Article

Recovery of Forest Structure Following Large-Scale Windthrows in the Northwestern Amazon

by
J. David Urquiza Muñoz
1,2,3,*,
Daniel Magnabosco Marra
1,4,
Robinson I. Negrón-Juarez
5,
Rodil Tello-Espinoza
3,
Waldemar Alegría-Muñoz
3,
Tedi Pacheco-Gómez
3,
Sami W. Rifai
6,
Jeffrey Q. Chambers
5,
Hillary S. Jenkins
7,
Alexander Brenning
2 and
Susan E. Trumbore
1
1
Biogeochemical Processes Department, Max Planck Institute for Biogeochemistry, 07745 Jena, Germany
2
Department of Geography, Friedrich Schiller University Jena, 07743 Jena, Germany
3
Faculty of Forestry Science, National University of the Peruvian Amazon, Iquitos 16002, Peru
4
Forest Management Laboratory, Brazilian Institute for Amazon Research, Manaus 69060-001, AM, Brazil
5
Lawrence Berkeley National Laboratory, Berkeley, CA 94720, USA
6
ARC Centre of Excellence for Climate Extremes, University of New South Wales, Sydney 2052, Australia
7
Department of Environmental Studies, University of Redlands, Redlands, CA 92373, USA
*
Author to whom correspondence should be addressed.
Forests 2021, 12(6), 667; https://doi.org/10.3390/f12060667
Submission received: 20 March 2021 / Revised: 17 May 2021 / Accepted: 21 May 2021 / Published: 25 May 2021

Abstract

:
The dynamics of forest recovery after windthrows (i.e., broken or uprooted trees by wind) are poorly understood in tropical forests. The Northwestern Amazon (NWA) is characterized by a higher occurrence of windthrows, greater rainfall, and higher annual tree mortality rates (~2%) than the Central Amazon (CA). We combined forest inventory data from three sites in the Iquitos region of Peru, with recovery periods spanning 2, 12, and 22 years following windthrow events. Study sites and sampling areas were selected by assessing the windthrow severity using remote sensing. At each site, we recorded all trees with a diameter at breast height (DBH) ≥ 10 cm along transects, capturing the range of windthrow severity from old-growth to highly disturbed (mortality > 60%) forest. Across all damage classes, tree density and basal area recovered to >90% of the old-growth values after 20 years. Aboveground biomass (AGB) in old-growth forest was 380 (±156) Mg ha−1. In extremely disturbed areas, AGB was still reduced to 163 (±68) Mg ha−1 after 2 years and 323 (± 139) Mg ha−1 after 12 years. This recovery rate is ~50% faster than that reported for Central Amazon forests. The faster recovery of forest structure in our study region may be a function of its higher productivity and adaptability to more frequent and severe windthrows. These varying rates of recovery highlight the importance of extreme wind and rainfall on shaping gradients of forest structure in the Amazon, and the different vulnerabilities of these forests to natural disturbances whose severity and frequency are being altered by climate change.

1. Introduction

Windthrows are associated with strong downdrafts produced during severe convective storms [1,2,3,4]. In the Amazon, windthrows are a frequent natural disturbance that influences regional tree mortality and has the potential to regulate regional biomass/carbon stocks and balance [5,6,7,8,9,10]. The geographic distribution of windthrows generally follows the pattern of rainfall across the Amazon Basin, though there are large variations in the size and frequency of occurrence [7,11,12]. Windthrows are more frequent in the Northwestern Amazon than in the Central Amazon [12].
Windthrows create changes in forest composition and forest dynamics [13,14]. Consequently, windthrows provide niches for maintaining a diverse cohort of species [6,8,15,16]. In old-growth tropical forests, species with limited competition strategies are eventually eliminated from the community [17]. Therefore, understanding the drivers of structural and compositional change in tropical forests is important for predicting the future composition of these ecosystems [18,19], especially since the frequency and intensity of convective storms are being affected by climate change [7,12]. This knowledge is crucial for better planning initiatives of forest management and climate adaptation [20]. Numerous studies have examined the impacts of climate variability [21,22], soils, nutrient availability, geomorphological variation [23], hydrological regimes [24,25], and productivity [26] on forest structure and dynamics, but the effects of large-scale windthrows have received less attention and remain unassessed for most of the Amazon. Research in the Central Amazon has demonstrated that the recovery of biomass and functional composition depends on the size and severity of the disturbance [5,8,27]. Understanding how wind disturbances impact standing biomass and influence subsequent succession through tree establishment, growth, and mortality is an enduring task in forest ecology [28].
In this study, we investigate rates of forest recovery from windthrows in the Northwestern Amazon. We compare our results with a similar study carried out in the Central Amazon, which is characterized by a lower frequency of windthrows, poorer soils and slower turnover rates than our study region. We address the following questions: (a) Which forest structural attributes are most affected following windthrows? and (b) How rapidly do these attributes recover to old-growth conditions? This is the first assessment of forest recovery after windthrow events in the Northwestern Amazon, and provides insight into the different regional patterns of forest dynamics and vulnerability to natural disturbances.

2. Materials and Methods
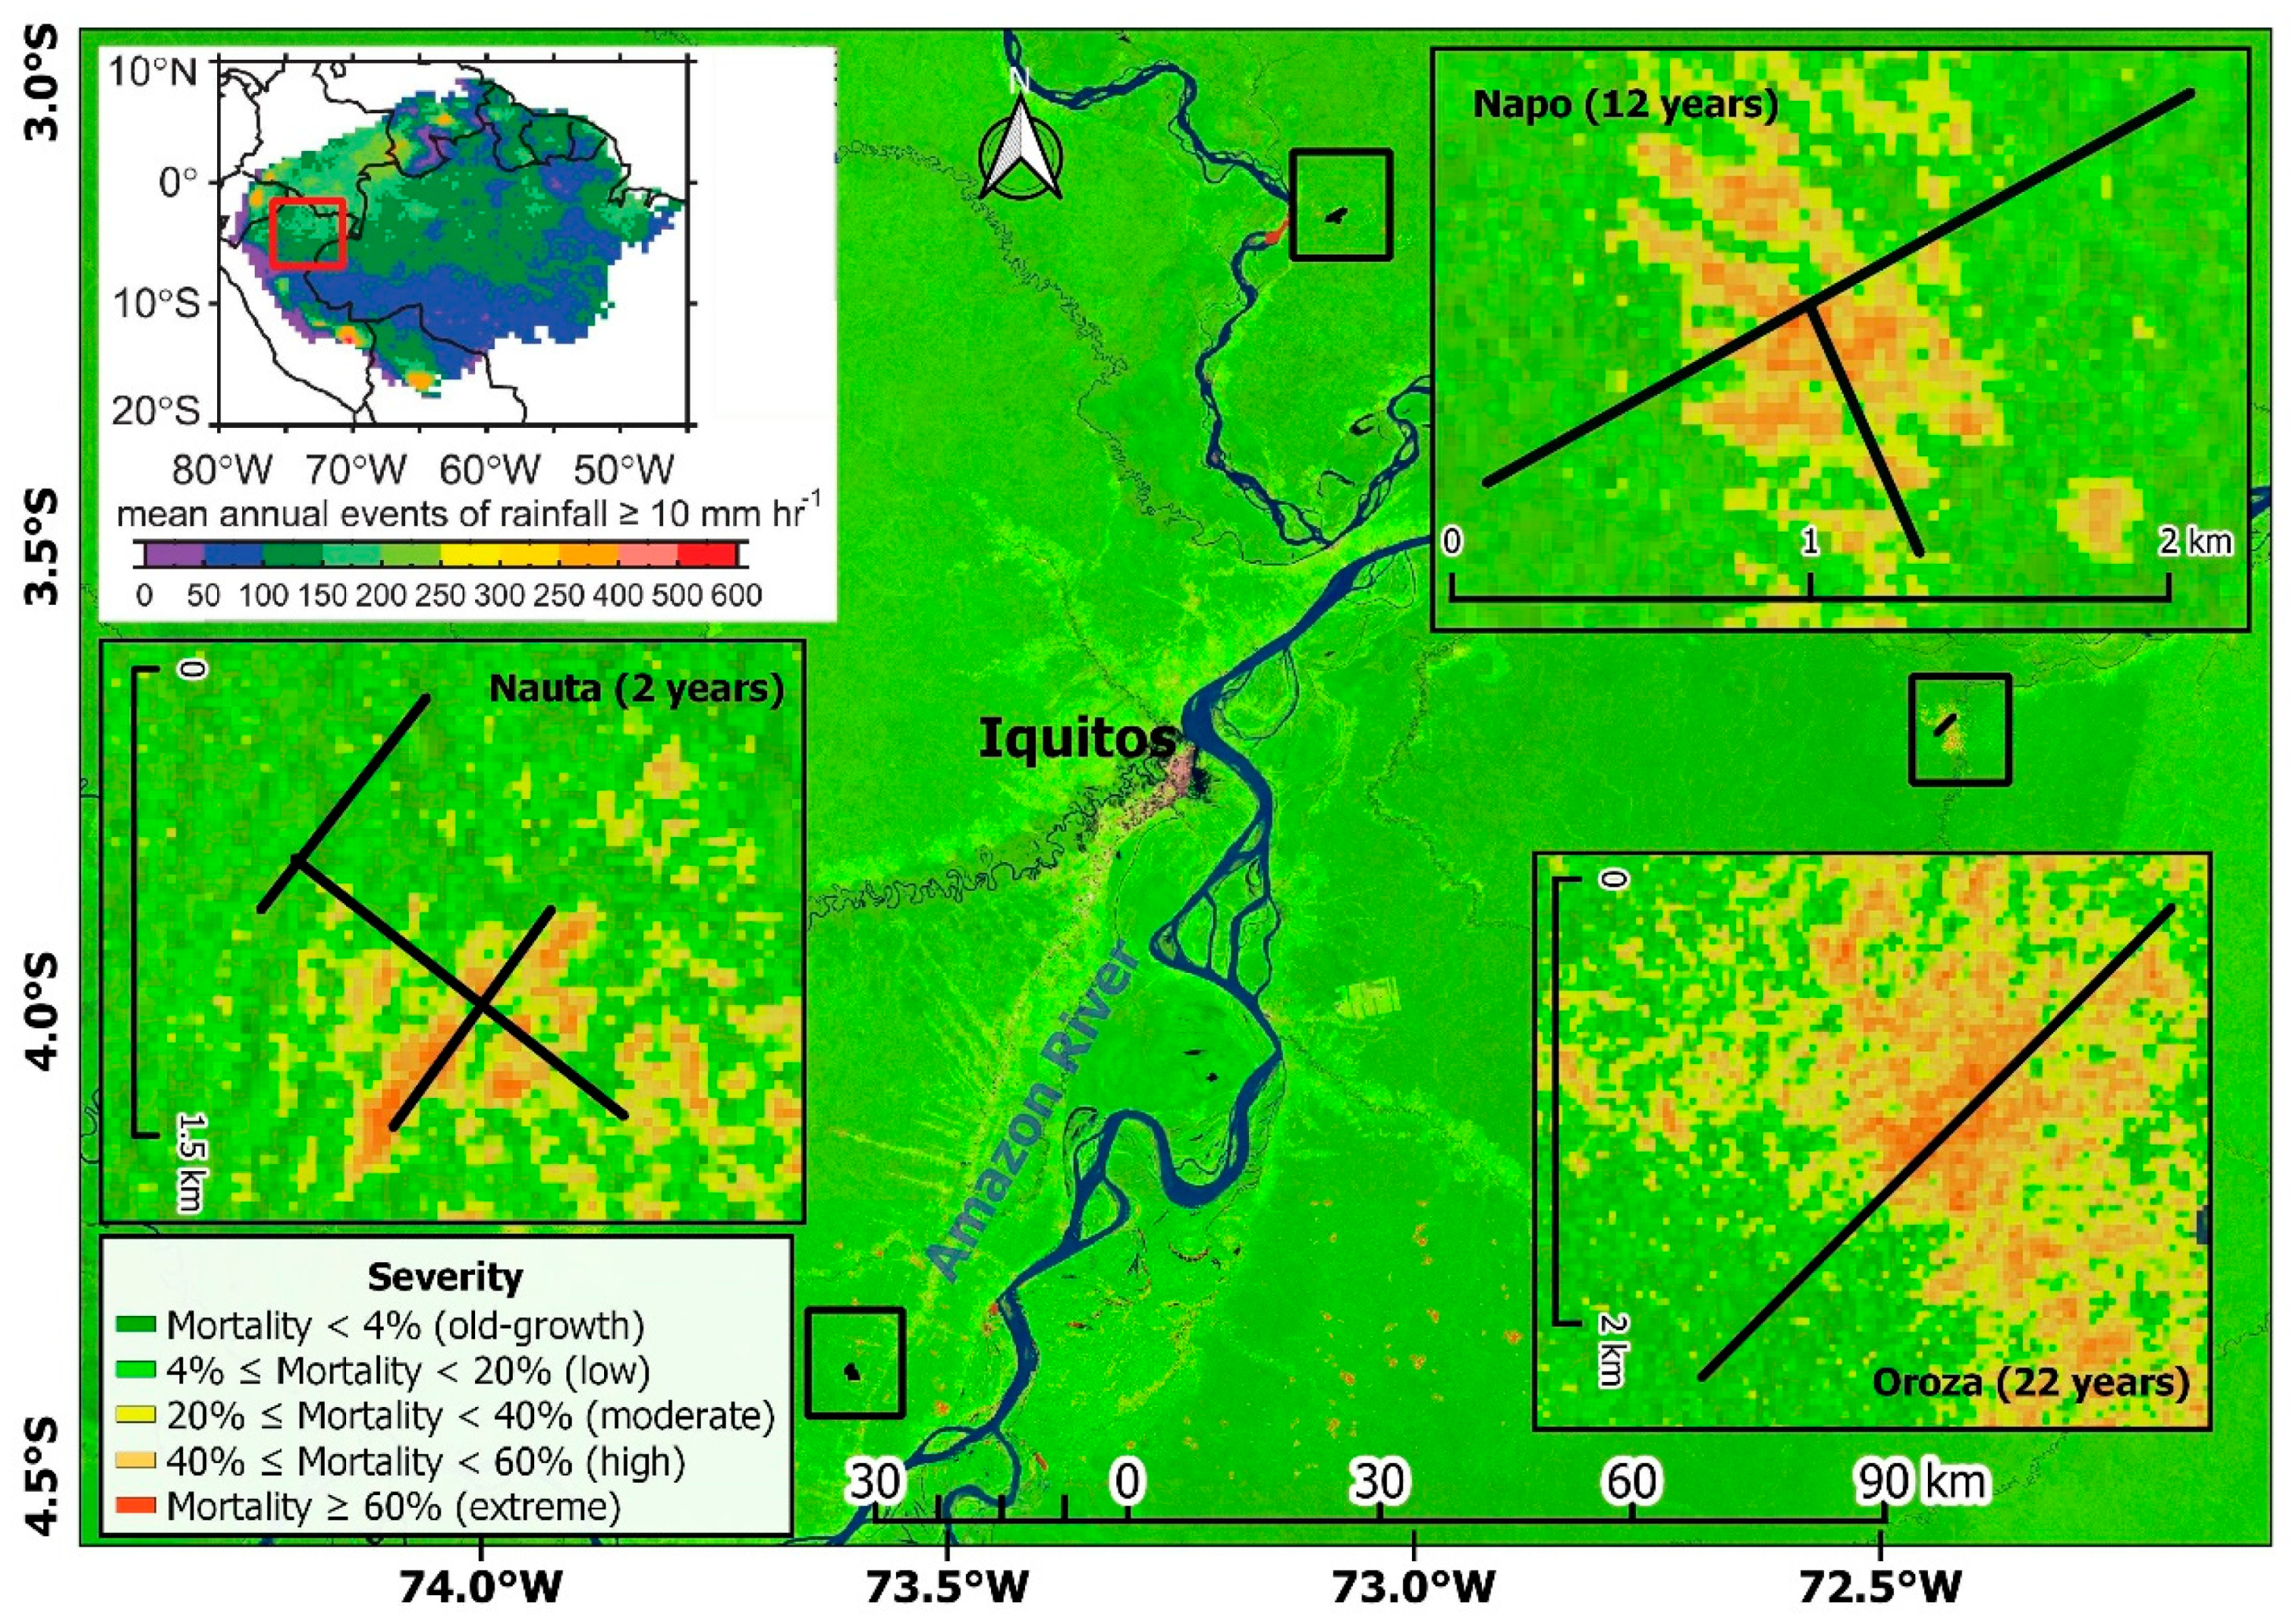
2.1. Study Area

The study area is located within ~50 km of Iquitos, Peru, in a region covered with old-growth lowland forest (no flooded areas and less than 500 m a.s.l.) (Figure 1). Iquitos is characterized by its lack of dry season (no consecutive months with rainfall ≤ 100 mm) [29]. The mean annual rainfall is 3000 mm, and mean annual temperature is 25.9 °C. Precipitation is lowest from June to August with a mean and standard deviation of 183 mm and ±10 mm month−1, respectively [12]. The study sites are managed by the National University of the Peruvian Amazon (UNAP). Because we want to study the timing of recovery after windthrow disturbances of differing severity, we identified a chronosequence of study sites that were affected by windthrow disturbances at different times in the past. The old-growth forests at the study sites have similar climatic, edaphic and floristic compositions. None of our study sites have experienced any major, recent or direct human impacts such as logging.
Windthrow events were identified via Landsat imagery using changes in non-photosynthetic vegetation (NPV) between sequential years [3,30]. This revealed that disturbances at the three study sites (Nauta, Napo and Oroza), occurred in a chronosequence of 2, 12 and 22 years, respectively, prior to transect installation. Oroza (named after the closest town) was windthrown in 1988, has a disturbed area of 662 ha and was surveyed in 2010 (i.e., 22 years after windthrow). Napo experienced a windthrow event in 1998, has a disturbed area of 188 ha, and was also surveyed in 2010 (12 years after windthrow). The windthrow in Nauta occurred in 2009. This site has a disturbed area of 189 ha and was surveyed in 2011 (2 years after windthrow).
Given that a chronosequence study substitutes space for time [8,31], our study sites are not strictly replicates, and there are differences in forest structure in the undisturbed parts of the transects. We acknowledge that additional temporal measurements would be needed to assess the degree to which this influences our results, and we have, in most cases, normalized our data to the respective undisturbed forest when making comparisons across sites.

2.2. Assessing Windthrow Severity

Landsat 5 TM images processed with LEDAPS (Landsat Ecosystem Disturbance Adaptive Processing System) [32] were used to detect the occurrence of windthrows. For Oroza, Landsat image P063R03 from 17 April 1988 (prior to disturbance) and 24 September 1988 (after disturbance) were used; for Napo, P062R03 from 19 August 1998 and 22 October 1998; and for Nauta, P063R03 from 2 September 2009 and 7 December 2009. Landsat 5 imagery with Ecosystem Disturbance Adaptive Processing System (LEDAPS) is available in the Google Earth Engine https://earthengine.google.com, (accessed on 24 February 2020) [33], which is the platform used for our imagery analysis and Landsat imagery processing. Windthrows were identified by their spectral characteristics (endmembers) and their distinctive shape diverging from a central area with radiant corridors separated by forest [1]. We used spectral mixture analysis (SMA) [34] to quantify the fraction of distinct endmembers. Specifically, we used image-derived endmembers: green photosynthetic vegetation (GV), non-photosynthetic vegetation (NPV), and shadows. The fractions of NPV and GV were then normalized without shadows as NPV/(GV + NPV) and GV/(GV + NPV) [3,30,34]. Metrics of the windthrow area and damage are derived from ∆NPV [3,6,15,30,35].
Using the ∆NPV, we estimated the percentage of trees directly toppled or killed in the studied windthrows by using a locally adjusted predictive windthrow tree-mortality model (Equation (1)) [12]:
M ( mortality ,   in   % ) = 99.86 · Δ NPV
To assign the mortality value by subplot (10 × 30 m), we resampled the image at a greater spatial resolution (from 30 × 30 m to 3 × 3 m), and extracted weighted ∆NPV values based on the pixels comprising subplots using the Zonal statistics tool available in QGIS 3.10.3. The ∆NPV values were used to classify windthrow severity at the subplot level, complementing previous studies in the CA [8].

2.3. Forest Inventory

At each site, we installed 10 m wide transects of varying lengths, with a total area of three hectares for Napo and Oroza, and 3.09 ha for Nauta. In Napo and Oroza, the transects were subdivided into 100 subplots of 300 m2 each (i.e., 30 m × 10 m), and 103 subplots for Nauta, yielding a total of 303 subplots for our analysis. The transects encompassed the entire gradient of windthrow tree-mortality derived from our remote-sensing metric [6,12]. In each subplot we measured the diameter of trees > 10 cm DBH (diameter at breast height, 1.3 m). Combining all sites, we recorded 4889 living trees. A botanical sample was collected from each recorded species for tree identification. A summary of forest floristics characteristics by severity is shown in Appendix A. Tree locations were determined using a local reference system (UTM 18S) and the following procedure. First, a handheld GPS receiver (Global Position System, Garmin Map76 CSx, Olathe, Kansas, U.S.A) was used to locate the start point of each transect, then the “x” and “y” coordinates of each tree were measured using a rangefinder laser (Trimble Laserace 1000, Sunnyvale, CA, USA) based on their distance and angle from the transect’s starting position.

2.4. Data Processing and Analysis

The basal area (BA) of recorded trees m2 ha−1 was estimated from the diameter at breast height assuming a circular trunk shape [36]. As there are no locally adjusted allometries, we estimated individual tree aboveground biomass (AGB) using references from other Amazon regions (Models 1, 2 and 3, Table 1). The AGB at the subplot level was calculated by summing the individual biomass of trees recorded in each subplot.
Since Models 1 and 2 include wood density as a predictor, we compiled wood density values of recorded species from previous studies conducted in the Amazon Basin [5,8,38]. Values were assigned using data at the species, genus, or family level (in order of preference), depending on the availability and geographical proximity of our study region. Model 3 was applied to individual trees from species for which wood density was not reported.
Forest structural attributes such as biomass can be over- and/or underestimated due to spatial variations in small plots containing relatively large individual trees [5,6,39]. Previous studies from the Central Amazon suggest that robust estimates of biomass require sample units with areas between 0.08 ha to 0.12 ha [8,39]. Therefore, to reduce intrinsic spatial variations in biomass estimates, we binned subplots from our study sites based on their windthrow severity. The final area of our binned plots ranged between 0.09–0.12 ha.

2.5. Statistical Analysis

A chi-square test at the 5% significance level was used to compare the diameter distribution of trees in old-growth plots. A Student’s t-test was used to assess whether differences in mean DBH, basal area, and average AGB were statistically significant between disturbed and old-growth forest. To compare tree size, basal area, and AGB among successional stages, we used a one-way ANOVA. For reporting forest recovery, we assumed a 10% uncertainty around the respective undisturbed reference, i.e., a subplot was considered ‘recovered’ if it attained 90% of the old-growth value for a given attribute. We estimated the time required to recover old-growth levels of basal area and AGB by fitting linear regressions to the subplot-level data using the time since windthrow as the predictor. We further calculated 90% confidence bands of the response in order to visualize uncertainties. Although our high number of subplots (total of 303) allows for calculating confidence intervals and p-values independent of data distribution, these may be overly optimistic as they do not account for site-level autocorrelation. The statistical analyses were carried out in the statistical software package R 4.0.3 [40].

3. Results

3.1. Subplot Distribution by Disturbance Severity Class

Estimates of windthrow tree-mortality (Equation (1)) and the locations of transects at respective sites allowed us to calculate the number of plots and the area occupied by each severity class (Table 2). These classes encompass the range of disturbance severity from old-growth forest to low, moderate, high, and extreme severity, and are given in Table 2.

3.2. Structural Attributes of Old-Growth Forests

Old-growth forest subplots at our study sites had a mean (± standard deviation) trees per hectare (TPH) of 562 ± 87 trees ha−1, BA of 24.8 ± 2.3 m2 ha−1 and AGB of 380 ± 156 Mg ha−1. We assessed possible pre-disturbance differences among old-growth forests by assessing the mean diameter of trees, the basal area and the AGB across old-growth plots. The results of the ANOVA indicated a significant difference in forest structure among the study sites for BA (p = 0.003) and AGB (p = 0.002), but no significant differences for mean DBH (p = 0.079). A post-hoc T-test (p-adjust using the Benjamin–Hochberg method) indicated that there is no statistical evidence of differences in mean DBH (p = 0.31), BA (p = 0.55), and AGB (p = 0.71) at the Napo and Nauta sites. The Oroza site showed significant differences from the Napo site for BA (p = 0.02) but no difference from the Nauta site (p = 0.06). For AGB, Oroza was significantly different from Nauta and Napo (p = 0.007 and p = 0.004, respectively). For mean DBH, Oroza did not differ significantly from Napo (p = 0.07) or Nauta (p = 0.3).

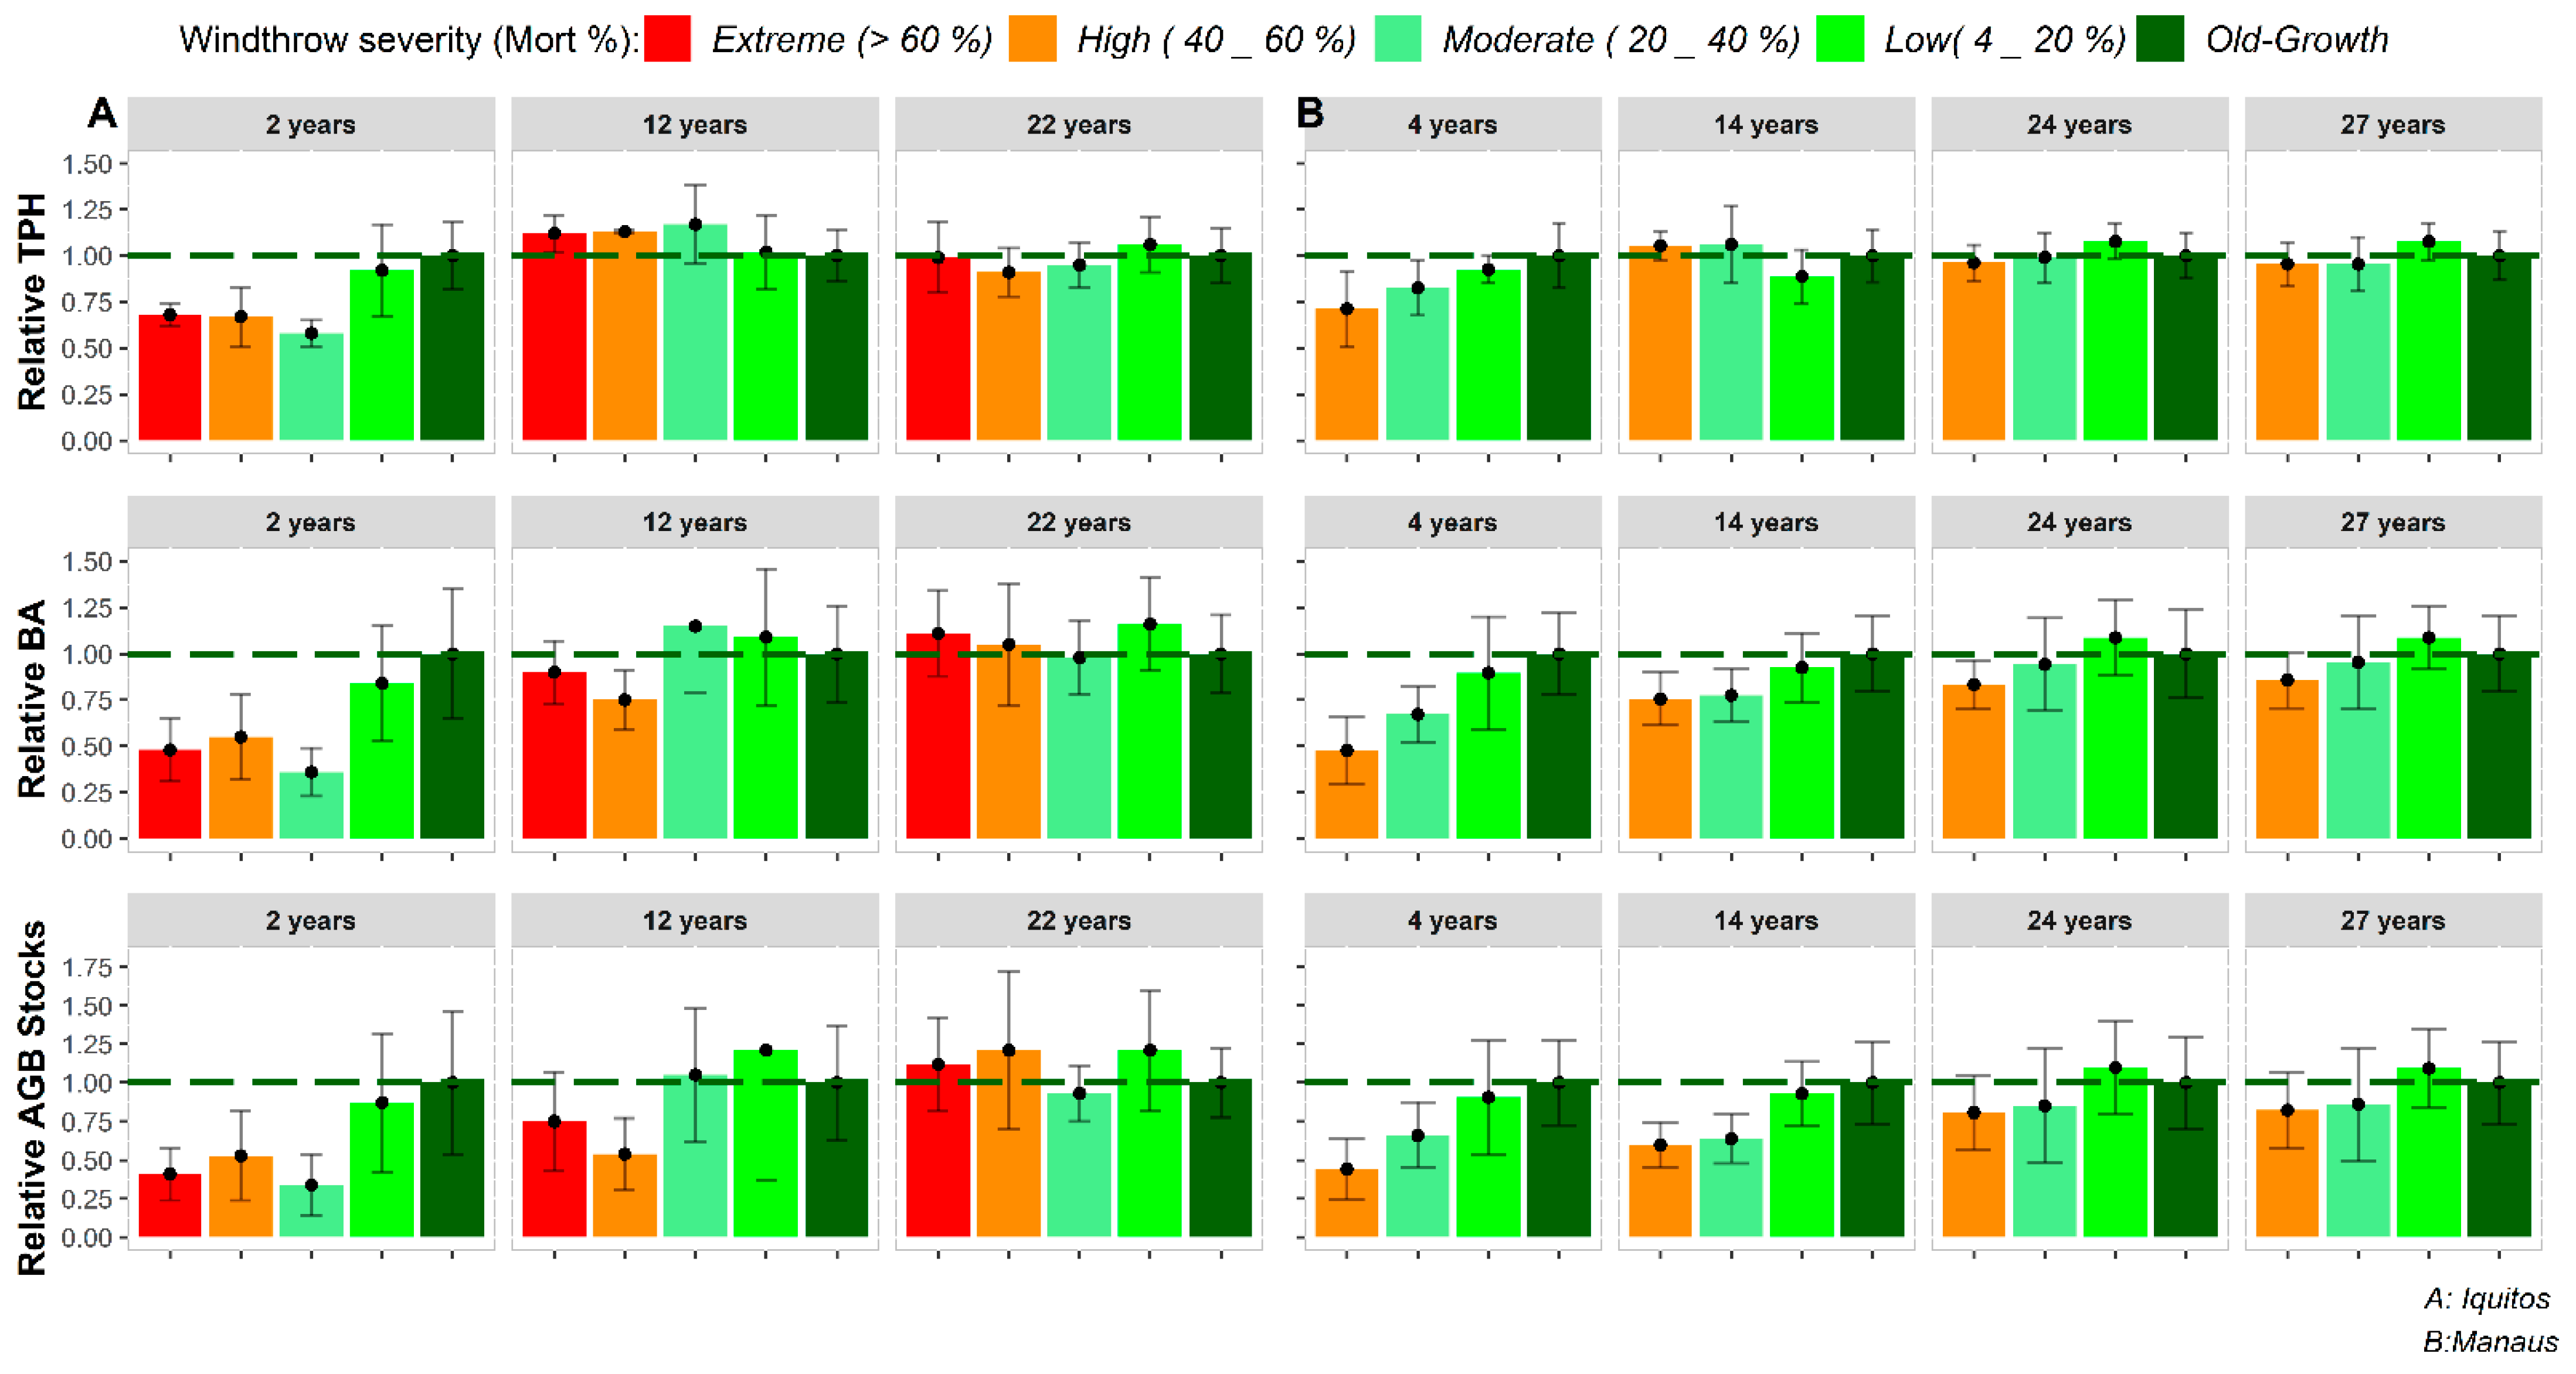
3.3. Recovery Patterns of Structural Attributes

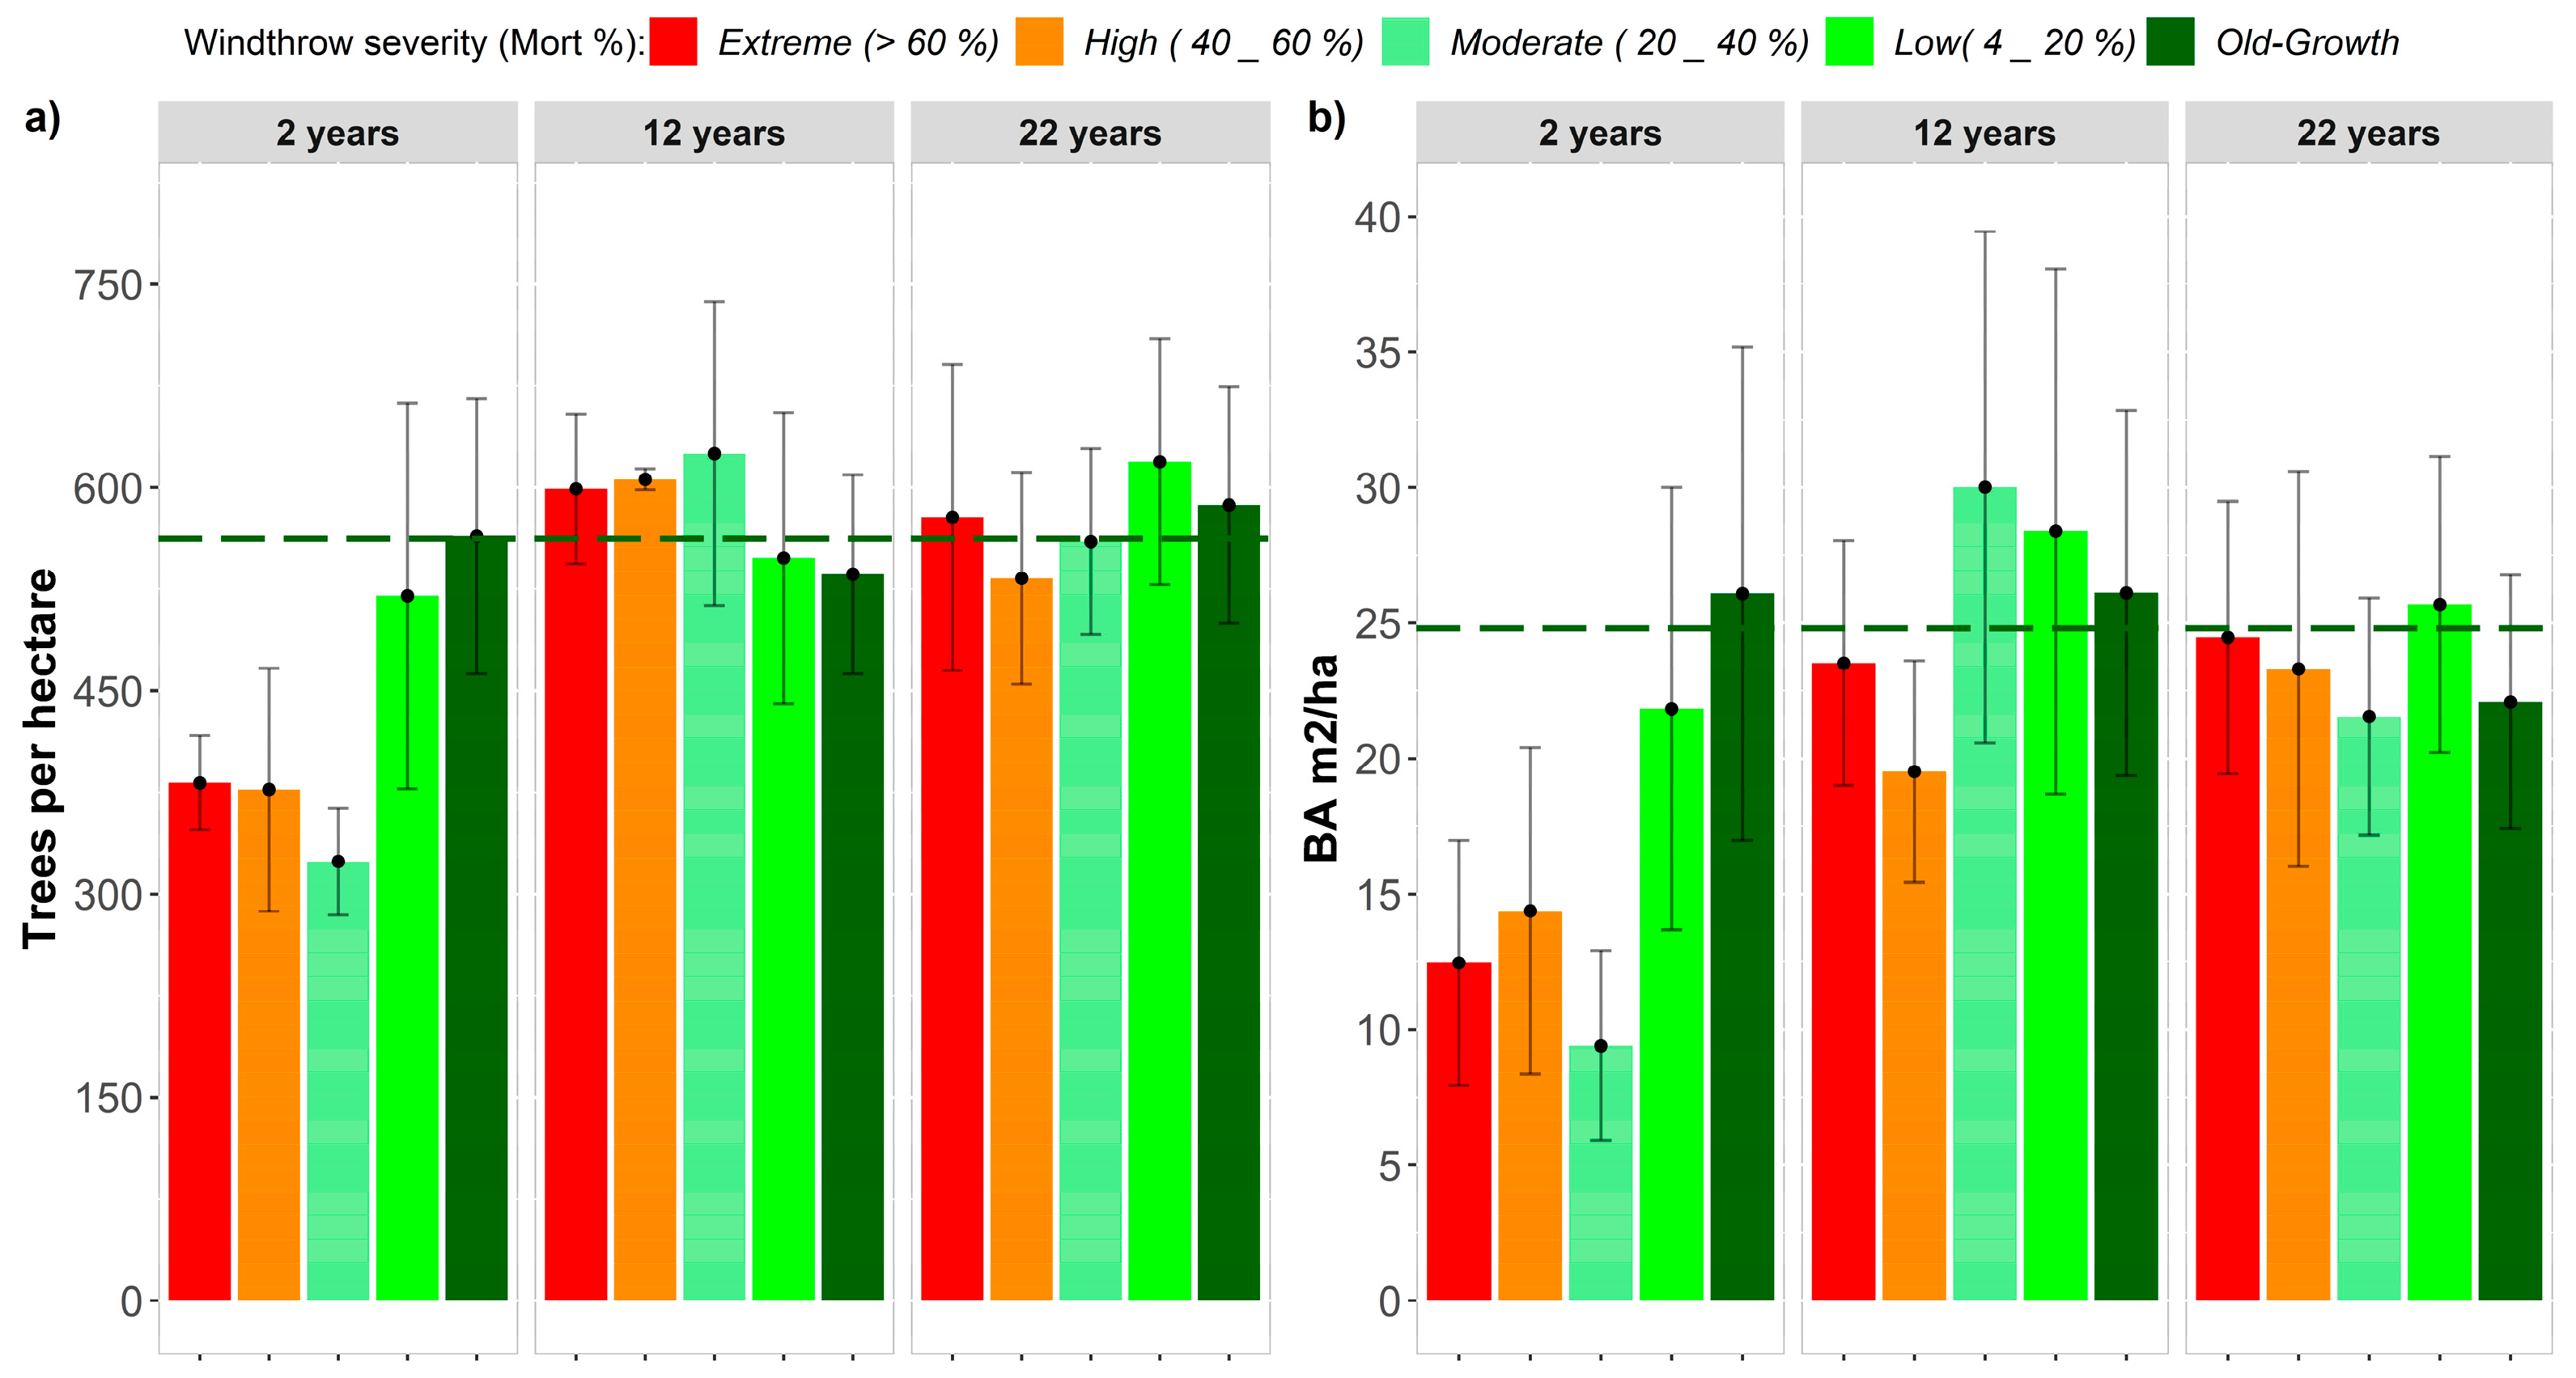
3.3.1. Mean Diameter, Tree Density and Basal Area

We did not find significant differences in the size distribution of trees recorded at varying windthrow severities. However, mean DBH was significantly reduced in extremely disturbed plots 2 years after windthrow (t-test p = 0.03), but differences were not significant 12 years (t-test p = 0.1) and 22 years (t-test p = 0.16) after windthrow. We therefore suggest that in extremely disturbed areas, DBH has recovered to old-growth levels by year 12. For moderate and high severities, no significant differences were observed 22 years after windthrow, with t-test values of p = 0.58 and p = 0.50, respectively.
The three sites, spanning 2 to 22 years after disturbance, show clear recovery of structural attributes in the decades following the respective windthrow events. Figure 2a shows the number of trees per hectare as a function of windthrow severity and recovery time. Two years after windthrow disturbance, the number of trees per hectare was 382 (± 35) trees ha−1 in extremely disturbed areas. This rapidly increased to 599 (± 55) trees ha−1 and 578 (±112) trees ha−1 12 and 22 years after windthrow disturbance, respectively. This apparently fast recovery of TPH was also observed for high and moderate windthrow severities. Figure 2b shows the basal area (BA) as a function of windthrow severity and recovery time. Comparing the BA of extremely disturbed forest 2 years following the windthrow event (12.46 ± 4.5 m2 ha−1) with that of extremely disturbed forest after 12 years (23.52 ± 4.51 m2 ha−1) and 22 years (24.46 ± 5.03 m2 ha−1) yields a gradual increase over time. Similar recovery patterns are observed for the high, moderate and low severity categories.

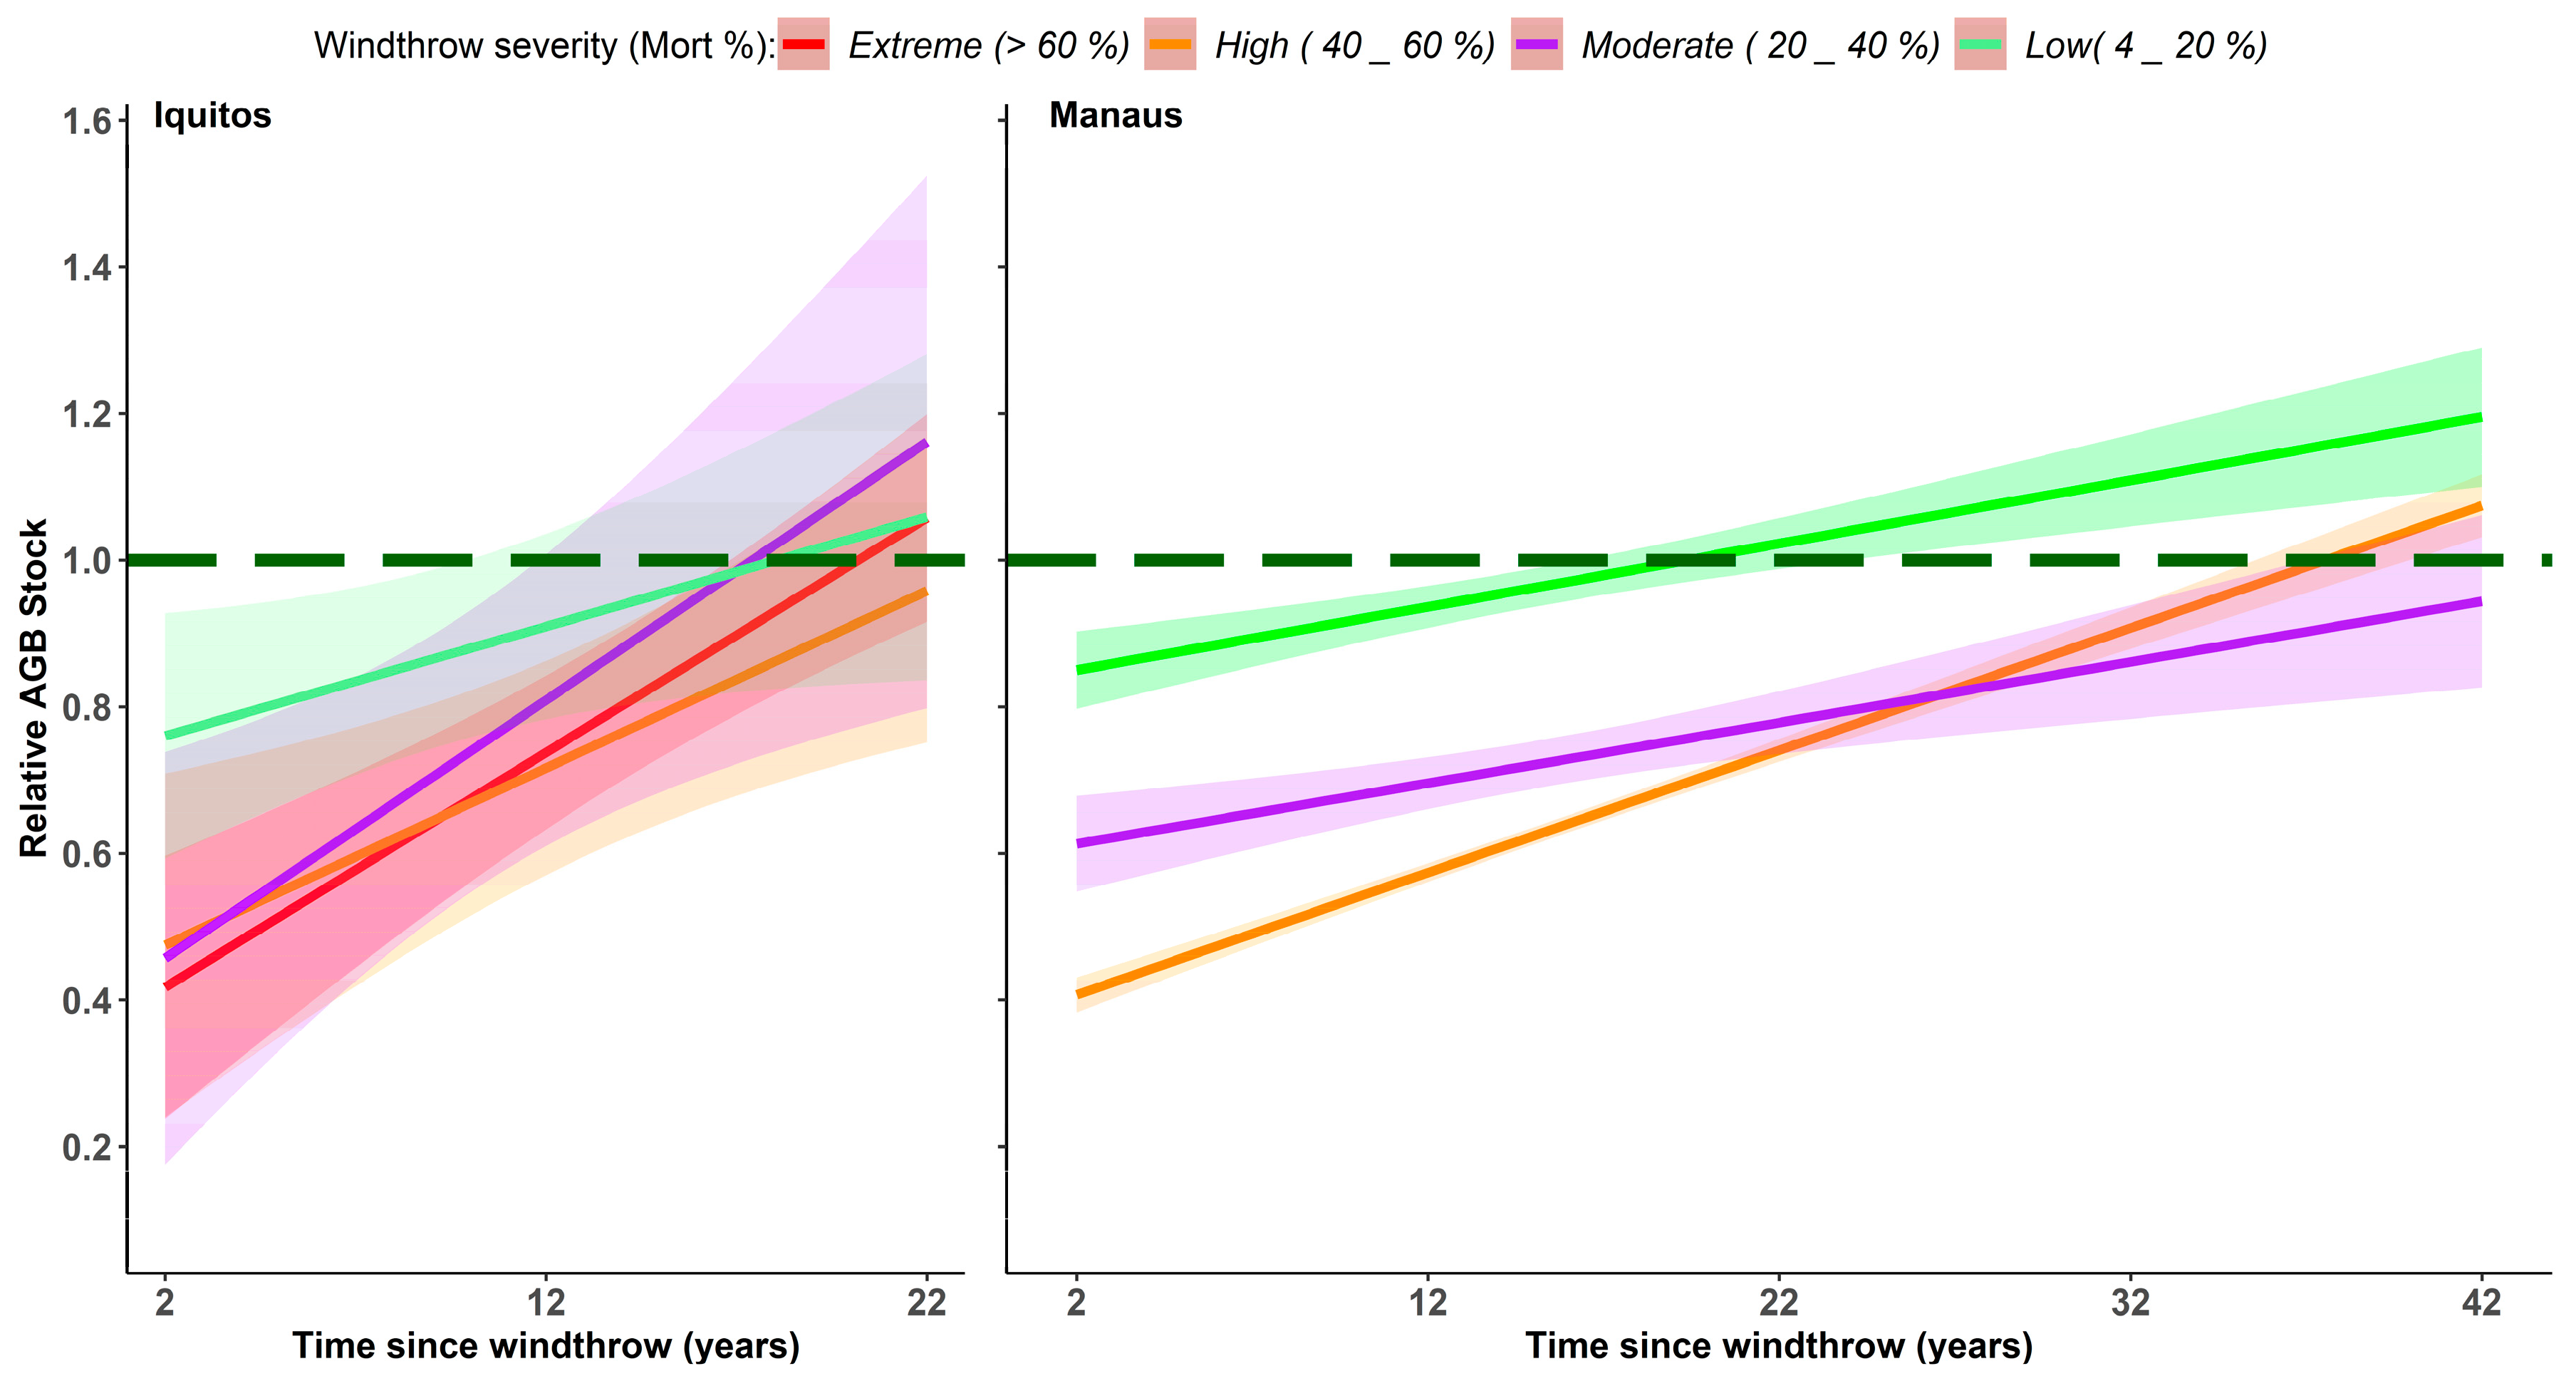
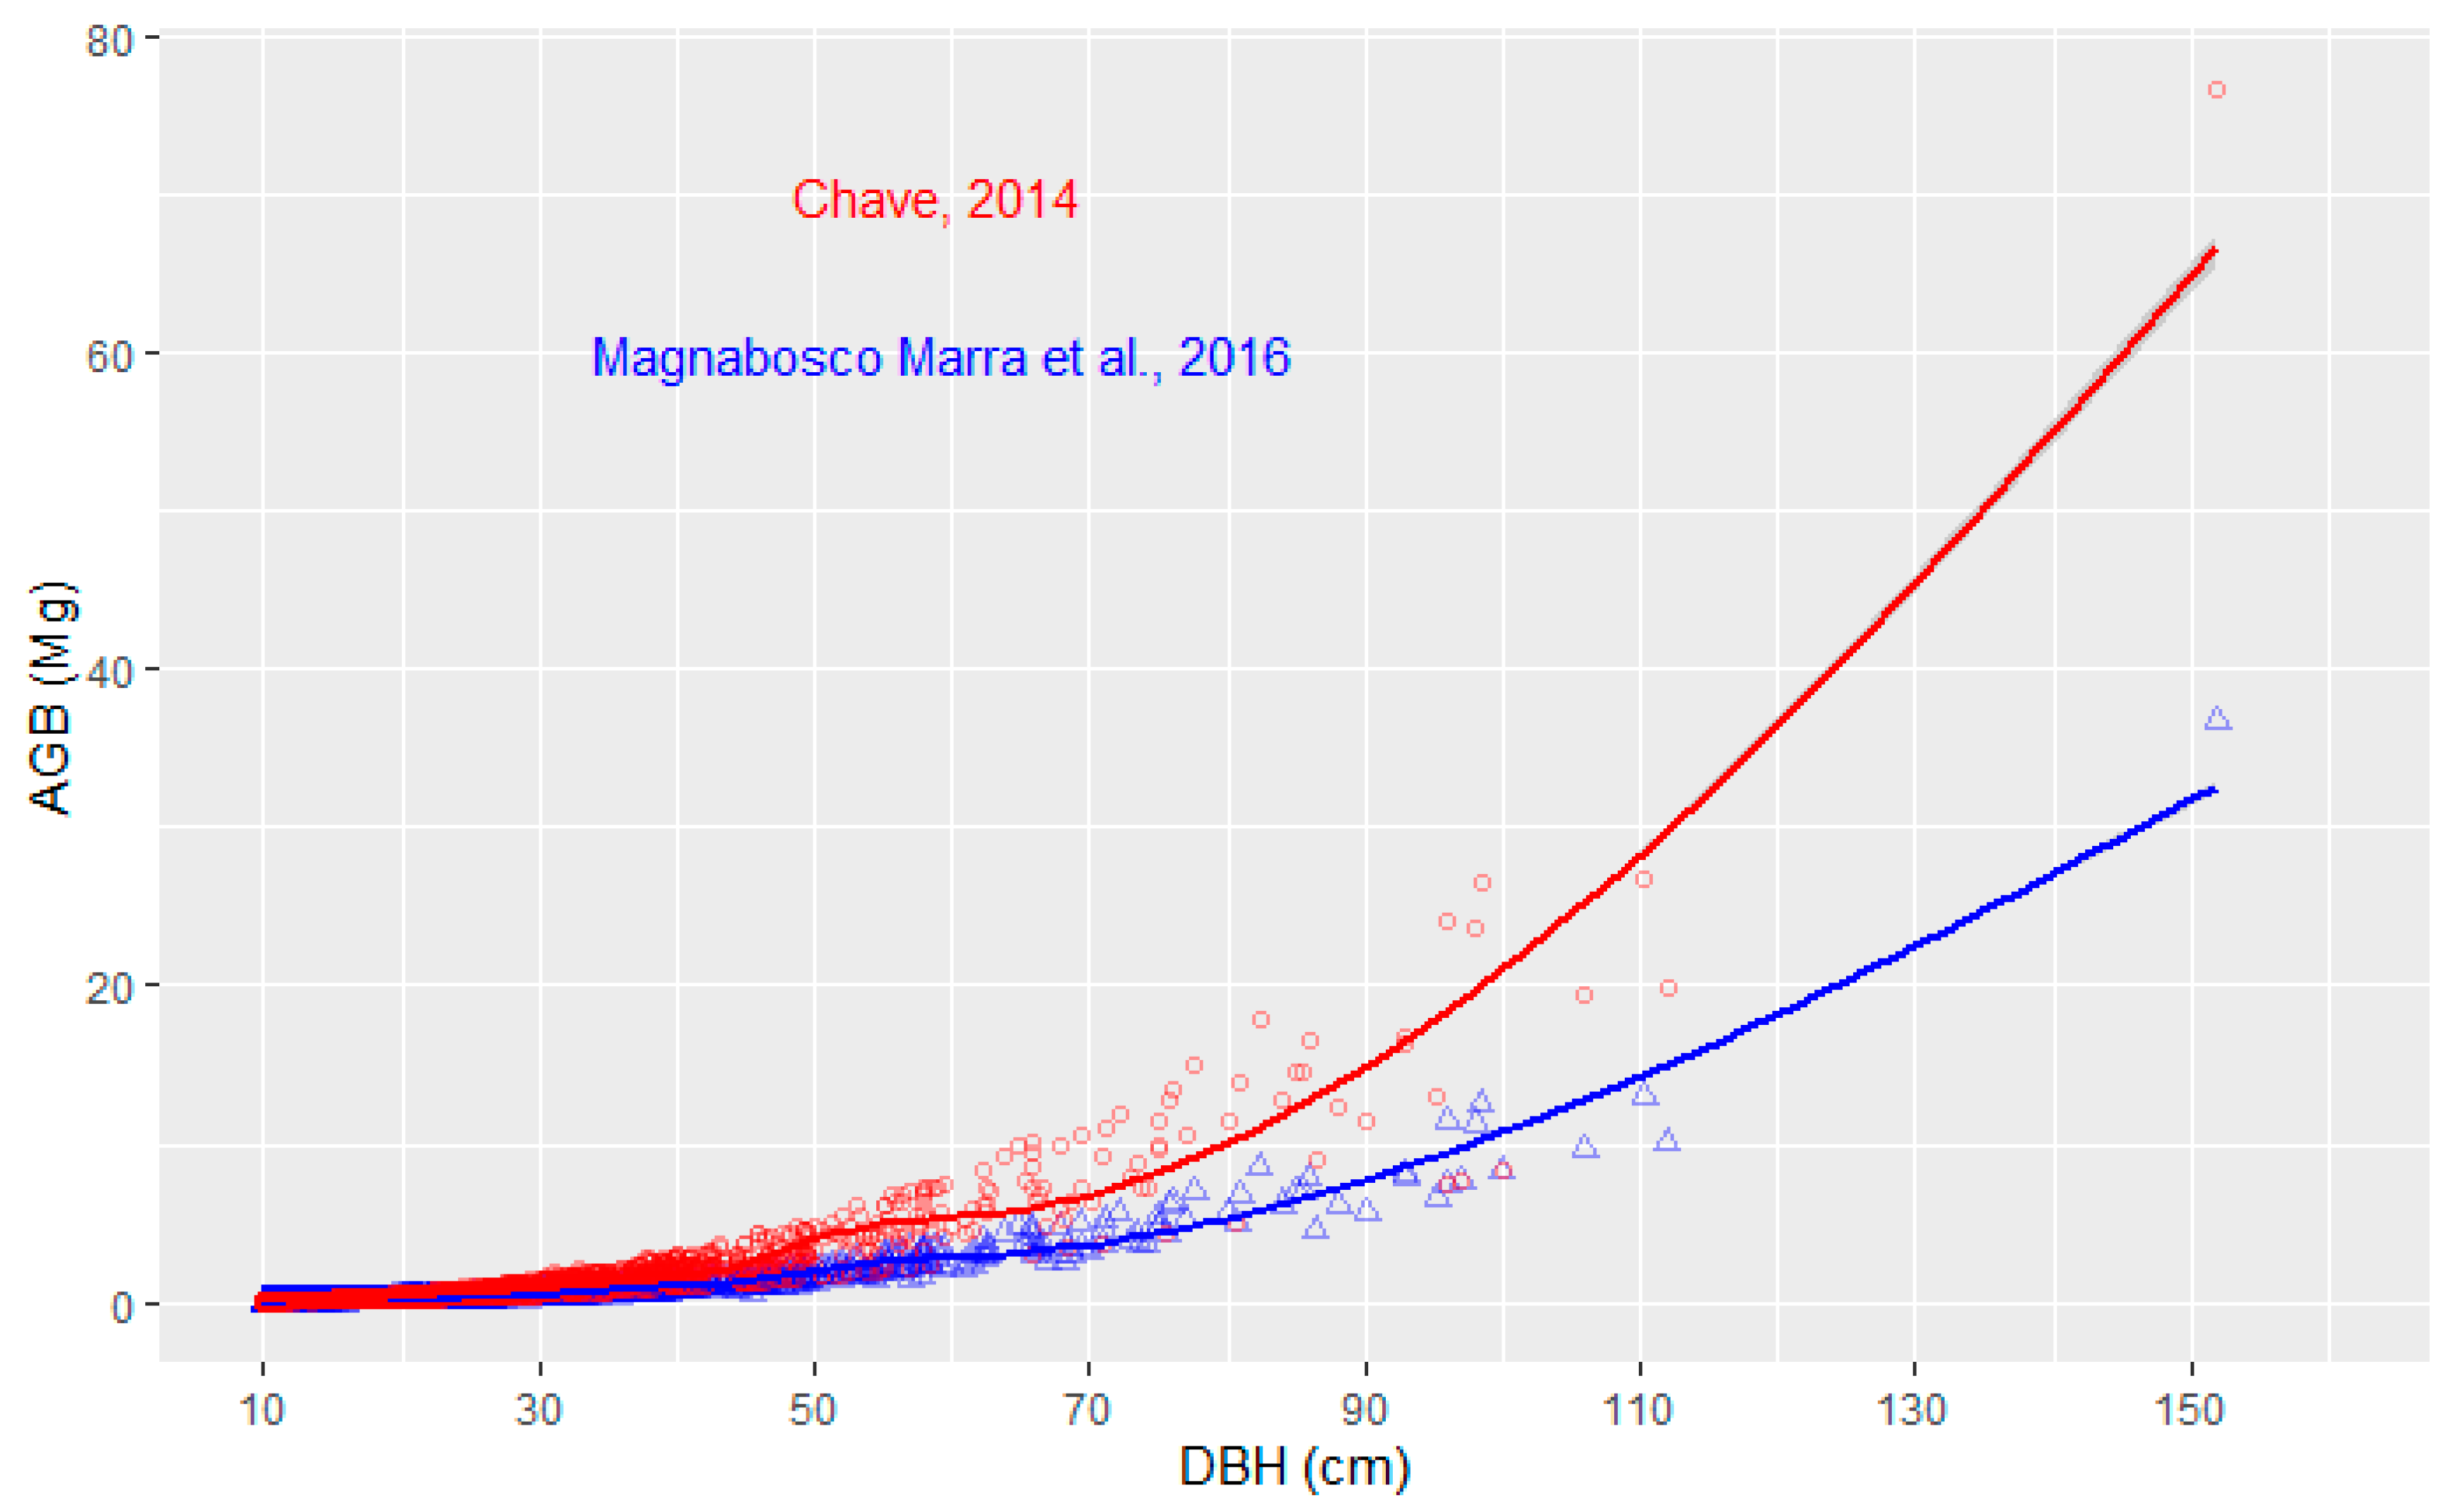
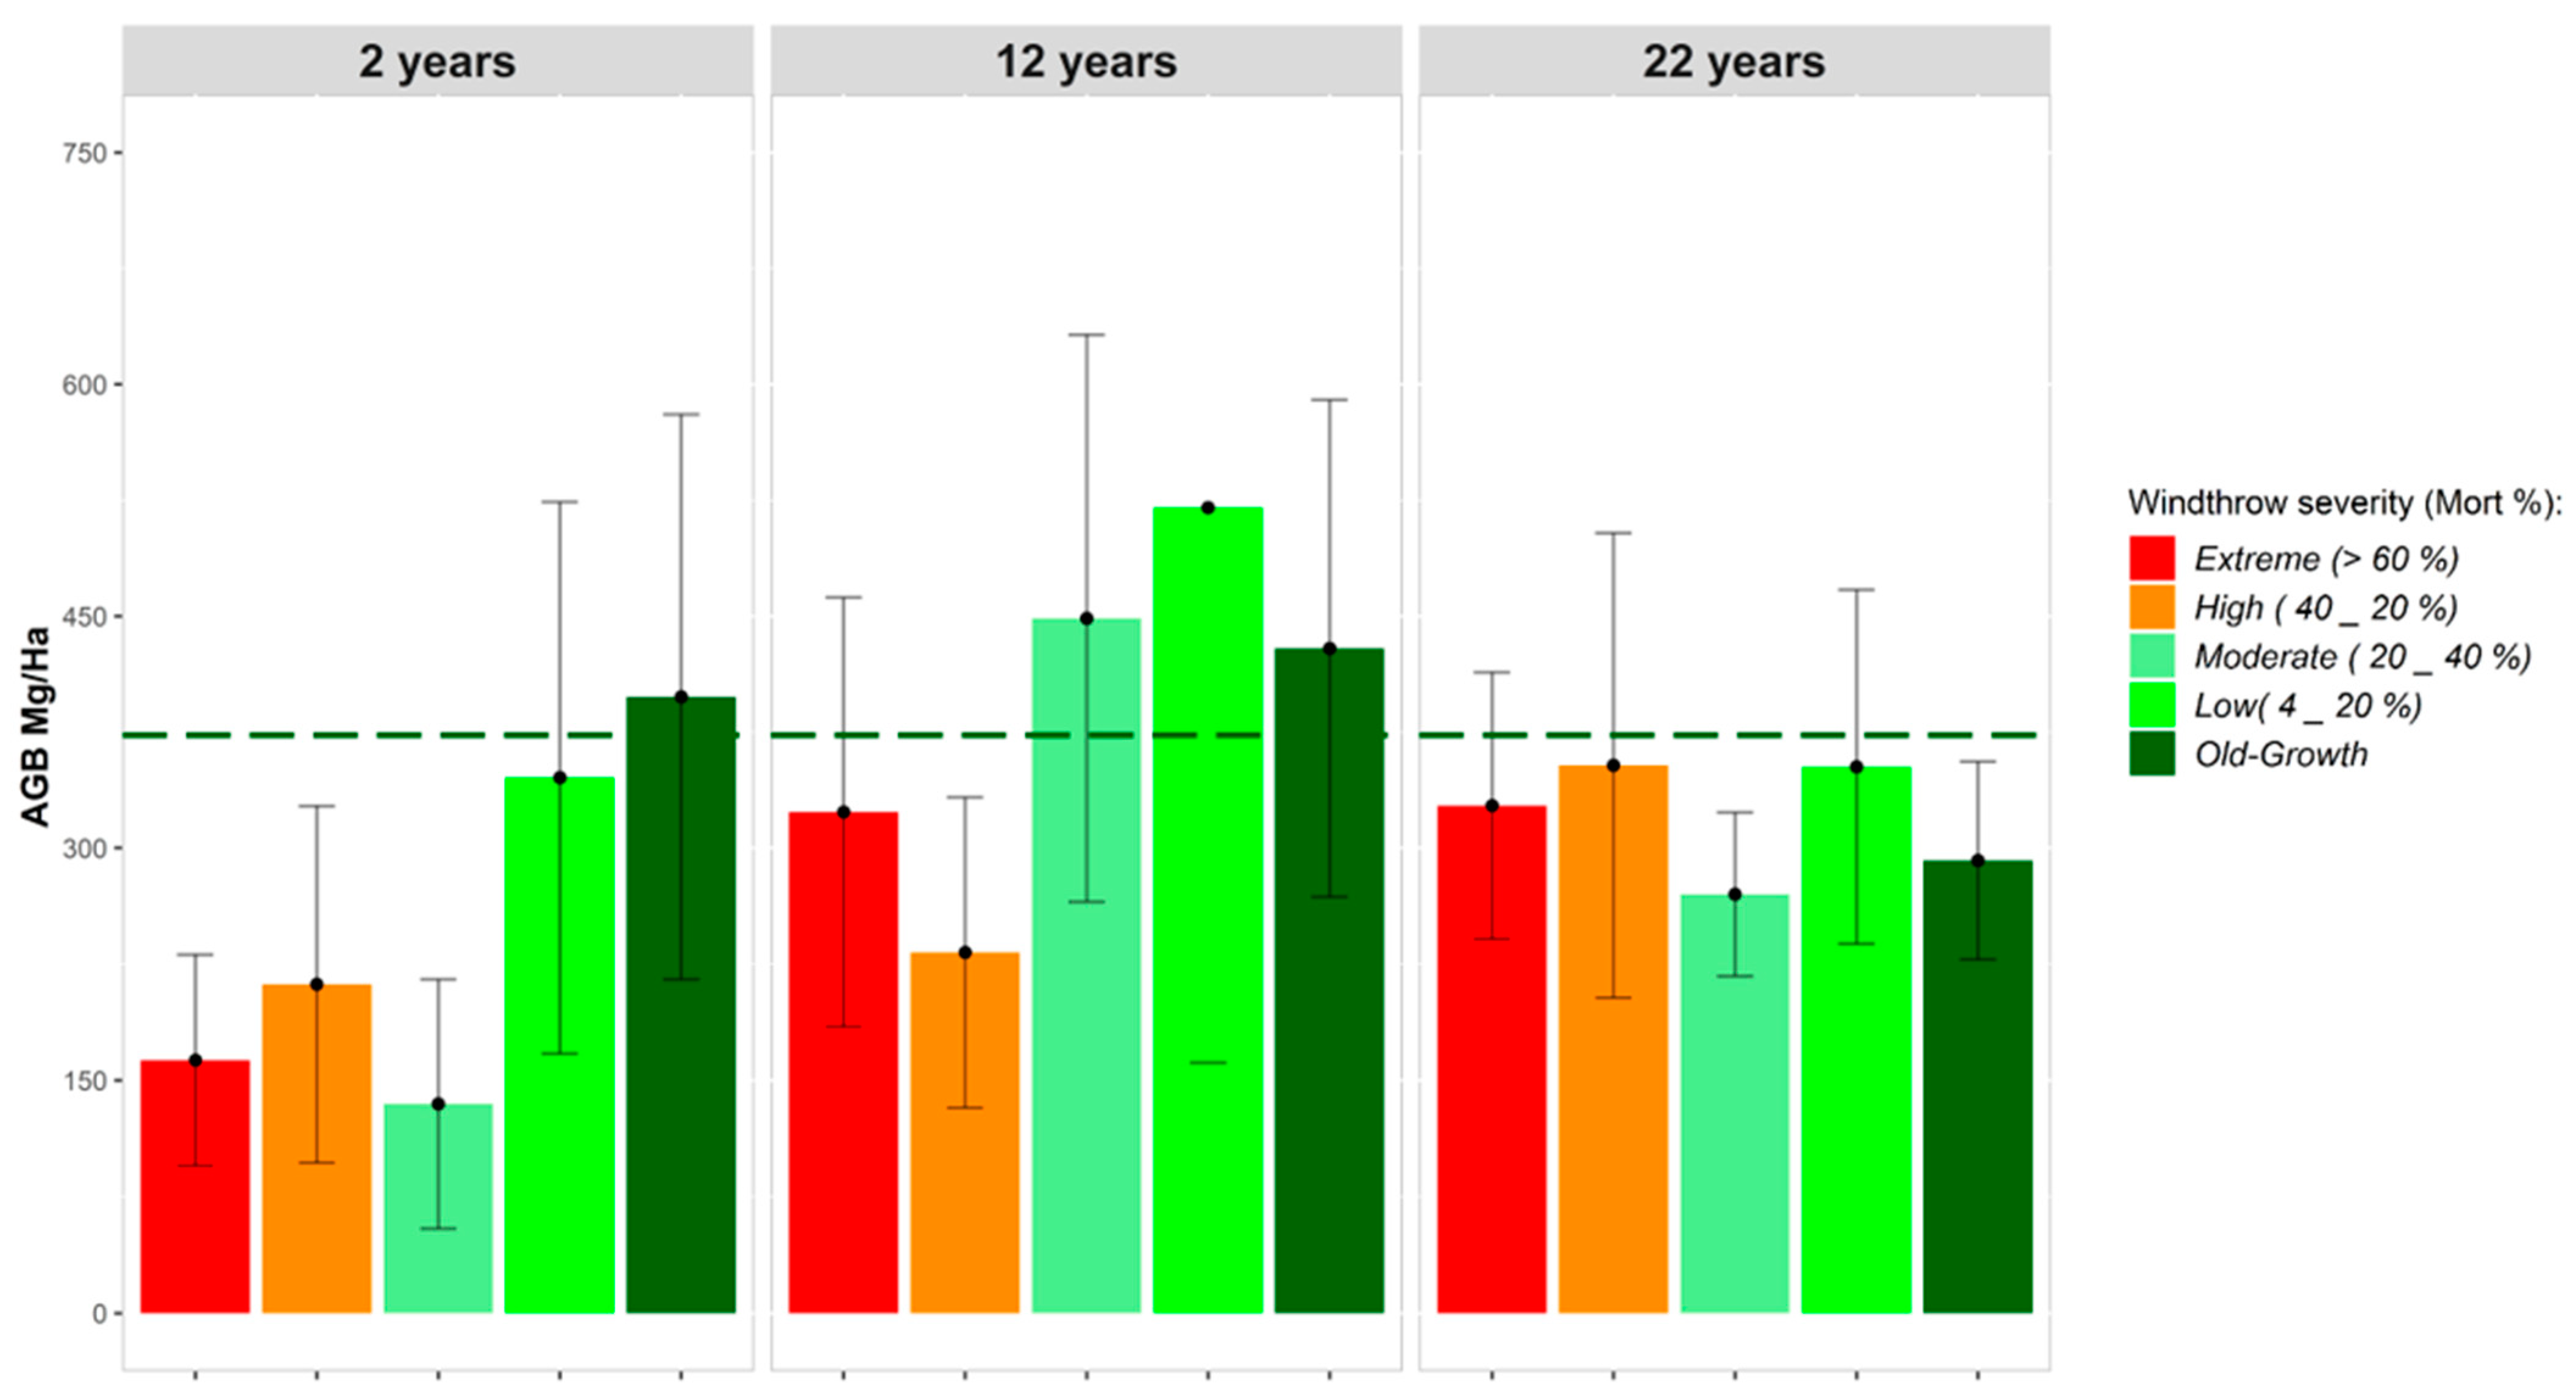
3.3.2. Aboveground Tree Biomass

Out of the 4889 trees recorded in our study, 2171 (44.5%) were assigned wood density values at the species level, 1554 (31.7%) at the genus level and 523 (10.7%) at the family level. We did not assign wood density values for 641 (13.1%) trees. We used 95 binned plots distributed over 4 severities and 3 measured years (ranging from 0.09 ha. to 0.12 ha.). Estimates of AGB differed when using Model 1 [37] versus Model 2 [5], mainly due to the relatively higher values given for trees larger than 50 cm DBH by Model 1. However, regardless of which model was used, the overall trajectory of AGB recovery did not change (Appendix B).
Extreme disturbance (>60% mortality) reduced the mean AGB to 163 ± 68 Mg ha−1 (2 years after windthrow). AGB increased to 323.4 ± 138.7 Mg ha−1 and 327.5 ± 86.2 Mg ha−1, 12 and 22 years after disturbance, respectively. This AGB recovery process was also observed for sites with high severity. Although AGB loss was considerably lower at low and moderate severity, these areas showed an increased biomass compared to old-growth levels 12 years after windthrow. AGB values differed among studied old-growth areas (see details in Appendix C). For these reasons, AGB recovery in disturbed areas was analyzed relative to old-growth values. Thus, a relative sequence of AGB recovery was made (Figure 3A, bottom panel). As suggested by a linear model (Figure 4-Iquitos), AGB stocks at all windthrow severities will recover to ~90% of that observed in contiguous old-growth forest over a time span of 22 years.

4. Discussion

4.1. Patterns of Recovery after Windthrow

Differences in forest attributes exist across the Amazon Basin [41,42], including tree-mortality predictors [10,43] that can explain different mortality/survival mechanisms when compared across a large region. Winds are an important mechanism of natural disturbance in forests worldwide [44,45,46]. Windthrows produce varying levels of tree damage/mortality that change forest structure [6,20] and can initiate varying successional trajectories [8,15,28]. Our results give further evidence to the importance of wind as a major disturbance mechanism in Amazon forests [9,12,15,47]
Forest inventories at windthrow sites in the Northwestern Amazon (our plots) and Central Amazon [5,8,15] followed the same overall sampling and analysis design. The degree of windthrow tree mortality estimated from ∆NPV was higher (up to 95%) in our Northwestern Amazon sites compared to the Central Amazon (up to 70%) [5,12,15]. For that reason, we included one additional severity class to represent extreme windthrow tree-mortality (>60%).
The 562 ± 87 trees ha−1 in our old-growth forests is similar to the number reported by other studies conducted in the Northwestern Amazon, for example 608–616 trees ha−1 [48], 559 ± 74 trees ha−1 [41], 589 ± 20 trees ha−1 [49], as well as in the Central Amazon (583 ± 46 trees ha−1) [15]. Our data on stem density (Figure 3A, top panel) shows that 12 years after windthrow, the windthrown forest reaches the same values observed in the adjacent/contiguous old-growth, and maintains this pattern at least until 22 years of recovery. Compared to plots in the Central Amazon, (Figure 3B, top panel) the patterns of forest recovery are similar in terms of TPH and the time required to recover to old-growth values for both regions is between 12 and 14 years, independent of the severity. Tree density was smaller in the Northwestern Amazon indicating that, for a given windthrow severity, mortality was relatively higher in this region than in the Central Amazon. Tree density recovery following disturbances was also faster in Iquitos (NWA) compared to Manaus (CA). In the Northwestern Amazon, tree density was reduced to 377 ± 89 trees ha−1 and 382 ± 35 trees ha−1 2 years after windthrow disturbance in the >40% and > 60% tree-mortality categories, respectively. In the Central Amazon, tree density was 422 ± 121 trees ha−1 4 years after disturbance in the >40% tree-mortality category [15].
Basal area in old-growth forests in the Northwestern Amazon was previously reported as ~28 m2 ha−1 [41] and 27.65 (±2.0) m2 ha−1 [49]. These values are similar to those found at our study sites in the Northwestern Amazon (24.8 ± 2.3 m2 ha−1) and those in the Central Amazon (26.8 ± 2.4 m2 ha−1) [15]. In our study, the estimated recovery time for the relative basal area (Figure 3A, middle panel) shows a gradual increase in all the windthrow severities. Compared with the Central Amazon (Figure 3B, top and middle panels), we observed a faster recovery of tree density and basal area in the Northwestern Amazon. This also contributes to a more rapid recovery of biomass [15,50] and may be related to changes in floristic composition and species diversity [15,51].

4.2. Time Span of Biomass Recovery

In tropical forests, the recovery of biomass following disturbance can vary greatly depending on the latitude, type and severity of the disturbance. In secondary forests created by human disturbances (e.g., slash-and-burn, and clear cut), biomass recovery to old-growth conditions can take from 66 [52] to >100 years [31,53,54,55]. These differences in time reflect, among other factors, the availability of nutrients for regrowth [56]. A hurricane in Puerto Rico reduced biomass by 50% [57]. Moreover, impacts and recovery times for this disturbance depended strongly on the degree of hurricane damage, with biomass recovery taking from 4 to 6 years (F0 damage), and from 50 to 150 years (F3 damage) [58,59]. This pattern was also observed after selective logging in Tapajos, Brazil (Central Amazon). Biomass recovery took ~13 years [60] and minimally affected forest carbon and water exchanges [61].
Previous studies in old-growth Amazon forests reported AGB ranging from 303 to 385 Mg ha−1 [62], 155 to 425 Mg ha−1 [63] and ~256 Mg ha−1 [64]. Regional-scale variations in biomass are well documented and likely related to factors such as climate [21,22], soils and nutrient availability, or geomorphological characteristics [23]. The causes of regional variations in vegetation structure across different forest types [64] and the main drivers of tree mortality are not yet fully understood [10]. Our results highlight the importance of large-scale windthrows in shaping forest structure in the Northwestern Amazon.
In the Amazon, windthrow distribution extends from the Northwestern Amazon to the Central Amazon [12], showing a spatial and temporal variability in gap sizes [11,65] and mortality rates [6,8,9,12]. In our study, the estimated time to recover AGB increased slightly with windthrow severity. In our study, the recovery to old-growth levels occurred after 22 years (Figure 3A, bottom panel), whereas in the Central Amazon, 24 years were only enough to recover the old-growth levels of attributes observed in forests exposed to low-severity windthrow, and showed a slower growth increment for moderate and high severities even 27 years after windthrow (Figure 3B, bottom panel).
We described the trajectories of biomass recovery in the Northwestern and Central Amazon using linear models (Figure 4). For the Northwestern Amazon, we estimated recovery to be at least > 90% of the old-growth condition after 14 years, 15 years, 18 years, and 20 years since windthrow for low, moderate, extreme, and high windthrow tree-mortality, respectively. For the Central Amazon we estimated ~10 years, ~30 years, and ~37 years for low, high, and moderate windthrow tree-mortality, respectively (details in Supplementary Material SM1, SM2). Differences in the width of confident intervals between the Northwestern and Central Amazon in Figure 4 reflect the number of binned plots used for each site and the numbers of measured years. In the Central Amazon, more complex models such as the generalized additive model (GAM) were used for estimating how biomass recovered to pre-disturbance levels (from 27 to 40 years, maximum) [8].
Our study indicated a faster recovery of biomass in the Northwestern Amazon than in the Central Amazon, which may be explained by the higher productivity in this region [26], and potentially related geographic variations in community attributes, including larger tree diversity [42] which can influence tree mortality patterns [12]. In addition, high competition in combination with water availability [25,66] promotes high productivity, and species that sacrifice defenses in favor of the competitive advantage obtained by rapid growth and low wood density may be favored in regions with severe disturbance regimes [43]. Thus, faster recovery could be the result of adaptation to more frequent windthrow disturbance in the Northwestern Amazon [12], which provides supporting evidence for the growth-defense hypothesis [67].
Ecologists have long recognized that disturbances and recovery processes overlap in spatial and temporal dimensions [68]. In our study sites, the density and size distribution of trees had returned to old-growth levels only 12 years after windthrow. Furthermore, basal area and biomass recovered to pre-disturbance levels within 20 years of the disturbance. This is ~50% faster than the recovery from windthrows observed in the Central Amazon. Future research on forest recovery from windthrows should include a component of geospatial analysis to help explain individual tree response [8].

5. Conclusions

This study demonstrated rapid recovery of tree density, basal area, and AGB in the two decades following windthrow events that caused mortality rates >60% in forests near Iquitos, Peru. The observed recovery rates are nearly twice as fast as those reported for a comparable study conducted in the slower-growing forests of the Central Amazon. The variations in forest damage and the recovery dynamics across this geographical and climatic gradient emphasize the effect that extreme wind and rain associated with convective storms can have on the spatial variability of forest structure across the Amazon Basin.

Supplementary Materials

The following are available online at https://www.mdpi.com/article/10.3390/f12060667/s1, Html SM1: Chronosequences (LM CI = 90%) for AGB recovery (>90% Old-growth conditions) across a range of windthrow severities in Iquitos, Peru (Northwestern Amazon), Html SM2: Chronosequences (LM CI = 90%) for AGB recovery (>90% Old-growth conditions) across a range of windthrow severities in Manaus, Brazil (Central Amazon).

Author Contributions

J.D.U.M., D.M.M., R.I.N.-J., J.Q.C., A.B. and S.E.T. performed the research and designed the analysis. J.D.U.M., D.M.M., R.I.N.-J., S.W.R., R.T.-E., W.A.-M., J.D.U.M. performed the data collection. J.D.U.M. analyzed the data and wrote the paper with contributions from R.I.N.-J., S.E.T., D.M.M., A.B., T.P.-G., H.S.J., S.W.R. All authors have read and agreed to the published version of the manuscript.

Funding

This research was supported by the Max Planck Institute of Biogeochemistry and the DAAD (German Academic Exchange Service). The field campaign was supported as part of the Next Generation Ecosystem Experiments-Tropics funded by the U.S. Department of Energy, Office of Science, and Office of Biological and Environmental Research. Data collection was supported by NASA Biodiversity (Grant number: NNX09AK21G). The Brazilian data applied in this study is part of the ATTO Project, funded by the German Federal Ministry of Education and Research (BMBF contracts 01LB1001A and 01LK1602A) and the Brazilian Ministério da Cieência, Tecnologia e Inovação (MCTI/FINEP contract 01.11.01248.00) as well as the Max Planck Society (MPG). Brazilian sites are also supported by the Instituto Nacional de Ciência e Tecnologia INCT-Madeiras da Amazônia. D.M.M. is also supported by the ATTO Project. R.N.J. is also supported by Reducing Uncertainties in Biogeochemical Interactions through Synthesis and Computation Scientific Focus Area (RUBISCO SFA) under contract to LBNL, which is sponsored by the Regional and Global Climate Modeling (RGCM) Program in the Climate and Environmental Sciences Division (CESD) of the Office of Biological and Environmental Research (BER) in the US Department of Energy Office of Science.

Institutional Review Board Statement

Not applicable.

Informed Consent Statement

Not applicable.

Data Availability Statement

The data presented in this study can be made available upon request from the corresponding author.

Acknowledgments

We thank crew members at the National University of the Peruvian Amazon (UNAP), for their logistic support through the project-Muro Huayra (RD N° 321-2009-FCF-UNAP, RR N°1389-2010-UNAP), Jarli Isuiza, Pablo Marin, and Victor Casanova for their dedicated field work.

Conflicts of Interest

The authors declare no conflict of interest.

Appendix A

Table A1. Summary of forest floristics characteristic by severity and years after windthrows.
Years after WindthrowSeverityNumber of FamiliesNumber of GenusNumber of Species
2Extreme295275
High204268
Moderate234576
Low3980174
Old-growth46112245
12Extreme3486125
High265379
Moderate4195161
Low46100185
Old-growth52159342
22Extreme39112222
High3984155
Moderate315482
Low3489170
Old-growth47120257

Appendix B

Figure A1. AGB estimations for model 1 (Chave et al, 2014) and model 2 (Magnabosco Marra et al., 2016) at circles and triangles, respectively. Red and Blue lines show the regression using Generalized additive model (GAM) for both models.
Forests 12 00667 g0a1

Appendix C

Figure A2. Recovery of AGB (Mg ha−1) of old-growth and windthrown forests across the range of severity classes at 2, 12, and 22 years after windthrow. 95% confidence intervals given by the error bars. Dashed dark green lines show the old-growth mean (of the three sites).
Forests 12 00667 g0a2

References

  1. Nelson, B.; Amaral, I. Destructive Wind Effects Detected in TM Image in the Amazon Basin. In Proceedings of the International Society for Photogrammetry and Remote Sensing, Rio de Janeiro, Brazil, 26–30 September 1994; Brazil’s National Institute for Space Research: Rio de Janeiro, Brazil, 1994; pp. 339–343. [Google Scholar]
  2. Garstang, M.; White, S.; Shugart, H.H.; Halverson, J. Convective Cloud Downdrafts as the Cause of Large Blowdowns in the Amazon Rainforest. Meteorl. Atmos. Phys. 1998, 67, 199–212. [Google Scholar] [CrossRef]
  3. Negrón-Juárez, R.I.; Chambers, J.Q.; Guimaraes, G.; Zeng, H.; Raupp, C.F.M.; Marra, D.M.; Ribeiro, G.H.P.M.; Saatchi, S.S.; Nelson, B.W.; Higuchi, N. Widespread Amazon Forest Tree Mortality from a Single Cross-Basin Squall Line Event: Wind-Driven Tree Mortality in Amazonia. Geophys. Res. Lett. 2010, 37. [Google Scholar] [CrossRef]
  4. Mitchell, S.J. Wind as a Natural Disturbance Agent in Forests: A Synthesis. Forestry 2013, 86, 147–157. [Google Scholar] [CrossRef] [Green Version]
  5. Magnabosco Marra, D.; Higuchi, N.; Trumbore, S.E.; Ribeiro, G.H.P.M.; dos Santos, J.; Carneiro, V.M.C.; Lima, A.J.N.; Chambers, J.Q.; Negrón-Juárez, R.I.; Holzwarth, F.; et al. Predicting Biomass of Hyperdiverse and Structurally Complex Central Amazonian Forests–a Virtual Approach Using Extensive Field Data. Biogeosciences 2016, 13, 1553–1570. [Google Scholar] [CrossRef] [Green Version]
  6. Rifai, S.W.; Urquiza Muñoz, J.D.; Negrón-Juárez, R.I.; Ramírez Arévalo, F.R.; Tello-Espinoza, R.; Vanderwel, M.C.; Lichstein, J.W.; Chambers, J.Q.; Bohlman, S.A. Landscape-Scale Consequences of Differential Tree Mortality from Catastrophic Wind Disturbance in the Amazon. Ecol. Appl. 2016, 26, 2225–2237. [Google Scholar] [CrossRef] [Green Version]
  7. Negrón-Juárez, R.; Jenkins, H.; Raupp, C.; Riley, W.; Kueppers, L.; Magnabosco Marra, D.; Ribeiro, G.; Monteiro, M.; Candido, L.; Chambers, J.; et al. Windthrow Variability in Central Amazonia. Atmosphere 2017, 8, 28. [Google Scholar] [CrossRef] [Green Version]
  8. Magnabosco Marra, D.; Trumbore, S.E.; Higuchi, N.; Ribeiro, G.H.P.M.; Negrón-Juárez, R.I.; Holzwarth, F.; Rifai, S.W.; dos Santos, J.; Lima, A.J.N.; Kinupp, V.F.; et al. Windthrows Control Biomass Patterns and Functional Composition of Amazon Forests. Glob. Chang. Biol. 2018, 24, 5867–5881. [Google Scholar] [CrossRef] [Green Version]
  9. Silvério, D.V.; Brando, P.M.; Bustamante, M.M.C.; Putz, F.E.; Marra, D.M.; Levick, S.R.; Trumbore, S.E. Fire, Fragmentation, and Windstorms: A Recipe for Tropical Forest Degradation. J. Ecol. 2019, 107, 656–667. [Google Scholar] [CrossRef]
  10. Esquivel-Muelbert, A.; Phillips, O.L.; Brienen, R.J.W.; Fauset, S.; Sullivan, M.J.P.; Baker, T.R.; Chao, K.-J.; Feldpausch, T.R.; Gloor, E.; Higuchi, N.; et al. Tree Mode of Death and Mortality Risk Factors across Amazon Forests. Nat. Commun. 2020, 11, 5515. [Google Scholar] [CrossRef]
  11. Espírito-Santo, F.D.B.; Gloor, M.; Keller, M.; Malhi, Y.; Saatchi, S.; Nelson, B.; Junior, R.C.O.; Pereira, C.; Lloyd, J.; Frolking, S.; et al. Size and Frequency of Natural Forest Disturbances and the Amazon Forest Carbon Balance. Nat. Commun. 2014, 5, 3434. [Google Scholar] [CrossRef] [Green Version]
  12. Negrón-Juárez, R.I.; Holm, J.A.; Marra, D.M.; Rifai, S.W.; Riley, W.J.; Chambers, J.Q.; Koven, C.D.; Knox, R.G.; McGroddy, M.E.; Di Vittorio, A.V.; et al. Vulnerability of Amazon Forests to Storm-Driven Tree Mortality. Environ. Res. Lett. 2018, 13, 054021. [Google Scholar] [CrossRef]
  13. Chesson, P. Overview: Nonequilibrium community theories: Chance, variability, history, and coexistence. In Community Ecology; Diamond, J., Case, T.J., Eds.; Harper and Row: New York, NY, USA, 1986; pp. 229–239. [Google Scholar]
  14. Ennos, A.R. Wind as a Ecological Factor. Trends Ecol. Evol. 1997, 12, 108–111. [Google Scholar] [CrossRef]
  15. Marra, D.M.; Chambers, J.Q.; Higuchi, N.; Trumbore, S.E.; Ribeiro, G.H.P.M.; dos Santos, J.; Negrón-Juárez, R.I.; Reu, B.; Wirth, C. Large-Scale Wind Disturbances Promote Tree Diversity in a Central Amazon Forest. PLoS ONE 2014, 9, e103711. [Google Scholar] [CrossRef]
  16. Ulanova, N.G. The Effects of Windthrow on Forests at Different Spatial Scales: A Review. For. Ecol. Manag. 2000, 135, 155–167. [Google Scholar] [CrossRef]
  17. Denslow, J.S. Tropical Rainforest Gaps and Tree Species Diversity. Annu. Rev. Ecol. Syst. 1987, 18, 431–451. [Google Scholar] [CrossRef]
  18. Baker, T.R.; Vela Díaz, D.M.; Chama Moscoso, V.; Navarro, G.; Monteagudo, A.; Pinto, R.; Cangani, K.; Fyllas, N.M.; Lopez Gonzalez, G.; Laurance, W.F.; et al. Consistent, Small Effects of Treefall Disturbances on the Composition and Diversity of Four Amazonian Forests. J. Ecol. 2016, 104, 497–506. [Google Scholar] [CrossRef] [PubMed] [Green Version]
  19. Seidl, R.; Schelhaas, M.-J.; Lexer, M.J. Unraveling the Drivers of Intensifying Forest Disturbance Regimes in Europe: Drivers of Forest Disturbance Intensification. Glob. Chang. Biol. 2011, 17, 2842–2852. [Google Scholar] [CrossRef]
  20. Quine, C.P.; Gardiner, B.A. Understanding How the Interaction of Wind and Trees Results in Windthrow, Stem Breakage, and Canopy Gap Formation. In Plant Disturbance Ecology; Elsevier: Amsterdam, The Netherlands, 2007; pp. 103–155. ISBN 978-0-12-088778-1. [Google Scholar]
  21. Espinoza Villar, J.C.; Ronchail, J.; Guyot, J.L.; Cochonneau, G.; Naziano, F.; Lavado, W.; De Oliveira, E.; Pombosa, R.; Vauchel, P. Spatio-Temporal Rainfall Variability in the Amazon Basin Countries (Brazil, Peru, Bolivia, Colombia, and Ecuador). Int. J. Climatol. 2009, 29, 1574–1594. [Google Scholar] [CrossRef] [Green Version]
  22. Marengo, J.A. Interdecadal Variability and Trends of Rainfall across the Amazon Basin. Theor. Appl. Climatol. 2004, 78, 79–96. [Google Scholar] [CrossRef]
  23. Quesada, C.A.; Lloyd, J.; Anderson, L.O.; Fyllas, N.M.; Schwarz, M.; Czimczik, C.I. Soils of Amazonia with Particular Reference to the Rainfor Sites. Biogeosciences 2011, 8, 1415–1440. [Google Scholar] [CrossRef] [Green Version]
  24. Gloor, M.; Brienen, R.J.W.; Galbraith, D.; Feldpausch, T.R.; Schöngart, J.; Guyot, J.-L.; Espinoza, J.C.; Lloyd, J.; Phillips, O.L. Intensification of the Amazon Hydrological Cycle over the Last Two Decades. Geophys. Res. Lett. 2013, 40, 1729–1733. [Google Scholar] [CrossRef]
  25. Nemani, R.R. Climate-Driven Increases in Global Terrestrial Net Primary Production from 1982 to 1999. Science 2003, 300, 1560–1563. [Google Scholar] [CrossRef] [PubMed] [Green Version]
  26. Malhi, Y.; Davidson, E.A. Biogeochemistry and Ecology of terrestrial Ecosystems of Amazonia. In Amazonia and Global Change; American Geophysical Union: Washington, DC, USA, 2009; ISBN 978-0-87590-476-4. [Google Scholar]
  27. de Mello Ribeiro, G.H.P.; Suwa, R.; Marra, D.M.; Lima, A.J.N.; Kajimoto, T.; Ishizuka, M.; Higuchi, N. Allometry for Juvenile Trees in an Amazonian Forest after Wind Disturbance. JARQ 2014, 48, 213–219. [Google Scholar] [CrossRef] [Green Version]
  28. Andrewsa, T.; Dietze, M.; Booth, R. Climate or Disturbance: Temperate Forest Structural Change and Carbon Sink Potential. bioRxiv 2018, 478693. [Google Scholar] [CrossRef]
  29. Sombroek, W. Spatial and Temporal Patterns of Amazon Rainfall: Consequences for the Planning of Agricultural Occupation and the Protection of Primary Forests. AMBIO J. Hum. Environ. 2001, 30, 388–396. [Google Scholar] [CrossRef] [PubMed]
  30. Adams, J.B.; Gillespie, A.R. Remote Sensing of Landscapes with Spectral Images: A Physical Modeling Approach; Cambridge University Press: Cambridge, UK, 2006; ISBN 978-0-511-61719-5. [Google Scholar]
  31. Saldarriaga, J.G.; West, D.C.; Tharp, M.L.; Uhl, C. Long-Term Chronosequence of Forest Succession in the Upper Rio Negro of Colombia and Venezuela. J. Ecol. 1988, 76, 938. [Google Scholar] [CrossRef]
  32. Masek, J.G.; Vermote, E.F.; Saleous, N.E.; Wolfe, R.; Hall, F.G.; Huemmrich, K.F.; Gao, F.; Kutler, J.; Lim, T.-K. A Landsat Surface Reflectance Dataset for North America, 1990–2000. IEEE Geosci. Remote Sens. Lett. 2006, 3, 68–72. [Google Scholar] [CrossRef]
  33. Gorelick, N.; Hancher, M.; Dixon, M.; Ilyushchenko, S.; Thau, D.; Moore, R. Google Earth Engine: Planetary-Scale Geospatial Analysis for Everyone. Remote Sens. Environ. 2017, 202, 18–27. [Google Scholar] [CrossRef]
  34. Adams, J. Classification of Multispectral Images Based on Fractions of Endmembers: Application to Land-Cover Change in the Brazilian Amazon. Remote Sens. Environ. 1995, 52, 137–154. [Google Scholar] [CrossRef]
  35. Chambers, J.Q.; Negrón-Juárez, R.I.; Hurtt, G.C.; Marra, D.M.; Higuchi, N. Lack of Intermediate-Scale Disturbance Data Prevents Robust Extrapolation of Plot-Level Tree Mortality Rates for Old-Growth Tropical Forests: Clustered Gaps Tropical Tree Mortality Rates. Ecol. Lett. 2009, 12, E22–E25. [Google Scholar] [CrossRef]
  36. Balderas Torres, A.; Lovett, J.C. Using Basal Area to Estimate Aboveground Carbon Stocks in Forests: La Primavera Biosphere’s Reserve, Mexico. Forestry 2013, 86, 267–281. [Google Scholar] [CrossRef] [Green Version]
  37. Chave, J.; Réjou-Méchain, M.; Búrquez, A.; Chidumayo, E.; Colgan, M.S.; Delitti, W.B.C.; Duque, A.; Eid, T.; Fearnside, P.M.; Goodman, R.C.; et al. Improved Allometric Models to Estimate the Aboveground Biomass of Tropical Trees. Glob. Chang. Biol. 2014, 20, 3177–3190. [Google Scholar] [CrossRef] [PubMed]
  38. Chave, J.; Coomes, D.; Jansen, S.; Lewis, S.L.; Swenson, N.G.; Zanne, A.E. Towards a Worldwide Wood Economics Spectrum. Ecol. Lett. 2009, 12, 351–366. [Google Scholar] [CrossRef]
  39. De Oliveira, M.M.; Higuchi, N.; Celes, C.H.; Higuchi, F.G. Tamanho e Formas de Parcelas Para Inventários Florestais de Espécies Arbóreas na Amazônia Central. Ciênc. Florest. 2014, 24, 645–653. [Google Scholar] [CrossRef] [Green Version]
  40. R Core Team. R: A Language and Environment for Statistical Computing; R Foundation for Statistical Computing: Vienna, Austria, 2013. [Google Scholar]
  41. Feldpausch, T.R.; Banin, L.; Phillips, O.L.; Baker, T.R.; Lewis, S.L.; Quesada, C.A.; Affum-Baffoe, K.; Arets, E.J.M.M.; Berry, N.J.; Bird, M.; et al. Height-Diameter Allometry of Tropical Forest Trees. Biogeosciences 2011, 8, 1081–1106. [Google Scholar] [CrossRef] [Green Version]
  42. ter Steege, H.; Pitman, N.C.A.; Phillips, O.L.; Chave, J.; Sabatier, D.; Duque, A.; Molino, J.-F.; Prévost, M.-F.; Spichiger, R.; Castellanos, H.; et al. Continental-Scale Patterns of Canopy Tree Composition and Function across Amazonia. Nature 2006, 443, 444–447. [Google Scholar] [CrossRef]
  43. Chao, K.-J.; Phillips, O.L.; Gloor, E.; Monteagudo, A.; Torres-Lezama, A.; Martínez, R.V. Growth and Wood Density Predict Tree Mortality in Amazon Forests. J. Ecol. 2008, 96, 281–292. [Google Scholar] [CrossRef]
  44. Aigbe, H.I.; Omokhua, G.E. Modeling Diameter Distribution of the Tropical Rainforest in Oban Forest Reserve. JEE 2014, 5, 130. [Google Scholar] [CrossRef] [Green Version]
  45. Muller-Landau, H.C.; Condit, R.S.; Harms, K.E.; Marks, C.O.; Thomas, S.C.; Bunyavejchewin, S.; Chuyong, G.; Co, L.; Davies, S.; Foster, R.; et al. Comparing Tropical Forest Tree Size Distributions with the Predictions of Metabolic Ecology and Equilibrium Models. Ecol. Lett. 2006, 9, 589–602. [Google Scholar] [CrossRef]
  46. Niklas, K.J.; Midgley, J.J.; Rand, R.H. Tree Size Frequency Distributions, Plant Density, Age and Community Disturbance: Tree Size Distributions. Ecol. Lett. 2003, 6, 405–411. [Google Scholar] [CrossRef] [Green Version]
  47. Chambers, J.Q.; Negron-Juarez, R.I.; Marra, D.M.; Di Vittorio, A.; Tews, J.; Roberts, D.; Ribeiro, G.H.P.M.; Trumbore, S.E.; Higuchi, N. The Steady-State Mosaic of Disturbance and Succession across an Old-Growth Central Amazon Forest Landscape. Proc. Natl. Acad. Sci. USA 2013, 110, 3949–3954. [Google Scholar] [CrossRef] [PubMed] [Green Version]
  48. Martinez, R.V.; Phillips, O.L. Allpahuayo: Floristics, Structure, and Dynamics of a High-Diversity Forest in Amazonian Peru. Ann. Mo. Bot. Gard. 2000, 87, 499. [Google Scholar] [CrossRef]
  49. Lewis, S.L.; Phillips, O.L.; Baker, T.R.; Lloyd, J.; Malhi, Y.; Almeida, S.; Higuchi, N.; Laurance, W.F.; Neill, D.A.; Silva, J.N.M.; et al. Concerted Changes in Tropical Forest Structure and Dynamics: Evidence from 50 South American Long-Term Plots. Phil. Trans. R. Soc. Lond. B 2004, 359, 421–436. [Google Scholar] [CrossRef] [PubMed]
  50. Chazdon, R.L.; Letcher, S.G.; van Breugel, M.; Martínez-Ramos, M.; Bongers, F.; Finegan, B. Rates of Change in Tree Communities of Secondary Neotropical Forests Following Major Disturbances. Phil. Trans. R. Soc. B 2007, 362, 273–289. [Google Scholar] [CrossRef]
  51. Sheil, D.; Burslem, D.F.R.P. Disturbing Hypotheses in Tropical Forests. Trends Ecol. Evol. 2003, 18, 18–26. [Google Scholar] [CrossRef]
  52. Poorter, L.; Bongers, F.; Aide, T.M.; Almeyda Zambrano, A.M.; Balvanera, P.; Becknell, J.M.; Boukili, V.; Brancalion, P.H.S.; Broadbent, E.N.; Chazdon, R.L.; et al. Biomass Resilience of Neotropical Secondary Forests. Nature 2016, 530, 211–214. [Google Scholar] [CrossRef]
  53. Chazdon, R.L. Tropical Forest Recovery: Legacies of Human Impact and Natural Disturbances. Perspect. Plant Ecol. Evol. Syst. 2003, 6, 51–71. [Google Scholar] [CrossRef] [Green Version]
  54. D’Oliveira, M.V.N.; Alvarado, E.C.; Santos, J.C.; Carvalho, J.A. Forest Natural Regeneration and Biomass Production after Slash and Burn in a Seasonally Dry Forest in the Southern Brazilian Amazon. For. Ecol. Manag. 2011, 261, 1490–1498. [Google Scholar] [CrossRef]
  55. Elias, F.; Ferreira, J.; Lennox, G.D.; Berenguer, E.; Ferreira, S.; Schwartz, G.; de Oliveira Melo, L.; Reis Júnior, D.N.; Nascimento, R.O.; Ferreira, F.N.; et al. Assessing the Growth and Climate Sensitivity of Secondary Forests in Highly Deforested Amazonian Landscapes. Ecology 2020, 101. [Google Scholar] [CrossRef]
  56. Veldkamp, E.; Schmidt, M.; Powers, J.S.; Corre, M.D. Deforestation and Reforestation Impacts on Soils in the Tropics. Nature Rev. Earth Environ. 2020, 1, 590–605. [Google Scholar] [CrossRef]
  57. Scatena, F.N.; Moya, S.; Estrada, C.; Chinea, J.D. The First Five Years in the Reorganization of Aboveground Biomass and Nutrient Use Following Hurricane Hugo in the Bisley Experimental Watersheds, Luquillo Experimental Forest, Puerto Rico. Biotropica 1996, 28, 424. [Google Scholar] [CrossRef]
  58. Everham, E.M.; Brokaw, N.V.L. Forest Damage and Recovery from Catastrophic Wind. Bot. Rev. 1996, 62, 113–185. [Google Scholar] [CrossRef]
  59. Boose, E.R.; Serrano, M.I.; Foster, D.R. Landscape and Regional Impacts of Hurricanes in Puerto Rico. Ecol. Monogr. 2004, 74, 335–352. [Google Scholar] [CrossRef]
  60. Silva, J.N.M.; de Carvalho, J.O.P.; Lopes, J.d.C.A.; de Almeida, B.F.; Costa, D.H.M.; de Oliveira, L.C.; Vanclay, J.K.; Skovsgaard, J.P. Growth and Yield of a Tropical Rain Forest in the Brazilian Amazon 13 Years after Logging. For. Ecol. Manag. 1995, 71, 267–274. [Google Scholar] [CrossRef] [Green Version]
  61. Miller, S.D.; Goulden, M.L.; Hutyra, L.R.; Keller, M.; Saleska, S.R.; Wofsy, S.C.; Figueira, A.M.S.; da Rocha, H.R.; de Camargo, P.B. Reduced Impact Logging Minimally Alters Tropical Rainforest Carbon and Energy Exchange. Proc. Natl. Acad. Sci. USA 2011, 108, 19431–19435. [Google Scholar] [CrossRef] [PubMed] [Green Version]
  62. Nogueira, E.M.; Fearnside, P.M.; Nelson, B.W.; Barbosa, R.I.; Keizer, E.W.H. Estimates of Forest Biomass in the Brazilian Amazon: New Allometric Equations and Adjustments to Biomass from Wood-Volume Inventories. For. Ecol. Manag. 2008, 256, 1853–1867. [Google Scholar] [CrossRef]
  63. Houghton, R.A.; Lawrence, K.T.; Hackler, J.L.; Brown, S. The Spatial Distribution of Forest Biomass in the Brazilian Amazon: A Comparison of Estimates. Glob. Chang. Biol. 2001, 7, 731–746. [Google Scholar] [CrossRef]
  64. Lima, A.J.N.; Suwa, R.; de Mello Ribeiro, G.H.P.; Kajimoto, T.; dos Santos, J.; da Silva, R.P.; de Souza, C.A.S.; de Barros, P.C.; Noguchi, H.; Ishizuka, M.; et al. Allometric Models for Estimating Above- and below-Ground Biomass in Amazonian Forests at São Gabriel Da Cachoeira in the Upper Rio Negro, Brazil. For. Ecol. Manag. 2012, 277, 163–172. [Google Scholar] [CrossRef]
  65. Espírito, F.D.B.; Keller, M.; Braswell, B.; Nelson, B.W.; Frolking, S.; Vicente, G. Storm Intensity and Old-growth Forest Disturbances in the Amazon Region. Geophys. Res. Lett. 2010, 37, 6. [Google Scholar] [CrossRef] [Green Version]
  66. Rozendaal, D.M.A.; Phillips, O.L.; Lewis, S.L.; Affum-Baffoe, K.; Alvarez-Davila, E.; Andrade, A.; Aragão, L.E.O.C.; Araujo-Murakami, A.; Baker, T.R.; Bánki, O.; et al. Competition Influences Tree Growth, but Not Mortality, across Environmental Gradients in Amazonia and Tropical Africa. Ecology 2020, 101, e03052. [Google Scholar] [CrossRef]
  67. Stephenson, N.L.; van Mantgem, P.J.; Bunn, A.G.; Bruner, H.; Harmon, M.E.; O’Connell, K.B.; Urban, D.L.; Franklin, J.F. Causes and Implications of the Correlation between Forest Productivity and Tree Mortality Rates. Ecol. Monogr. 2011, 81, 527–555. [Google Scholar] [CrossRef] [Green Version]
  68. Zelnik, Y.R.; Arnoldi, J.-F.; Loreau, M. The Impact of Spatial and Temporal Dimensions of Disturbances on Ecosystem Stability. Front. Ecol. Evol. 2018, 6, 224. [Google Scholar] [CrossRef] [PubMed] [Green Version]
Figure 1. Top left inset: Map demonstrating the mean annual number of rainfall events for the period 1998–2016 obtained using TRMM. The red square indicates the location of the study sites near Iquitos, Perú. Main figure: Map of windthrow severity over the study region. Small black squares indicate the locations of the Nauta, Napo, and Oroza sites (3 ha each). These sites are enlarged in the top right, bottom right, and bottom left inset panels which include transects (black lines) located across the windthrow gradient within each field site.
Forests 12 00667 g001
Figure 2. Recovery of (a) tree density (N tree ha−1), and (b) mean basal area (m2 ha−1) of old-growth and windthrown forests across the range of severity classes at 2, 12, and 22 years after windthrow. 95% confidence intervals given by the error bars. Dashed dark green lines show the old-growth mean (of the three sites).
Forests 12 00667 g002
Figure 3. Recovery of structural attributes in Northwestern and Central Amazon windthrown forest. Structural attributes: trees per hectare (TPH), basal area (BA) and aboveground biomass (AGB). Sites: (A) Iquitos (NWA) and (B) Manaus (CA). Dashed dark green lines show the old-growth mean and vertical bars the 95% confidence intervals (error bars).
Forests 12 00667 g003
Figure 4. Chronosequences (LM CI = 90%) for AGB recovery (>90% Old-growth conditions) across a range of windthrow severities in Iquitos, Peru (Northwestern Amazon) and Manaus, Brazil (Central Amazon). The dashed dark-green line shows the old-growth condition.
Forests 12 00667 g004
Table 1. Allometric equations used for AGB estimation.
ModelEquationReference
Model 1AGBest = exp [−1.803 − 0.97 E + 0.976 ln (WD) + 2.673 ln (D) − 0.229 [ln(D)]2]Equation (7) in [37]
Model 2AGBest = 0.230 D2.406·(WD)0.88Equation (33) in [5]
Model 3AGBest = 0.183 D2.328Equation (13) in [5]
D = diameter (cm), WD = wood density (g/cm3), E = environmental stress.
Table 2. The number of subplots and their total area (ha) for each windthrow tree-mortality category (defined as % of individuals) and disturbance severity class. Subplot data are given across the three study sites and periods of time (year) since windthrow.
Mortality (%)Disturbance SeverityYears Since Windthrow Total Number of Subplots by Severity
2 Years12 Years22 Years
≤4Old-growth39 (1.17 ha)46 (1.38 ha)35 (1.03 ha)120
>4 & ≤20Low27 (0.81 ha)20 (0.6 ha)17 (0.51 ha)64
>20 & ≤40Moderate14 (0.42 ha)14 (0.42 ha)7 (0.21 ha)35
>40 & ≤60High10 (0.30 ha)7 (0.21 ha)15 (0.45 ha)32
>60 (max:94)Extreme13 (0.39 ha)13 (0.39 ha)26 (0.78 ha)52
Total subplots by years103100100303
Publisher’s Note: MDPI stays neutral with regard to jurisdictional claims in published maps and institutional affiliations.

