Article

Burn Severity Assessment Using Sentinel-1 SAR in the Southeast Peruvian Amazon, a Case Study of Madre de Dios

by
Gabriel Alarcon-Aguirre
1,2,3,
Reynaldo Fabrizzio Miranda Fidhel
1,
Dalmiro Ramos Enciso
4,
Rembrandt Canahuire-Robles
2,3,
Liset Rodriguez-Achata
3,5 and
Jorge Garate-Quispe
6,*
1
Departamento Académico de Ingeniería Forestal y Medio Ambiente, Facultad de Ingeniería, Universidad Nacional Amazónica de Madre de Dios, Puerto Maldonado 17001, Peru
2
Centro de Teledetección para el Estudio y Gestión de los Recursos Naturales (CETEGERN), Facultad de Ingeniería, Universidad Nacional Amazónica de Madre de Dios, Puerto Maldonado 17001, Peru
3
Earth Sciences & Dynamics of Ecology and Landscape Research Group, Universidad Nacional Amazónica de Madre de Dios, Puerto Maldonado 17001, Peru
4
Departamento Académico de Ingeniería de Sistemas e Informática, Facultad de Ingeniería, Universidad Nacional Amazónica de Madre de Dios, Puerto Maldonado 17001, Peru
5
Departamento Académico de Ciencias Básicas, Facultad de Ingeniería, Universidad Nacional Amazónica de Madre de Dios, Puerto Maldonado 17001, Peru
6
Department of Evolutionary Biology, Ecology and Environmental Sciences, University of Barcelona, 08028 Barcelona, Spain
*
Author to whom correspondence should be addressed.
Submission received: 8 June 2022 / Revised: 3 July 2022 / Accepted: 6 July 2022 / Published: 8 July 2022
(This article belongs to the Special Issue Vegetation Fires in South America)

Abstract

:
Fire is one of the significant drivers of vegetation loss and threat to Amazonian landscapes. It is estimated that fires cause about 30% of deforested areas, so the severity level is an important factor in determining the rate of vegetation recovery. Therefore, the application of remote sensing to detect fires and their severity is fundamental. Radar imagery has an advantage over optical imagery because radar can penetrate clouds, smoke, and rain and can see at night. This research presents algorithms for mapping the severity level of burns based on change detection from Sentinel-1 backscatter data in the southeastern Peruvian Amazon. Absolute, relative, and Radar Forest Degradation Index (RDFI) predictors were used through singular polarization length (dB) patterns (Vertical, Vertical-VV and Horizontal, Horizontal-HH) of vegetation and burned areas. The Composite Burn Index (CBI) determined the algorithms’ accuracy. The burn severity ratios used were estimated to be approximately 40% at the high level, 43% at the moderate level, and 17% at the low level. The validation dataset covers 384 locations representing the main areas affected by fires, showing the absolute and relative predictors of cross-polarization (k = 0.734) and RDFI (k = 0.799) as the most concordant in determining burn severity. Overall, the research determines that Sentinel-1 cross-polarized (VH) data has adequate accuracy for detecting and quantifying burns.

1. Introduction

The consequences of a fire generally include the total or partial loss of vegetation, leaving the soil exposed to erosion, flash flooding, and the release of greenhouse gases into the atmosphere [1,2,3]. In addition, fire hazards continue after the event, depending on fire severity. Therefore, it is necessary to assess the severity and vulnerability of fire-affected areas for future management [3,4]. In Peru, and specifically in the Amazon region of Madre de Dios, initiatives exist to respond to emergencies in burned areas. The Regional Emergency Operations Center (COER) has the mission to mitigate fire consequences by quickly assessing the severity of fires and their implications for emergency stabilization and subsequent management. However, its actions are not sufficient to eliminate fire threats.
Currently, the method for determining the severity of burns is through the use of satellite imagery and remote sensing techniques, because they cover large areas and the results are objective [3,5,6,7,8]. For this purpose, satellite images from optical sensor have been widely used and have proven to be useful for mapping burned areas [3,6,7,9]. However, there are questions about the detection and quantification of burned areas as mapping products. Likewise, other studies show that the exclusive use of optical data for mapping burned areas is limited by environmental conditions, biophysical characteristics, spectral signature, and cast shadow [8,10]. In emergency situations, such conditions could result in high costs in lives and property damage.
The severity of burns is generally determined by bitemporal indices based on the normalized burn index (NBR) such as the differentiated normalized burn index (dNBR), the relative dNBR (RdNBR), and the relativized burn index (RBR) [6,7,8]. The related measure, dNBR, refers to the difference between pre- and post-fire datasets. The results of the absolute measure of change in vegetation do not consider the heterogeneity of the landscape, so the burn intensity could vary according to the size and density of vegetation per pixel [5,6,7,8,11,12,13]. Furthermore, these are influenced by vegetation height, moisture content in vegetation and soil, and the exposure of burned material. These characteristics behave adequately for areas not affected or very affected by fire but exhibit lower effectiveness in discriminating intermediate severity levels, where multiple factors interact [6,7,8,11,14,15,16,17,18].
On the other hand, synthetic aperture radar (SAR), as an active sensor, works nocturnally as well and can be used under almost any weather condition. The potential of SAR technologies in mapping burns through active microwaves presents better detection through cloud cover and less interference from weather conditions. Despite this, studies report that backscattering on vegetation and burned areas depends on polarization (VV, HH, VH, and HV), frequency (X, C, and L), soil moisture, and topography, obtaining precisions lower than the optical ones in many studies [17]. The electric field orientations of the electromagnetic wave are known as polarizations and are usually controlled between Horizontal (H) and Vertical (V) (1. HH; Transmitted-Horizontally and Received-Horizontally, 2. HV; Transmitted-Horizontally and Received-Vertically, 3. VH; Transmitted-Vertically and Received-Horizontally, 4. VV; Transmitted-Vertically and Received-Vertically) in terms of where to incorporate the simultaneous orthogonal polarization component that allows the electric field to be equal to the vector sum of the H and V polarizations based on the phase difference (linearly, elliptically, or circularly) [17]. However, investigations of the interferometric coherence of different bands and polarizations in burned areas indicate a strong relationship of the severity of burning in a stable and dry environment, a situation that is appropriate to the seasonality of burning in the Amazon and needs to be investigated [17,19,20,21,22].
In that sense, we use the C-band backscatter data from the Sentinel-1 sensor (with a center frequency of 5.405 GHz and a length of 5.0 cm over a 250 km swath and a high geometric resolution of 5 m by 20 m) to quantify and estimate the severity of burns. For this purpose, we used absolute and relative predictors, as well as the Radar Forest Degradation Index (RDFI) with C-band co-polarization (VV) and cross-polarization (VH), and length patterns (dB) of vegetation and burned areas, validating the accuracy by means of the Composite Burn Index (CBI) calculated from data collected in the field [18,19,20,21,22,23,24,25].
The objective of the study is to estimate the area and severity level of burns through SAR Sentinel-1 in the southeastern Peruvian Amazon. Specifically, we focus on forests during 2020 in the district of Tahuamanu, Madre de Dios. The specific objectives of the study were: (a) to quantify the area of burns, and (b) to estimate the severity levels of burns. The hypothesis of the study indicates that the area and severity level of burns using SAR Sentinel-1 images can be determined through processing techniques employing the absolute/relative predictors (VH) and RDFI, with a kappa accuracy greater than 0.70.

2. Materials and Methods
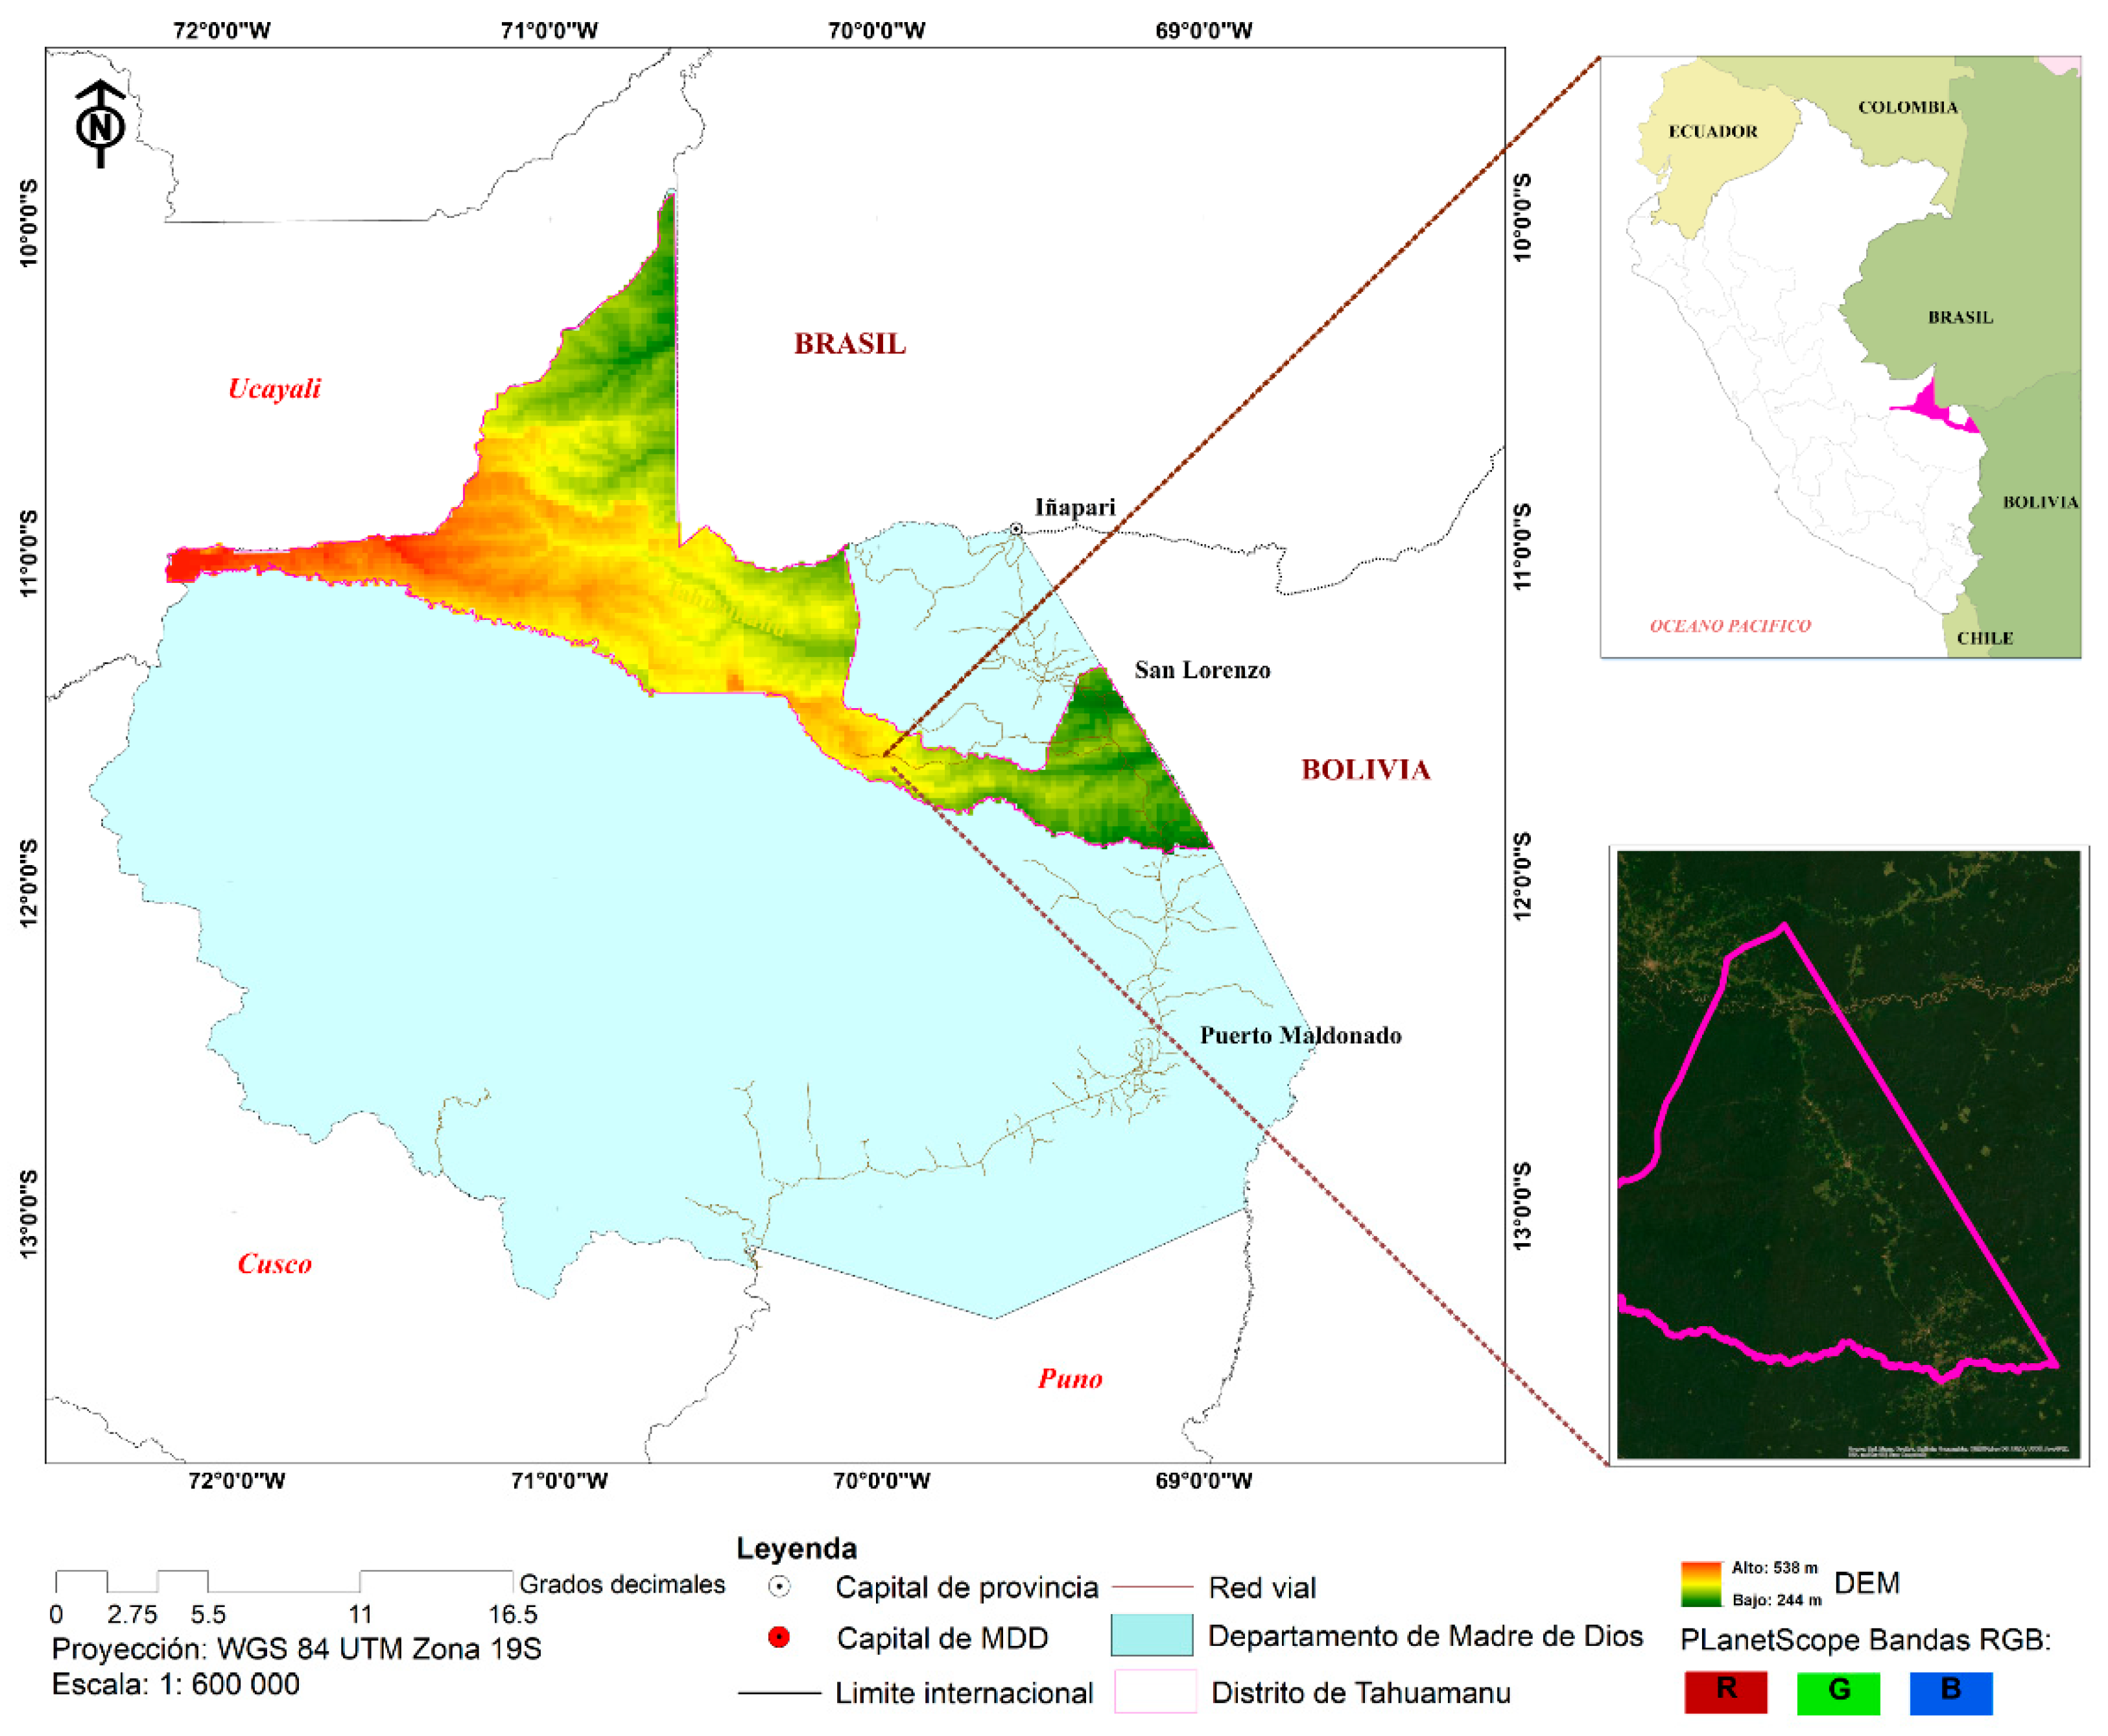
2.1. Study Area

The study area comprises the district of Tahuamanu in the department of Madre de Dios, in the southeastern Peruvian Amazon. The district of Tahuamanu encompasses a total area of 15,079 km2 (Figure 1) and includes agricultural areas, timber, and non-timber forest concessions, as well as indigenous lands [26]. It is located between parallels 9°51′12″ and 11°55′56″ south latitude and meridians 68°59′18″ and 72° 14′39″ west longitude, with an altitude between 200 m and 550 m above sea level [27,28,29,30,31].
The study area is in the tropical rainforest. The average annual temperature is 25 °C, with maximum temperatures reaching 38 °C, and minimum temperatures dropping to 8 °C. The coldest months are December, January, and February, while the warmest months are June, July, and August [32,33]. A climatic phenomenon characterized by low temperatures, due to cold air masses arriving from the American Southeast, is known locally as “friaje” or “surazo” [34,35,36]. The average annual relative humidity varies from 70% to 85% [35,36].

2.2. Description and Data Processing

2.2.1. SAR Sentinel-1 (S1)

The European Space Agency (ESA), through the Sentinel-1 mission, provides worldwide coverage of freely available dual or cross-polarized C-band SAR images (with Ground Range Detected scenes) at a time interval of 6 days and from 1 to 3 days revisit rate, depending on the orbits (ascending and descending) of the satellites (1A and 1B) and the overlap (Table S2). All SAR images used in this study were acquired in Interferometric Wide (IW) mode, VV polarization (Figure S2), VH (Figure S3), and descending orbit (Tables S1 and S2).
The type of study applied was correlational and predictive, with a transactional (cross-sectional) design [37]. Sentinel-1 data were accessed through the Google Earth Engine (GEE) portal. Using the GEE processing engine, the complex data were converted into radiometric and geo-coded terrain data, obtaining the co-registration of the scenes and sensor track. Representative pixel corrections were performed, and speckle noise was reduced. For this, spatial temporal weighting was performed, and speckle reduction filters were applied to the detected image, while the multi-look reduced speckle at the cost of resolution [3,38]. Geometric correction (geocoding) was performed to correct for the satellite sensor’s topographical variations and tilt. The available algorithm, Range Doppler Terrain Correction Operator, uses the digital elevation model (DEM) of the Shuttle Radar Topography Mission (SRTM) for each pre-and post-scenario [3,38].
The mean backscatter values were initially evaluated before being spatially located in the study area (before and after the fire) [3]. The analysis applied absolute, relative, and RBR predictor equations by RDFI (Equations (1)–(9)) from the VV and VH backscatter data [3,18,39] to quantify the area and severity of burnings:
A b s _ V V = V V p r e V V p o s t
A b s _ V H = V H p r e V H p o s t
Re l _ V V _ 1 = V V p r e V V p o s t V V p r e
Re l _ V H _ 1 = V H p r e V H p o s t V H p r e
Re l _ V V _ 2 = V V p r e V V p o s t V V p r e
Re l _ V H _ 2 = V H p r e V H p o s t V H p r e
σ 0 , d B = 10 × log 10 × σ 0
where VV and VH represent the backscatter coefficients in unit σ0 (Sigma0) to be expressed in decibels (dB).
The RBR involved the calculation of the post-fire ratio of backscatter coefficients in units of power (Equation (8)):
RBR xy = Post fire average backscatter xy Pre fire average backscatter xy
where xy is an individual polarization or radar index.
RBR was developed for each polarization (VV and VH) and for RFDI (Equation (9)), which shows the strength of the double bounce and backscatter of the soil directly.
RDFI = VV VH VV + VH
where VV and VH represent the backscatter coefficient in power units.
Equations (1) and (2) measure the absolute changes in the landscape after the fires, while Equations (3)–(6) show the relative changes with respect to the initial condition of the soil before the fire [3,18,39].
The absolute and relative parameters for measuring the severity level of burns (Abs_VV, Abs_VH, Rel_VV1, Rel_VV_2, Rel_VH_1, and Rel_VH_2) used the criteria shown in Table 1 [3,18,39].
On the other hand, to measure RBR by means of the RDFI from the backscatter data VV and VH [3,18,39], the criteria shown in Table 2 were used.
The final results were applied to post-classification by the majority/minority analysis method with a kernel size of 3 × 3 to rectify and reclassify each image pixel by pixel [29,40,41]. The processing used SNAP ESA, GEE, ArcGis Pro 2.1®, and ArcGis 10.5® provided by the Centro de Teledetección para el Estudio y Gestión de los Recursos Naturales (CETEGERN) of the Universidad Nacional Amazónica de Madre de Dios [29] and the Center for Amazonian Scientific Innovation (CINCIA).

2.2.2. Accuracy Assessment and Field Data

A surface area of 15,079 km2 was established for the field data collection, in 384 field samples, selected using a stratified random sampling method and inclusion and exclusion techniques (Figure S1) [42,43,44]. The sampled plots in the field had a minimum size of 30 m × 30 m and were distributed in a representative manner [44] among burn severity categories: low (n = 128), moderate (n = 128), and high (n = 128) (Figure 2 and Figure S1).
Data were analyzed using statistical procedures. We applied tests for the evaluation of the predictive power of the absolute, relative, and index values with the actual field information (CBI) and employed the confusion matrix and the kappa coefficient (κ) [3,29,43,45,46,47,48].
The continuous in-class CBI proposed by Key and Benson [49], adapted and modified for the study, was used in the field to measure fire severity among the following categories: no change (CBI = 0), low severity (0 < CBI ≤ 1), medium severity (1 < CBI ≤ 2), and high severity (CBI > 2) (Table 3).
From the results of the statistical analysis, we determined the overall accuracy and Cohen’s Kappa Index (Equations (10) and (11)), which measures the overall performance of the model [48] and inter-observer concordance [29,50,51] in the correct identification of the three burn severity classes.
O v e r a l l a c c u r a c y = T P + T N T P + F P + T N + F N
where TP is true positive, TN is true negative, FP is false positive, and FN is false negative.
K a p p a k = 0 c N c
where ƒ0 is the proportion of matching units, and ƒc is the proportion of units expected to match at random.

3. Results

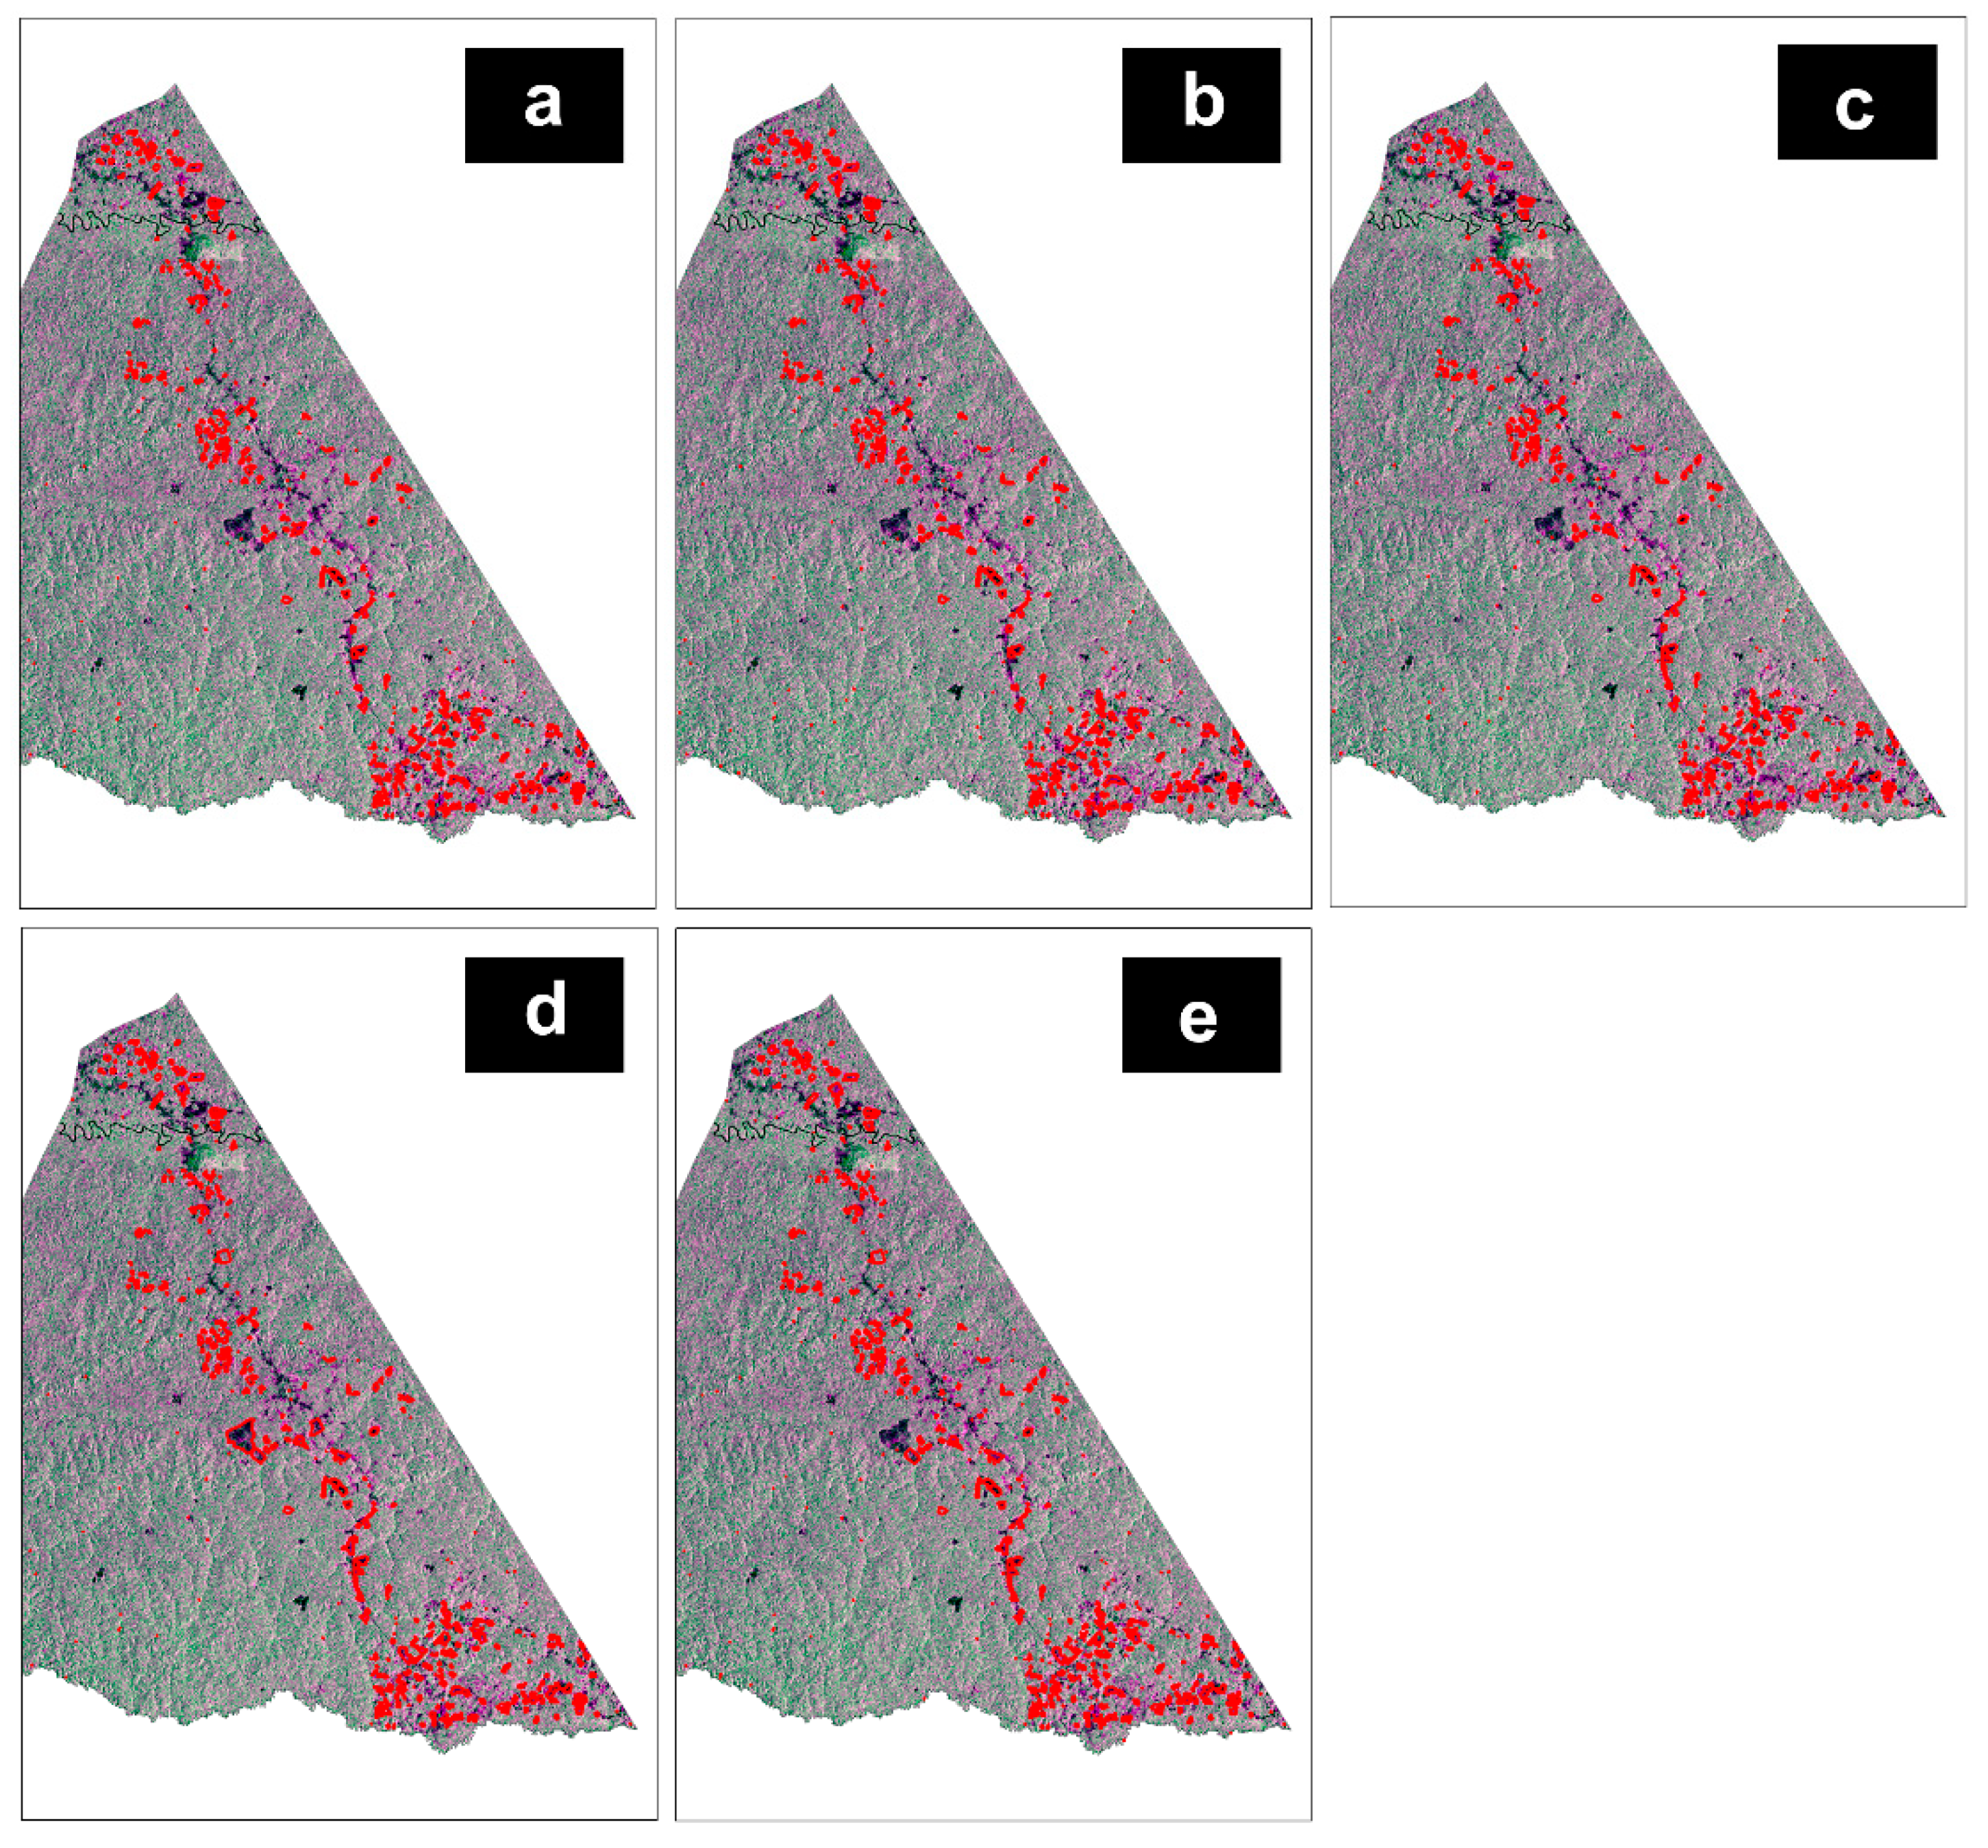
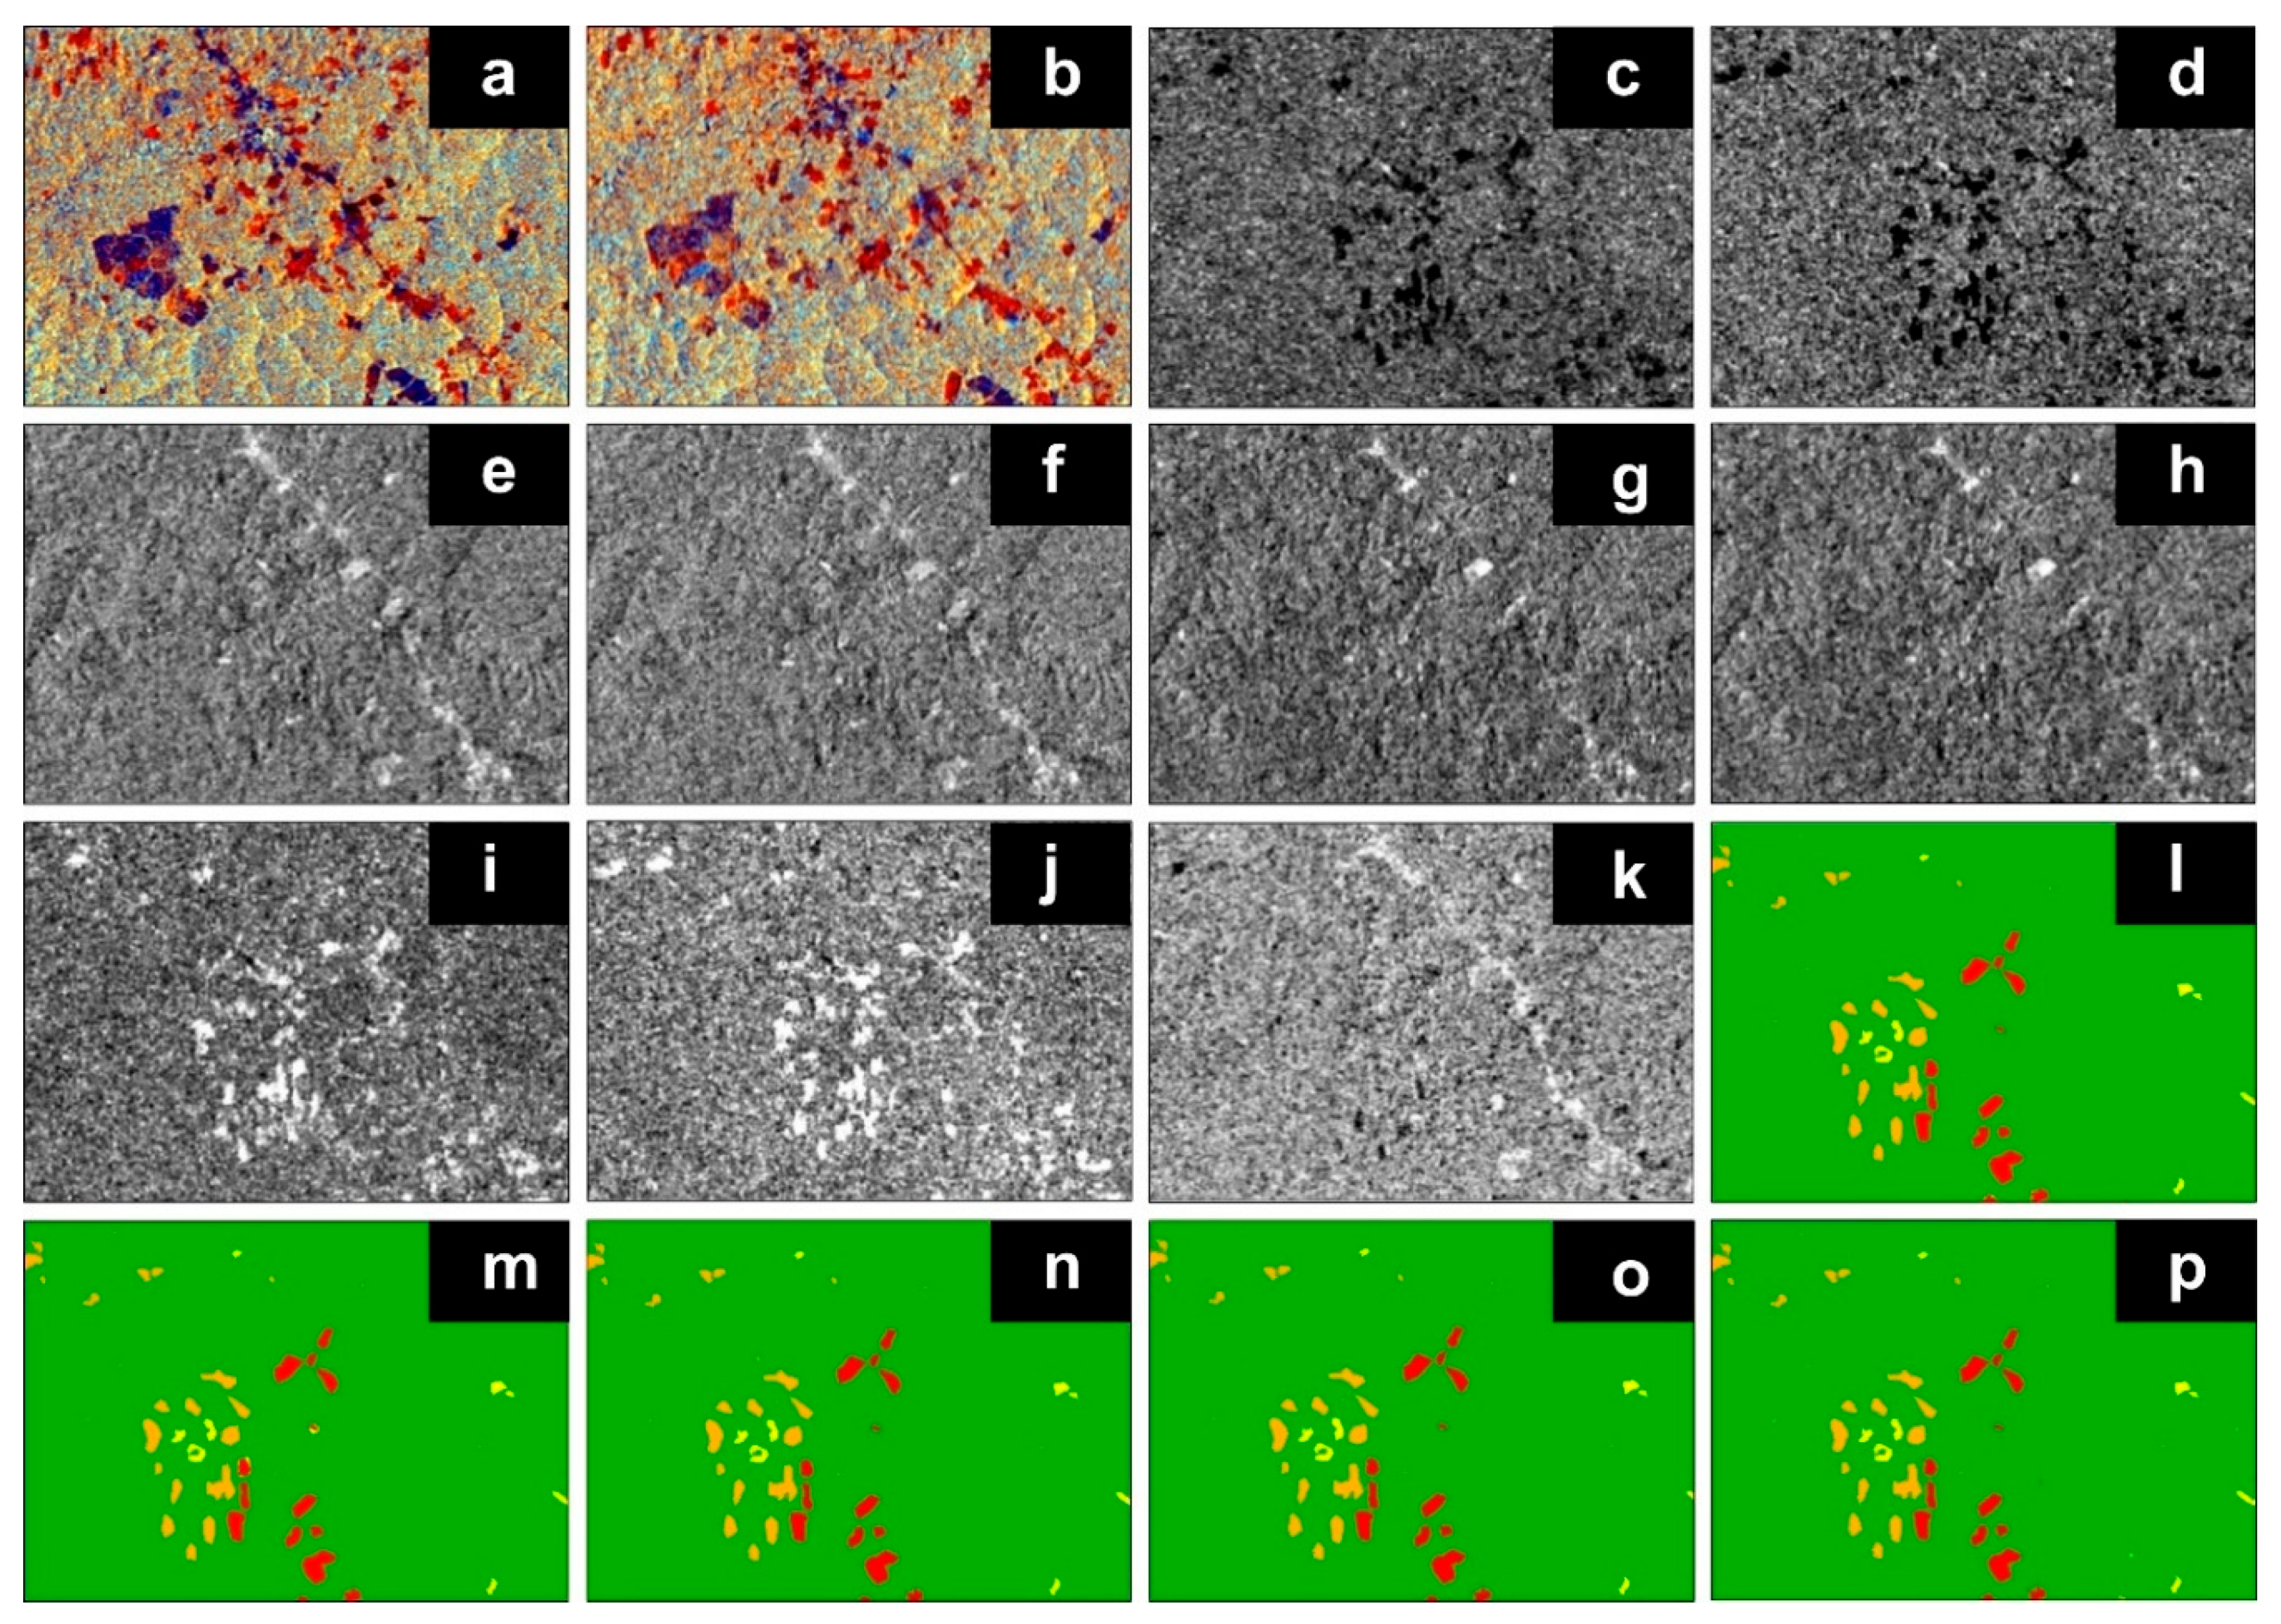
3.1. Estimation of Burned Areas Using the Sentinel-1 (S1) Sensor

To evaluate SAR burn severity according to local topography, the Composite Burn Index (CBI) was used as a function of sensor type and orbit direction (S1A downward) (Table S1 and Figure 3 and Figure 4). The reduction of weather effects was achieved through the acquisition of SAR images with VV and VH polarization in environmental conditions of minimum humidity pre- (16 and 21 May 2020) and post-fire (1 and 6 October 2020) (Table S2). For the Tahuamanu district, Abs_VVV, Abs_VH, Rel_VV_1, Rel_VH_1, Rel_VV_2, Rel_VH_2, RBRxy, and RDFI (Equations (1)–(10)) were posed as quotients. The C-band backscatter data from the Sentinel-1 sensor with a center frequency of 5.405 GHz and a length of 5 cm over a 250 km swath and a high geometric resolution of 5 m by 20 m are useful for mapping burn severity [3,17,18].
C-band co-polarization (VV) and cross-polarization (VH) coherence were used to measure the sensitivity of volume changes and the combustion of biomass (leaves and branches) and consequently the damaged, thin, and dry vegetation resulting from the burn generating less backscatter (Figure 3 and Figure 4) [3]. Figure 3 and Figure 4 show the spatial patterns in decibels (dB) and indices of the vegetation and burned areas, such as the severity of the burn (CBI), where the dark areas show the differential increase in polarization and the greater influence of the surface properties of the burned area.

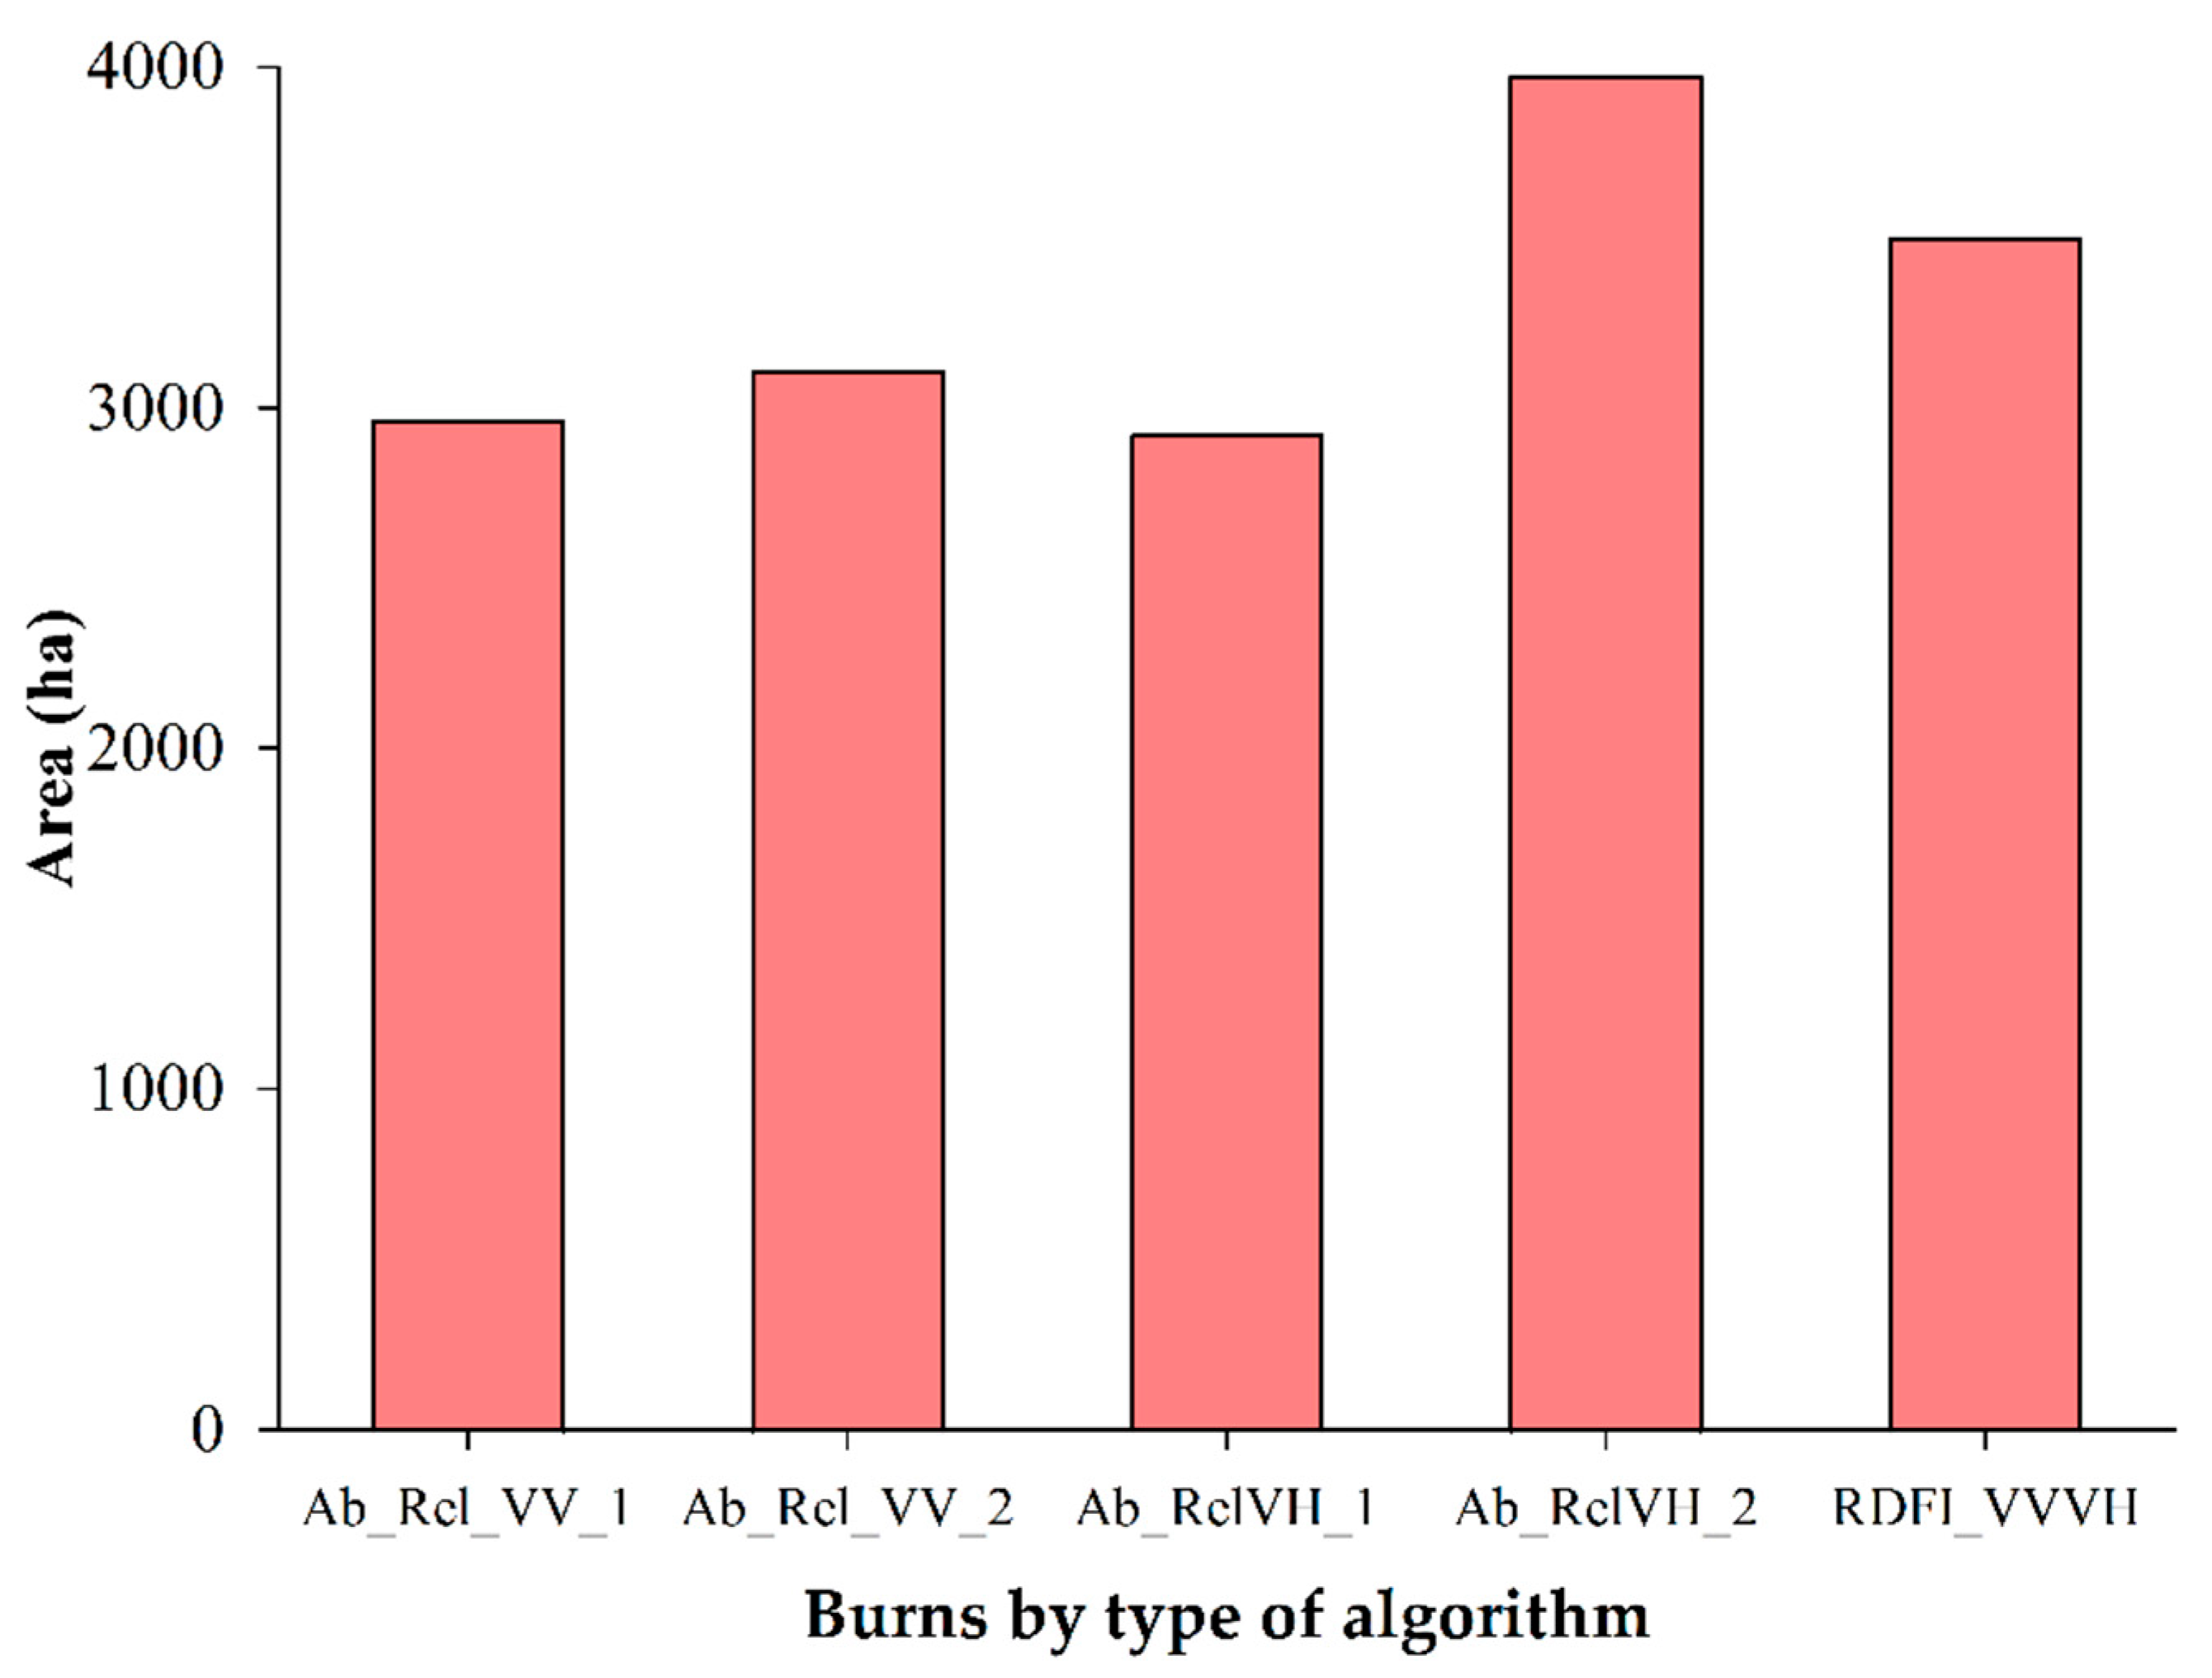
3.1.1. Burn Quantification

The data shown in Figure 5 were characterized by the greatest difference in backscatter between burned and unburned vegetation. The SAR Sentinel-1 VV and VH polarization images were acquired under two climatic conditions: (1) late rainy season, and (2) high temperature (Table S1). The co-polarized backscatter coefficient VV increased minimally with burn severity with respect to the C-band VH polarization (Figure 3). This minimal variation of the backscattering of the burned areas of VV over VH could be explained with the decrease of the canopy and consequently the exposure of residual vegetation and soil [17,18,39,52]. In that sense, the most intense and darkest zones (black and purple) show the differential increase in polarization and the greatest influence of the surface properties of the burned area (Figure 4 and Figure 5).
The burns of the mapped vegetation in the forests of the district of Tahuamanu with SAR Sentinel-1 images used absolute, relative, and RBR predictors by means of RDFI quantified areas of 2963 ha (Ab_Rel_VV_1), 3108 ha (Ab_Rel_VV_2), 2920 ha (Ab_Rel_VH_1), 3972 ha (Ab_Rel_VH_2), and 3496 ha (RDFI_VVVH), respectively (Figure 6 and Figures S4–S8). These results showed differences in the spatial distribution and surface area of burned areas, ranging from 1052 ha between the minimum (Ab_Rel_VH_1) and maximum (Ab_Rel_VH_2).

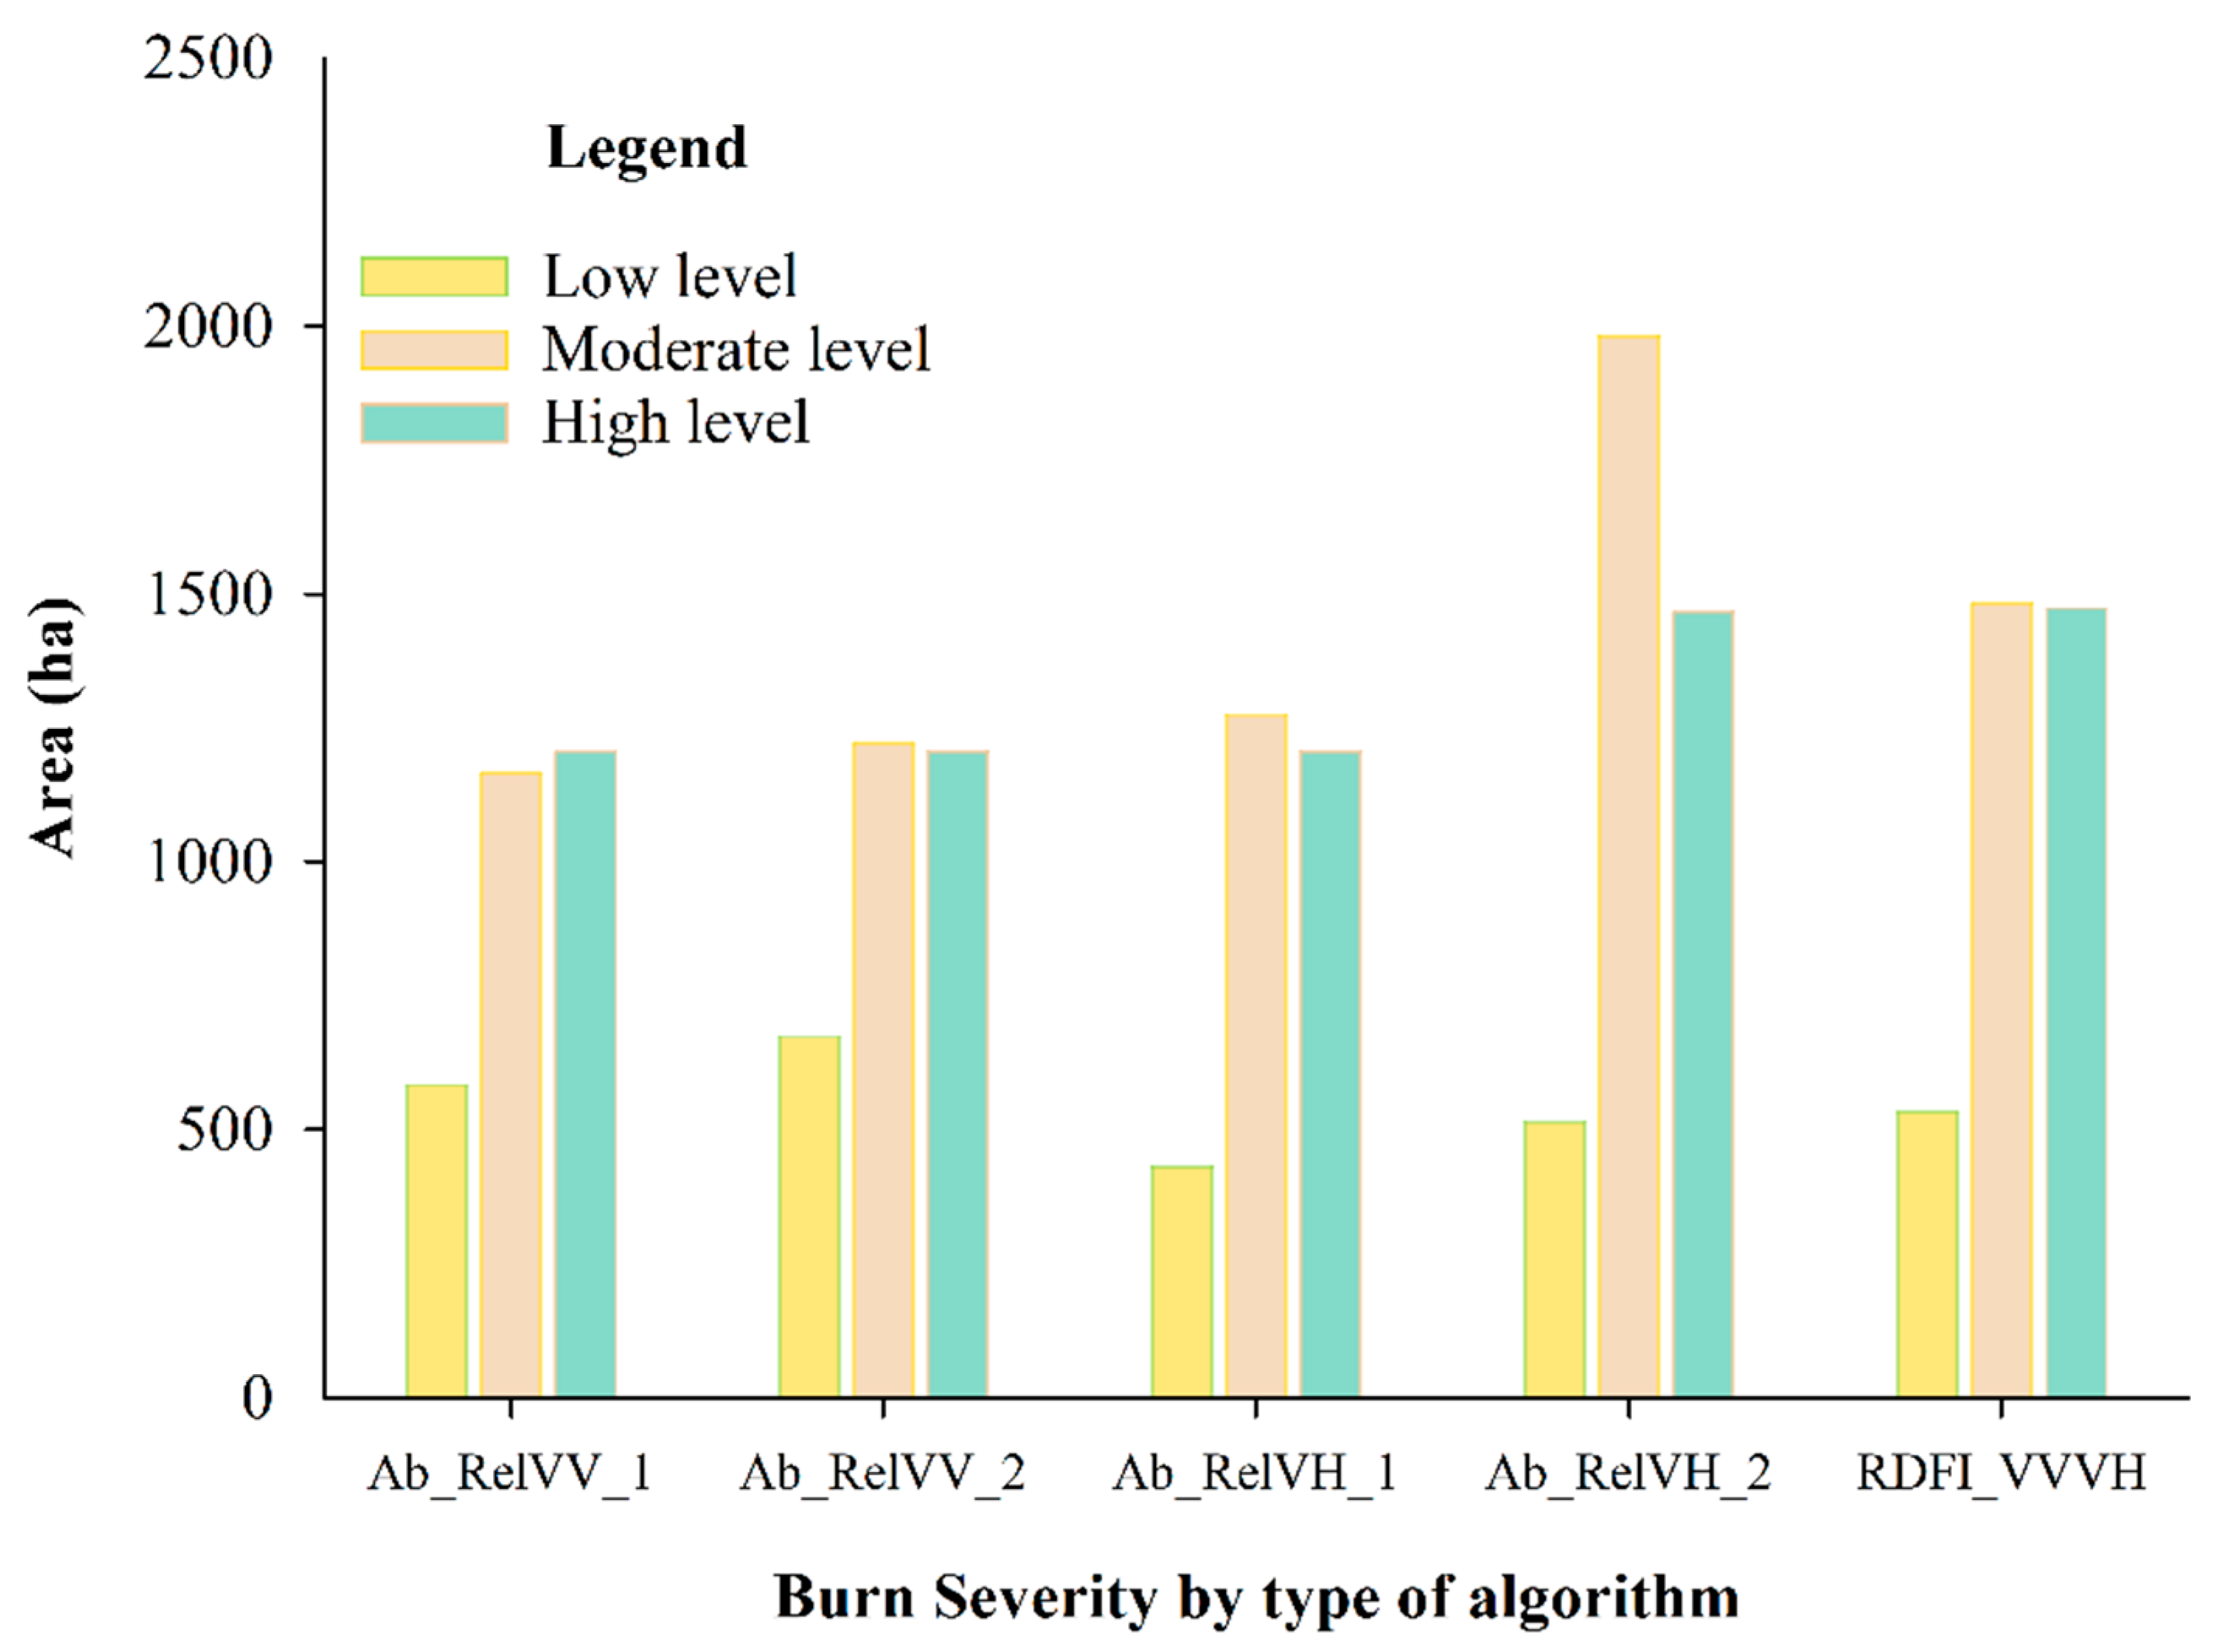
3.1.2. Burn Severity

To determine burn severity, Sentinel-1 SAR backscatter was used by means of absolute and relative predictors and RBR by means of RDFI according to the parameters proposed in Table 1, Table 2 and Table 3. The results showed a strong association between backscatter and burn severity with co-polarization (VV) and cross-polarization (VH). Absolute/relative coefficient crossover and RDFI were used to determine and discriminate the relative strength of polarization and burn severity. The simultaneous use of co-polarized channels and cross-polarization allowed for the determination of the highest coefficients and the lowest errors for the C-band. The highest records in the C-band in units of decibels (dB) were related to the level of vegetation burn severity.
Absolute and relative values of co-polarization and cross-polarization indices showed Abs_VV values from −18.71 to −0.03 (moderate/low), 0.03 to 0.19 (high), and >0.19 (moderate); Abs_VH values <0.05 (moderate/low), from 0.05 to 0.09 (high/moderate), and from 0.09 to 0.16 (high); Rel_VV_1 values from −18.3 to 0.57 (moderate/high) and >0.57 (high); Rel_VH1 with values from 0.76 to 2.92 (high); Rel_VH_2 from 0.41 to 0.57 (moderate) and from 0.57 to 1.52 (high); and Rel_VH_2 from −18.37 to 0.57 (high/moderate/low), and >0.57 (high) (Figure 7).
In the case of burned areas based on RBR with RDFI, the severity of burns was quantified with values of indices from −0.6 to −0.47 at the low level, from −0.47 to 0.04 at the moderate level, and from 0.04 to0.16 at the high level (Figure 8).
From the data, it was possible to detect and quantify the severity of the burns in the images: (1) Ab_Rel_VV_1 with 586 ha (low), 1167 ha (moderate), and 1209 ha (high); (2) Ab_Rel_VV_2 with 676 ha (low), 1223 ha (moderate), and 1208 ha (high); (3) Ab_Rel_VH_1 with 435 ha (low), 1277 ha (moderate), and 1208 ha (high); (4) Ab_Rel_VH_2 with 519 ha (low), 1983 ha (moderate), and 1470 ha (high), and; (5) RDFI_VVVH with 536 ha (low), 1484 ha (moderate), and 1475 ha (high) (Figure 8 and Figures S9–S13).

3.2. Accuracy Assessment

To measure the accuracy of burn severity at different co-polarization and cross-polarization ratios, a coefficient of agreement analysis was carried out for nominal scales (kappa), and a global accuracy matrix using field data on plot burn severity (CBI) [1,5,12,44,51,53]. The proportion of plots (n = 384) with CBI values (Table 4) was relatively significant. However, more detailed measurements of vegetation structure parameters are needed to increase the significance of the statistical analysis [17,18,39,51,54,55,56].
The SAR Sentinel-1 backscatter data detected k = 0.523 for VV_1, k = 0.516 for VV_2, k = 0.477 for VH_1, k = 0.672 for VH_2, and k = 0.742 for VVVH, where more than half of the joint judgments were in agreement (excluding chance). The marginals were such that kM was 1.004 (VV_1), kM was 1.016 (VV_2), kM was 1.012 (VH_1), kM was 1.043 (VH_2), and kM was 1.051 (VVVH), so a substantial part of the disagreement was a consequence of marginal discrepancies (where kM is the maximun value of k). The probable population value (at 95%)of x for VV_1 was estimated to be between 0.454 and 0.593, for VV_2 between 0.445 and 0.586, for VH_1 between 0.405 and 0.548, for VH_2 between 0.610 and 0. 734, and of VVVH between 0.686 and 0.799, with moderate concordance strengths (0.41–0.60) for VV_1, VV_2, and VH_1, while for VH_2 and VVVH there was a considerable concordance strength (0.61–0.80) [51]. At the overall precision level, they reported values of 0.682, 0.677, 0.651, 0.781, and 0.828, respectively. The z-values for VV_1 (14.506), VV_2 (14.289), VH_1 (13.207), VH_2 (18.602), and VVVH (20.568) measured the difference between an observed statistic and its hypothetical population parameter in standard deviation units, being significant at a probability of (p < 0.001) (Table 4).
The reliability results determined the cross ratios of absolute and relative cross-polarization values VH_2 (k = 0.734) and the RBR by RDFI (k = 0.799) to be the most concordant to determine the severity of burns, showing considerable concordance strength with respect to the moderate strength of the other ratios [1,5,12,44,51,53].

4. Discussion

Historically, burn-related forest disturbances in the Amazon have been associated primarily with the conversion of natural forests to agricultural uses [28,30,57,58]. Various attempts to establish policies and management instruments have existed to regulate burning, but they have not worked due to the weak presence of the government in rural areas [31,59].
An advantage, but not a determining factor, is the occupation of areas with forest titles, titled agricultural lands, or indigenous communities, which guarantee some security and protection against encroachment but are not free from burning. Despite all this, there is evidence of invasions for agricultural purposes, where slash-and-burn activities are carried out. In most cases, uncontrolled burning extends to agricultural fields, pastures, pastureland, grasslands, secondary forests, and primary forests [22,60,61,62,63].
Another common situation in the study area is patch and edge burning. Most burns are provoked by small and medium farmers by (1) slash and burn forestry, and (2) uncontrolled logging, in which trees are affected by fire and then they are logged, even though these forests are able to recover after forest fires [20,22,64,65].
Many studies show the potential of using radar and combined radar and optical sensors to detect vegetation disturbance from burning [17,18,22,52,60,66,67]. We used Sentinel-1 SAR with VV and VH polarizations to achieve a higher observation density and to overcome the influence of environmental factors on the optical time series. The results show that the vertical and horizontal sensitivities of SAR to changes in photosynthetic and non-photosynthetic vegetation cover go beyond a binary detection (forest and burns); therefore, its use can be very broad [3,22,39,52,55]. In this context, studies of burn patterns identified in Amazonian regions such as Pando (Bolivia) and Acre (Brazil) are similar to those in the Madre de Dios region [21,27,68].
The Sentinel-1 C-band SAR data with VV and VH backscatter were acquired under two climatic conditions: (1) end of the rainy season, and (2) high temperature (Table S1). The backscattering coefficient VV increased minimally with burn severity with respect to VH polarization. This increase in the backscattering of burned areas is supported by the reduced presence of canopy and exposure of residual vegetation and soil. Consequently, the penetration of vertical waves generates a lower response. However, the dispersion and spatial quantification of burn severity may vary in their behavior and present a better level of detection with vertical and horizontal backscattering [17,18,19,39,52,54,55,67].
Areas not affected by burns showed 0 dB of change, with values around 1. Crossing absolute and relative values of the cross-polarization VH, the coefficient Ab_Rel_VH_1 detected a slight underestimation in the quantification of burn severity relative to the other ratios, as opposed to the predictor Ab_Rel_VH_2, where it exhibited a slight overestimation with respect to the others. While the RDFI_VVVH showed much more consistent results, this could be due to the dispersion of the use of co-polarization (VV) and cross-polarization (VH) in the same quotient (Figure 7, Figures S8 and S13) [17,18,25,60,69], as well as the wide opening of the vertical and horizontal waves in the detection of burns due to the reduction of the canopy and, as a consequence, the exposure of residual vegetation and soil [17,18,19,39,52,54,55,67].
The proportion of burn severity in the ratios used showed average ranges from 38% to 42% at the high level, from 39% to 50% at the moderate level, and from 13% to 22% at the low level. On the other hand, the increase in fire severity in Ab_Rel_VV_1, Ab_Rel_VV_2, Ab_Rel_VH_1, Ab_Rel_VH_1, and RDFI_VVVH corresponds to the increase in post-burn values. The highest values are due to a differentiated effect of the severity of the burns and are recorded in the VV and VH polarizations, with VV backscattering showing a decrease due to the effect of the elimination of scattering elements, compensated by an increase in surface scattering [3,63,69,70]. The burn ratios varied from unburned to high severity levels, and the findings resemble those reported by other researchers, in which the values were elevated by the presence of dispersant elements in Amazonian forests [3,5,21,22,61,62,63,66,69,70,71]. However, the behavior is the opposite in coniferous, temperate, or boreal forests [17,18,19,24,72,73].
Regarding the accuracy of burn severity at different co-polarization and cross-polarization ratios, a coefficient of agreement analysis was carried out for nominal scales (kappa), and a global accuracy matrix using field data on plot burn severity (CBI) [1,5,12,44,51,53]. Cross-ratios of absolute and relative cross-polarization values VH_2 (k = 0.734) and the RBR by RDFI (k = 0.799) were shown to be the most reliable for determining burn severity, showing consistent overall accuracy and considerable strength of agreement [1,5,12,44,51,53]. The behavior of the CBI in the field proposed by Key and Benson [49], adapted and modified for this study, was significant (Table 4), and adequate responses to VV and VH polarizations were obtained (Figure 2, Figure 3 and Figure 4). We obtained a significant response to the VV and VH polarization (Figure 2, Figure 3 and Figure 4) because the CBI field protocol takes into account the sensor orientation (downward), improving the canopy and understory attenuation layer consumption and the indirect estimates due to the effect of soil exposure, and generating a high relative measurement in the detection of burn severity by the sensor (Figure 2, Figure 3 and Figure 4) [17,18,19,39,52,54,55,67].
Our results show a scientific basis for the use of active imagery such as C-band SAR Sentinel-1 in the detection and quantification of burn severity in the Peruvian Amazon. The results give VH cross-polarization using absolute/relative ratio and RDFI as the best predictors. Future research should focus on further validating the behavior of burn severity in different forest types in the Amazon region and generating monitoring methods on a large scale. Likewise, the fusion of global optical images such as Sentinel-2 and Landsat with SAR images should be studied to evaluate detection and accuracy versus independent analysis of optical or SAR images.

5. Conclusions

The research provides knowledge about the use of 2020 Sentinel-1 C-band SAR imagery in the estimation of burn severity in the southeastern Peruvian Amazon. We applied absolute, relative, and Burn Ratio (RBR) predictors by means of the Radar Forest Degradation Index (RDFI) and verified the accuracy with field data on plot fire severity (CBI).
The use of simple cross-polarization (VH) determined the absolute/relative predictor (1. Ab_Rel_VH_2 = 3972 ha) and RDFI (2. VVVH = 3496 ha) with the best dispersion responses, with accuracies of a kappa index (k) of 0.734 (1) and 0. 799 (2). The highest occurrences and incidences were recorded at the moderate (43%) and high (40%) levels.
According to our analysis, the behavior of the co-polarization (VV) and cross-polarization (VH) of the C-band SAR Sentinel-1 varied according to the terrain physiography and vegetation physiognomy. The backscattering of VH allowed for better detection at surface and depth, while the co-polarization (VV) was more affected by scattering processes and demonstrated a strong relationship of burning severity in a stable and dry environment that matched the burning seasonality in the Amazon. On the other hand, the limitations of using co-polarization backscattering and cross-polarization were minimized by the application of RDFI, which uses VV and VH polarizations pre- and post-burning. In our case, the results were as expected according to the theoretical basis of radar image backscattering. However, we suggest further analysis for other reductions.

Supplementary Materials

The following supporting information can be downloaded at: https://www.mdpi.com/article/10.3390/fire5040094/s1, Figure S1: Distribution of samples to validate the severity of burns in the district of Tahuamanu, southeastern Peruvian Amazon; Figure S2: Sentinel-1 C-band SAR images with VV polarization pre- and post-fire 2020; Figure S3: Sentinel-1 C-band SAR images with VH polarization pre- and post-fire 2020; Figure S4: Determination of burned areas using absolute and relative values of pre- and post-fire 2020 VV_1 backscatter data; Equations (1) and (3); Figure S5: Determination of burned areas using absolute and relative values of pre- and post-fire 2020 VV_2 backscatter data; Equations (1) and (5); Figure S6: Determination of burned areas using absolute and relative values of pre- and post-fire 2020 VH_1 backscatter data; Equations (2) and (4); Figure S7: Determination of burned areas using absolute and relative values of pre- and post-fire 2020 VH_2 backscatter data; Equations (2) and (6); Figure S8: Determination of burned areas through Burn Ratio (RBR) by Radar Forest Degradation Index (RDFI) from pre- and post-fire 2020 VV and VH backscatter data; Equations (8) and (9); Figure S9: Burn severity using absolute, relative values from VV_1 pre- and post-fire 2020 backscatter data; Equations (1) and (3); Figure S10: Burn severity using absolute, relative values from VV_2 pre- and post-fire 2020 backscatter data; Equations (1) and (5); Figure S11: Burn severity using absolute, relative values from VH_1 pre- and post-fire 2020 backscatter data; Equations (2) and (4); Figure S12: Burn severity using absolute, relative values from VH_2 pre- and post-fire 2020 backscatter data; Equations (2) and (6); Figure S13: Burn severity using Radar Burn Ratio (RBR) and Radar Forest Degradation Index (RDFI) of pre- and post-fire 2020 VV and VH backscatter data; Equations (7)–(9); Table S1: Sentinel-1 image acquisition information; Table S2: Sentinel-1 satellite image characteristics.

Author Contributions

Conceptualization, G.A.-A. and R.F.M.F.; methodology, G.A.-A. and R.F.M.F.; software, R.F.M.F., G.A.-A., R.C.-R., D.R.E. and J.G.-Q.; validation, R.F.M.F., G.A.-A. and J.G.-Q.; formal analysis, R.F.M.F., G.A.-A., D.R.E. and J.G.-Q.; research, R.F.M.F., G.A.-A., D.R.E. and J.G.-Q.; data curation, R.F.M.F. and G.A.-A.; writing—original draft, R.F.M.F.; writing—revising and editing, G.A.-A., L.R.-A., J.G.-Q. and D.R.E.; visualization, G.A.-A., L.R.-A. and J.G.-Q.; project administration, G.A.-A.; fund raising, G.A.-A. All authors have read and agreed to the published version of the manuscript.

Funding

This research received no external funding.

Data Availability Statement

Not applicable.

Conflicts of Interest

The authors declare no conflict of interest.

References

  1. Cannon, S.H.; Gartner, J.E.; Rupert, M.G.; Michael, J.A.; Rea, A.H.; Parrett, C. Predicting the probability and volume of postwildfire debris flows in the intermountain western United States. Bulletin 2010, 122, 127–144. [Google Scholar] [CrossRef]
  2. Cannon, S.H.; DeGraff, J. The increasing wildfire and post-fire debris-flow threat in western USA, and implications for consequences of climate change. In Landslides–Disaster Risk Reduction; Springer: Berlin/Heidelberg, Germany, 2009; pp. 177–190. [Google Scholar] [CrossRef]
  3. Addison, P.; Oommen, T. Utilizing satellite radar remote sensing for burn severity estimation. Int. J. Appl. Earth Obs. Geoinf. 2018, 73, 292–299. [Google Scholar] [CrossRef]
  4. Kern, A.N.; Addison, P.; Oommen, T.; Salazar, S.E.; Coffman, R.A. Machine learning based predictive modeling of debris flow probability following wildfire in the intermountain Western United States. Math. Geosci. 2017, 49, 717–735. [Google Scholar] [CrossRef]
  5. Parks, S.A.; Dillon, G.K.; Miller, C. A new metric for quantifying burn severity: The relativized burn ratio. Remote Sens. 2014, 6, 1827–1844. [Google Scholar] [CrossRef] [Green Version]
  6. Brown, A.R.; Petropoulos, G.P.; Ferentinos, K.P. Appraisal of the Sentinel-1 & 2 use in a large-scale wildfire assessment: A case study from Portugal’s fires of 2017. Appl. Geogr. 2018, 100, 78–89. [Google Scholar] [CrossRef]
  7. Colson, D.; Petropoulos, G.P.; Ferentinos, K.P. Exploring the Potential of Sentinels-1 & 2 of the Copernicus Mission in Support of Rapid and Cost-effective Wildfire Assessment. Int. J. Appl. Earth Obs. Geoinf. 2018, 73, 262–276. [Google Scholar] [CrossRef]
  8. Belenguer-Plomer, M.A.; Tanase, M.A.; Chuvieco, E.; Bovolo, F. CNN-based burned area mapping using radar and optical data. Remote Sens. Environ. 2021, 260, 112468. [Google Scholar] [CrossRef]
  9. Stroppiana, D.; Azar, R.; Calò, F.; Pepe, A.; Imperatore, P.; Boschetti, M.; Silva, J.; Brivio, P.A.; Lanari, R. Integration of optical and SAR data for burned area mapping in Mediterranean Regions. Remote Sens. 2015, 7, 1320–1345. [Google Scholar] [CrossRef] [Green Version]
  10. Allison, R.S.; Johnston, J.M.; Craig, G.; Jennings, S. Airborne optical and thermal remote sensing for wildfire detection and monitoring. Sensors 2016, 16, 1310. [Google Scholar] [CrossRef] [Green Version]
  11. Meng, R.; Wu, J.; Zhao, F.; Cook, B.D.; Hanavan, R.P.; Serbin, S.P. Measuring short-term post-fire forest recovery across a burn severity gradient in a mixed pine-oak forest using multi-sensor remote sensing techniques. Remote Sens. Environ. 2018, 210, 282–296. [Google Scholar] [CrossRef]
  12. Murphy, K.A.; Reynolds, J.H.; Koltun, J.M. Evaluating the ability of the differenced Normalized Burn Ratio (dNBR) to predict ecologically significant burn severity in Alaskan boreal forests. Int. J. Wildland Fire 2008, 17, 490–499. [Google Scholar] [CrossRef]
  13. Lertsakdadet, B.S.; Kennedy, G.T.; Stone, R.; Kowalczewski, C.; Kowalczewski, A.C.; Natesan, S.; Christy, R.J.; Durkin, A.J.; Choi, B. Assessing multimodal optical imaging of perfusion in burn wounds. Burns 2021, 48, 799–807. [Google Scholar] [CrossRef]
  14. Gibson, L.; Engelbrecht, J.; Rush, D. Detecting historic informal settlement fires with Sentinel 1 and 2 satellite data—Two case studies in Cape Town. Fire Saf. J. 2019, 108, 102828. [Google Scholar] [CrossRef]
  15. Zhang, Q.; Ge, L.; Zhang, R.; Metternicht, G.I.; Du, Z.; Kuang, J.; Xu, M. Deep-learning-based burned area mapping using the synergy of Sentinel-1 & 2 data. Remote Sens. Environ. 2021, 264, 112575. [Google Scholar] [CrossRef]
  16. Chuvieco, E.; Mouillot, F.; van der Werf, G.R.; San Miguel, J.; Tanase, M.; Koutsias, N.; García, M.; Yebra, M.; Padilla, M.; Gitas, I.; et al. Historical background and current developments for mapping burned area from satellite Earth observation. Remote Sens. Environ. 2019, 225, 45–64. [Google Scholar] [CrossRef]
  17. Tanase, M.A.; Kennedy, R.; Aponte, C. Fire severity estimation from space: A comparison of active and passive sensors and their synergy for different forest types. Int. J. Wildland Fire 2015, 24, 1062–1075. [Google Scholar] [CrossRef]
  18. Tanase, M.A.; Kennedy, R.; Aponte, C. Radar Burn Ratio for fire severity estimation at canopy level: An example for temperate forests. Remote Sens. Environ. 2015, 170, 14–31. [Google Scholar] [CrossRef]
  19. Viedma, O.; Chico, F.; Fernández, J.J.; Madrigal, C.; Safford, H.D.; Moreno, J.M. Disentangling the role of prefire vegetation vs. burning conditions on fire severity in a large forest fire in SE Spain. Remote Sens. Environ. 2020, 247, 111891. [Google Scholar] [CrossRef]
  20. Dos Reis, M.; Graça, P.M.L.d.A.; Yanai, A.M.; Ramos, C.J.P.; Fearnside, P.M. Forest fires and deforestation in the central Amazon: Effects of landscape and climate on spatial and temporal dynamics. J. Environ. Manag. 2021, 288, 112310. [Google Scholar] [CrossRef]
  21. Melo, V.F.; Barros, L.S.; Silva, M.C.S.; Veloso, T.G.R.; Senwo, Z.N.; Matos, K.S.; Nunes, T.K.O. Soil bacterial diversities and response to deforestation, land use and burning in North Amazon, Brazil. Appl. Soil Ecol. 2021, 158, 103775. [Google Scholar] [CrossRef]
  22. Santos, A.M.d.; Silva, C.F.A.d.; Rudke, A.P.; Oliveira Soares, D.d. Dynamics of active fire data and their relationship with fires in the areas of regularized indigenous lands in the Southern Amazon. Remote Sens. Appl. Soc. Environ. 2021, 23, 100570. [Google Scholar] [CrossRef]
  23. Kasischke, E.S.; Melack, J.M.; Dobson, M.C. The use of imaging radars for ecological applications—A review. Remote Sens. Environ. 1997, 59, 141–156. [Google Scholar] [CrossRef]
  24. Collins, L.; Bennett, A.F.; Leonard, S.W.J.; Penman, T.D. Wildfire refugia in forests: Severe fire weather and drought mute the influence of topography and fuel age. Glob. Chang. Biol. 2019, 25, 3829–3843. [Google Scholar] [CrossRef]
  25. Sánchez, M.E.G.; Borja, M.E.L.; Álvarez, P.A.P.; Romero, J.G.; Cozar, J.S.; Navarro, D.M.; de las Heras Ibáñez, J. Efecto de los trabajos de restauración forestal post-incendio en ladera sobre la recuperación de la funcionalidad del suelo. Cuad. De La Soc. Española De Cienc. For. 2019, 45, 35–44. [Google Scholar]
  26. Dourojeanni, M. Esbozo de una nueva política forestal peruana. Rev. For. Del Perú 2019, 34, 4–20. [Google Scholar] [CrossRef]
  27. Perz, S.; Qiu, Y.; Xia, Y.; Southworth, J.; Sun, J.; Marsik, M.; Rocha, K.; Passos, V.; Rojas, D.; Alarcón, G.; et al. Trans-boundary infrastructure and land cover change: Highway paving and community-level deforestation in a tri-national frontier in the Amazon. Land Use Policy 2013, 34, 27–41. [Google Scholar] [CrossRef]
  28. Chávez, A.; Huamani, L.; Fernandez, R.; Bejar, N.; Valera, F.; Perz, S.; Brown, I.; Domínguez, S.; Pinedo, R.; Alarcón, G. Regional Deforestation Trends within Local Realities: Land-Cover Change in Southeastern Peru 1996–2011. Land 2013, 2, 131–157. [Google Scholar] [CrossRef] [Green Version]
  29. Alarcón, G.; Díaz, J.; Vela, M.; García, M.; Gutiérrez, J. Deforestación en el sureste de la amazonia del Perú entre los años 1999–2013; caso Regional de Madre de Dios (Puerto Maldonado–Inambari). J. High Andean Res. 2016, 18, 319–330. [Google Scholar] [CrossRef] [Green Version]
  30. Perz, S.; Castro, W.; Rojas, R.; Castillo, J.; Chávez, A.; García, M.; Guadalupe, Ó.; Gutiérrez, T.; Hurtado, A.; Mamani, Z.; et al. La Amazonia como un sistema socio-ecológico: Las dinámicas de cambios complejos humanos y ambientales en una frontera trinacional. In Naturaleza y Sociedad: Perpectivas Socio-Ecológicas Sobre Cambios Globales en América Latina; Postigo, J., Young, K., Eds.; Desco, IEP e INTE-PUCP: Lima, Perú, 2016; p. 444. [Google Scholar]
  31. GOREMAD; IIAP. Macro Zonificación Ecológica Económica de Madre de Dios; Gobierno Regional de Madre de Dios: Puerto Maldonado, Peru, 2009; p. 208. [Google Scholar]
  32. Román-Dañobeytia, F.; Cabanillas, F.; Lefebvre, D.; Farfan, J.; Alferez, J.; Polo-Villanueva, F.; Llacsahuanga, J.; Vega, C.M.; Velasquez, M.; Corvera, R.; et al. Survival and early growth of 51 tropical tree species in areas degraded by artisanal gold mining in the Peruvian Amazon. Ecol. Eng. 2021, 159, 106097. [Google Scholar] [CrossRef]
  33. Román-Dañobeytia, F.; Huayllani, M.; Michi, A.; Ibarra, F.; Loayza-Muro, R.; Vázquez, T.; Rodríguez, L.; García, M. Reforestation with four native tree species after abandoned gold mining in the Peruvian Amazon. Ecol. Eng. 2015, 85, 39–46. [Google Scholar] [CrossRef]
  34. Holdridge, L.R. Life zone ecology. In Life Zone Ecology; Springer: Berlin/Heidelberg, Germany, 1967. [Google Scholar]
  35. SENAMHI. Mapa de Clasificación Climática del Perú; Servicio Nacional de Meteorología e Hidrología del Perú: Lima, Perú, 2012. [Google Scholar]
  36. SENAMHI. En la Selva Preparémonos para la Llegada de los Friajes; Servicio Nacional de Meteorología e Hidrología del Perú: Lima, Perú, 2015. [Google Scholar]
  37. Escobar, A.A.H.; Rodríguez, M.P.R.; López, B.M.P.; Ganchozo, B.I.; Gómez, A.J.Q.; Ponce, L.A.M. Metodología de la Investigación Científica; 3Ciencias: Alcoy, Spain, 2018; Volume 15. [Google Scholar]
  38. Bernhard, E.-M.; Twele, A.; Gähler, M. Rapid mapping of forest fires in the European Mediterranean region—A change detection approach using X-band SAR-data. Photogramm.-Fernerkund.-Geoinf. 2011, 2011, 261–270. [Google Scholar] [CrossRef] [Green Version]
  39. Tanase, M.A.; Santoro, M.; Aponte, C.; de la Riva, J. Polarimetric properties of burned forest areas at C-and L-band. IEEE J. Sel. Top. Appl. Earth Obs. Remote Sens. 2013, 7, 267–276. [Google Scholar] [CrossRef]
  40. Xiuwan, C. Using remote sensing and GIS to analyse land cover change and its impacts on regional sustainable development. Int. J. Remote Sens. 2002, 23, 107–124. [Google Scholar] [CrossRef]
  41. Jensen, J.R.; Lin, H.; Yang, X.; Ramsey III, E.; Davis, B.A.; Thoemke, C.W. The measurement of mangrove characteristics in southwest Florida using SPOT multispectral data. Geocarto Int. 1991, 6, 13–21. [Google Scholar] [CrossRef]
  42. Anaya, J.A.; Chuvieco, E. Validación para Colombia de la estimación de área quemada del producto L3JRC en el periodo 2001-2007/Validation of the L3JRC burned area product estimation in Colombia from 2001 to 2007. Actual. Biológicas 2010, 32, 29. [Google Scholar]
  43. Chuvieco, E.; Hantson, S. Procesamiento Estándar de Imágenes Landsat. Documento Técnico de Algoritmos a Aplicar. Version 1. Plan Nacional de Teledetección. Instituto Geográfico Nacional. En Linea. 2010. Available online: http://www.ign.es/PNT/pdf/especificacionestecnicas-pnt-mediar-landsat_v2-2010.pdf (accessed on 31 January 2022).
  44. Ochoa, C.; Páez, O. Inferencia estadística: Probabilidad, variables aleatorias y distribuciones de probabilidad. Evid. Pediatr. 2019, 15, 27. [Google Scholar]
  45. Elijah, R.; Jensen, J.R. Remote Sensing of Mangrove Wetlands: Relating Canopy Spectra to Site-Specific Data. 1996. Available online: https://www.asprs.org/wp-content/uploads/pers/1996journal/aug/1996_aug_939-948.pdf (accessed on 31 January 2022).
  46. Chuvieco, E. Teledetección Espacial: La Observación de la Tierra Desde el Espacio; Digital Reasons: Barcelona, Spain, 2002. [Google Scholar]
  47. Kuhn, M.; Johnson, K. Applied Predictive Modeling; Springer: Berlin/Heidelberg, Germany, 2013; Volume 26. [Google Scholar]
  48. Townsend, J.T. Theoretical analysis of an alphabetic confusion matrix. Percept. Psychophys. 1971, 9, 40–50. [Google Scholar] [CrossRef]
  49. Key, C.H.; Benson, N.C. Landscape Assessment (LA). In FIREMON: Fire Effects Monitoring and Inventory System; General Technical Report RMRS-GTR-164-CD; Lutes, D.C., Keane, R.E., Caratti, J.F., Key, C.H., Benson, N.C., Sutherland, S., Gangi, L.J., Eds.; US Department of Agriculture, Forest Service, Rocky Mountain Research Station: Fort Collins, CO, USA, 2006; Volume 164, p. LA-1-55. Available online: https://www.fs.fed.us/rm/pubs/rmrs_gtr164/rmrs_gtr164_13_land_assess.pdf (accessed on 31 January 2022).
  50. Cerda, J.; Villarroel, L. Evaluación de la concordancia inter-observador en investigación pediátrica: Coeficiente de Kappa. Rev. Chil. De Pediatría 2008, 79, 54–58. [Google Scholar] [CrossRef] [Green Version]
  51. Cohen, J. A Coefficient of Agreement for Nominal Scales. Educ. Psychol. Meas. 1960, 20, 37–46. [Google Scholar] [CrossRef]
  52. Li, X.; Zhou, Y.; Gong, P.; Seto, K.C.; Clinton, N. Developing a method to estimate building height from Sentinel-1 data. Remote Sens. Environ. 2020, 240, 111705. [Google Scholar] [CrossRef]
  53. Cruz, M.G.; Alexander, M.E. Uncertainty associated with model predictions of surface and crown fire rates of spread. Environ. Model. Softw. 2013, 47, 16–28. [Google Scholar] [CrossRef]
  54. Tanase, M.A.; Santoro, M.; de La Riva, J.; Fernando, P.; Le Toan, T. Sensitivity of X-, C-, and L-band SAR backscatter to burn severity in Mediterranean pine forests. IEEE Trans. Geosci. Remote Sens. 2010, 48, 3663–3675. [Google Scholar] [CrossRef]
  55. Tanase, M.A.; Santoro, M.; Wegmüller, U.; de la Riva, J.; Pérez-Cabello, F. Properties of X-, C-and L-band repeat-pass interferometric SAR coherence in Mediterranean pine forests affected by fires. Remote Sens. Environ. 2010, 114, 2182–2194. [Google Scholar] [CrossRef]
  56. Torres, R.; Snoeij, P.; Geudtner, D.; Bibby, D.; Davidson, M.; Attema, E.; Potin, P.; Rommen, B.; Floury, N.; Brown, M. GMES Sentinel-1 mission. Remote Sens. Environ. 2012, 120, 9–24. [Google Scholar] [CrossRef]
  57. Alarcon, G.; Canahuire, R.R.; Guevarra, F.M.G.; Rodriguez, L.; Gallegos, L.E.; Garate-Quispe, J. Dinámica de la pérdida de bosques en el sureste de la Amazonia peruana: Un estudio de caso en Madre de Dios. Ecosistemas 2021, 30, 2175. [Google Scholar] [CrossRef]
  58. Chavez, A.B.; Perz, S.G. Path dependency and contingent causation in policy adoption and land use plans: The case of Southeastern Peru. Geoforum 2013, 50, 138–148. [Google Scholar] [CrossRef]
  59. Chavez, A.; Huamani, L.; Vilchez, H.; Perz, S.; Quaedvlieg, J.; Rojas, R.; Brown, F.; Pinedo, R. The effects of climate change variability on rural livelihoods in Madre de Dios, Peru. Reg. Environ. Chang. 2020, 20, 70. [Google Scholar] [CrossRef]
  60. Coen, J.L.; Stavros, E.N.; Fites-Kaufman, J.A. Deconstructing the King megafire. Ecol. Appl. 2018, 28, 1565–1580. [Google Scholar] [CrossRef]
  61. De Oliveira Alves, N.; de Souza Hacon, S.; de Oliveira Galvão, M.F.; Simões Peixotoc, M.; Artaxo, P.; de Castro Vasconcellos, P.; de Medeiros, S.R.B. Genetic damage of organic matter in the Brazilian Amazon: A comparative study between intense and moderate biomass burning. Environ. Res. 2014, 130, 51–58. [Google Scholar] [CrossRef]
  62. De Oliveira Alves, N.; Brito, J.; Caumo, S.; Arana, A.; de Souza Hacon, S.; Artaxo, P.; Hillamo, R.; Teinilä, K.; Batistuzzo de Medeiros, S.R.; de Castro Vasconcellos, P. Biomass burning in the Amazon region: Aerosol source apportionment and associated health risk assessment. Atmos. Environ. 2015, 120, 277–285. [Google Scholar] [CrossRef] [Green Version]
  63. Porcher, V.; Thomas, E.; Gomringer, R.C.; Lozano, R.B. Fire- and distance-dependent recruitment of the Brazil nut in the Peruvian Amazon. For. Ecol. Manag. 2018, 427, 52–59. [Google Scholar] [CrossRef]
  64. Smith, J.; van de Kop, P.; Reategui, K.; Lombardi, I.; Sabogal, C.; Diaz, A. Dynamics of secondary forests in slash-and-burn farming: Interactions among land use types in the Peruvian Amazon. Agric. Ecosyst. Environ. 1999, 76, 85–98. [Google Scholar] [CrossRef]
  65. Morello, T.; Anderson, L.; Silva, S. Innovative fire policy in the Amazon: A statistical Hicks-Kaldor analysis. Ecol. Econ. 2022, 191, 107248. [Google Scholar] [CrossRef]
  66. Leite-Filho, A.T.; Costa, M.H.; Fu, R. The southern Amazon rainy season: The role of deforestation and its interactions with large-scale mechanisms. Int. J. Climatol. 2020, 40, 2328–2341. [Google Scholar] [CrossRef]
  67. Stevens, L.E.; Schenk, E.R.; Springer, A.E. Springs ecosystem classification. Ecol. Appl. 2020, 31, e2218. [Google Scholar] [CrossRef]
  68. Southworth, J.; Marsik, M.; Qiu, Y.; Perz, S.; Cumming, G.; Stevens, F.; Rocha, K.; Duchelle, A.; Barnes, G. Roads as Drivers of Change: Trajectories across the Tri-National Frontier in MAP, the Southwestern Amazon. Remote Sens. 2011, 3, 1047–1066. [Google Scholar] [CrossRef] [Green Version]
  69. Belenguer-Plomer, M.A.; Tanase, M.A.; Fernandez-Carrillo, A.; Chuvieco, E. Burned area detection and mapping using Sentinel-1 backscatter coefficient and thermal anomalies. Remote Sens. Environ. 2019, 233, 111345. [Google Scholar] [CrossRef]
  70. Bradstock, R.A.; Hammill, K.A.; Collins, L.; Price, O. Effects of weather, fuel and terrain on fire severity in topographically diverse landscapes of south-eastern Australia. Landsc. Ecol. 2010, 25, 607–619. [Google Scholar] [CrossRef]
  71. Hernández, H.M. Lo que Usted Debe Saber Sobre Incendios de Cobertura Vegetal. 2019. Available online: https://repositorio.gestiondelriesgo.gov.co/bitstream/handle/20.500.11762/28309/Cartilla_Incendios_2019-.pdf?sequence=4 (accessed on 31 January 2022).
  72. Lahaye, S.; Curt, T.; Fréjaville, T.; Sharples, J.; Paradis, L.; Hély, C. What are the drivers of dangerous fires in Mediterranean France? Int. J. Wildland Fire 2018, 27, 155–163. [Google Scholar] [CrossRef]
  73. Martins, F.d.S.R.V.; dos Santos, J.R.; Galvão, L.S.; Xaud, H.A.M. Sensitivity of ALOS/PALSAR imagery to forest degradation by fire in northern Amazon. Int. J. Appl. Earth Obs. Geoinf. 2016, 49, 163–174. [Google Scholar] [CrossRef]
Figure 1. Location of the study area, Distrito de Tahuamanu, Madre de Dios—Perú.
Fire 05 00094 g001
Figure 2. Types of burn severity (CBI): low severity (a), moderate severity (b), and high severity (c).
Fire 05 00094 g002
Figure 3. Wavelength (dB microwave) backscatter VV (a) and VH (b) for vegetation and burned areas.
Fire 05 00094 g003
Figure 4. Sentinel-1 C-band VV co-polarization (a,b), VH cross-polarization (c,d), and pre- and post-burn composite (e,f).
Fire 05 00094 g004
Figure 5. Sentinel-1 C-band burn quantification using absolute and relative values of VV, VH, and pre- and post-burn 2020 backscatter data: (a) relative absolute VV_1, (b) relative absolute VV_2, (c) relative absolute VH_1, (d) relative absolute VH_2, (e) RDFI VVVH.
Fire 05 00094 g005
Figure 6. Quantification of burned areas by absolute and relative values, and RBR by RDFI of pre- and post-fire 2020 VV and VH backscatter data; Equations (1)–(9).
Fire 05 00094 g006
Figure 7. Sentinel-1 C-band, burn severity using absolute and relative values of backscatter data VV, VH, and pre- and post-burn 2020: (a) pre-burn, (b) post-burn, (c) absolute VV, (d) absolute VH, (e) relative VV, (f) relative VH, (g) relative absolute VV_1, (h) relative absolute VV_2, (i) relative absolute VH_1, (j) relative absolute VH_2, (k) RDFI VVVH, (l) relative absolute burn severity VV_1, (m) relative absolute burn severity VV_2, (n) relative absolute burn severity VH_1, (o) relative absolute burn severity VH_2, and (p) RDFI burn severity VVVH.
Fire 05 00094 g007
Figure 8. Areas by burn severity level using absolute and relative values and Burn Ratio (RBR) by Radar Forest Degradation Index (RDFI) from pre- and post-fire 2020 VV and VH backscatter data.
Fire 05 00094 g008
Table 1. Decision criteria for developing the SAR Sentinel-1 burn severity model using absolute and relative values 1.
Decision CriteriaSeverity of Burns
Rel_VV/VH 1 ≤ 0.57; Evergreen = No; Abs_VV/VH ≤ 0.03Moderate
Rel_VV/VH 1 ≤ 0.57; Evergreen = No; Abs_VV/VH > 0.03High
Rel_VV/VH 1 ≤ 0.57; Evergreen = Yes; Abs_VV/VH ≤ 0.03Low
Rel_VV/VH 1 ≤ 0.57; Evergreen = Yes; Abs_VV/VH > 0.03Moderate
Rel_VH 1 > 0.57; Abs_VV/VH ≤ 0.19High
Rel_VV/VH 1 ≤ 0.57; Abs_VV/VH > 0.19Moderate
1 Adapted from Addison and Oommen [3].
Table 2. Decision criteria for developing the SAR Sentinel-1 burn severity model using RDFI 1.
Decision CriteriaSeverity of Burns
RDFI = −0.6 to −0.47Low
RDFI = −0.47 to 0.04Moderate
RDFI ≥ 0.04High
1 Adapted from Tanase et al. [17] and Tanase et al. [18].
Table 3. Definitions of CBI severity categories for comparing absolute, relative values, and RBR by RDFI from VV and VH backscatter data 1.
CategoryCBIDescription
Unburned0The location did not experience any fires. This may also include a location that recovers quickly after fires.
Low>0 to ≤1Minimal vegetation consumption: vegetation fragments affected.
Moderate1 to ≤2The landscape exhibits transitional conditions between the low and high severity characteristics described above.
High>2Approximately 90% to total vegetation consumption. Sites typically exhibit greater than 50% mineral soil cover or freshly exposed rock fragments.
1 Adapted from Key and Benson [49].
Table 4. Confusion matrix and kappa index of CBI test data (columns) versus SAR Sentinel-1 data of absolute and relative values of VV and VH backscatter data of 2020 burns. (a) Relative absolute burn severity VV_1; (b) relative absolute burn severity VV_2; (c) relative absolute burn severity VH_1; (d) relative absolute burn severity VH_2, and (e) RDFI burn severity VVVH.
Category (a)CBICategory (b)CBI
LowModerateHighƒSAR
Sentinel-1
LowModerateHighƒSAR Sentinel-1
SAR Sentinel-1 (VV_1)Low88 (42)2315126SAR Sentinel-1 (VV_2)Low86 (41)2315124
Moderate2483 (43)22129Moderate2385 (44)24132
High162291 (43)129High192089 (43)128
ƒCBI128128128384ƒCBI128128128384
ƒo=262ƒc=128ƒo=260ƒc=128
k=0.523kM=1.004k=0.516kM=1.016
σk=0.0356σko=0.0361σk=0.0358σko=0.0361
z=14.506Confusion matrix=0.682z=14.289Confusion matrix=0.677
Category (c)CBICategory (d)CBI
LowModerateHighƒSAR Sentinel-1LowModerateHighƒSAR
Sentinel-1
SAR Sentinel-1 (VH_1)Low79 (41)2519123SAR Sentinel-1 (VH_2)Low101 (43)1513129
Moderate2783 (44)21131Moderate15104 (46)20139
High222088 (43)130High12995 (39)116
ƒCBI128128128384ƒCBI128128128384
ƒo=250ƒc=128ƒo=300ƒc=128
k=0.477kM=1.012k=0.672kM=1.043
σk=0.0365σko=0.0361σk=0.0316σko=0.0361
z=13.207Confusion matrix=0.651z=18.602Confusion matrix=0.781
Category (e)CBI
LowModerateHighƒSAR Sentinel-1
SAR Sentinel-1 (VVVH)Low108 (44)1112131
Moderate13111 (47)17141
High7699 (37)112
ƒCBI128128128384
ƒo=318ƒc=128
k=0.742kM=1.051
σk=0.0289σko=0.0361
z=20.568Confusion matrix=0.828
Publisher’s Note: MDPI stays neutral with regard to jurisdictional claims in published maps and institutional affiliations.

