
Ultrasonic Atomization: New Spray Characterization Approaches


ADAI—LAETA, Department of Mechanical Engineering, Faculdade de Ciências e Tecnologia, University of Coimbra, 3030-289 Coimbra, Portugal
Fluids 2022, 7(1), 29; https://doi.org/10.3390/fluids7010029
Submission received: 3 December 2021
/
Revised: 4 January 2022
/
Accepted: 5 January 2022
/
Published: 7 January 2022
(This article belongs to the Special Issue Thin Liquid Films: From Theory to Applications)
Abstract
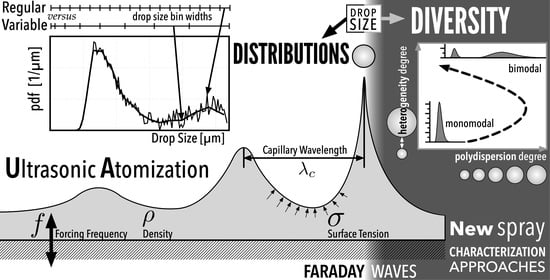
:In particle engineering, spray drying is an essential technique that depends on producing sprays, ideally made of equal-sized droplets. Ultrasonic sprays appear to be the best option to achieve it, and Faraday waves are the background mechanism of ultrasonic atomization. The characterization of sprays in this atomization strategy is commonly related to the relation between characteristic drop sizes and the capillary length produced by the forcing frequency of wavy patterns on thin liquid films. However, although this atomization approach is practical when the intended outcome is to produce sprays with droplets of the same size, drop sizes are diverse in real applications. Therefore, adequate characterization of drop size is paramount to establishing the relations between empirical approaches proposed in the literature and the outcome of ultrasonic atomization in actual operating conditions. In this sense, this work explores new approaches to spray characterization applied to ultrasonic sprays produced with different solvents. The first two introduced are the role of redundancy in drop size measurements to avoid resolution limitation in the measurement technique and compare using regular versus variable bin widths when building the histograms of drop size. Another spray characterization tool is the Drop Size Diversity to understand the limitations of characterizing ultrasonic sprays solely based on representative diameters or moments of drop size distributions. The results of ultrasonic spray characterization obtained emphasize: the lack of universality in the relation between a characteristic diameter and the capillary length associated with Faraday waves; the variability on drop size induced by both liquid properties and flow rate on the atomization outcome, namely, lower capillary lengths produce smaller droplets but less efficiently; the higher sensibility of the polydispersion and heterogeneity degrees in Drop Size Diversity when using variable bin widths to build the histograms of drop size; the higher drop size diversity for lower flow rates expressed by the presence of multiple clusters of droplets with similar characteristics leading to multimodal drop size distributions; and the gamma and log-normal mathematical probability functions are the ones that best describe the organization of drop size data in ultrasonic sprays.
1. Introduction
Spray drying is an essential technique in particle engineering for obtaining high performance pharmaceutical products, namely, direct compressibles (for oral dosage forms) or breathable particles (for inhalation products). The process begins with the formation of a spray from a feed solution containing an Active Pharmaceutical Ingredient (API) and excipients inside a chamber. A stream of hot gas interacts with the spray droplets, and evaporates the solvent precipitating the solids forming the powder used in pharmaceutical products. For the preparation of inhalation drug products, these solutions are usually dilute and since the atomization process depends on the properties of the liquid, the solvent becomes the determining factor defining drop sizes. The objective is to produce a spray with droplets of the same size, but the closest method to achieve it is to use mono-size injectors, which unnecessarily increases the complexity of the spray system. Instead, the industry explored ultrasonic sprays using Faraday waves as the atomization mechanism that produces droplets.
1.1. Atomization by Faraday Waves
In 1831, Michael Faraday documented the emergence of capillary wave patterns in a liquid free-surface when subjected a vibration with a certain amplitude [1]. Later, Rayleigh [2] reported the work of Kelvin on the definition of the dominant wavelength produced by these capillary waves as
which considers the influence liquid properties, such as the surface tension () and density (), as well as the forcing frequency, f. Only in 1927 did Wood and Loomis [3] produced for the first time an aerosol spray from a liquid film using ultrasounds. When the wavy patterns reach certain instability levels, the hydrodynamic structures form jets that can destabilize into droplets and this is the basic physical phenomena forming ultrasonic sprays through the capillary wave hypothesis. However, the forcing frequency range in this hypothesis is within the kHz. When the range increases to MHz, Söllner [4] showed proposed an alternative cavitation hypothesis where hydraulic shocks produced by implosion of bubbles generated by cavitation lead to liquid atomization near its surface. Later, Boguslavski [5] joined these two hypothesis into a “conjuction theory” stating capillary waves induced by cavitation bubbles would eventually disintegrate into droplets. Although capillary waves depend on the forcing frequency, their regular nature should result in drop size distributions with a high uniformity degree, meaning an approach to the ideal case of mono-sized droplets. However, given the random nature of droplets produced by cavitation, ultrasonic sprays increase their drop size diversity, as demonstrated by Avvaru et al. [6]. Additionally, Qi et al. [7] showed with experiments that for higher frequencies, deviations are high from the capillary wave hypothesis. However, instead of exploring the cavitation alternative, the authors attribute deviations to the nature of the capillary frequency—viscous or inertia—which could induce some variability in the relation between drop size and the capillary length depending on the experimental conditions.
Considering the capillary wave hypothesis, Lang [8] in his seminal work on this ultrasonic atomization strategy, empirically found a constant relation between the number-median diameter (not the area-weighted mean diameter, , as some authors report) and this wavelength as
where corresponds to the droplet diameter value that represents 50% of the droplets in a spray. Or, in statistical terms, when the droplet size distribution represented is cumulative (), . However, Lang’s empirical proposal is not universal. The value determined by Lang [8] was , and Donnelly et al. [9] later validated this value with more experiments obtaining . However, in the analysis of Peskin and Raco [10], , the results reported by Nedeljković et al. [11] point to an experimental value of , and, recently, Kooij et al. [12] reported experimental relations for between 0.17 and 0.65, depending of the ultrasonic devices. Therefore, it appears the relation between a characteristic drop size and the capillary wavelength is not well-established or restricted to a single value. Therefore, it underlines the value of developing a clearer definition of the physical phenomena involved in the onset of ultrasonic atomization by Faraday waves. A noteworthy argument made by Paneva et al. [13] and Mwakikunga [14] is that the characteristic size of droplets considered by different authors may not be the same, eventually leading to these differences, but Mwakikunga [14] also advances two other reasons: (i) the Kelvin assumption leading to Equation (1) is not universal; (ii) or the effect of viscosity () and volumetric flow rate () should be taken into consideration. Although there is a lack of systematic research investigating the first reason, several works tackled with the second one. Namely, Li and Fogler [15] understood that including the viscous term in the instability function describing wave patterns implies fulfilling a criterion where the acoustic wave amplitude destabilizes and atomizes when it is larger than .
Rajan and Pandit [16] explored several of these alternative correlations with an intermediate step. Instead of predicting a characteristic or representative drop size () from the capillary length (), as in Equation (2), they considered the characteristic diameter of the jet () produced by instabilities in the Faraday wavy pattern, and then predicted the size of droplets through the itinerary: . Therefore, the constant becomes a function of the assumptions defining the size of the jets and corresponding breakup mechanisms. However, what is the role of the liquid properties in this itinerary?
A noteworthy effect is the amplitude voltage of the signal generating the acoustic wave which affect the atomization rate [17], but not the median diameter [18]. This appears contrary to the results earlier obtained by Peskin and Raco [10], but one should point that these authors used lower forcing frequencies where the capillary wave hypothesis dominates droplet production, while Barreras et al. [18] operated on the cavitation hypothesis domain.
In applications such as spray drying for the pharmaceutical industry, choosing the solvent is a major concern because of its possible effect on liquid atomization. Additionally, how much does changing the liquid properties affects the diversity of drop sizes? The following section synthesizes the main works on the effect of liquid properties on ultrasonic atomization.
1.2. Effect of Liquid Properties in Ultrasonic Atomization
An early work by Mizutani et al. [19] investigated the effect of and on ultrasonic drop sizes and observed a conflict. An increase in that leads to larger capillary wavelengths led to smaller mean drop sizes, contradicting the relation of Lang [8] and other authors. The explanation provided states that Lang’s relation correctly represents the effect of the vibration frequency, but not the effect of liquid properties in the atomization process. However, Mizutani et al. [19] measured drop sizes using a glass-slide on which the capturing liquid drops spread, measuring the distribution with photographs. The authors do not provide detailed information about this method, although it is reasonable to consider that the diameter of spreading droplets is larger than their size before impact. Additionally, the impact velocity affects spreading, questioning their measurement of mean drop diameters. In fact, Lacas et al. [20] used a Phase-Doppler Interferometer to measure drop size distributions for different fluids using the same flow rate, and Sindayihebura et al. [21], Cousin et al. [22] used a laser diffraction technique to measure the Sauter mean diameter, and all these works present experimental results congruent with Lang’s relation.
Mizutani et al. [19] further investigated the effect of the dynamic viscosity and observed an increase in the Sauter mean diameter with this property in the range cP. However, Sindayihebura et al. [21] experimental results showed no effect within that range. Only Rajan and Pandit [16] made experiments showing an effect of the dynamic viscosity but considered cP. Dalmoro et al. [23] provides an interesting explanation for the decrease in drop size for liquids with a higher dynamic viscosity. They state that more viscous liquids delay the atomization by increasing the liquid’s residence time on the atomizing surface, causing an increase in its temperature as a result of the energy dissipation through vibration. The induced thermal effect decreases liquid viscosity to a critical point where the hydrodynamic structures generate smaller droplets. Therefore, since the viscosity values in Mizutani et al. [19] were below 10 cP, one does not expect an effect induced by the liquid’s dynamic viscosity in the atomization outcome. Are the differences in the proportional relation between a characteristic size and the capillary length due to differences in the thermophysical properties of the fluid? Or is it an effect of the flow rate as noted by Mwakikunga [14]?
Yasuda et al. [24] addressed the effect of the liquid’s dynamic viscosity and modified Lang’s equation to
with , and as the dynamic viscosity of water. However, by modifying Lang’s equation, Yasuda et al. [24] assumes the predominance of the capillary wave hypothesis as the ultrasonic atomization mechanism over the capillary hypothesis. Lozano et al. [17] also found a strong effect of the viscosity on the atomization rate, but does not appear to consider the cavitation hypothesis.
Other effects, such as surface tension have been found to produce little effect by Lioubashevski et al. [25], but not by Lozano et al. [17], which means further research is still needed. A final comment relates to drop size distributions.
The advantage of ultrasonic sprays is the production of micro-size droplets with a low diversity. However, Barreras et al. [18] measured the formation of a distinct cluster of larger droplets and attributed to the higher degree of instabilities induced by the vibration of the transducer. Later, Lozano et al. [17] observed these larger droplets emerged from crests in the surface wavy pattern attributing their formation to the capillary wave hypothesis.
The purpose of the research reported here is to investigate the effect of liquid properties in ultrasonic atomization using a more advanced analysis of the spray characteristics based on the drop size distributions. Although laser diffraction techniques allow measuring drop size distributions, and laser interferometry the size and velocity of droplets, most approaches to spray characterization are statistical, presenting data in the form of characteristic diameters (mean and representative quantities, depending on using discrete or cumulative probability distributions, respectively), or plot the distributions without specifying the reasoning behind the building of distribution classes. However, despite the usefulness of characteristic diameters such as the Sauter mean diameter to evaluate the atomization efficiency (see Panão [26]), without presenting the probability distributions and performing an adequate analysis of their scale and shape, a significant amount of information about the spray is lost. Namely, the emergence of different clusters of droplets with similar characteristics resulting in multimodal drop size distributions, as observed by Dumouchel et al. [27]. Therefore, this work uses the methodologies synthesized and introduced in Panão et al. [28] to provide further insight into the ultrasonic atomization strategy using Faraday waves.
2. Experimental Setup and Spray Characterization Considerations
The ultrasonic atomizer used in the experimental setup is the 8700-35 Sono-Tek model with a conical tip. The solvent flow rate varied between 5 and 50 mL/min, and the fluids considered are water, acetone, and water–ethanol mixtures of 10% and 20%. The power supplied to the atomizer is W for a fixed ultrasonic frequency of 35 kHz. Table 1 summarizes the thermophysical properties of the liquids used.
The size and axial velocity of droplets has been measured using a Dantec Phase-Doppler Interferometer (PDI) using the light emitted by particles crossing the measurement volume at a scattering angle of 30. The laser power set to 350 mW forms the control volume for one velocity component (downward) with the wavelength of 514.5 nm. The beam spacing is 60 mm and both transmitting and receiving lens have a 500 mm focal length. The transmitting optics unit is a 55X, the unit receiving the light emitted by particles is a 57 × 10 PDA and the BSA P80 processes signals to obtain the information on droplets characteristics (size, , and downward velocity, ). Measurement locations considered in the analysis focus of the central axial axis ( [mm]) at the plane of [mm] to ensure a stable and fully formed spray. The uncertainties in drop size measurements according to the information theory approach developed in Panão and Moreira [29] resulted in 1.92–6.87%.
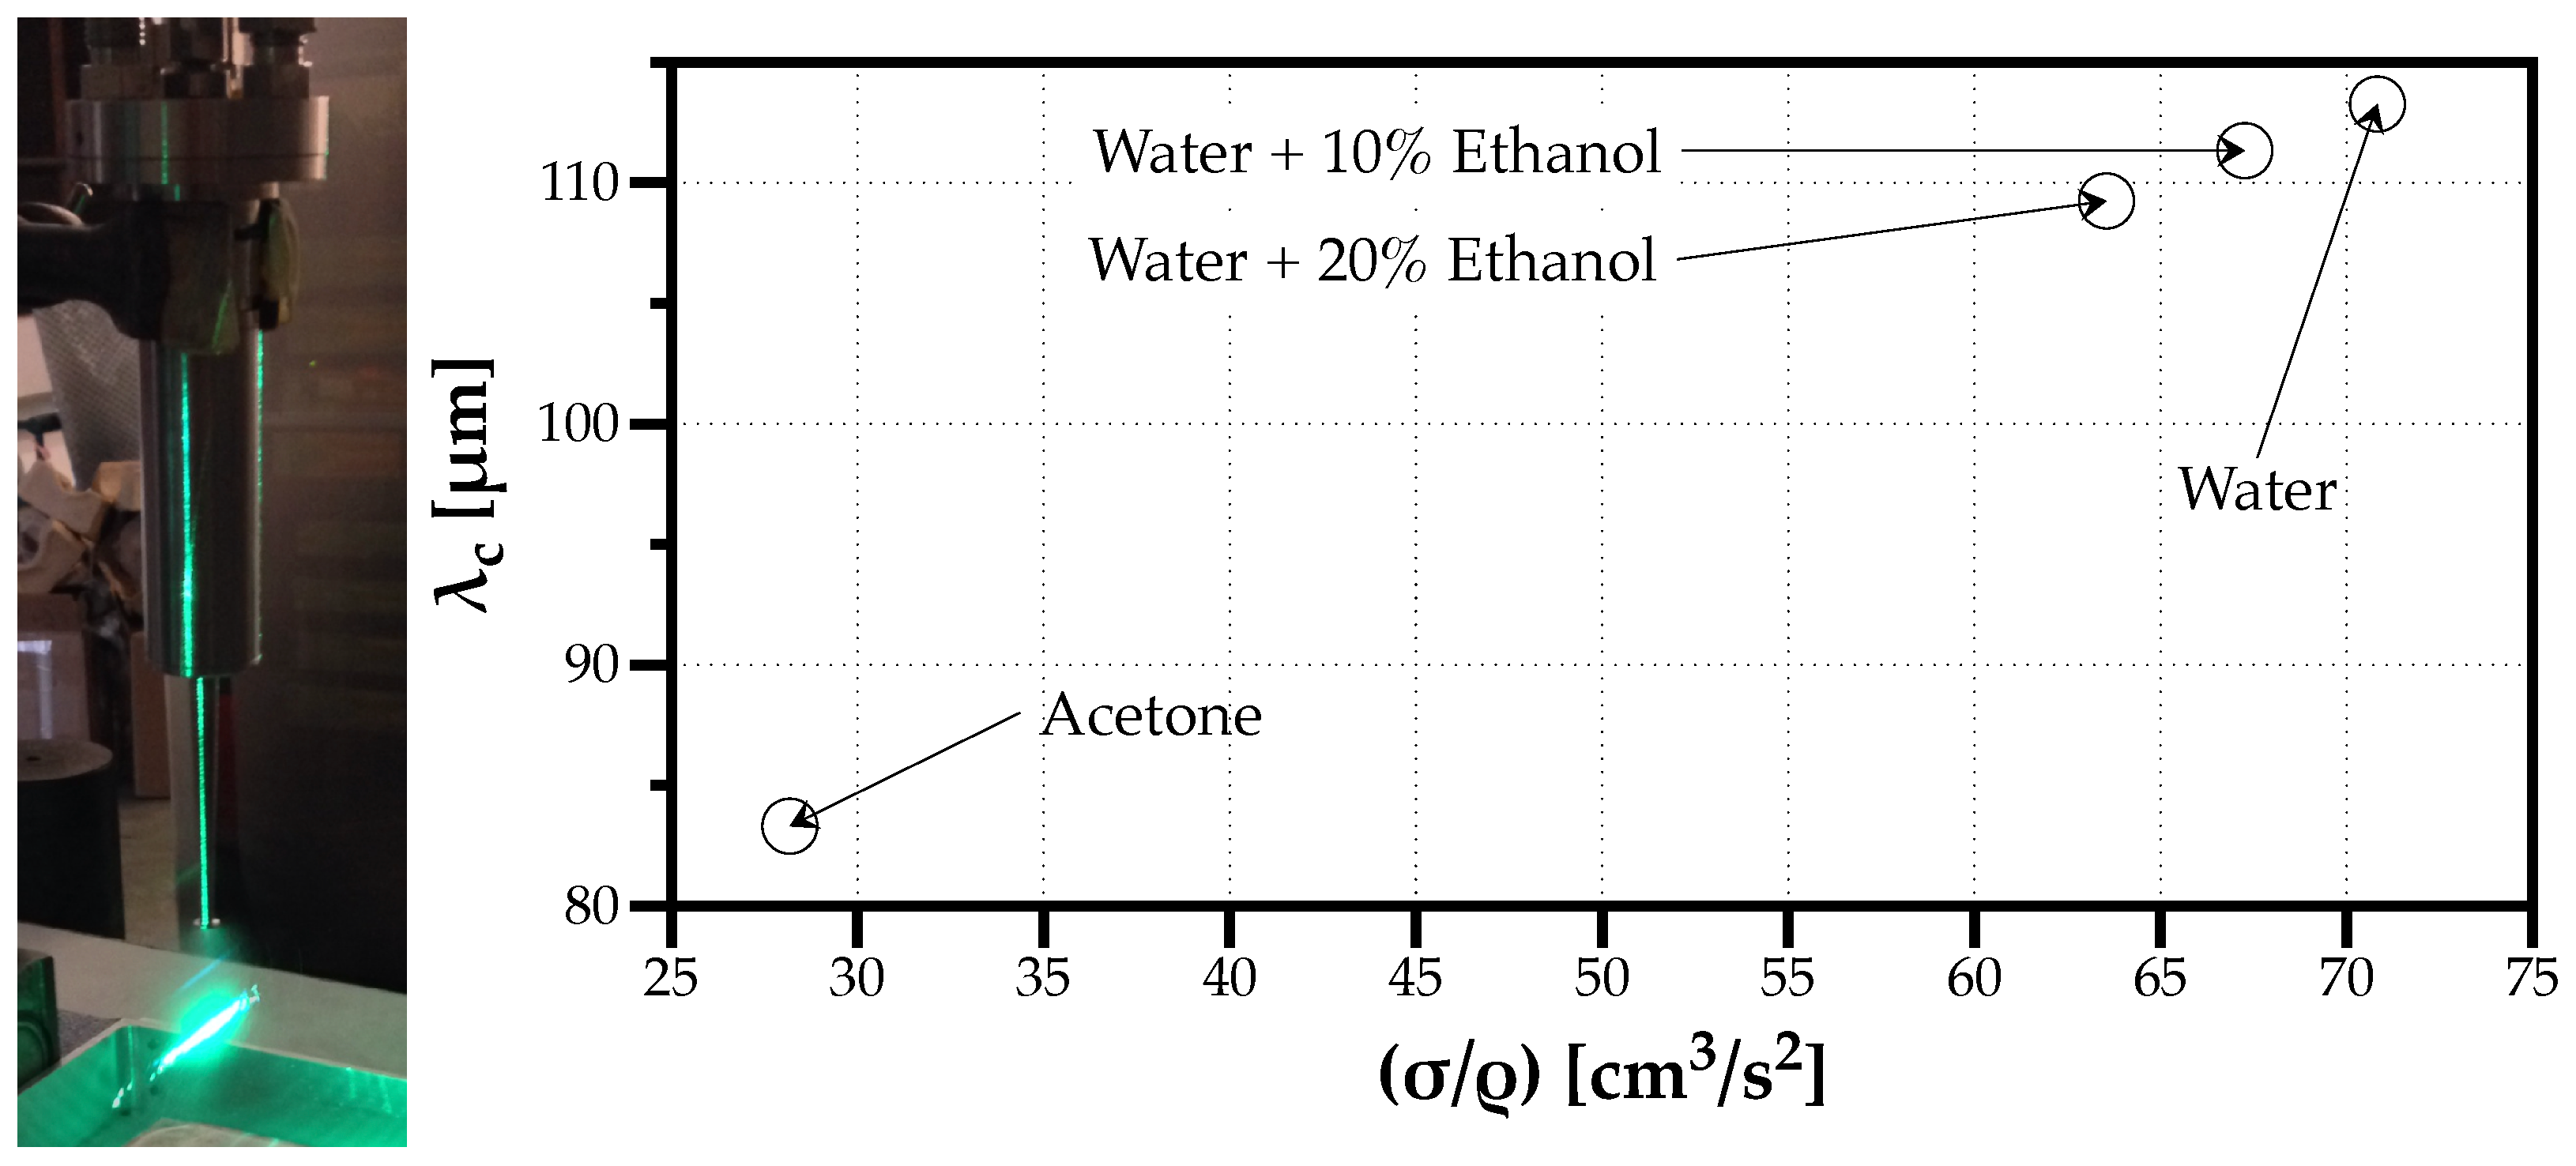
Figure 1 shows on the left an image of the ultrasonic injector used in the experiments and the PDI measurement volume, and on the right is the capillary Faraday wavelength () obtained for each fluid under the operating frequency of kHz as a function of the fluid properties ().
One of the neglected effects in spray characterization is the resolution of experimental techniques measuring the size and velocity of droplets. The next section questions for the first time the relevance of redundancy in data to overcome the resolution challenge before organizing data using statistical tools.
2.1. Introducing Data Redundancy and Implications
The precision in drop size samples produced by the PDI Dantec system is , which means the unique values are limited by the data resolution. This limitation influences the building of discrete drop size distributions and challenges our ability to find an good agreement with a mathematical function, assuming droplet production is a continuous phenomenon within the full size range, and not a discontinuous one where only certain sizes emerge from liquid atomization. Figure 2 shows for one measurement point with water, the counts of unique drop sizes (a total of 1355) measured in a 12,000 droplets’ sample. For example, a drop size of 65.9 m appear 36 times. This raises the question about resolution as a limitation in drop size measurement techniques.
Moreover, one notices that each measurement value contains an integer part, and a decimal one. In the case of a 65.9 m droplet, 65 m is the integer part and 0.9 m is the decimal part. Thus, if we separate the integer part from the decimal one, defining the classes to build the integer part histogram is easy with one class per unique drop size from m to m in the example considered. Figure 3 compares the cumulative distributions of the sample made of integer drop sizes and the one with values including the decimal part. A Kolmogorov–Smirnov test shows that both samples belong to the same distribution. Therefore, how redundant are the precision values in drop size measurements?
Considering the previous example of a drop with 65.9 m, adding a random redundancy means the value becomes 65.9138940732430 m. After adding redundancy to all measurements in the data sample, it increases the 1355 unique values to the total sample size of 12,000 different measurement values. Figure 4 splits the integer from the decimal part of each drop size, and shows the effect of adding redundancy. After applying this procedure to all data samples in all experimental conditions considered, it implied a maximum bias of 0.055% to the Sauter Mean Diameter (), which is negligible. The relevance of this procedure is to avoid any resolution effects while building drop size distributions, as detailed in next section.
There is a final legitimate question about adding redundancy. If adding does not significantly change the outcome, or improves the fitting of a mathematical probability distribution to data, why add any redundancy at all? In several optical techniques, blurring effects and resolution often limit their ability to accurately measure a drop size. However, the topic of data redundancy introduced raises the hypothesis that as long as one can accurately measure the integer part, the attribution of a random decimal one allows to distinguish each droplet, resolving the shortcomings of data truncation from limitations of the measurement technique. Nonetheless, this section mainly introduces a topic that is open for further research.
2.2. Measurement Interpretation
Laser diagnostic systems such as the Phase Doppler Interferometer (PDI) produce large amounts of data. Panão et al. [28] synthesized the best practices for presenting the histograms produced from the statistical characterization of sprays, but there was one topic left for further research: the appropriate way to define the histogram classes. How many classes should one use to organize drop size data? Although most research works on sprays consider drop size distributions (DSDn) as the result of statistical analysis (and they are), Panão et al. [28] interpret spray characterization as a way of organizing data. Therefore, the probability associated to a certain drop size class is not one of occurrence, but of presence. However, the best strategy to define the number and interval of size classes remains unclear. In this section, we explore the reasons and present the first step to develop best practices for presenting data in spray characterization.
Following the example in Figure 3, if the cumulative distributions of a data sample truncated at the integer part, and the cumulative distribution of the full data sample including the decimal are practically the same, a first approach to define the classes for representing drop data is to consider intervals of 1 m centered on the integer part of drop sizes from 1 m to the maximum integer value above the largest measured drop size. For example, if the maximum drop size in a sample is 272.7 m, we should consider a class centered on 273 m. Therefore, to choose the number of classes () for organizing spray data, one needs to define whether their size () is regular or variable. Panão et al. [28] synthesized several strategies found in the literature to define the number and size of classes in histograms. However, this work uses the maximum number of classes given by interlaced Fibonacci series with , where floor() rounds the result to the lowest integer value, N is the sample number, and J is the number of interlaced Fibonacci series set to 6 (see Gentry and Cheng [30] for details on the expression), similarly to previous works. However, it is noteworthy that an adequate criterion for setting J is open for further research, which is beyond the scope of the present paper.
A second element in the method for organizing spray data as histograms is choosing between regular versus variable class sizes. Although classes with a regular bin width are the drop size spectrum divided by the number of classes, variable class sizes keep constant the class size () relative to its centroid (), . The definition of the constant C is still open for further research, however, in this work, the option is to calculate it as the inverse of the square root of the maximum number of classes given by the interlaced Fibonacci series expressed above, . It means larger samples decrease the value of C, consequently, increasing the number of classes as expected in statistical analysis with more data.
Figure 5 depicts the volume-weighted density-histograms for the highest (water) and lowest (acetone) capillary lengths considering the lowest volumetric flow rate of mL/min, and the number of classes is the same () for both size classes with a regular or variable bin width. The results evidence how regular bin sizes tend to produce “noisier” histograms with greater variability between adjacent classes for no particular reason, while the histograms with variable classes are smoother, even when there are traces of bimodality as in the case of the water spray. Therefore, in this work, all distributions considered variable bin width size classes to improve the visualization of the statistically organized spray data.
Despite the most common option to present spray data considers volume-weighted probability density histograms, , especially if the number of classes varies between data samples, the most appropriate form should be cumulative drop size distributions because the ordinate limits are the same, i.e., between 0 and 1. Additionally, an important step is to evaluate whether a mathematical function, such as the Log-Normal, Gamma, Weibull, or other empirical distributions, as the Nukyiama–Tansawa, can accurately describe the experimental results using a Kolmogorov–Smirnov (KS) goodness-to-fit test. The reason for this assessment is the ability to provide the characteristic parameters that enable the reconstruction of probability distributions for the validation of numerical models and extract mean diameters without losing the original information contained in spray data. The challenge in this fitting occurs when the discrete distribution is multimodal. However, fitting algorithms for multimodal distributions is beyond the scope of the present work.
3. Results and Discussion
The first results presented correspond to the characterization of drop size distributions for the ultrasonic sprays and the effects of liquid properties and volume flow rate on their shape. Secondly, one investigates these effects on the characteristic drop sizes, comparing the ratio between mean values and the capillary wavelength with Lang’s approach through constant . Additionally, one analyzes these effects on the atomization efficiency. Finally, in the last subsection, one characterizes the effects of liquid properties and volume flow rate on Drop Size Diversity (DSDy), and the relevant insights of a new approach proposed in an earlier work [28] for assessing the performance of ultrasonic atomization.
3.1. Drop Size Distributions
The lowest volumetric flow rate considered ( mL/min) produced a drop size distribution (DSDn) which none of the usual probability density function models would fit. Figure 6 shows on the left the density probability histograms for the several tested fluids, and on the right the corresponding cumulative drop size distributions (DSDn). The sprays mixing water with 10% ethanol had the highest degree of bimodality, followed by water. The mixture with 20% ethanol still contains a small percentage of large droplets, but the spray of acetone is clearly unimodal. This bimodality occurs for lower flow rates and higher capillary lengths. Barreras et al. [18] attributed the production of larger droplets to the displacement of the liquid volume as a whole, and it is unrelated to the ultrasonic frequency. Kooij et al. [12] also observed a second peak of larger droplets in their ultrasonic atomizer and attributed their formation to direct interaction of the surface acoustic wave with liquid films on the surface generating spikes that lead to the detachment of larger droplets. Since all the aforementioned works used stationary liquid films is coherent with the present results obtained for the lowest flow rates, which is the closest operating condition. The shape and scale of these DSDn is a relevant information in the analysis of Drop Size Diversity explored in Section 3.3. However, if the purpose of testing different solvents in ultrasonic sprays is to evaluate which fluid produces the highest percentage of droplets with the same size, at low flow rates, only the one with the lowest capillary length shows a promising outcome.
Figure 7 depicts the volume-weighted cumulative DSDn for each solvent considering volumetric flow rates from 10 to 50 mL/min with 10 mL/min intervals. The colored distributions were the ones that failed the Kolmogorov–Smirnov (KS) goodness-to-fit test that has a significance level of 95%. However, even for these cases, the line drawn corresponding to the distribution which best fitted the experiments can still follow the experimental data. For the majority of operating conditions considered, one can extract information about the effect of changing the solvent and the flow rate in the scale and shape of these DSDn.
The scale of DSDn related to the diameter range of the spray droplets seems unaffected by the differences in the solvents’ thermophysical properties. The shape of DSDn is particularly sensible to low flow rates ( mL/min), inducing the production of a cluster with droplets of larger size. This would be problematic to fulfill the purpose of producing uniform powder particles. Zhang et al. [31] observed for flow rates mL/min a similar bimodality of drop size distributions and attributed this effect to increasingly random patterns of Faraday waves affecting ultrasonic atomization. A second argument of Zhang et al. [31] for producing larger droplets is the deformation of uniform capillary waver and a greater collapse of cavitation bubbles in thicker layers that explode and generate larger droplets. A third argument is the effect of viscosity influencing the growth of capillary waves leading to larger local capillary wavelengths and, consequently, increasing the size of drops produced from the crest instabilities. The results depicted in Figure 7 indicate that above mL/min, the phenomenon identified by Zhang et al. [31] ceases to produce any significant effect. Additionally, the bimodality for the lowest flow rate considered only appeared for water and water mixed with 10% ethanol whose capillary lengths are above m. This outcome raises the hypothesis that lower values for the capillary length are less prone to generate clusters of larger droplets. However, its test is beyond the scope of the present characterization and the subject of future work.
3.2. Characteristic Drop Sizes and Atomization Performance
When fitting the data depicted in Figure 7 to known mathematical functions describing drop size distributions, only two systematically found a best fitting with the available data: the log-normal and gamma distributions. The nature of the fragmentation process leading to spray formation is a cascade of events. For example, Broniarz-Press et al. [32] considered that unstable capillary waves can produce thin filaments eventually fragmenting into multiple droplets, and Vukasinovic et al. [33] visualized the formation of these ligaments. Villermaux [34] showed the gamma distribution explains better the distribution of droplets after ligament fragmentation, associating it to a temporal event, and Kooij et al. [12] obtained best fittings using this mathematical distribution function. In earlier works, such as Kottler [35], the log-normal has been associated to a sequence of random breakup processes. Associating the nature of the atomization mechanism to the nature of the mathematical distribution function is still a question open for further research. However, one could present the hypothesis that larger capillary length tends to produce ligaments leading to breakup temporal events with the same nature of the waiting times described by gamma distributions, while smaller capillary lengths tend promote multiple breakup events with random waiting times. Appendix A contains the data of the gamma and log-normal distributions that passed the Kolmogorov–Smirnov best fitting test, being useful to reproduce the entire distribution measured for the ultrasonic sprays of the experiments reported here.
As reviewed in Section 1.1, Lang [8] introduced the idea of a proportional relation between the capillary wavelength produced by Faraday waves and the number(n)-median diameter as , with , derived for excitation frequencies in the range of 10 to 800 kHz. The fluids used by Lang [8] had similar thermophysical properties relative to the solvents used in this work. However, the results depicted in Figure 8 show values for the proportional constant above Lang’s threshold of 0.34, and close to 1 in the case of Acetone. The differences in the sprays produced by commercial ultrasonic atomizers and the early versions devised by Lang [8] indicate Lang’s criterion is not universal. Kooij et al. [12] obtained a range for between 0.17 and 0.65, covering Lang’s value, however, still below the values obtained in the present experiments. Moreover, while water and the two water-ethanol mixtures have similar , and, consequently, similar , lower lead to a closer relation between the number-median drop size and the wavelength of the capillary waves, .
Although the number-median diameter is essential for characterizing ultrasonic sprays produced by Faraday waves, the appropriate mean diameter associated with the atomization process depends on the total surface area of all droplets in the spray, , defined as:
where n is the total number of droplets in the spray, and the size of each droplet. Considering the mass of all droplets in the spray as , with as the liquid density, and introducing this mass in Equation (4) through , it implies that
with as the Sauter mean diameter. This result justifies the physical link between the interfacial energy of droplets in a spray and the Sauter mean diameter.
Figure 9 shows a higher variability of when the volumetric flow rate is low (<20 mL/min) considering the different solvents (The mean diameters starting with D represent quantities retrieved from cumulative size distributions, while those starting with d represent mean values from weighted discrete probability distributions. For example, is the mean diameter of an area-weighted drop size distribution. More details in Sowa [36]), and for mL/min, the values are similar, which is consistent with the stabilization of depicted in Figure 8.
Following the general definition for the atomization efficiency explained in Panão [26] as
with as the ultrasonic input power, and retrieved from a Rayleigh instability approach [16]
Figure 10 synthesizes the results for the atomization efficiency for all solvents. The effect of the volumetric flow rate is enough to increase the efficiency of the ultrasonic atomizer by one order of magnitude. Considering that does not change significantly with acetone, the results for the atomization efficiency in this case evidence that using liquids with a lower capillary wavelength, produce smaller droplets, thus, perform better, but the energy cost is higher.
If we confront the atomization efficiency results in Figure 10 with the mean sizes depicted in Figure 9, reducing the surface tension in the attempt to produce smaller droplets does not seem to be the best strategy. Alternatively, from another point of view, using solvents with different surface tensions does not necessarily result in significant changes of the mean sizes of droplets produced by ultrasonic atomization. The following section investigates the effect of different solvents on Drop Size Diversity, a concept introduced in Panão et al. [28].
3.3. Drop Size Diversity
One of the main advantages of using ultrasonic sprays in spray drying applications is the ability to control droplet size, aiming at sprays with a high uniformity degree (all droplets have the same size), or a low Drop Size Diversity (DSDy). Panão et al. [28] introduced Drop Size Diversity to distinguish two degrees associated with the different sizes of droplets: the polydispersion degree characterizing how many different sizes are relevant in the spray; and the heterogeneity degree characterizing how different are the relevant sizes in the spray. The parameter that quantifies the polydispersion degree is the normalized Shannon entropy,
with as the number of size classes, and as the volume-weighted drop size probability. The normalized Shannon entropy is zero for sprays with all droplets of the same size, and it is maximum when all possible sizes have the same relevancy in the spray, i.e., the same probability of being present in the spray.
The parameter quantifying the heterogeneity degree is the volume-weighted standard deviation,
with with as the measured size of droplets in the spray. The most know parameter used to characterize DSDy is the Relative Span (, with as the representative diameter containing X% of all droplets in the spray in terms of volume-weighted (v) drop size distributions). However, Panão et al. [28] argued in detail about its limitations and do not recommended its use as a criterion to assess DSDy.
Figure 11 shows the results obtained in the experiments considered. Most conditions express a linear relation between the spray polydispersion and heterogeneity degrees, expressing that a greater diversity of sizes with similar relevancy in the spray intensify how different these sizes are, with the exception of a point apart from the trend corresponding to the lowest volume flow rate of mL/min with the mixture of water and 10% ethanol.
Could the exception be related to the bimodality observed in Figure 6? To understand this exception, several simulations mixed one spray of droplets with sizes according to a Log-Normal distribution with and , with another spray made of droplets with sizes according to a Log-Normal distribution with the same standard deviation but gradually increasing the geometrical mean diameter .
Figure 12 on the right shows the gradual evolution from a mono-modal to a bi-modal drop size distribution, and on the left we observe this change produces a non-linear variation of the heterogeneity degree () as a function of the polydispersion degree (). Moreover, this sensitivity to the DSDy with, at least, two distinct clusters of drop sizes increases when the discrete probability distributions have variable bin sizes, compared to regular bin sizes. The greater sensitivity of probability distributions with variable bin size classes is due to the higher concentration of classes in the smaller diameters where the probability values are lower. This outcome evidences how the way we characterize a spray using histograms can affect the interpretation of the physical phenomena involved.
Figure 13 and Figure 14 show the effect of the volumetric flow rate on the DSDy and one observes a higher variability of DSDy between solvents for flow rates below 20 mL/min, while above this value only the polydispersion degree increases slightly with the flow rate. The higher variability occurs for the fluids with a larger capillary length , or when more than one cluster of droplets with distinct characteristic sizes form the spray resulting in multimodal DSDn.
The results evidence that ultrasonic atomization producing smaller capillary lengths tend to produce sprays with a higher uniformity degree, i.e., with more droplets of the same size. In this since, future work suggest exploring higher forcing frequencies in solvents with larger .
4. Conclusions
In particle engineering, spray drying is an essential technique that depends on producing sprays, ideally made of equal-sized droplets and ultrasonic sprays appear to be the best option to achieve it. Ultrasonic atomization uses the instabilities in the patterns generated by Faraday waves to produce droplets with similar sizes, i.e., with a high uniformity degree. This work reviews the empirical approaches developed to characterize ultrasonic sprays, pointing to their limitations and focusing on the effect of liquid properties considering the need to design sprays with specific drop sizes, as in the case of the pharmaceutical industry. Afterwards, using the spray characterization data of ultrasonic sprays produced with different solvents and flow rates and provided by a Phase-Doppler Interferometer, the work introduces the implications of data redundancy in this laser diagnostic technique. Additionally, it compares the effect of regular versus variable bin widths when organizing drop size data through histograms.
The results presented first consider the effect of liquid properties and flow rate on drop size distributions and evidence the emergence of multimodal histograms for lower flow rates, which justifies the limits of using a proportional relation between a characteristic size and the capillary length to describe and design ultrasonic sprays. Additionally, the mathematical functions that best fitted the experimental results were the gamma and log-normal distributions, evidencing the atomization process as a cascade of events associated with the temporal evolution of instabilities in ligaments or randomness is sequential breakup events, respectively.
Considering representative () or characteristic () sizes, both liquid properties and flow rate affect the atomization outcome. Namely, solvents generating lower capillary lengths produced smaller droplets but less efficiently. Part of the new approaches for characterizing sprays includes the analysis of Drop Size Diversity with its polydispersion and heterogeneity degrees. This tool is particularly relevant in assessing the uniformity degree of ultrasonic sprays, i.e., how close is the atomization outcome to sprays of equal size droplets. The analysis evidences the higher sensibility of the polydispersion and heterogeneity degrees in Drop Size Diversity when using variable bin widths to build the histograms of drop size. As a result of this improvement in characterizing sprays, one concludes that lower flow rates induce a higher drop size diversity expressed by the multimodal drop size distributions.
Finally, one suggests as future work exploring why higher capillary lengths generate multimodal drop size distributions and whether one could alter this outcome by changing the forcing frequency. Additionally, a closer and detailed visualization of the atomization process could help better understand the relation between the nature of ultrasonic atomization breakup mechanisms and the nature of the mathematical probability functions that best describe the organization of spray data.
Funding
This research was funded by ADAI by projects UIDB/50022/2020 and UIDP/ 50022/2020.
Data Availability Statement
Besides the data available in this article, please contact the corresponding author for any additional data.
Acknowledgments
The author would like to acknowledge reviewers for their insightful comments that helped improve this manuscript.
Conflicts of Interest
The author declares no conflict of interest.
Abbreviations
The following abbreviations are used in this manuscript:
| DSDn | Drop Size Distributions |
| DSDy | Drop Size Diversity |
| KS | Kolmogorov–Smirnov |
| PDI | Phase-Doppler Interferometer |
Appendix A. Best Fitting Mathematical Probability Distributions
When adjusting a mathematical function to the discrete cumulative drop size distributions, only two functions passed the KS goodness-to-fit test, the Log-Normal Distribution function
and the Gamma Distribution function
Figure A1 synthesizes the characteristic parameters of the mathematical functions that best describe the experimental results. The best fitting means the ability to reconstruct the distribution for modeling purposes without losing information.
Figure A1.
Characteristic parameters of the mathematical probability functions that passed the KS goodness-to-fit test for all volumetric flow rates considered and fluids.
Figure A1.
Characteristic parameters of the mathematical probability functions that passed the KS goodness-to-fit test for all volumetric flow rates considered and fluids.

References
- Faraday, M. XVII. On a peculiar class of acoustical figures; and on certain forms assumed by groups of particles upon vibrating elastic surfaces. Philos. Trans. R. Soc. Lond. 1831, 121, 299–340. [Google Scholar]
- Strutt, J.W.; Rayleigh, J.W.S.B. The Theory of Sound; Macmillan: New York, NY, USA, 1894; Volume 1. [Google Scholar]
- Wood, R.W.; Loomis, A.L. XXXVIII. The physical and biological effects of high-frequency sound-waves of great intensity. Lond. Edinb. Dublin Philos. Mag. J. Sci. 1927, 4, 417–436. [Google Scholar] [CrossRef]
- Söllner, K. The mechanism of the formation of fogs by ultrasonic waves. Trans. Faraday Soc. 1936, 32, 1532–1536. [Google Scholar] [CrossRef]
- Boguslavski, Y. Physical mechanism of the acoustic atomization of a liquid. Sov. Phys. Acoust. 1969, 15, 14–21. [Google Scholar]
- Avvaru, B.; Patil, M.N.; Gogate, P.R.; Pandit, A.B. Ultrasonic atomization: Effect of liquid phase properties. Ultrasonics 2006, 44, 146–158. [Google Scholar] [CrossRef]
- Qi, A.; Yeo, L.Y.; Friend, J.R. Interfacial destabilization and atomization driven by surface acoustic waves. Phys. Fluids 2008, 20, 074103. [Google Scholar] [CrossRef] [Green Version]
- Lang, R.J. Ultrasonic atomization of liquids. J. Acoust. Soc. Am. 1962, 34, 6–8. [Google Scholar] [CrossRef]
- Donnelly, T.D.; Hogan, J.; Mugler, A.; Schommer, N.; Schubmehl, M.; Bernoff, A.J.; Forrest, B. An experimental study of micron-scale droplet aerosols produced via ultrasonic atomization. Phys. Fluids 2004, 16, 2843–2851. [Google Scholar] [CrossRef] [Green Version]
- Peskin, R.L.; Raco, R.J. Ultrasonic atomization of liquids. J. Acoust. Soc. Am. 1963, 35, 1378–1381. [Google Scholar] [CrossRef]
- Nedeljković, J.; Šaponjić, Z.; Rakočević, Z.; Jokanović, V.; Uskoković, D. Ultrasonic spray pyrolysis of TiO2 nanoparticles. Nanostruct. Mater. 1997, 9, 125–128. [Google Scholar] [CrossRef]
- Kooij, S.; Astefanei, A.; Corthals, G.L.; Bonn, D. Size distributions of droplets produced by ultrasonic nebulizers. Sci. Rep. 2019, 9, 1–8. [Google Scholar] [CrossRef]
- Paneva, R.; Temmel, G.; Burte, E.; Ryssel, H. Micromechanical ultrasonic liquid nebulizer. Sens. Actuators A Phys. 1997, 62, 765–767. [Google Scholar] [CrossRef]
- Mwakikunga, B.W. Progress in ultrasonic spray pyrolysis for condensed matter sciences developed from ultrasonic nebulization theories since michael faraday. Crit. Rev. Solid State Mater. Sci. 2014, 39, 46–80. [Google Scholar] [CrossRef] [Green Version]
- Li, M.; Fogler, H. Acoustic emulsification. Part 1. The instability of the oil-water interface to form the initial droplets. J. Fluid Mech. 1978, 88, 499–511. [Google Scholar] [CrossRef]
- Rajan, R.; Pandit, A.B. Correlations to predict droplet size in ultrasonic atomisation. Ultrasonics 2001, 39, 235–255. [Google Scholar] [CrossRef]
- Lozano, A.; Garcia, J.A.; Alconchel, J.; Barreras, F.; Calvo, E.; Santolaya, J.L. Ultrasonic Atomization of Alkanes and Alcohols. At. Sprays 2017, 27, 875–891. [Google Scholar] [CrossRef]
- Barreras, F.; Amaveda, H.; Lozano, A. Transient high-frequency ultrasonic water atomization. Exp. Fluids 2002, 33, 405–413. [Google Scholar] [CrossRef]
- Mizutani, Y.; Uga, Y.; Nishimoto, T. An investigation on ultrasonic atomization. Bull. JSME 1972, 15, 620–627. [Google Scholar] [CrossRef]
- Lacas, F.; Versaevel, P.; Scouflaire, P.; Coeur-Joly, G. Design and performance of an ultrasonic atomization system for experimental combustion applications. Part. Part. Syst. Charact. 1994, 11, 166–171. [Google Scholar] [CrossRef]
- Sindayihebura, D.; Dobre, M.; Bolle, L. Experimental study of thin liquid film ultrasonic atomization. In Proceedings of the 4th World Conference on Experimental Heat Transfer, Fluid Mechanics and Thermodynamics, Dubrovnik, Yugoslavia, Brussels, Belgium, 2–6 June 1997; Citeseer: Princeton, NJ, USA, 1997; pp. 1249–1256. [Google Scholar]
- Cousin, J.; Dumouchel, C.; Sindayihebura, D. Characterization of Sprays Produced by Low Frequency Ultrasonic Atomizers. Int. J. Fluid Mech. Res. 1997, 24, 544–555. [Google Scholar]
- Dalmoro, A.; Barba, A.A.; d’Amore, M. Analysis of size correlations for microdroplets produced by ultrasonic atomization. Sci. World J. 2013, 2013, 482910. [Google Scholar] [CrossRef]
- Yasuda, K.; Bando, Y.; Yamaguchi, S.; Nakamura, M.; Oda, A.; Kawase, Y. Analysis of concentration characteristics in ultrasonic atomization by droplet diameter distribution. Ultrason. Sonochem. 2005, 12, 37–41. [Google Scholar] [CrossRef] [PubMed]
- Lioubashevski, O.; Fineberg, J.; Tuckerman, L. Scaling of the transition to parametrically driven surface waves in highly dissipative systems. Phys. Rev. E 1997, 55, R3832. [Google Scholar] [CrossRef] [Green Version]
- Panão, M.R.O. Interpreting liquid atomization efficiency. Int. J. Eng. Technol. Inform. 2021, 2, 121–124. [Google Scholar]
- Dumouchel, C.; Sindayihebura, D.; Bolle, L. Application of the maximum entropy formalism on sprays produced by ultrasonic atomizers. Part. Part. Syst. Charact. Meas. Descr. Part. Prop. Behav. Powders Other Disperse Syst. 2003, 20, 150–161. [Google Scholar] [CrossRef]
- Panão, M.O.; Moita, A.S.; Moreira, A.L. On the Statistical Characterization of Sprays. Appl. Sci. 2020, 10, 6122. [Google Scholar] [CrossRef]
- Panão, M.; Moreira, A. A real-time assessment of measurement uncertainty in the experimental characterization of sprays. Meas. Sci. Technol. 2008, 19, 095402. [Google Scholar] [CrossRef]
- Gentry, J.; Cheng, S. The effect of special classes of collision kernels on the asymptotic behavior of aerosol size distributions undergoing coagulation. J. Aerosol Sci. 1996, 27, 519–535. [Google Scholar] [CrossRef]
- Zhang, Y.; Yuan, S.; Wang, L. Investigation of capillary wave, cavitation and droplet diameter distribution during ultrasonic atomization. Exp. Therm. Fluid Sci. 2021, 120, 110219. [Google Scholar] [CrossRef]
- Broniarz-Press, L.; Sosnowski, T.; Matuszak, M.; Ochowiak, M.; Jabłczyńska, K. The effect of shear and extensional viscosities on atomization of Newtonian and non-Newtonian fluids in ultrasonic inhaler. Int. J. Pharm. 2015, 485, 41–49. [Google Scholar] [CrossRef]
- Vukasinovic, B.; Smith, M.K.; Glezer, A. Mechanisms of free-surface breakup in vibration-induced liquid atomization. Phys. Fluids 2007, 19, 012104. [Google Scholar] [CrossRef]
- Villermaux, E. Fragmentation. Annu. Rev. Fluid Mech. 2007, 39, 419–446. [Google Scholar] [CrossRef]
- Kottler, F. The distribution of particle sizes. J. Frankl. Inst. 1950, 250, 339–356. [Google Scholar] [CrossRef]
- Sowa, W. Interpreting mean drop diameters using distribution moments. At. Sprays 1992, 2, 1–15. [Google Scholar] [CrossRef]
Figure 1.
Photo of the experimental setup and PDI measurement volume (left). Variation of the capillary Faraday wavelength () for each fluid at the ultrasonic frequency used of 35 kHz (right).
Figure 1.
Photo of the experimental setup and PDI measurement volume (left). Variation of the capillary Faraday wavelength () for each fluid at the ultrasonic frequency used of 35 kHz (right).

Figure 2.
Example of the counts of unique drop sizes (1355) in a 12,000 sample.

Figure 3.
Comparison between the cumulative drop size distributions of the integer part and the full value including the decimal part. A Kolmogorov–Smirnov test with shows that both samples belong to the same distribution.
Figure 3.
Comparison between the cumulative drop size distributions of the integer part and the full value including the decimal part. A Kolmogorov–Smirnov test with shows that both samples belong to the same distribution.

Figure 4.
Example of adding redundancy to drop sizes to overcome the limitation in measurement resolution and obtain samples values closer to what one expects from a random process, such as forming a spray.
Figure 4.
Example of adding redundancy to drop sizes to overcome the limitation in measurement resolution and obtain samples values closer to what one expects from a random process, such as forming a spray.

Figure 5.
Volume-weighted drop size distributions for acetone (red) and water (blue) comparing regular (thin line) with variable (thick line) class sizes for the volumetric flow rate of mL/min.
Figure 5.
Volume-weighted drop size distributions for acetone (red) and water (blue) comparing regular (thin line) with variable (thick line) class sizes for the volumetric flow rate of mL/min.

Figure 6.
Volume-weighted probability density (left) and cumulative (right) drop size distributions for all fluids considered and a volumetric flow rate of mL/min.
Figure 6.
Volume-weighted probability density (left) and cumulative (right) drop size distributions for all fluids considered and a volumetric flow rate of mL/min.

Figure 7.
Volume-weighted cumulative drop size distributions for each fluid and volumetric flow rates of 10–50 mL/min, with 10 mL/min intervals.
Figure 7.
Volume-weighted cumulative drop size distributions for each fluid and volumetric flow rates of 10–50 mL/min, with 10 mL/min intervals.

Figure 8.
Effect of volumetric flow rate in the normalized number median diameter ( and the capillary wavelength defined for ultrasonic atomization by Faraday waves according to Lang [8]) for all fluids considered.
Figure 8.
Effect of volumetric flow rate in the normalized number median diameter ( and the capillary wavelength defined for ultrasonic atomization by Faraday waves according to Lang [8]) for all fluids considered.

Figure 9.
Effect of volumetric flow rate in the Sauter mean diameter for all fluids considered.

Figure 10.
Effect of volumetric flow rate in the atomization efficiency () for all fluids considered.
Figure 10.
Effect of volumetric flow rate in the atomization efficiency () for all fluids considered.

Figure 11.
Drop Size Diversity (polydispersion——and heterogeneity——degrees) of the ultrasonic sprays for all fluids considered.
Figure 11.
Drop Size Diversity (polydispersion——and heterogeneity——degrees) of the ultrasonic sprays for all fluids considered.

Figure 12.
Effect of increasing bimodality of a drop size distribution on DSDy polydispersion and heterogeneity degrees.
Figure 12.
Effect of increasing bimodality of a drop size distribution on DSDy polydispersion and heterogeneity degrees.

Figure 13.
Effect of the volumetric flow rate on the DSDy polydispersion degree ().

Figure 14.
Effect of the volumetric flow rate on the DSDy heterogeneity degree ().


Table 1.
Thermophysical properties of the atomized liquids at 35 °C.
| Liquid | Density | Kinematic Viscosity | Surface Tension |
|---|---|---|---|
| Water | 994 | 72.4 | 70.4 |
| Water − 10% Ethanol | 973.8 | 76.7 | 65.6 |
| Water − 20% Ethanol | 953.6 | 81.0 | 60.6 |
| Acetone | 773.4 | 47.2 | 21.8 |
Publisher’s Note: MDPI stays neutral with regard to jurisdictional claims in published maps and institutional affiliations. |
© 2022 by the author. Licensee MDPI, Basel, Switzerland. This article is an open access article distributed under the terms and conditions of the Creative Commons Attribution (CC BY) license (https://creativecommons.org/licenses/by/4.0/).
Share and Cite
MDPI and ACS Style
Panão, M. Ultrasonic Atomization: New Spray Characterization Approaches. Fluids 2022, 7, 29. https://doi.org/10.3390/fluids7010029
AMA Style
Panão M. Ultrasonic Atomization: New Spray Characterization Approaches. Fluids. 2022; 7(1):29. https://doi.org/10.3390/fluids7010029
Chicago/Turabian StylePanão, Miguel. 2022. "Ultrasonic Atomization: New Spray Characterization Approaches" Fluids 7, no. 1: 29. https://doi.org/10.3390/fluids7010029