
State-of-the-Art of Analytical Techniques to Determine Food Fraud in Olive Oils

 ,
,  , , , ,
  and
and 
Abstract
: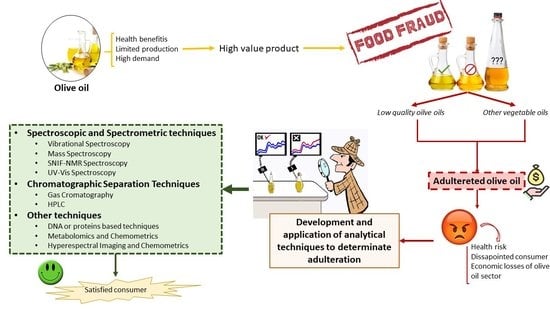
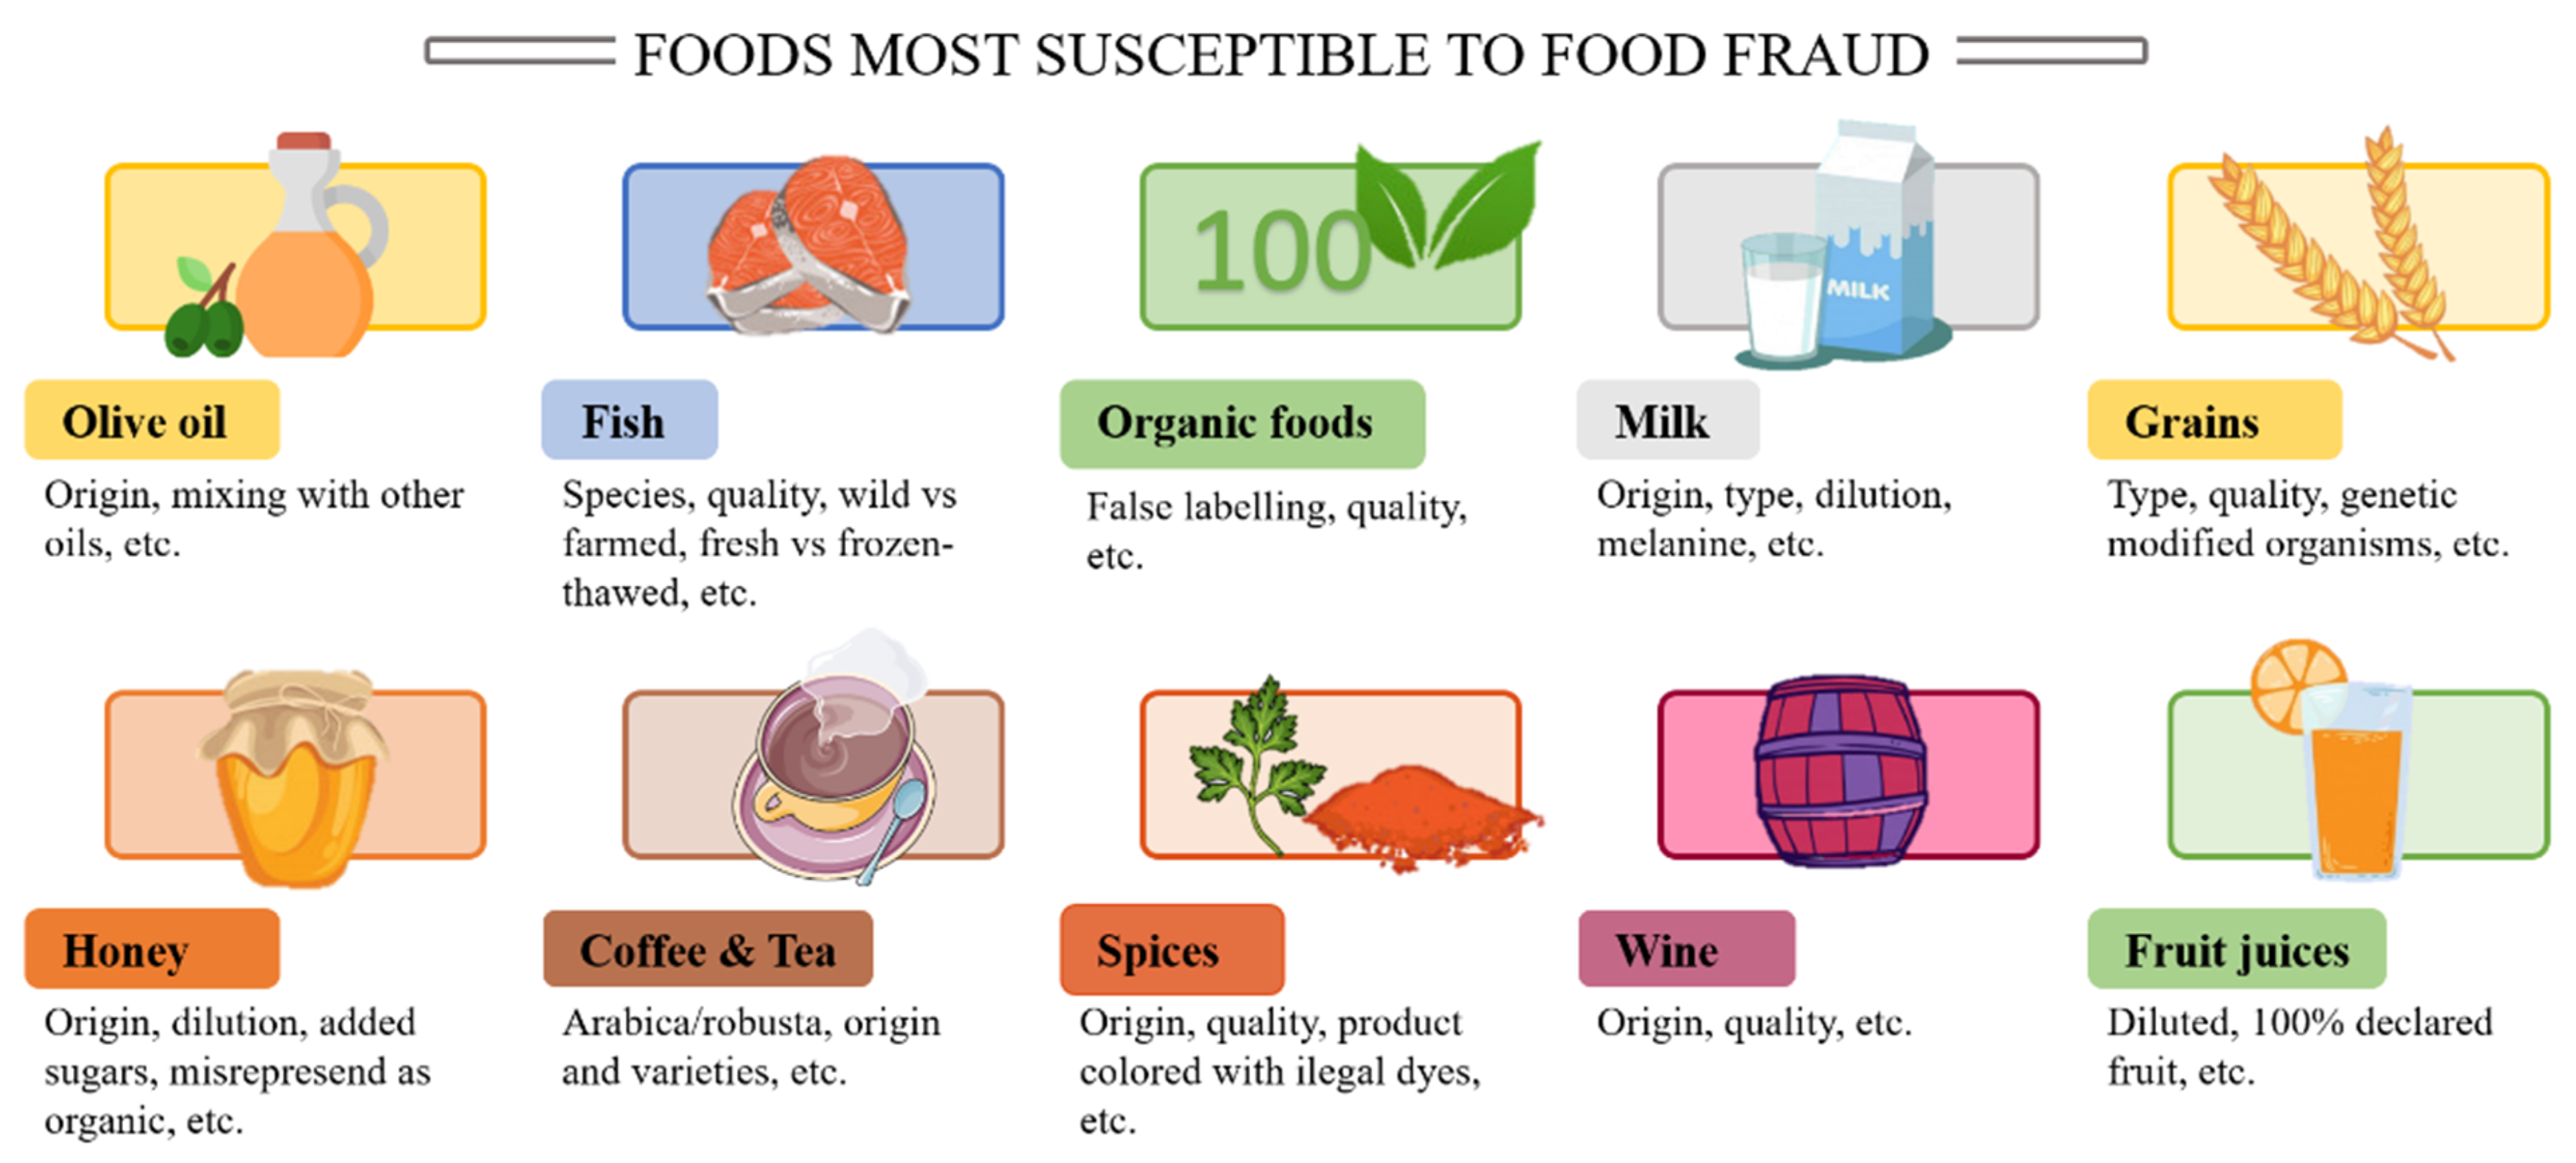
1. Introduction
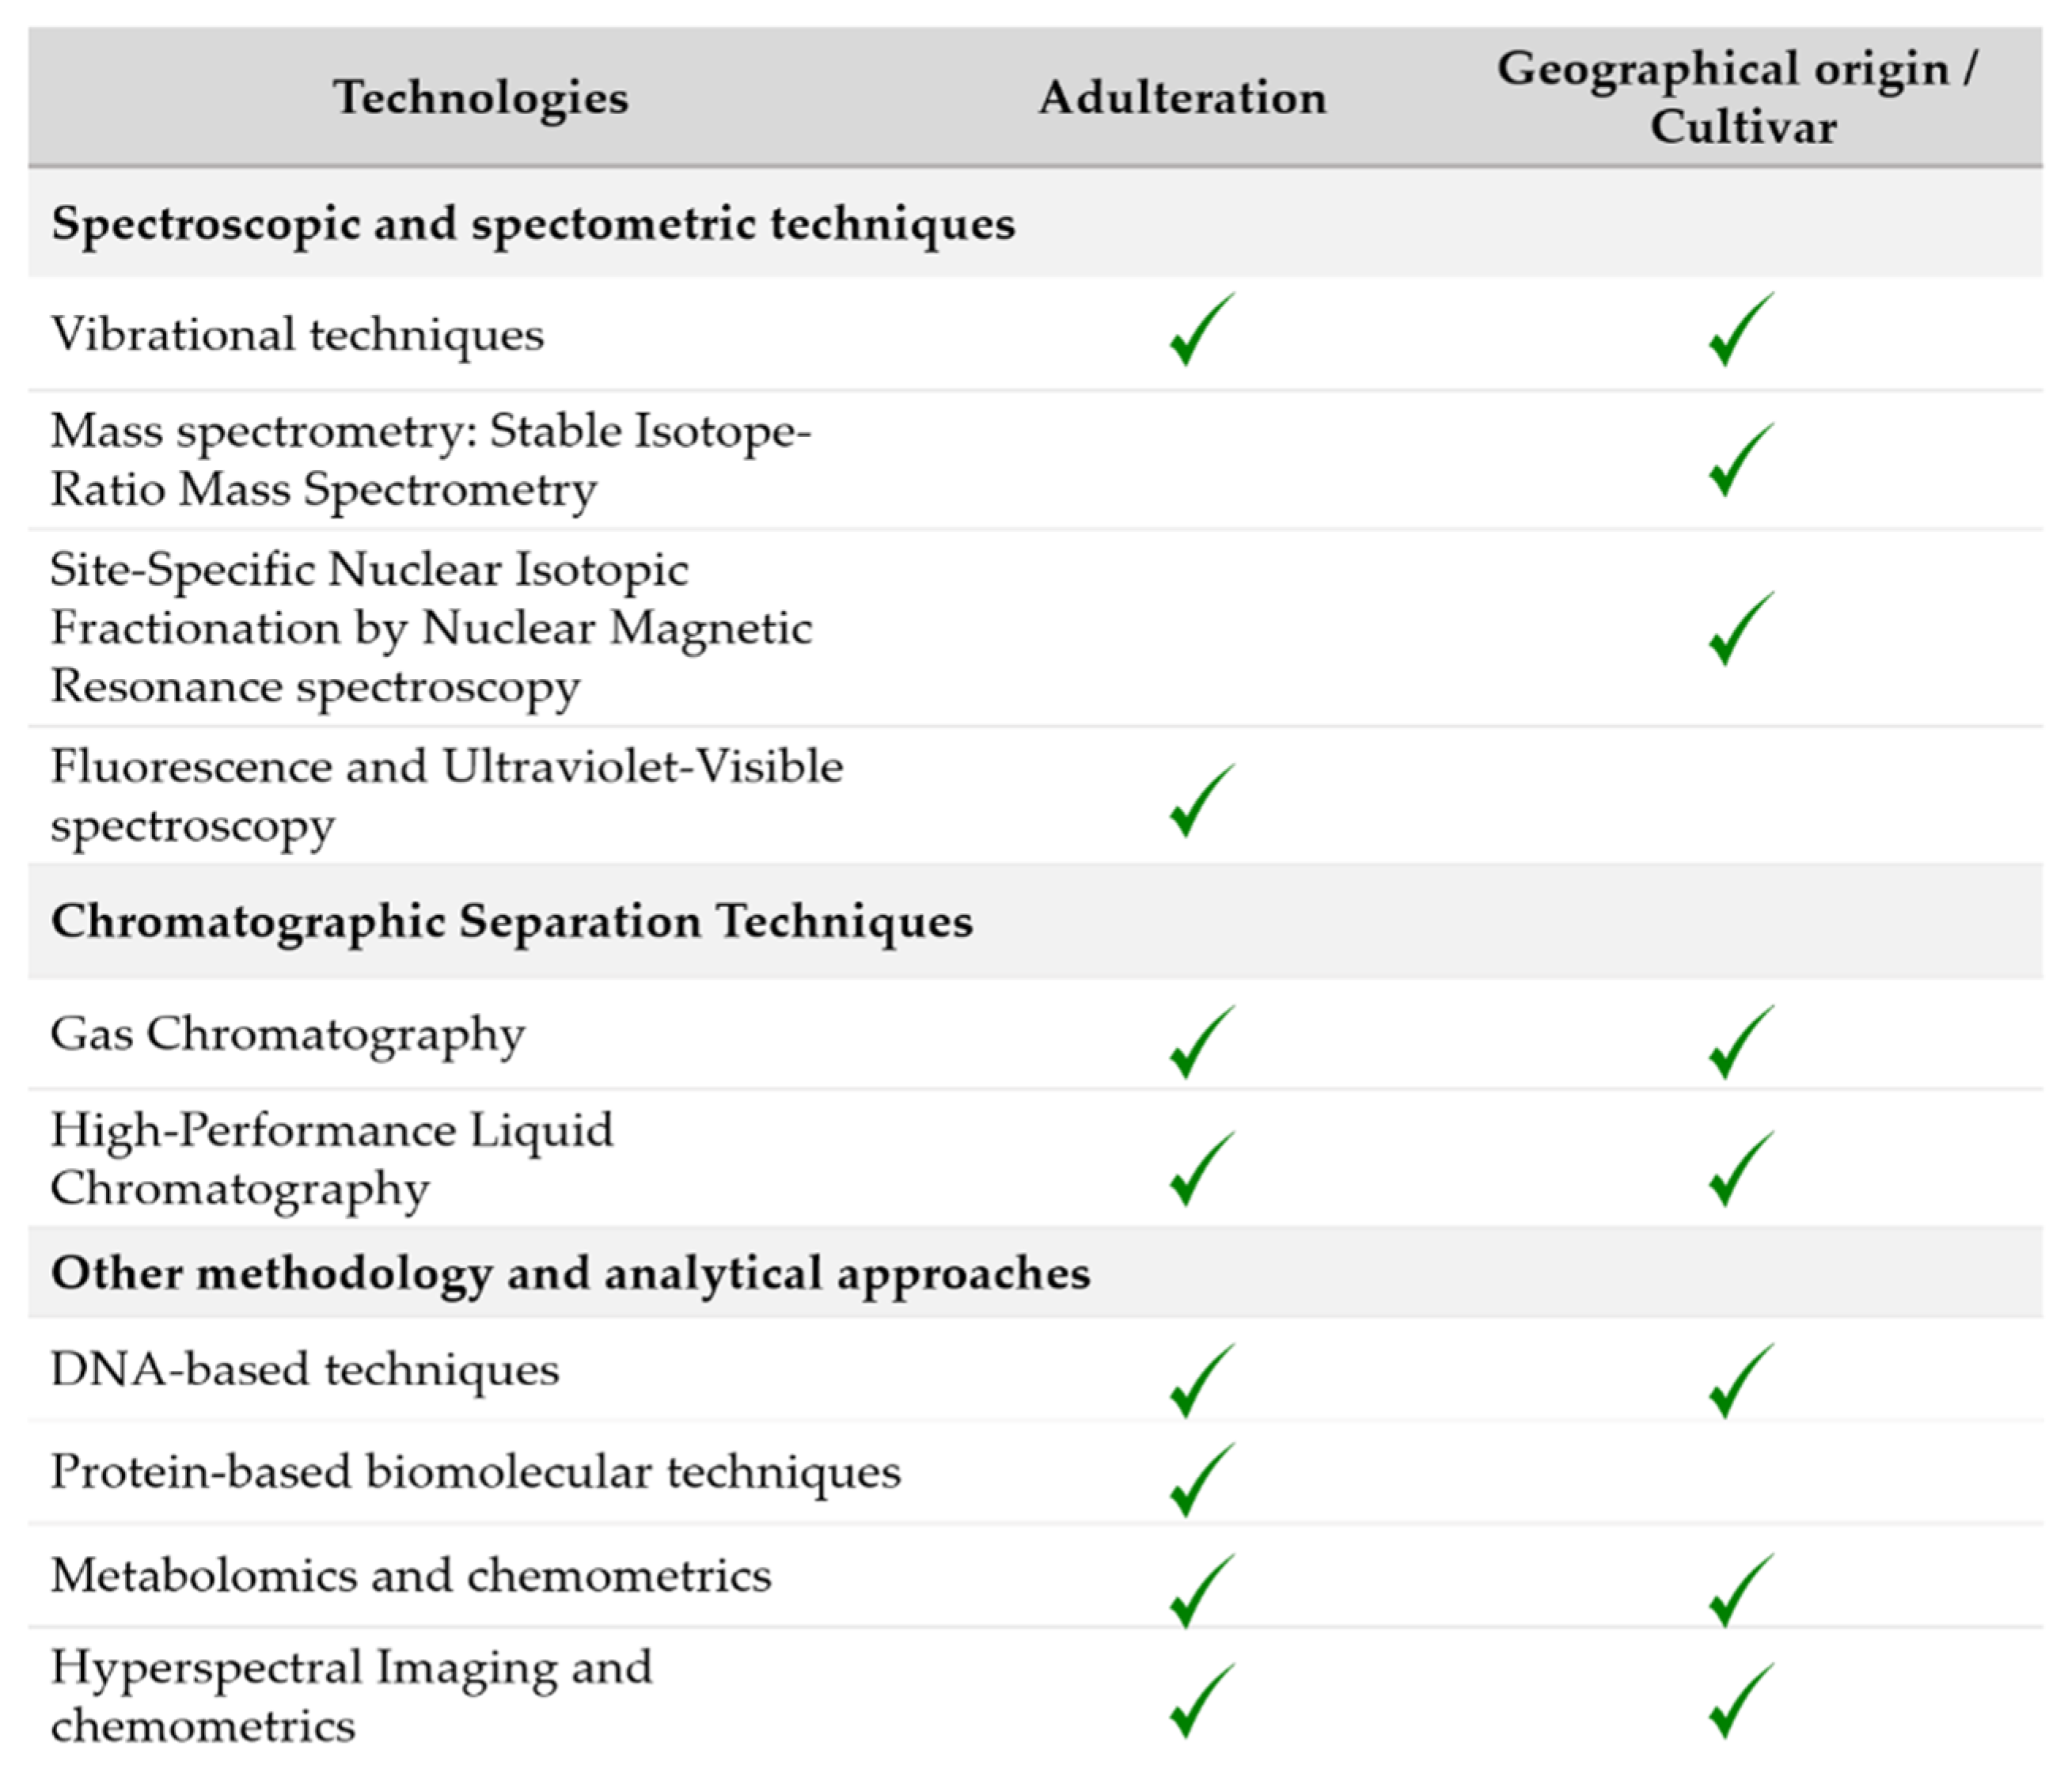
2. Spectroscopic and Spectrometric Techniques
2.1. Vibrational Spectroscopy
2.1.1. Fourier Transform Infrared Spectroscopy
2.1.2. Fourier Transform Near-Infrared Spectroscopy
2.1.3. Raman Spectroscopy
2.2. Mass Spectrometry: Stable Isotope-Ratio Mass Spectrometry (IRMS)
2.3. Site-Specific Nuclear Isotopic Fractionation by Nuclear Magnetic Resonance (SNIF-NMR) Spectroscopy
2.4. Fluorescence and Ultraviolet-Visible (UV-Vis) Spectroscopy
3. Chromatographic Separation Techniques
3.1. Gas Chromatography (GC)
3.2. High-Performance Liquid Chromatography (HPLC)
4. Other Methodology and Analytical Approaches
4.1. DNA-Based Techniques
4.2. Protein-Based Biomolecular Techniques
4.3. Metabolomics and Chemometrics
4.4. Hyperspectral Imaging and Chemometrics
5. Conclusions
Author Contributions
Funding
Institutional Review Board Statement
Informed Consent Statement
Data Availability Statement
Acknowledgments
Conflicts of Interest
References
- Robson, K.; Dean, M.; Haughey, S.; Elliott, C. A comprehensive review of food fraud terminologies and food fraud mitigation guides. Food Control 2021, 120, 107516. [Google Scholar] [CrossRef]
- Manning, L. Food fraud: Policy and food chain. Curr. Opin. Food Sci. 2016, 10, 16–21. [Google Scholar] [CrossRef]
- Casadei, E.; Valli, E.; Panni, F.; Donarski, J.; Gubern, J.F.; Lucci, P.; Conte, L.; Lacoste, F.; Maquet, A.; Brereton, P.; et al. Emerging trends in olive oil fraud and possible countermeasures. Sci. Total Environ. 2019, 124, 135907. [Google Scholar]
- Yan, J.; Erasmus, S.W.; Aguilera Toro, M.; Huang, H.; van Ruth, S.M. Food fraud: Assessing fraud vulnerability in the extra virgin olive oil supply chain. Food Control 2020, 111, 107081. [Google Scholar] [CrossRef]
- Oueslati, I.; Djebali, H.M.; Mhamdi, R. Use of Phytosterols as a Tool for the Authenticity Assessment of Virgin Olive Oil: Protection of the Olive Oil Market. In Sterols: Types, Classification and Structure; Jimenez, S., Ed.; Nova Science Publishers: Hauppauge, NY, USA, 2020. [Google Scholar]
- Angerosa, F.; Campestre, C.; Glasante, L. Analysis and authentication. In Olive Oil, Chemistry and Technology; AOCS Press: Urbana, IL, USA, 2006; pp. 113–172. [Google Scholar]
- Blanch, G.; Caja, M.; León, M.; Herraiz, M. Determination of (E)-5-methylhept-2-en-4-one in deodorised hazelnut oil. Application to the detection of adulterated olive oils. J. Sci. Food Agric. 2000, 80, 140–144. [Google Scholar] [CrossRef]
- Yang, R.; Xue, L.; Zhang, L.; Wang, X.; Qi, X.; Jiang, J.; Yu, L.; Wang, X.; Zhang, W.; Zhang, Q.; et al. Phytosterol contents of edible oils and their contributions to estimated phytosterol intake in the Chinese diet. Foods 2019, 8, 334. [Google Scholar] [CrossRef] [Green Version]
- Azadmard-Damirchi, S.; Torbati, M. Adulterations in some edible oils and fats and their detection methods. J. Food Qual. Hazards Control 2015, 2, 38–44. [Google Scholar]
- Guillaume, C.; Miller, P.; Cantrill, R. Fraud in fats and oils. In Food Fraud: A Global Threat with Public Health and Economic Consequences, 1st ed.; Hellberg, R.S., Everstine, K., Sklare, S.A., Eds.; Elsevier Australia: Melbourne, Australia, 2021; pp. 151–176. ISBN 9780128172421. [Google Scholar]
- McGrath, T.F.; Haughey, S.A.; Patterson, J.; Fauhl-Hassek, C.; Donarski, J.; Alewijn, M.; van Ruth, S.; Elliott, C.T. What are the scientific challenges in moving from targeted to non-targeted methods for food fraud testing and how can they be addressed?—Spectroscopy case study. Trends Food Sci. Technol. 2018, 76, 38–55. [Google Scholar] [CrossRef]
- Meenu, M.; Cai, Q.; Xu, B. A critical review on analytical techniques to detect adulteration of extra virgin olive oil. Trends Food Sci. Technol. 2019, 91, 391–408. [Google Scholar] [CrossRef]
- Danezis, G.P.; Tsagkaris, A.S.; Camin, F.; Brusic, V.; Georgiou, C.A. Food authentication: Techniques, trends & emerging approaches. Trends Anal. Chem. 2016, 85, 123–132. [Google Scholar]
- Li, X.; Zhang, L.; Zhang, Y.; Wang, D.; Wang, X.; Yu, L.; Zhang, W.; Li, P. Review of NIR spectroscopy methods for nondestructive quality analysis of oilseeds and edible oils. Trends Food Sci. Technol. 2020, 101, 172–181. [Google Scholar] [CrossRef]
- Jimenez-Lopez, C.; Carpena, M.; Lourenço-Lopes, C.; Gallardo-Gomez, M.; Lorenzo, J.M.; Barba, F.J.; Prieto, M.A.; Simal-Gandara, J. Bioactive compounds and Quality of Extra Virgin Olive Oil. Foods 2020, 9, 1014. [Google Scholar] [CrossRef]
- Mendes, T.O.; da Rocha, R.A.; Porto, B.L.S.; de Oliveira, M.A.L.; dos Anjos, V.d.C.; Bell, M.J.V. Quantification of Extra-virgin Olive Oil Adulteration with Soybean Oil: A Comparative Study of NIR, MIR, and Raman Spectroscopy Associated with Chemometric Approaches. Food Anal. Methods 2015, 8, 2339–2346. [Google Scholar] [CrossRef]
- Yang, H.; Irudayaraj, J. Comparison of near-infrared, Fourier transform-infrared, and Fourier transform-Raman methods for determining olive pomace oil adulteration in extra virgin olive oil. J. Am. Oil Chem. Soc. 2001, 78, 889–895. [Google Scholar] [CrossRef]
- Christy, A.A.; Kasemsumran, S.; Du, Y.; Ozaki, Y. The detection and quantification of adulteration in olive oil by near-infrared spectroscopy and chemometrics. Anal. Sci. 2004, 20, 935–940. [Google Scholar] [CrossRef] [Green Version]
- Downey, G.; McIntyre, P.; Davies, A.N. Detecting and quantifying sunflower oil adulteration in extra virgin olive oils from the Eastern Mediterranean by visible and near-infrared spectroscopy. J. Agric. Food Chem. 2002, 50, 5520–5525. [Google Scholar] [CrossRef]
- Azizian, H.; Mossoba, M.M.; Fardin-Kia, A.R.; Delmonte, P.; Karunathilaka, S.R.; Kramer, J.K.G. Novel, rapid identification, and quantification of adulterants in extra virgin olive oil using near-infrared spectroscopy and chemometrics. Lipids 2015, 50, 705–718. [Google Scholar] [CrossRef] [PubMed]
- Lerma-García, M.J.; Ramis-Ramos, G.; Herrero-Martínez, J.M.; Simó-Alfonso, E.F. Authentication of extra virgin olive oils by Fourier-transform infrared spectroscopy. Food Chem. 2010, 118, 78–83. [Google Scholar] [CrossRef]
- Vasconcelos, M.; Coelho, L.; Barros, A.; de Almeida, J.M.M.M. Study of adulteration of extra virgin olive oil with peanut oil using FTIR spectroscopy and chemometrics. Cogent Food Agric. 2015, 1, 1018695. [Google Scholar] [CrossRef]
- Li, X.; Wang, S.; Shi, W.; Shen, Q. Partial Least Squares Discriminant Analysis Model Based on Variable Selection Applied to Identify the Adulterated Olive Oil. Food Anal. Methods 2016, 9, 1713–1718. [Google Scholar] [CrossRef]
- Ozen, B.F.; Mauer, L.J. Detection of hazelnut oil adulteration using FT-IR spectroscopy. J. Agric. Food Chem. 2002, 50, 3898–3901. [Google Scholar] [CrossRef] [PubMed]
- Rohman, A.; Man, Y.B.C. Fourier transform infrared (FTIR) spectroscopy for analysis of extra virgin olive oil adulterated with palm oil. Food Res. Int. 2010, 43, 886–892. [Google Scholar] [CrossRef]
- Liang, P.; Wang, H.; Chen, C.; Ge, F.; Liu, D.; Li, S.; Han, B.; Xiong, X.; Zhao, S. The use of fourier transform infrared spectroscopy for quantification of adulteration in virgin walnut oil. J. Spectrosc. 2013, 1. [Google Scholar] [CrossRef]
- Hirri, A.; Gammouh, M.; Gorfti, A.; Kzaiber, F.; Bassbasi, M.; Souhassou, S.; Balouki, A.; Oussama, A. The use of Fourier transform mid infrared (FT-MIR) spectroscopy for detection and estimation of extra virgin olive oil adulteration with old olive oil. Sky J. Food Sci. 2015, 4, 60–66. [Google Scholar]
- Gurdeniz, G.; Ozen, B. Detection of adulteration of extra-virgin olive oil by chemometric analysis of mid-infrared spectral data. Food Chem. 2009, 116, 519–525. [Google Scholar] [CrossRef] [Green Version]
- Zou, M.Q.; Zhang, X.F.; Xiao-Hua, Q.I.; Han-Lu, M.; Dong, Y.; Chun-Wei, L.I.U.; Guo, X.U.N.; Wang, H. Rapid authentication of olive oil adulteration by raman spectrometry. J. Agric. Food Chem. 2009, 57, 6001–6006. [Google Scholar] [CrossRef]
- Heise, H.M.; Damm, U.; Lampen, P.; Davies, A.N.; Mcintyre, P.S. Spectral variable selection for partial least squares calibration applied to authentication and quantification of extra virgin olive oils using Fourier transform Raman spectroscopy. Appl. Spectrosc. 2005, 59, 1286–1294. [Google Scholar] [CrossRef]
- Zhang, X.-F.; Zou, M.-Q.; Qi, X.-H.; Liu, F.; Zhang, C.; Yin, F. Quantitative detection of adulterated olive oil by Raman spectroscopy and chemometrics. J. Raman Spectrosc. 2011, 42, 1784–1788. [Google Scholar] [CrossRef]
- Li, Y.; Fang, T.; Zhu, S.; Huang, F.; Chen, Z.; Wang, Y. Detection of olive oil adulteration with waste cooking oil via Raman spectroscopy combined with iPLS and SiPLS. Spectrochim. Acta Part A Mol. Biomol. Spectrosc. 2018, 189, 37–43. [Google Scholar] [CrossRef]
- Torrecilla, J.S.; Rojo, E.; Domínguez, J.C.; Rodríguez, F. A novel method to quantify the adulteration of extra virgin olive oil with low-grade olive oils by UV-Vis. J. Agric. Food Chem. 2010, 5, 1679–1684. [Google Scholar] [CrossRef]
- Tan, J.; Li, R.; Jiang, Z.T.; Tang, S.H.; Wang, Y.; Shi, M.; Xiao, Y.Q.; Jia, B.; Lu, T.X.; Wang, H. Synchronous front-face fluorescence spectroscopy for authentication of the adulteration of edible vegetable oil with refined used frying oil. Food Chem. 2017, 217, 274–280. [Google Scholar] [CrossRef]
- Dankowska, A.; Małecka, M. Application of synchronous fluorescence spectroscopy for determination of extra virgin olive oil adulteration. Eur. J. Lipid Sci. Technol. 2009, 111, 1233–1239. [Google Scholar] [CrossRef]
- Fragaki, G.; Spyros, A.; Siragakis, G.; Salivaras, E.; Dais, P. Detection of extra virgin olive oil adulteration with lampante olive oil and refined olive oil using nuclear magnetic resonance spectroscopy and multivariate statistical analysis. J. Agric. Food Chem. 2005, 53, 2810–2816. [Google Scholar] [CrossRef]
- Šmejkalová, D.; Piccolo, A. High-power gradient diffusion NMR spectroscopy for the rapid assessment of extra-virgin olive oil adulteration. Food Chem. 2010, 118, 153–158. [Google Scholar] [CrossRef]
- Fraga-Corral, M.; Carpena, M.; Garcia-Oliveira, P.; Pereira, A.G.; Prieto, M.A.; Simal-Gandara, J. Analytical Metabolomics and Applications in Health, Environmental and Food Science. Crit. Rev. Anal. Chem. 2020, 1–23. [Google Scholar] [CrossRef] [PubMed]
- Yang, H.; Irudayaraj, J.; Paradkar, M.M. Discriminant analysis of edible oils and fats by FTIR, FT-NIR and FT-Raman spectroscopy. Food Chem. 2005, 93, 25–32. [Google Scholar] [CrossRef]
- Tay, A.; Singh, R.K.; Krishnan, S.S.; Gore, J.P. Authentication of olive oil adulterated with vegetable oils using Fourier transform infrared spectroscopy. LWT Food Sci. Technol. 2002, 35, 99–103. [Google Scholar] [CrossRef]
- Ozen, B.F.; Weiss, I.; Mauer, L.J. Dietary supplement oil classification and detection of adulteration using fourier transform infrared spectroscopy. J. Agric. Food Chem. 2003, 51, 5871–5876. [Google Scholar] [CrossRef]
- Vermeulen, P.; Fernandez Pierna, J.A.; Abbas, O.; Rogez, H.; Davrieux, F.; Baeten, V. Authentication and traceability of agricultural and food products using vibrational spectroscopy. In Food Traceability and Authenticity: Analytical Techniques; Montet, D., Ray, R.C., Eds.; CRC Press: Boca Raton, FL, USA, 2017; p. 450. [Google Scholar]
- Manley, M.; Baeten, V. Spectroscopic Technique: Near Infrared (NIR) Spectroscopy. In Modern Techniques for Food Authentication; Academic Press: Cambridge, MA, USA, 2018; pp. 51–102. ISBN 9780128142646. [Google Scholar]
- Cozzolino, D. Near infrared spectroscopy in natural products analysis. Planta Med. 2009, 75, 746–756. [Google Scholar] [CrossRef] [PubMed] [Green Version]
- Peng, Y.; Wang, W. Application of Near-infrared Spectroscopy for Assessing Meat Quality and Safety. In Infrared Spectroscopy—Anharmonicity of Biomolecules, Crosslinking of Biopolymers, Food Quality and Medical Applications; Theophanides, T., Ed.; InTech: London, UK, 2015. [Google Scholar]
- Van de Voort, F.R.; Sedman, J. FTIR spectroscopy—the next generation of oil analysis methodologies? Inform 2000, 11, 614–620. [Google Scholar]
- Fernández Pierna, J.A.; Manley, M.; Dardenne, P.; Downey, G.; Baeten, V. Spectroscopic Technique: Fourier Transform (FT) Near-Infrared Spectroscopy (NIR) and Microscopy (NIRM); Academic Press: Cambridge, MA, USA, 2018; ISBN 9780128142646. [Google Scholar]
- Karoui, R.; De Baerdemaeker, J. A review of the analytical methods coupled with chemometric tools for the determination of the quality and identity of dairy products. Food Chem. 2007, 102, 621–640. [Google Scholar] [CrossRef]
- Sato, T.; Kawano, S.; Iwamoto, M. Near infrared spectral patterns of fatty acid analysis from fats and oils. J. Am. Oil Chem. Soc. 1991, 68, 827–833. [Google Scholar] [CrossRef]
- Bruker. Edible Oils and Fats: FT-NIR analyzers for QC in the Lab and Production, 2015. Bruker. Available online: https://www.bruker.com/content/bruker/int/en/meta/fileadmin.html?q=Oil_NIR_Brochure_EN.pdf (accessed on 11 February 2021).
- Azizian, H.; Kramer, J.K.G. A rapid method for the quantification of fatty acids in fats and oils with emphasis on trans fatty acids using fourier transform near infrared spectroscopy (FT-NIR). Lipids 2005, 40, 855–867. [Google Scholar] [CrossRef] [PubMed]
- Özdemir, D.; Öztürk, B. Near infrared spectroscopic determination of olive oil adulteration with sunflower and corn oil. J. Food Drug Anal. 2007, 15, 40–47. [Google Scholar]
- Jiang, H.; Chen, Q. Determination of adulteration content in extra virgin olive oil using FT-NIR spectroscopy combined with the BOSS–PLS algorithm. Molecules 2019, 24, 2134. [Google Scholar] [CrossRef] [PubMed] [Green Version]
- Kasemsumran, S.; Kang, N.; Christy, A.; Ozaki, Y. Partial least squares processing of near-infrared spectra for discrimination and quantification of adulterated olive oils. Spectrosc. Lett. 2005, 38, 839–851. [Google Scholar] [CrossRef]
- Li, H.; Van De Voort, F.R.; Ismail, A.A.; Cox, R. Determination of peroxide value by Fourier transform near-infrared spectroscopy. JAOCS J. Am. Oil Chem. Soc. 2000, 77, 137–142. [Google Scholar] [CrossRef]
- Li, H.; Van De Voort, F.R.; Sedman, J.; Ismail, A.A. Rapid determination of cis and trans content, iodine value, and saponification number of edible oils by Fourier transform near-infrared spectroscopy. JAOCS J. Am. Oil Chem. Soc. 1999, 76, 491–497. [Google Scholar] [CrossRef]
- Li, H.; Van De Voort, F.R.; Ismail, A.A.; Sedman, J.; Cox, R. Trans determination of edible oils by Fourier transform near-infrared spectroscopy. JAOCS J. Am. Oil Chem. Soc. 2000, 77, 1061–1067. [Google Scholar] [CrossRef]
- Marzi, J.; Brauchle, E.; Carvajal Berrio, D.A.; Lee Layland, S.; Schenke-Layland, K. 3.7 Raman spectroscopy. In Comprehensive Biomaterials IICompr. Biomater. II.; Elsevier: Amsterdam, The Netherlands, 2017; Volume 3, pp. 108–127. ISBN 9780081006917. [Google Scholar]
- Everall, N.J. Confocal Raman microscopy: Common errors and artefacts. Analyst 2010, 135, 2512–2522. [Google Scholar] [CrossRef]
- Wang, P.; Sun, J.; Zhang, T.; Liu, W. Vibrational spectroscopic approaches for the quality evaluation and authentication of virgin olive oil. Appl. Spectrosc. Rev. 2016, 51, 763–790. [Google Scholar] [CrossRef]
- Georgouli, K.; Martinez Del Rincon, J.; Koidis, A. Continuous statistical modelling for rapid detection of adulteration of extra virgin olive oil using mid infrared and Raman spectroscopic data. Food Chem. 2017, 217, 735–742. [Google Scholar] [CrossRef] [PubMed] [Green Version]
- Portarena, S.; Baldacchini, C.; Brugnoli, E. Geographical discrimination of extra-virgin olive oils from the Italian coasts by combining stable isotope data and carotenoid content within a multivariate analysis. Food Chem. 2017, 215, 1–6. [Google Scholar] [CrossRef] [PubMed]
- Dong, W.; Zhang, Y.; Zhang, B.; Wang, X. Quantitative analysis of adulteration of extra virgin olive oil using Raman spectroscopy improved by Bayesian framework least squares support vector machines. Anal. Methods 2012, 4, 2772–2777. [Google Scholar] [CrossRef]
- Yildiz Tiryaki, G.; Ayvaz, H. Quantification of soybean oil adulteration in extra virgin olive oil using portable raman spectroscopy. J. Food Meas. Charact. 2017, 11, 523–529. [Google Scholar] [CrossRef]
- López-Díez, E.C.; Bianchi, G.; Goodacre, R. Rapid quantitative assessment of the adulteration of virgin olive oils with hazelnut oils using Raman spectroscopy and chemometrics. J. Agric. Food Chem. 2003, 51, 6145–6150. [Google Scholar] [CrossRef]
- Barthus, R.C.; Poppi, R.J. Determination of the total unsaturation in vegetable oils by Fourier transform Raman spectroscopy and multivariate calibration. Vib. Spectrosc. 2001, 26, 99–105. [Google Scholar] [CrossRef]
- Portarena, S.; Anselmi, C.; Zadra, C.; Farinelli, D.; Famiani, F.; Baldacchini, C.; Brugnoli, E. Cultivar discrimination, fatty acid profile and carotenoid characterization of monovarietal olive oils by Raman spectroscopy at a single glance. Food Control 2019, 96, 137–145. [Google Scholar] [CrossRef]
- Gouvinhas, I.; Machado, N.; Carvalho, T.; De Almeida, J.M.M.M.; Barros, A.I.R.N.A. Short wavelength Raman spectroscopy applied to the discrimination and characterization of three cultivars of extra virgin olive oils in different maturation stages. Talanta 2015, 132, 829–835. [Google Scholar] [CrossRef] [PubMed] [Green Version]
- Bianchi, F.; Careri, M. Mass spectrometry in food authenticity and traceability. In Food Authentication and Traceability, 1st ed.; Galanakis, C.M., Ed.; Academic Press: Cambridge, MA, USA, 2020; pp. 101–130. ISBN 9780128211045. [Google Scholar]
- Muccio, Z.; Jackson, G. Isotope Ratio Mass Spectrometry. Analyst 2009, 134, 213–222. [Google Scholar] [CrossRef]
- Royer, A.; Gerard, C.; Naulet, N.; Lees, M.; Martin, G.J. Stable isotope characterization of olive oils. I-Compositional and carbon-13 profiles of fatty acids. J. Am. Oil Chem. Soc. 1999, 76, 357–363. [Google Scholar] [CrossRef]
- Spangenberg, J.E.; Macko, S.A.; Hunziker, J. Characterization of Olive Oil by Carbon Isotope Analysis of Individual Fatty Acids: Implications for Authentication. J. Agric. Food Chem. 1998, 46, 4179–4184. [Google Scholar] [CrossRef]
- Spangenberg, J.E.; Ogrinc, N. Authentication of vegetable oils by bulk and molecular carbon isotope analyses with emphasis on olive oil and pumpkin seed oil. J. Agric. Food Chem. 2001, 49, 1534–1540. [Google Scholar] [CrossRef]
- Jung, J.; Puff, B.; Eberts, T.; Hener, U.; Mosandl, A. Reductive ester cleavage of acyl glycerides-GC-C/P-IRMS measurements of glycerol and fatty alcohols. Eur. Food Res. Technol. 2007, 225, 191–197. [Google Scholar] [CrossRef]
- Baum, A.; Lu, Y.; Muccio, Z.; Jackson, G.P.; Harrington, P.B. Differentiation between origins of extra virgin olive oils by GC-C-IRMS using principal component analysis, linear discriminant analysis, and hierarchical cluster analysis. Spectrosc. 2010, 25, 40–47. [Google Scholar]
- Bontempo, L.; Paolini, M.; Franceschi, P.; Ziller, L.; García-González, D.L.; Camin, F. Characterisation and attempted differentiation of European and extra-European olive oils using stable isotope ratio analysis. Food Chem. 2019, 276, 782–789. [Google Scholar] [CrossRef]
- Jiménez-Morillo, N.T.; Palma, V.; Garcia, R.; Pereira, J.A.; Dias, C.B.; Cabrita, M.J. Multivariate geostatistical analysis of stable isotopes in Portuguese varietal extra virgin olive oils. Microchem. J. 2020, 157, 105044. [Google Scholar] [CrossRef]
- Katharina Richter, E.V.A.; Spangenberg, J.E.; Kreuzer, M.; Leiber, F. Characterization of rapeseed (brassica napus) oils by bulk C, O, H, and fatty acid C stable isotope analyses. J. Agric. Food Chem. 2010, 58, 8048–8055. [Google Scholar] [CrossRef]
- Schipilliti, L.; Dugo, G.; Santi, L.; Dugo, P.; Mondello, L. Authentication of bergamot essential oil by gas chromatography-combustion-isotope ratio mass spectrometer (gc-c-irms). J. Essent. Oil Res. 2011, 23, 60–71. [Google Scholar] [CrossRef]
- Pradhan, S.; Rajamani, S.; Agrawal, G.; Dash, M.; Samal, S.K. NMR, FT-IR and raman characterization of biomaterials. In Characterization of Polymeric Biomaterials; Tanzi, M.C., Farè, S., Eds.; Woodhead Publishing: Cambridge, UK, 2017; pp. 147–173. ISBN 978-0-08-100737-2. [Google Scholar]
- Rongai, D.; Sabatini, N.; Del Coco, L.; Perri, E.; Del Re, P.; Simone, N.; Marchegiani, D.; Fanizzi, F.P. 1H NMR and Multivariate Analysis for Geographic Characterization of Commercial Extra Virgin Olive Oil: A Possible Correlation with Climate Data. Foods 2017, 6, 96. [Google Scholar] [CrossRef] [Green Version]
- Binetti, G.; Del Coco, L.; Ragone, R.; Zelasco, S.; Perri, E.; Montemurro, C.; Valentini, R.; Naso, D.; Fanizzi, F.P.; Schena, F.P. Cultivar classification of Apulian olive oils: Use of artificial neural networks for comparing NMR, NIR and merceological data. Food Chem. 2017, 219, 131–138. [Google Scholar] [CrossRef] [PubMed]
- Martin, G.J.; Martin, M.L. Deuterium labelling at the natural abundance level as studied by high field quantitative 2H NMR. Tetrahedron Lett. 1981, 22, 3525–3528. [Google Scholar] [CrossRef]
- Remaud, G.S.; Giraudeau, P.; Lesot, P.; Akoka, S. Isotope ratio monitoring by NMR: Part 1-recent advances. In Modern Magnetic Resonance; Springer International Publishing: Berlin/Heidelberg, Germany, 2018; pp. 1353–1378. ISBN 9783319283883. [Google Scholar]
- Eurofins. SNIF-NMR—How it all Began. Available online: https://www.eurofins.com/scientific-impact/scientific-innovation/snif-nmr-how-it-all-began/ (accessed on 11 February 2021).
- Gilbert, A.; Silvestre, V.; Robins, R.J.; Remaud, G.S.; Tcherkez, G. Biochemical and physiological determinants of intramolecular isotope patterns in sucrose from C3, C4 and CAM plants accessed by isotopic 13C NMR spectrometry: A viewpoint. Nat. Prod. Rep. 2012, 29, 476–486. [Google Scholar] [CrossRef] [PubMed]
- Royer, A.; Naulet, N.; Mabon, F.; Lees, M.; Martin, G.J. Stable isotope characterization of olive oils: II-deuterium distribution in fatty acids studied by nuclear magnetic resonance (SNIF-NMR). J. Am. Oil Chem. Soc. 1999, 76, 1–9. [Google Scholar] [CrossRef]
- Penner, M.H. Basic Principles of Spectroscopy; Springer: Cham, Switzerland, 2017; pp. 79–88. [Google Scholar]
- Karoui, R. Spectroscopic Technique: Fluorescence and Ultraviolet-Visible (UV-Vis) Spectroscopies, 2nd ed.; Sun, D.-W., Ed.; Academic Press: Cambridge, MA, USA, 2018; ISBN 9780128142646. [Google Scholar]
- Sikorska, E.; Khmelinskii, I.V.; Sikorski, M.; Caponio, F.; Bilancia, M.T.; Pasqualone, A.; Gomes, T. Fluorescence spectroscopy in monitoring of extra virgin olive oil during storage. Int. J. Food Sci. Technol. 2008, 43, 52–61. [Google Scholar] [CrossRef]
- Hernández-Sánchez, N.; Lleó, L.; Ammari, F.; Cuadrado, T.R.; Roger, J.M. Fast Fluorescence Spectroscopy Methodology to Monitor the Evolution of Extra Virgin Olive Oils Under Illumination. Food Bioprocess Technol. 2017, 10, 949–961. [Google Scholar] [CrossRef]
- Addou, S.; Fethi, F.; Chikri, M.; Rrhioua, A. Detection of argan oil adulteration with olive oil using fluorescence spectroscopy and chemometrics tools. J. Mater. Environ. Sci. 2016, 7, 2689–2698. [Google Scholar]
- Hajslova, J.; Cajka, T. Gas chromatography in food analysis. In Handbook of Food Analysis Instruments; Ötleş, S., Ed.; CRC press: Boca Raton, FL, USA, 2008. [Google Scholar]
- Forgács, E.; Cserháti, T. Gas chromatography. In Food Authenticity and Traceability; Elsevier: Amsterdam, The Netherlands, 2013; pp. 197–217. ISBN 9781855735262. [Google Scholar]
- Ruiz-Matute, A.I.; Rodríguez-Sánchez, S.; Sanz, M.L.; Soria, A.C. Chromatographic Technique: Gas Chromatography (GC). In Modern Techniques for Food Authentication; Academic Press: Cambridge, MA, USA, 2018; pp. 415–458. ISBN 9780128142646. [Google Scholar]
- Mondello, L.; Casilli, A.; Tranchida, P.Q.; Costa, R.; Chiofalo, B.; Dugo, P.; Dugo, G. Evaluation of fast gas chromatography and gas chromatography-mass spectrometry in the analysis of lipids. J. Chromatogr. A 2004, 1035, 237–247. [Google Scholar] [CrossRef] [PubMed]
- Andrikopoulos, N.K.; Giannakis, I.G.; Tzamtzis, V. Analysis of olive oil and seed oil triglycerides by capillary gas chromatography as a tool for the detection of the adulteration of olive oil. J. Chromatogr. Sci. 2001, 39, 137–145. [Google Scholar] [CrossRef] [PubMed] [Green Version]
- Dourtoglou, V.G.; Dourtoglou, T.; Antonopoulos, A.; Stefanou, E.; Lalas, S.; Poulos, C. Detection of olive oil adulteration using principal component analysis applied on total and regio FA content. J. Am. Oil Chem. Soc. 2003, 80, 203–208. [Google Scholar] [CrossRef]
- Park, J.R.; Lee, D.S. Detection of adulteration in olive oils using triacylglycerols compositions by high temperature gas chromatography. Bull. Korean Chem. Soc. 2003, 24, 527–530. [Google Scholar]
- Al-Ismail, K.M.; Alsaed, A.K.; Ahmad, R.; Al-Dabbas, M. Detection of olive oil adulteration with some plant oils by GLC analysis of sterols using polar column. Food Chem. 2010, 121, 1255–1259. [Google Scholar] [CrossRef]
- Jabeur, H.; Zribi, A.; Makni, J.; Rebai, A.; Abdelhedi, R.; Bouaziz, M. Detection of chemlali extra-virgin olive oil adulteration mixed with soybean oil, corn oil, and sunflower oil by using GC and HPLC. J. Agric. Food Chem. 2014, 62, 4893–4904. [Google Scholar] [CrossRef] [PubMed]
- Vera, D.N.; Jiménez-Carvelo, A.M.; Cuadros-Rodríguez, L.; Ruisánchez, I.; Callao, M.P. Authentication of the geographical origin of extra-virgin olive oil of the Arbequina cultivar by chromatographic fingerprinting and chemometrics. Talanta 2019, 203, 194–202. [Google Scholar] [CrossRef]
- Melucci, D.; Bendini, A.; Tesini, F.; Barbieri, S.; Zappi, A.; Vichi, S.; Conte, L.; Gallina Toschi, T. Rapid direct analysis to discriminate geographic origin of extra virgin olive oils by flash gas chromatography electronic nose and chemometrics. Food Chem. 2016, 204, 263–273. [Google Scholar] [CrossRef] [Green Version]
- Parcerisa, J.; Casals, I.; Boatella, J.; Codony, R.; Rafecas, M. Analysis of olive and hazelnut oil mixtures by high-performance liquid chromatography-atmospheric pressure chemical ionisation mass spectrometry of triacylglycerols and gas-liquid chromatography of non-saponifiable compounds (tocopherols and sterols). J. Chromatogr. A 2000, 881, 149–158. [Google Scholar] [CrossRef]
- Zabaras, D.; Gordon, M.H. Detection of pressed hazelnut oil in virgin olive oil by analysis of polar components: Improvement and validation of the method. Food Chem. 2004, 84, 475–483. [Google Scholar] [CrossRef]
- Romaniello, R.; Baiano, A. Discrimination of flavoured olive oil based on hyperspectral imaging. J. Food Sci. Technol. 2018, 55, 2429–2435. [Google Scholar] [CrossRef]
- Deng, S.; Xu, Y.; Li, L.; Li, X.; He, Y. A feature-selection algorithm based on Support Vector Machine-Multiclass for hyperspectral visible spectral analysis. J. Food Eng. 2013, 119, 159–166. [Google Scholar] [CrossRef]
- Xie, C.; Wang, Q.; He, Y. Identification of Different Varieties of Sesame Oil Using Near-Infrared Hyperspectral Imaging and Chemometrics Algorithms. PLoS ONE 2014, 9, e98522. [Google Scholar]
- Guo, Y.; Ding, H.; Xu, J.; Xu, H. Clustering analysis based on hyperspectral DN values of waste oil. Remote Sens. L. Resour. 2014, 26, 37–41. [Google Scholar]
- Kazemi, S.; Wang, N.; Ngadi, M.; Prasher, S.O. Evaluation of frying oil quality using VIS/NIR hyperspectral analysis. Agric. Eng. Int. CIGR J. 2005, 7, 1–12. [Google Scholar]
- Gila, D.M.; Marchal, P.C.; García, J.G.; Ortega, J.G. Hyperspectral imaging for determination of some quality parameters for olive oil. In Proceedings of the 18th International Conference on Automation and Computing (ICAC), Loughborough, UK, 7–8 September 2012; pp. 1–6. [Google Scholar]
- Bremer, M.G.E.G.; Smits, N.G.E.; Haasnoot, W. Biosensor immunoassay for traces of hazelnut protein in olive oil. Anal. Bioanal. Chem. 2009, 395, 119–126. [Google Scholar] [CrossRef] [PubMed] [Green Version]
- Zhang, D.; Li, P.; Yang, Y.; Zhang, Q.; Zhang, W.; Xiao, Z.; Ding, X. A high selective immunochromatographic assay for rapid detection of aflatoxin B1. Talanta 2011, 85, 736–742. [Google Scholar] [CrossRef] [PubMed]
- Gutiérrez, A.; Burgos, J.A.; Moltó, E. Development of an immunosensor based on the measurement of fluorescence. Sensors Actuators, B Chem. 2008, 131, 621–626. [Google Scholar] [CrossRef]
- Pereira, A.G.; Fraga, M.; Oliveira, P.G.; Jimenez-Lopez, C.; Lourenço-Lopes, C.; Barros, L.; Ferreira, I.C.F.R.; Prieto, M.A.; Simal-Gandara, J. Identification, quantification, and method validation of anthocyanins. In Anthocyanins: Antioxidant Properties, Sources and Health Benefits; Nova Science Publisher: Hauppauge, NY, USA, 2020; ISBN 978-1-53617-816-6. [Google Scholar]
- El-Hamdy, A.H.; El-Fizga, N.K. Detection of olive oil adulteration by measuring its authenticity factor using reversed-phase high-performance liquid chromatography. J. Chromatogr. A 1995, 708, 351–355. [Google Scholar] [CrossRef]
- Moreda, W.; Pérez-Camino, M.C.; Cert, A. Improved method for the determination of triacylglycerols in olive oils by high performance liquid chromatography. Grasas y Aceites 2003, 54, 175–179. [Google Scholar] [CrossRef]
- International Olive Council. International Olive Council COI/T.20/Doc. no.25 DEC- 22/100-V/2013; International Olive Council: Madrid, Spain, 2013. [Google Scholar]
- Cert, A.; Moreda, W. Algoritmos para la detección de aceite de avellana en aceite de oliva. Grasas Aceites 2000, 51, 143–149. [Google Scholar]
- Puspitasari-Nienaber, N.L.; Ferruzzi, M.G.; Schwartz, S.J. Simultaneous detection of tocopherols, carotenoids, and chlorophylls in vegetable oils by direct injection C 30 RP-HPLC with coulometric electrochemical array detection. J. Am. Oil Chem. Soc. 2002, 79, 633–640. [Google Scholar] [CrossRef]
- Christodouleas, D.; Fotakis, C.; Papadopoulos, K.; Dimotikali, D.; Calokerinos, A.C. Luminescent Methods in the Analysis of Untreated Edible Oils: A Review. Anal. Lett. 2012, 45, 625–641. [Google Scholar] [CrossRef]
- Flores, G.; Ruiz Del Castillo, M.L.; Herraiz, M.; Blanch, G.P. Study of the adulteration of olive oil with hazelnut oil by on-line coupled high performance liquid chromatographic and gas chromatographic analysis of filbertone. Food Chem. 2006, 97, 742–749. [Google Scholar] [CrossRef]
- Kalaitzis, P.; El-Zein, Z. Olive oil authentication, traceability and adulteration detection using DNA-based approaches. Lipid Technol. 2016, 28, 173–176. [Google Scholar] [CrossRef]
- Vietina, M.; Agrimonti, C.; Marmiroli, N. Detection of plant oil DNA using high resolution melting (HRM) post PCR analysis: A tool for disclosure of olive oil adulteration. Food Chem. 2013, 141, 3820–3826. [Google Scholar] [CrossRef]
- Pasqualone, A.; Montemurro, C.; Di Rienzo, V.; Summo, C.; Paradiso, V.M.; Caponio, F. Evolution and perspectives of cultivar identification and traceability from tree to oil and table olives by means of DNA markers. J. Sci. Food Agric. 2016, 96, 3642–3657. [Google Scholar] [CrossRef] [PubMed]
- Agrimonti, C.; Marmiroli, N. Food Genomics for the Characterization of PDO and PGI Virgin Olive Oils. Eur. J. Lipid Sci. Technol. 2019, 121, 1–10. [Google Scholar] [CrossRef]
- Bodurov, I.; Vlaeva, I.; Marudova, M.; Yovcheva, T.; Nikolova, K.; Eftimov, T.; Plachkova, V. Detection of adulteration in olive oils using optical and thermal methods. Bulg. Chem. Commun. 2013, 45, 81–85. [Google Scholar]
- Ritchie, R.F. The Foundations of Immunochemistry. In The Immunoassay Handbook; Elsevier: Amsterdam, The Netherlands, 2013; ISBN 9780080970370. [Google Scholar]
- González-Martínez, M.Á.; Puchades, R.; Maquieira, Á. Immunoanalytical Technique: Enzyme-Linked Immunosorbent Assay (ELISA); Academic Press: Cambridge, MA, USA, 2018; pp. 617–657. ISBN 9780128142646. [Google Scholar]
- Cui, X.; Wu, P.; Lai, D.; Zheng, S.; Chen, Y.; Eremin, S.A.; Peng, W.; Zhao, S. Development of a Highly Specific Fluorescence Immunoassay for Detection of Diisobutyl Phthalate in Edible Oil Samples. J. Agric. Food Chem. 2015, 63, 9372–9378. [Google Scholar] [CrossRef] [PubMed]
- Ghisoni, S.; Lucini, L.; Angilletta, F.; Rocchetti, G.; Farinelli, D.; Tombesi, S.; Trevisan, M. Discrimination of extra-virgin-olive oils from different cultivars and geographical origins by untargeted metabolomics. Food Res. Int. 2019, 121, 746–753. [Google Scholar] [CrossRef]
- Temime, S.B.; Manai, H.; Methenni, K.; Baccouri, B.; Abaza, L.; Daoud, D.; Casas, J.S.; Bueno, E.O.; Zarrouk, M. Sterolic composition of Chétoui virgin olive oil: Influence of geographical origin. Food Chem. 2008, 110, 368–374. [Google Scholar] [CrossRef] [PubMed]
- Trygg, J.; Gullberg, J.; Johansson, A.I.; Jonsson, P.; Moritz, T. Chemometrics in Metabolomics—An Introduction BT—Plant Metabolomics; Saito, K., Dixon, R.A., Willmitzer, L., Eds.; Springer: Berlin/Heidelberg, Germany, 2006; pp. 117–128. ISBN 978-3-540-29782-6. [Google Scholar]
- Esteki, M.; Simal-Gandara, J.; Shahsavari, Z.; Zandbaaf, S.; Dashtaki, E.; Vander Heyden, Y. A review on the application of chromatographic methods, coupled to chemometrics, for food authentication. Food Control 2018, 93, 165–182. [Google Scholar] [CrossRef]
- Carranco, N.; Farrés-Cebrián, M.; Saurina, J.; Núñez, O. Authentication and Quantitation of Fraud in Extra Virgin Olive Oils Based on HPLC-UV Fingerprinting and Multivariate Calibration. Foods 2018, 7, 44. [Google Scholar] [CrossRef] [Green Version]
- Ozcan-Sinir, G. Detection of adulteration in extra virgin olive oil by selected ion flow tube mass spectrometry (SIFT-MS) and chemometrics. Food Control 2020, 118, 107433. [Google Scholar] [CrossRef]
- Xu, Y.; Zhong, P.; Jiang, A.; Shen, X.; Li, X.; Xu, Z.; Shen, Y.; Sun, Y.; Lei, H. Raman spectroscopy coupled with chemometrics for food authentication: A review. TrAC Trends Anal. Chem. 2020, 131, 116017. [Google Scholar] [CrossRef]
- Sánchez-López, E.; Sánchez-Rodríguez, M.I.; Marinas, A.; Marinas, J.M.; Urbano, F.J.; Caridad, J.M.; Moalem, M. Chemometric study of Andalusian extra virgin olive oils Raman spectra: Qualitative and quantitative information. Talanta 2016, 156–157, 180–190. [Google Scholar] [CrossRef] [PubMed]
- Borghi, F.T.; Santos, P.C.; Santos, F.D.; Nascimento, M.H.C.; Corrêa, T.; Cesconetto, M.; Pires, A.A.; Ribeiro, A.V.F.N.; Lacerda, V.; Romão, W.; et al. Quantification and classification of vegetable oils in extra virgin olive oil samples using a portable near-infrared spectrometer associated with chemometrics. Microchem. J. 2020, 159, 105544. [Google Scholar] [CrossRef]
- Pu, Y.Y.; Feng, Y.Z.; Sun, D.W. Recent progress of hyperspectral imaging on quality and safety inspection of fruits and vegetables: A review. Compr. Rev. Food Sci. Food Saf. 2015, 14, 176–188. [Google Scholar] [CrossRef] [PubMed]
- Liu, Y.; Pu, H.; Sun, D.W. Hyperspectral imaging technique for evaluating food quality and safety during various processes: A review of recent applications. Trends Food Sci. Technol. 2017, 69, 25–35. [Google Scholar] [CrossRef]
- Wu, D.; Sun, D.W. Advanced applications of hyperspectral imaging technology for food quality and safety analysis and assessment: A review—Part I: Fundamentals. Innov. Food Sci. Emerg. Technol. 2013, 19, 1–14. [Google Scholar] [CrossRef]
- Baiano, A. Applications of hyperspectral imaging for quality assessment of liquid based and semi-liquid food products: A review. J. Food Eng. 2017, 214, 10–15. [Google Scholar] [CrossRef]


| Technique | Adulterant | Detection (%) | Quantification (%) | Conditions | Ref. |
|---|---|---|---|---|---|
| NIR | Soybean Oil | - | 1.76 | 12,000–4000 cm−1 | [16] |
| NIR | Olive Pomace Oil | - | 3.27 | 8000–2000 cm−1 | [17] |
| NIR | Corn, sunflower, soya, walnut and hazelnut oil | 2 | 0.57, 1.32, 0.96, 0.56, 0.57 | 12,000–4000 cm−1 | [18] |
| NIR | Sunflower Oil | 1 | - | 2498–1100 nm | [19] |
| NIR | Adulterants | 1 | 5280 cm−1 | [20] | |
| FT-IR | Low-cost edible oils | 5 | - | 4000–500 cm−1 | [21] |
| FT-IR | Olive Pomace Oil | - | 3.28 | 4000–400 cm−1 | [17] |
| FT-IR | Peanut Oil | 1 | - | 3050–600 cm−1 | [22] |
| FT-IR | Peanut Oil | 5 | - | 4000–400 cm−1 | [23] |
| FT-IR | Hazelnut Oil | 25 | - | 3100–800 cm−1 | [24] |
| FT-IR | Palm, corn, canola and sunflower oil | - | 1 | 1500–1000 cm−1 | [25] |
| FT-IR | Soybean and tea seed oil | 1 | 4000–650 cm−1 | [26] | |
| MIR | Old olive oil | 1–50 | 4000–600 cm−1 | [27] | |
| MIR | Soybean Oil | 4.89 | 4000–350 cm−1 | [16] | |
| MIR | Corn-sunflower mixture, cottonseed, and rapeseed | 5 | 4000–650 cm−1 | [28] | |
| Raman | Soybean Oil | 1.57 | 3500–50 cm−1 | [16] | |
| Raman | Olive Pomace Oil | 1.72 | 3700–400 cm−1 | [17] | |
| Raman | - | 5 | 2400–250 cm−1 | [29] | |
| Raman | Sunflower oil | 1 | 3100–560 cm−1 | [30] | |
| Raman | Soybean oil | 1 | 1800–1000 cm−1 | [31] | |
| Raman | Waste cooking oil | 2.5 | 3500–100 cm−1 | [32] | |
| UV-VIS | Refined oil | <10 | 0–650 nm | [33] | |
| UV-VIS | Frying oils | 1 | 0–650 nm | [34] | |
| UV-VIS | Olive oil | 8.4 | 60–700 nm | [35] | |
| NMR | Lampante olive oil, Refined olive oil | 5 | - | [36] | |
| NMR | Seed and nut oils | 10 | - | [37] |
| Technique | Adulterant | Conditions | Ref. |
|---|---|---|---|
| GC | Soybean, corn, sunflower oil | Column Agilent CP-Sil88 (50 m × 0.25 mm, 0.20 μm). FID (HP 6890N, Agilent, 250 °C). t0 = 165 °C, 25 min; gradient of 5 °C/min tf = 195 °C.Percentage of adulteration detection: 1–3% | [101] |
| HPLC | Hazelnut, olive and their mixtures | Column Spherisorb ODS2 (octadodecylsilane) (46 cm × 0.25 m, 5 µm). 25 °C, 50 min. (A): A–Act (64:36, v/v) 1 mL/min. Percentage of adulteration detection: 2% | [104] |
| HPLC | Hazelnut | Kromasil 100-5C18 (3.2 mm × 250 mm; 5 μm). (A): W/AA (97:3, v/v). (B): M/Act (50:50, v/v). 30 °C, 0.490 mL/min. PDA-100, 280 nm. Isocratic (95% A–5% B, 15 min), gradient (100% B, 25 min) back to 5% B, 20 min. Percentage of adulteration detection: 5% | [105] |
| HSI | Olive oil | 400–570 nm. Competitive adaptive reweighted sampling (CARS), successive projections algorithm (SPA), and x-loading weights (x-LW) | [106] |
| HSI | Sesame oil | 325–1075 nm. Support Vector Machine-Multiclass Forward Feature Selection (SVM-MFFS) | [107] |
| HSI | Sesame oil | 874–1734 nm. Least Squares-Support Vector Machine (LS-SVM) and the Linear Discriminant Analysis (LDA) | [108] |
| HSI | Edible and waste cooking oils | 350–2500 nm. Unweighted Distance Method and Interior Square Sum Distance | [109] |
| HSI | Frying oils | 400–1750 nm. PLS calibration models | [110] |
| HSI | Virgin olive oils | 900–1700 nm. Genetic Algorithm (GA), Least Absolute Shrinkage and Selection Operator, and Successive Projection Algorithm (SPA) | [111] |
| IRMS | Glycerol, fatty alcohols | δ13C, δ18O | [74] |
| IRMS | Palmitic acid, palmitoleic acid, stearic acid, oleic acid, linoleic acid, linolenic acid | δ13C, bulk. Vegetable oils can be classified using the isotopic ratios of the bulk oil, the fatty acids, and also the composition of the fatty acids | [73] |
| IRMS | Phytol, geranyl geraniol, citrostadienol, docosanol, tetracosanol, hexacosanol | δ13C. Percentage of adulteration detection: 3% | [78] |
| IRMS | Methyl palmitoleate, methyl palmitate, methyl oleate | δ13C. Use of 3 FAME peaks enabled greater differentiation between samples of different geographic origin compared to using the isotopic ratios of the bulk oils | [75] |
| Enzymes | Hazelnut proteins | Indirect competitive ELISA and direct immunosensor. For biosensor, LOD 0.08 μg/g olive oil, assay time 4.5 min | [112] |
| Enzymes | Aflatoxin B1 | Immunostrips and indirect competitive ELISA. For strips, visual LOD 1 ng/mL, assay time 15 min | [113] |
| Enzymes | OrganophosporusPesticides | Indirect and direct fluorescent competitive immunosensor. High sensitivity of the fluorescence transducer | [114] |
Publisher’s Note: MDPI stays neutral with regard to jurisdictional claims in published maps and institutional affiliations. |
© 2021 by the authors. Licensee MDPI, Basel, Switzerland. This article is an open access article distributed under the terms and conditions of the Creative Commons Attribution (CC BY) license (http://creativecommons.org/licenses/by/4.0/).
Share and Cite
González-Pereira, A.; Otero, P.; Fraga-Corral, M.; Garcia-Oliveira, P.; Carpena, M.; Prieto, M.A.; Simal-Gandara, J. State-of-the-Art of Analytical Techniques to Determine Food Fraud in Olive Oils. Foods 2021, 10, 484. https://doi.org/10.3390/foods10030484
González-Pereira A, Otero P, Fraga-Corral M, Garcia-Oliveira P, Carpena M, Prieto MA, Simal-Gandara J. State-of-the-Art of Analytical Techniques to Determine Food Fraud in Olive Oils. Foods. 2021; 10(3):484. https://doi.org/10.3390/foods10030484
Chicago/Turabian StyleGonzález-Pereira, Antia, Paz Otero, Maria Fraga-Corral, Paula Garcia-Oliveira, Maria Carpena, Miguel A. Prieto, and Jesus Simal-Gandara. 2021. "State-of-the-Art of Analytical Techniques to Determine Food Fraud in Olive Oils" Foods 10, no. 3: 484. https://doi.org/10.3390/foods10030484