Article

Characterizing Industrial and Artisanal Fishing Vessel Catch Composition Using Environmental DNA and Satellite-Based Tracking Data

by
Demian A. Willette
1,*,
Gabriela Navarrete-Forero
2,3,
Zachary Gold
4,
Apollo Marco D. Lizano
5,
Leonardo Gonzalez-Smith
1 and
Giovanna Sotil
6
1
Biology Department, Loyola Marymount University, Los Angeles, CA 90045-2659, USA
2
Centro del Agua y Desarrollo Sustentable, Escuela Superior Politécnica del Litoral, 090902 Guayaquil, Ecuador
3
Proyecto Redes Fantasma DAAD, Universidad San Francisco de Quito, 170901 Esmeraldas, Ecuador
4
Department of Ecology and Evolutionary Biology, University of California, Los Angeles, CA 90095, USA
5
Faculty of Bioscience & Aquaculture, Nord University, 8026 Bodø, Norway
6
Laboratorio de Genética Molecular, Instituto del Mar del Perú-IMARPE, Callao 01, Lima, Peru
*
Author to whom correspondence should be addressed.
Foods 2021, 10(6), 1425; https://doi.org/10.3390/foods10061425
Submission received: 26 May 2021 / Revised: 13 June 2021 / Accepted: 15 June 2021 / Published: 19 June 2021
(This article belongs to the Special Issue Detection of Food Fraud Using Analytical Methods)

Abstract

:
The decline in wild-caught fisheries paired with increasing global seafood demand is pushing the need for seafood sustainability to the forefront of national and regional priorities. Validation of species identity is a crucial early step, yet conventional monitoring and surveillance tools are limited in their effectiveness because they are extremely time-consuming and require expertise in fish identification. DNA barcoding methods are a versatile tool for the genetic monitoring of wildlife products; however, they are also limited by requiring individual tissue samples from target specimens which may not always be possible given the speed and scale of seafood operations. To circumvent the need to individually sample organisms, we pilot an approach that uses forensic environmental DNA (eDNA) metabarcoding to profile fish species composition from the meltwater in fish holds on industrial and artisanal fishing vessels in Ecuador. Fish identified genetically as present were compared to target species reported by each vessel’s crew. Additionally, we contrasted the geographic range of identified species against the satellite-based fishing route data of industrial vessels to determine if identified species could be reasonably expected in the catch.

Graphical Abstract

1. Introduction

Global per capita consumption of seafood now exceeds 20 kg [1], with rising demand driving substantial increases in fisheries exports from developing nations [2]. Seafood commands a value of USD 151 billion on the global market [1] and sustains the livelihood and nutrition of nearly 4.5 billion people [3]. The decline in wild-caught fisheries continues, however, and is pushing the need for improved management for long-term sustainability to the forefront of national and regional priorities. One major threat to sustainable wild-caught stocks is illegal, unreported, and unregulated (IUU) fishing activities. Emerging multilateral agreements by policy agencies including the Asia-Pacific Fishery Commission, the Southeast Asian Fisheries Development Center, the European Union, and the United States Seafood Import Monitoring Program are setting the framework for action on IUU fishing [4,5,6,7], namely the aim to develop personnel expertise and tools in accurate and cost-effective monitoring, control, and surveillance (MCS) of fisheries.
Ecuador is among the top 25 nations in marine capture production [8]. The industrial fishing fleet includes approximately 700 vessels using purse seine nets and longlines [9,10]. This fleet currently targets tropical tunas (e.g., Katsuwonus pelamis, Thunnus albacares, Thunnus obesus), common dolphinfish (Coryphaena hippurus), and Chilean jack mackerel (Trachurus murphiyi). In 2010, the industrial fleet produced 249,850 tons of fish, whereas the artisanal fleet produced 100,900 tons [11]. The artisanal fleet involves > 5500 fishing boats using lines and surface gillnets to catch the pelagic species C. hippurus, tropical tunas, billfish (e.g., Xiphias gladius), and sharks (e.g., Alopias pelagicus). Other common pieces of artisan gear are bottom gillnets for snappers (Lutjanus spp.), deep longlines for Pacific bearded brotula (Brotula clarkae) and several grouper species (Epinephelus spp.) locally known as murico or mero [12]. However, the pool of species that are caught by the artisanal fleet is megadiverse. For instance, more than 130 species have been recently recorded at two landing sites in the province of Esmeraldas, and most fish species are consumed locally (Navarrete-Forero, unpublished data). Commonly represented families include Carangidae, Clupeidae, Engraulidae, Haemulidae, Lutjanidae, Sciaenidae, and Serranidae.
Over the past 50 years, genetic technologies have made significant contributions to fisheries management and marine conservation [13,14,15]. DNA barcoding applications, for example, have highlighted the occurrence of and challenging circumstances associated with seafood mislabeling at all levels of the supply chain [16,17,18,19], including in certified seafood programs that emphasize traceability [20,21], and efforts to stem the illegal trade of protected species [22,23,24]. While barcoding methods are a versatile and quick tool for genetic monitoring of wildlife products [25], they do rely on obtaining tissue samples from harvested specimens, which may not always be possible given the scale, speed, and logistics of marine fishing operations and seafood processing.
Next-generation sequencing technology now permits the sequencing of residual DNA of target species indirectly from their surrounding environment, circumventing the need to capture and sample individual organisms (see reviews by [26,27,28]). Every living specimen sheds particles of genetic material in the form of scales, skin, hair, waste, etc., into their surrounding aquatic or terrestrial environment. Collectively, these are referred to as environmental DNA (eDNA). Metabarcoding allows for eDNA to be filtered from a representative sample of an environment and then sequenced to determine the species diversity of a location’s community [28,29]. Early development of eDNA metabarcoding methods successfully identified residents of large artificial mesocosms [30] with 93% accuracy [31]. In natural marine [32] and aquatic [33,34] habitats, not only have eDNA methods been able to identify typical species but they have also proven extremely useful at detecting species occurring at much lower abundances that would likely be missed with a traditional census survey [32,35]. Growth in eDNA approaches has been facilitated by initiatives such as the Tree of Life and Barcode of Life projects [25,36] that have compiled comprehensive and dynamic open access databases of genetic information, enabling rapid identification of species using standardized genetic “barcodes” [37]. While eDNA methods are a relatively new approach and efforts are underway to reduce uncertainty and improve accuracy in validating species presence, the realized benefits for fisheries include non-lethal assessments, early detection of invasive species, and cost effectiveness [27,32,38]. eDNA also holds promise for aiding in assessing fish biomass [39,40], screening for threatened species unintentionally corralled as fisheries by-catch [41], conducting gut content analysis [42], investigating holobiont/microbiome biodiversity [43], and tracking the frequency and impact of species that escape from aquaculture farms into open-water systems [44]. With growing national and international support to improve the MCS of fisheries, eDNA is an emerging tool that could be leveraged early in the seafood supply chain at points where monitoring has been previously limited or inaccessible.
Here, we pilot an approach that uses forensic eDNA metabarcoding to profile fish species composition from the meltwater in fish holds on industrial and artisanal fishing vessels. We apply a threshold criterion to enumerate and compare species-level identification among fishing vessel types to explore catch patterns. The genetic-based identification of present fish was compared to species catch composition reported by fishing vessel crew. Lastly, we traced the route of industrial vessel fishing activities using publicly available satellite-tracking data and contrasted the geographic range of identified species against a vessel’s fishing location to determine if the identified fish species could reasonably be expected in the catch.

2. Materials and Methods

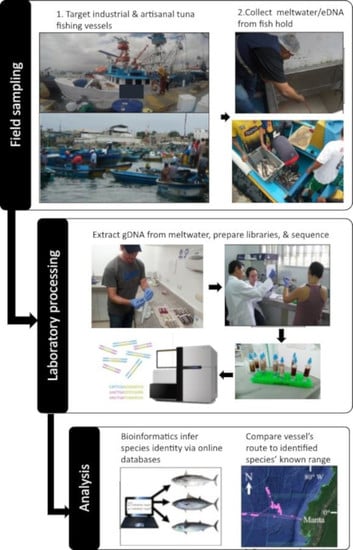
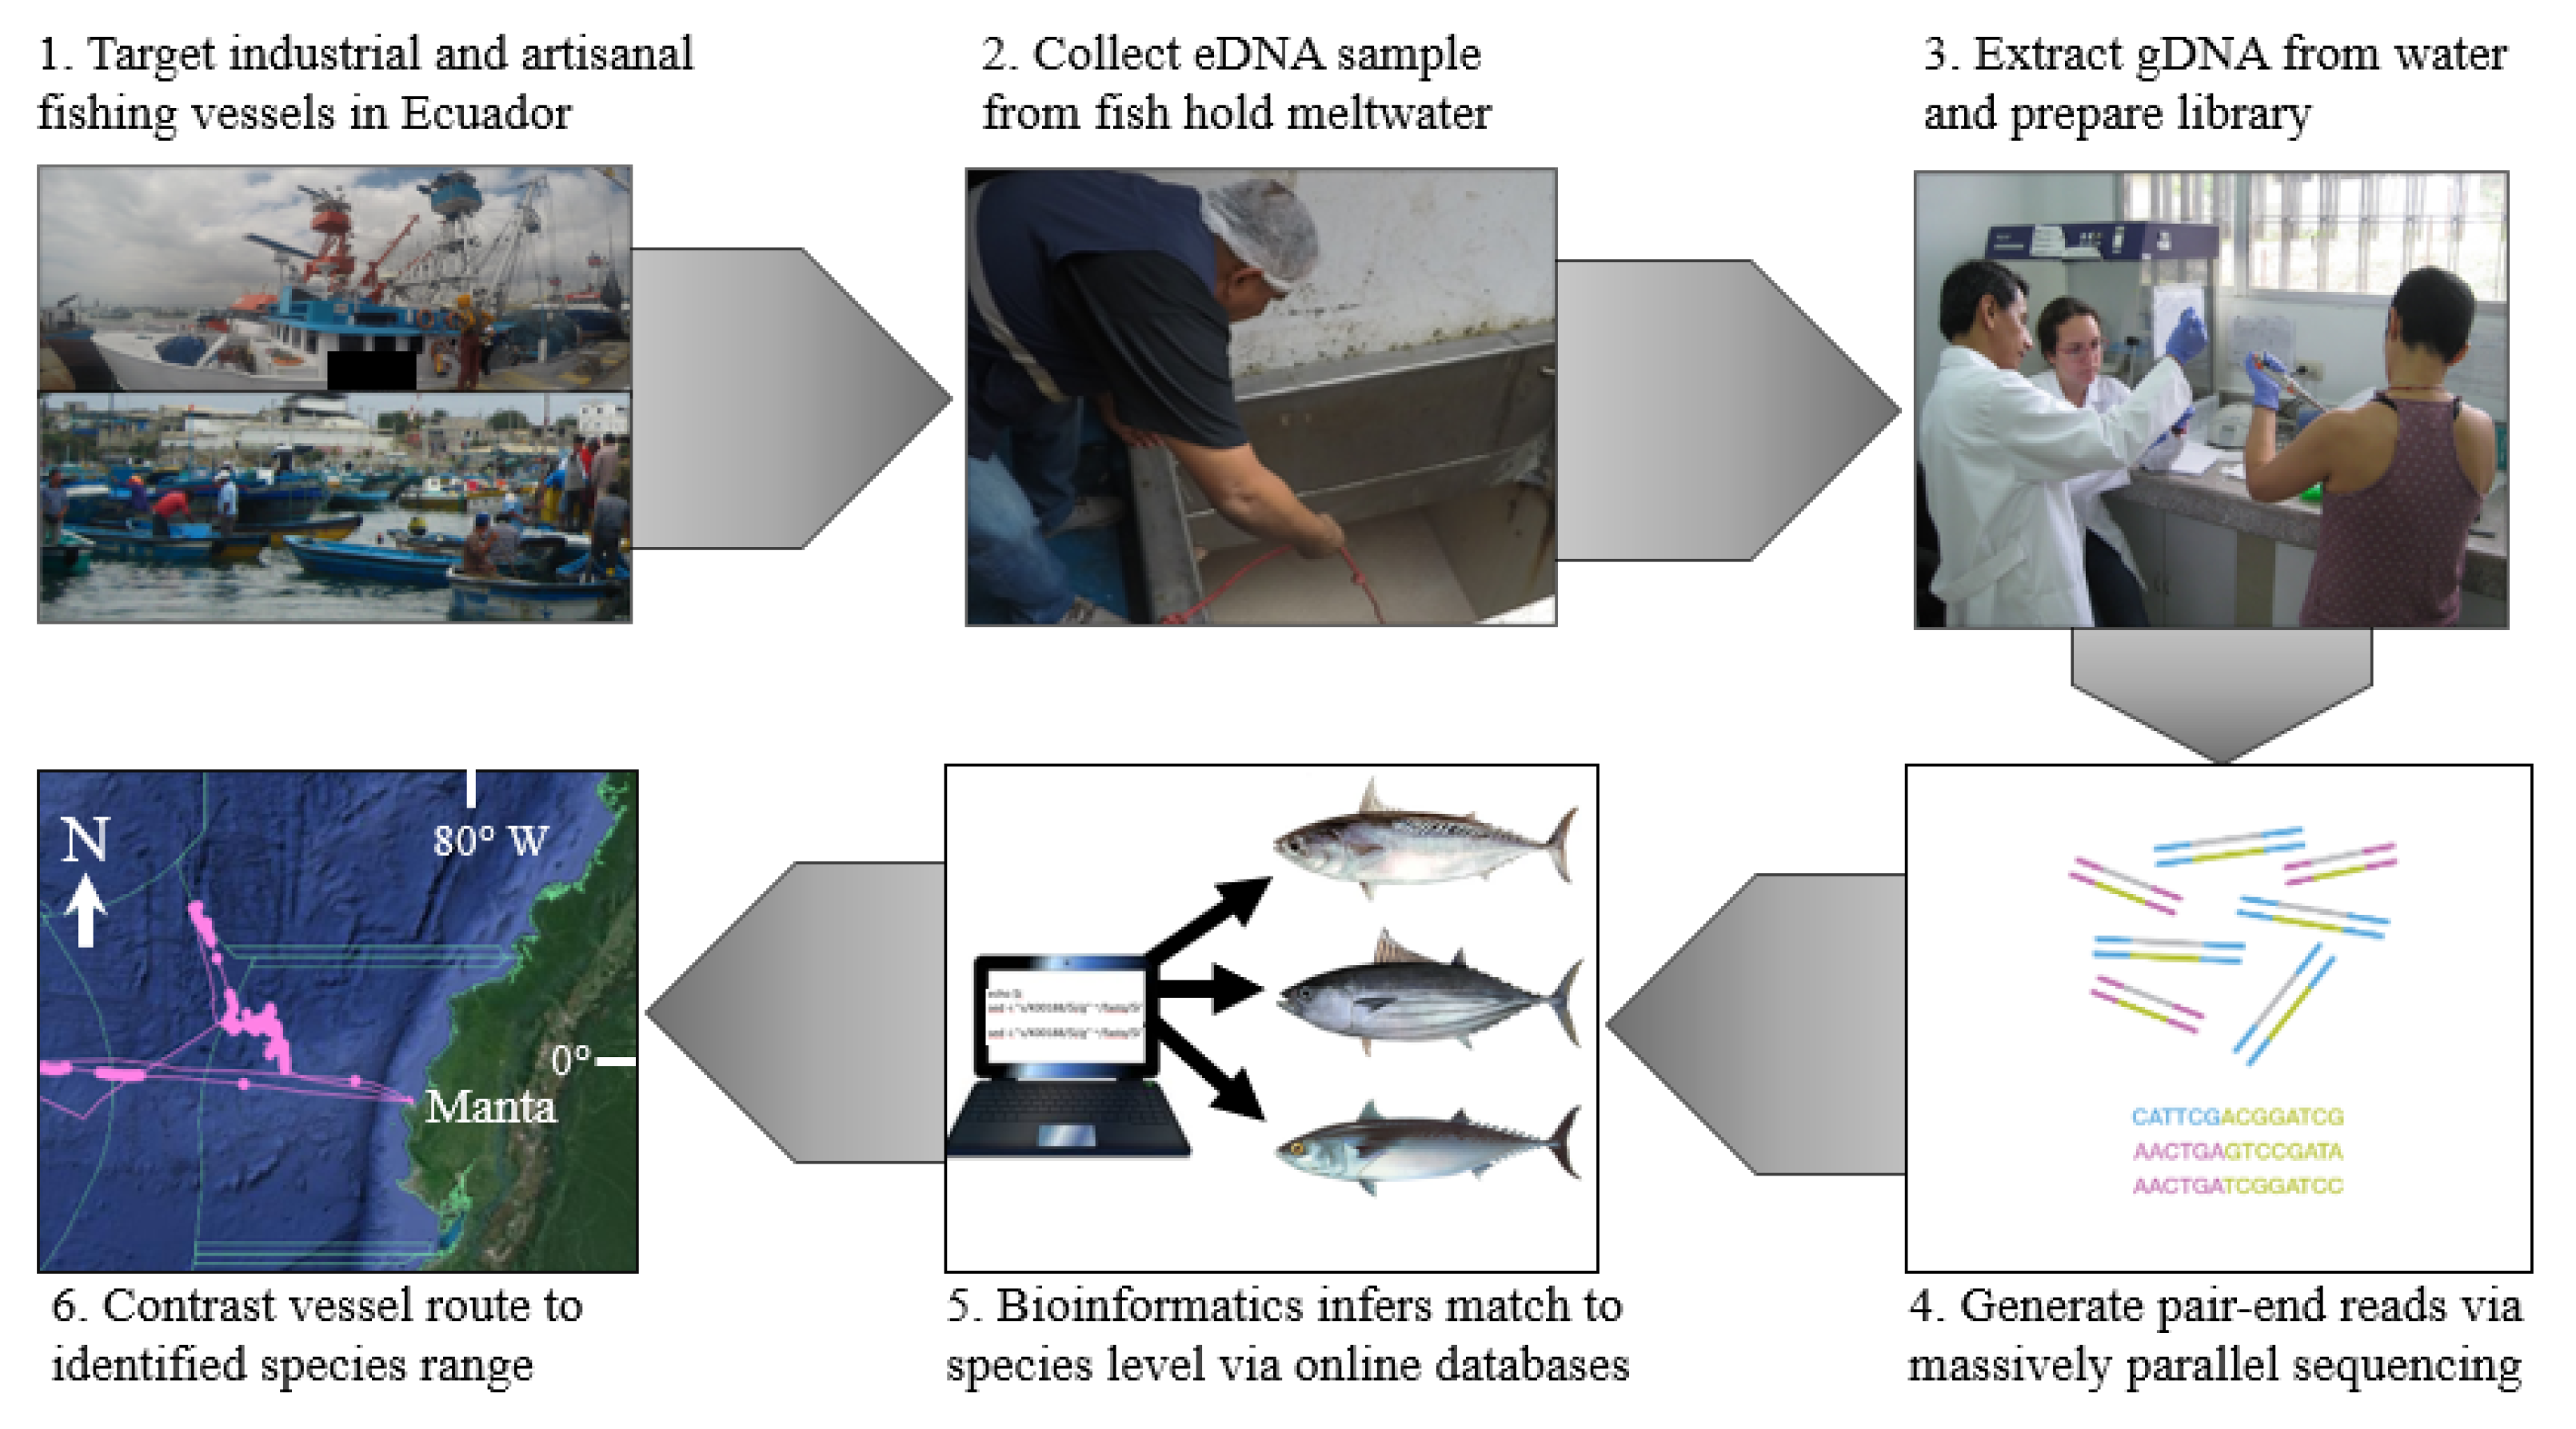
2.1. Field Sites and Vessel Sampling

Permission and access to sample from industrial and artisanal fishing vessels was coordinated and conducted with staff of the Instituto Público de Investigación de Acuicultura y Pesca (IPIAP) in collaboration with the Escuela Superior Politécnica del Litoral. Three industrial purse seine tuna fishing vessels (I_EC, I_DA, I_LZ) were sampled dockside at the Manta International Fish Port Complex (0°56′27″ S, 80°43′38″ W) on 14 July 2017, and three artisanal longline fishing vessels (A_AL, A_EC, A_ED) were sampled just prior to docking at the Facilidad Pesquera de Santa Rosa in Salinas (2°12′26″ S, 80°56′58″ W) on 17 July 2017 (Figure 1). The sampled vessels were chosen based on their presence in port, if they had been targeting tuna species, and the captain and crew’s willingness to allow sampling of meltwater. Upon boarding, the captain and crew were asked which fish species they targeted, the general location of their fishing activities, the type of gear used, and the trip’s duration, with all data confirmed for accuracy by accompanying IPIAP staff. Sampling from industrial vessels consisted of casting a 5 L pail tied to a rope into the pooled meltwater at the bottom of the fishing hold, dipping it up and down for 15 s, and then drawing it up to the deck to obtain three samples, which were stored in 50 mL conical tubes, sealed with Parafilm, and frozen for later processing. The smaller size of the artisanal vessels’ holds allowed for directly dipping the 50 mL tube into the pooled meltwater several times to mix and then remove the sample. Triplicate samples were taken from each vessel, labeled, and frozen until processing.

2.2. eDNA Extraction and Library Preparation

eDNA was extracted and purified from sampled meltwater using a Qiagen DNeasy blood and tissue kit with modifications ([45], see Supplemental Materials S1 for protocol details). Preparation of sequencing libraries for eDNA analysis consisted of a two-step polymerase chain reaction protocol [46]. All reactions were conducted in PCR tubes using commercially available reagents (see Supplemental Materials S2 for product and protocol details). The first PCR treatment used non-indexed primers with Illumina Nextera adapter sequences, genomic DNA template, and Qiagen multiplex master mix; and the second PCR treatment used a template from the first PCR, and unique combinations of Illumina Nextera indexing primers. All amplifications were performed using Kapa high-fidelity polymerase master mix. In the first PCR, an assortment of universal and taxon-specific primers were available for use and are detailed in Supplemental Materials S2. Here, the universal MiFish-U primers [31], which were designed from a short hypervariable region (163–185 bp) of the 12S rRNA gene, were used to screen from hundreds of marine fish species. During the second PCR, unique combinations of indexing primers were added to each individual sample, thus allowing all uniquely indexed samples to be combined in equal concentrations, in a single sequencing reaction on the Illumina HiSeq 2500 platform, and distinguished during the bioinformatics stage. Prepared libraries were processed in a single lane on an Illumina HiSeq 2500 platform using paired-end sequencing.

2.3. Read Processing and Bioinformatics

Raw reads were processed using the modular metabarcode sequence toolkit Anacapa (available online: http://github.com/limey-bean/Anacapa/ (accessed on 16 May 2021)) [47] and the contained R-based package, ranacapa [48]. Generated paired-end sequencing reads were processed through the Toolkit’s quality control and ASV (amplicon sequence variant) parsing module to trim, filter out singletons and low-quality reads, and ultimately return ASV FASTA files and ASV count summary tables. These files were then processed through the Toolkit’s Anacapa Classifier module to assign taxonomy, where ASVs were queried against the CRUX-generated 12S reference database. Taxonomic identity was assigned probabilistically using the Toolkit’s modified Bayesian Least Common Ancestor method using a cutoff level of 60, following [46]. Furthermore, given uneven sequencing depth across samples, taxa with less than 1% of the proportion of reads were excluded from the analysis.

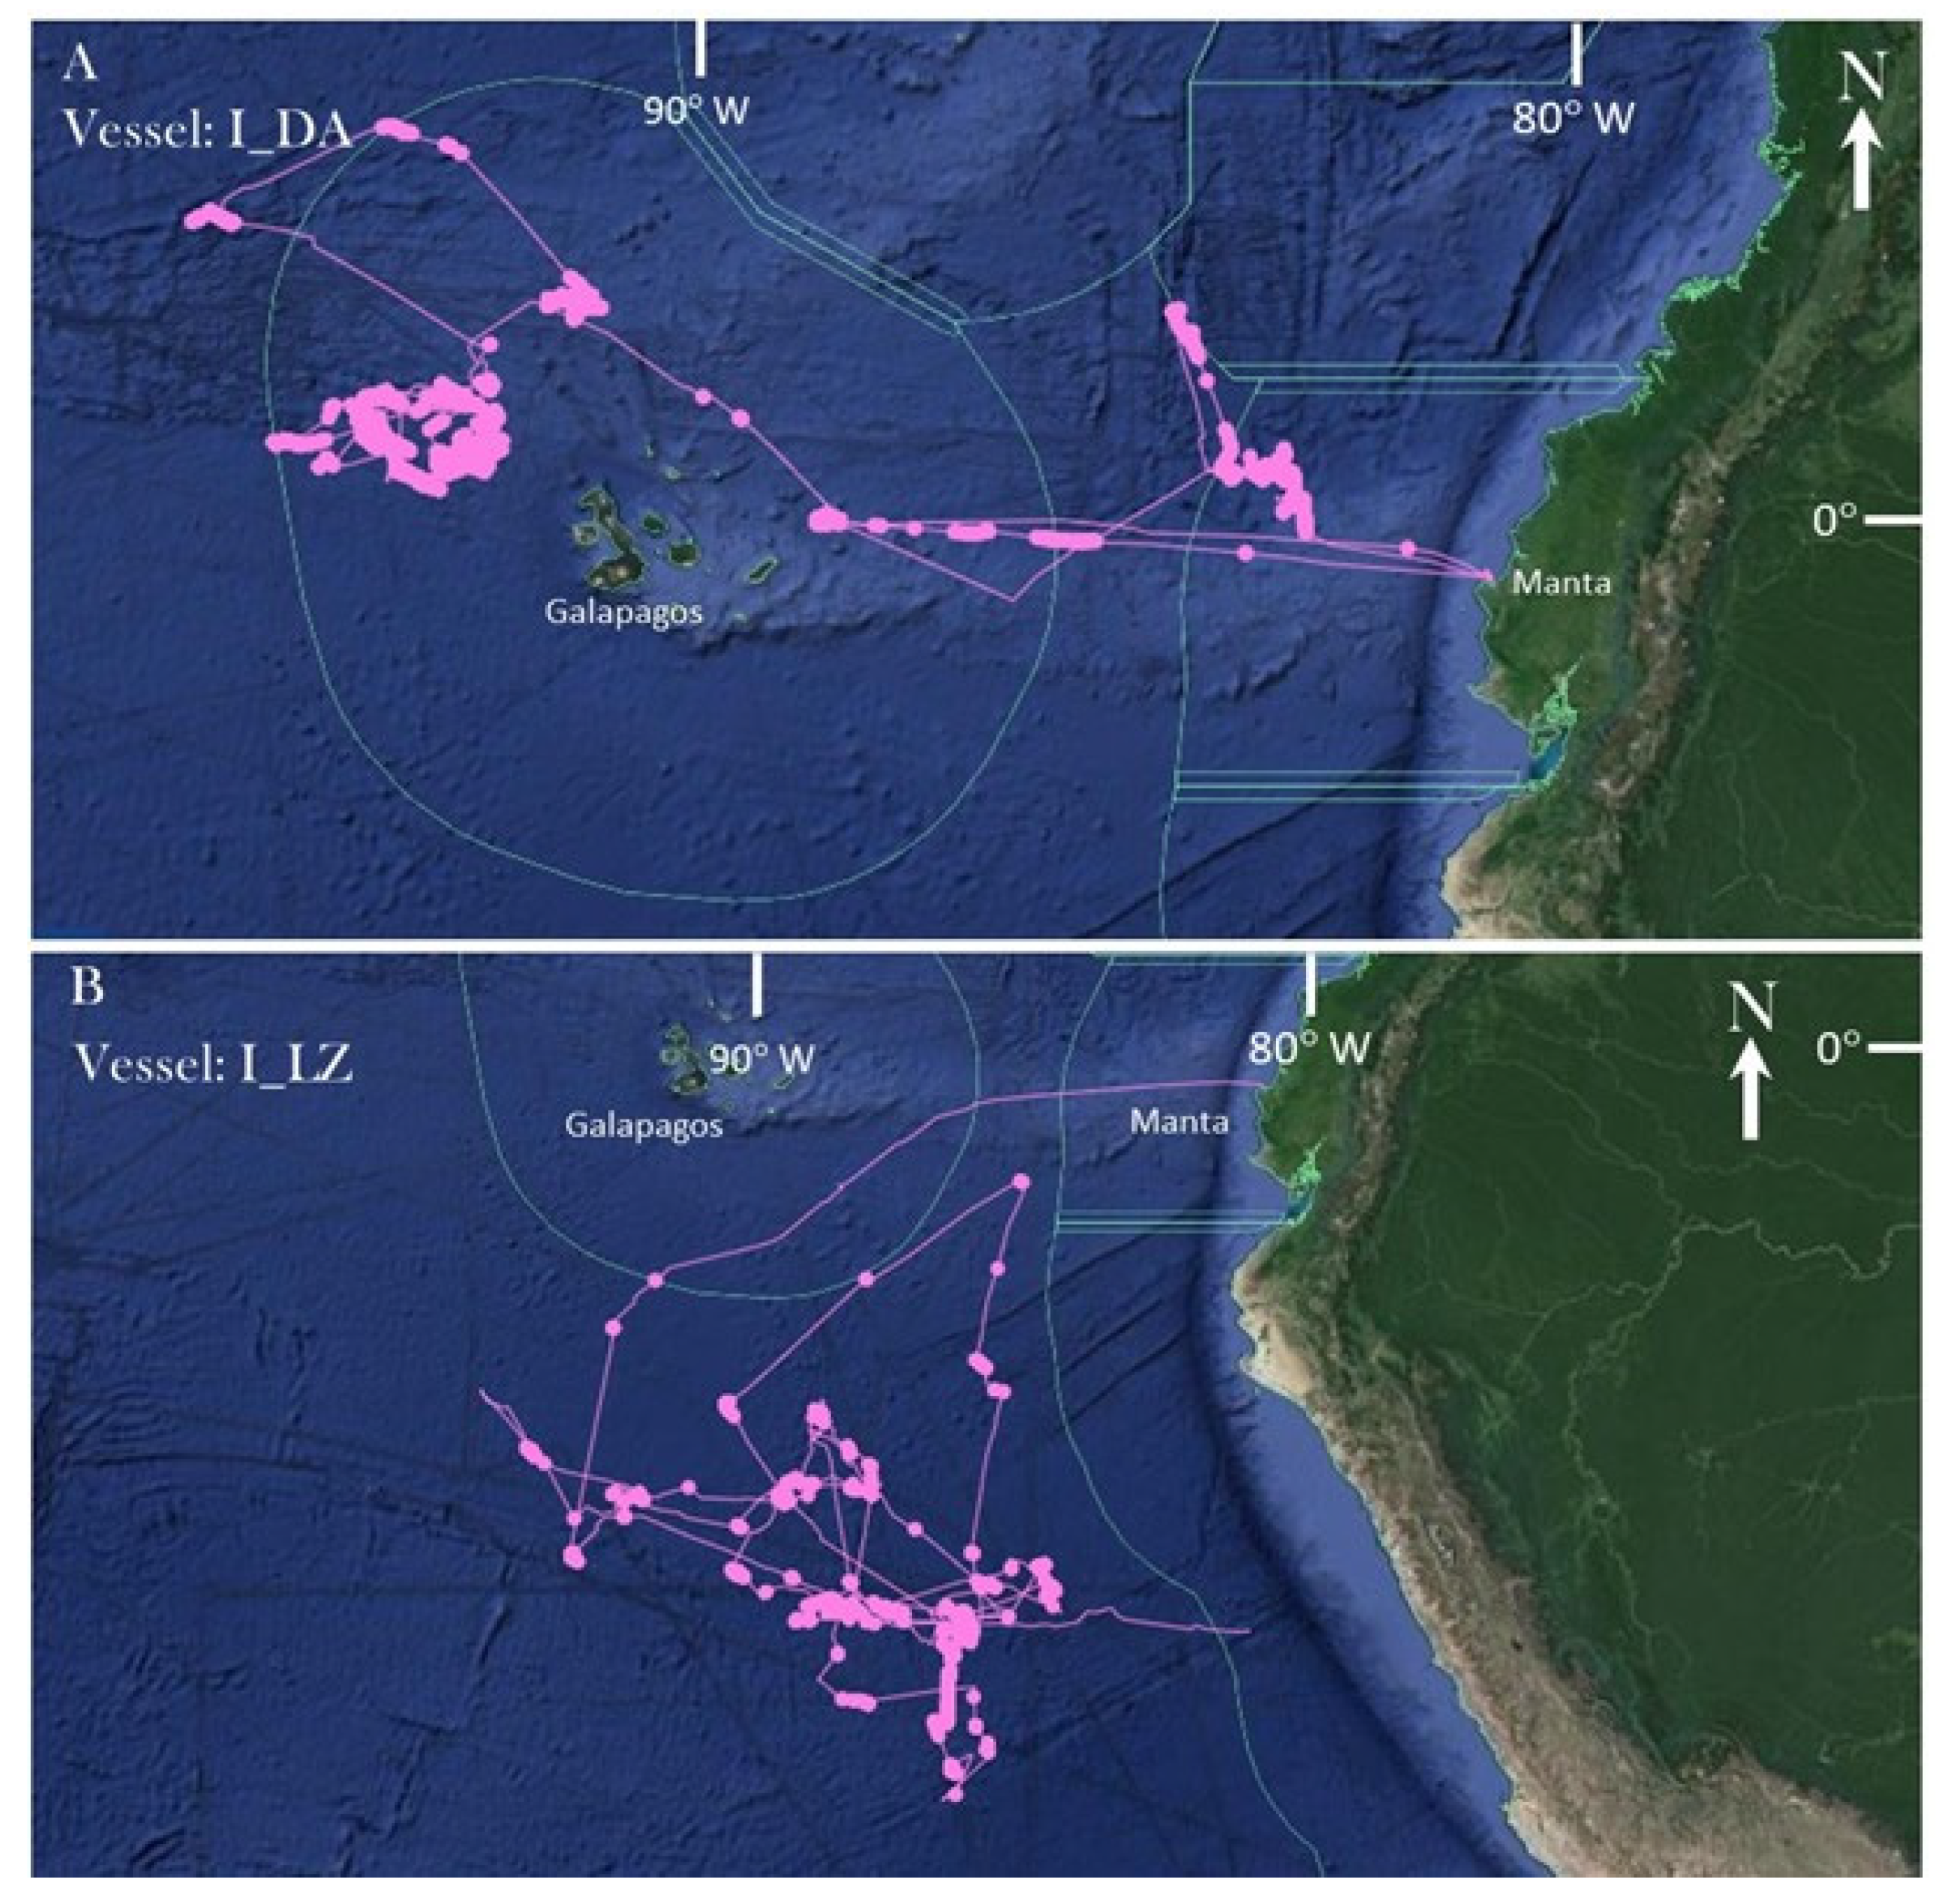
2.4. Pairing Industrial Vessel Route and Metabarcoding Results

To further validate the taxonomic accuracy of species identified from meltwater samples, we contrasted industrial fishing vessels’ travel routes against the known geographic distribution of identified fish species. This was achieved by retrieving data from the ship’s automatic ship identification system (AIS) which publicly broadcasts its identity, position, and course while at sea. AIS was originally conceived to prevent at-sea ship collisions, yet has gained attention as a powerful tool to monitor fishing vessels with that mass detection of AIS via satellite (S-AIS) [49,50]. Here, we recorded the name, Maritime Mobile Service Identity (MMSI), and flag state for the sampled industrial fishing vessel in Manta, Ecuador. We then used the public database maintained by Global Fishing Watch (available online: http://globalfishingwatch.org (accessed on 20 February 2021) to retrieve the vessel’s travel route prior to making port on our day of sampling. Instances of fishing were inferred from locations where vessel speeds slowed below 4 knots and movement occurred in a “zig-zag” pattern [51,52]. We used computer-generated native distribution maps by AquaMaps [53] to cross reference the geographic range of identified fish to see if the known range overlapped with the vessel’s fishing location.

3. Results

A total of 2,588,151 12S paired-end sequencing reads were generated from the meltwater samples from the three industrial and three artisanal fishing vessels. After applying the 1% cutoff threshold at the sample level, reads were matched to six taxonomic orders within the class Actinopterygii. These were further delimited into eight families, 13 genera, and 12 species (Table 1). Of the total reads (post-cutoff), 72.4% (565,484/781,086) were matched at the species level.
Of the 12 identified species, no single species was found across all sampled industrial and artisanal vessels (Table 2). Skipjack tuna K. pelamis and a genus-level match to tuna, Thunnus spp., were identified in samples from all three industrial vessels, whereas no species was commonly identified across the three artisanal vessels. In contrast, nine of the 12 identified species were unique to a single fishing vessel. A similar number of distinct fish species were genetically identified among the artisanal and industrial fishing vessels (one to four species per vessel) (Table 2).
No species reported as a target fish by any artisanal vessel was also identified in the eDNA results (Table 3). Notably, the target fish Merluccius gayi of the vessel A_AL was not found but the congener Merluccius productus was identified. Two GenBank entries for M. gayi (Accession FJ215054, DQ274005) did not match. There are, however, sequences for T. alalunga available on GenBank and this species was targeted by all sampled vessels, yet Thunnus cannot be resolved here and requires other primer sets. In contrast, on industrial vessels, two fish species, Acanthocybium solandri and K. pelamis, were reported by crew and identified genetically.
The route of the representative fishing vessel I_DA was traced for the 35-day fishing voyage and of I_LZ for a 76-day fishing voyage prior to making port in Manta, Ecuador on the sampling day based on AIS data obtained from the Global Fishing Watch database (Figure 2). Both vessels’ routes coincided with the verbal description and duration provided by the crew on the sampling day. The two species-level and one genus-level matches from the I_DA eDNA samples (Auxis thazard, K. pelamis, and Thunnus sp.) all had a high (0.80–1.00) relative probability of occurrence in the regions where fishing activity likely occurred (as indicated by “zig-zag” movement of the vessel) per each species’ computer-generated native distribution maps [33] (Figure 2A). Likewise, all four species-level and one genus-level match from the I_LZ eDNA sample had high (0.80–1.00) relative probability of occurrence where fishing took place. AIS data for I_EC was unavailable on the Global Fishing Watch database, whereas Ecuadorian artisanal vessels are not equipped nor required to transmit AIS data.

4. Discussion

Here, we have demonstrated that eDNA barcoding can be employed to characterize the species composition of captured fish from the meltwater leftover in industrial and artisanal fishing operations. eDNA is gaining popularity and utility in fisheries and seafood research and has the potential to be a potent and complementary tool to the growing number of approaches to improving traceability throughout the seafood supply chain [38,40,54,55]. Built upon nearly two decades of studies applying the well-vetted concept of DNA barcoding to identify fish to species level [16,56], the eDNA approach is positioned to be both a familiar and a transformative tool in improving seafood monitoring. Yet, the breadth, scale, and variety of global marine fisheries has and will continue to require an assortment of strategies to validate species identity.
Although there is room for further development of this study’s methods to achieve greater agreement between the reported target species and those species identified from the eDNA samples, our findings are encouraging and reflect a shortcoming of the current pilot study and do not represent an indictment on metabarcoding approaches themselves. For example, eDNA approaches failed to identify South Pacific hake Merluccius gayi, yet the congener North Pacific hake M. productus was identified. This was driven by a lack of 12S reference barcode sequence for this fisheries target. It highlights the importance of accurate and complete databases for successful applications of eDNA metabarcoding approaches, mainly on those markers frequently used for species identification. The Barcode of Life and recent efforts to generate region-specific reference databases such as Mo’orea BIOCODE [57] and California Current Large Marine Ecosystem [58] have dramatically improved the taxonomic assignment capabilities of eDNA metabarcoding. Thus, for the successful application of metabarcoding approaches for MCS, regional reference databases of priority species should be barcoded, allowing for tailored assays and improved resolution.
Our study design targeted vessels fishing tuna and eDNA sampling did detect Thunnus present from four vessels, including all three industrial vessels. We were, however, only able to resolve genus-level matches for tunas (Thunnus sp.). These results are not surprising as previous research has demonstrated that the MiFish Universal Teleost primers used here do not capture sufficient genetic variation to resolve this recent adaptive radiation. Thus, future applications of eDNA metabarcoding that require species-level resolution of Thunnus will need to use alternative markers such as the Thunnus-specific primer [31]. This highlights the need for thoughtful consideration into primer design and benchmarking to adequately address specific monitoring questions of interest, particularly if these assays will be used for enforcement. Notably, the common Spanish name, albacora, reported by crew can also be problematic as it regionally refers to T. alalunga, as well as T. albacares and T. obesus [59]. We note that similar eDNA metabarcoding approaches could be used for a broad suite of fisheries targets, including cryptic and hard-to-identify species, as well as invertebrate targets, employing different genetic markers tailored for specific targets. Despite these minor limitations observed here, our results demonstrate that even “universal” teleost primer sets can provide important traceability information.
Sampled industrial fishing vessels reported more targeted fish species (six) than artisanal vessels (three) but were found to have similar numbers of species genetically identified (seven) as present (Table 2 and Table 3). Differences between industrial and artisanal catches might be attributed to several factors, including fishing effort, fishing duration, and fishing gear (pelagic longline versus purse seiner). All taxa reported by industrial vessel crew and identified genetically in the eDNA samples had known geographic ranges in the eastern Pacific, including the Galapagos Islands. Furthermore, some species identified genetically may not have been targeted fish, yet were still incidentally captured. Examples include A. rochei and A. thazard that can be also captured in purse seiner nets, E. volitans which is prey of tuna species, and reef species C. maculata which may also be found off the shore of oceanic islands [59]. Furthermore, fishers normally report commercial species as targeted because they fetch the best price, yet they usually catch many other species of lower economic value which are shared with crew members, port assistants, and relatives [60]. It may be that some species identified in the eDNA samples were not precisely by-catch and are important items for food security for coastal communities [60].
One of the limitations of this study is that the true fish species within each hold were unknown. For example, although the crew of the three artisanal fishing vessels cited targeting three species for capture, seven non-target species were identified genetically (Table 2 and Table 3). These data may provide insight into which species may be taken accidentally as by-catch, an area of research in artisanal fishing that has largely been overlooked [61]. However, given the high sensitivity of these molecular methods, it is unknown whether DNA from any of these species may have persisted from previous fishing excursions or been transferred by other sources (tracked in on boots, on the ice within the holds, etc.) as fishing vessels are hardly sterile environments. Furthermore, the industrial fishing vessels had multiple holds and the failed detection of some species may be a result of not sampling every hold aboard the active vessel. It is possible we sampled a given hold filled with catch from a certain schedule (e.g., afternoon), whereas dorado (C. hippurus) was captured in the morning and stored in another hold.
Likewise, these data cannot determine if a species is absent from the fish hold. In the case of A. solandri, C. hippurus, and E. lineatus being reported as target fish by the crew of I_DA, and these fish occurring where fishing activity occurred, we did detect their signature in the genetic sample, but far below the 1% cutoff threshold used to confirm presence. A reason why may have been related to the preservation of eDNA particles in aquatic environments, which are believed to be best preserved when conditions are alkaline and kept out of solar radiation exposure [62,63]. Cooler temperatures also prolong the viability of eDNA, lasting 10 days at 25 °C and up to 53 days at 5 °C [63]. However, the volume to detect species of interest may also be a limitation. For example, [64] suggested a sample volume of 100 L to ensure a high probability of capturing eDNA from aquatic environments with a density of fish of 0.32 g m2. Here, we were less concerned with obtaining enough eDNA particles overall, given the high concentration of biomass in the fish holds, versus the greater concern that the collected sample was a representative sample of the whole hold due to the high level of fish mucus and scales in the melt water. Future work could get around this issue by pooling multiple samples collected from around the fish hold to maximize probability of detection.
Lastly, we were unable to identify species relative abundance or biomass from a catch. The ability to use eDNA metabarcoding for abundance or biomass estimation remains equivocal [65], although recent applications appear promising [40,66]. Importantly, theoretical advancement in our understanding of PCR bias suggests that the application of mock communities can be strategically used to allow for the correction and estimation of abundance [67,68]. However, more work is needed to demonstrate the ability of eDNA metabarcoding approaches to provide meaningful abundance estimates [69], particularly in fish hold settings as explored here.

5. Conclusions

Overall, the main target species of tuna (K. pelamis, Thunnus spp.) were both reported by crew and identified in the meltwater eDNA samples for all industrial vessels. Results were less consistent for artisanal vessels. Furthermore, nine of 12 genetically identified species were unique to a single fishing vessel, providing insight into the diversity of captured fishes. Genetic tools, including eDNA metabarcoding, are well positioned to aid in the monitoring and management of seafood throughout the supply chain. Arguably, we no longer need to continue demonstrating the potential of genetics but now must accelerate its implementation [70]. For example, advancements in the application of eDNA for population genetics holds promise to elucidate geographic origin and stock structure of fisheries targets [71]. To date, there have been successful applications of eDNA to identify unique haplotypes associated with specific stock structures and geographic location [72,73,74,75]. As these methods improve, such applications could provide critical information for not only identifying species from fishing holds, but also stocks and likely geographic origin [40,76], aiding in the management and traceability of fishing fleets. To meet the objectives of national and multinational fisheries policies to improve seafood traceability and combat IUU fishing, transformative action should aim to (a) apply the most appropriate technologies that are also portable and accessible [77] and (b) build a monitoring and enforcement capacity that spans from fisher to consumer [5].

Supplementary Materials

The following are available online at https://www.mdpi.com/article/10.3390/foods10061425/s1, S1: eDNA extraction protocol, S2: Library preparation protocol.

Author Contributions

Conceptualization, D.A.W.; methodology, D.A.W. and Z.G.; formal analysis, D.A.W., Z.G., and L.G.-S., investigation, D.A.W., G.N.-F., A.M.D.L., and G.S.; writing—original draft preparation, D.A.W.; writing—review and editing D.A.W., G.N.-F., Z.G., A.M.D.L., L.G.-S., and G.S.; project administration, D.A.W.; funding acquisition, D.A.W. All authors have read and agreed to the published version of the manuscript.

Funding

This research was funded in part by a U.S. Fulbright Global Scholar Award to D.A.W., and funding from the Loyola Marymount University Seaver College of Science and Engineering also to D.A.W.

Institutional Review Board Statement

Not applicable.

Informed Consent Statement

Not applicable.

Data Availability Statement

The data presented in this study are available within the article and on request from the corresponding author.

Acknowledgments

The authors extend tremendous gratitude to the Escuela Superior Poltécnica del Litoral and the University of the Philippines Marine Science Institute, who hosted the associated eDNA/IUU fishing research workshops that helped conduct this research, and the 22 workshop participants from Ecuador, Peru, and the Philippines. D.A.W. especially thanks host faculty Rachel Gotanco, Mudjie Santos, and Luis Dominguez for their kindness and collaboration, and thanks Margarita Joaquin for logistical support.

Conflicts of Interest

The authors declare no conflict of interest.

References

  1. FAO. The State of World Fisheries and Aquaculture (2020) Sustainability in Action; FAO: Rome, Italy, 2020. [Google Scholar] [CrossRef]
  2. Agnew, D.J.; Pearce, J.; Pramod, G.; Peatman, T.; Watson, R.; Beddington, J.R.; Pitcher, T.J. Estimating the worldwide extent of illegal fishing. PLoS ONE 2009, 4, e4570. [Google Scholar] [CrossRef] [Green Version]
  3. Béné, C.; Barange, M.; Subasinghe, R.; Pinstrup-Andersen, P.; Merino, G.; Hemre, G.I.; Williams, M. Feeding 9 billion by 2050–Putting fish back on the menu. Food Secur. 2015, 7, 261–274. [Google Scholar] [CrossRef] [Green Version]
  4. Al-Abdulrazzak, D.; Galland, G.R.; McClenachan, L.; Hocevar, J. Opportunities for improving global marine conservation through multilateral treaties. Mar. Policy 2017, 86, 247–252. [Google Scholar] [CrossRef]
  5. Willette, D.A.; Cheng, S.H. Delivering on seafood traceability under the new US import monitoring program. Ambio 2018, 47, 25–30. [Google Scholar] [CrossRef] [PubMed]
  6. Zhang, H. Fisheries cooperation in the South China Sea: Evaluating the options. Mar. Policy 2018, 89, 67–76. [Google Scholar] [CrossRef]
  7. He, J. Do unilateral trade measures really catalyze multilateral environmental agreements? Int. Environ. Agreem. Politics Law Econ. 2019, 19, 577–593. [Google Scholar] [CrossRef]
  8. FAO. The State of the World Fisheries and Aquaculture 2016—Contributing to Food Security and Nutrition for All; Food and Agriculture Organization of the United Nations: Rome, Italy, 2016. [Google Scholar]
  9. Ayala Villa, B. Pesca ilegal, no declara, no reglamentada—Subsecretaría de Recursos Pesqueros. In En el Seminario: Biotecnología Aplicada a la Lucha Contra la Pesca Ilegal, no Declarada y no Reglamentada en los Países del Océano Pacífico; ESPOL Polytechnic University: Guayaquil, Ecuador, 2017. [Google Scholar]
  10. Bucaram, S.J.; Hearn, A.; Trujillo, A.M.; Rentería, W.; Bustamante, R.H.; Morán, G.; Reck, G.; García, J.L. Assessing fishing effects inside and outside an MPA: The impact of the Galapagos Marine Reserve on the Industrial pelagic tuna fisheries during the first decade of operation. Mar. Policy 2018, 87, 212–225. [Google Scholar] [CrossRef]
  11. Alava, J.J.; Lindop, A.; Jacquet, J. Marine fisheries catch reconstructions for continental Ecuador: 1950–2010. In Fisheries Centre Working Paper; Fisheries Centre, University of British Columbia: Vancouver, BC, Canada, 2015; Volune 34, p. 25. [Google Scholar]
  12. Alava, J.J.; Tatar, B.; Barragán, M.J.; Castro, C.; Rosero, P.; Denkinger, J.; Jiménez, P.J.; Carvajal, R.; Samaniego, J. Mitigating cetacean bycatch in coastal Ecuador: Governance challenges for small-scale fisheries. Mar. Policy 2019, 110, 102769. [Google Scholar] [CrossRef]
  13. Schwartz, M.K.; Luikart, G.; Waples, R.S. Genetic monitoring as a promising tool for conservation and management. Trends Ecol. Evol. 2007, 22, 25–33. [Google Scholar] [CrossRef] [PubMed] [Green Version]
  14. Bourlat, S.J.; Borja, A.; Gilbert, J.; Taylor, M.I.; Davies, N.; Weisberg, S.B.; Griffith, J.F.; Lettieri, T.; Field, D.; Benzie, J.; et al. Genomics in marine monitoring: New opportunities for assessing marine health status. Mar. Pollut. Bull. 2013, 74, 19–31. [Google Scholar] [CrossRef]
  15. Lu, G.; Luo, M. Genomes of major fishes in world fisheries and aquaculture: Status, application and perspective. Aquac. Fish. 2020, 5, 163–173. [Google Scholar] [CrossRef]
  16. Marko, P.B.; Lee, S.C.; Rice, A.M.; Gramling, J.M.; Fitzhenry, T.M.; McAlister, J.S.; Moran, A.L. Mislabelling of a depleted reef fish. Nature 2004, 430, 309–310. [Google Scholar] [CrossRef]
  17. Clark, L.F. The current status of DNA barcoding technology for species identification in fish value chains. Food Policy 2015, 54, 85–94. [Google Scholar] [CrossRef]
  18. Luque, G.M.; Donlan, C.J. The characterization of seafood mislabeling: A global meta-analysis. Biol. Conserv. 2019, 236, 556–570. [Google Scholar] [CrossRef]
  19. Shehata, H.R.; Bourque, D.; Steinke, D.; Chen, S.; Hanner, R. Survey of mislabelling across finfish supply chain reveals mislabelling both outside and within Canada. Food Res. Int. 2019, 121, 723–729. [Google Scholar] [CrossRef]
  20. Barendse, J.; Roel, A.; Longo, C.; Andriessen, L.; Webster, L.M.; Ogden, R.; Neat, F. DNA barcoding validates species labelling of certified seafood. Curr. Biol. 2019, 29, R198–R199. [Google Scholar] [CrossRef] [PubMed] [Green Version]
  21. Willette, D.A.; Esteves, S.C.; Fitzpatrick, B.; Smith, M.L.; Wilson, K.; Yuan, X. The last mile challenge: Certified seafood and federal labeling laws out of sync at the end of the supply chain in Los Angeles, California. Mar. Policy 2021, 125, 104380. [Google Scholar] [CrossRef]
  22. Asis, A.M.J.M.; Lacsamana, J.K.M.; Santos, M.D. Illegal trade of regulated and protected aquatic species in the Philippines detected by DNA barcoding. Mitochondrial DNA Part A 2016, 27, 659–666. [Google Scholar] [CrossRef] [PubMed]
  23. Hobbs, C.A.; Potts, R.W.; Walsh, M.B.; Usher, J.; Griffiths, A.M. Using DNA barcoding to investigate patterns of species utilisation in UK shark products reveals threatened species on sale. Sci. Rep. 2019, 9, 1028. [Google Scholar] [CrossRef] [PubMed] [Green Version]
  24. Bernardo, C.; de Lima Adachi, A.M.C.; da Cruz, V.P.; Foresti, F.; Loose, R.H.; Bornatowski, H. The label “Cação” is a shark or a ray and can be a threatened species! Elasmobranch trade in Southern Brazil unveiled by DNA barcoding. Mar. Policy 2020, 116, 103920. [Google Scholar]
  25. Hebert, P.D.N.; Cywinska, A.; Ball, S.L.; de Waard, J.R. Biological identifications through DNA barcodes. Proc. R. Soc. B Biol. Sci. 2003, 270, 313–321. [Google Scholar] [CrossRef] [PubMed] [Green Version]
  26. Bohmann, K.; Evans, A.; Gilbert, M.T.P.; Carvalho, G.R.; Creer, S.; Knapp, M.; Yu, D.W.; de Bruyn, M. Environmental DNA for wildlife biology and biodiversity monitoring. Trends Ecol. Evol. 2014, 29, 358–367. [Google Scholar] [CrossRef] [PubMed]
  27. Kelly, R.P.; Port, J.; Yamahara, K.M.; Martone, R.G.; Lowell, N.; Thomsen, P.F.; Mach, M.E.; Bennett, M.; Prahler, E.; Caldwell, M.R.; et al. Harnessing DNA to improve environmental management. Science 2014, 344, 1455–1456. [Google Scholar] [CrossRef] [PubMed]
  28. Deiner, K.; Fronhofer, E.A.; Mächler, E.; Altermatt, F. Environmental DNA reveals that rivers are conveyer belts of biodiversity information. Biorxiv 2015. [Google Scholar] [CrossRef] [PubMed] [Green Version]
  29. Ficetola, G.F.; Miaud, C.; Pompanon, F.O.; Taberlet, P. Species detection using environmental DNA from water samples. Biol. Lett. 2008, 4, 423–425. [Google Scholar] [CrossRef] [PubMed] [Green Version]
  30. Kelly, R.P.; Port, J.A.; Yamahara, K.M.; Crowder, L.B. Using environmental DNA to census marine fishes in a large mesocosm. PLoS ONE 2014, 9, e86175. [Google Scholar] [CrossRef] [PubMed] [Green Version]
  31. Miya, M.; Sato, Y.; Fukunaga, T.; Sado, T.; Poulsen, J.Y.; Sato, K.; Minamoto, T.; Yamamoto, S.; Yamanaka, H.; Arakiet, H.; et al. MiFish, a set of universal PCR primers for metabarcoding environmental DNA from fishes: Detection of more than 230 subtropical marine species. R. Soc. Open Sci. 2015, 2, 150088. [Google Scholar] [CrossRef] [Green Version]
  32. Thomsen, P.F.; Willerslev, E. Environmental DNA—An emerging tool in conservation for monitoring past and present biodiversity. Biol. Conserv. 2014, 183, 4–18. [Google Scholar] [CrossRef]
  33. Minamoto, T.; Yamanaka, H.; Takahara, T.; Honjo, M.N.; Kawabata, Z. Surveillance of fish species composition using environmental DNA. Limnology 2011, 13, 193–197. [Google Scholar] [CrossRef] [Green Version]
  34. Takahara, T.; Minamoto, T.; Yamanaka, H.; Doi, H.; Kawabata, Z. Estimation of fish biomass using environmental DNA. PLoS ONE 2012, 7, e35868. [Google Scholar] [CrossRef] [Green Version]
  35. Pikitch, E.K. A tool for finding rare marine species. Science 2018, 360, 1180–1182. [Google Scholar] [CrossRef] [PubMed]
  36. Janzen, D.H.; Hajibabaei, M.; Burns, J.M.; Hallwachs, W.; Remigio, E.; Hebert, P.D. Wedding biodiversity inventory of a large and complex Lepidoptera fauna with DNA barcoding. Phil. Trans. R. Soc. B Biol. 2005, 360, 1835–1845. [Google Scholar] [CrossRef] [PubMed] [Green Version]
  37. Ardura, A.; Planes, S.; Garcia-Vazquez, E. Applications of DNA barcoding to fish landings: Authentication and diversity assessment. Zookeys 2013, 365, 49–65. [Google Scholar] [CrossRef] [PubMed] [Green Version]
  38. Jerde, C.L. Can we manage fisheries with the inherent uncertainty from eDNA? J. Fish Biol. 2021, 98, 341–353. [Google Scholar] [CrossRef] [PubMed]
  39. Rourke, M.L.; Fowler, A.M.; Hughes, J.M.; Broadhurst, M.K.; DiBattista, J.D.; Fielder, S.; Furlan, E.M. Environmental DNA (eDNA) as a tool for assessing fish biomass: A review of approaches and future considerations for resource surveys. Environ. DNA 2021. [Google Scholar] [CrossRef]
  40. Stoeckle, M.Y.; Adolf, J.; Charlop-Powers, Z.; Dunton, K.J.; Hinks, G.; VanMorter, S.M. Trawl and eDNA assessment of marine fish diversity, seasonality, and relative abundance in coastal New Jersey, USA. ICES J. Mar. Sci. 2021, 78, 293–304. [Google Scholar] [CrossRef]
  41. Burgess, M.G.; McDermott, G.R.; Owashi, B.; Reeves, L.E.P.; Clavelle, T.; Ovando, D.; Costello, C. Protecting marine mammals, turtles, and birds by rebuilding global fisheries. Science 2018, 359, 1255–1258. [Google Scholar] [CrossRef] [Green Version]
  42. Leray, M.; Yang, J.Y.; Meyer, C.P.; Mills, S.C.; Agudelo, N.; Ranwez, V.; Machida, R.J. A new versatile primer set targeting a short fragment of the mitochondrial COI region for metabarcoding metazoan diversity: Application for characterizing coral reef fish gut contents. Front. Zool. 2013, 10, 34. [Google Scholar] [CrossRef] [PubMed] [Green Version]
  43. Bokulich, N.A.; Dillon, M.R.; Zhang, Y.; Rideout, J.R.; Bolyen, E.; Li, H.; Caporaso, J.G. q2-longitudinal: Longitudinal and paired-sample analyses of microbiome data. MSystems 2018, 3, e00219-18. [Google Scholar] [CrossRef] [Green Version]
  44. Aguirre-Pabon, J.C.; Orozco Berdugo, G., Jr.; Narváez Barandica, J.C. Genetic status, source and establishment risk of the giant tiger shrimp (Penaeidae: Penaeus monodon), an invasive species in Colombian Caribbean waters. Acta Biológica Colomb. 2015, 20, 117–127. [Google Scholar] [CrossRef]
  45. Spens, J.; Evans, A.R.; Halfmaerten, D.; Knudsen, S.W.; Sengupta, M.E.; Mak, S.S.; Hellström, M. Comparison of capture and storage methods for aqueous macrobial eDNA using an optimized extraction protocol: Advantage of enclosed filter. Methods Ecol. Evol. 2017, 8, 635–645. [Google Scholar] [CrossRef] [Green Version]
  46. Gold, Z.; Sprague, J.; Kushner, D.J.; Zerecero Marin, E.; Barber, P.H. eDNA metabarcoding as a biomonitoring tool for marine protected areas. PLoS ONE 2021, 16, e0238557. [Google Scholar] [CrossRef] [PubMed]
  47. Curd, E.E.; Gold, Z.; Kandlikar, G.S.; Gomer, J.; Ogden, M.; O’Connell, T.; Pipes, L.; Schweizer, T.M.; Rabichow, L.; Lin, M.; et al. Anacapa Toolkit: An environmental DNA toolkit for processing multilocus metabarcode datasets. Methods Ecol. Evol. 2019, 10, 1469–1475. [Google Scholar] [CrossRef] [Green Version]
  48. Kandlikar, G.S.; Gold, Z.J.; Cowen, M.C.; Meyer, R.S.; Freise, A.C.; Kraft, N.J.; Curd, E.E. ranacapa: An R package and Shiny web app to explore environmental DNA data with exploratory statistics and interactive visualizations. F1000Research 2018, 7, 1734. [Google Scholar] [CrossRef] [PubMed]
  49. McCauley, D.J.; Woods, P.; Sullivan, B.; Bergman, B.; Jablonicky, C.; Roan, A.; Hirshfield, M.; Boerder, K.; Worm, B. Ending hide and Seek at Sea. Science 2016, 351, 1148–1150. [Google Scholar] [CrossRef] [PubMed] [Green Version]
  50. Taconet, M.; Kroodsma, D.A.; Fernandes, J.A. Global Atlas of AIS-Based Fishing Activity—Challenges and Opportunities; FAO: Rome, Italy, 2019. [Google Scholar]
  51. Bez, N.; Walker, E.; Gaertner, D.; Rivoirard, J.; Gaspar, P. Fishing activity of tuna purse seiners estimated from vessel monitoring system (VMS) data. Can. J. Fish. Aquat. Sci. 2011, 68, 1998–2010. [Google Scholar] [CrossRef]
  52. de Souza, E.N.; Boerder, K.; Matwin, S.; Worm, B. Improving fishing pattern detection from satellite AIS using data mining and machine learning. PLoS ONE 2016, 11, e0158248. [Google Scholar]
  53. Kaschner, K.; Kesner-Reyes, K.; Garilao, C.; Segschneider, J.; Rius-Barile, J.; Rees, T.; Froese, R. AquaMaps: Predicted Range Maps for Aquatic Species. Available online: https://www.aquamaps.org (accessed on 20 February 2021).
  54. von Gersdorff Jørgensen, L.; Nielsen, J.W.; Villadsen, M.K.; Vismann, B.; Dalvin, S.; Mathiessen, H.; Buchmann, K. A non-lethal method for detection of Bonamia ostreae in flat oyster (Ostrea edulis) using environmental DNA. Sci. Rep. 2020, 10, 16143. [Google Scholar] [CrossRef]
  55. Noh, E.S.; Lee, M.N.; Kim, E.M.; Nam, B.H.; Noh, J.K.; Park, J.Y.; Kang, J.H. Discrimination of raw material species in mixed seafood products (surimi) using the next generation sequencing method. Food Biosci. 2021, 41, 100786. [Google Scholar] [CrossRef]
  56. Willette, D.A.; Simmonds, S.E.; Cheng, S.H.; Esteves, S.; Kane, T.L.; Nuetzel, H.; Pilaud, N.; Rachmawati, R.; Barber, P.H. Using DNA barcoding to track seafood mislabeling in Los Angeles restaurants. Conserv. Biol. 2017, 31, 1076–1085. [Google Scholar]
  57. Leray, M.; Boehm, J.T.; Mills, S.C.; Meyer, C.P. Moorea BIOCODE barcode library as a tool for understanding predator–prey interactions: Insights into the diet of common predatory coral reef fishes. Coral Reefs 2012, 31, 383–388. [Google Scholar] [CrossRef]
  58. Gold, Z.; Curd, E.; Goodwin, K.; Choi, E.; Frable, B.; Thompson, A.; Barber, P. Improving Metabarcoding Taxonomic Assignment: A Case Study of Fishes in a Large Marine Ecosystem. Authorea Prepr. 2021. [Google Scholar] [CrossRef]
  59. Froese, R.; Pauly, D. (Eds.) FishBase; World Wide Web Electronic Publication; 2021; Available online: www.fishbase.org (accessed on 20 February 2021).
  60. Béné, C. Small-Scale Fisheries: Assessing Their Contribution to Rural Livelihoods in Developing Countries; FAO Fisheries Circular No. 1008; FAO: Rome, Italy, 2006; p. 46. [Google Scholar]
  61. Peckham, S.H.; Díaz, D.M.; Walli, A.; Ruiz, G.; Crowder, L.B.; Nichols, W.J. Small-scale fisheries bycatch jeopardizes endangered Pacific loggerhead turtles. PLoS ONE 2007, 2, e1041. [Google Scholar] [CrossRef] [PubMed]
  62. Pilliod, D.S.; Goldberg, C.S.; Arkle, R.S.; Waits, L.P. Factors influencing detection of eDNA from a stream-dwelling amphibian. Mol. Ecol. Resour. 2014, 14, 109–116. [Google Scholar] [CrossRef] [PubMed]
  63. Strickler, K.M.; Fremier, A.K.; Goldberg, C.S. Quantifying effects of UV-B, temperature, and pH on eDNA degradation in aquatic microcosms. Biol. Conserv. 2015, 183, 85–92. [Google Scholar] [CrossRef]
  64. Moyer, G.R.; Diaz-Ferguson, E.; Hill, J.E.; Shea, C. Assessing environmental DNA detection in controlled lentic systems. PLoS ONE 2014, 9, e103767. [Google Scholar] [CrossRef]
  65. Deiner, K.; Bik, H.M.; Mächler, E.; Seymour, M.; Lacoursière-Roussel, A.; Altermatt, F.; Bernatchez, L. Environmental DNA metabarcoding: Transforming how we survey animal and plant communities. Mol. Ecol. 2017, 26, 5872–5895. [Google Scholar] [CrossRef]
  66. Di Muri, C.; Lawson Handley, L.; Bean, C.W.; Li, J.; Peirson, G.; Sellers, G.S.; Hänfling, B. Read counts from environmental DNA (eDNA) metabarcoding reflect fish abundance and biomass in drained ponds. Metabarcoding Metagenomics 2020, 4, 97–112. [Google Scholar] [CrossRef]
  67. Kelly, R.P.; Shelton, A.O.; Gallego, R. Understanding PCR processes to draw meaningful conclusions from environmental DNA studies. Sci. Rep. 2019, 9, 12133. [Google Scholar] [CrossRef] [Green Version]
  68. McLaren, M.R.; Willis, A.D.; Callahan, B.J. Consistent and correctable bias in metagenomic sequencing experiments. Elife 2019, 8, e46923. [Google Scholar] [CrossRef] [PubMed]
  69. Beng, K.C.; Corlett, R.T. Applications of environmental DNA (eDNA) in ecology and conservation: Opportunities, challenges and prospects. Biodivers. Conserv. 2020, 29, 2089–2121. [Google Scholar] [CrossRef]
  70. Bernatchez, L.; Wellenreuther, M.; Araneda, C.; Ashton, D.T.; Barth, J.M.; Beacham, T.D.; Withler, R.E. Harnessing the power of genomics to secure the future of seafood. Trends Ecol. Evol. 2017, 32, 665–680. [Google Scholar] [CrossRef] [Green Version]
  71. Sigsgaard, E.E.; Jensen, M.R.; Winkelmann, I.E.; Møller, P.R.; Hansen, M.M.; Thomsen, P.F. Population-level inferences from environmental DNA—Current status and future perspectives. Evol. Appl. 2020, 13, 245–262. [Google Scholar] [CrossRef] [PubMed] [Green Version]
  72. Sigsgaard, E.E.; Nielsen, I.B.; Bach, S.S.; Lorenzen, E.D.; Robinson, D.P.; Knudsen, S.W.; Thomsen, P.F. Population characteristics of a large whale shark aggregation inferred from seawater environmental DNA. Nat. Ecol. Evol. 2017, 1, 4. [Google Scholar] [CrossRef]
  73. Parsons, K.M.; Everett, M.; Dahlheim, M.; Park, L. Water, water everywhere: Environmental DNA can unlock population structure in elusive marine species. R. Soc. Open Sci. 2018, 5, 180537. [Google Scholar] [CrossRef] [PubMed] [Green Version]
  74. Reinholdt Jensen, M.; Egelyng Sigsgaard, E.; Agersnap, S.; Jessen Rasmussen, J.; Baattrup-Pedersen, A.; Wiberg-Larsen, P.; Francis Thomsen, P. Seasonal turnover in community composition of stream-associated macroinvertebrates inferred from freshwater environmental DNA metabarcoding. Environ. DNA 2021, 1–16. [Google Scholar] [CrossRef]
  75. Pochardt, M.; Allen, J.M.; Hart, T.; Miller, S.D.; Yu, D.W.; Levi, T. Environmental DNA facilitates accurate, inexpensive, and multiyear population estimates of millions of anadromous fish. Mol. Ecol. Resour. 2020, 20, 457–467. [Google Scholar] [CrossRef]
  76. Lacoursière-Roussel, A.; Côté, G.; Leclerc, V.; Bernatchez, L. Quantifying relative fish abundance with eDNA: A promising tool for fisheries management. J. Appl. Ecol. 2016, 53, 1148–1157. [Google Scholar] [CrossRef]
  77. Ames, C.L.; Ohdera, A.H.; Colston, S.M.; Collins, A.G.; Fitt, W.K.; Morandini, A.C.; Vora, G.J. Fieldable Environmental DNA Sequencing to Assess Jellyfish Biodiversity in Nearshore Waters of the Florida Keys, United States. Front. Mar. Sci. 2021, 8, 369. [Google Scholar] [CrossRef]
Figure 1. Schematic overview of experimental design using eDNA metabarcoding to characterize fish catch from industrial and artisanal fishing vessels in Ecuador.
Foods 10 01425 g001
Figure 2. Fishing route (pink line) of industrial fishing vessels (A) I_DA and (B) I_LZ based on AIS information. Fishing duration was 35 and 76 days, respectively. Green line indicates Economic Exclusive Zones of 200 nautical miles from shore. Imagery adapted from GlobalFishingWatch.org.
Foods 10 01425 g002
Table 1. Taxonomic classification of amplicon sequence variants (ASVs) across all sampled fishing vessels. ““ indicates same taxonomic level as above cell. -indicates no data.
OrderFamilyGenusSpecies (Common Name)
AcanthuriformesScianenidae--
BeloniformesExocoetidaeExocoetusExocoetus volitans (two-wing flying fish)
““HemiramphidaeOxyporhamphusOxyporhamphus Micropterus (bigwing halfbeak)
CarangiformesCarangidaeSeriolaSeriola rivoliana (longfin yellowtail)
““““ChloroscombrusChloroscombrus orquesta (Pacific bumper)
““““DecapterusDecapterus macrosoma (shortfin scad)
GadiformesMerlucciidaeMerlucciusMerluccius productus (North Pacific hake)
IstiophoriformesIstiophridae--
ScombriformesScombridaeAcanthocybiumAcanthocybium solandri (wahoo)
““““AuxisAuxis rochei (bullet tuna)
““““““Auxis thazard (frigate tuna)
““““KatsuwonusKatsuwonus pelamis (skipjack tuna)
““““SardaSarda orientalis (striped bonito)
““““Euthynnus-
““““Thunnus-
TetradontiformesBalistidaeCanthidermisCanthidermis maculate (rough triggerfish)
Table 2. Species- or genus-level taxa identified in eDNA samples as present (P) in artisanal and industrial fishing vessels. Grey highlighting signifies taxon was listed by crew/captain as targeted fish in catch.
Artisanal Fishing VesselIndustrial Fishing Vessel
SpeciesA_ALA_ECA_EDI_DAI_ECI_LZ
Acanthocybium solandri P
Auxis rochei P P
Auxis thazard P PP
Canthidermis maculate P
Chloroscombrus sorquetaP
Decapterus macrosoma P
Exocoetus volitans P
Katsuwonus pelamis PPP
Merluccius productusP
Oxyporhamphus Micropterus P
Sarda orientalis P
Seriola rivoliana P
Genus level only
Euthynnus P
Thunnus PPPP
Table 3. Species reported by each vessel’s crew as targeted fish (P) in catch. Spanish name reported in parenthesis. Peje sierra is also sometimes used for Scomberomorus sierra and albacora may sometimes be used for Thunnus albacares and T. obesus regionally.
SpeciesA_ALA_ECA_EDI_DAI_ECI_LZ
Acanthocybium solandri (peje sierra) P P
Coryphaena hippurus (dorado) P P
Euthynnus lineatus (pata seca) P
Istiompax indica (picudo) P
Katsuwonus pelamis (bonito) P PPP
Merluccius gayi (merluza)P
Thunnus alalunga (albacora)PPPPPP
Publisher’s Note: MDPI stays neutral with regard to jurisdictional claims in published maps and institutional affiliations.

