Multiple SERS Detection of Phenol Derivatives in Tap Water †
by
 , , , and
Anxo Carreira-Casais
1 ,
,
Verónica Montes-García
2,
Isabel Pastoriza-Santos
2,
Miguel Ángel Prieto
1 ,
,
Jesus Simal-Gandara
1,* and
and
Jorge Pérez-Juste
2,* 1
Nutrition and Bromatology Group, Department of Analytical and Food Chemistry, Faculty of Science, University of Vigo, Ourense Campus, E-32004 Ourense, Spain
2
Department of Physical Chemistry, Biomedic Research Center of Galicia (CINBIO), University of Vigo, Lagoas, Marcosende Campus, 36310 Vigo, Spain
*
Authors to whom correspondence should be addressed.
†
Presented at the 1st International Electronic Conference on Food Science and Functional Foods, 10–25 November 2020; Available online: https://foods_2020.sciforum.net/ .
Proceedings 2021, 70(1), 88; https://doi.org/10.3390/foods_2020-07755
Published: 10 November 2020
(This article belongs to the Proceedings of The 1st International Electronic Conference on Food Science and Functional Foods)
Abstract
:Phenol and some of its derivatives are products of the petrochemical industry. These compounds are characterized by their exceptional ability to persist in media and reach both food and water used by human beings. The consumption of these compounds has harmful effects on health, producing both acute and chronic effects—among the most prominent damages are teratogenicity, mutagenicity and carcinogenicity. Compounds such as phenol, ortho-cresol, and 1-napthol are listed by agencies such as the EPA. The aim of this work was the development of a rapid method for the simultaneous detection of these compounds in water samples. The method was based on the colorimetric reaction between phenol derivatives and Gibbs reagent, which forms indophenolates; using increased surface Raman spectroscopy together with statistical methods, SERS spectra were acquired, which were then analyzed. The developed method allows one to at least equalize the detection limits of the colorimetric method through UV–VIS spectroscopy and to discriminate among the three mixed phenols in at least binary aqueous samples. The major advantage of the method is the possibility of discriminating between phenol spectra quickly and easily.
1. Introduction
Phenol and its derivatives are compounds generally produced by the petrochemical industry, although to a lesser extent they can be produced naturally. In addition, they are also part of a multitude of pesticides. These compounds have one or more phenolic rings and are widely persistent in media. They produce both acute and long-term effects. Among the long-term effects are carcinogenicity, mutagenicity, teratogenicity and others; therefore, control agencies such as the EPA have established limits for them [1]. The reference method for the determination of total phenols in water is based on the spectrophotometric measurement of the product of the reaction of total phenols with 4-aminoantipyrine [2,3]. The aim of this method is to develop a rapid system for the detection of phenol and some of its derivatives in water samples. This method is based on the comparison of the Surface-enhanced Raman spectroscopy SERS spectra of the different indophenolates formed after the reaction in a basic medium between the Gibbs reagent and phenol and its derivatives [4,5,6]. Analysis by UV–VIS allows the quantification of total phenols present in the water sample; however, it is not possible to distinguish between them. For this reason, the SERS spectra of the reaction products have been obtained and have been analyzed using principal component analysis to look for differences between the different concentrations of the same compound and between different compounds.
2. Material and Methods
2.1. Materials
Phenol (99%), ortho-cresol (99%) and 1-naphtol (99%) were purchased from Sigma-Aldrich, and 2,6-dichloroquinone-4-chloroimide (dbqc) (97%) was purchased from Sigma-Aldrich. Milli-Q water was employed in the synthesis of nanoparticles. The SERS substrate was home-made using layer-by-layer deposition of 60 nm Au@nanospheres produced using the method of Bastús et al. (2011) [7] into a piece of glass. The characterization of the nanoparticles was carried out using a JEOL JEM 1010 Transmission Electron Microscope (TEM). UV–VIS spectra were recorded using an 8543 Agilent spectrophotometer and SERS spectra were recorded using and Renishaw InVia Reflex System.
2.2. Methods
SERS Substrates Synthesis
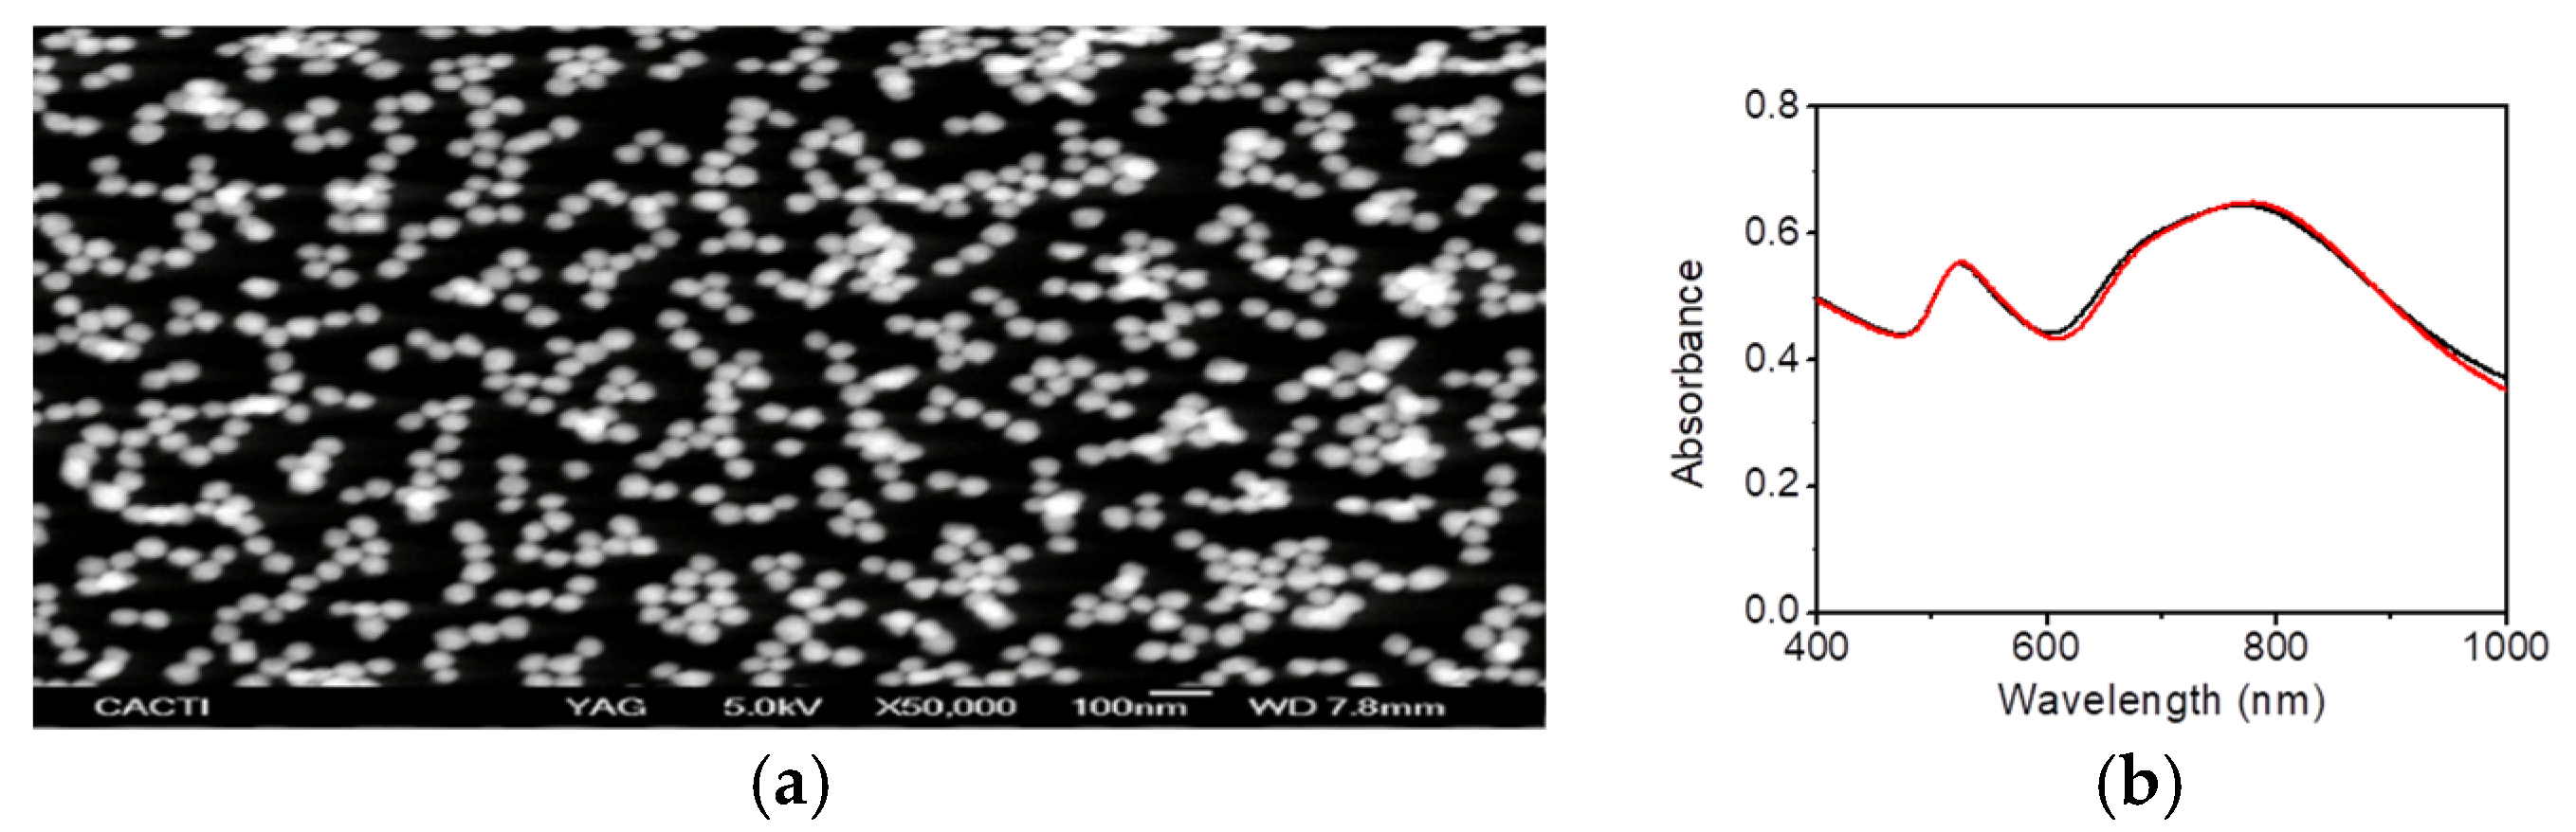
Following Bastús et al. (2011), 60 nm gold nanospheres were growth. These nanospheres were deposited into a glass substrate using the layer-by-layer method. This created a substrate that allowed us to greatly enhance the signal (Figure 1).
2.3. Experiment
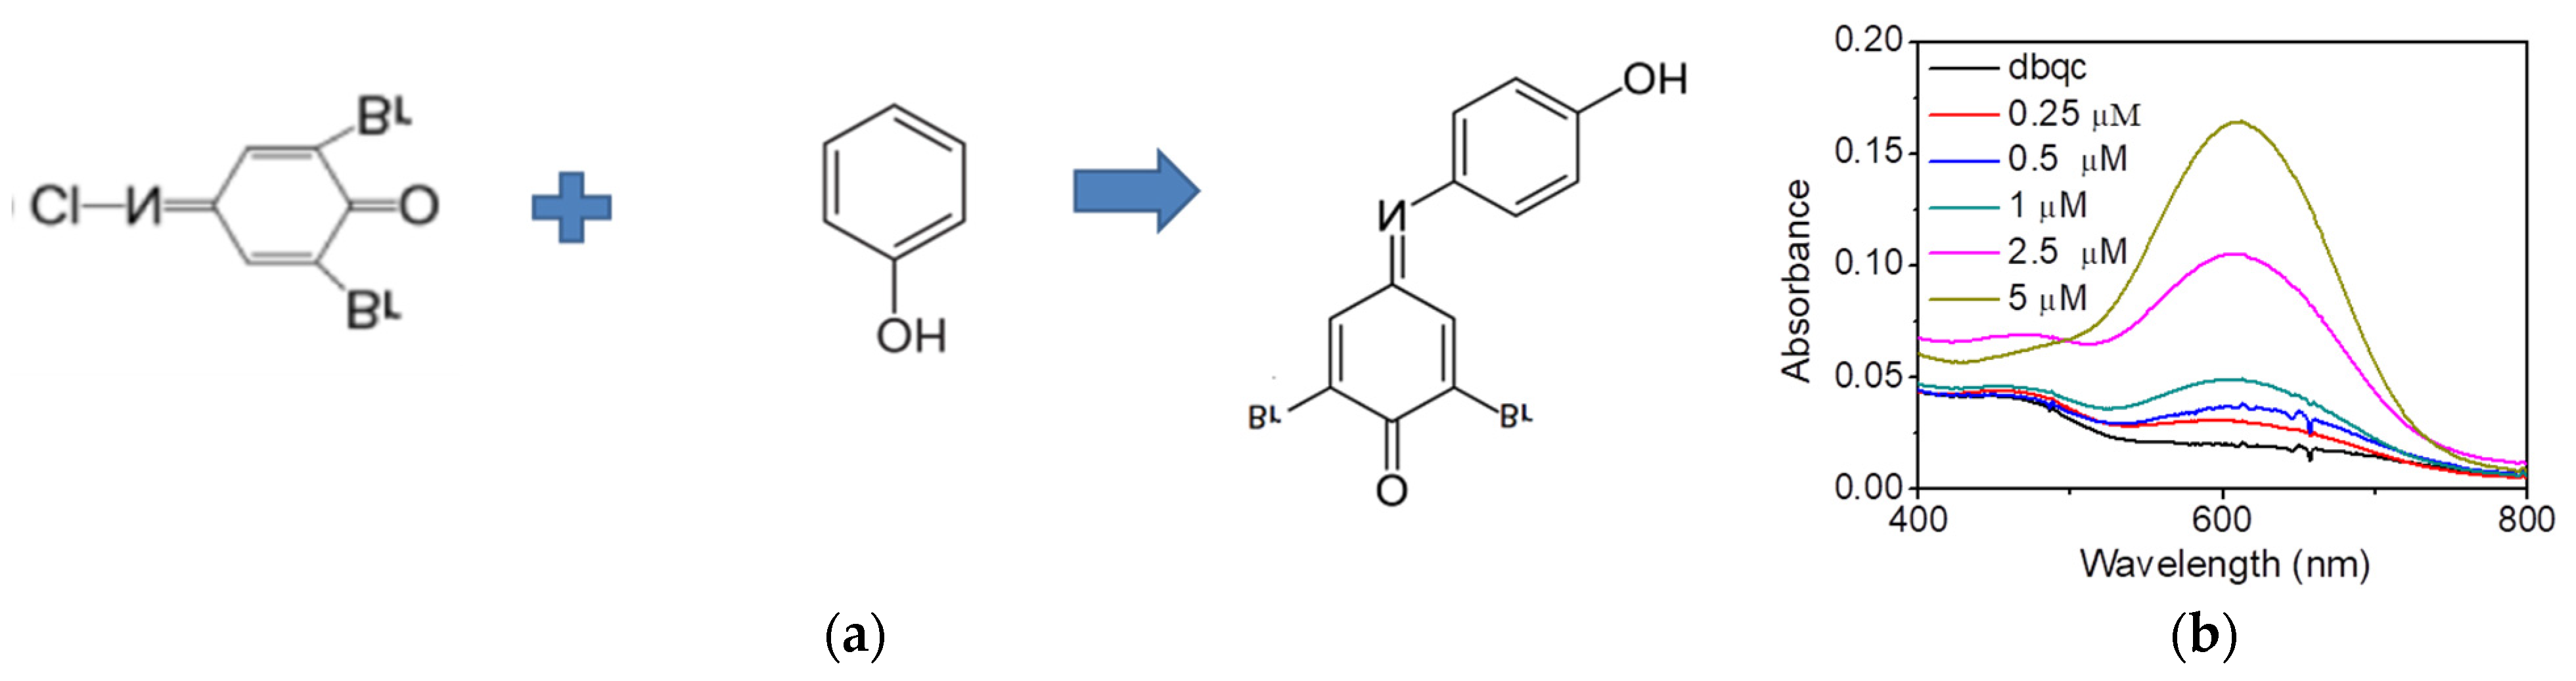
The experiment is based on the reaction between phenol or a non-para-substituted phenol derivative in basic medium, to form and indophenolate. This indophenolate (Figure 2) is a green colored compound with an absorption band around 600 nm (Figure 3). The concentration of the reactive of Gibbs employed in the experiment was always constant at 50 µM.
The resulting indophenolates have an absorption band at around 600 nm and it is not possible to distinguish between the phenol and the phenol derivatives; hence, the SERS experiment was performed. The SERS spectra were performed by putting a drop of the resulting indophenolates into a SERS substrate, and measuring the spectra using a Renishaw Invia Reflex System; for this, a 633 nm laser line was employed due to the possibility of the indophenolates to act in resonance conditions due to their 600 nm absorption band.
2.4. Data
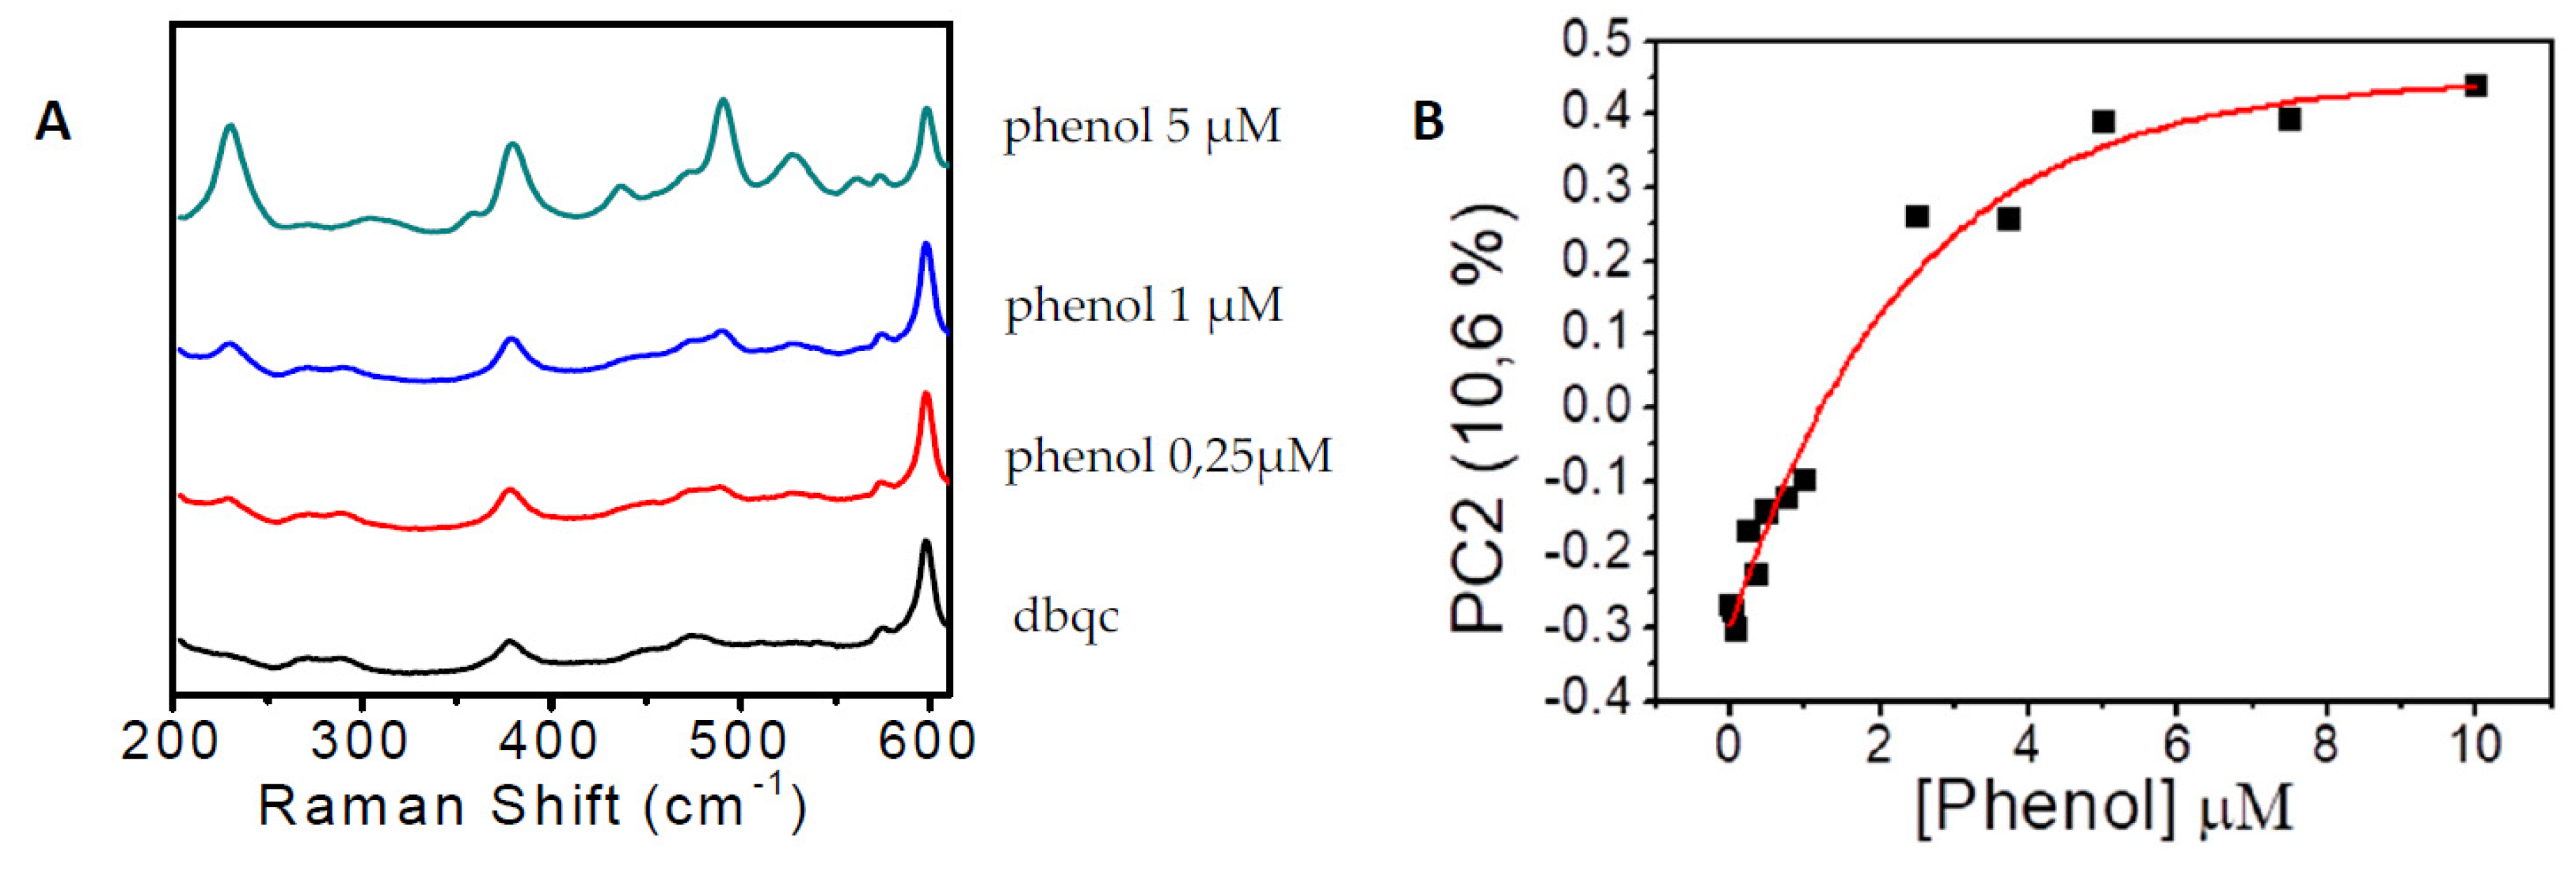
The obtained spectra were statistical analysis using R and spectra Principal Component Analysis (PCA) was performed to quantify and distinguish between phenols. All the data represented in the graphs are the average of at least 16 points of measurement. The regression of the SERS spectra in the phenol’s case was performed using a Hill–Langmuir regression.
3. Results
The first experiment was the verification of the detection and quantification of the phenolic compounds separately. The detection limits of the spectrometric method were found to equalize and sometimes even improve. Quantification was carried out for the three phenols, describing the same in the lower figure for the case of phenol (Figure 3)
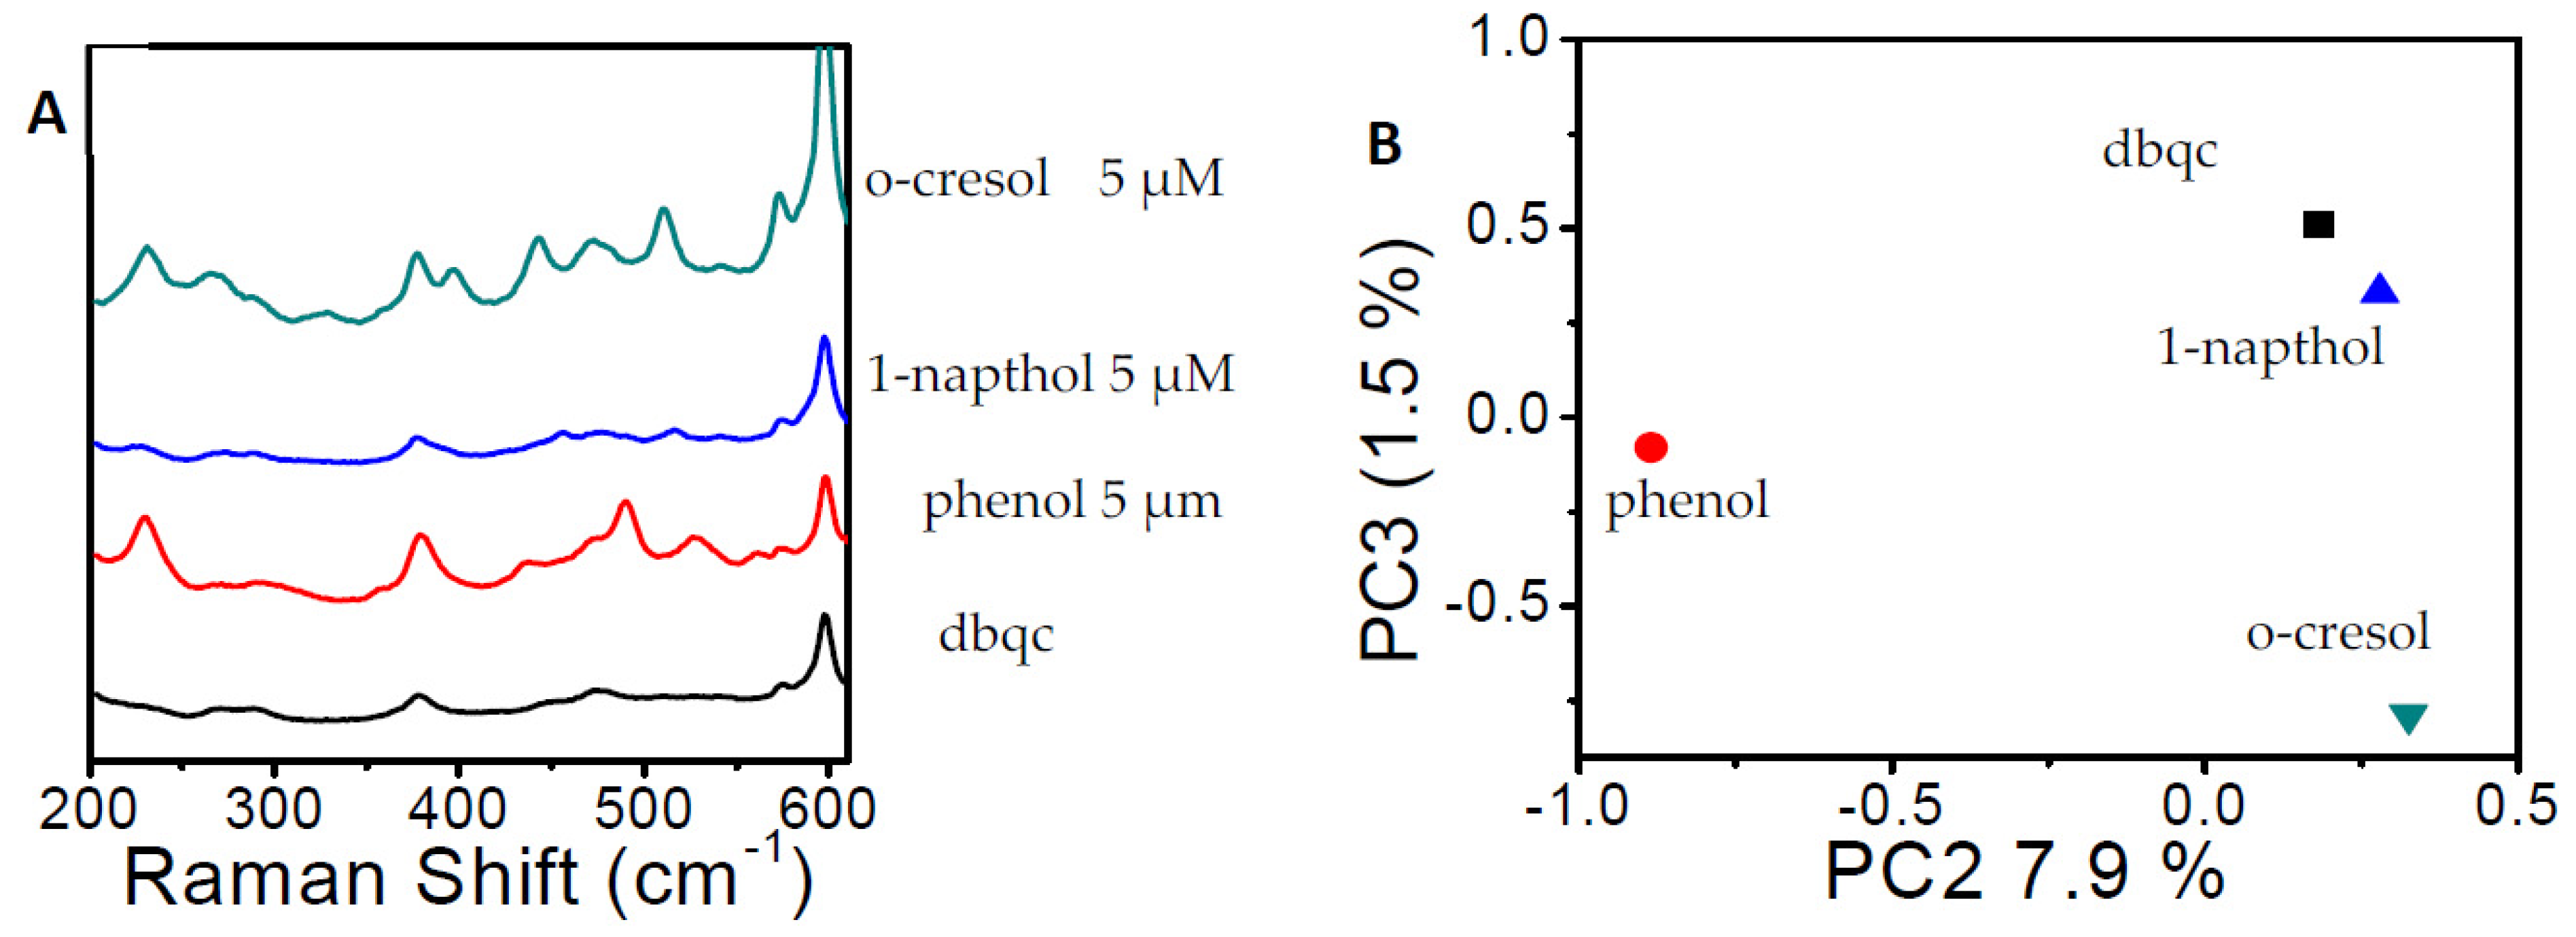
When the detection of the phenol was performed, other phenol derivatives were used in order to attempt a multiplex detection; the spectra of the products of the reaction between 1-Naphthol, ortho-cresol and phenol at 5 µM concentration are represented in the figure below (Figure 4). To clearly distinguish between those SERS spectra, Principal Component Analysis (PCA) was performed. This technique is a powerful statistical method that looks for difference between the ratio of peaks in the spectra (Figure 4a,b).
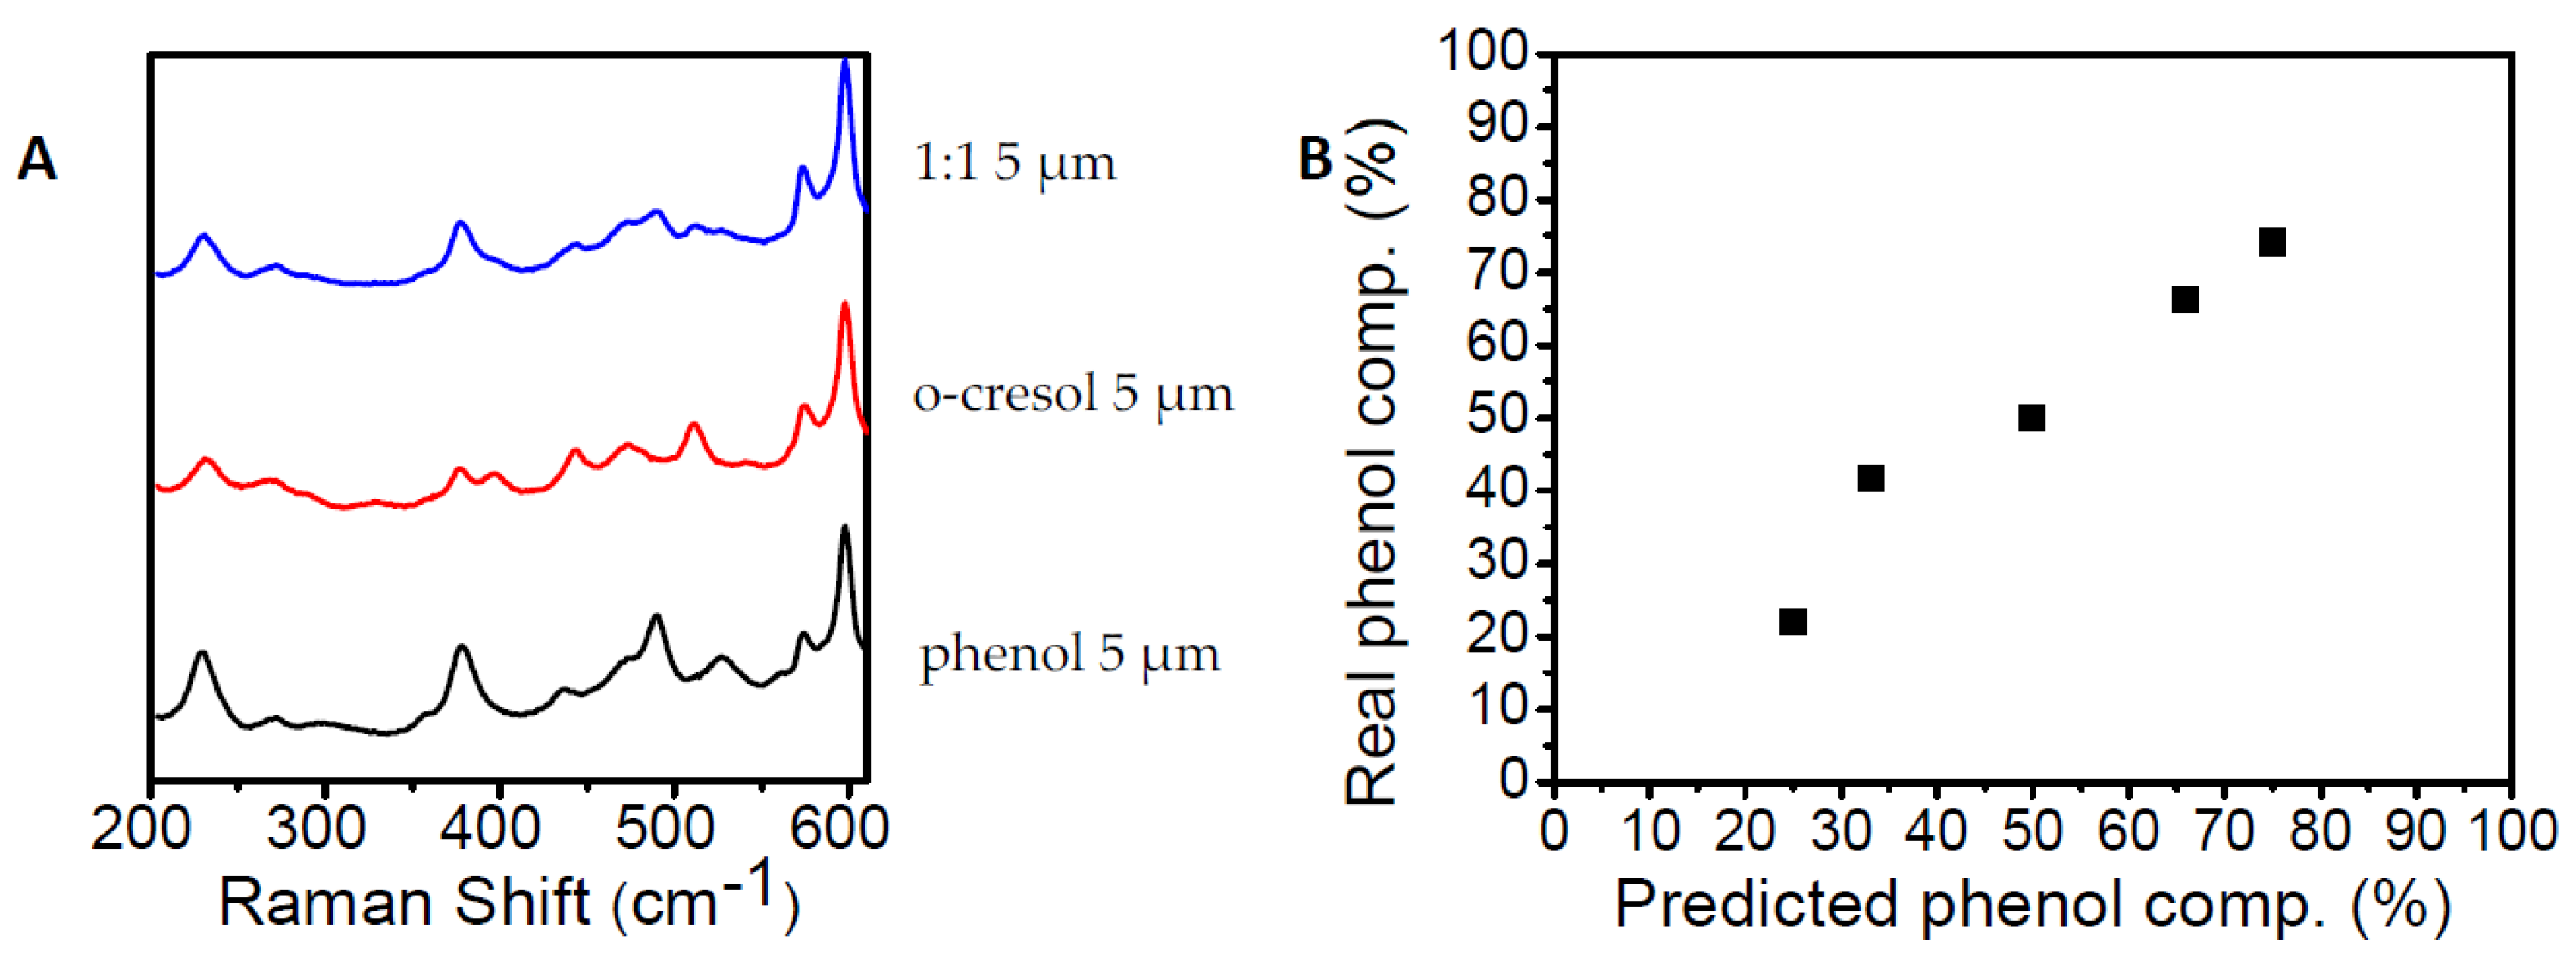
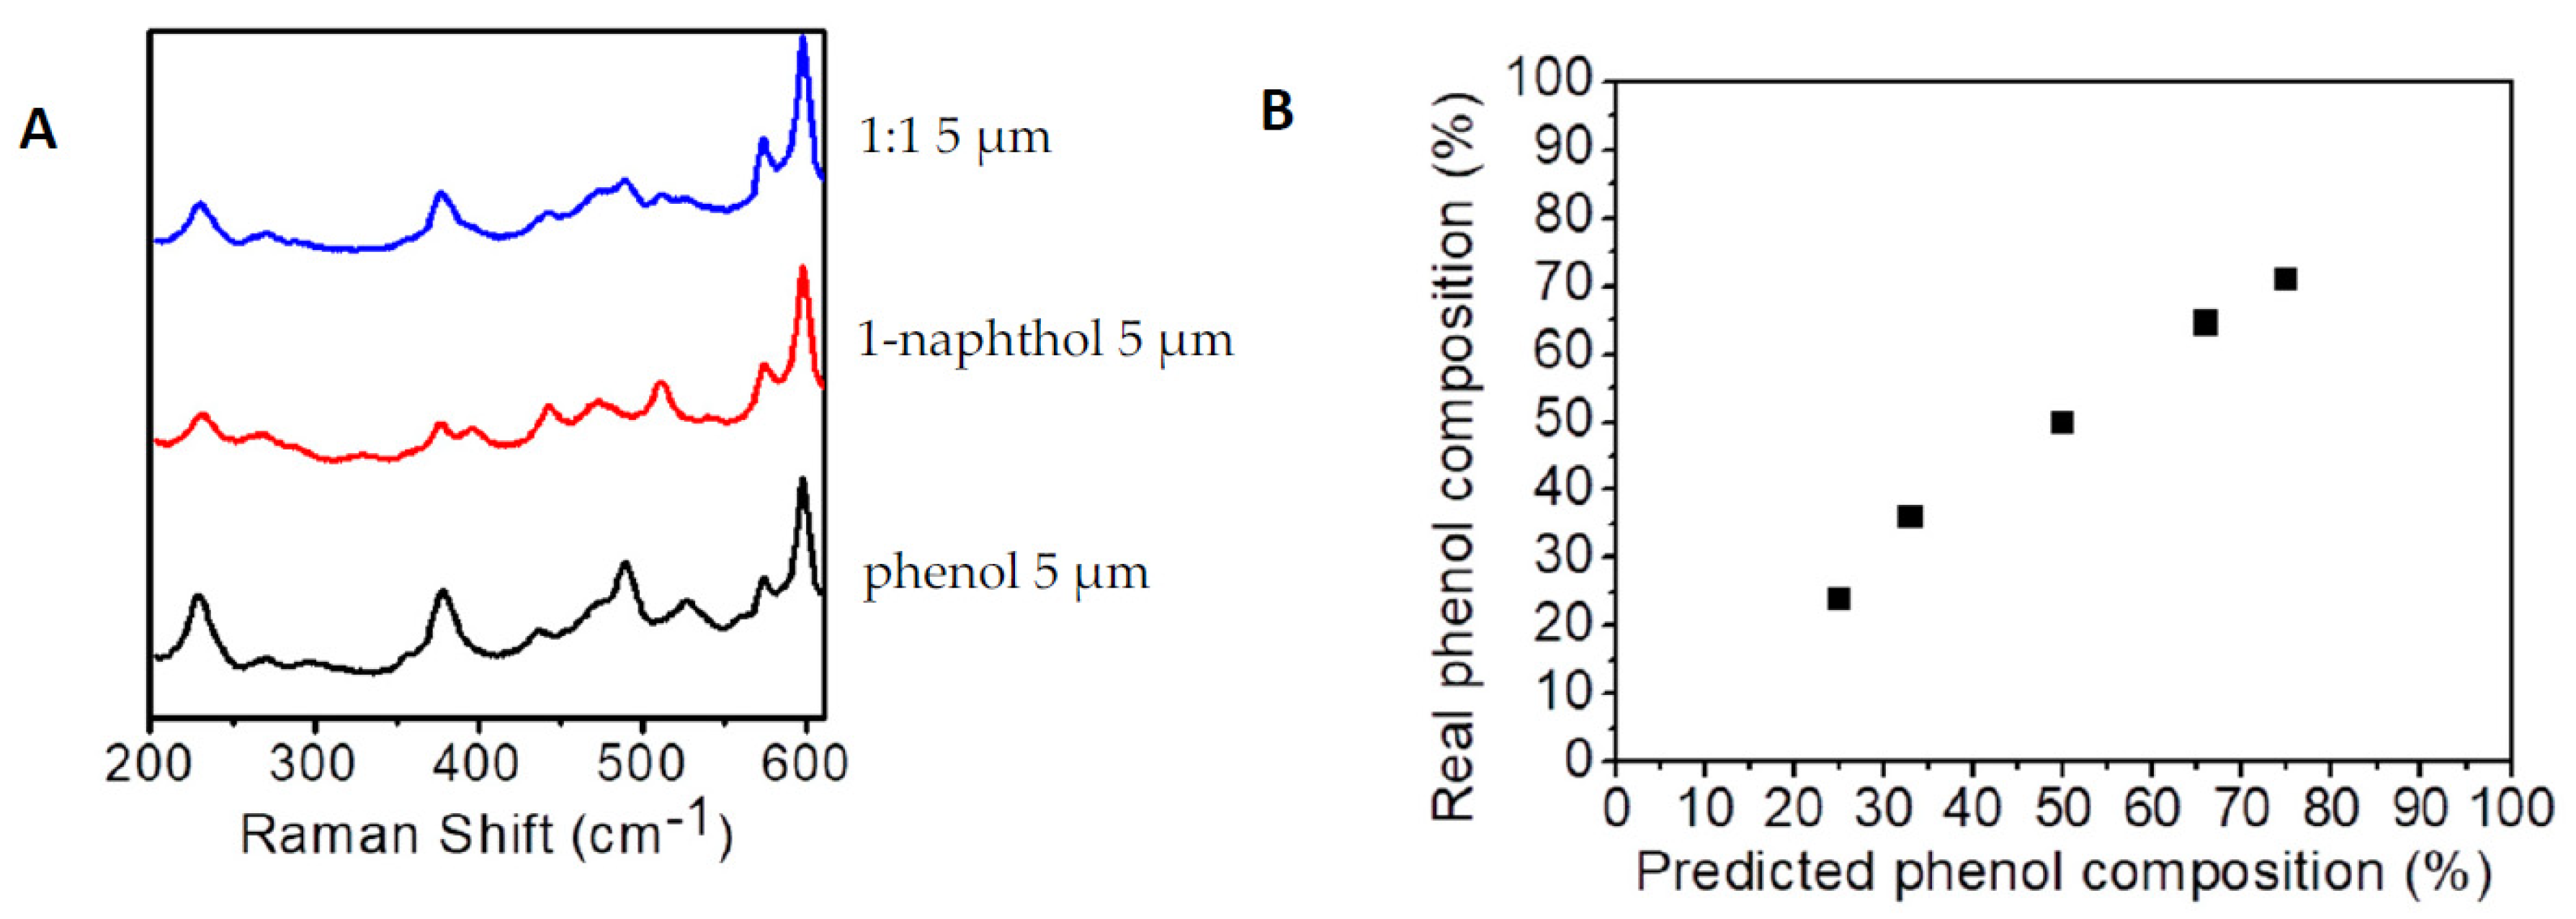
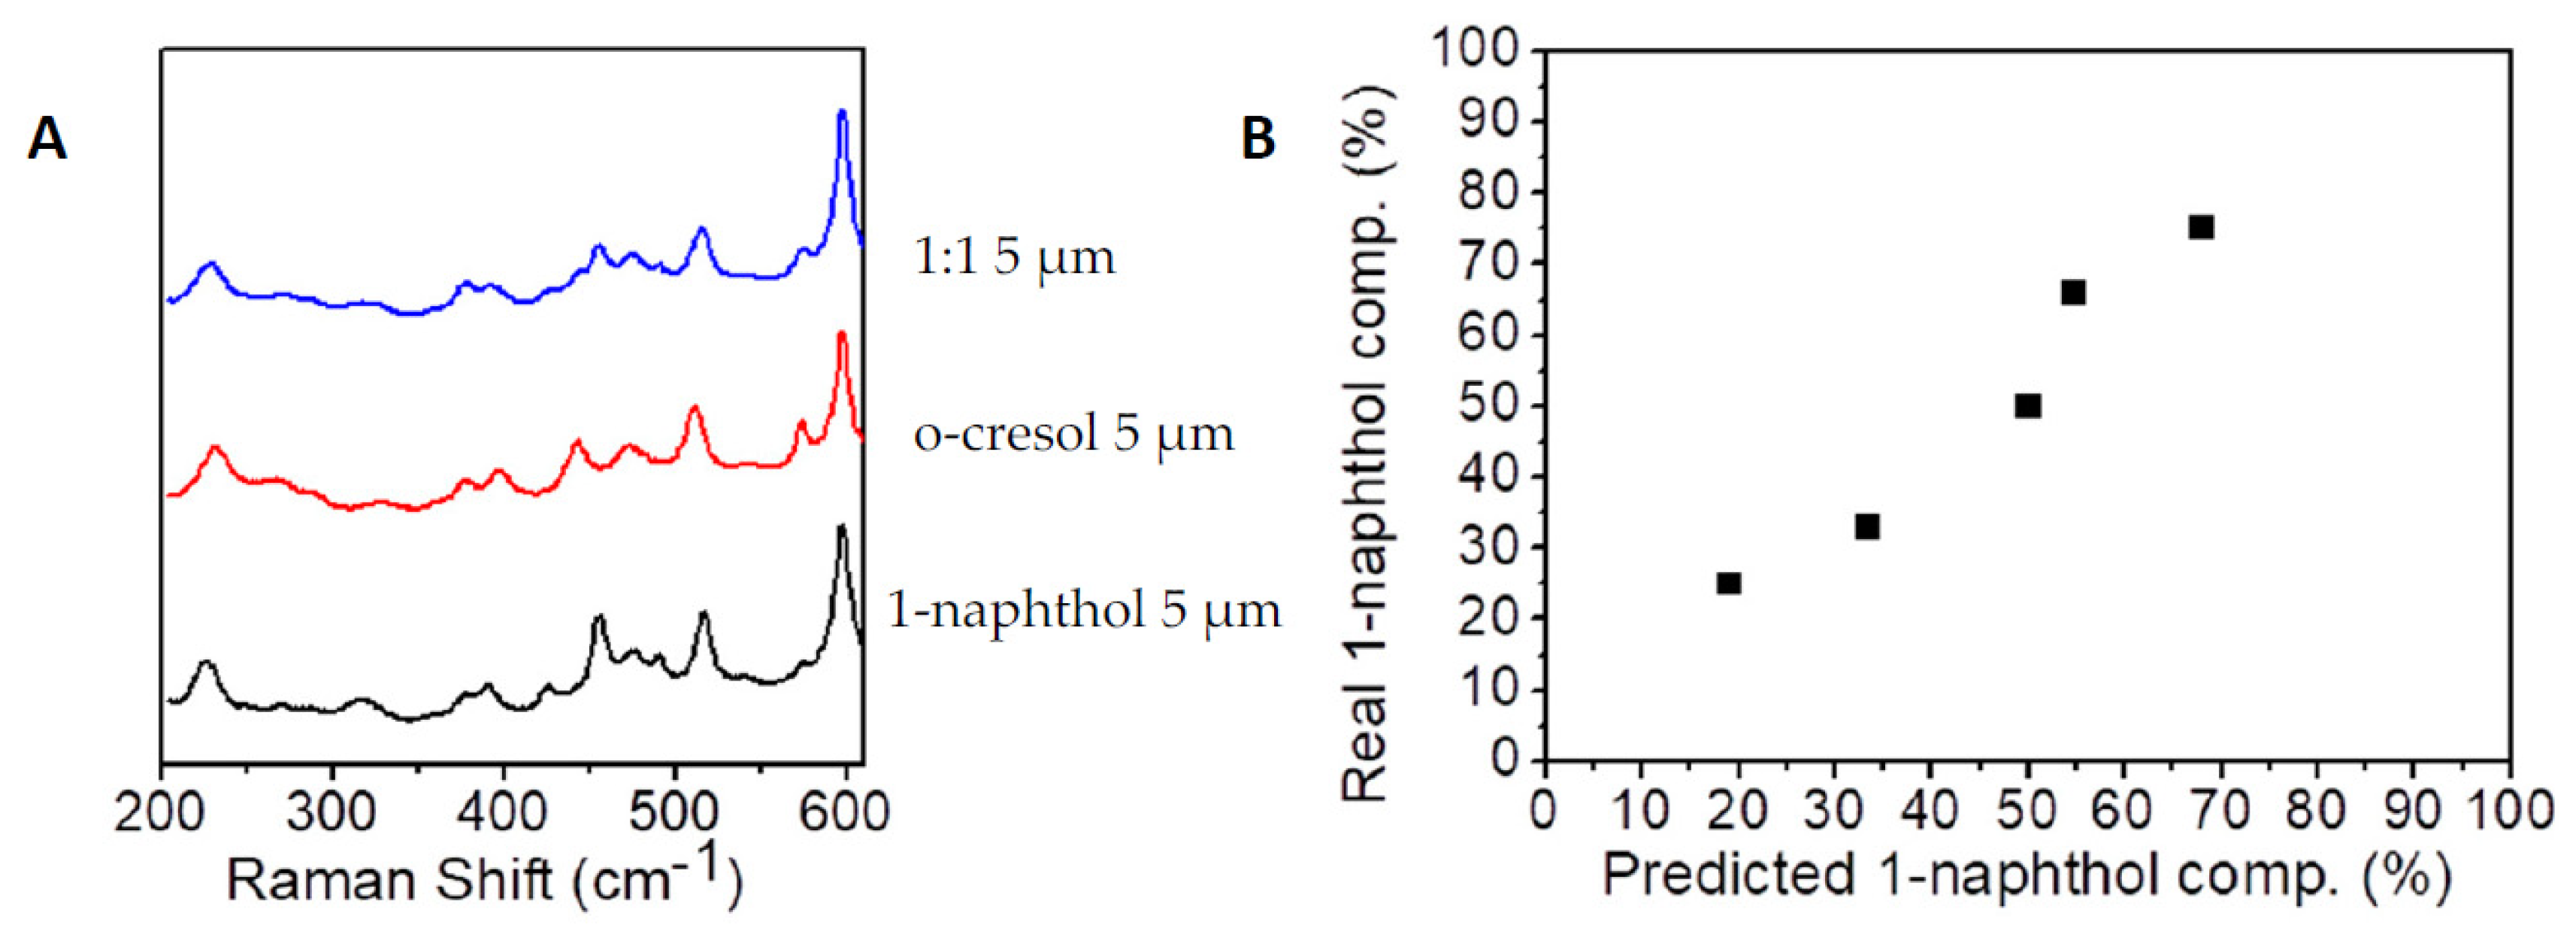
To finalize the experiment, a semiquantitative detection of the phenol and phenol derivatives was performed using binary mixtures. In this case, we demonstrated that it is possible to quantify the amount of ortho-cresol and phenol in a binary mixture using our method and analyzing the data using PCA. Performing different ratios of binary mixtures between phenol derivatives means a semiquantification could potentially be used (Figure 5, Figure 6 and Figure 7).
4. Discussion and Conclusions
In conclusion, it is possible to say that the method proposed could be an easy-to-use method for the detection of phenol in water. It is well recognized that SERS detection works very well in a water aqueous matrix. The detection limit that we achieved is not the best in the literature, but it is enough to perform a preliminary method to detect contamination by phenols in tap water.
So, we can say that is possible to detect phenol, ortho-cresol and 1-napthol in a sample of tap water in a range between 0.25 and 5 µM and it is possible to differentiate and quantify at least at the binary mixture level.
Author Contributions
Conceptualization, methodology, software validation, formal analysis, investigation, resources, data curation, writing—original draft preparation, writing—review and editing, visualization, supervision: A.C.-C., V.M-G., I.P-S., M.Á.P., J. S.-G. and J.P.-J. All authors have read and agreed to the published version of the manuscript.
Funding
This research received no external funding.
Acknowledgments
Anxo Carreira-Casais thanks MCINN for his FPU grant (FPU2016/06135) and Miguel Ángel Prieto Lage thanks MICINN for his Ramón y Cajal grant (RYC-2017-22891.)
Conflicts of Interest
The authors declare no conflict of interest.
References
- US Environmental Protection Agency. Ambient Water Quality Criteria for Pentachlorophenol; US Environmental Protection Agency: Washington, DC, USA, 1980. [Google Scholar]
- Acosta, C.A.; Pasquali, C.E.L.; Paniagua, G.; Garcinuño, R.M.; Hernando, P.F. Evaluation of total phenol pollution in water of San Martin Canal from Santiago del Estero, Argentina. Environ. Pollut. 2018, 236, 265–272. [Google Scholar] [CrossRef] [PubMed]
- Schmauch, L.J.; Grubb, H.M. Determination of Phenols in Waste Waters by Ultraviolet Absorption. Anal. Chem. 1954, 26, 308–311. [Google Scholar] [CrossRef]
- Du, B.; Su, X.; Yang, K.; Pan, L.; Liu, Q.; Gong, L.; Wang, P.; Yang, J.; He, Y. Antibody-Free Colorimetric Detection of Total Aflatoxins in Rice Based on a Simple Two-Step Chromogenic Reaction. Anal. Chem. 2016, 88, 3775–3780. [Google Scholar] [CrossRef] [PubMed]
- Josephy, P.D.; Van Damme, A. Reaction of Gibbs Reagent with Para-Substituted Phenols. Anal. Chem. 1984, 56, 813–814. [Google Scholar] [CrossRef]
- Svobodová, D.; Křenek, P.; Fraenkl, M.; Gasparič, J. Colour reaction of phenols with the gibbs reagent. The reaction mechanism and decomposition and stabilisation of the reagent. Mikrochim. Acta 1977, 67, 251–264. [Google Scholar] [CrossRef]
- Bastús, N.G.; Comenge, J.; Puntes, V. Kinetically controlled seeded growth synthesis of citrate-stabilized gold nanoparticles of up to 200 nm: Size focusing versus ostwald ripening. Langmuir 2011, 27, 11098–11105. [Google Scholar] [CrossRef] [PubMed]
Figure 1.
(a) TEM Image of the SERS substrate; (b) UV–VIS spectra of the substrate.

Figure 2.
(a) Reaction between phenol and Gibbs reactive in a basic medium to form indophenolate. (b) UV–VIS spectra of the result of the reaction between Gibbs reactive and a phenolic compound.
Figure 2.
(a) Reaction between phenol and Gibbs reactive in a basic medium to form indophenolate. (b) UV–VIS spectra of the result of the reaction between Gibbs reactive and a phenolic compound.

Figure 3.
(a) Representation of the average spectra of dbqc, and the product of the reaction between the Gibbs reactive and different concentrations of phenol. (b) Hill–Langmuir fitting for the concentration of phenol in the sample using spectra Principal Component Analysis (PCA).
Figure 3.
(a) Representation of the average spectra of dbqc, and the product of the reaction between the Gibbs reactive and different concentrations of phenol. (b) Hill–Langmuir fitting for the concentration of phenol in the sample using spectra Principal Component Analysis (PCA).

Figure 4.
(a) Average of 16 spectra of different phenol derivatives and blank. (b) Representation of PCA of average spectra of phenol derivatives and blank.
Figure 4.
(a) Average of 16 spectra of different phenol derivatives and blank. (b) Representation of PCA of average spectra of phenol derivatives and blank.

Figure 5.
(a) Representation of the average spectra of phenol, ortho-cresol and a binary mixture between ortho-cresol and phenol 1:1 at 5 µM. (b) Representation of the obtained and real values in a semiquantitative determination of binary mixtures of phenol and ortho-cresol.
Figure 5.
(a) Representation of the average spectra of phenol, ortho-cresol and a binary mixture between ortho-cresol and phenol 1:1 at 5 µM. (b) Representation of the obtained and real values in a semiquantitative determination of binary mixtures of phenol and ortho-cresol.

Figure 6.
(a) Representation of the average spectra of phenol, 1-napthol and a binary mixture between ortho-cresol and phenol 1:1 at 5 µM. (b) Representation of the obtained and real values in a semiquantitative determination of binary mixtures of phenol and ortho-cresol.
Figure 6.
(a) Representation of the average spectra of phenol, 1-napthol and a binary mixture between ortho-cresol and phenol 1:1 at 5 µM. (b) Representation of the obtained and real values in a semiquantitative determination of binary mixtures of phenol and ortho-cresol.

Figure 7.
(a) Representation of the average spectra of 1-napthol, o-cresol and a binary mixture between ortho-cresol and phenol 1:1 at 5 µM. (b) Representation of the obtained and real values in a semiquantitative determination of binary mixtures of phenol and ortho-cresol.
Figure 7.
(a) Representation of the average spectra of 1-napthol, o-cresol and a binary mixture between ortho-cresol and phenol 1:1 at 5 µM. (b) Representation of the obtained and real values in a semiquantitative determination of binary mixtures of phenol and ortho-cresol.

Publisher’s Note: MDPI stays neutral with regard to jurisdictional claims in published maps and institutional affiliations. |
© 2020 by the authors. Licensee MDPI, Basel, Switzerland. This article is an open access article distributed under the terms and conditions of the Creative Commons Attribution (CC BY) license (https://creativecommons.org/licenses/by/4.0/).
Share and Cite
MDPI and ACS Style
Carreira-Casais, A.; Montes-García, V.; Pastoriza-Santos, I.; Prieto, M.Á.; Simal-Gandara, J.; Pérez-Juste, J. Multiple SERS Detection of Phenol Derivatives in Tap Water. Proceedings 2021, 70, 88. https://doi.org/10.3390/foods_2020-07755
AMA Style
Carreira-Casais A, Montes-García V, Pastoriza-Santos I, Prieto MÁ, Simal-Gandara J, Pérez-Juste J. Multiple SERS Detection of Phenol Derivatives in Tap Water. Proceedings. 2021; 70(1):88. https://doi.org/10.3390/foods_2020-07755
Chicago/Turabian StyleCarreira-Casais, Anxo, Verónica Montes-García, Isabel Pastoriza-Santos, Miguel Ángel Prieto, Jesus Simal-Gandara, and Jorge Pérez-Juste. 2021. "Multiple SERS Detection of Phenol Derivatives in Tap Water" Proceedings 70, no. 1: 88. https://doi.org/10.3390/foods_2020-07755