Induction of Chicken Host Defense Peptides within Disease-Resistant and -Susceptible Lines


1
Department of Animal Science, Iowa State University, Ames, IA 50011, USA
2
Department of Animal Biotechnology, Jeonbuk National University, Jeonju 54896, Korea
3
Department of Research and Development, Center for Industrialization of Agricultural and Livestock Microorganisms, Jeongup 56212, Korea
*
Author to whom correspondence should be addressed.
Genes 2020, 11(10), 1195; https://doi.org/10.3390/genes11101195
Submission received: 15 September 2020
/
Revised: 6 October 2020
/
Accepted: 12 October 2020
/
Published: 14 October 2020
(This article belongs to the Special Issue Poultry Genetics, Breeding and Biotechnology)
Abstract
:Host defense peptides (HDPs) are multifunctional immune molecules that respond to bacterial and viral pathogens. In the present study, bone marrow-derived cells (BMCs) and chicken embryonic fibroblasts (CEFs) were cultured from a Leghorn line (Ghs6) and Fayoumi line (M15.2), which are inbred chicken lines relatively susceptible and resistant to various diseases, respectively. The cells were treated by lipopolysaccharide (LPS) or polyinosinic-polycytidylic acid (poly(I:C)) and, subsequently, mRNA expression of 20 chicken HDPs was analyzed before and after the stimulation. At homeostasis, many genes differed between the chicken lines, with the Fayoumi line having significantly higher expression (p < 0.05) than the Leghorn line: AvBD1, 2, 3, 4, 6, and 7 in BMCs; CATH1, CATH3, and GNLY in CEFs; and AvDB5, 8, 9, 10, 11, 12, 13 in both BMCs and CEFs. After LPS treatment, the expression of AvBD1, 2, 3, 4, 5, 9, 12, CATH1, and CATHB1 was significantly upregulated in BMCs, but no genes changed expression in CEFs. After poly(I:C) treatment, AvBD2, 11, 12, 13, CATHB1 and LEAP2 increased in both cell types; CATH2 only increased in BMCs; and AvBD3, 6, 9, 14, CATH1, CATH3, and GNLY only increased in CEFs. In addition, AvBD7, AvBD14, CATH1, CATH2, GNLY, and LEAP2 showed line-specific expression dependent upon cell type (BMC and CEF) and stimulant (LPS and poly(I:C)). The characterization of mRNA expression patterns of chicken HDPs in the present study suggests that their functions may be associated with multiple types of disease resistance in chickens.
1. Introduction
Thousands of host defense peptides (HDPs), also known as antimicrobial peptides, have been identified in various organisms including bacteria, fungi, plants and animals [1,2]. HDPs exhibit antimicrobial activities against bacteria, fungi and viruses by damaging their cell membranes or organelles, or by disrupting their physiological activities [2,3,4]. In addition, HDPs of humans, animals and plants may act as signaling molecules in innate immune defense, chemokine induction, chemotaxis, inflammation and wound healing. [5,6,7,8].
The primary avian HDPs studied to date are the defensins, cathelicidins, liver-expressed antimicrobial peptide 2 (LEAP2), and NK-lysin [9,10,11,12,13,14]. Of the three main defensins (α-, β-, and θ-defensins), birds have only β-defensins, which are regarded as the ancestor of the others [15,16,17]. Chickens have 14 avian β-defensin (AvBD1-14) and 4 ovodefensin (OvoDA1, 1–2, 3, and B1) genes clustered on chromosome 3 [18,19]. Transcripts of AvBDs were first found in leukocytes and bone marrow [20,21] and they have since been reported in immune-related tissues, the respiratory tract, and the reproductive tract [9,10] while ovodefensin was only expressed in egg white and the oviduct [19]. Chickens have four cathelicidin (CATH1, CATH2, CATH3, and CATHB1 also known as fowlicidin-1, -2, -3 and chCATH-B1) genes clustered on chromosome 2. The avian cathelicidins have a conserved signal peptide and cathelin domain similar to mammalian cathelicidins [22,23]. CATH1, 2, and 3 are expressed in various tissues including the respiratory tract, gastrointestinal tract and multiple lymphoid organs, while CATHB1 shows specifically higher expression in bursa compared to other tissues [10,24,25]. The LEAP2 gene is on chicken chromosome 13. Chicken LEAP2 has approximately 60% homology to mammalian LEAP2 and is expressed in liver, intestine, gall bladder, kidney, and multiple reproductive organs [26,27]. Chicken NK-lysin (GNLY) has been recently reported to have antimicrobial and anticancer activities. Additionally, GNLY is overexpressed in immune-related organs and the gastrointestinal tract, such as spleen and duodenal loop in chickens [10,11].
The Leghorn line Ghs6 was highly inbred from a cross of Leghorn lines; the Leghorn breed originated in Europe and provided the foundation stock for many commercial layer lines [28,29,30]. The Fayoumi line M15.2 was segregated from the Egyptian Fayoumi breed, has been highly inbred, and has large genetic distance from broiler and Leghorn lines [29,31]. From past comparisons between inbred Fayoumi and Leghorn chickens, the Fayoumi line has shown more resistance against various pathogens and stressful environments, suggesting superior immune responses [29,30,32,33]. In previous studies, Fayoumis have been demonstrated to have different expression of several HDPs [34] and association of genetic variants with disease response [35]. In addition, chicken bone marrow has been regarded as a secondary lymphoid organ interacting with thymus and bursa of Fabricius (bursa) [36,37,38].
The immune response of bone marrow-derived dendritic cells can be activated by various stimulating conditions such as lipopolysaccharide (LPS) and/or heat stress [33]. Fibroblasts have been early considered as a non-immune type cell maintaining the structural integrity of connective tissue [39,40,41,42]. Additionally, avian immune responses have been studied by comparing between fibroblasts and immune typed cells [43,44,45]. Collectively, the comparisons using these cell types can provide insight on systemic immune responses between and within chicken lines.
LPS and polyinosinic-polycytidylic acid (poly(I:C)) are commonly used to mimic bacteria- and virus-mediated immune responses, respectively. LPS originates from the outer membrane of gram-negative bacteria and poly(I:C) is a synthetic molecule that has a double-stranded RNA structure like an RNA-viral genome [46,47,48]. TLR4 on cell membrane and TLR3 located in endosome vesicles are activated by LPS and poly(I:C), respectively. After the TLRs are bound, then the related signaling pathways induce host immune responses [49,50,51,52,53]. Chicken cells respond to LPS and poly(I:C) in a similar manner that is generally comparable to other species. It has been reported that various cytokines and immune-related genes were induced in several chicken cell types by LPS and poly(I:C) [33,54,55,56,57]. However, stimulation of HDPs by LPS or poly(I:C) is not yet well characterized in chicken.
In this study, we analyzed the in vitro expression of the major chicken HDPs (excluding egg-specific HDPs) after induction by LPS and poly(I:C) of fibroblast and bone marrow-derived cells from inbred Fayoumi and Leghorn chickens. Our study using induction by bacterial and viral components may contribute to understanding expression patterns of HDPs against various pathogens in chickens.
2. Materials and Methods
2.1. Ethical Statement
The Institutional Animal Care and Use Committee at Iowa State University (ISU) approved all animal procedures (IACUC-19-287). All methods were performed in accordance with the relevant guidelines and regulations outlined in this protocol. Fertilized eggs from the inbred Leghorn line Ghs6 and the Fayoumi line M15.2 were incubated in three batches to obtain in total 90 5-day-old embryos per line and 90 day-of hatch chicks per line.
2.2. Cell Culture
2.2.1. Chicken Embryonic Fibroblast (CEF) Culture
The head, internal organs, limbs, and tail were removed from 5-day-old embryos. The remaining embryonic bodies were rinsed with 1 × phosphate buffered saline (PBS) (Gibco, Thermo Fisher Scientific, Waltham, MA, USA). Thirty samples per line were pooled within line (Fayoumi or Leghorn) for each of the 3 batches, resulting in a total of 6 pooled samples of CEF. Each pooled sample was then dissociated using 0.05% Trypsin EDTA (TE) (Gibco) at 39 °C for 10 min. Subsequently, 4 × 10⁵ of the dissociated cells were cultured per well in multiple 6-well culture plates with 2 mL of Dulbecco’s Modified Eagle’s Medium (DMEM) (Gibco) with 10% fetal bovine serum (FBS) (Hyclone, Logan, UT, USA) and 1% antibiotics (1× Antibiotic-Antimycotic, Gibco) at 39 °C with 5% CO2 until passage 3 (P3). For passaging each cell batch, CEFs from a single well were split into 3 wells in every subculture. CEFs were frozen in liquid nitrogen at P3 until treatments were performed. Before treatments, equal numbers of CEFs from all three batches were mixed, and then 5 × 10⁵ of the mixed batch cells were cultured until passage 5 (P5). The cell viability, determined by trypan blue staining, was over 95% in every subculture.
2.2.2. Bone Marrow-Derived Cell (BMC) Culture
For each batch, both thighbones were collected from 30 day-of-hatch chicks per line. Each thighbone was split and bone marrow was scraped from the split thighbone using a sharp blade. The bone marrows were rinsed with 1 × PBS (Gibco), then pooled within line within each of the 3 batches, resulting in a total of 6 pooled bone marrow samples. Each pooled sample was then dissociated using 0.05% TE (Gibco) at 39 °C for 20 min. Subsequently, 3 × 10⁵ of the dissociated cells were cultured per well in multiple 6-well culture plates with 2 mL of DMEM (Gibco) with 10% FBS (Hyclone), 5% chicken serum (Gibco) and 1% antibiotics (1 × Antibiotic-Antimycotic, Gibco) at 39 °C with 5% CO2 until passage 2 (P2). For passaging each cell batch, BMCs from a single well were split into 4 wells in every subculture. BMCs were frozen in liquid nitrogen at P2 until treatments were performed. Before treatments, equal of BMCs from all three batches were mixed, and then 5 × 10⁵ of the mixed batch cells were cultured until P3. The cell viability, determined by trypan blue staining, was over 95% in every subculture.
2.3. Immune Stimulation
2.3.1. Lipopolysaccharide (LPS) Treatment
P3 BMCs and P5 CEFs were prepared to 70~80% confluency in 6-well culture plates with 2 wells for each experimental group before exposure to LPS treatment. To mimic an extracellular bacterial infection, LPS (Salmonella enterica serotype typhimurium, L6143, Sigma-Aldrich, St. Louis, MO, USA) was added to the prepared cells at concentrations of 100 or 200 ng/mL at 1, 3, 6, 12, 24, and 48 h before sampling the cultures. Within each experimental group, the cells in 2 wells were pooled during sampling to generate sufficient material for subsequent assays. All LPS-treated groups were simultaneously sampled at the end of the experiment. A non-LPS-treated group was also sampled before starting the treatment and at the end of the experiment to assess the change of HDP expression during cell incubation without stimulant. The treatment was independently performed using each cell batch, providing three experimental replicates of each LPS- or non-treated group. In total, 168 samples (2 chicken lines × 2 cell types × 2 concentrations of LPS × 6 exposure times × 3 LPS-stimulated replicates, plus 2 chicken lines × 2 cell types × 2 exposure times × 3 non-stimulated replicates) were individually snap frozen using liquid nitrogen and stored at −80 °C until use.
2.3.2. Polyinosinic: Polycytidylic Acid (Poly(I:C)) Treatment
P3 BMCs and P5 CEFs were prepared to 70~80% confluency in 6-well culture plates with 2 wells for each experimental group before exposure to poly(I:C) treatment. To mimic an intracellular viral infection, poly(I:C) (Poly(IC) HMW, InvivoGen, San Diego, CA, USA) was transfected into the prepared cells at concentrations of 10 and 50 ng/mL using lipofectamine (Lipofectamine 3000 Transfection Reagent, Invitrogen, Thermo Fisher Scientific). Within each experimental group, the cells in 2 wells were pooled during sampling to generate sufficient material for subsequent assays. Each poly(I:C)-treated group was sampled at 1, 3, 6, 12, and 24 h after the transfection. Non-poly(I:C)-treated controls were also sampled at 1, 3, 6, 12, and 24 h after lipofectamine treatment without poly(I:C). In addition, no-treatment controls (without lipofectamine) were sampled before the treatment and at the same exposure times as the treatment groups (1, 3, 6, 12, and 24 h) to determine the HDP expression during cell incubation. The treatment was independently performed using each cell batch, providing three experimental replicates of each poly(I:C)-, non-poly(I:C)- or non-treated group. In total, 252 samples (2 chicken lines × 2 cell types × 2 concentrations of poly(I:C) × 5 exposure times × 3 poly(I:C)-stimulated replicates, plus 2 chicken lines × 2 cell types × 5 exposure times × 3 non-poly(I:C)-lipofectamine only replicates, plus 2 chicken lines × 2 cell types × 6 sampling times (including 0 h) × 3 non-stimulated replicates) were rapidly frozen using liquid nitrogen and stored at −80 °C until further use.
2.4. Analysis of Gene Expression
2.4.1. Primer Design
Primers for 20 targeted HDP genes and 3 reference genes were designed using Primer-BLAST (https://www.ncbi.nlm.nih.gov/tools/primer-blast/index.cgi?LINK_LOC=BlastHome) (Table 1). The amplicon identity was confirmed to match the intended target gene by Sanger sequencing for all 23 primer sets.
2.4.2. Expression Analysis of Host Defense Peptide Genes
Total RNA was isolated from the samples using the RNAqueous Total RNA Isolation Kit (Ambion, Thermo Fisher Scientific) according to the manufacturer’s protocol. RNA quantity was assessed on a NanoDrop ND-1000 UV-vis spectrophotometer (Thermo Fisher Scientific). cDNA was synthesized from 50 ng of each RNA sample using Reverse Transcription Master Mix (Fluidigm, South San Franciso, CA, USA) and it was subsequently preamplified for 16 cycles using Preamp Master Mix (Fluidigm) following manufacturer’s protocols. Each sample was assayed in duplicate using a Fluidigm 192.24 Integrated Fluidic Circuit (IFC). Real-time PCR was performed on the Biomark HD (Fluidigm) with five independent IFCs (IFC1, 2, 3, 4, and 5). IFC1 included LPS-treated BMCs and their non-treated controls from Fayoumi and Leghorn from all three experimental replicates (Figure 1). IFC2 included LPS-treated CEFs and their non-treated controls in Fayoumi and Leghorn from all three experimental replicates (Figure 1). IFC3, 4, and 5 each included one independent experimental replicate of poly(I:C)-treated BMCs and CEFs and their non-poly(I:C)-treated and non-treated controls in Fayoumi and Leghorn (Figure 1). The data were analyzed using the Fluidigm Real-Time PCR Analysis software. The technical replicates of the same sample per primer set had overlapping major peaks in their melting curves, confirming that a single product was amplified for each primer pair. Gene expression was compared between chicken lines, between LPS-treated groups and non-treated controls (from 48 h after incubation without LPS), or between poly(I:C)-treated groups and non-poly(I:C)-treated controls (with lipofectamine), all using the 2(−ΔΔCt) method [58] in Excel. The relative expression of the HDPs between lines or treatments was visualized as Log2 fold changes (Log2FC) using the gplots package in R (https://ggplot2.tidyverse.org).
2.4.3. Data Imputation and Reference Gene Selection
In this analysis, 35% cycle thresholds (Cts) values of HDPs were out of the range of the Biomark Dynamic assay. Hypothesizing that the out-of-range Cts were lowly expressed genes, these missing Cts were tested with imputation of 31, 50, and 100 Cts, all of which are below the detection range of 1 to 30 Cts. Missing Ct values were also imputed to 1 Ct (the minimum Ct), which is the maximum detection value. From principal component analysis (PCA), the imputations of 31, 50, and 100 Cts were similarly clustered among experimental groups while the imputation of 1 Ct was differently clustered (Figure S1). Collectively, the results suggested that the missing values occurred by exceeding the maximum Cts, indicating either no or low gene expression. Thus, 31 Cts was imputed to the missing Ct values of HDPs for downstream analysis, understanding that this may have been an overestimate of expression for some samples.
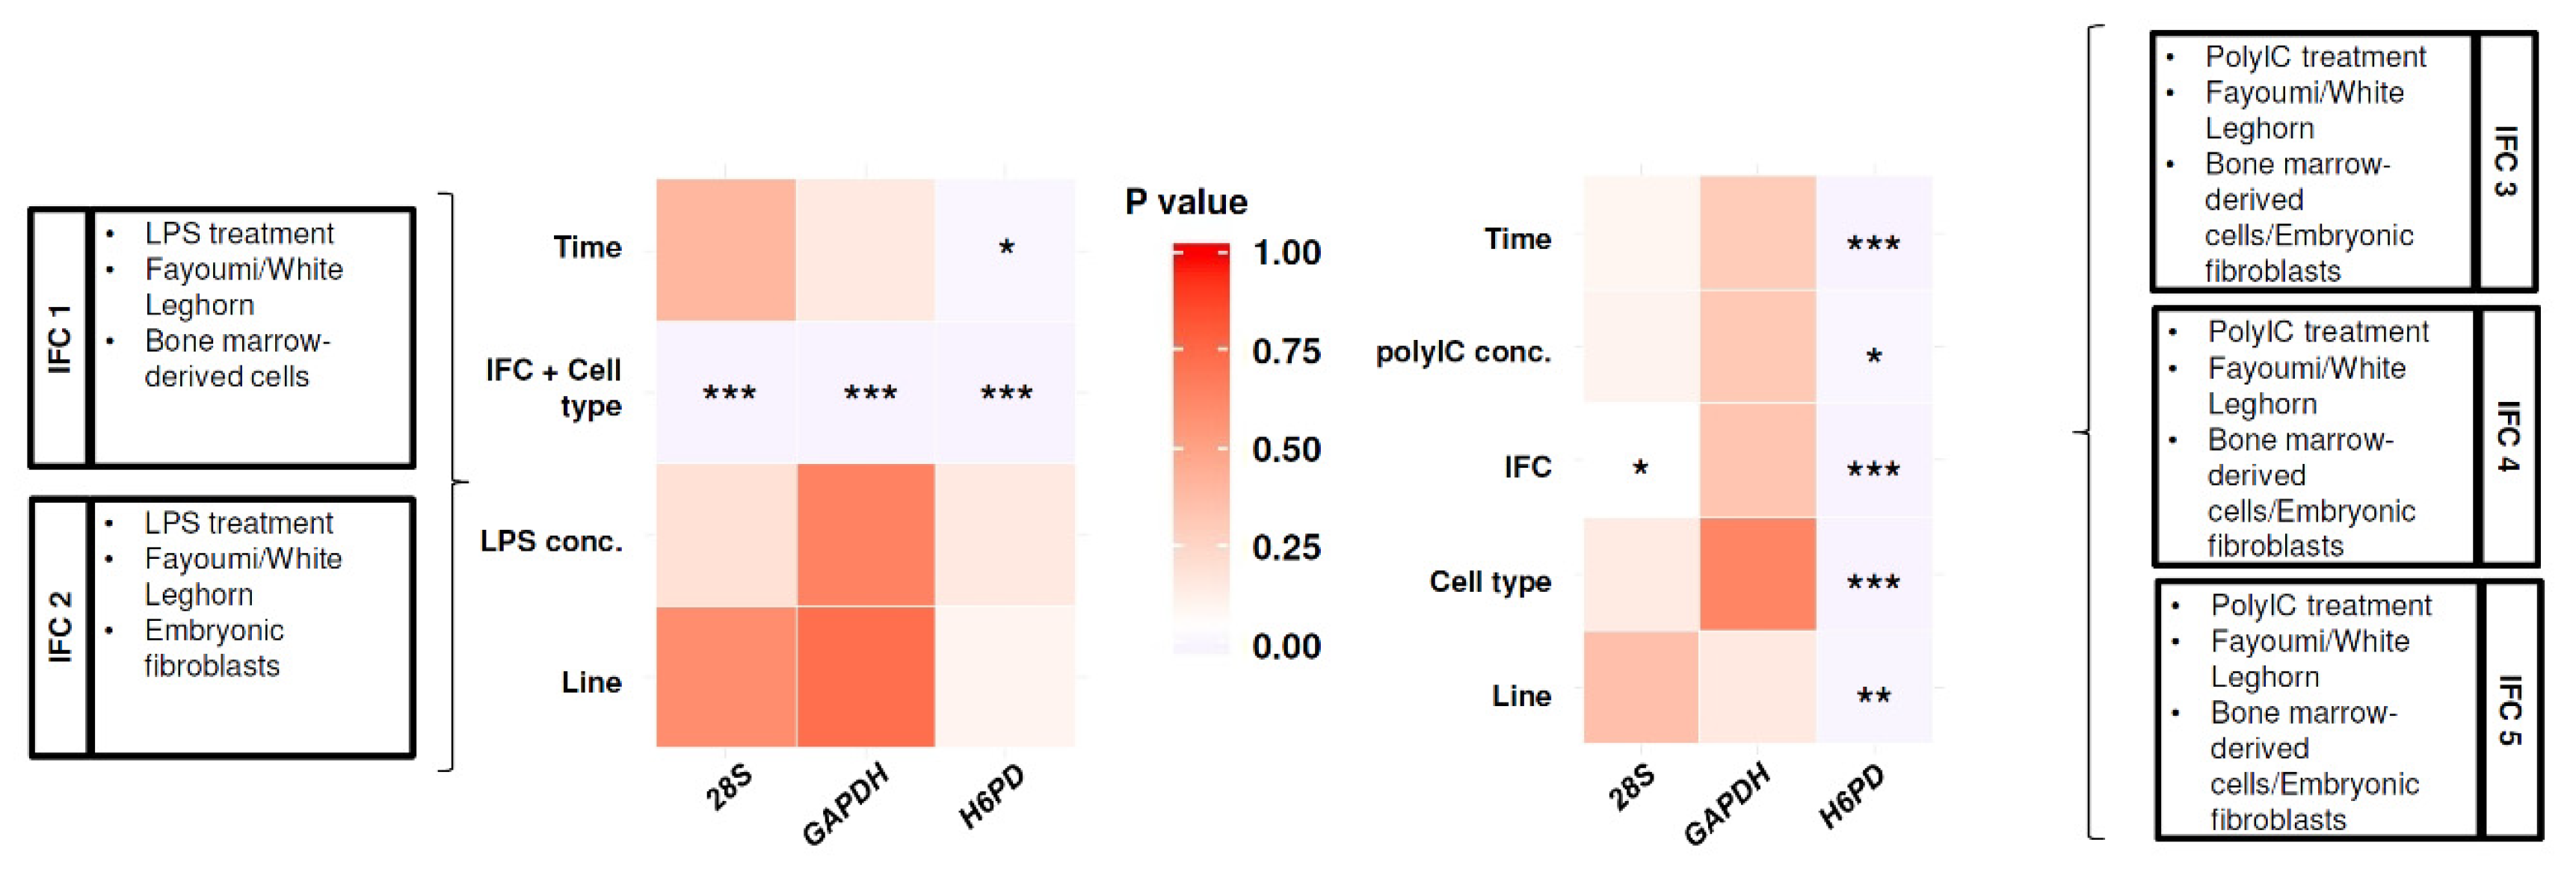
To select between the tested reference genes (H6PD, GAPDH, and 28S), Ct variation in the reference genes due to experimental variables was statistically tested for IFC1 and 2, or for IFC3, 4, and 5 (Figure 1). Linear regression models were fit with Ct ~ time + line + LPS concentration + IFC/cell type (combined effect of IFC and cell type) for IFC1 and 2 and Ct ~ time + line + Poly(I:C) concentration + cell type + IFC for IFC 3, 4, and 5. These models revealed that the Cts of GAPDH showed no significant difference for most variables, except the combined effect of IFC and cell type in IFC 1 and IFC 2 (Figure 1), which were not statistically compared in the downstream analysis. Therefore, GAPDH was selected as the reference gene to calculate delta Ct (dCt) values.
2.5. Statistical Analysis
Within each cell type, multiple linear regression models were fit to the dCts using JMP 14.3.0 (SAS Institute Inc. NC, USA) to identify the effects of LPS treatment, poly(I:C) treatment or homeostatic differences between lines without stimulation of the cells. Because the different concentrations of LPS or poly (I:C) did not significantly affect gene expression of most HDPs (p > 0.05, data not shown), the following statistical analyses investigated the overall effects of treatment, combining the data from both concentrations. Post-hoc testing of significant interactions (p < 0.05) in these models was performed using the Tukey HSD test in JMP.
The LPS-treated BMCs and their non-treated controls (IFC1) or the LPS-treated CEFs and their non-treated controls (IFC2) were separately fit to the linear regression model of dCt ~ Line + Treatment + Time[Treatment] + Line*Treatment + Line*Time[Treatment] + Replicate&Random. In the model, line included Fayoumi and Leghorn. Treatment was categorized into LPS-treated and non-treated groups. Time was nested within treatment and included 0, 1, 3, 6, 12, 24, and 48 h before the experiment termination. Replicate included the 3 experimental replicates as a random effect.
To investigate homeostatic differences between the chicken lines within each cell type, the non-poly(I:C)-treated and non-treated controls from IFC3, 4 and 5 were subset by cell type (BMC and CEF); these subsets were separately fit with the linear regression model of dCt ~ Line + Lipofection + Time + Replicate&Random. In the model, line included Fayoumi and Leghorn. Lipofection included the non-poly(I:C) but lipofectamine-treated and no-treatment control groups. Time included 0, 1, 3, 6, 12, and 24 h after the experiment initiation. Replicate included the effect of the IFCs and the 3 experimental replicates as a random effect.
The poly(I:C)-treated BMCs and their non-poly(I:C)-treated controls (IFC3, 4 and 5) or the poly(I:C)-treated CEFs and their non-poly(I:C)-treated controls (IFC3, 4 and 5) were separately fit to the linear regression model of dCt ~ Line + Treatment + Time[Treatment] + Line*Treatment + Line*Time[Treatment] + Replicate&Random. In the model, line included Fayoumi and Leghorn. Treatment was categorized into poly(I:C)-treated and non-poly(I:C)-treated groups (with lipofectamine only). Time included 0, 1, 3, 6, 12, and 24 h after the experiment initiation. Replicate included the effect of the IFCs and the 3 experimental replicates as a random effect.
3. Results
3.1. Line Differences in Expression of HDPs in Homeostatic State
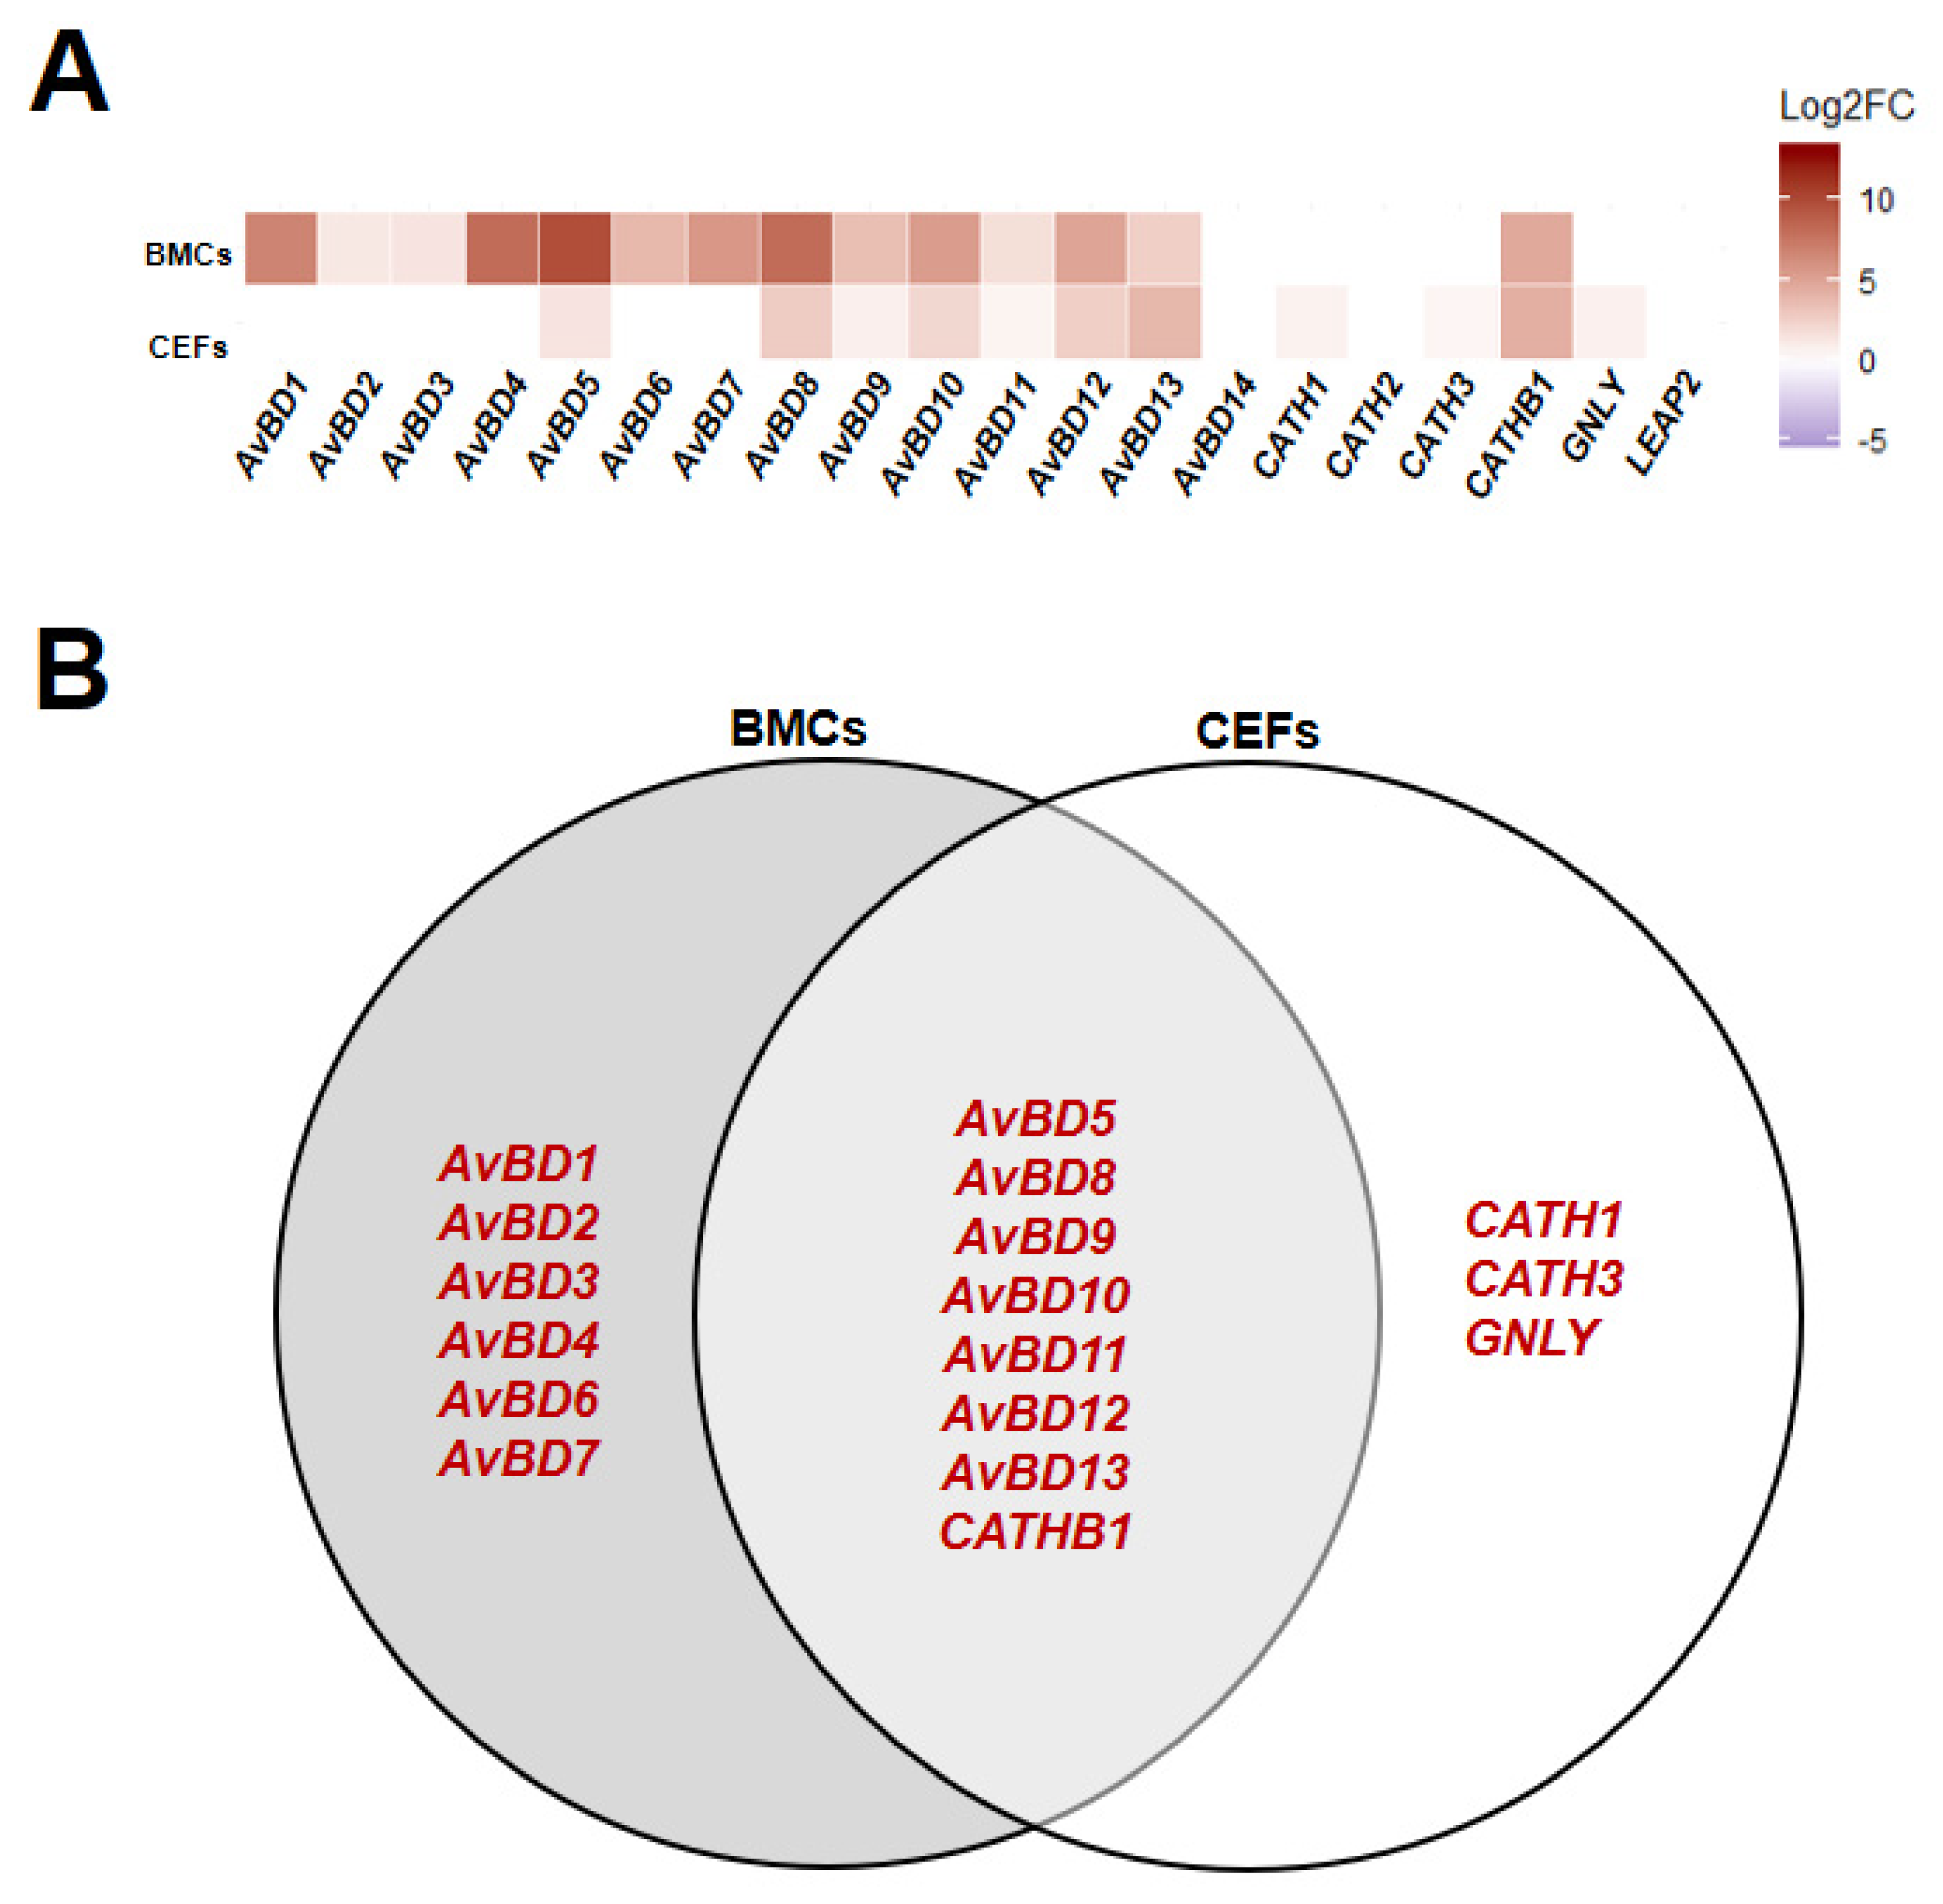
From the regression model on control (non-poly(I:C)-treated and non-treated) groups from the poly(I:C) experimental sets (IFC3, 4, and 5), homeostatic HDP expression levels were mainly affected by line, although a few HDP expression levels were affected by time and lipofectamine (Figure S2). All HDPs with a significant difference between lines (p < 0.05) showed higher expression in Fayoumi compared to Leghorn (Figure 2A). Among them, AvBD5, 8, 9, 10, 11, 12, 13, and CATHB1 were higher expressed in both BMCs and CEFs while AvBD1, 2, 3, 4, 6, and 7 exhibited specifically higher expression in BMCs and CATH1, CATH3, and GNLY exhibited specifically higher expression in CEFs (Figure 2). Our data indicate that most HDPs are more highly expressed in Fayoumi than Leghorn, and BMCs and CEFs showed different expression patterns of HDPs at homeostatic levels.
3.2. HDPs Responded to LPS and Poly(I:C)
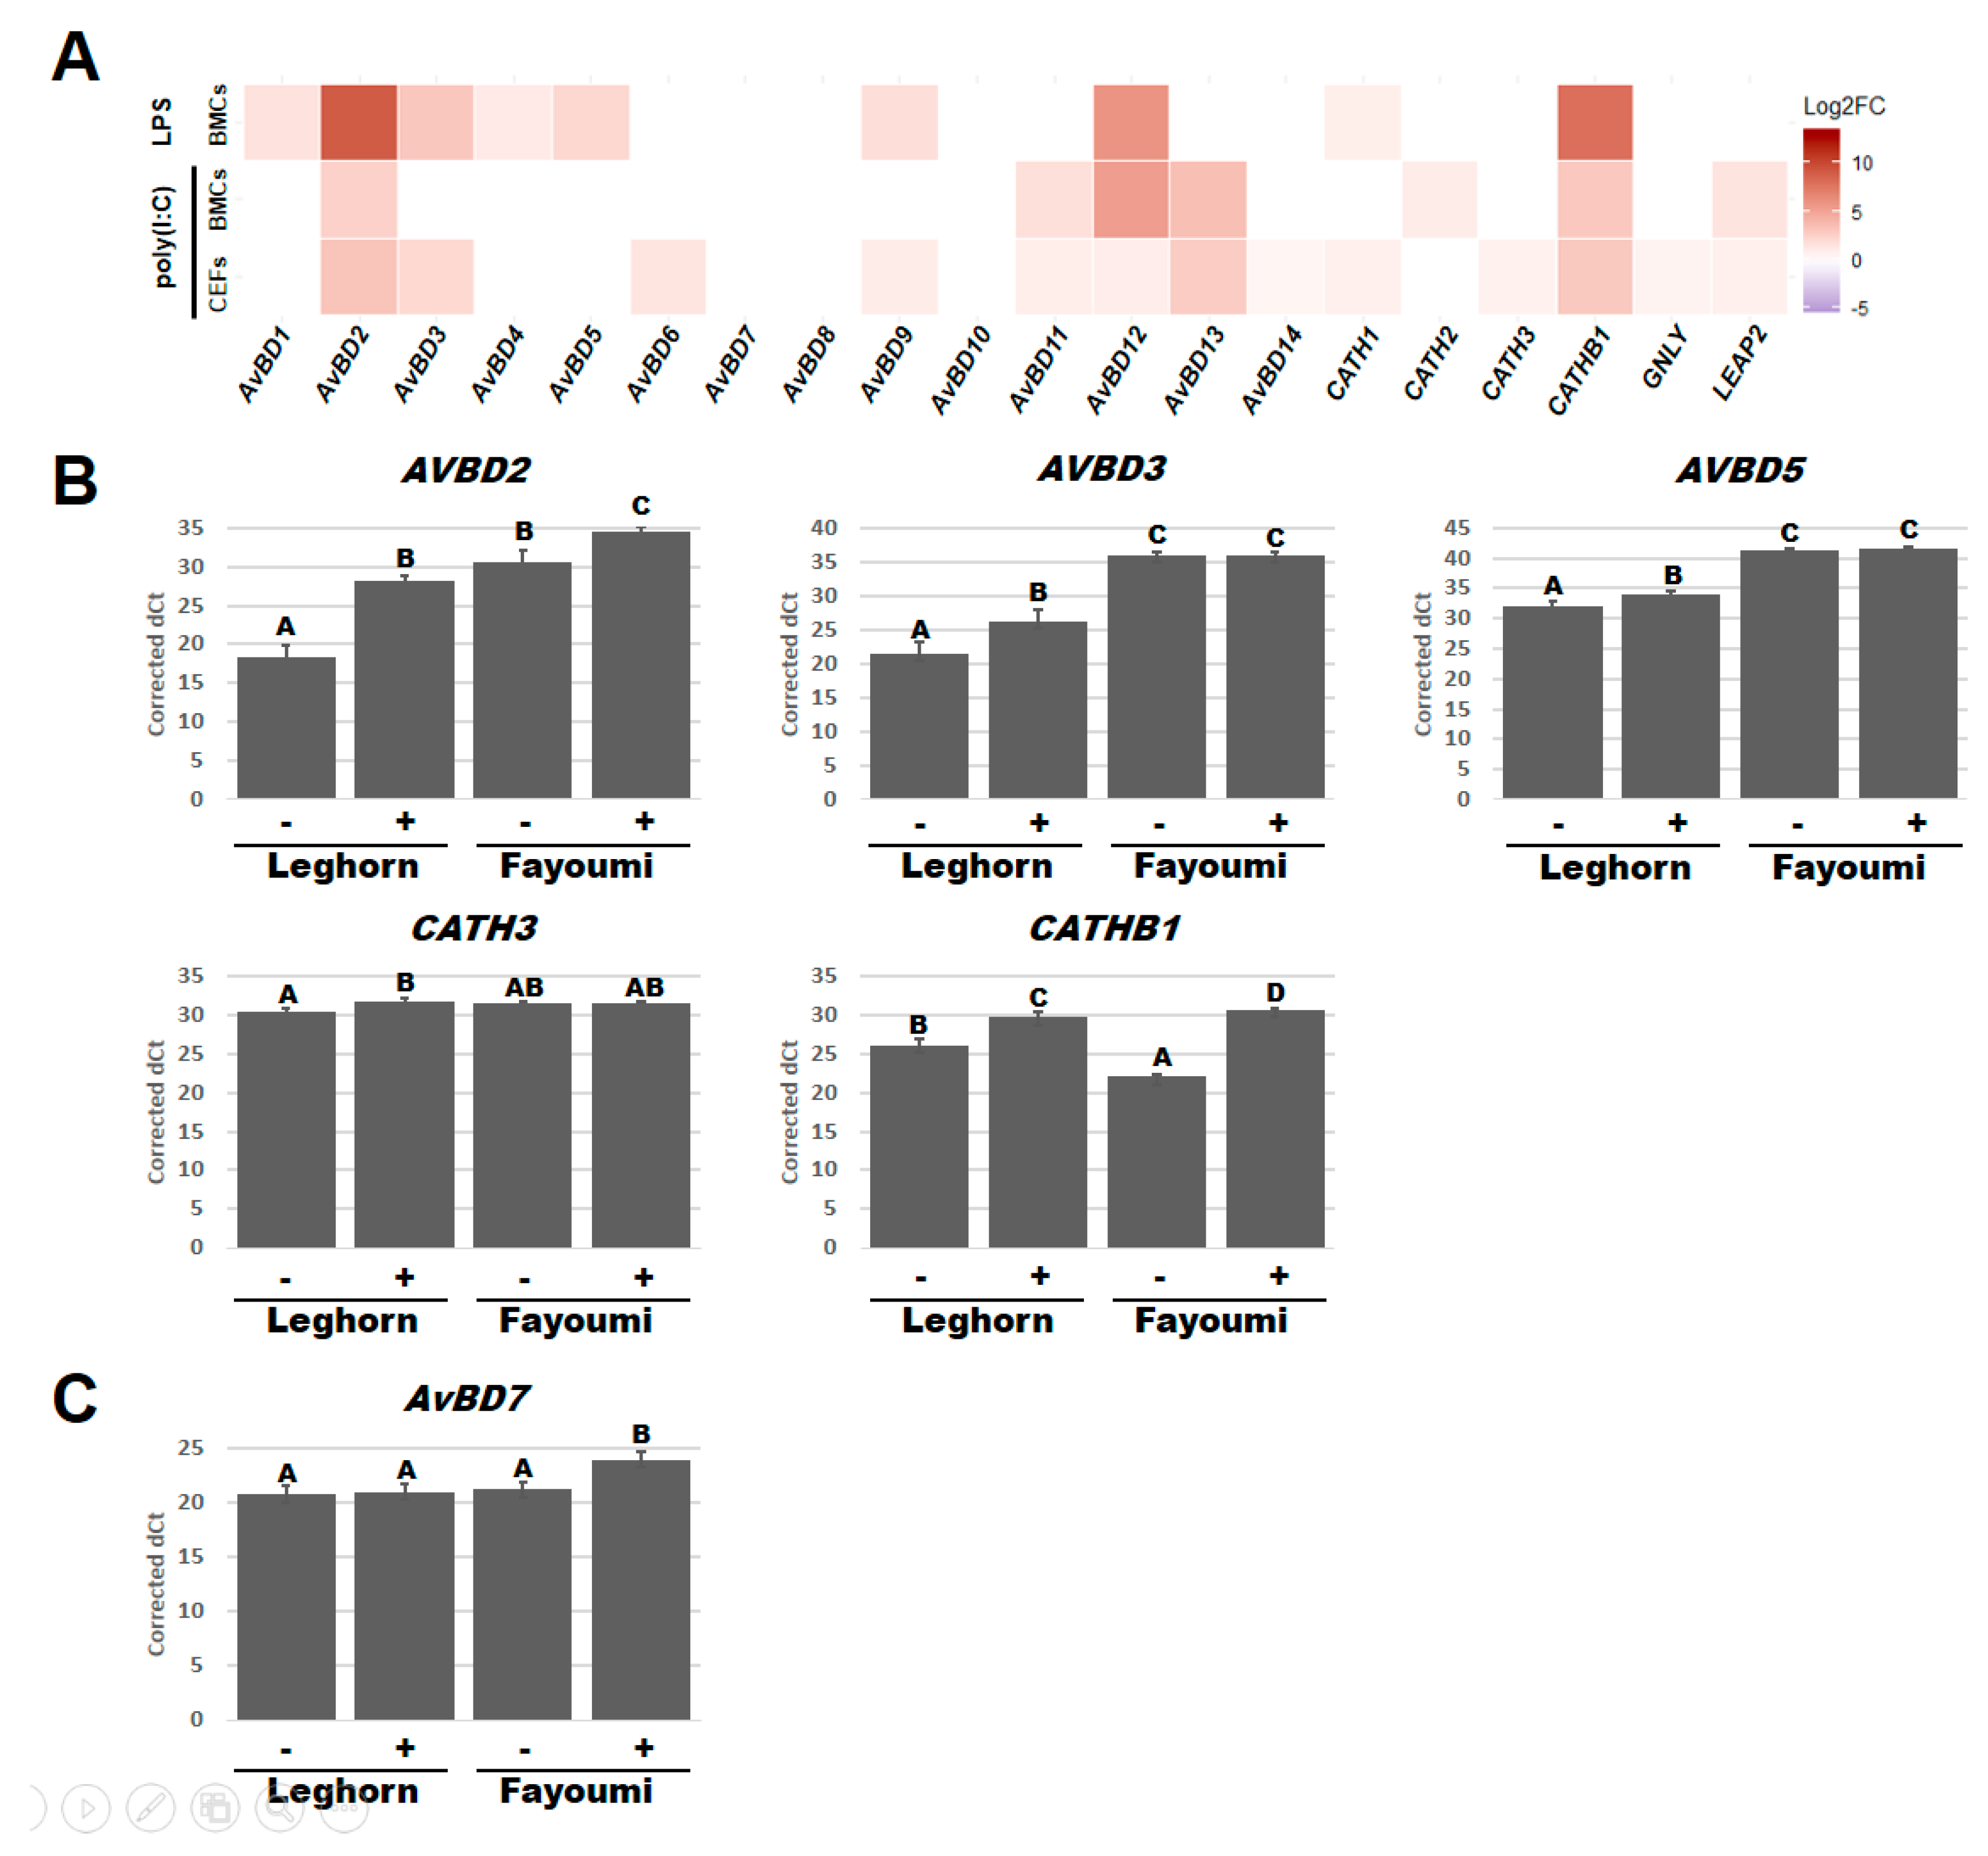
Regression models were also used to investigate the effect of treatment and revealed differences in which HDPs respond significantly (p < 0.05) to LPS or poly(I:C) in BMCs or CEFs (Figure S2 and Figure 3A). After LPS treatment, the expression of AvBD1, 2, 3, 4, 5, 9, 12, CATH1, and CATHB1 significantly increased in BMCs while no HDP expression significantly changed in CEFs (Figure 3A). After poly(I:C) treatment, AvBD2, 11, 12, 13, CATH2, CATHB1, and LEAP2 significantly increased in BMCs and AvBD2, 3, 6, 9, 11, 12, 13, 14, CATH1, CATH3, CATHB1, GNLY, and LEAP2 increased in CEFs (Figure 3A). Expression of 6 of these HDPs additionally had a significant interaction between treatment and line factors (Figure S2) and were subsequently used for a post-hoc Tukey test (p < 0.05) (Figure 3B,C). From the post-hoc Tukey test, AvBD2 (Leghorn, p < 0.001; Fayoumi, p < 0.05) and CATHB1 (Leghorn, p < 0.01; Fayoumi, p < 0.001) expression significantly increased in BMCs of both lines while the expression of AvBD3 (p < 0.05), AvBD5 (p < 0.05), and CATH3 (p < 0.05) only increased in Leghorn BMCs after LPS treatment (Figure 3B). Although AvBD3 and AvBD5 only responded to LPS in Leghorn BMCs, their expression when stimulated still remained lower than the Fayoumi BMCs without LPS. Similarly, while LPS increased AvBD2 expression in both lines, the Fayoumi BMCs had greater expression than the Leghorn BMCs under both LPS- and non-treated conditions. CATHB1 had higher homeostatic levels in the Leghorn BMCs, but after LPS treatment, the Fayoumi BMCs had higher expression. AvBD7 expression significantly increased in Fayoumi CEFs after poly(I:C) treatment (p < 0.01), but there was no response in the Leghorn line (Figure 3C). There were no significant interactions between line and treatment in CEFs after LPS treatment or in BMCs after poly(I:C) (Figure S2). Collectively, our data indicate that under our treatment conditions, poly(I:C) stimulated various HDPs in BMCs and CEFs while LPS stimulated them in the only BMCs. Especially, AvBD2, AvBD3, AvBD5, CATH3, CATHB1 showed an interaction between line and LPS, while AvBD7 responded to poly(I:C) in a line-dependent manner.
3.3. Line-Dependent Expression of HDPs Impacted by LPS and Poly(I:C) Treatments
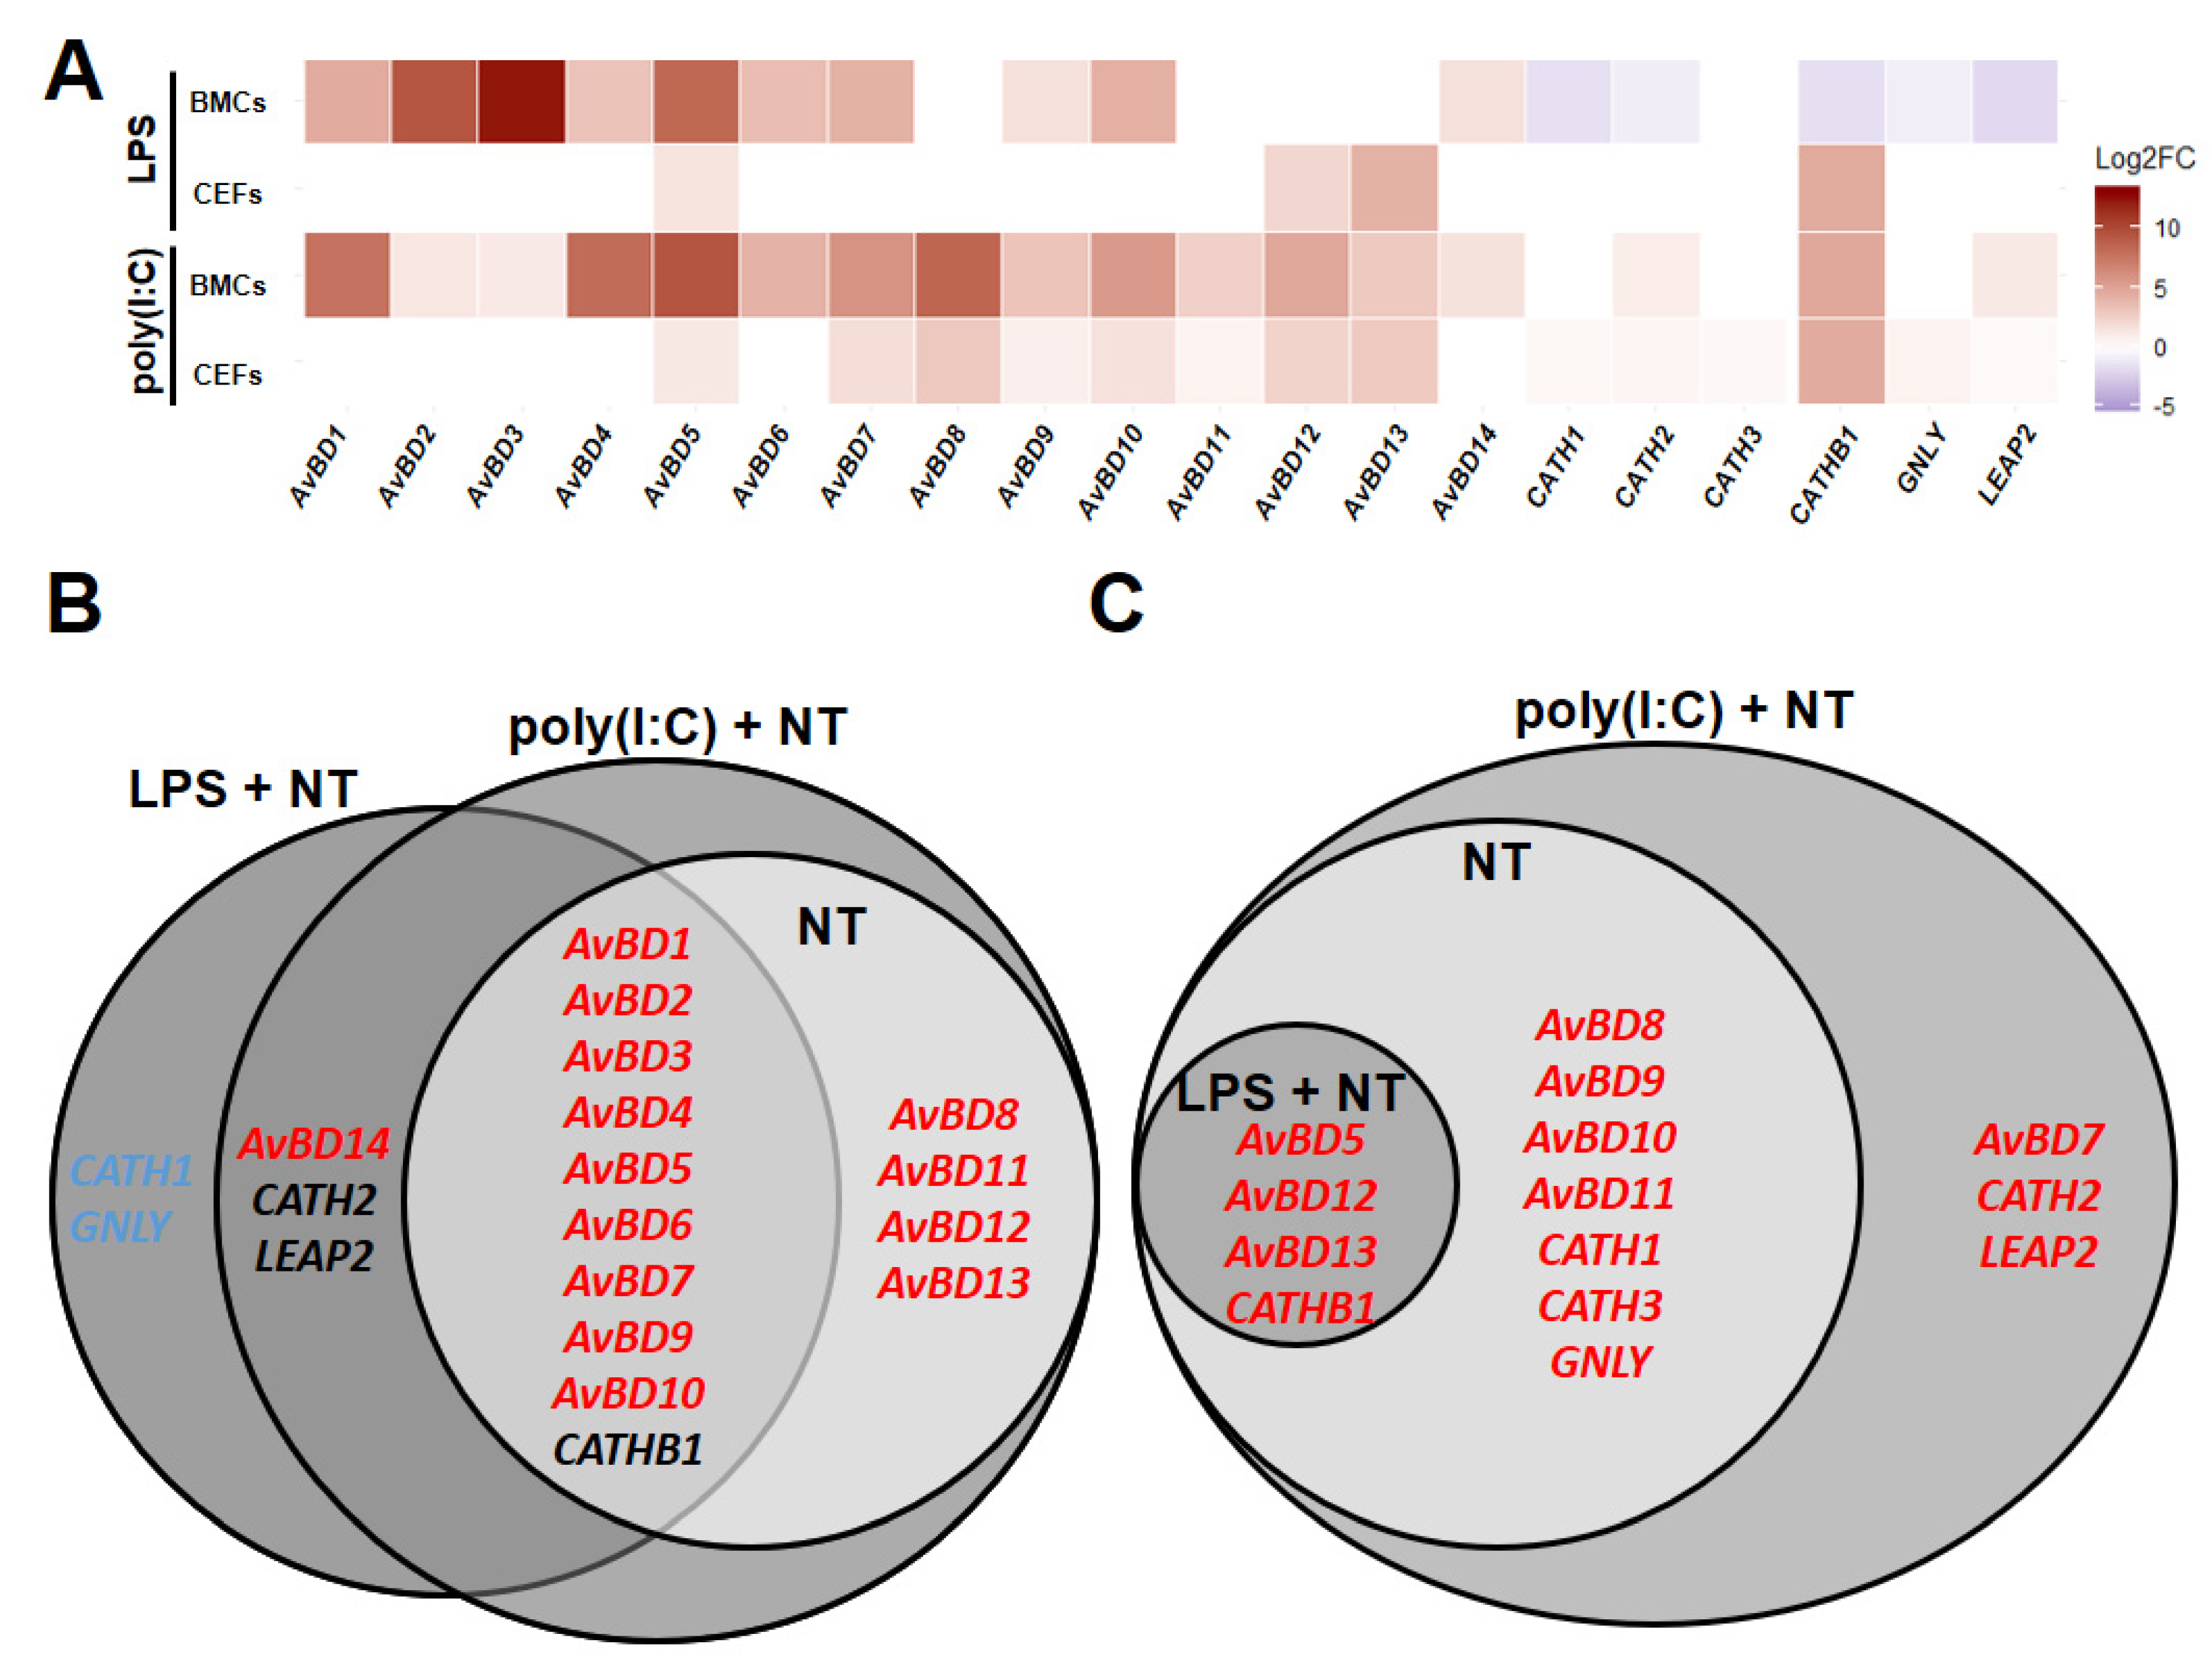
To determine whether the line differences observed under homeostatic conditions were affected by adding LPS- and/or poly(I:C)-stimulated groups, HDPs were compared between lines in BMCs or CEFs using the regression models for LPS- and non-treated groups (IFC 1 and 2) or poly(I:C)- and non-poly(I:C)-treated groups (IFC 3, 4, and 5). Comparing Fayoumi to Leghorn in BMCs with poly(I:C) treatment (poly(I:C) + non-poly(I:C)-treated), Fayoumi BMCs had higher expression of AvBD1, 2, 3, 4, 5, 6, 7, 8, 9, 10, 11, 12, 13, and CATHB1, maintaining the difference between lines observed in the homeostatic state (Figure 4A,B). Additionally, AvBD14, CATH2, and LEAP2 were significantly higher in Fayoumi than Leghorn BMCs with poly(I:C) treatment, but not at homeostasis. Similarly, AvBD1, 2, 3, 4, 5, 6, 7, 9, and 10 were expressed at greater levels in Fayoumi than Leghorn BMCs with LPS treatment (LPS + non-treated), maintaining line-dependent expression patterns from the homeostatic state. However, incorporating the LPS treatment (LPS + non-treated) did change some expression patterns in BMCs; AvBD14 became significantly higher expressed in Fayoumi than Leghorn BMCs, while CATH1, CATH2, CATHB1, GNLY, and LEAP2 were greater in Leghorn than Fayoumi BMCs only with LPS treatment (Figure 4A,B). Comparing Fayoumi to Leghorn in CEFs with poly(I:C) treatment, Fayoumi CEFs had significantly higher expression of AvBD5, 8, 9, 10, 11, 12, 13, CATH1, CATH3, CATHB1, and GNLY than Leghorn CEFs, which are the same line-dependent expression patterns observed in the homeostatic state (Figure 4A,C). Addition of the LPS treatment (LPS + non-treated) maintained less of the homeostatic line differences in the CEFs, but AvBD5, AvBD12, AvBD13 and CATHB1 were more highly expressed in Fayoumi than Leghorn CEFs both with LPS treatment and at homeostasis. Additionally, AvBD7, CATH2, and LEAP2 had significantly greater expression in Fayoumi than Leghorn CEFs only with poly(I:C) treatment (Figure 4A,C). These results suggest that AvBD7, 14, CATH1, CATH2, CATHB1, GNLY, and LEAP2 had line differences in expression in a stimulant-dependent (LPS and poly(I:C)) manner.
4. Discussion
The inbred Fayoumi line included in this study has been shown to be relatively more resistant against various pathogens and environmental stresses than the inbred Leghorn line or a broiler line, including the Fayoumi line activating immune-related signaling pathways against viral infection and LPS treatment with/without heat stress [32,59,60,61]. In this study, we investigated the expression of 20 chicken HDPs before and after induction by LPS and poly(I:C) in embryonic fibroblasts and bone marrow-derived cells from the inbred Fayoumi M15.2 and Leghorn Ghs6 chicken lines.
From comparisons between the two lines under homeostatic conditions, all HDPs except AvBD14, CATH2, and LEAP2 showed higher expression in Fayoumi than Leghorn. HDPs are well known as a critical component of immune responses that inhibit microbes such as bacteria and viruses and modulate the host immune system [5,8,62]. Many studies have also suggested an association between HDP expression and various infectious diseases [63,64,65], though the direct evidence for a correlation between a HDP and disease resistance is still limited in livestock. Thus, our results suggested that the higher expression of HDPs in the Fayoumi line at homeostasis could be associated with its innate disease resistance.
LPS and poly(I:C) are well known as agonists of Toll-like receptors (TLRs), which recognize microbial pathogens such as bacteria and viruses, triggering host innate immune responses. LPS and poly(I:C) are respectively recognized by TLR4 on the host cell membrane and TLR3, which resides in endosome vesicles [52,53]. After that, the host immune system activates various cytokines and chemokines through serial signaling pathways. Ultimately, the chain of such immune signaling pathways activates HDP expression, although the regulatory mechanisms of HDP expression are still unclear in chickens [49,50,51]. In this study, AvBDs generally maintained higher expression in the Fayoumi line than Leghorn line after LPS and poly(I:C) treatments, while the expression patterns of CATH1, CATH2, CATHB1, GNLY, and LEAP2 between the two lines varied according to the stimulant (LPS or poly(I:C)). Previous studies have reported that 14 AvBD genes are densely clustered on chicken chromosome 3 and their functional domains are highly conserved [16,26,66,67,68]. Another study suggested that there are interactions between AvBDs and other antimicrobial proteins or among AvBD family proteins [45]. Therefore, our results suggest that the genes of the AvBD family could be systemically upregulated after immune stimulation to cooperatively confer disease resistance to the Fayoumi line.
In addition to the AvBDs, the CATH family genes, GNLY, and LEAP2 showed variable expression patterns across lines, cell types, or stimulant treatments. Unlike human and mouse, which have a single cathelicidin on their genomes, chicken has four cathelicidins (CATH1, CATH2, CATH3, and CATHB1) [23,25]. CATH1, 2, and 3 share a typical cathelin-like domain with mammalian cathelicidins, while CATHB1 has an uncharacteristic cathelin-like domain. CATHB1 antimicrobial activity is known to be relatively weaker than the other cathelicidins [10,23,24,25]. CATH1 and CATH3 have a high similarity of amino acid sequences compared to others (>90%), suggesting the same gene clade of CATH gene family. In addition, CATH1, 2, and 3 can be highly expressed in chicken bone marrow [10], while CATHB1 was characteristically expressed in the bursa [10,25]. Chicken LEAP2 can not only be widely expressed in the liver, intestine, gall bladder, kidney, and multiple reproductive organs but can also increase during embryo development [23,26,27,69]. Chicken GNLY was shown to be characteristically overexpressed in spleen and the duodenal loop compared to AvBDs and CATHs [10]. Collectively, these studies suggest that these HDPs can have independent or cooperative roles in various tissues, although their specific functions are still unclear.
5. Conclusions
In conclusion, we analyzed the expression of the major chicken HDPs and confirmed the higher expression of most HDPs in the disease-resistant Fayoumi line compared to the disease-susceptible Leghorn line at homeostasis and in an LPS- or poly(I:C)-stimulated state. Thus, our results suggest that HDP functions may be associated with disease resistance mechanisms in chicken. Functions and regulatory mechanisms of these HDPs should be further studied to understand the relationship between specific pathogen resistance and HDPs in these inbred chicken lines and commercial populations.
Supplementary Materials
The following are available online at https://www.mdpi.com/2073-4425/11/10/1195/s1, Figure S1: PCA analysis before and after raw Ct imputation; Figure S2: Statistical analysis of dCt values of host defense peptide (HDP) genes among experimental groups.
Author Contributions
Conceptualization, H.-J.J. and S.J.L.; data curation, M.M.; formal analysis, H.-J.J.; funding acquisition, H.-J.J. and S.J.L.; investigation, H.-J.J., M.M. and M.K.; methodology, M.M. and M.K.; project administration, S.J.L.; resources, S.J.L.; software, M.M.; supervision, S.J.L.; validation, S.J.L.; visualization, H.-J.J.; writing—original draft, H.-J.J.; writing—review and editing, M.M., M.K. and S.J.L. All authors have read and agreed to the published version of the manuscript.
Funding
This study was supported by USDA Animal Health Capacity Building Funds (Project IOW05458) and Basic Science Research Program through the National Research Foundation of Korea funded by the Ministry of Education (NRF-2016R1D1A1B04935092).
Acknowledgments
The authors would like to thank the staff of the poultry farm at Iowa State University.
Conflicts of Interest
The authors declare no conflict of interest. The funders had no role in the design of the study; in the collection, analyses, or interpretation of data; in the writing of the manuscript, or in the decision to publish the results.
References
- Jenssen, H.; Hamill, P.; Hancock, R.E. Peptide antimicrobial agents. Clin. Microbiol. Rev. 2006, 19, 491–511. [Google Scholar] [CrossRef] [PubMed] [Green Version]
- Kosciuczuk, E.M.; Lisowski, P.; Jarczak, J.; Strzalkowska, N.; Jozwik, A.; Horbanczuk, J.; Krzyzewski, J.; Zwierzchowski, L.; Bagnicka, E. Cathelicidins: Family of antimicrobial peptides. A review. Mol. Biol. Rep. 2012, 39, 10957–10970. [Google Scholar] [CrossRef] [PubMed] [Green Version]
- Starr, C.G.; Maderdrut, J.L.; He, J.; Coy, D.H.; Wimley, W.C. Pituitary adenylate cyclase-activating polypeptide is a potent broad-spectrum antimicrobial peptide: Structure-activity relationships. Peptides 2018, 104, 35–40. [Google Scholar] [CrossRef] [PubMed]
- Zanetti, M. Cathelicidins, multifunctional peptides of the innate immunity. J. Leukoc. Biol. 2004, 75, 39–48. [Google Scholar] [CrossRef]
- Lei, J.; Sun, L.; Huang, S.; Zhu, C.; Li, P.; He, J.; Mackey, V.; Coy, D.H.; He, Q. The antimicrobial peptides and their potential clinical applications. Am. J. Transl. Res. 2019, 11, 3919–3931. [Google Scholar]
- Moravej, H.; Moravej, Z.; Yazdanparast, M.; Heiat, M.; Mirhosseini, A.; Moosazadeh Moghaddam, M.; Mirnejad, R. Antimicrobial Peptides: Features, Action, and Their Resistance Mechanisms in Bacteria. Microb. Drug Resist. 2018, 24, 747–767. [Google Scholar] [CrossRef]
- Taniguchi, M.; Saito, K.; Aida, R.; Ochiai, A.; Saitoh, E.; Tanaka, T. Wound healing activity and mechanism of action of antimicrobial and lipopolysaccharide-neutralizing peptides from enzymatic hydrolysates of rice bran proteins. J. Biosci. Bioeng. 2019, 128, 142–148. [Google Scholar] [CrossRef]
- Zasloff, M. Antimicrobial Peptides of Multicellular Organisms: My Perspective. Adv. Exp. Med. Biol. 2019, 1117, 3–6. [Google Scholar] [CrossRef]
- Cuperus, T.; Coorens, M.; van Dijk, A.; Haagsman, H.P. Avian host defense peptides. Dev. Comp. Immunol. 2013, 41, 352–369. [Google Scholar] [CrossRef]
- Lee, M.O.; Jang, H.J.; Rengaraj, D.; Yang, S.Y.; Han, J.Y.; Lamont, S.J.; Womack, J.E. Tissue expression and antibacterial activity of host defense peptides in chicken. BMC Vet. Res. 2016, 12, 231. [Google Scholar] [CrossRef] [Green Version]
- Lee, M.O.; Kim, E.H.; Jang, H.J.; Park, M.N.; Woo, H.J.; Han, J.Y.; Womack, J.E. Effects of a single nucleotide polymorphism in the chicken NK-lysin gene on antimicrobial activity and cytotoxicity of cancer cells. Proc. Natl. Acad. Sci. USA 2012, 109, 12087–12092. [Google Scholar] [CrossRef] [PubMed] [Green Version]
- Lynn, D.J.; Lloyd, A.T.; O’Farrelly, C. In silico identification of components of the Toll-like receptor (TLR) signaling pathway in clustered chicken expressed sequence tags (ESTs). Vet. Immunol. Immunopathol. 2003, 93, 177–184. [Google Scholar] [CrossRef]
- van Dijk, A.; Molhoek, E.M.; Bikker, F.J.; Yu, P.L.; Veldhuizen, E.J.; Haagsman, H.P. Avian cathelicidins: Paradigms for the development of anti-infectives. Vet. Microbiol. 2011, 153, 27–36. [Google Scholar] [CrossRef] [PubMed]
- van Dijk, A.; Veldhuizen, E.J.; Kalkhove, S.I.; Tjeerdsma-van Bokhoven, J.L.; Romijn, R.A.; Haagsman, H.P. The β-defensin gallinacin-6 is expressed in the chicken digestive tract and has antimicrobial activity against food-borne pathogens. Antimicrob. Agents Chemother. 2007, 51, 912–922. [Google Scholar] [CrossRef] [Green Version]
- Selsted, M.E.; Ouellette, A.J. Mammalian defensins in the antimicrobial immune response. Nat. Immunol. 2005, 6, 551–557. [Google Scholar] [CrossRef]
- Xiao, Y.; Hughes, A.L.; Ando, J.; Matsuda, Y.; Cheng, J.F.; Skinner-Noble, D.; Zhang, G. A genome-wide screen identifies a single β-defensin gene cluster in the chicken: Implications for the origin and evolution of mammalian defensins. BMC Genom. 2004, 5, 56. [Google Scholar] [CrossRef] [PubMed] [Green Version]
- Yang, D.; Biragyn, A.; Hoover, D.M.; Lubkowski, J.; Oppenheim, J.J. Multiple roles of antimicrobial defensins, cathelicidins, and eosinophil-derived neurotoxin in host defense. Annu. Rev. Immunol. 2004, 22, 181–215. [Google Scholar] [CrossRef]
- Hellgren, O.; Ekblom, R. Evolution of a cluster of innate immune genes (β-defensins) along the ancestral lines of chicken and zebra finch. Immunome Res. 2010, 6, 3. [Google Scholar] [CrossRef] [Green Version]
- Gong, D.; Wilson, P.W.; Bain, M.M.; McDade, K.; Kalina, J.; Herve-Grepinet, V.; Nys, Y.; Dunn, I.C. Gallin; an antimicrobial peptide member of a new avian defensin family, the ovodefensins, has been subject to recent gene duplication. BMC Immunol. 2010, 11, 12. [Google Scholar] [CrossRef] [Green Version]
- Brockus, C.W.; Jackwood, M.W.; Harmon, B.G. Characterization of β-defensin prepropeptide mRNA from chicken and turkey bone marrow. Anim. Genet. 1998, 29, 283–289. [Google Scholar] [CrossRef]
- Harwig, S.S.; Swiderek, K.M.; Kokryakov, V.N.; Tan, L.; Lee, T.D.; Panyutich, E.A.; Aleshina, G.M.; Shamova, O.V.; Lehrer, R.I. Gallinacins: Cysteine-rich antimicrobial peptides of chicken leukocytes. FEBS Lett. 1994, 342, 281–285. [Google Scholar] [CrossRef] [Green Version]
- Van Dijk, A.; Veldhuizen, E.J.; van Asten, A.J.; Haagsman, H.P. CMAP27, a novel chicken cathelicidin-like antimicrobial protein. Vet. Immunol. Immunopathol. 2005, 106, 321–327. [Google Scholar] [CrossRef] [PubMed]
- Xiao, Y.; Cai, Y.; Bommineni, Y.R.; Fernando, S.C.; Prakash, O.; Gilliland, S.E.; Zhang, G. Identification and functional characterization of three chicken cathelicidins with potent antimicrobial activity. J. Biol. Chem. 2006, 281, 2858–2867. [Google Scholar] [CrossRef] [Green Version]
- Achanta, M.; Sunkara, L.T.; Dai, G.; Bommineni, Y.R.; Jiang, W.; Zhang, G. Tissue expression and developmental regulation of chicken cathelicidin antimicrobial peptides. J. Anim. Sci. Biotechnol. 2012, 3, 15. [Google Scholar] [CrossRef] [PubMed] [Green Version]
- Goitsuka, R.; Chen, C.L.; Benyon, L.; Asano, Y.; Kitamura, D.; Cooper, M.D. Chicken cathelicidin-B1, an antimicrobial guardian at the mucosal M cell gateway. Proc. Natl. Acad. Sci. USA 2007, 104, 15063–15068. [Google Scholar] [CrossRef] [Green Version]
- Lynn, D.J.; Higgs, R.; Gaines, S.; Tierney, J.; James, T.; Lloyd, A.T.; Fares, M.A.; Mulcahy, G.; O’Farrelly, C. Bioinformatic discovery and initial characterisation of nine novel antimicrobial peptide genes in the chicken. Immunogenetics 2004, 56, 170–177. [Google Scholar] [CrossRef] [Green Version]
- Michailidis, G.; Avdi, M.; Argiriou, A. Transcriptional profiling of antimicrobial peptides avian β-defensins in the chicken ovary during sexual maturation and in response to Salmonella enteritidis infection. Res. Vet. Sci. 2012, 92, 60–65. [Google Scholar] [CrossRef]
- Deist, M.S.; Gallardo, R.A.; Bunn, D.A.; Kelly, T.R.; Dekkers, J.C.M.; Zhou, H.; Lamont, S.J. Novel Mechanisms Revealed in the Trachea Transcriptome of Resistant and Susceptible Chicken Lines following Infection with Newcastle Disease Virus. Clin. Vaccine Immunol. 2017, 24. [Google Scholar] [CrossRef]
- Kim, D.K.; Kim, C.H.; Lamont, S.J.; Keeler, C.L., Jr.; Lillehoj, H.S. Gene expression profiles of two B-complex disparate, genetically inbred Fayoumi chicken lines that differ in susceptibility to Eimeria maxima. Poult. Sci. 2009, 88, 1565–1579. [Google Scholar] [CrossRef]
- Schilling, M.A.; Memari, S.; Cavanaugh, M.; Katani, R.; Deist, M.S.; Radzio-Basu, J.; Lamont, S.J.; Buza, J.J.; Kapur, V. Conserved, breed-dependent, and subline-dependent innate immune responses of Fayoumi and Leghorn chicken embryos to Newcastle disease virus infection. Sci. Rep. 2019, 9, 7209. [Google Scholar] [CrossRef]
- Zhou, H.; Lamont, S.J. Chicken MHC class I and II gene effects on antibody response kinetics in adult chickens. Immunogenetics 2003, 55, 133–140. [Google Scholar] [CrossRef] [PubMed]
- Saelao, P.; Wang, Y.; Gallardo, R.A.; Lamont, S.J.; Dekkers, J.M.; Kelly, T.; Zhou, H. Novel insights into the host immune response of chicken Harderian gland tissue during Newcastle disease virus infection and heat treatment. BMC Vet. Res. 2018, 14, 280. [Google Scholar] [CrossRef] [PubMed]
- Van Goor, A.; Slawinska, A.; Schmidt, C.J.; Lamont, S.J. Distinct functional responses to stressors of bone marrow derived dendritic cells from diverse inbred chicken lines. Dev. Comp. Immunol. 2016, 63, 96–110. [Google Scholar] [CrossRef] [PubMed] [Green Version]
- Su, S.; Miska, K.B.; Fetterer, R.H.; Jenkins, M.C.; Lamont, S.J.; Wong, E.A. Differential expression of intestinal nutrient transporters and host defense peptides in Eimeria maxima-infected Fayoumi and Ross chickens. Poult. Sci. 2018, 97, 4392–4400. [Google Scholar] [CrossRef]
- Hasenstein, J.R.; Lamont, S.J. Chicken gallinacin gene cluster associated with Salmonella response in advanced intercross line. Avian Dis. 2007, 51, 561–567. [Google Scholar] [CrossRef]
- Jankovic, B.D.; Isakovic, K.; Petrovic, S. Direct stimulation of lymphoid tissue of the chicken. 3. Haemagglutinin production, haemolysin-forming cells and changes in lymphoid tissues following injection of guinea-pig erythrocytes into the bone marrow. Immunology 1973, 25, 663–674. [Google Scholar]
- Vainio, O.; Imhof, B.A. The immunology and developmental biology of the chicken. Immunol. Today 1995, 16, 365–370. [Google Scholar] [CrossRef]
- Sun, H.; Bi, R.; Liu, P.; Nolan, L.K.; Lamont, S.J. Combined analysis of primary lymphoid tissues’ transcriptomic response to extra-intestinal Escherichia coli (ExPEC) infection. Dev. Comp. Immunol. 2016, 57, 99–106. [Google Scholar] [CrossRef] [Green Version]
- Wong, T.; McGrath, J.A.; Navsaria, H. The role of fibroblasts in tissue engineering and regeneration. Br. J. Dermatol. 2007, 156, 1149–1155. [Google Scholar] [CrossRef]
- Alberts, B.; Johnson, A.; Lewis, J.; Raff, M.; Roberts, K.; Walter, P. Molecular Biology of the Cell; Garland Science: New York, NY, USA, 2015; pp. 1227–1242. [Google Scholar]
- Steinhauser, M.L.; Kunkel, S.L.; Hogaboam, C.M.; Evanoff, H.; Strieter, R.M.; Lukacs, N.W. Macrophage/fibroblast coculture induces macrophage inflammatory protein-1alpha production mediated by intercellular adhesion molecule-1 and oxygen radicals. J. Leukoc. Biol. 1998, 64, 636–641. [Google Scholar] [CrossRef] [Green Version]
- Blenis, J.; Hawkes, S.P. Transformation-sensitive protein associated with the cell substratum of chicken embryo fibroblasts. Proc. Natl. Acad. Sci. USA 1983, 80, 770–774. [Google Scholar] [CrossRef] [PubMed] [Green Version]
- Arslan, M.; Yang, X.; Santhakumar, D.; Liu, X.; Hu, X.; Munir, M.; Li, Y.; Zhang, Z. Dynamic Expression of Interferon Lambda Regulated Genes in Primary Fibroblasts and Immune Organs of the Chicken. Genes 2019, 10, 145. [Google Scholar] [CrossRef] [PubMed] [Green Version]
- Szmolka, A.; Wiener, Z.; Matulova, M.E.; Varmuzova, K.; Rychlik, I. Gene Expression Profiles of Chicken Embryo Fibroblasts in Response to Salmonella Enteritidis Infection. PLoS ONE 2015, 10, e0127708. [Google Scholar] [CrossRef] [PubMed]
- Rengaraj, D.; Truong, A.D.; Lillehoj, H.S.; Han, J.Y.; Hong, Y.H. Expression and regulation of avian β-defensin 8 protein in immune tissues and cell lines of chickens. Asian Australas. J. Anim. Sci. 2018, 31, 1516–1524. [Google Scholar] [CrossRef]
- Calabrese, V.; Cighetti, R.; Peri, F. Molecular simplification of lipid A structure: TLR4-modulating cationic and anionic amphiphiles. Mol. Immunol. 2015, 63, 153–161. [Google Scholar] [CrossRef]
- Fortier, M.E.; Kent, S.; Ashdown, H.; Poole, S.; Boksa, P.; Luheshi, G.N. The viral mimic, polyinosinic:polycytidylic acid, induces fever in rats via an interleukin-1-dependent mechanism. Am. J. Physiol. Regul. Integr. Comp. Physiol. 2004, 287, R759–R766. [Google Scholar] [CrossRef] [Green Version]
- Imanishi, T.; Ishihara, C.; Badr, M.E.G.S.; Hashimoto-Tane, A.; Kimura, Y.; Kawai, T.; Takeuchi, O.; Ishii, K.J.; Taniguchi, S.; Noda, T.; et al. Nucleic acid sensing by T cells initiates Th2 cell differentiation. Nat. Commun. 2014, 5, 3566. [Google Scholar] [CrossRef] [Green Version]
- Janeway, C.A., Jr.; Medzhitov, R. Innate immune recognition. Annu. Rev. Immunol. 2002, 20, 197–216. [Google Scholar] [CrossRef] [Green Version]
- Kawai, T.; Akira, S. TLR signaling. Cell Death Differ. 2006, 13, 816–825. [Google Scholar] [CrossRef] [Green Version]
- Medzhitov, R. Toll-like receptors and innate immunity. Nat. Rev. Immunol. 2001, 1, 135–145. [Google Scholar] [CrossRef]
- Opitz, B.; van Laak, V.; Eitel, J.; Suttorp, N. Innate immune recognition in infectious and noninfectious diseases of the lung. Am. J. Respir. Crit. Care Med. 2010, 181, 1294–1309. [Google Scholar] [CrossRef] [PubMed]
- Simpson, J.L.; Brooks, C.; Douwes, J. Innate immunity in asthma. Paediatr. Respir. Rev. 2008, 9, 263–270. [Google Scholar] [CrossRef] [PubMed]
- Jang, H.J.; Song, K.D. Expression patterns of innate immunity-related genes in response to polyinosinic:polycytidylic acid (poly[I:C]) stimulation in DF-1 chicken fibroblast cells. J. Anim. Sci. Technol. 2020, 62, 385–395. [Google Scholar] [CrossRef] [PubMed]
- Kint, J.; Fernandez-Gutierrez, M.; Maier, H.J.; Britton, P.; Langereis, M.A.; Koumans, J.; Wiegertjes, G.F.; Forlenza, M. Activation of the chicken type I interferon response by infectious bronchitis coronavirus. J. Virol. 2015, 89, 1156–1167. [Google Scholar] [CrossRef] [PubMed] [Green Version]
- Michailidis, G.; Anastasiadou, M.; Guibert, E.; Froment, P. Activation of innate immune system in response to lipopolysaccharide in chicken Sertoli cells. Reproduction 2014, 148, 259–270. [Google Scholar] [CrossRef] [Green Version]
- Slawinska, A.; Hsieh, J.C.; Schmidt, C.J.; Lamont, S.J. Heat Stress and Lipopolysaccharide Stimulation of Chicken Macrophage-Like Cell Line Activates Expression of Distinct Sets of Genes. PLoS ONE 2016, 11, e0164575. [Google Scholar] [CrossRef]
- Livak, K.J.; Schmittgen, T.D. Analysis of relative gene expression data using real-time quantitative PCR and the 2(-Delta Delta C(T)) Method. Methods 2001, 25, 402–408. [Google Scholar] [CrossRef]
- Deist, M.S.; Gallardo, R.A.; Bunn, D.A.; Kelly, T.R.; Dekkers, J.C.M.; Zhou, H.; Lamont, S.J. Novel analysis of the Harderian gland transcriptome response to Newcastle disease virus in two inbred chicken lines. Sci. Rep. 2018, 8, 6558. [Google Scholar] [CrossRef] [Green Version]
- Monson, M.S.; Van Goor, A.G.; Ashwell, C.M.; Persia, M.E.; Rothschild, M.F.; Schmidt, C.J.; Lamont, S.J. Immunomodulatory effects of heat stress and lipopolysaccharide on the bursal transcriptome in two distinct chicken lines. BMC Genom. 2018, 19, 643. [Google Scholar] [CrossRef]
- Monson, M.S.; Van Goor, A.G.; Persia, M.E.; Rothschild, M.F.; Schmidt, C.J.; Lamont, S.J. Genetic lines respond uniquely within the chicken thymic transcriptome to acute heat stress and low dose lipopolysaccharide. Sci. Rep. 2019, 9, 13649. [Google Scholar] [CrossRef] [Green Version]
- Haney, E.F.; Mansour, S.C.; Hancock, R.E. Antimicrobial Peptides: An Introduction. Methods Mol. Biol. 2017, 1548, 3–22. [Google Scholar] [CrossRef] [PubMed]
- Rivas-Santiago, B.; Serrano, C.J.; Enciso-Moreno, J.A. Susceptibility to infectious diseases based on antimicrobial peptide production. Infect. Immun. 2009, 77, 4690–4695. [Google Scholar] [CrossRef] [PubMed] [Green Version]
- Kelly, P.; Bajaj-Elliott, M.; Katubulushi, M.; Zulu, I.; Poulsom, R.; Feldman, R.A.; Bevins, C.L.; Dhaliwal, W. Reduced gene expression of intestinal α-defensins predicts diarrhea in a cohort of African adults. J. Infect. Dis. 2006, 193, 1464–1470. [Google Scholar] [CrossRef] [PubMed] [Green Version]
- Zasloff, M. Innate immunity, antimicrobial peptides, and protection of the oral cavity. Lancet 2002, 360, 1116–1117. [Google Scholar] [CrossRef]
- Derache, C.; Labas, V.; Aucagne, V.; Meudal, H.; Landon, C.; Delmas, A.F.; Magallon, T.; Lalmanach, A.C. Primary structure and antibacterial activity of chicken bone marrow-derived β-defensins. Antimicrob. Agents Chemother. 2009, 53, 4647–4655. [Google Scholar] [CrossRef] [Green Version]
- Lynn, D.J.; Higgs, R.; Lloyd, A.T.; O’Farrelly, C.; Herve-Grepinet, V.; Nys, Y.; Brinkman, F.S.; Yu, P.L.; Soulier, A.; Kaiser, P.; et al. Avian β-defensin nomenclature: A community proposed update. Immunol. Lett. 2007, 110, 86–89. [Google Scholar] [CrossRef]
- van Dijk, A.; Veldhuizen, E.J.; Haagsman, H.P. Avian defensins. Vet. Immunol. Immunopathol. 2008, 124, 1–18. [Google Scholar] [CrossRef]
- Zhang, G.; Sunkara, L.T. Avian antimicrobial host defense peptides: From biology to therapeutic applications. Pharmaceuticals 2014, 7, 220–247. [Google Scholar] [CrossRef] [Green Version]
Publisher’s Note: MDPI stays neutral with regard to jurisdictional claims in published maps and institutional affiliations. |
Figure 1.
Statistical analysis for impact of experimental variables on Ct values of reference genes among Fluidigm 192.24 Integrated Fluidic Circuits (IFCs). p-values for each experimental variable and loaded sample information for each IFC are shown. *, p < 0.05; **, p < 0.01; ***, p < 0.001.
Figure 1.
Statistical analysis for impact of experimental variables on Ct values of reference genes among Fluidigm 192.24 Integrated Fluidic Circuits (IFCs). p-values for each experimental variable and loaded sample information for each IFC are shown. *, p < 0.05; **, p < 0.01; ***, p < 0.001.

Figure 2.
Expression patterns of host defense peptides (HDPs) in homeostatic state comparing Fayoumi to Leghorn within each cell type. Relative expression state (Log2 fold change (Log2FC)) of HDPs in bone marrow-derived cells (BMCs) and chicken embryonic fibroblasts (CEFs) comparing Fayoumi to Leghorn (A) and Venn diagram of HDPs that were significantly differentially expressed (p < 0.05) in BMCs and CEFs (B). Red font indicates higher expression in Fayoumi compared to Leghorn.

Figure 3.
Host defense peptides (HDPs) that responded to LPS or poly(I:C) treatment. Heatmap for Log2 fold change (Log2FC) of each HDPs comparing the LPS- or poly(I:C)-treated cells to the non-treated or non-poly(I:C)-treated cells in BMCs or CEFs (A). Bar graph of corrected dCts for HDPs with a significant interaction between line and LPS in BMCs (B) and between line and poly(I:C) in CEFs (C). Corrected dCts were calculated by 30 (maximum detected dCt)—lsmean of the targeted gene dCt and LSmeans adjusted according to each linear model. BMCs, bone marrow-derived cells; CEFs, chicken embryonic fibroblasts; -, with treatment; +, without treatment. Statistical significance was indicated as a different character above each bar in graphs.

Figure 4.
Line-dependent expression of host defense peptides (HDPs) with LPS or poly(I:C) treatment. Relative expression (Log2 fold change (Log2FC)) of HDPs comparing Fayoumi to Leghorn in LPS- + non-treated (LPS + NT) or poly(I:C)- + non-poly(I:C)-treated (poly(I:C) + NT) BMCs or CEFs (A), Venn diagram for significantly differentially expressed (p < 0.05) HDP in BMCs comparing Fayoumi to Leghorn in non-treated (NT), LPS + NT or poly(I:C) + NT. (B) Venn diagram for significantly differentially expressed (p < 0.05) HDP in CEFs comparing Fayoumi to Leghorn in NT, LPS + NT or poly(I:C) + NT. (C) Red font color indicates significantly higher expression in Fayoumi compared to Leghorn. Blue font color indicates significantly higher expression in Leghorn compared to Fayoumi. Black font color indicates higher expression in Fayoumi with poly(I:C) and in Leghorn with LPS. BMCs, bone marrow-derived cells; CEFs, chicken embryonic fibroblasts.


Table 1.
Primer information for host defense peptide genes and reference genes.
| Gene | Entrez ID | Forward Primer (5’–3’) | Reverse Primer (5’–3’) | Amplicon Length (bp) |
|---|---|---|---|---|
| AvBD1 | 395841 | ACAGACGTAAACCATGCGGA | GACTTCCTTCCTAGAGCCTGG | 99 |
| AvBD2 | 395840 | GGGTGTCCCAGCCATCTAAT | TCCAAGGCCATTTGCAGCAG | 70 |
| AvBD3 | 395363 | CTCTTGTTTCTCCAGGGTGCT | GCTCCCAACACGACAGAATC | 75 |
| AvBD4 | 414342 | CAGTCTGCCTTCTGCCATGA | GGTCCCGCGATATCCACATT | 124 |
| AvBD5 | 414340 | GTCATGTCCTCCAGGGATCG | CGTGAAGGGACATCAGAGGC | 101 |
| AvBD6 | 407776 | GGGTTGGATCATGTGGCAGT | AGTGCCAGAGAGGCCATTTG | 120 |
| AvBD7 | 407777 | GGGATCTGTCGAAGGCCATA | TTCCCAGAAGTCAGGGAGGT | 105 |
| AvBD8 | 414875 | CTTGGCCGTTCTCCTCACTG | ACTGTGCCTCGTTGTTAGGT | 71 |
| AvBD9 | 414343 | ACACCGTCAGGCATCTTCAC | GTCTTCTTGGCTGTAAGCTGG | 129 |
| AvBD10 | 414341 | TCAGGGGAATTTCTGCCGTG | CTTACTGCGCCGGAATCTTG | 107 |
| AvBD11 | 414876 | ATGCTCTTGGCGTCAGAAAAC | GGAGATACGCAATGGCCCC | 87 |
| AvBD12 | 414339 | CTGCTCGCTCACGGAAGCA | TATTCCCCAGGGTTGCAGTTC | 89 |
| AvBD13 | 414877 | AGCTGCTCTTTGCCATCGTT | CAGTGGCCATGGTTGTTCCT | 97 |
| AvBD14 | 100858701 | GGCGACACGACAATGTCAAC | TTGCCCTTCATCTTCCGACA | 119 |
| CATH1 | 414337 | GACTCCATGGCTGACCCTGT | ATCGCCCGGTAGAGGTTGTA | 89 |
| CATH2 | 420407 | CGACTGCGACTTCAAGGAGAA | GATCTCGGGAGTGTCCTGC | 79 |
| CATH3 | 100858343 | GATGTCACCTGCGTGGACTC | TTGTAGAGGTTGATGCCCGC | 107 |
| CATHB1 | 100858412 | GGTTGCTCAACCAGAGGATCT | TCCTCCACAAGGAAGCTCAC | 118 |
| GNLY | 693257 | TTCTGCGTCAGTCTGGTGAA | AGATACTCCTCTGGCGCCTC | 118 |
| LEAP2 | 414338 | GTTGGAGCCTCATGTAGGGA | GAGGCCGTTCTAAGGAAGCAG | 80 |
| 28S | 112533599 | GGCGAAGCCAGAGGAAACT | GACGACCGATTTGCACGTC | 62 |
| GAPDH | 374193 | GCAGCAGGAACACTATAAAGGC | TTTGCCAGAGAGGACGGC | 100 |
| H6PD | 428188 | ATGTACCGGGTGGACCACTA | AACTGACGGTTCTGATCTCGAAA | 80 |
© 2020 by the authors. Licensee MDPI, Basel, Switzerland. This article is an open access article distributed under the terms and conditions of the Creative Commons Attribution (CC BY) license (http://creativecommons.org/licenses/by/4.0/).
Share and Cite
MDPI and ACS Style
Jang, H.-J.; Monson, M.; Kaiser, M.; Lamont, S.J. Induction of Chicken Host Defense Peptides within Disease-Resistant and -Susceptible Lines. Genes 2020, 11, 1195. https://doi.org/10.3390/genes11101195
AMA Style
Jang H-J, Monson M, Kaiser M, Lamont SJ. Induction of Chicken Host Defense Peptides within Disease-Resistant and -Susceptible Lines. Genes. 2020; 11(10):1195. https://doi.org/10.3390/genes11101195
Chicago/Turabian StyleJang, Hyun-Jun, Melissa Monson, Michael Kaiser, and Susan J Lamont. 2020. "Induction of Chicken Host Defense Peptides within Disease-Resistant and -Susceptible Lines" Genes 11, no. 10: 1195. https://doi.org/10.3390/genes11101195
Note that from the first issue of 2016, this journal uses article numbers instead of page numbers. See further details here.