Exposure to Environmental and Occupational Particulate Air Pollution as a Potential Contributor to Neurodegeneration and Diabetes: A Systematic Review of Epidemiological Research


Abstract
:1. Introduction
2. Methods
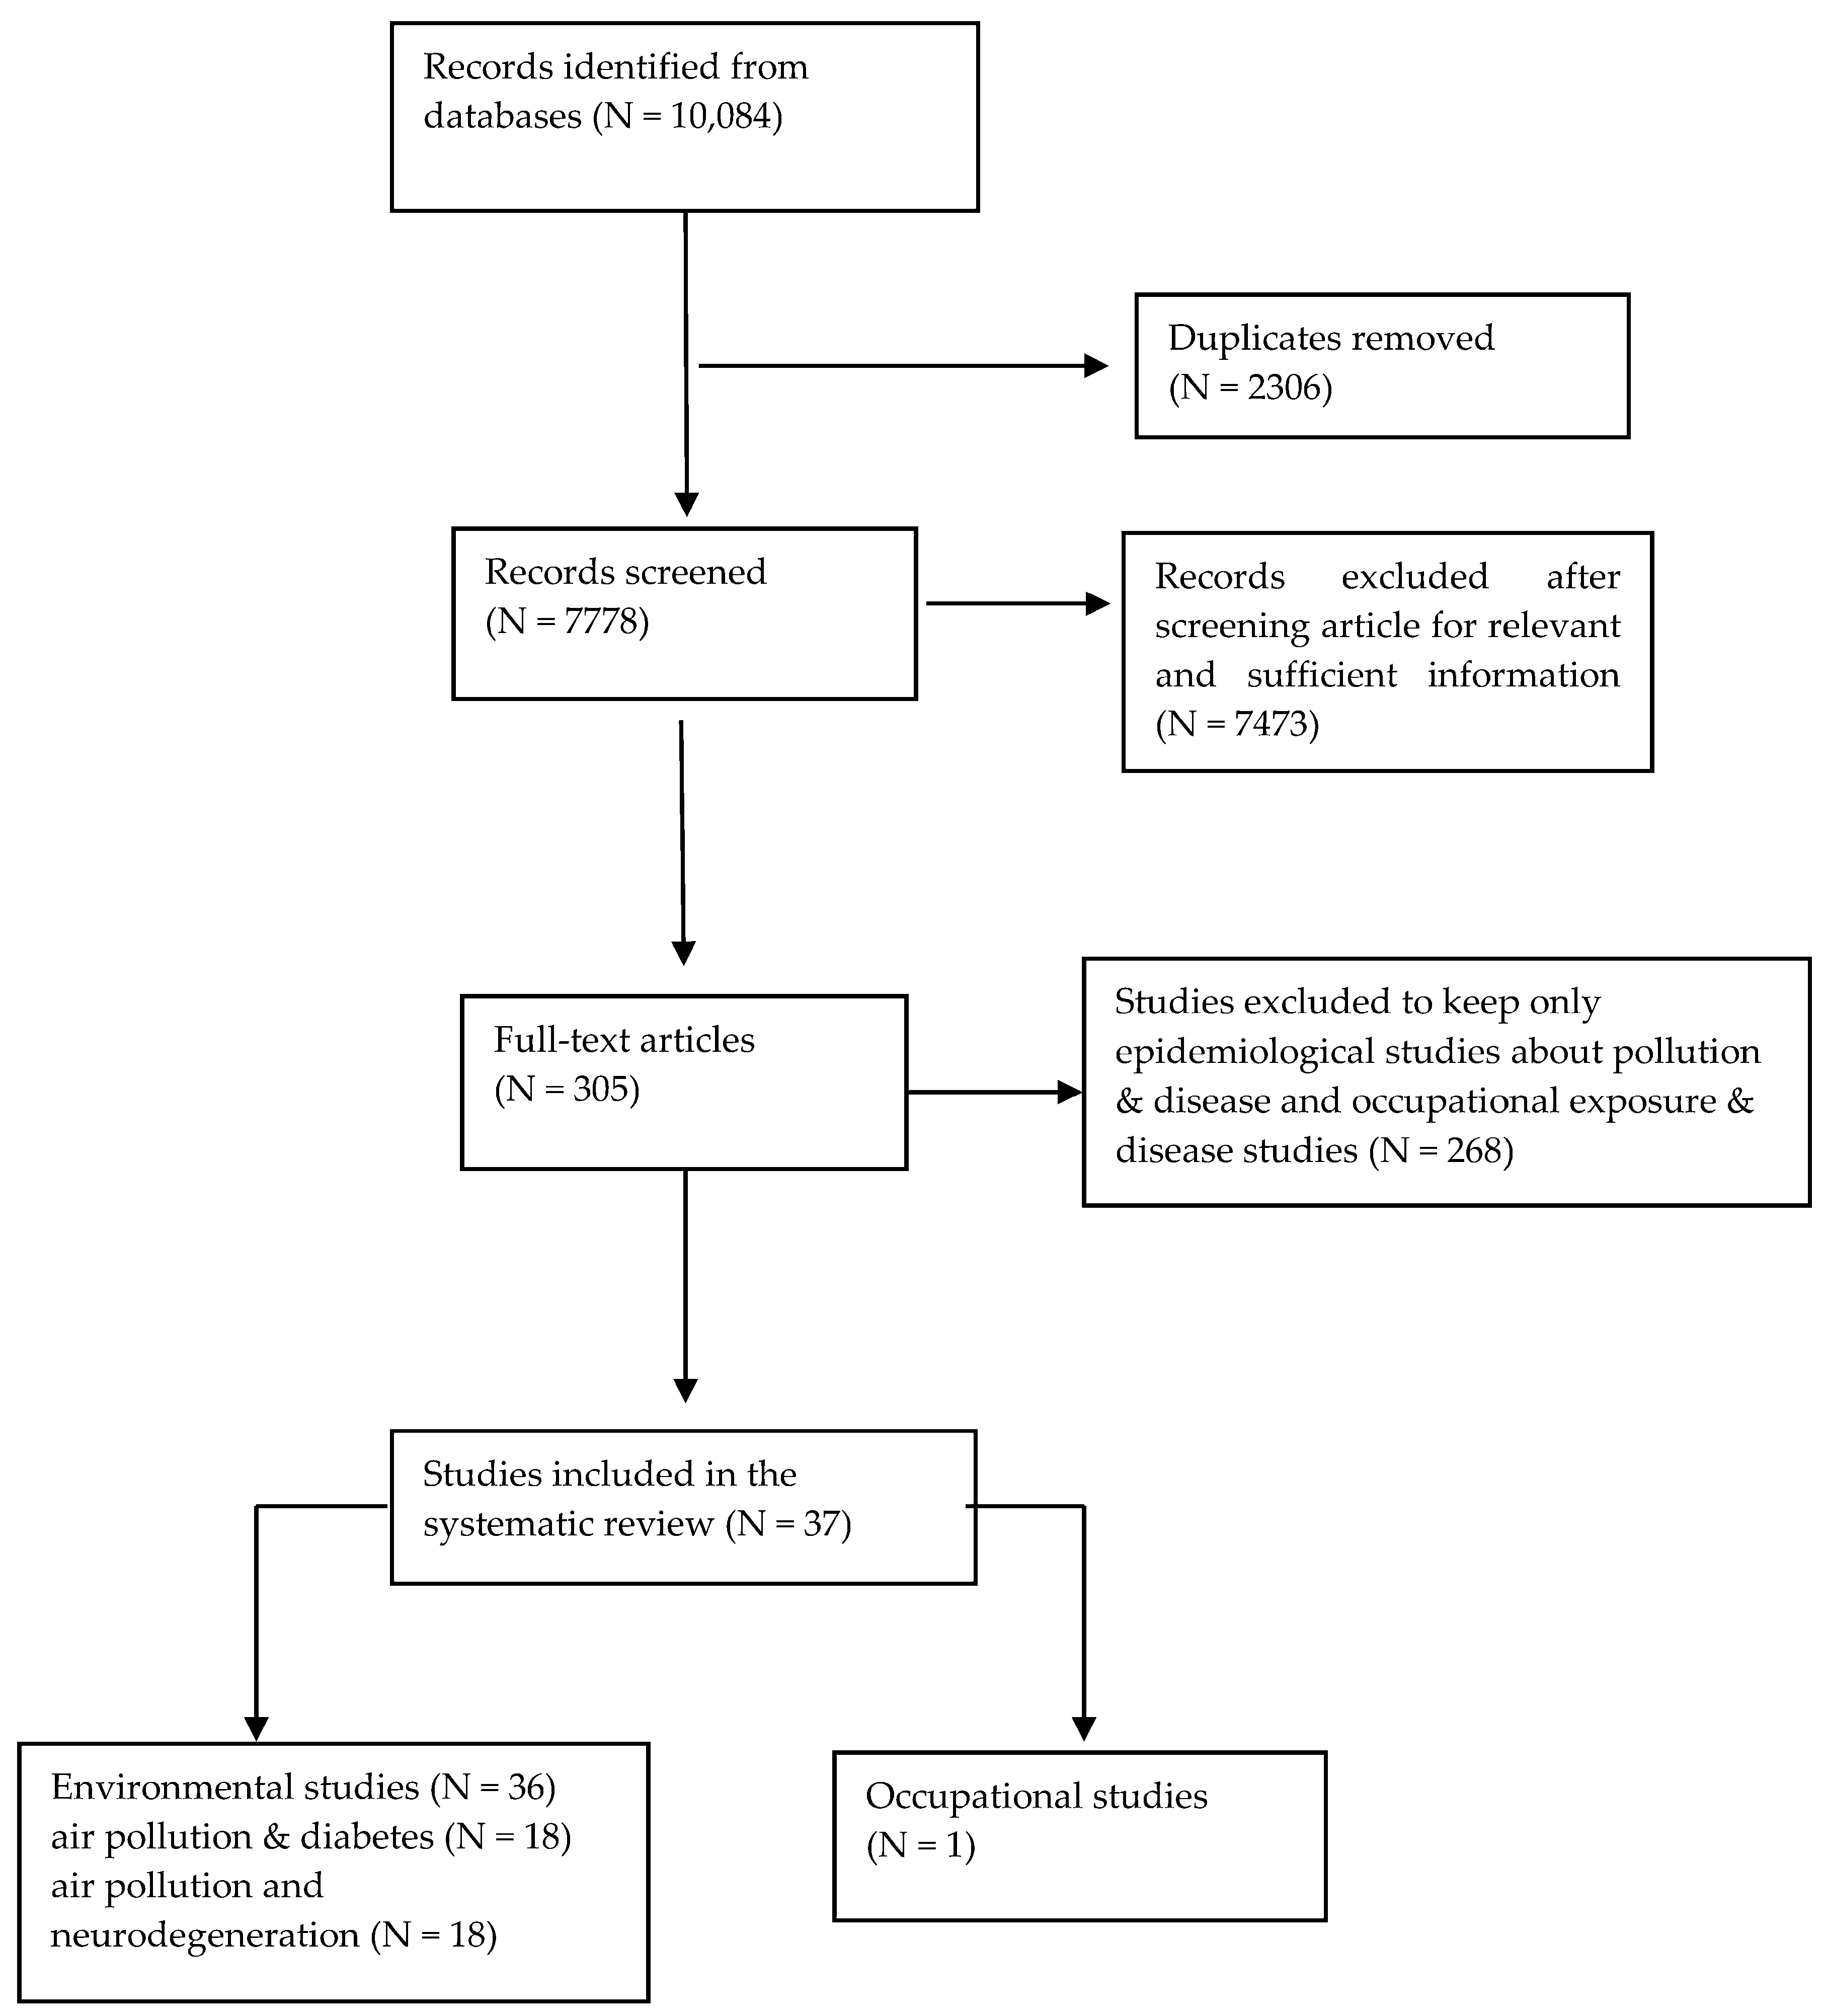
2.1. Search Strategy and Study Selection
2.2. Evaluation of the Systematic Review and Quality of the Studies
- Representativeness and size of the study sample, as well as the duration of follow-up period. High number of participants, many years of follow-up, no attrition and lost during follow-up and participants that were members of a bigger cohort, could upgrade the quality of the studies.
- Publication bias or other kinds of bias, such as selection bias, misclassifications, selective reporting, or conflict of interest diminish the quality of a study. The quality may be downgraded if authors presented incomplete or selectively reported the tested hypothesis, compared to their aim and objectives. If there was no declaration of funder and involvement of the funding body in the research or if the authors had indicated a conflict of interest the quality was also downgraded.
- Potential confounders such as age, sex, physical activity, education level, alcohol intake, smoking status, socioeconomic status (SES) should have been considered. There is a need of an adequate control of confounding and adjustment in the statistical analysis. If more appropriate potential confounders were taken into account, then the quality of the study could be upgraded.
- For both exposure and outcome assessment, standardized and validated methods were required. Well established methods enable the comparison between studies and as a result they can contribute to higher quality rating.
3. Results
3.1. Air Pollution and Neurodegeneration
3.2. Air Pollution and Diabetes (T2DM)
3.3. Rating the Quality of Evidence According to GRADE
4. Discussion
5. Conclusions
Author Contributions
Funding
Acknowledgments
Conflicts of Interest
Appendix A

| Section/Topic | # | Checklist Item | Reported on Page # |
|---|---|---|---|
| TITLE | |||
| Title | 1 | Identify the report as a systematic review, meta-analysis, or both. | 1 |
| ABSTRACT | |||
| Structured summary | 2 | Provide a structured summary including, as applicable: background; objectives; data sources; study eligibility criteria, participants, and interventions; study appraisal and synthesis methods; results; limitations; conclusions and implications of key findings; systematic review registration number. | 1 |
| INTRODUCTION | |||
| Rationale | 3 | Describe the rationale for the review in the context of what is already known. | 1–2 |
| Objectives | 4 | Provide an explicit statement of questions being addressed with reference to participants, interventions, comparisons, outcomes, and study design (PICOS). | 1–2 |
| METHODS | |||
| Protocol and registration | 5 | Indicate if a review protocol exists, if and where it can be accessed (e.g., Web address), and, if available, provide registration information including registration number. | - |
| Eligibility criteria | 6 | Specify study characteristics (e.g., PICOS, length of follow-up) and report characteristics (e.g., years considered, language, publication status) used as criteria for eligibility, giving rationale. | 3 |
| Information sources | 7 | Describe all information sources (e.g., databases with dates of coverage, contact with study authors to identify additional studies) in the search and date last searched. | 3 |
| Search | 8 | Present full electronic search strategy for at least one database, including any limits used, such that it could be repeated. | 3 |
| Study selection | 9 | State the process for selecting studies (i.e., screening, eligibility, included in systematic review, and, if applicable, included in the meta-analysis). | 3 |
| Data collection process | 10 | Describe method of data extraction from reports (e.g., piloted forms, independently, in duplicate) and any processes for obtaining and confirming data from investigators. | 3 |
| Data items | 11 | List and define all variables for which data were sought (e.g., PICOS, funding sources) and any assumptions and simplifications made. | 8–25 |
| Risk of bias in individual studies | 12 | Describe methods used for assessing risk of bias of individual studies (including specification of whether this was done at the study or outcome level), and how this information is to be used in any data synthesis. | 4–5 |
| Summary measures | 13 | State the principal summary measures (e.g., risk ratio, difference in means). | 8–15, 17–24 |
| Synthesis of results | 14 | Describe the methods of handling data and combining results of studies, if done, including measures of consistency (e.g., I2) for each meta-analysis. | 4–5 |
| Risk of bias across studies | 15 | Specify any assessment of risk of bias that may affect the cumulative evidence (e.g., publication bias, selective reporting within studies). | 5, 7, 8–15, 17–24, 26 |
| Additional analyses | 16 | Describe methods of additional analyses (e.g., sensitivity or subgroup analyses, meta-regression), if done, indicating which were pre-specified. | - |
| RESULTS | |||
| Study selection | 17 | Give numbers of studies screened, assessed for eligibility, and included in the review, with reasons for exclusions at each stage, ideally with a flow diagram. | 4 |
| Study characteristics | 18 | For each study, present characteristics for which data were extracted (e.g., study size, PICOS, follow-up period) and provide the citations. | 8–25 |
| Risk of bias within studies | 19 | Present data on risk of bias of each study and, if available, any outcome level assessment (see Item 12). | 8–15, 17–24 |
| Results of individual studies | 20 | For all outcomes considered (benefits or harms), present, for each study: (a) simple summary data for each intervention group (b) effect estimates and confidence intervals, ideally with a forest plot. | 8–15, 17–24 |
| Synthesis of results | 21 | Present results of each meta-analysis done, including confidence intervals and measures of consistency. | - |
| Risk of bias across studies | 22 | Present results of any assessment of risk of bias across studies (see Item 15). | 7, 26 |
| Additional analysis | 23 | Give results of additional analyses, if done (e.g., sensitivity or subgroup analyses, meta-regression (see Item 16)). | - |
| DISCUSSION | |||
| Summary of evidence | 24 | Summarize the main findings including the strength of evidence for each main outcome; consider their relevance to key groups (e.g., healthcare providers, users, and policy makers). | 8–25, 30 |
| Limitations | 25 | Discuss limitations at study and outcome level (e.g., risk of bias), and at review-level (e.g., incomplete retrieval of identified research, reporting bias). | 30 |
| Conclusions | 26 | Provide a general interpretation of the results in the context of other evidence, and implications for future research. | 31 |
| FUNDING | |||
| Funding | 27 | Describe sources of funding for the systematic review and other support (e.g., supply of data); role of funders for the systematic review. | 31 |
References
- Nenonen, N.; Saarela, K.L.; Takala, J.; Hamalainen, P. Global Estimates of Occupational Accidents and Fatal Work-Related Diseases; International Labour Office (ILO): Frankfurt, Germany, 2014; pp. 1–26. [Google Scholar]
- Health and Safety Executive. Health and Safety Statistics for UK Report; Health and Safety Executive: Bootle, UK, 2016.
- World Health Organization (WHO). Ambient Air Pollution: A Global Assessment of Exposure and Burden of Disease; WHO: Geneva, Switzerland, 2016. [Google Scholar]
- WHO. Global Health Risks: Mortality and Burden of Diseases Attributable to Selected Major Risks; WHO: Geneva, Switzerland, 2009. [Google Scholar]
- Every Breath We Take: The Lifelong Impact of Air Pollution; Royal College of Physicians: London, UK, 2016.
- Donaldson, K.; Seaton, A. A short history of the toxicology of inhaled particles. Part. Fibre Toxicol. 2012, 9, 13. [Google Scholar] [CrossRef] [PubMed] [Green Version]
- Jun, K. Case Study of Air Pollution Episodes in Meuse Valley of Belgium, Donora of Pennsylvania, and London, UK. In Environmental Toxicology and Human Health; Satoh, T., Ed.; Eolss Publishers Co. Ltd.: Oxford, UK, 2009; Volume I. [Google Scholar]
- Seaton, A.; MacNee, W.; Donaldson, K.; Godden, D. Particulate air pollution and acute health effects. Lancet 1995, 345, 176–178. [Google Scholar] [CrossRef]
- Donaldson, K.; Stone, V. Current hypotheses on the mechanisms of toxicity of ultrafine particles. Annali Dell’istituto Superiore di Sanita 2003, 39, 405–410. [Google Scholar] [PubMed]
- Stone, V.; Miller, M.R.; Clift, M.J.D.; Elder, A.; Mills, N.L.; Moller, P.; Schins, R.P.F.; Vogel, U.; Kreyling, W.G.; Alstrup Jensen, K.; et al. Nanomaterials Versus Ambient Ultrafine Particles: An Opportunity to Exchange Toxicology Knowledge. Environ. Health Perspect. 2017, 125, 106002. [Google Scholar] [CrossRef] [PubMed] [Green Version]
- Brook, R.D.; Rajagopalan, S.; Pope, C.A., 3rd; Brook, J.R.; Bhatnagar, A.; Diez-Roux, A.V.; Holguin, F.; Hong, Y.; Luepker, R.V.; Mittleman, M.A.; et al. Particulate matter air pollution and cardiovascular disease: An update to the scientific statement from the American Heart Association. Circulation 2010, 121, 2331–2378. [Google Scholar] [CrossRef] [PubMed]
- Dockery, D.W.; Pope, C.A., 3rd; Xu, X.; Spengler, J.D.; Ware, J.H.; Fay, M.E.; Ferris, B.G., Jr.; Speizer, F.E. An association between air pollution and mortality in six U.S. cities. N. Engl. J. Med. 1993, 329, 1753–1759. [Google Scholar] [CrossRef] [PubMed]
- Schwartz, J. Air pollution and daily mortality: A review and meta analysis. Environ. Res. 1994, 64, 36–52. [Google Scholar] [CrossRef] [PubMed]
- D’Amato, G. Outdoor air pollution in urban areas and allergic respiratory diseases. Monaldi Arch. Chest Dis. 1999, 54, 470–474. [Google Scholar] [PubMed]
- Jovanovic-Andersen, Z. Health effects of long-term exposure to air pollution: An overview of major respiratory and cardiovascular diseases and diabetes. Chem. Ind. Chem. Eng. Quart. 2012, 18, 617–622. [Google Scholar] [CrossRef]
- WHO. Air Pollution and Cancer; WHO: Geneva, Switzerland, 2013. [Google Scholar]
- Eze, I.C.; Schaffner, E.; Fischer, E.; Schikowski, T.; Adam, M.; Imboden, M.; Tsai, M.; Carballo, D.; von Eckardstein, A.; Kunzli, N.; et al. Long-term air pollution exposure and diabetes in a population-based Swiss cohort. Environ. Int. 2014, 70, 95–105. [Google Scholar] [CrossRef] [PubMed]
- Wang, B.; Xu, D.; Jing, Z.; Liu, D.; Yan, S.; Wang, Y. Effect of long-term exposure to air pollution on type 2 diabetes mellitus risk: A systemic review and meta-analysis of cohort studies. Eur. J. Endocrinol. 2014, 171, R173–R182. [Google Scholar] [CrossRef] [PubMed]
- Teichert, T.; Vossoughi, M.; Vierkotter, A.; Sugiri, D.; Schikowski, T.; Schulte, T.; Roden, M.; Luckhaus, C.; Herder, C.; Kramer, U. Association between traffic-related air pollution, subclinical inflammation and impaired glucose metabolism: Results from the SALIA study. PLoS ONE 2013, 8, e83042. [Google Scholar] [CrossRef] [PubMed] [Green Version]
- Coogan, P.F.; White, L.F.; Jerrett, M.; Brook, R.D.; Su, J.G.; Seto, E.; Burnett, R.; Palmer, J.R.; Rosenberg, L. Air pollution and incidence of hypertension and diabetes mellitus in black women living in Los Angeles. Circulation 2012, 125, 767–772. [Google Scholar] [CrossRef] [PubMed]
- De Jager, C.; Blackwell, A.; Budge, M.; Sahakian, B. Predicting cognitive decline in healthy adults. Am. J. Geriatr. Psychiatry 2005, 13, 735–740. [Google Scholar] [CrossRef] [PubMed]
- Liu, C.; Bai, Y.; Xu, X.; Sun, L.; Wang, A.; Wang, T.Y.; Maurya, S.K.; Periasamy, M.; Morishita, M.; Harkema, J.; et al. Exaggerated effects of particulate matter air pollution in genetic type II diabetes mellitus. Part. Fibre Toxicol. 2014, 11, 27. [Google Scholar] [CrossRef] [PubMed]
- Dubowsky, S.D.; Suh, H.; Schwartz, J.; Coull, B.A.; Gold, D.R. Diabetes, Obesity, and Hypertension May Enhance Associations between Air Pollution and Markers of Systemic Inflammation. Environ. Health Perspect. 2006, 114, 992–998. [Google Scholar] [CrossRef] [PubMed] [Green Version]
- Weinmayr, G.; Hennig, F.; Fuks, K.; Nonnemacher, M.; Jakobs, H.; Mohlenkamp, S.; Erbel, R.; Jockel, K.H.; Hoffmann, B.; Moebus, S.; et al. Long-term exposure to fine particulate matter and incidence of type 2 diabetes mellitus in a cohort study: Effects of total and traffic-specific air pollution. Environ. Health 2015, 14, 53. [Google Scholar] [CrossRef] [PubMed]
- Rajagopalan, S.; Brook, R.D. Air pollution and type 2 diabetes: Mechanistic insights. Diabetes 2012, 61, 3037–3045. [Google Scholar] [CrossRef] [PubMed]
- Jung, C.R.; Lin, Y.T.; Hwang, B.F. Ozone, particulate matter, and newly diagnosed Alzheimer’s disease: A population-based cohort study in Taiwan. J. Alzheimer’s Dis. 2015, 44, 573–584. [Google Scholar] [CrossRef] [PubMed]
- Moulton, P.V.; Yang, W. Air pollution, oxidative stress, and Alzheimer’s disease. J. Environ. Public Health 2012, 2012, 472751. [Google Scholar] [CrossRef] [PubMed]
- Calderon-Garciduenas, L.; Franco-Lira, M.; Mora-Tiscareno, A.; Medina-Cortina, H.; Torres-Jardon, R.; Kavanaugh, M. Early Alzheimer’s and Parkinson’s disease pathology in urban children: Friend versus Foe responses—It is time to face the evidence. BioMed Res. Int. 2013, 2013, 161687. [Google Scholar] [CrossRef] [PubMed]
- Kirrane, E.F.; Bowman, C.; Davis, J.A.; Hoppin, J.A.; Blair, A.; Chen, H.; Patel, M.M.; Sandler, D.P.; Tanner, C.M.; Vinikoor-Imler, L.; et al. Associations of Ozone and PM2.5 Concentrations With Parkinson’s Disease Among Participants in the Agricultural Health Study. J. Occup. Environ. Med. 2015, 57, 509–517. [Google Scholar] [CrossRef] [PubMed]
- Heusinkveld, H.J.; Wahle, T.; Campbell, A.; Westerink, R.H.S.; Tran, L.; Johnston, H.; Stone, V.; Cassee, F.R.; Schins, R.P.F. Neurodegenerative and neurological disorders by small inhaled particles. Neurotoxicology 2016, 56, 94–106. [Google Scholar] [CrossRef] [PubMed]
- Oberdorster, G.; Sharp, Z.; Atudorei, V.; Elder, A.; Gelein, R.; Kreyling, W.; Cox, C. Translocation of inhaled ultrafine particles to the brain. Inhal. Toxicol. 2004, 16, 437–445. [Google Scholar] [CrossRef] [PubMed]
- Park, S.K.; Adar, S.D.; O’Neill, M.S.; Auchincloss, A.H.; Szpiro, A.; Bertoni, A.G.; Navas-Acien, A.; Kaufman, J.D.; Diez-Roux, A.V. Long-Term Exposure to Air Pollution and Type 2 Diabetes Mellitus in a Multiethnic Cohort. Am. J. Epidemiol. 2015, 181, 327–336. [Google Scholar] [CrossRef] [PubMed] [Green Version]
- Guyatt, G.H.; Oxman, A.D.; Vist, G.E.; Kunz, R.; Falck-Ytter, Y.; Alonso-Coello, P.; Schunemann, H.J.; Group, G.W. GRADE: An emerging consensus on rating quality of evidence and strength of recommendations. BMJ 2008, 336, 924–926. [Google Scholar] [CrossRef] [PubMed]
- Theorell, T.; Hammarstrom, A.; Aronsson, G.; Traskman Bendz, L.; Grape, T.; Hogstedt, C.; Marteinsdottir, I.; Skoog, I.; Hall, C. A systematic review including meta-analysis of work environment and depressive symptoms. BMC Public Health 2015, 15, 738. [Google Scholar] [CrossRef] [PubMed]
- Morgan, R.L.; Thayer, K.A.; Bero, L.; Bruce, N.; Falck-Ytter, Y.; Ghersi, D.; Guyatt, G.; Hooijmans, C.; Langendam, M.; Mandrioli, D.; et al. GRADE: Assessing the quality of evidence in environmental and occupational health. Environ. Int. 2016, 92–93, 611–616. [Google Scholar] [CrossRef] [PubMed]
- Rooney, A.A.; Cooper, G.S.; Jahnke, G.D.; Lam, J.; Morgan, R.L.; Boyles, A.L.; Ratcliffe, J.M.; Kraft, A.D.; Schunemann, H.J.; Schwingl, P.; et al. How credible are the study results? Evaluating and applying internal validity tools to literature-based assessments of environmental health hazards. Environ. Int. 2016, 92–93, 617–629. [Google Scholar] [CrossRef] [PubMed]
- Tonne, C.; Elbaz, A.; Beevers, S.; Singh-Manoux, A. Traffic-related air pollution in relation to cognitive function in older adults. Epidemiology 2014, 25, 674–681. [Google Scholar] [CrossRef] [PubMed]
- Chen, J.C.; Wang, X.; Wellenius, G.A.; Serre, M.L.; Driscoll, I.; Casanova, R.; McArdle, J.J.; Manson, J.E.; Chui, H.C.; Espeland, M.A. Ambient air pollution and neurotoxicity on brain structure: Evidence from women’s health initiative memory study. Ann. Neurol. 2015, 78, 466–476. [Google Scholar] [CrossRef] [PubMed]
- Power, M.C.; Weisskopf, M.G.; Alexeeff, S.E.; Coull, B.A.; Spiro, A., 3rd; Schwartz, J. Traffic-related air pollution and cognitive function in a cohort of older men. Environ. Health Perspect. 2011, 119, 682–687. [Google Scholar] [CrossRef] [PubMed]
- Ranft, U.; Schikowski, T.; Sugiri, D.; Krutmann, J.; Kramer, U. Long-term exposure to traffic-related particulate matter impairs cognitive function in the elderly. Environ. Res. 2009, 109, 1004–1011. [Google Scholar] [CrossRef] [PubMed]
- Schikowski, T.; Vossoughi, M.; Vierkotter, A.; Schulte, T.; Teichert, T.; Sugiri, D.; Fehsel, K.; Tzivian, L.; Bae, I.S.; Ranft, U.; et al. Association of air pollution with cognitive functions and its modification by APOE gene variants in elderly women. Environ. Res. 2015, 142, 10–16. [Google Scholar] [CrossRef] [PubMed]
- Weuve, J.; Puett, R.C.; Schwartz, J.; Yanosky, J.D.; Laden, F.; Grodstein, F. Exposure to particulate air pollution and cognitive decline in older women. Arch. Intern. Med. 2012, 172, 219–227. [Google Scholar] [CrossRef] [PubMed]
- Chen, J.C.; Schwartz, J. Neurobehavioral effects of ambient air pollution on cognitive performance in US adults. Neurotoxicology 2009, 30, 231–239. [Google Scholar] [CrossRef] [PubMed]
- Kioumourtzoglou, M.A.; Schwartz, J.D.; Weisskopf, M.G.; Melly, S.J.; Wang, Y.; Dominici, F.; Zanobetti, A. Long-term PM2.5 Exposure and Neurological Hospital Admissions in the Northeastern United States. Environ. Health Perspect. 2016, 124, 23–29. [Google Scholar] [CrossRef] [PubMed]
- Tzivian, L.; Dlugaj, M.; Winkler, A.; Weinmayr, G.; Hennig, F.; Fuks, K.B.; Vossoughi, M.; Schikowski, T.; Weimar, C.; Erbel, R.; et al. Long-term air pollution and traffic noise exposures and mild cognitive impairment in older adults: A cross-sectional analysis of the Heinz Nixdorf recall study. Environ. Health Perspect. 2016, 124, 1361–1368. [Google Scholar] [CrossRef] [PubMed]
- Chen, C.Y.; Hung, H.J.; Chang, K.H.; Hsu, C.Y.; Muo, C.H.; Tsai, C.H.; Wu, T.N. Long-term exposure to air pollution and the incidence of Parkinson’s disease: A nested case-control study. PLoS ONE 2017, 12, e0182834. [Google Scholar] [CrossRef] [PubMed]
- Ailshire, J.A.; Clarke, P. Fine particulate matter air pollution and cognitive function among U.S. older adults. J. Gerontol. B Psychol. Sci. Soc. Sci. 2015, 70, 322–328. [Google Scholar] [CrossRef] [PubMed]
- Wu, Y.C.; Lin, Y.C.; Yu, H.L.; Chen, J.H.; Chen, T.F.; Sun, Y.; Wen, L.L.; Yip, P.K.; Chu, Y.M.; Chen, Y.C. Association between air pollutants and dementia risk in the elderly. Alzheimer’s Dement. 2015, 1, 220–228. [Google Scholar] [CrossRef] [PubMed]
- Palacios, N.; Fitzgerald, K.C.; Hart, J.E.; Weisskopf, M.; Schwarzschild, M.A.; Ascherio, A.; Laden, F. Air Pollution and Risk of Parkinson’s Disease in a Large Prospective Study of Men. Environ. Health Perspect. 2017, 125, 087011. [Google Scholar] [CrossRef] [PubMed] [Green Version]
- Palacios, N.; Fitzgerald, K.C.; Hart, J.E.; Weisskopf, M.G.; Schwarzschild, M.A.; Ascherio, A.; Laden, F. Particulate matter and risk of Parkinson disease in a large prospective study of women. Environ. Health 2014, 13, 80. [Google Scholar] [CrossRef] [PubMed]
- Liu, R.; Young, M.T.; Chen, J.C.; Kaufman, J.D.; Chen, H. Ambient Air Pollution Exposures and Risk of Parkinson Disease. Environ. Health Perspect. 2016, 124, 1759–1765. [Google Scholar] [CrossRef] [PubMed]
- Power, M.C.; Adar, S.D.; Yanosky, J.D.; Weuve, J. Exposure to air pollution as a potential contributor to cognitive function, cognitive decline, brain imaging, and dementia: A systematic review of epidemiologic research. Neurotoxicology 2016, 56, 235–253. [Google Scholar] [CrossRef] [PubMed] [Green Version]
- Ferreira, L.K.; Busatto, G.F. Neuroimaging in Alzheimer’s disease: Current role in clinical practice and potential future applications. Clinics 2011, 66 (Suppl. 1), 19–24. [Google Scholar] [CrossRef]
- Chen, H.; Kwong, J.C.; Copes, R.; Tu, K.; Villeneuve, P.J.; van Donkelaar, A.; Hystad, P.; Martin, R.V.; Murray, B.J.; Jessiman, B.; et al. Living near major roads and the incidence of dementia, Parkinson’s disease, and multiple sclerosis: A population-based cohort study. Lancet 2017, 389, 718–726. [Google Scholar] [CrossRef]
- Sharp, E.S.; Gatz, M. Relationship between education and dementia: An updated systematic review. Alzheimer Dis. Assoc. Disord. 2011, 25, 289–304. [Google Scholar] [CrossRef] [PubMed]
- Fischer, C.; Yeung, E.; Hansen, T.; Gibbons, S.; Fornazzari, L.; Ringer, L.; Schweizer, T.A. Impact of socioeconomic status on the prevalence of dementia in an inner city memory disorders clinic. Int. Psychogeriatr. 2009, 21, 1096–1104. [Google Scholar] [CrossRef] [PubMed]
- Russ, T.C.; Stamatakis, E.; Hamer, M.; Starr, J.M.; Kivimaki, M.; Batty, G.D. Socioeconomic status as a risk factor for dementia death: Individual participant meta-analysis of 86,508 men and women from the UK. Br. J. Psychiatry 2013, 203, 10–17. [Google Scholar] [CrossRef] [PubMed] [Green Version]
- Liu, C.; Yang, C.; Zhao, Y.; Ma, Z.; Bi, J.; Liu, Y.; Meng, X.; Wang, Y.; Cai, J.; Chen, R.; et al. Associations between long-term exposure to ambient particulate air pollution and type 2 diabetes prevalence, blood glucose and glycosylated hemoglobin levels in China. Environ. Int. 2016, 92–93, 416–421. [Google Scholar] [CrossRef] [PubMed]
- Wolf, K.; Popp, A.; Schneider, A.; Breitner, S.; Hampel, R.; Rathmann, W.; Herder, C.; Roden, M.; Koenig, W.; Meisinger, C.; et al. Association Between Long-term Exposure to Air Pollution and Biomarkers Related to Insulin Resistance, Subclinical Inflammation, and Adipokines. Diabetes 2016, 65, 3314–3326. [Google Scholar] [CrossRef] [PubMed]
- Eze, I.C.; Schaffner, E.; Foraster, M.; Imboden, M.; von Eckardstein, A.; Gerbase, M.W.; Rothe, T.; Rochat, T.; Kunzli, N.; Schindler, C.; et al. Long-Term Exposure to Ambient Air Pollution and Metabolic Syndrome in Adults. PLoS ONE 2015, 10, e0130337. [Google Scholar] [CrossRef] [PubMed] [Green Version]
- O’Donovan, G.; Chudasama, Y.; Grocock, S.; Leigh, R.; Dalton, A.M.; Gray, L.J.; Yates, T.; Edwardson, C.; Hill, S.; Henson, J.; et al. The association between air pollution and type 2 diabetes in a large cross-sectional study in Leicester: The CHAMPIONS Study. Environ. Int. 2017, 104, 41–47. [Google Scholar] [CrossRef] [PubMed] [Green Version]
- De Sio, S.; Rosati, M.V.; Cherubini, E.; Ciarrocca, M.; Baccolo, T.P.; Grimaldi, F.; Caciari, T.; Tomao, E.; Tomei, F. Occupational exposure to urban pollutants and plasma insulin. Saudi Med. J. 2005, 26, 416–420. [Google Scholar] [PubMed]
- Brook, R.D.; Cakmak, S.; Turner, M.C.; Brook, J.R.; Crouse, D.L.; Peters, P.A.; van Donkelaar, A.; Villeneuve, P.J.; Brion, O.; Jerrett, M.; et al. Long-term fine particulate matter exposure and mortality from diabetes in Canada. Diabetes Care 2013, 36, 3313–3320. [Google Scholar] [CrossRef] [PubMed]
- Li, C.; Fang, D.; Xu, D.; Wang, B.; Zhao, S.; Yan, S.; Wang, Y. Main air pollutants and diabetes-associated mortality: A systematic review and meta-analysis. Eur. J. Endocrinol. 2014, 171, R183–R190. [Google Scholar] [CrossRef] [PubMed]
- Pope, C.A., 3rd; Turner, M.C.; Burnett, R.T.; Jerrett, M.; Gapstur, S.M.; Diver, W.R.; Krewski, D.; Brook, R.D. Relationships between fine particulate air pollution, cardiometabolic disorders, and cardiovascular mortality. Circ. Res. 2015, 116, 108–115. [Google Scholar] [CrossRef] [PubMed]
- Chen, H.; Burnett, R.T.; Kwong, J.C.; Villeneuve, P.J.; Goldberg, M.S.; Brook, R.D.; van Donkelaar, A.; Jerrett, M.; Martin, R.V.; Brook, J.R.; et al. Risk of incident diabetes in relation to long-term exposure to fine particulate matter in Ontario, Canada. Environ. Health Perspect. 2013, 121, 804–810. [Google Scholar] [CrossRef] [PubMed]
- Hansen, A.B.; Ravnskjaer, L.; Loft, S.; Andersen, K.K.; Brauner, E.V.; Baastrup, R.; Yao, C.; Ketzel, M.; Becker, T.; Brandt, J.; et al. Long-term exposure to fine particulate matter and incidence of diabetes in the Danish Nurse Cohort. Environ. Int. 2016, 91, 243–250. [Google Scholar] [CrossRef] [PubMed]
- Lyons, T.J.; Basu, A. Biomarkers in diabetes: Hemoglobin A1c, vascular and tissue markers. Transl. Res. 2012, 159, 303–312. [Google Scholar] [CrossRef] [PubMed]
- Chen, Z.; Salam, M.T.; Toledo-Corral, C.; Watanabe, R.M.; Xiang, A.H.; Buchanan, T.A.; Habre, R.; Bastain, T.M.; Lurmann, F.; Wilson, J.P.; et al. Ambient Air Pollutants Have Adverse Effects on Insulin and Glucose Homeostasis in Mexican Americans. Diabetes Care 2016, 39, 547–554. [Google Scholar] [CrossRef] [PubMed] [Green Version]
- Kramer, U.; Herder, C.; Sugiri, D.; Strassburger, K.; Schikowski, T.; Ranft, U.; Rathmann, W. Traffic-related air pollution and incident type 2 diabetes: Results from the SALIA cohort study. Environ. Health Perspect. 2010, 118, 1273–1279. [Google Scholar] [CrossRef] [PubMed] [Green Version]
- Kim, J.H.; Hong, Y.C. GSTM1, GSTT1, and GSTP1 polymorphisms and associations between air pollutants and markers of insulin resistance in elderly Koreans. Environ. Health Perspect. 2012, 120, 1378–1384. [Google Scholar] [CrossRef] [PubMed]
- Puett, R.C.; Hart, J.E.; Schwartz, J.; Hu, F.B.; Liese, A.D.; Laden, F. Are particulate matter exposures associated with risk of type 2 diabetes? Environ. Health Perspect. 2011, 119, 384–389. [Google Scholar] [CrossRef] [PubMed]
- Chen, L.; Zhou, Y.; Li, S.; Williams, G.; Kan, H.; Marks, G.B.; Morawska, L.; Abramson, M.J.; Chen, S.; Yao, T.; et al. Air pollution and fasting blood glucose: A longitudinal study in China. Sci. Total Environ. 2016, 541, 750–755. [Google Scholar] [CrossRef] [PubMed]
- Wang, Y.; Eliot, M.N.; Kuchel, G.A.; Schwartz, J.; Coull, B.A.; Mittleman, M.A.; Lipsitz, L.A.; Wellenius, G.A. Long-term exposure to ambient air pollution and serum leptin in older adults: Results from the MOBILIZE Boston study. J. Occup. Environ. Med. 2014, 56, e73–e77. [Google Scholar] [CrossRef] [PubMed]
- Eze, I.C.; Hemkens, L.G.; Bucher, H.C.; Hoffmann, B.; Schindler, C.; Kunzli, N.; Schikowski, T.; Probst-Hensch, N.M. Association between ambient air pollution and diabetes mellitus in Europe and North America: Systematic review and meta-analysis. Environ. Health Perspect. 2015, 123, 381–389. [Google Scholar] [CrossRef] [PubMed]
- Guyatt, G.H.; Oxman, A.D.; Montori, V.; Vist, G.; Kunz, R.; Brozek, J.; Alonso-Coello, P.; Djulbegovic, B.; Atkins, D.; Falck-Ytter, Y.; et al. GRADE guidelines: 5. Rating the quality of evidence—Publication bias. J. Clin. Epidemiol. 2011, 64, 1277–1282. [Google Scholar] [CrossRef] [PubMed]
- Guyatt, G.H.; Oxman, A.D.; Kunz, R.; Woodcock, J.; Brozek, J.; Helfand, M.; Alonso-Coello, P.; Falck-Ytter, Y.; Jaeschke, R.; Vist, G.; et al. GRADE guidelines: 8. Rating the quality of evidence—Indirectness. J. Clin. Epidemiol. 2011, 64, 1303–1310. [Google Scholar] [CrossRef] [PubMed]
- Clifford, A.; Lang, L.; Chen, R.; Anstey, K.J.; Seaton, A. Exposure to air pollution and cognitive functioning across the life course—A systematic literature review. Environ. Res. 2016, 147, 383–398. [Google Scholar] [CrossRef] [PubMed]
- Palacios, N.; Fitzgerald, K.; Roberts, A.L.; Hart, J.E.; Weisskopf, M.G.; Schwarzschild, M.A.; Ascherio, A.; Laden, F. A prospective analysis of airborne metal exposures and risk of Parkinson disease in the nurses’ health study cohort. Environ. Health Perspect. 2014, 122, 933–938. [Google Scholar] [CrossRef] [PubMed] [Green Version]
- Ailshire, J.A.; Crimmins, E.M. Fine particulate matter air pollution and cognitive function among older US adults. Am. J. Epidemiol. 2014, 180, 359–366. [Google Scholar] [CrossRef] [PubMed]
- Fung, K.Y.; Luginaah, I.N.; Gorey, K.M. Impact of air pollution on hospital admissions in Southwestern Ontario, Canada: Generating hypotheses in sentinel high-exposure places. Environ Health 2007, 6, 18. [Google Scholar] [CrossRef] [PubMed]
- Kunzli, N.; Tager, I.B. Air pollution: From lung to heart. Swiss Med. Wkly. 2005, 135, 697–702. [Google Scholar] [PubMed]
- Janghorbani, M.; Momeni, F.; Mansourian, M. Systematic review and meta-analysis of air pollution exposure and risk of diabetes. Eur. J. Epidemiol. 2014, 29, 231–242. [Google Scholar] [CrossRef] [PubMed]
- Thibault, V.; Belanger, M.; LeBlanc, E.; Babin, L.; Halpine, S.; Greene, B.; Mancuso, M. Factors that could explain the increasing prevalence of type 2 diabetes among adults in a Canadian province: A critical review and analysis. Diabetol. Metab. Syndr. 2016, 8, 71. [Google Scholar] [CrossRef] [PubMed]
- Robertson, M.; Seaton, A.; Whalley, L.J. Can we reduce the risk of dementia? QJM 2015, 108, 93–97. [Google Scholar] [CrossRef] [PubMed]
- Baldi, I.; Lebailly, P.; Mohammed-Brahim, B.; Letenneur, L.; Dartigues, J.F.; Brochard, P. Neurodegenerative diseases and exposure to pesticides in the elderly. Am. J. Epidemiol. 2003, 157, 409–414. [Google Scholar] [CrossRef] [PubMed]
- Donaldson, K.; Brown, D.; Clouter, A.; Duffin, R.; MacNee, W.; Renwick, L.; Tran, L.; Stone, V. The pulmonary toxicology of ultrafine particles. J. Aerosol Med. 2002, 15, 213–220. [Google Scholar] [CrossRef] [PubMed]
- Johnston, H.J.; Verdon, R.; Gillies, S.; Brown, D.M.; Fernandes, T.F.; Henry, T.B.; Rossi, A.G.; Tran, L.; Tucker, C.; Tyler, C.R.; et al. Adoption of in vitro systems and zebrafish embryos as alternative models for reducing rodent use in assessments of immunological and oxidative stress responses to nanomaterials. Crit. Rev. Toxicol. 2018, 48, 252–271. [Google Scholar] [CrossRef] [PubMed]
- Duncan, B.B.; Schmidt, M.I.; Pankow, J.S.; Ballantyne, C.M.; Couper, D.; Vigo, A.; Hoogeveen, R.; Folsom, A.R.; Heiss, G.; Atherosclerosis Risk in Communities. Low-grade systemic inflammation and the development of type 2 diabetes: The atherosclerosis risk in communities study. Diabetes 2003, 52, 1799–1805. [Google Scholar] [CrossRef] [PubMed]
- Wellen, K.E.; Hotamisligil, G.S. Inflammation, stress, and diabetes. J. Clin. Investig. 2005, 115, 1111–1119. [Google Scholar] [CrossRef] [PubMed] [Green Version]
- Rehman, K.; Akash, M.S. Mechanisms of inflammatory responses and development of insulin resistance: How are they interlinked? J. Biomed. Sci. 2016, 23, 87. [Google Scholar] [CrossRef] [PubMed]
- Meigs, J.B. Multiple biomarker prediction of type 2 diabetes. Diabetes Care 2009, 32, 1346–1348. [Google Scholar] [CrossRef] [PubMed]
- Rioux, C.L.; Tucker, K.L.; Brugge, D.; Gute, D.M.; Mwamburi, M. Traffic exposure in a population with high prevalence type 2 diabetes—Do medications influence concentrations of C-reactive protein? Environ. Pollut. 2011, 159, 2051–2060. [Google Scholar] [CrossRef] [PubMed]
- Khafaie, M.A.; Salvi, S.S.; Ojha, A.; Khafaie, B.; Gore, S.S.; Yajnik, C.S. Systemic inflammation (C-reactive protein) in type 2 diabetic patients is associated with ambient air pollution in Pune City, India. Diabetes Care 2013, 36, 625–630. [Google Scholar] [CrossRef] [PubMed]
- Yang, B.Y.; Qian, Z.M.; Li, S.; Chen, G.; Bloom, M.S.; Elliott, M.; Syberg, K.W.; Heinrich, J.; Markevych, I.; Wang, S.Q.; et al. Ambient air pollution in relation to diabetes and glucose-homoeostasis markers in China: A cross-sectional study with findings from the 33 Communities Chinese Health Study. Lancet Planet Health 2018, 2, e64–e73. [Google Scholar] [CrossRef]
- Bolos, M.; Perea, J.R.; Avila, J. Alzheimer’s disease as an inflammatory disease. Biomol. Concepts 2017, 8, 37–43. [Google Scholar] [CrossRef] [PubMed]
- De Groot, N.S.; Burgas, M.T. Is membrane homeostasis the missing link between inflammation and neurodegenerative diseases? Cell Mol. Life Sci. 2015, 72, 4795–4805. [Google Scholar] [CrossRef] [PubMed] [Green Version]
- Morales, I.; Farias, G.; Maccioni, R.B. Neuroimmunomodulation in the pathogenesis of Alzheimer’s disease. Neuroimmunomodulation 2010, 17, 202–204. [Google Scholar] [CrossRef] [PubMed]
- Shepherd, C.; McCann, H.; Halliday, G.M. Variations in the neuropathology of familial Alzheimer’s disease. Acta Neuropathol. 2009, 118, 37–52. [Google Scholar] [CrossRef] [PubMed]
- Gupta, A.; Watkins, A.; Thomas, P.; Majer, R.; Habubi, N.; Morris, G.; Pansari, K. Coagulation and inflammatory markers in Alzheimer’s and vascular dementia. Int. J. Clin. Pract. 2005, 59, 52–57. [Google Scholar] [CrossRef] [PubMed]
- Koyama, A.; O’Brien, J.; Weuve, J.; Blacker, D.; Metti, A.L.; Yaffe, K. The role of peripheral inflammatory markers in dementia and Alzheimer’s disease: A meta-analysis. J. Gerontol. Ser. A Biol. Sci. Med. Sci. 2013, 68, 433–440. [Google Scholar] [CrossRef] [PubMed]
- Jefferson, A.L.; Massaro, J.M.; Wolf, P.A.; Seshadri, S.; Au, R.; Vasan, R.S.; Larson, M.G.; Meigs, J.B.; Keaney, J.F., Jr.; Lipinska, I.; et al. Inflammatory biomarkers are associated with total brain volume: The Framingham Heart Study. Neurology 2007, 68, 1032–1038. [Google Scholar] [CrossRef] [PubMed] [Green Version]
- Calderon-Garciduenas, L.; Reed, W.; Maronpot, R.R.; Henriquez-Roldan, C.; Delgado-Chavez, R.; Calderon-Garciduenas, A.; Dragustinovis, I.; Franco-Lira, M.; Aragon-Flores, M.; Solt, A.C.; et al. Brain inflammation and Alzheimer’s-like pathology in individuals exposed to severe air pollution. Toxicol. Pathol. 2004, 32, 650–658. [Google Scholar] [CrossRef] [PubMed]
- Calderon-Garciduenas, L.; Azzarelli, B.; Acuna, H.; Garcia, R.; Gambling, T.M.; Osnaya, N.; Monroy, S.; Del Tizapantzi, M.R.; Carson, J.L.; Villarreal-Calderon, A.; et al. Air pollution and brain damage. Toxicol. Pathol. 2002, 30, 373–389. [Google Scholar] [CrossRef] [PubMed]
- Calderon-Garciduenas, L.; Maronpot, R.R.; Torres-Jardon, R.; Henriquez-Roldan, C.; Schoonhoven, R.; Acuna-Ayala, H.; Villarreal-Calderon, A.; Nakamura, J.; Fernando, R.; Reed, W.; et al. DNA damage in nasal and brain tissues of canines exposed to air pollutants is associated with evidence of chronic brain inflammation and neurodegeneration. Toxicol. Pathol. 2003, 31, 524–538. [Google Scholar] [CrossRef] [PubMed]
- Campbell, A.; Oldham, M.; Becaria, A.; Bondy, S.; Meacher, D.; Sioutas, C.; Misra, C.; Mendez, L.; Kleinman, M. Particulate matter in polluted air may increase biomarkers of inflammation in mouse brain. Neurotoxicology 2005, 26, 133–140. [Google Scholar] [CrossRef] [PubMed]
- Gerlofs-Nijland, M.E.; van Berlo, D.; Cassee, F.R.; Schins, R.P.; Wang, K.; Campbell, A. Effect of prolonged exposure to diesel engine exhaust on proinflammatory markers in different regions of the rat brain. Part. Fibre Toxicol. 2010, 7, 12. [Google Scholar] [CrossRef] [PubMed] [Green Version]
- Durga, M.; Devasena, T.; Rajasekar, A. Determination of LC50 and sub-chronic neurotoxicity of diesel exhaust nanoparticles. Environ. Toxicol. Pharmacol. 2015, 40, 615–625. [Google Scholar] [CrossRef] [PubMed]
- Cole, T.B.; Coburn, J.; Dao, K.; Roque, P.; Chang, Y.C.; Kalia, V.; Guilarte, T.R.; Dziedzic, J.; Costa, L.G. Sex and genetic differences in the effects of acute diesel exhaust exposure on inflammation and oxidative stress in mouse brain. Toxicology 2016, 374, 1–9. [Google Scholar] [CrossRef] [PubMed]
- Kim, S.Y.; Kim, J.K.; Park, S.H.; Kim, B.G.; Jang, A.S.; Oh, S.H.; Lee, J.H.; Suh, M.W.; Park, M.K. Effects of inhaled particulate matter on the central nervous system in mice. Neurotoxicology 2018, 67, 169–177. [Google Scholar] [CrossRef] [PubMed]
- Hullmann, M.; Albrecht, C.; van Berlo, D.; Gerlofs-Nijland, M.E.; Wahle, T.; Boots, A.W.; Krutmann, J.; Cassee, F.R.; Bayer, T.A.; Schins, R.P.F. Diesel engine exhaust accelerates plaque formation in a mouse model of Alzheimer’s disease. Part. Fibre Toxicol. 2017, 14, 35. [Google Scholar] [CrossRef] [PubMed]
- Morgan, T.E.; Davis, D.A.; Iwata, N.; Tanner, J.A.; Snyder, D.; Ning, Z.; Kam, W.; Hsu, Y.T.; Winkler, J.W.; Chen, J.C.; et al. Glutamatergic neurons in rodent models respond to nanoscale particulate urban air pollutants in vivo and in vitro. Environ. Health Perspect. 2011, 119, 1003–1009. [Google Scholar] [CrossRef] [PubMed]
- Solaimani, P.; Saffari, A.; Sioutas, C.; Bondy, S.C.; Campbell, A. Exposure to ambient ultrafine particulate matter alters the expression of genes in primary human neurons. Neurotoxicology 2017, 58, 50–57. [Google Scholar] [CrossRef] [PubMed]
- Gillespie, P.; Tajuba, J.; Lippmann, M.; Chen, L.C.; Veronesi, B. Particulate matter neurotoxicity in culture is size-dependent. Neurotoxicology 2013, 36, 112–117. [Google Scholar] [CrossRef] [PubMed] [Green Version]
- Campbell, A.; Daher, N.; Solaimani, P.; Mendoza, K.; Sioutas, C. Human brain derived cells respond in a type-specific manner after exposure to urban particulate matter (PM). Toxicol. In Vitro 2014, 28, 1290–1295. [Google Scholar] [CrossRef] [PubMed]
- Goldman, S.M. Environmental toxins and Parkinson’s disease. Annu. Rev. Pharmacol. Toxicol. 2014, 54, 141–164. [Google Scholar] [CrossRef] [PubMed]
- Niranjan, R. The role of inflammatory and oxidative stress mechanisms in the pathogenesis of Parkinson’s disease: Focus on astrocytes. Mol. Neurobiol. 2014, 49, 28–38. [Google Scholar] [CrossRef] [PubMed]
- Allen, K.V.; Frier, B.M.; Strachan, M.W. The relationship between type 2 diabetes and cognitive dysfunction: Longitudinal studies and their methodological limitations. Eur. J. Pharmacol. 2004, 490, 169–175. [Google Scholar] [CrossRef] [PubMed]
- Barbieri, M.; Boccardi, V.; Paolisso, G. Chapter 35—Cognitive Decline and Diabetes: A Focus on Linking Mechanisms. In Diet and Nutrition in Dementia and Cognitive Decline; Martin, C.R., Preedy, V.R., Eds.; Academic Press: San Diego, CA, USA, 2015; pp. 393–402. [Google Scholar]
- Craft, S. Insulin resistance syndrome and Alzheimer’s disease: Age- and obesity-related effects on memory, amyloid, and inflammation. Neurobiol. Aging 2005, 26 (Suppl. 1), 65–69. [Google Scholar] [CrossRef]
- Accardi, G.; Caruso, C.; Colonna-Romano, G.; Camarda, C.; Monastero, R.; Candore, G. Can Alzheimer disease be a form of type 3 diabetes? Rejuvenat. Res. 2012, 15, 217–221. [Google Scholar] [CrossRef] [PubMed] [Green Version]
- Cheng, G.; Huang, C.; Deng, H.; Wang, H. Diabetes as a risk factor for dementia and mild cognitive impairment: A meta-analysis of longitudinal studies. Intern. Med. J. 2012, 42, 484–491. [Google Scholar] [CrossRef] [PubMed]
- Frisardi, V.; Solfrizzi, V.; Seripa, D.; Capurso, C.; Santamato, A.; Sancarlo, D.; Vendemiale, G.; Pilotto, A.; Panza, F. Metabolic-cognitive syndrome: A cross-talk between metabolic syndrome and Alzheimer’s disease. Ageing Res. Rev. 2010, 9, 399–417. [Google Scholar] [CrossRef] [PubMed]
- Garcia-Lara, J.M.; Aguilar-Navarro, S.; Gutierrez-Robledo, L.M.; Avila-Funes, J.A. The metabolic syndrome, diabetes, and Alzheimer’s disease. Revista de Investigacion Clinica Organo del Hospital de Enfermedades de la Nutricion 2010, 62, 343–349. [Google Scholar] [PubMed]
- Ohara, T.; Doi, Y.; Ninomiya, T.; Hirakawa, Y.; Hata, J.; Iwaki, T.; Kanba, S.; Kiyohara, Y. Glucose tolerance status and risk of dementia in the community: The Hisayama study. Neurology 2011, 77, 1126–1134. [Google Scholar] [CrossRef] [PubMed]
- Adeghate, E.; Donath, T.; Adem, A. Alzheimer disease and diabetes mellitus: Do they have anything in common? Curr. Alzheimer Res. 2013, 10, 609–617. [Google Scholar] [CrossRef] [PubMed]
- Alam, F.; Islam, M.A.; Sasongko, T.H.; Gan, S.H. Type 2 Diabetes Mellitus and Alzheimer’s Disease: Bridging the Pathophysiology and Management. Curr. Pharm. Des. 2016, 22, 4430–4442. [Google Scholar] [CrossRef] [PubMed]
- D’Amelio, M.; Ragonese, P.; Callari, G.; Di Benedetto, N.; Palmeri, B.; Terruso, V.; Salemi, G.; Famoso, G.; Aridon, P.; Savettieri, G. Diabetes preceding Parkinson’s disease onset. A case-control study. Parkinsonism Relat. Disord. 2009, 15, 660–664. [Google Scholar] [CrossRef] [PubMed]
- Hu, G.; Jousilahti, P.; Bidel, S.; Antikainen, R.; Tuomilehto, J. Type 2 diabetes and the risk of Parkinson’s disease. Diabetes Care 2007, 30, 842–847. [Google Scholar] [CrossRef] [PubMed]
- Yue, X.; Li, H.; Yan, H.; Zhang, P.; Chang, L.; Li, T. Risk of Parkinson Disease in Diabetes Mellitus: An Updated Meta-Analysis of Population-Based Cohort Studies. Medicine 2016, 95, e3549. [Google Scholar] [CrossRef] [PubMed]
- van Himbergen, T.M.; Beiser, A.S.; Ai, M.; Seshadri, S.; Otokozawa, S.; Au, R.; Thongtang, N.; Wolf, P.A.; Schaefer, E.J. Biomarkers for insulin resistance and inflammation and the risk for all-cause dementia and alzheimer disease: Results from the Framingham Heart Study. Arch. Neurol. 2012, 69, 594–600. [Google Scholar] [CrossRef] [PubMed]
- Jayaraman, A.; Pike, C.J. Alzheimer’s disease and type 2 diabetes: Multiple mechanisms contribute to interactions. Curr. Diabetes Rep. 2014, 14, 476. [Google Scholar] [CrossRef] [PubMed]
- Cardoso, S.; Correia, S.; Santos, R.X.; Carvalho, C.; Santos, M.S.; Oliveira, C.R.; Perry, G.; Smith, M.A.; Zhu, X.; Moreira, P.I. Insulin is a two-edged knife on the brain. J. Alzheimer’s Dis. 2009, 18, 483–507. [Google Scholar] [CrossRef] [PubMed]
- Kleinridders, A.; Ferris, H.A.; Cai, W.; Kahn, C.R. Insulin action in brain regulates systemic metabolism and brain function. Diabetes 2014, 63, 2232–2243. [Google Scholar] [CrossRef] [PubMed]
- Verdile, G.; Keane, K.N.; Cruzat, V.F.; Medic, S.; Sabale, M.; Rowles, J.; Wijesekara, N.; Martins, R.N.; Fraser, P.E.; Newsholme, P. Inflammation and Oxidative Stress: The Molecular Connectivity between Insulin Resistance, Obesity, and Alzheimer’s Disease. Mediat. Inflamm. 2015, 2015, 105828. [Google Scholar] [CrossRef] [PubMed]
- Diaz, J.; Martinez-Martin, P.; Rodriguez-Blazquez, C.; Vazquez, B.; Forjaz, M.J.; Ortiz, C.; Carmona, R.; Linares, C. Short-term association between road traffic noise and healthcare demand generated by Parkinson’s disease in Madrid, Spain. Gac. Sanit. 2017. [Google Scholar] [CrossRef] [PubMed]
- Cui, B.; Li, K.; Gai, Z.; She, X.; Zhang, N.; Xu, C.; Chen, X.; An, G.; Ma, Q.; Wang, R. Chronic Noise Exposure Acts Cumulatively to Exacerbate Alzheimer’s Disease-Like Amyloid-beta Pathology and Neuroinflammation in the Rat Hippocampus. Sci. Rep. 2015, 5, 12943. [Google Scholar] [CrossRef] [PubMed]
- Bakre, A.T.; Chen, R.; Khutan, R.; Wei, L.; Smith, T.; Qin, G.; Danat, I.M.; Zhou, W.; Schofield, P.; Clifford, A.; et al. Association between fish consumption and risk of dementia: A new study from China and a systematic literature review and meta-analysis. Public Health Nutr. 2018, 21, 1921–1932. [Google Scholar] [CrossRef] [PubMed]
- Balti, E.V.; Echouffo-Tcheugui, J.B.; Yako, Y.Y.; Kengne, A.P. Air pollution and risk of type 2 diabetes mellitus: A systematic review and meta-analysis. Diabetes Res. Clin. Pract. 2014, 106, 161–172. [Google Scholar] [CrossRef] [PubMed]
- Oberdurster, G. Toxicology of ultrafine particles: In vivo studies. Philos. Trans. R. Soc. A 2000, 358, 2719–2740. [Google Scholar] [CrossRef]
- Zhang, R.; Dai, Y.; Zhang, X.; Niu, Y.; Meng, T.; Li, Y.; Duan, H.; Bin, P.; Ye, M.; Jia, X.; et al. Reduced pulmonary function and increased pro-inflammatory cytokines in nanoscale carbon black-exposed workers. Part. Fibre Toxicol. 2014, 11, 73. [Google Scholar] [CrossRef] [PubMed] [Green Version]
- Castranova, V.; Frazer, D.G.; Manley, L.K.; Dey, R.D. Pulmonary alterations associated with inhalation of occupational and environmental irritants. Int. Immunopharmacol. 2002, 2, 163–172. [Google Scholar] [CrossRef]


| No. | Author’s Name & Year | Study Design/Type of Study | Population Participated Location Study Period (Average Duration of Follow-Up) | Measures of Exposure | Measures of Outcome/Disease | Confounding Factors/Adjusted for: | OR/RR/HR/β Coef (95% CI) Associations of Air Pollution with the Disease | Summary of Findings/Conclusions | Potential Bias (Limitations of Study) |
|---|---|---|---|---|---|---|---|---|---|
| 1 | Ailshire and Clarke, 2014 [47] | Cross-sectional from the ‘Changing Lives Study’ | N = 780 55 years or older Men + women White + black U.S. 15 years | PM2.5 measured by air monitoring within 60 km of residence (data from EPA AQS) | Working memory and orientation (Serial 3 s subtraction test SPMSQ questionnaire) | Age, sex, race, education, income, employment status, residential tenure, and marital status | 10 μg/m3 increase in PM2.5 associated with increased incidence rate: OR: 1.53 (1.02, 2.30). | Adverse effect of exposure to PM2.5 on cognitive function among older adults | Neighbourhood based measure of exposure may not fully capture individual exposure. Screening test lacks word recall tasks to assess memory. Lost to follow up from 1986 and only a selective group survived to respond. Unable to determine effects of long-term exposure. Unable to control other confounders such as diet. |
| 2 | Chen & Schwartz, 2008 [43] | Cross sectional (3rd National Health and Nutrition Examination Survey) | N = 1764 20–59 years U.S. 4 years | Annual home PM10 and O3 assigned to participants via geocoding (data obtained from US EPA AIRS) | Three neurobehavioral tests (SRTT, SDST, SDLT) | Age, sex, ethnicity, SES (education and employment status, annual family income, poverty-income ratio, family size), lifestyle (smoking, alcohol consumption, physical activity), urban/rural residence, cardiovascular risk factors (BMI, hypertension, diabetes mellitus, HDL). Indoor air pollutant sources. | Increase in PM10 by 10-μg/m3 associated with: SRTT (β: −0.36, −2.58 to 1.85); SDST (β: 0.00, −0.04 to 0.05); SDLT trials to criterion (β: 0.09, 0.00 to 0.17); SDLT total (β: 0.12, −0.07 to 0.31) | Adverse effects of ambient air pollutants on CNS in adults/statistically significant only O3 with SDST and SDLT, all the other no significant | Cross-sectional study design. The one-time residential information does not allow to characterize life-course cumulative exposure. No personal air pollution exposure monitoring data. Possibility that the observed effect of ozone may represent other photoreactive pollutants. Possibility of other confounders. |
| 3 | Chen et al., 2015 [38] | Prospective study | N = 1403 Women (65–80) U.S. 10 years | Spatiotemporal model (BME)-based estimated PM2.5 concentration | Annual screening using 3MS Examination, CERAD, tomography scans, laboratory tests | Age, race, SES, smoking, alcohol, physical activity, clinical characteristics, hypertension, diabetes, CVD | WM with fine particulate matter exposures linear regression coefficients: −5.52 ± 1.22 | PM2.5 exposure may contribute to WM loss in older women | One-time assessment of brain volume. Not generalized findings because of sample. Only focus on PM2.5. Not include genetic determinants of brain structure. Only late-life exposure because of PM2.5. |
| 4 | Chen et al., 2017 [46] | Nested case-control study (National Health Insurance Research Dataset) | N = 54,524 ≥40 years Taiwan 14 years | Concentrations from 76 monitoring stations across Taiwan (data from EPA of Taiwan) | Neurological examination and imaging | Age, gender, air pollution levels, urbanization levels, comorbid disease (hypertension, diabetes, dementia, stroke, depression, renal disease, sleep disorder, alcohol-related disease, head injury) | PM10 and PD: OR (95% CI) 1.35 (1.12, 1.62) | PM10 significantly affected the incidence of PD, but O3, CO, NO, NOx, NO2 did not | Lack of data on related biomarkers or risk factors. Diagnostic bias because of cases identified by ICD-9-CM codes. Possible attendance bias (subsequent diagnosis). |
| 5 | Chen et al., 2017 [54] | Population based cohort study | N = 2,165,268 20–85 years Ontario, Canada 12 years | Residential proximity to major roadways or high ways based on postal code—PM2.5 from a global atmospheric chemistry transport model and NO2 from national land-use regression model | Dementia and PD diagnoses from validated databases | Age, sex, pre-existing comorbidity (coronary heart disease, stroke, congestive heart failure, diabetes, hypertension, arrhythmia, traumatic brain injury), SES, education, income, unemployment, immigration status, urban residency | Association between major road and dementia HR (95% CI) Less than 50 m: 1.07 (1.06, 1.08) 50–100 m: 1.04 (1.02, 1.05) 101–200 m: 1.02 (1.01, 1.03) 201–300 m: 1.00 (0.99, 1.01) | Living near major roadways was associated with increased dementia incidence (but not PD or multiple sclerosis). NO2 and PM2.5 were positively associated with dementia | Did not examine factors such as noise or additional pollutants, could not identify undiagnosed cases (incomplete diagnosis might lead to underestimation of the true effect), no information on medications that may influence dementia risk, lack of information on individual SES and behavioural variables, no personal exposure assessment (assessment based on postal-code address). |
| 6 | Jung et al., 2014 [26] | Prospective Cohort study | N = 95,690 ≥65 Taiwan 10 years | Hourly PM10 and O3 from monitoring stations—geographic info system—spatial resolution 100.00 m (from EPA Taiwan) | From database: coding was assigned by physician (history, examination, lab, CT, MRI) | Age, sex, income, diabetes, hypertension, myocardial infarction, stroke, PAD, asthma, COPD | HRadj (95% CI) corresponding to 4.34 μg/m3 increase in PM2.5 exposure: Change CO 2.17 (2.03, 2.33), Change NO2 2.23 (2.07, 2.41), Change O3 2.43 (2.30, 2.57), Change SO2 2.34 (2.17, 2.52) | Higher concentrations of O3 were associated with increased risk of newly diagnosed AD and long-term exposure to O3 and PM2.5 are associated with increased risk of AD | Not able to adjust for confounders such as genetic information, BMI, smoking, metals, occupational exposure. Did not evaluate subtypes of AD. Unable to investigate how pollutants influenced AD (no info on compositions and source of PM2.5). |
| 7 | Kioumourtzoglou et al., 2016 [44] | Time series analyses from Medicare open cohort | N = 9,817,806 Men + women More than 65 years U.S. (50 cities) 10 years | Average of all monitors for estimation of annual PM2.5 (data from US EPA AQS) | Admission records for PD, AD, and dementia by using codes from the ICD-9-CM | Sex, age, race, ZIP code of residence, median income, diabetes, COPD, CHF, MI | For PD: HR: 1.08 (1.04, 1.12), for AD: HR:1.15 (1.11, 1.19) and for dementia: HR:1.08 (1.05, 1.11) | Significant positive associations between long-term PM2.5 and PD, AD and dementia/air pollution likely accelerates the progression of neurodegeneration | Outcome misclassification (hospital admissions might be recorded with misclassifications). Mobility issues due to average age. Some subjects could have been hospitalized before turning 65. |
| 8 | Kirrane et al., 2015 [29] | Cohort (Agricultural Health Study) | N = 82,935 North Carolina& Iowa Min 8 years–max 17 years. | Annual averages of pollutant concentrations by using geocoded addresses 12 × 12 km grids/hierarchical Bayesian model | Self-reports of PD | Age, sex, state, race, education, smoking status, pesticide use | O3 and PD in NC: OR (95% CI) 1.39 (0.98, 1.98) PM2.5 and PD in NC: 1.34 (0.93, 1.93) | Positive associations between PD and O3 and PM2.5 concentrations in NC. In IA, associations were generally weak | Possibility of residual confounding by pesticide exposure or confounding by other occupational risk factors for PD that are different in applicators and spouses. |
| 9 | Liu et al., 2016 [51] | Nested case-control analysis based on National Institutes of Health-American Association of Retired Persons Diet and Healthy Study prospective cohort | N = 4869 (case: 1556 and control: 3313) U.S. 12 years | Used residential locations to estimate outdoor pollutant concentrations/daily PM10, PM2.5 and hourly NO2 were obtained from U.S. EPA/regionalized national universal kriging& land use regression model | Medical records and diagnostic questionnaire obtained by physician/neurologist and then reviewed by research team | Age, sex, race, smoking status, caffeine intake, physical activity, education, residential setting | PM2.5 and risk of PD: OR (95% CI) 1.02(0.94, 1.10) PM10 and risk of PD: 1.02 (0.97, 1.09) NO2 and PD: 1.01 (0.93, 1.10) | No statistically significant associations between exposures to ambient PM10, PM2.5, or NO2 and PD risk/although they found a higher risk of PD among both women and never smokers with exposures to high levels of PM2.5 and PM10 | Possible misclassification. No info on concentrations in microenvironments. Pollutant estimates only in adulthood and not earlier. Only collected residential address (pollutants in workplace were not available). PD diagnosis asked only once at the follow-up survey. PD case identification based on self-reports. |
| 10 | Palacios et al., 2014 [50] | Prospective cohort | N = 115,767 Women U.S. 18 years (average follow up 16.6 years) | Spatio-temporal models/estimation of PM10 and PM2.5 (data from EPA’s AQS-IMPROVE) | Medical records and questionnaire from neurologist and then reviewed by movement disorder specialist | Age, region, pack years smoking, smoking status, population density, caffeine consumption, use of ibuprofen, income | PM10 and risk of PD: RR (95% CI) 1.03 (0.78, 1.37) PM2.5 and risk of PD 1.10 (0.83, 1.45) | No statistically significant associations between air pollution and PD risk | Information on air pollution from 1988 onwards (only adulthood exposure). No personal air pollution measurements (indirect measures of air pollution). Misclassification of biologically relevant levels of individual exposure. Potential occupational exposure (only info on residential address). |
| 11 | Palacios et al., 2017 [49] | Prospective cohort | N = 50,352 40–75 years old Male U.S. 30 years | Monthly average PM10 and PM2.5 Questionnaires using spatiotemporal models (data from EPA’s AQS) | Participant reports PD and then contact the neurologist who completes a questionnaire to confirm diagnosis and send medical record which were reviewed by a movement disorder specialist | Age, time period, smoking, region, population density | PM10 and PD: HRadj: 0.85 (0.63, 1.15) PM2.5: 0.97 (0.72, 1.32) PM2.5–10: 0.88 (0.64, 1.22) | No statistically significant association between PM10, PM2.5, PM2.5–10, and PD risk | No personal air pollution measurements, misclassification of biologically relevant levels of individual exposures, not able to account for occupational exposure to air pollution or neurotoxins, study based in U.S. only, estimate exposure only during adulthood, not generalizable results because of the sample used (highly educated male US professionals). |
| 12 | Power et al., 2011 [39] | Cohort 12 years prospective of the Normative Aging Study | N = 680 men only 51–97 years old Boston Massachusetts area 12 years | Black carbon from land use regression model, monitoring sites | Global cognitive functioning MMSE; digit span backwards test, verbal fluency, constructional praxis, immediate recall, delayed recall, pattern comparison task (7 cognitive tests) | Age, education, alcohol intake, physical activity, diabetes, dark fish consumption, computer experience, first language, percentage of participant’s census tract that is non-white, % of participant’s census tract with at least a college degree, cognitive data from first cognitive assessment, part time resident of greater Boston area, smoking, BMI | Doubling of black carbon concentration associated with increased risk of having a low MMSE score (ORadj: 1.3, 1.1–1.6) Doubling of black carbon concentration associated with reduced overall cognitive test score (−0.054, −0.103 to−0.006) | Significant association of higher BC with greater risk of poor cognition and worse general cognitive performance. (No association with PM10)/traffic related air pollution may have adverse effect on cognition in older men | Exposure estimates based on residential address may misclassify personal exposure levels. Inability to attribute findings to a particular traffic-related exposure. |
| 13 | Ranft et al., 2009 [40] | Cohort prospective (SALIA: Study on the Influence of air pollution on Lung function, Inflammation and Aging) | N = 402 68–79 years old Female Germany 20 years | PM10 by monitoring stations 8 km grid and Distance of address to next busy road with 10,000 cars per day monitoring stations by State Environment Agency | Cognitive function CERAD-Plus; Stroop test, sniffing sticks (validated) | Age, education, regular sporting activities, obesity, smoking, ETS, indoor air pollution exposure, depression, diabetes, hypertension, cholesterol, stroke, morbidity | Traffic exposure associated with CERAD test: β = −3.8 (−7.8, 0.1) Stroop: β = −5.1 (−8.2, −2.0) Sniffing: β = −1.3 (−2.4, −0.2) PM exposure associated with CERAD: 0.4 (0.0, 0.9), Stroop: −0.0 (−0.4, 0.4), Sniffing: 0.0 (−0.1, 0.1) | Significant association of shorter distance to road with worse performance on a general assessment of cognition and a test of selective attention. No association with PM10/chronic exposure to traffic-related PM may be involved in the development of MCI | Selection bias (due to increase of AD incidence after 74 years and disability to participate). Results are the consequence of traffic noise. Only subjects of a bigger cohort (SALIA) who were able and willing to attend follow-up 2007–2008. |
| 14 | Schikowski et al., 2015 [41] | Cross-sectional (from the SALIA cohort) | N = 789 Female Germany 27 years | NO2, NOx, PM2.5, and PM10 estimated using land use regression models. Daily traffic load within 100 m of residential address | Global cognition CERAD-plus, MMSE | Smoking status, ETS exposure, educational level, SES, physical activity, chronic respiratory diseases, cardiovascular diseases, body mass index, emotional state | Increased traffic load associated with CERAD: β = (−0.40; −2.16, 1.36) and MMSE (0.04; −0.18, 0.26) Increased NO2 associated with CERAD (−1.10; −2.37, 0.18) and MMSE (0.00; −0.16, 0.16) Increased NOx with CERAD (−1.35; −2.59, −0.10) and MMSE (−0.04; −0.19, 0.12) Increased PM10 with CERAD (0.32; −0.68, 1.33) and MMSE (0.07; −0.06, 0.20) Increased PM2.5 with CERAD (0.31; −1.11, 1.72) and MMSE (0.07; −0.10, 0.25) | Markers of air pollution associated with cognitive impairment/air pollution may affect only specific areas on the brain and result in lower performance in the subtest of the CERAD test battery | Only cross-sectional analysis of air pollution exposure and cognitive function (even if applied back-extrapolation they did not know if pattern remained the same for the entire study period). Only one assessment of cognitive function at a single time point. |
| 15 | Tonne et al., 2014 [37] | Longitudinal cohort study | N = 2867 66 ± 6 years London, UK 5 years | Average PM10, PM2.5; average exposures from vehicle exhaust PM10; PM2.5 measured over 5 years (at 20 × 20 resolution) | Reasoning, short term memory, verbal fluency (Alice Heim 4-I Test, 20-word free recall, semantic and phonemic verbal fluency) | Age, sex, ethnicity, marital status, educational achievement, socioeconomic position, smoking status, alcohol use, frequency of fruit and vegetable consumption, physical activity, systolic and diastolic blood pressure, serum cholesterol levels, prevalence of stroke, coronary heart disease and diabetes, frequency of depressive symptoms, year of screening | Higher PM2.5 of 1.1 μg/m3 was associated with a 0.03 (95% CI 0.002–0.06) 5-year decline in standardized memory score and a 0.04 (−0.07–0.01) decline when restricted to participants remaining in London between study waves | Association between PM and reasoning and decline over time in memory, no conclusive findings for verbal fluency | Exposure misclassification (exposure was based only at residence (not take into account workplace etc) and the role of air conditioning). No data on traffic noise exposure (confounder). Only two cognitive assessments. |
| 16 | Tzivian et al., 2016 [45] | Cross-sectional (based on Heihz Nixdorf Recall study) | N = 2050 45–75 years old German Ruhr Area (3 cities) 5 years | PM was measured in 20 sites, NOx was measured at 40 sites over 1 year—noise exposure assessment (land use regression) | Verbal memory, speed of processing, verbal fluency, abstraction (MCI diagnosed according to Petersen/International working group on MCI criteria) | Age, sex, SES, alcohol consumption, smoking status, ETS, physical activity, BMI, CHD, T2DM, APOEε4, depression | PM10 OR (95% CI): 1.11 (0.99, 1.23) PM2.5: 1.16 (1.05, 1.27) NOx: 1.10 (0.96, 1.26) Traffic noise: Lden: 1.40 (1.03, 1.91) Lnight: 1.80 (1.07, 3.04) | Long-term exposure to both air pollution and road traffic noise was associated with overall MCI-strongest associations for PM2.5 | Cross-sectional design. Selection bias (cognitively impaired people less likely to participate). Underreporting (questionnaires). Possible exposure misclassification and residual confounding between air pollution and noise. |
| 17 | Weuve et al., 2012 [42] | Prospective (Nurses’ Health Study Cognitive Cohort) | N = 19 409 Age 70–81 years Female U.S. 7–13 years | Quintiles of PM2.5 and PM2.5–10 in preceding month, year, 2 years, 5 years, and since 1988 (monitor data obtained from USEPA AQS) | Cognitive functioning TICS, East Boston Memory Test (immediate and delayed paragraph recall) | Age, education, husband’s education, physical activity, smoking status, alcohol consumption, history of diabetes, coronary diseases, high blood pressure, emphysema | PM2.5 highest vs. lowest quintile of long-term exposure associated with greater 2-year decline in global cognition (−0.018; 95% CI: −0.034, −0.002) PM2.5–10 highest vs. lowest quintile of long-term exposure associated with greater 2-year decline in global cognition (−0.024; 95% CI: −0.040, −0.008) | Higher levels of exposures to ambient PM are associated with worse cognitive decline | Indirect estimates of PM results due to confounding. |
| 18 | Wu et al., 2015 [48] | Case-control study | N = 871 ≥60 years old Taiwan 3 years | Estimation of spatiotemporal distribution of PM10 (and ozone) concentration (data from EPA Taiwan) | Mini mental state examination (Diagnostic and Statistical Manual of Mental Disorders) | For AD: age, gender, APOE ε4 status, PM10 level, ozone level, education years, BMI | Association of PM10 and risk of dementia: OR (95% CI) 4.17 (2.31, 7.54) p < 0.0001 | Elevated long-term PM10 level was significantly associated with an increased risk of AD and VaD in the elderly | Explored only two air pollutants. Assumption that participants tended to live in the same places after retirement. Survival bias (people who did not survive for 12 to 14 years). |
| No. | Author’s Name and Year | Exposure/Pollutants | Outcomes | ||||||||
|---|---|---|---|---|---|---|---|---|---|---|---|
| PM10 | PM2.5 | NOx/NO2 | BC and Others (such as O3, CO, SO2) | Cognitive Decline | MCI | A.D. | P.D. | Dementia | Neurodegeneration | ||
| 1 | Ailshire and Clarke, 2014 [47] | × | × | ||||||||
| 2 | Chen & Schwartz, 2008 [43] | × | × | × | |||||||
| 3 | Chen et al., 2015 [38] | × | × (WM loss) | ||||||||
| 4 | Chen et al., 2017 [46] | × | × | × | × | ||||||
| 5 | Chen et al., 2017 [54] | × | × | × | × | ||||||
| 6 | Jung et al., 2014 [26] | × | × | × | |||||||
| 7 | Kioumourtzoglou et al., 2016 [44] | × | × | × | × | ||||||
| 8 | Kirrane et al., 2015 [29] | × | × | × | |||||||
| 9 | Liu et al., 2016 [51] | × | × | × | |||||||
| 10 | Palacios et al., 2014 [50] | × | × | × | |||||||
| 11 | Palacios et al., 2017 [49] | × | × | × | |||||||
| 12 | Power et al., 2011 [39] | x | × | ||||||||
| 13 | Ranft et al., 2009 [40] | × | × | × | |||||||
| 14 | Schikowski et al., 2015 [41] | × | × | × | × | ||||||
| 15 | Tonne et al., 2014 [37] | × | × | × | |||||||
| 16 | Tzivian et al., 2016 [45] | × | × | × | × | × | |||||
| 17 | Weuve et al., 2012 [42] | × | × | × | |||||||
| 18 | Wu et al., 2015 [48] | × | × | ||||||||
| No. | Author’s Name & Year | Study Design/Type of Study | Location/Population Participated Study Period (Average Duration of Follow-Up) | Measures of Exposure | Measures of Outcome/Disease | Confounding Factors/Adjusted for: | OR/RR/HR/β Coef (95%CI) Associations of Air Pollution with the Disease | Summary of Findings/Conclusions | Potential Bias (Limitations of Study) |
|---|---|---|---|---|---|---|---|---|---|
| 1 | Brook et al., 2013 [63] | Prospective cohort | N = 2.1 million adults Canada 10 years | Average concentrations of PM2.5 from satellite data with a spatial resolution of 10 × 10 km | Diabetes mortality from Canadian Mortality Database | Sex, age, any aboriginal ancestry, marital status, education level, employment status, occupation classification, income | HR (95% CI) stratified by age & sex: 1.10 (1.03, 1.18) Measured at individual level: 1.30 (1.21, 1.39) Including community size: 1.51 (1.39, 1.64) Other contextual variables: 1.49 (1.37, 1.62) | PM2.5 was significantly associated with diabetes mortality | Cross-coding and misclassification because underlying cause of death may be difficult to establish. Underestimation of true prevalence of diabetes because of use of death certificates. Possibility of confounding by regional differences in coding. Diabetes-related deaths were not capture in this study. Exposure misclassification. |
| 2 | Chen et al., 2013 [66] | Population-based cohort | N = 62,012 ≥equal to 35 years (mean age: 54.9) Ontario, Canada 14 years max (mean follow up: 8 ± 3.2 years) | Satellite-based estimates of surface concentrations of PM2.5 (NASA’’ satellite) at a resolution of approximately 10 × 10 km | Enter Diabetes database if at least one hospital admission with diabetes diagnosis or 2 or more physicians claims for diabetes (2 year period) | Marital status, race/ethnicity, education, household income, BMI, smoking status, alcohol consumption, daily consumption of fruits and vegetables, physical activity, urban/rural residence, hypertension, area-level unemployment, COPD, heart failure, acute myocardial infarction, asthma | For a 10 μg/m3 increase in PM2.5 HRadj (95% CI): 1.11 (1.02, 1.21) | Long-term exposure to PM2.5 was associated with an increased risk of incidence diabetes after controlling for various individual and neighbourhood covariates | Not differentiate between type 1 and 2 diabetes. Could not identify undiagnosed cases of diabetes in cohort. Unable to estimate associations at finer spatial scale. No info on daily activity. Do not consider the mixture of air pollutants. No family history of diabetes or occupational exposure. |
| 3 | Chen et al., 2016 [73] | Prospective population-based cohort (Kailuan cohort) | N = 27,685 (18 to 90 years Mean of 47 years) Tangshan City, China 5 years | PM10 and NO2 obtained from Tangshan Environmental Monitoring Centre | Fasting blood samples were assayed for concentrations of glucose etc. by specialist | Age, sex, BMI, drinking status, smoking status, annual family income, education, BP, history of diabetes and hypertension and stroke, exercise activity, marital status, work type, seasonality | Univariate PM10 p value< 0.001 Multipollutant model (SO2 + NO2 + PM10) PM10 −0.047 (−0.11, 0.01) p value 0.094 | Exposure to PM10 (and NO2 and SO2) was associated with an increased level of FBG/univariate analysis significant results, whereas multipollutant model was not significant | Ozone and PM10 not assessed. Used fixed monitoring data rather than personal air pollution exposure. Sex distribution not balanced. |
| 4 | Chen et al., 2016 [69] | Cohort | N = 1023 (17.9–65.6 years Mean age 34.5) Mexican American women Los Angeles, California, U.S. 7 years | PM2.5 and NO2 data collected spatial interpolation of data from air quality monitors (FRM)/ambient info from U.S. Environmental Protection Agency’s Air Quality System data max interpolation radius of 50 km | DXA and oral and intravenous glucose tolerance test (FSIGT) and completed dietary and physical activity questionnaires | SES, income, poverty rate, unemployment rate, education, physical activity, and dietary intakes | Between PM2.5 and fasting glucose: β(p): 0.08 (<0.001) HOMA-IR: 5.81 (0.016) | Higher annual average PM2.5 exposure was significantly associated with higher fasting glucose, HOMA-IR, and lower insulin resistance | Limitation on generalizability of our results (only overweight Mexican American). Nondifferential misclassification (personal air pollution exposure levels were not monitored). Individual-level info on SES was not available. No info on covariates of interest such as sleep, noise, smoking, and indoor sources of air pollution. |
| 5 | Coogan et al., 2012 [20] | Prospective Cohort (Black Women’s Health Study) | N = 4204 (21–69 years) Women Los Angeles, U.S. 10 years | PM2.5 and NOx-Participants’ residential address with land use regression models and interpolation from monitoring station measurements | A self-report of doctor diagnosed DM (then physicians provided data from their medical records) | Age, height, weight, smoking and alcohol consumption, household income, family size, education, neighbourhood SES, physical exercise | The IRRs for diabetes mellitus were 1.63 (95% CI, 0.78, 3.44) and 1.25 (95% CI, 1.07, 1.46) | Exposure to air pollutants may increase the risk of T2DM | Not feasible to identify undiagnosed cases of diabetes in the cohort. Pollutant exposures were assessed for only 1 year and assigned to all years of follow-up. Only residential address (not work address). |
| 6 | Donovan et al., 2017 [61] | Cross-sectional (CHAMPIONS study) | N = 10,443 (40–75 white European 25–75 other) UK 3 years | 1 × 1 km grids of pollutant concentrations from DEFRA | Oral glucose tolerance test based on WHO 2011 criteria | Age, sex, smoking habit, urban or rural location, area social deprivation score, ethnicity, cholesterol, physical activity, neighbourhood green space | OR for T2DM was 1.10 (0.92, 1.32) after adjustment for lifestyle factors and 0.91 (0.72, 1.16) after further adjustment for neighbourhood green space | PM and NO2 were associated with T2DM in unadjusted models, no associations after certain adjustments | Causal relationships cannot be inferred because of study design. Exposure to air pollution based on residential location (may not reflect actual exposure). Associations not adjusted for confounders such as noise. Possibility of over-adjustment, bias due to missing data. |
| 7 | Eze et al., 2014 [17] | Cross-sectional of the cohort (SAPALDIA) | N = 6392 29–73 years Switzerland 11 years | PM10 and NO2 Validated dispersion models of 200 × 200 m resolution/Annual trends at fixed monitoring sites and participant residential histories were used to estimate residential levels | Health examinations (computer-assisted interviews, lung function, allergy testing), blood samples taken | Age, sex, BMI, education, neighbourhood SES, physical activity, smoking, alcohol, occupational exposure, raw vegetables consumption, co-morbidities (COPD), road traffic noise exposure | Fully adjusted OR for prevalent diabetes was 1.40 (95% CI: 1.17, 1.67) Unadjusted: 1.46 (1.20, 1.77) | Long-term exposure to PM10 and NO2 were positively associated with prevalent diabetes mellitus | The inclusion of all cases of self-reported, physician diagnosed diabetes irrespective of the time of diagnosis. Potential bias due to differential non-participation. |
| 8 | Eze et al., 2015 [60] | Cross-sectional (SAPALDIA) | N = 3769 29–73 years Switzerland 10 years | Estimates of PM10 and NO2 dispersion models (200 × 200 m)/land use regression | Physical examination | Sex, age, smoking status, physical activity, SES, occupational status of household head, alcohol intake, educational level, consumption of raw vegetables, fruits, occupational exposures to vapours/dust/fumes | Association between PM10 and MetS: OR (95% CI): 1.64 (1.35, 1.98) 1.58 (1.29, 1.95) 1.72 (1.46, 2.02) (3 different models) | Strongest association with MetS and PM10 (than NO2)/ positive associations between markers of long-term AP exposure and MetS | Cross-sectional design. No estimates of indoor or occupational air pollution for our participants. Physical activity not objectively measured. |
| 9 | Hansen et al., 2016 [67] | Cohort (Danish Nurse Cohort) | N = 28,731 44–95 years Female Denmark 20 years (mean follow up 15.3 years) | PM2.5, PM10, NO2 and NOx concentrations air pollution dispersion modelling system | Hospital diagnosis-5 blood glucose measurements within a year—second purchase of insulin or oral anti-diabetic drugs | Age, BMI, neighbourhood SES, physical activity, smoking, alcohol, consumption of fruit and vegetables, employment status, marital status, MI, hypertension | HR for PM2.5 and diabetes 1.14 (1.04, 1.24) 1.11 (1.02, 1.22) 1.11 (1.01, 1.22) (3 different models) | - Long-term exposure to PM2.5 was associated with increased risk for diabetes - Weak positive insignificant associations between diabetes incidence and PM10, NO2, NOx | Exposure misclassification. Lack of info on indoor exposures-air pollution at work-commuting habits-personal activity patterns. Lack of noise exposure data. Not distinguish type 1 from type 2 diabetes. |
| 10 | Kim et al., 2012 [71] | Longitudinal study (Korean Elderly Environmental Panel) | N = 560 ≥60 years Seoul, Korea 3 years | PM10 and NO2 were obtained from ROK (concentrations nearest to the residence of each subject were used to estimate individual exposures, average distance monitor and residence <1 km) | Medical examinations, fasting blood samples, questionnaire about demographics, lifestyle habits and medical history (measure fasting glucose—hexokinase method and insulin levels—double antibody batch method and HOMA) | Age, BMI, sex, cotinine level, outdoor temperature, dew point | PM10 and HOMA: 0.14 (−0.003, 0.29) | Positive associations of PM10, O3, NO2 with fasting glucose, insulin, and HOMA indices, indicating that these pollutants may affect the development of DM | Results not generalizable to younger people. No measurement of individual exposure. Exposure misclassification. No SES adjustment. |
| 11 | Kramer et al., 2010 [70] | Cohort (SALIA: Study on the Influence of Air Pollution on Lung, Inflammation and Aging) | N = 1775 54–55 years old women Germany 16 years | PM and NO2-Data from monitoring stations (State Environment Agency) in an 8 km grid, and emission inventories to assess motor vehicle exhaust, land use regression models, baseline investigation to next major road | Questionnaire (physician diagnosis of diabetes, antidiabetic treatment) and interview | Age, BMI, SES, education, smoking, workplace exposure, hypertension | Adjusted HR (95% CI) Monitoring stations: PM10 1.16 (0.81, 1.65) NO2 1.34 (1.02, 1.76) Emission inventory: PM 1.15 (1.04, 1.27), NO2 1.15 (1.04, 1.27) Land-use regression model: NO2 1.42 (1.16–1.73) | - Traffic-related air pollution is associated with increased risk to develop T2DM - Stronger associations with NO2 than PM-related exposure assessments | Self-report only. Outcome misclassification—under diagnosis (no glucose measurements). Not complete follow-up and higher education overrepresented. |
| 12 | Liu et al., 2016 [58] | Cross- sectional study (China Health and Retirement Longitudinal Study) | N = 11,847 ≥45 years China 1 year | PM2.5-Satellite-based spatial statistical model 10 × 10 km resolution | Blood test HbA1c: Boronate affinity HPLC method Glucose levels: enzymatic colorimetric method | Age, sex, BMI, educational status, location of residence, smoking status, drinking, indoor air pollution, ambient O3 | PRadj (95% CI) of T2DM associated with PM2.5: 1.14 (1.08, 1.20) Fasting glucose: 0.26 (0.20, 0.32) HbA1c: 0.08 (0.06, 0.10) | Long-term exposure to PM2.5 was positively associated with significant increases in diabetes prevalence, fasting glucose, and HbA1c levels | Not completely exclude exposure measurement errors cause spatial resolution of PM2.5 was still not very high. Did not have long-term PM2.5 measurements before survey for several years. Failed to have info about how long they had T2DM. Unable to control physical activity confounding. Not able to evaluate medication as possible effect modifier. Uncertainty to exposure assessment because of change in address. |
| 13 | Park et al., 2015 [32] | Prospective Cohort (Multi-Ethnic Study of Atherosclerosis) | N = 5135 45–84 years U.S. 12 years max (median 9 years follow-up) | PM2.5 and NOx concentrations hierarchical spatiotemporal model (US Environmental Protection Agency’s Air Quality System) | Fasting serum glucose levels measurements | Age, sex, race, family history of DM, educational level, smoking, alcohol consumption, physical activity, NSES index, BMI, site | PM2.5 and DM: ORadj (95% CI): 1.09 (1.0, 1.1) | Long-term exposures to PM2.5 and nitrogen oxides estimated as the annual averages were significantly associated with prevalent DM at baseline (not incidence) | Exposure measures were based on annual averages from year 2000 and assumed that the exposures were time constant. |
| 14 | Pope et al., 2015 [65] | Cohort | N = 66,046 U.S. 22 years | PM2.5-Land use regression and BME interpolation model | Deaths linked to diabetes death/certificates | BMI, smoking habits, occupational exposures, marital status, education, alcohol | Per 10 μg/m3 increment in PM2.5 and diabetes mellitus: HR (95% CI): 1.13 (1.02, 1.26) | PM2.5 is associated with diabetes mellitus mortality | Not random sample (included friends and family members). Underestimation of the effect. Reduce precision of control for risk factors. Use of cause-of-death info. |
| 15 | Puett et al., 2011 [72] | Two prospective cohorts (Nurses’ Health Study & Health Professionals Follow-up Study) | 74,412 women and 15,048 men U.S. 14 years | PM questionnaires to geocoded address and spatiotemporal models developed/using monitoring data (from US EPA AQS, VIEWS, IMROVE, CASTNet) | Reported diagnosis of DM on questionnaire | Age, season, calendar year, state of residence, time-varying cigarette smoking, hypertension, BMI, alcohol intake, physical activity, diet | HR (95% CI): 1.03 (0.96, 1.10) for PM2.5, 1.04 (0.99, 1.09) for PM10, 1.04 (0.99, 1.09) for PM10–2.5 | No strong evidence for an association between exposure to PM2.5, PM10, or PM 10–2.5 in the 12 months before diagnosis and T2DM incidence | Misclassification because of self-reported diagnosis. Meta-analyses and combined analyses were dominated by the NHS because of number of participants. Need of more acute exposures and exposures during childhood. No generalizability of results (narrow range of SES). |
| 16 | Wang et al., 2014 [74] | Prospective cohort (MOBILIZE Boston Study) | N = 765 ≥65 years mean age: 78.1 Boston, U.S. 1 year | PM2.5-ArcGIS spatial-temporal land-use regression model Euclidean distance from residence to nearest major roadway | Interview/clinic examination (blood samples) | Age, sex, race, season, physical activity, alcohol consumption, smoking, household income, education, neighbourhood SES, BMI, diabetes, hypertension, hyperlipidaemia | Fully adjusted model: 0.12 (0.03, 0.22) leptin levels associated with increase in BC | Evidence that leptin was associated with annual mean residential BC, but not residential distance to major road/long-term exposure to at least some aspects of traffic pollution may adversely impact cardiometabolic health | Measured leptin in non-fasting serum samples (do not know when participants last ate), measure leptin not with conventional ELISA. No info about residential history prior to enrolment. Only one leptin measurement. Exposure misclassification or residual confounding (no info about indoor home or combustion-derived pollution). No generalizable results. |
| 17 | Weinmayr et al., 2015 [24] | Cohort (Heinz Nixdorf Recall Study) | N = 3607 45–75 years old Germany Mean follow-up 5.1 years | PM10 and PM2.5 chemistry transport model (EURAD-CTM) on a spatial resolution of 1 km2 grid cells | Questionnaire, face to face interviews, clinical and lab tests, clinical examination, glucose measurements | Sex, age, BMI, smoking status, physical activity, area-level and individual-level SES, and city | Association of total and traffic-specific pollutants and diabetes incidence: RR (95% CI) Total PM10: 1.05 (1.00, 1.10) Total PM2.5: 1.03 (0.95, 1.12) Traffic PM10: 1.36 (0.98, 1.89) Traffic PM2.5: 1.36 (0.97, 1.89) | Possible effect of total PM on type 2 diabetes risk/clear effect for living near a busy road/long-term exposure to total PM increases type 2 diabetes risk in the general population | The availability of only modelled values. Could not account for the mobility of study participants. Underestimation of real risk if air pollution higher. |
| 18 | Wolf et al., 2017 [59] | Cross-sectional (KORA: Cooperative Health Research in the Region Augsburg) | N = 2944 mean age: 56.2 Germany 3 years | PM10, PM2.5, NO2, and NOx monitoring sites land use regression | HOMA-IR, glucose, insulin, HbA1c, leptin, C-reactive protein from fasting samples/interview, questionnaires | Sex, age, BMI, smoking status, physical activity, waist-to-hip ratio, month of blood withdrawal, SES, per capita income, years of education, occupational status, alcohol intake | 7.9 μg/m3 increment in PM10 was associated with higher HOMA-IR change (95% CI) 0.16 (0.04, 0.29) and insulin 0.15 (0.36, 0.27) | Positive associations between PM10, PM2.5, NO2, and NOx and HOMA-IR and insulin levels/association between traffic-related air pollution and biomarkers related to IR, subclinical inflammation and adipokines in the general population | One-time measurements because of cross-sectional study design. Not possible to infer causation (biomarkers determined up to 3 years before air pollution measurements). Exposure misclassification. |
| Details of a study investigating the relationship between occupational exposure to air pollution and diabetes mellitus | |||||||||
| 19 | De Sio et al., 2005 [62] | Case-control | N = 488 Rome, Italy 2 months (March–April 2001) | PM10 in fixed stations located in districts with different intensities of vehicle traffic | Sample of venous blood/measure the insulin concentration using radio-immunoassay | Early risk factor for diabetes or for reduced glucose tolerance→cumulative effect of urban pollutants | In male traffic police mean plasma insulin levels were significantly lower compared with controls (p = 0.000). In female were also significantly lower (p = 0.002). | Plasma insulin level was altered in traffic police who are exposed to chemical and physical stressors | Not mentioned. |
| No. | Author’s Name and Year | Exposure/Pollutants | |||
|---|---|---|---|---|---|
| PM10 | PM2.5 | NOx/NO2 | BC and Others (such as O3, CO, SO2) | ||
| 1 | Brook et al., 2013 [63] | × | |||
| 2 | Chen et al., 2013 [66] | × | |||
| 3 | Chen et al., 2016 [73] | × | × | × | |
| 4 | Chen et al., 2016 [69] | × | × | × | |
| 5 | Coogan et al., 2012 [20] | × | × | × | |
| 6 | De Sio et al., 2005 [62] | × | × | ||
| 7 | Donovan et al., 2017 [61] | × | × | × | |
| 8 | Eze et al., 2014 [17] | × | × | ||
| 9 | Eze et al., 2015 [60] | × | × | ||
| 10 | Hansen et al., 2016 [67] | × | × | × | |
| 11 | Κim et al., 2012 [71] | × | × | × | |
| 12 | Kramer et al., 2010 [70] | × | × | × | × |
| 13 | Liu et al., 2016 [58] | × | |||
| 14 | Park et al., 2015 [32] | × | × | ||
| 15 | Pope et al., 2015 [65] | × | |||
| 16 | Puett et al., 2011 [72] | × | × | ||
| 17 | Wang et al., 2014 [74] | × | |||
| 18 | Weinmayr et al., 2015 [24] | × | × | × | |
| 19 | Wolf et al., 2017 [59] | × | × | × | |
© 2018 by the authors. Licensee MDPI, Basel, Switzerland. This article is an open access article distributed under the terms and conditions of the Creative Commons Attribution (CC BY) license (http://creativecommons.org/licenses/by/4.0/).
Share and Cite
Dimakakou, E.; Johnston, H.J.; Streftaris, G.; Cherrie, J.W. Exposure to Environmental and Occupational Particulate Air Pollution as a Potential Contributor to Neurodegeneration and Diabetes: A Systematic Review of Epidemiological Research. Int. J. Environ. Res. Public Health 2018, 15, 1704. https://doi.org/10.3390/ijerph15081704
Dimakakou E, Johnston HJ, Streftaris G, Cherrie JW. Exposure to Environmental and Occupational Particulate Air Pollution as a Potential Contributor to Neurodegeneration and Diabetes: A Systematic Review of Epidemiological Research. International Journal of Environmental Research and Public Health. 2018; 15(8):1704. https://doi.org/10.3390/ijerph15081704
Chicago/Turabian StyleDimakakou, Eirini, Helinor J. Johnston, George Streftaris, and John W. Cherrie. 2018. "Exposure to Environmental and Occupational Particulate Air Pollution as a Potential Contributor to Neurodegeneration and Diabetes: A Systematic Review of Epidemiological Research" International Journal of Environmental Research and Public Health 15, no. 8: 1704. https://doi.org/10.3390/ijerph15081704