Spatio-Temporal Dynamic of Malaria Incidence: A Comparison of Two Ecological Zones in Mali

 ,
,  , ,
, ,  ,
,  , , , add
Show full author list
, , , add
Show full author list
Abstract
:1. Introduction
2. Materials and Methods
2.1. Materials
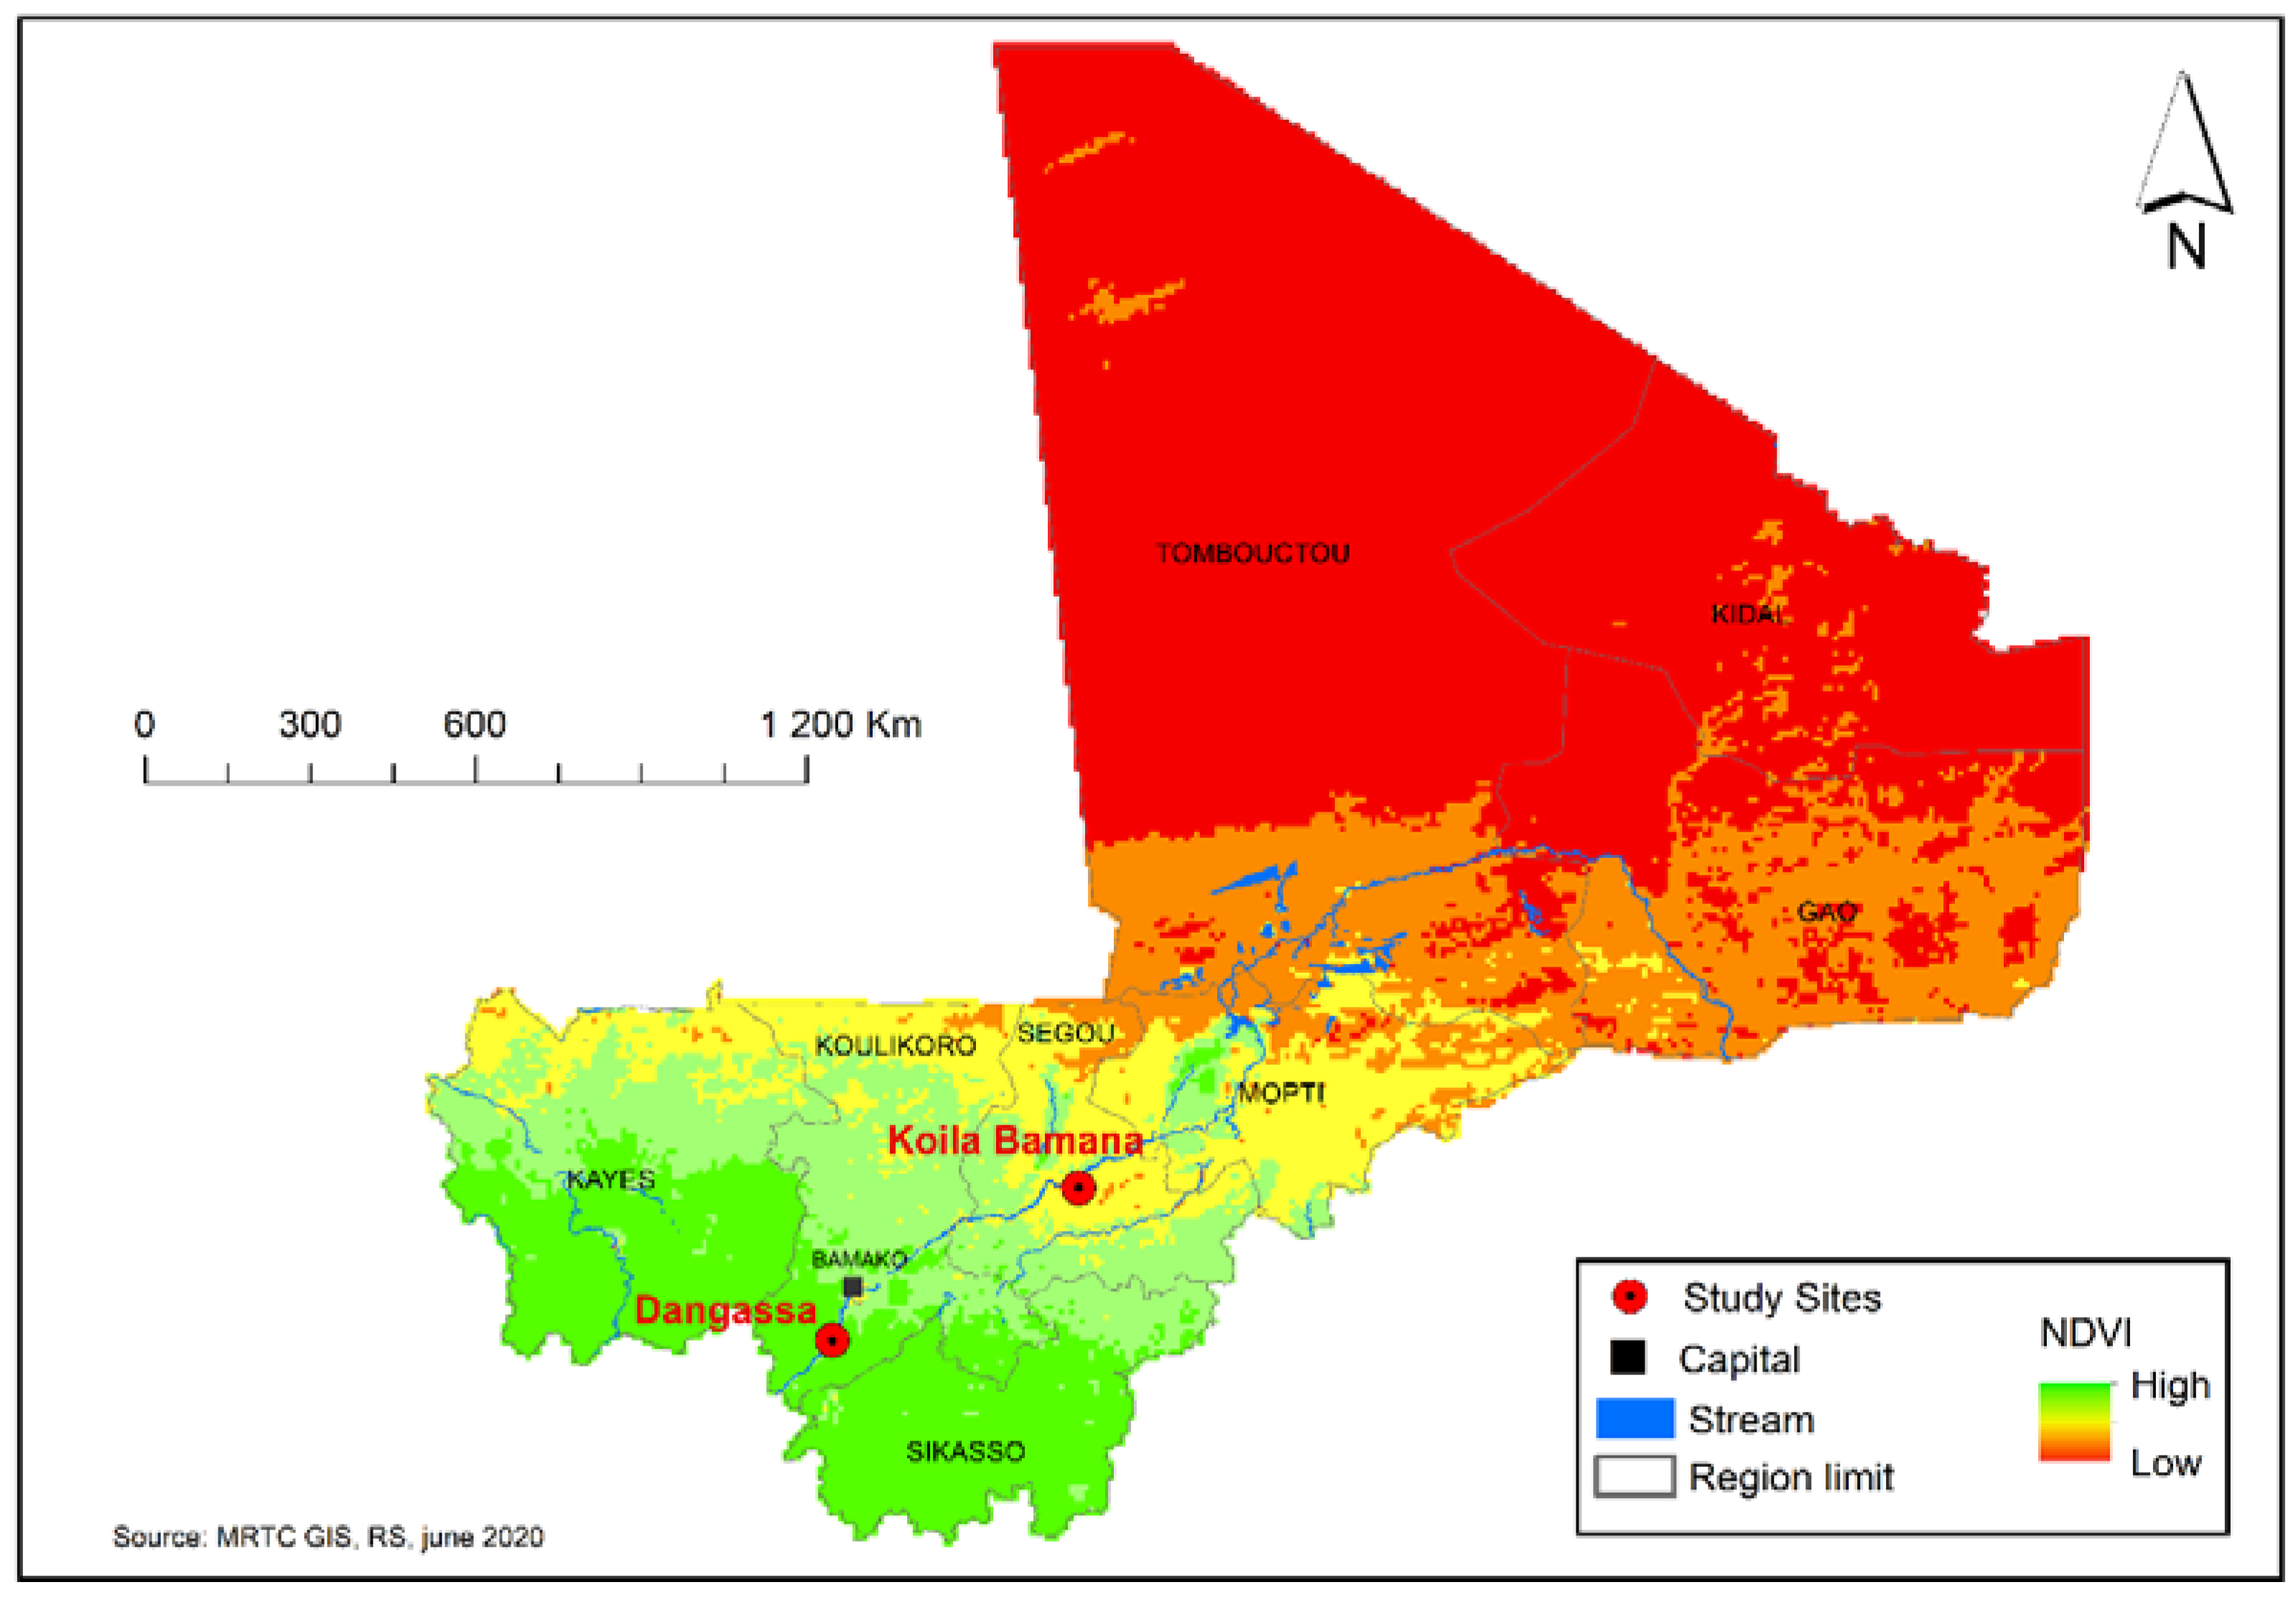
2.1.1. Study Areas
2.1.2. Data Source
Study Population and Data Collection
Hydrological Data
Climate and Environmental Data
2.2. Statistical Methods
3. Results
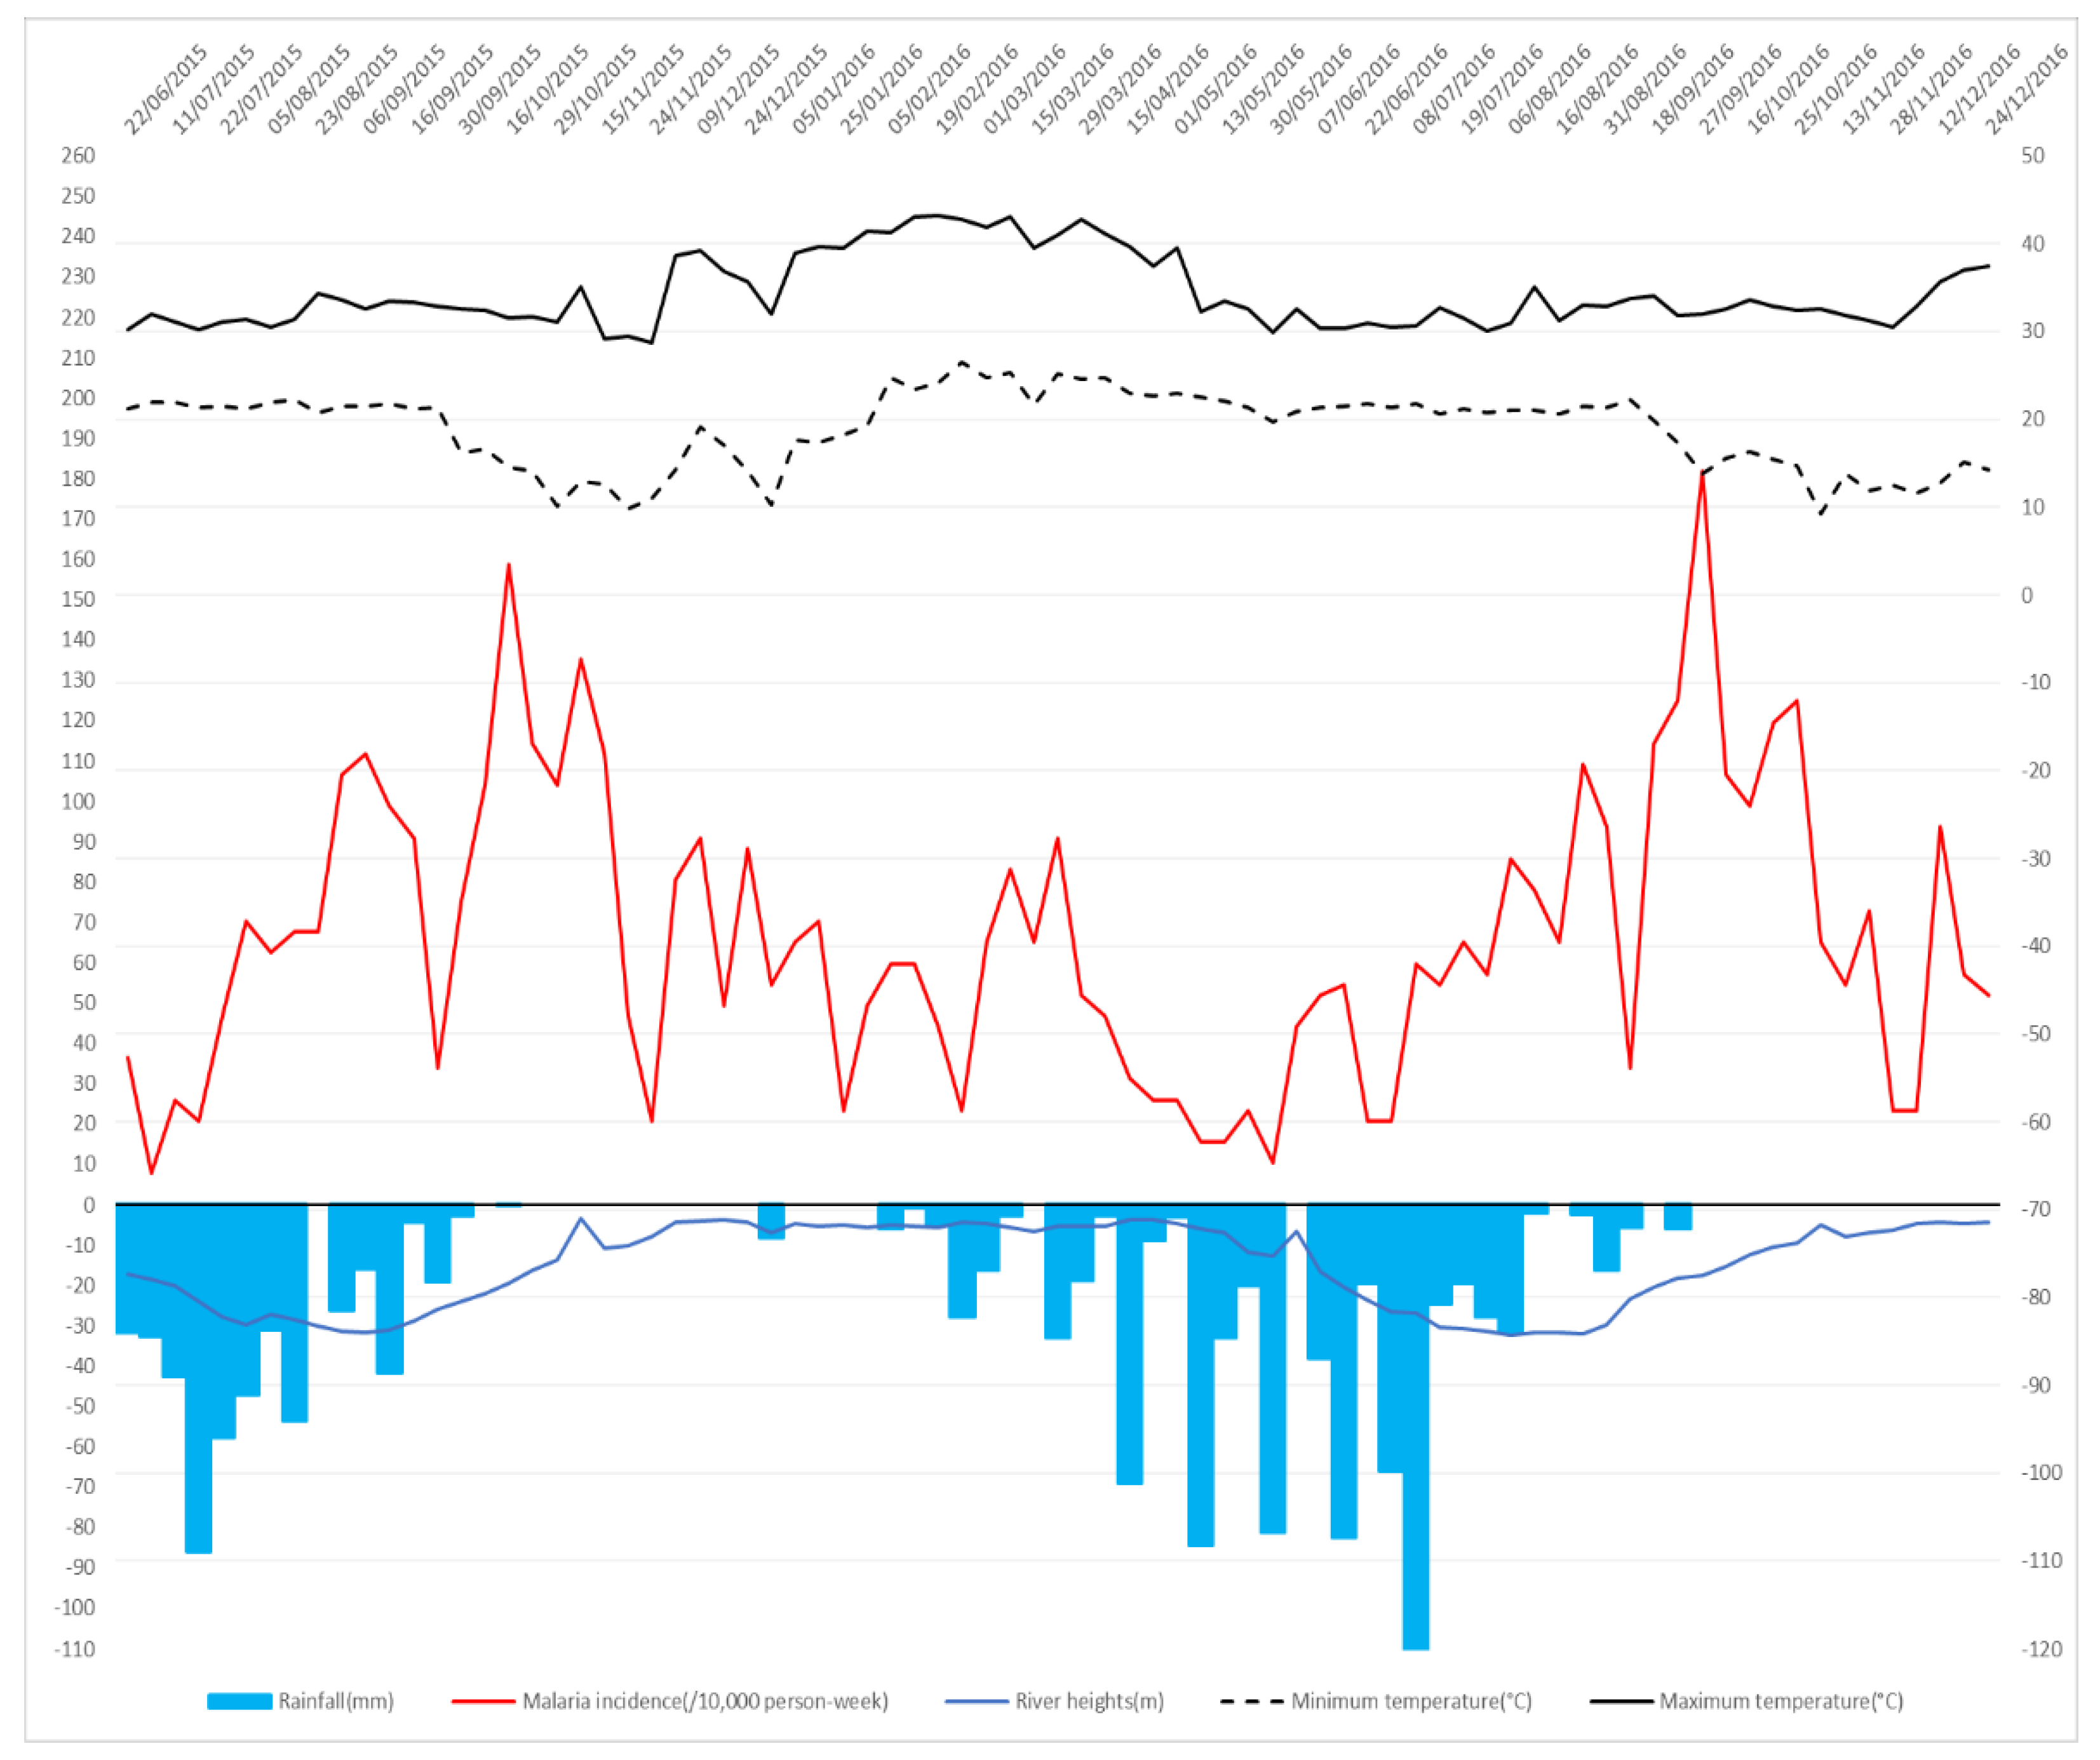
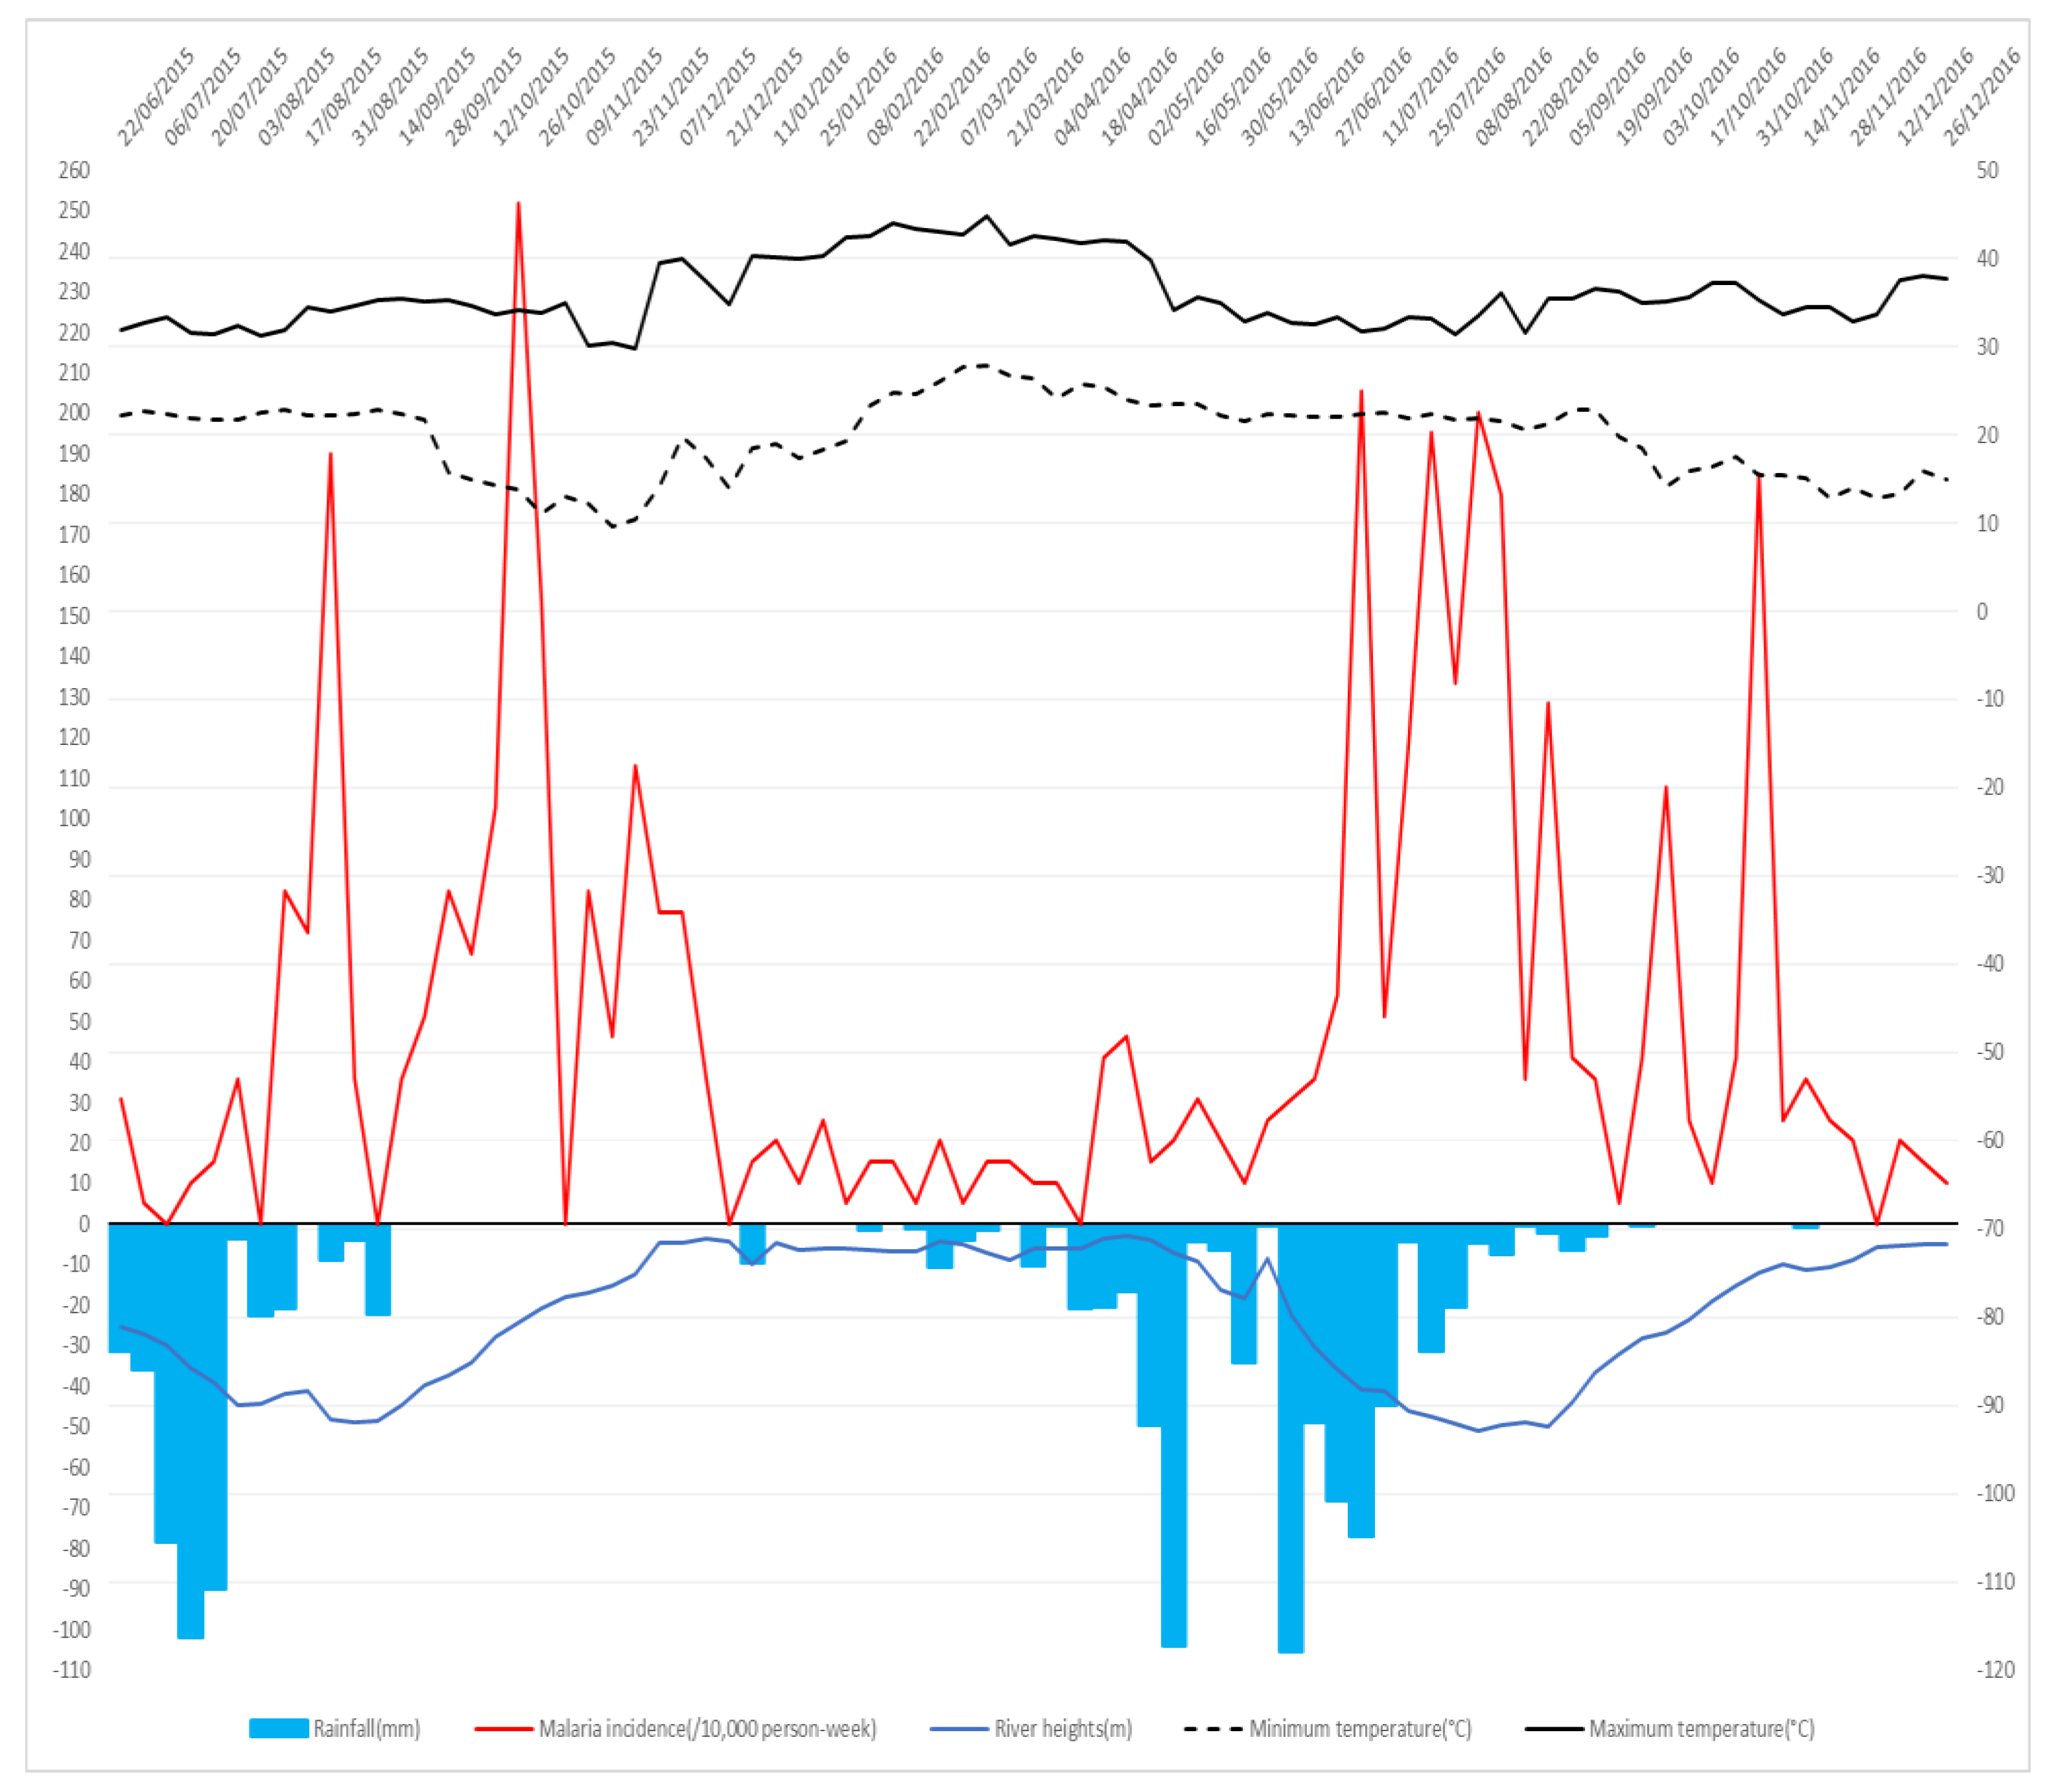
3.1. Time Series Overview
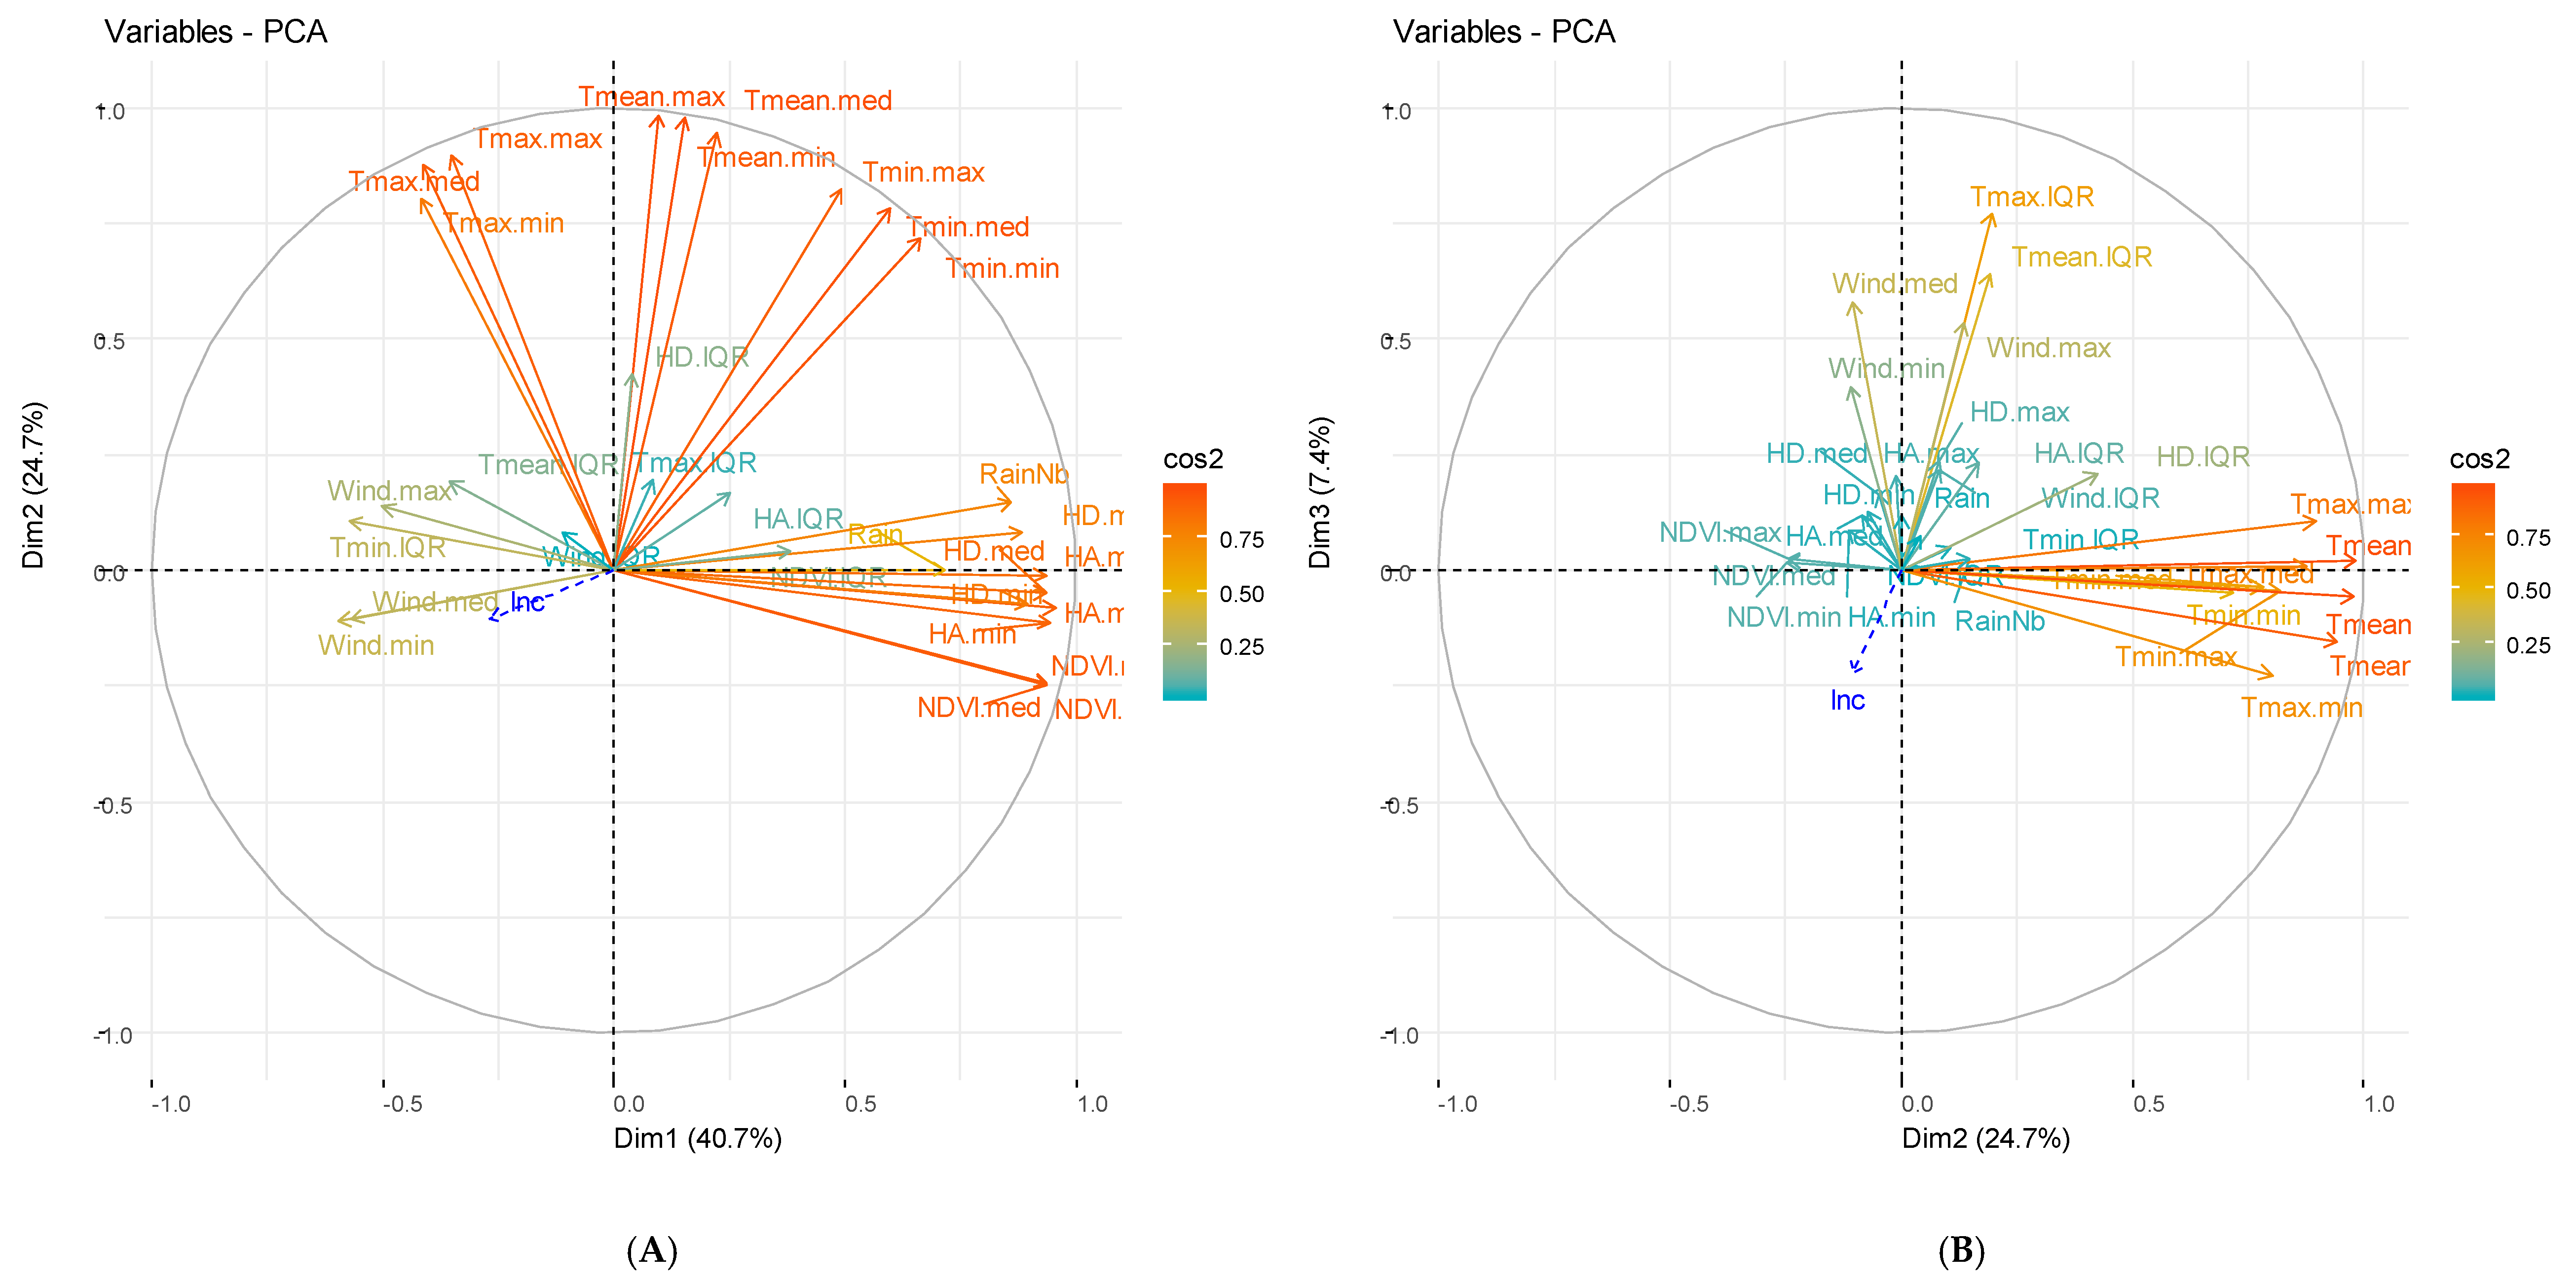
3.2. Principal Component Analysis
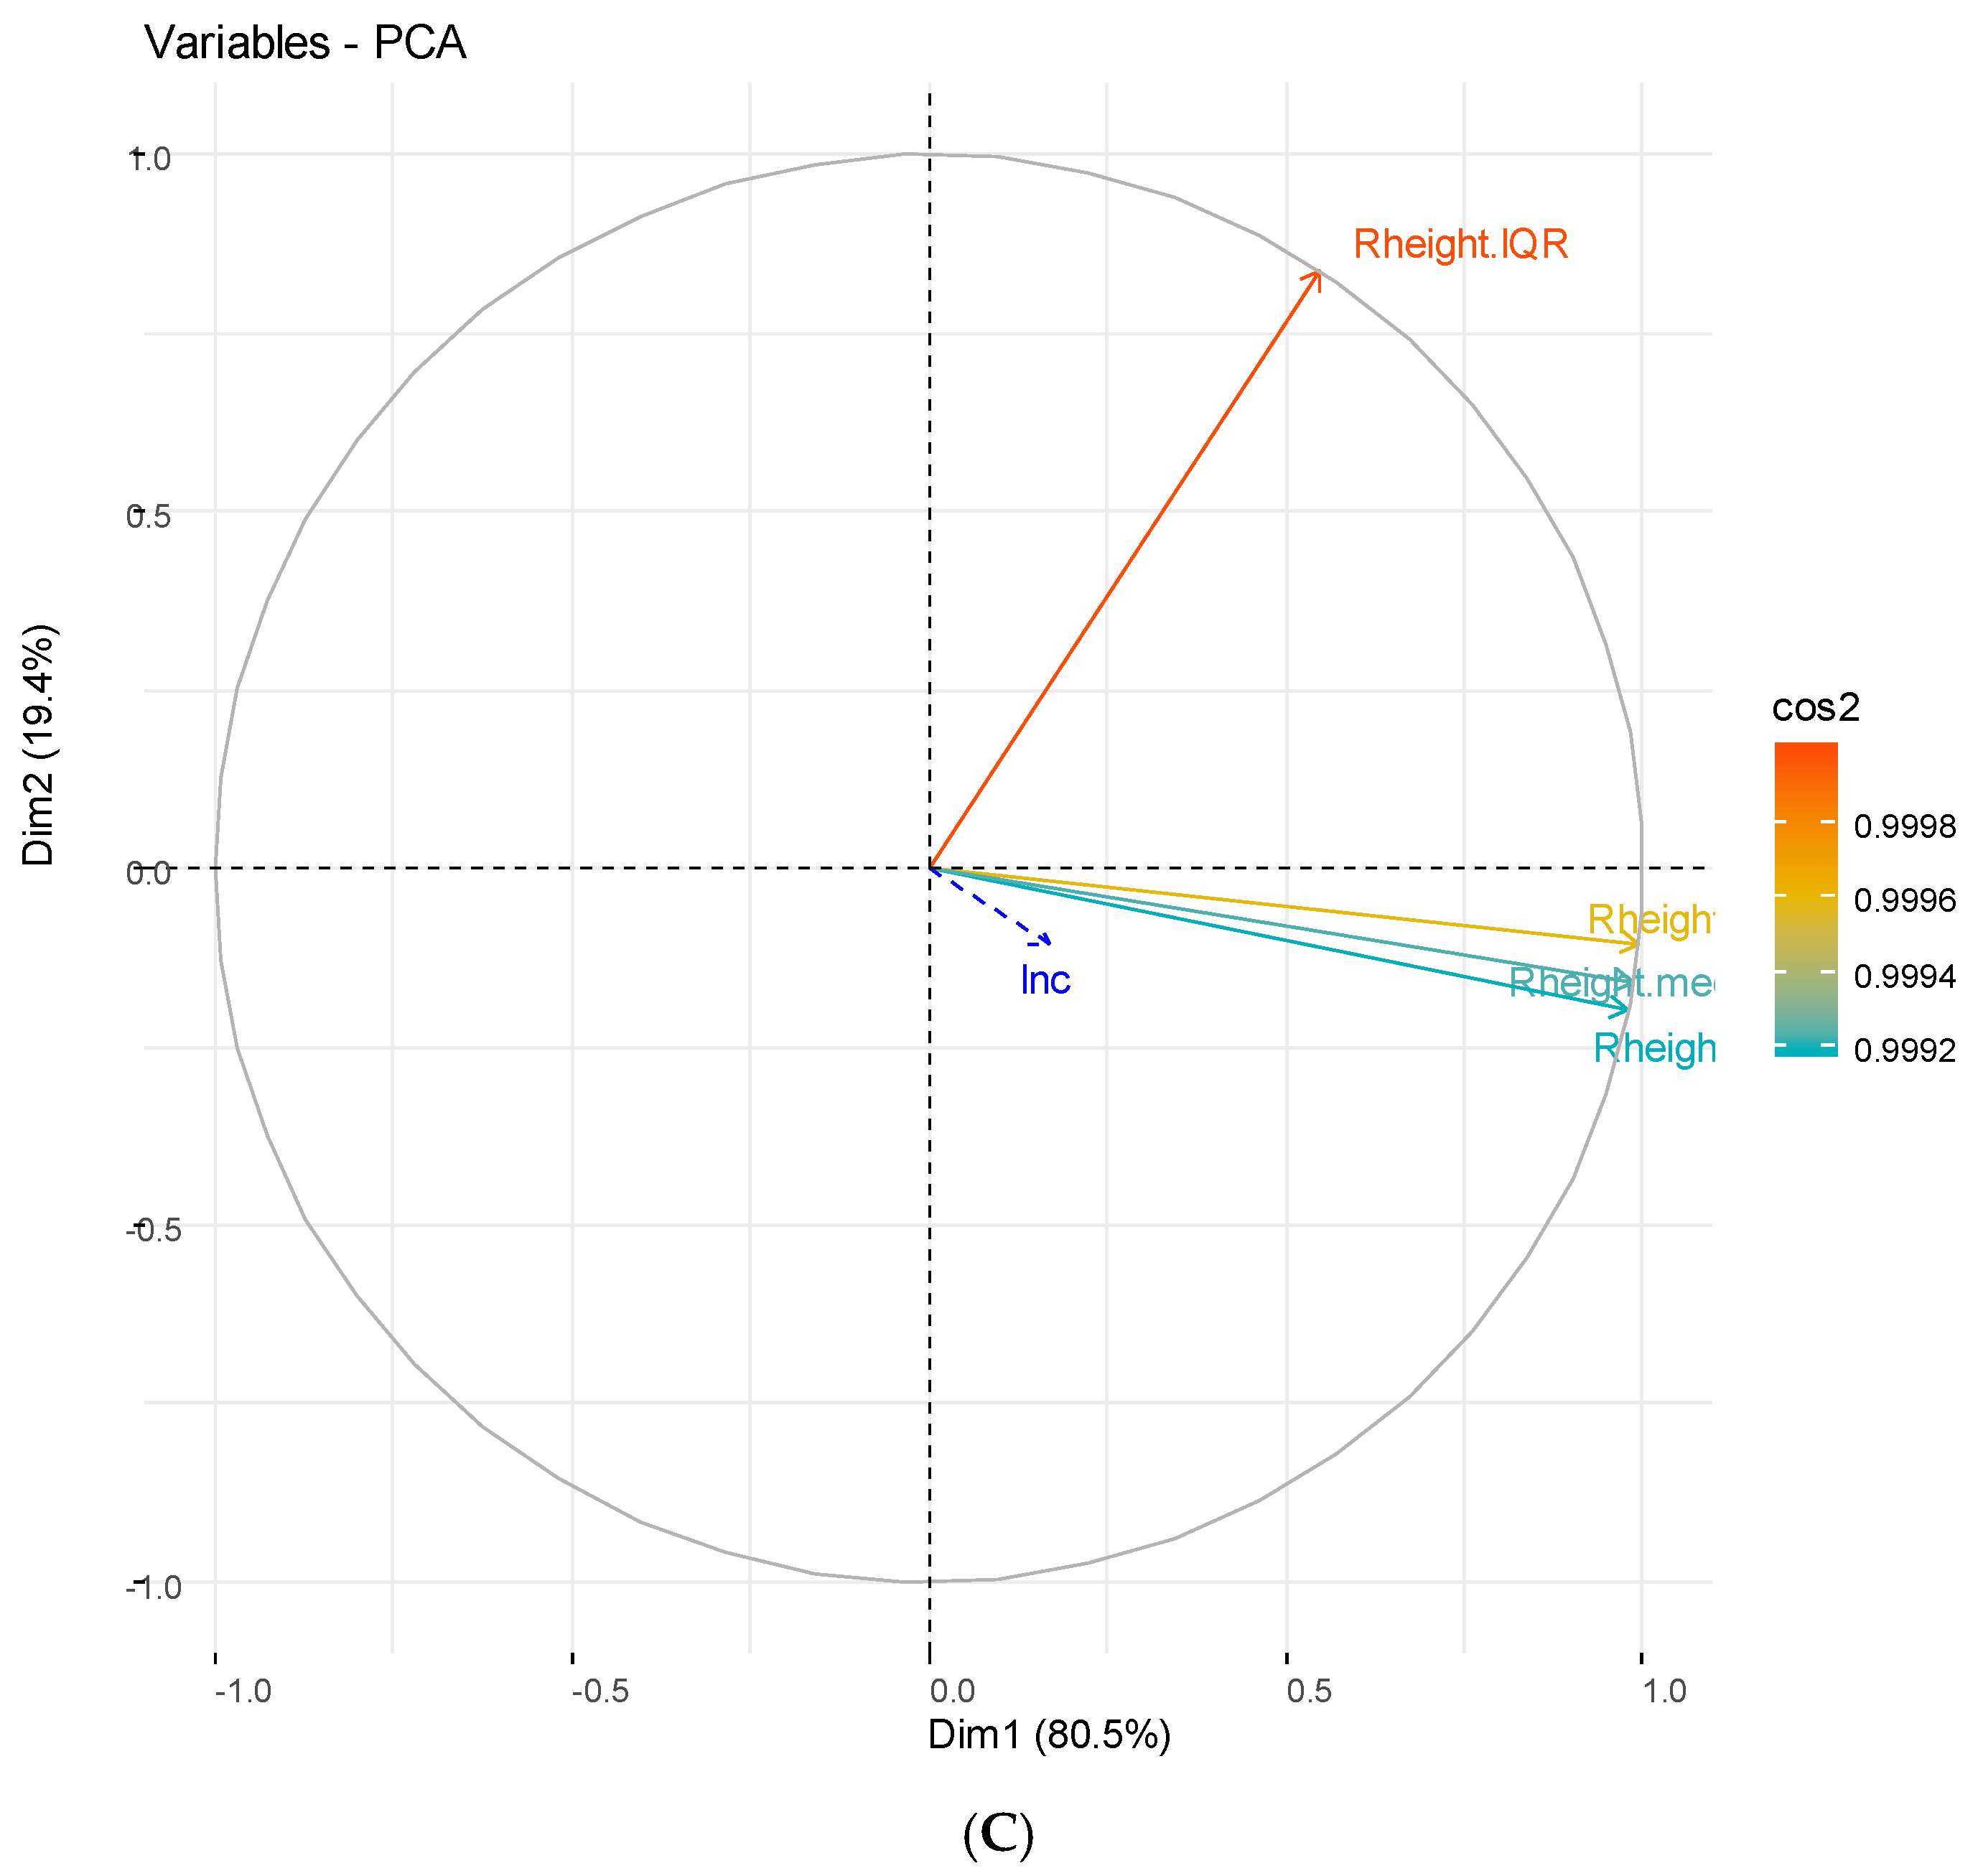
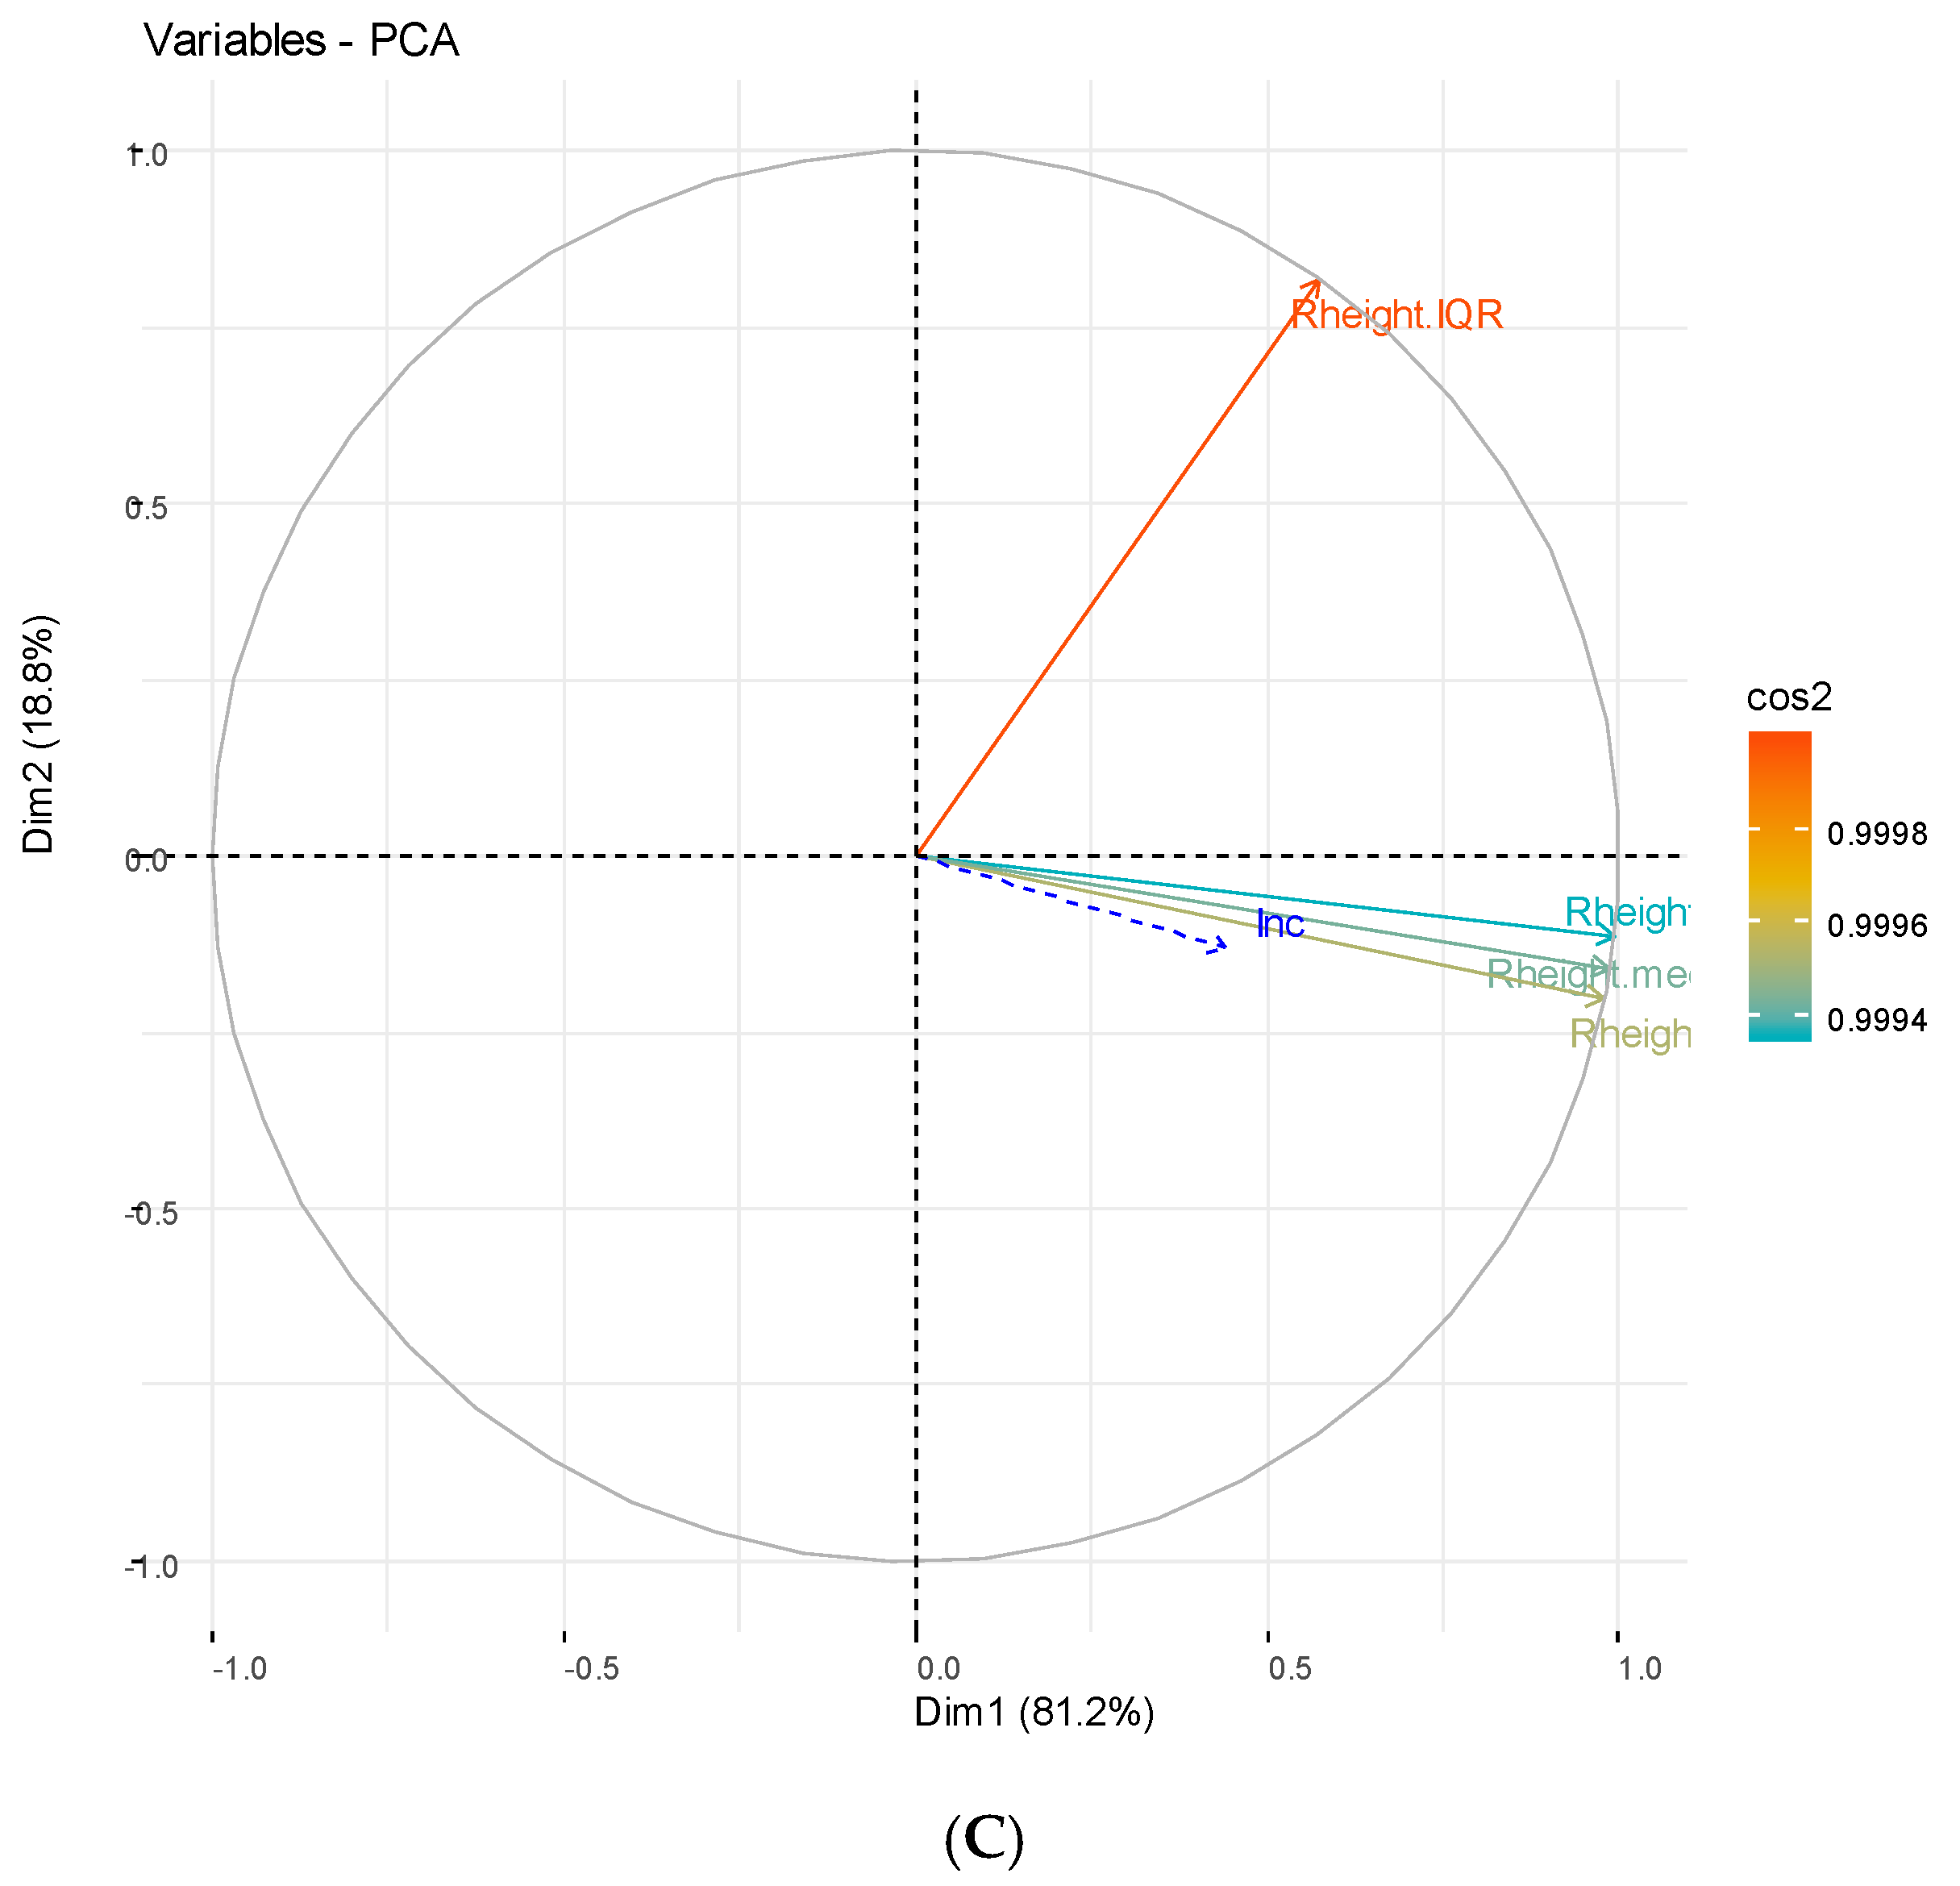
3.2.1. Hydrological Components
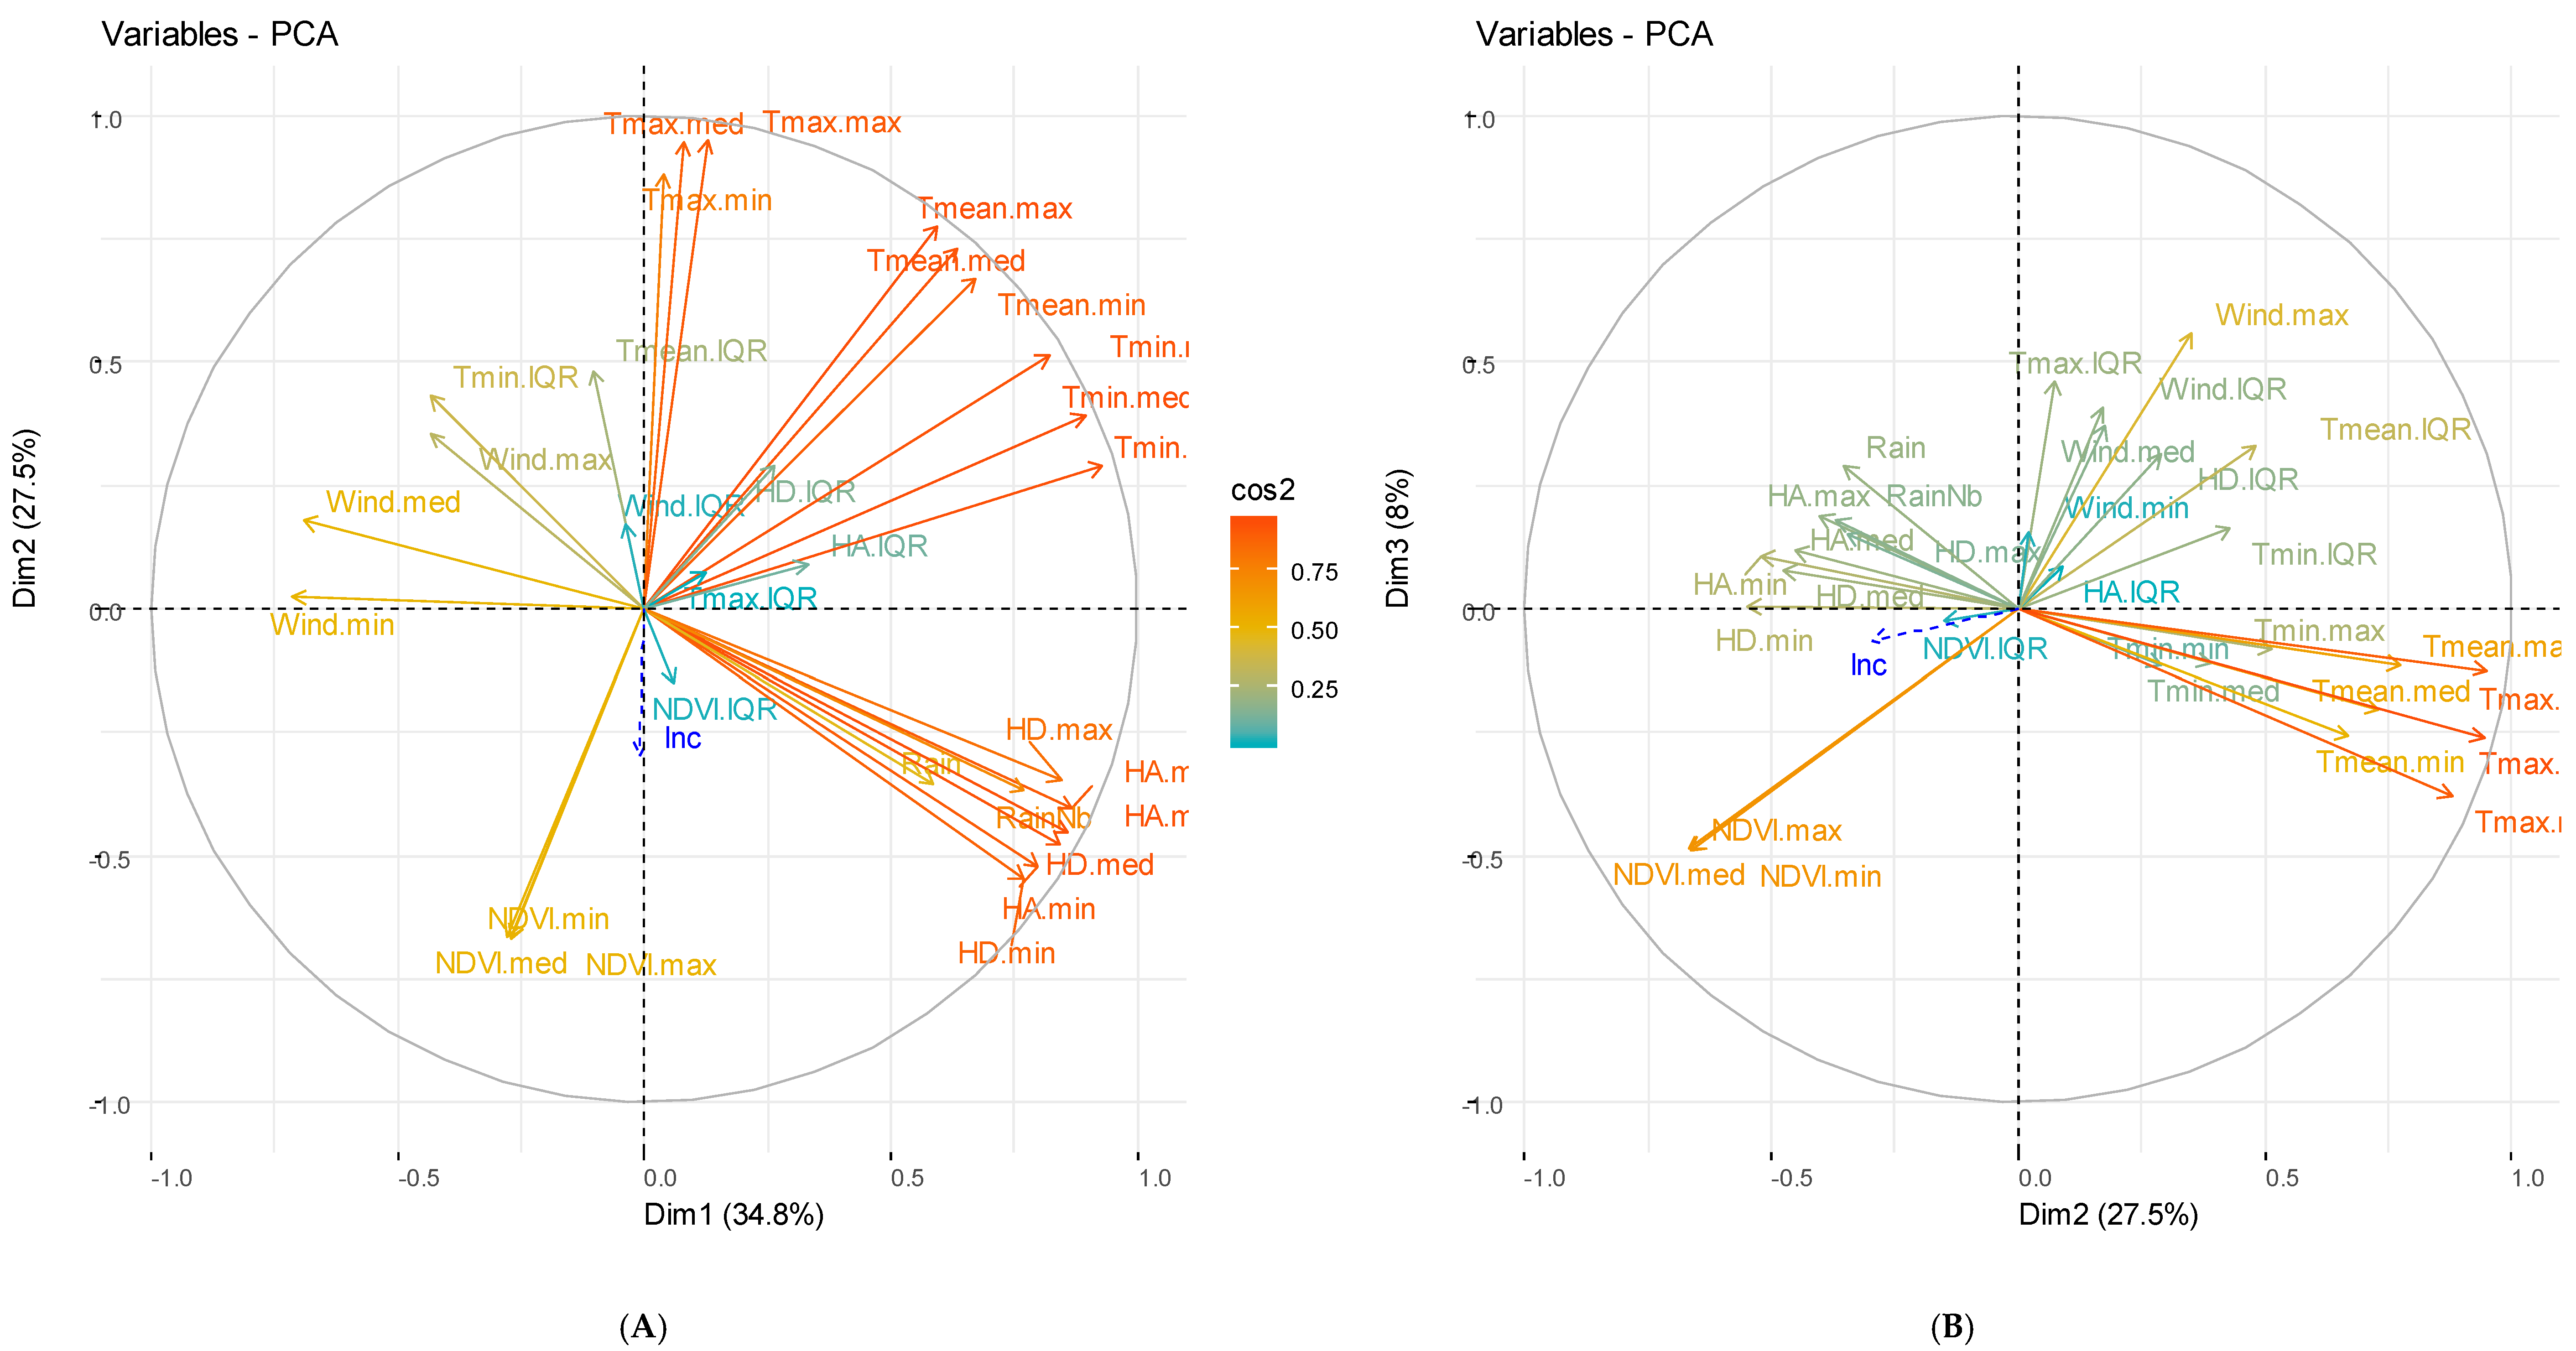
3.2.2. Weather and Vegetation Components
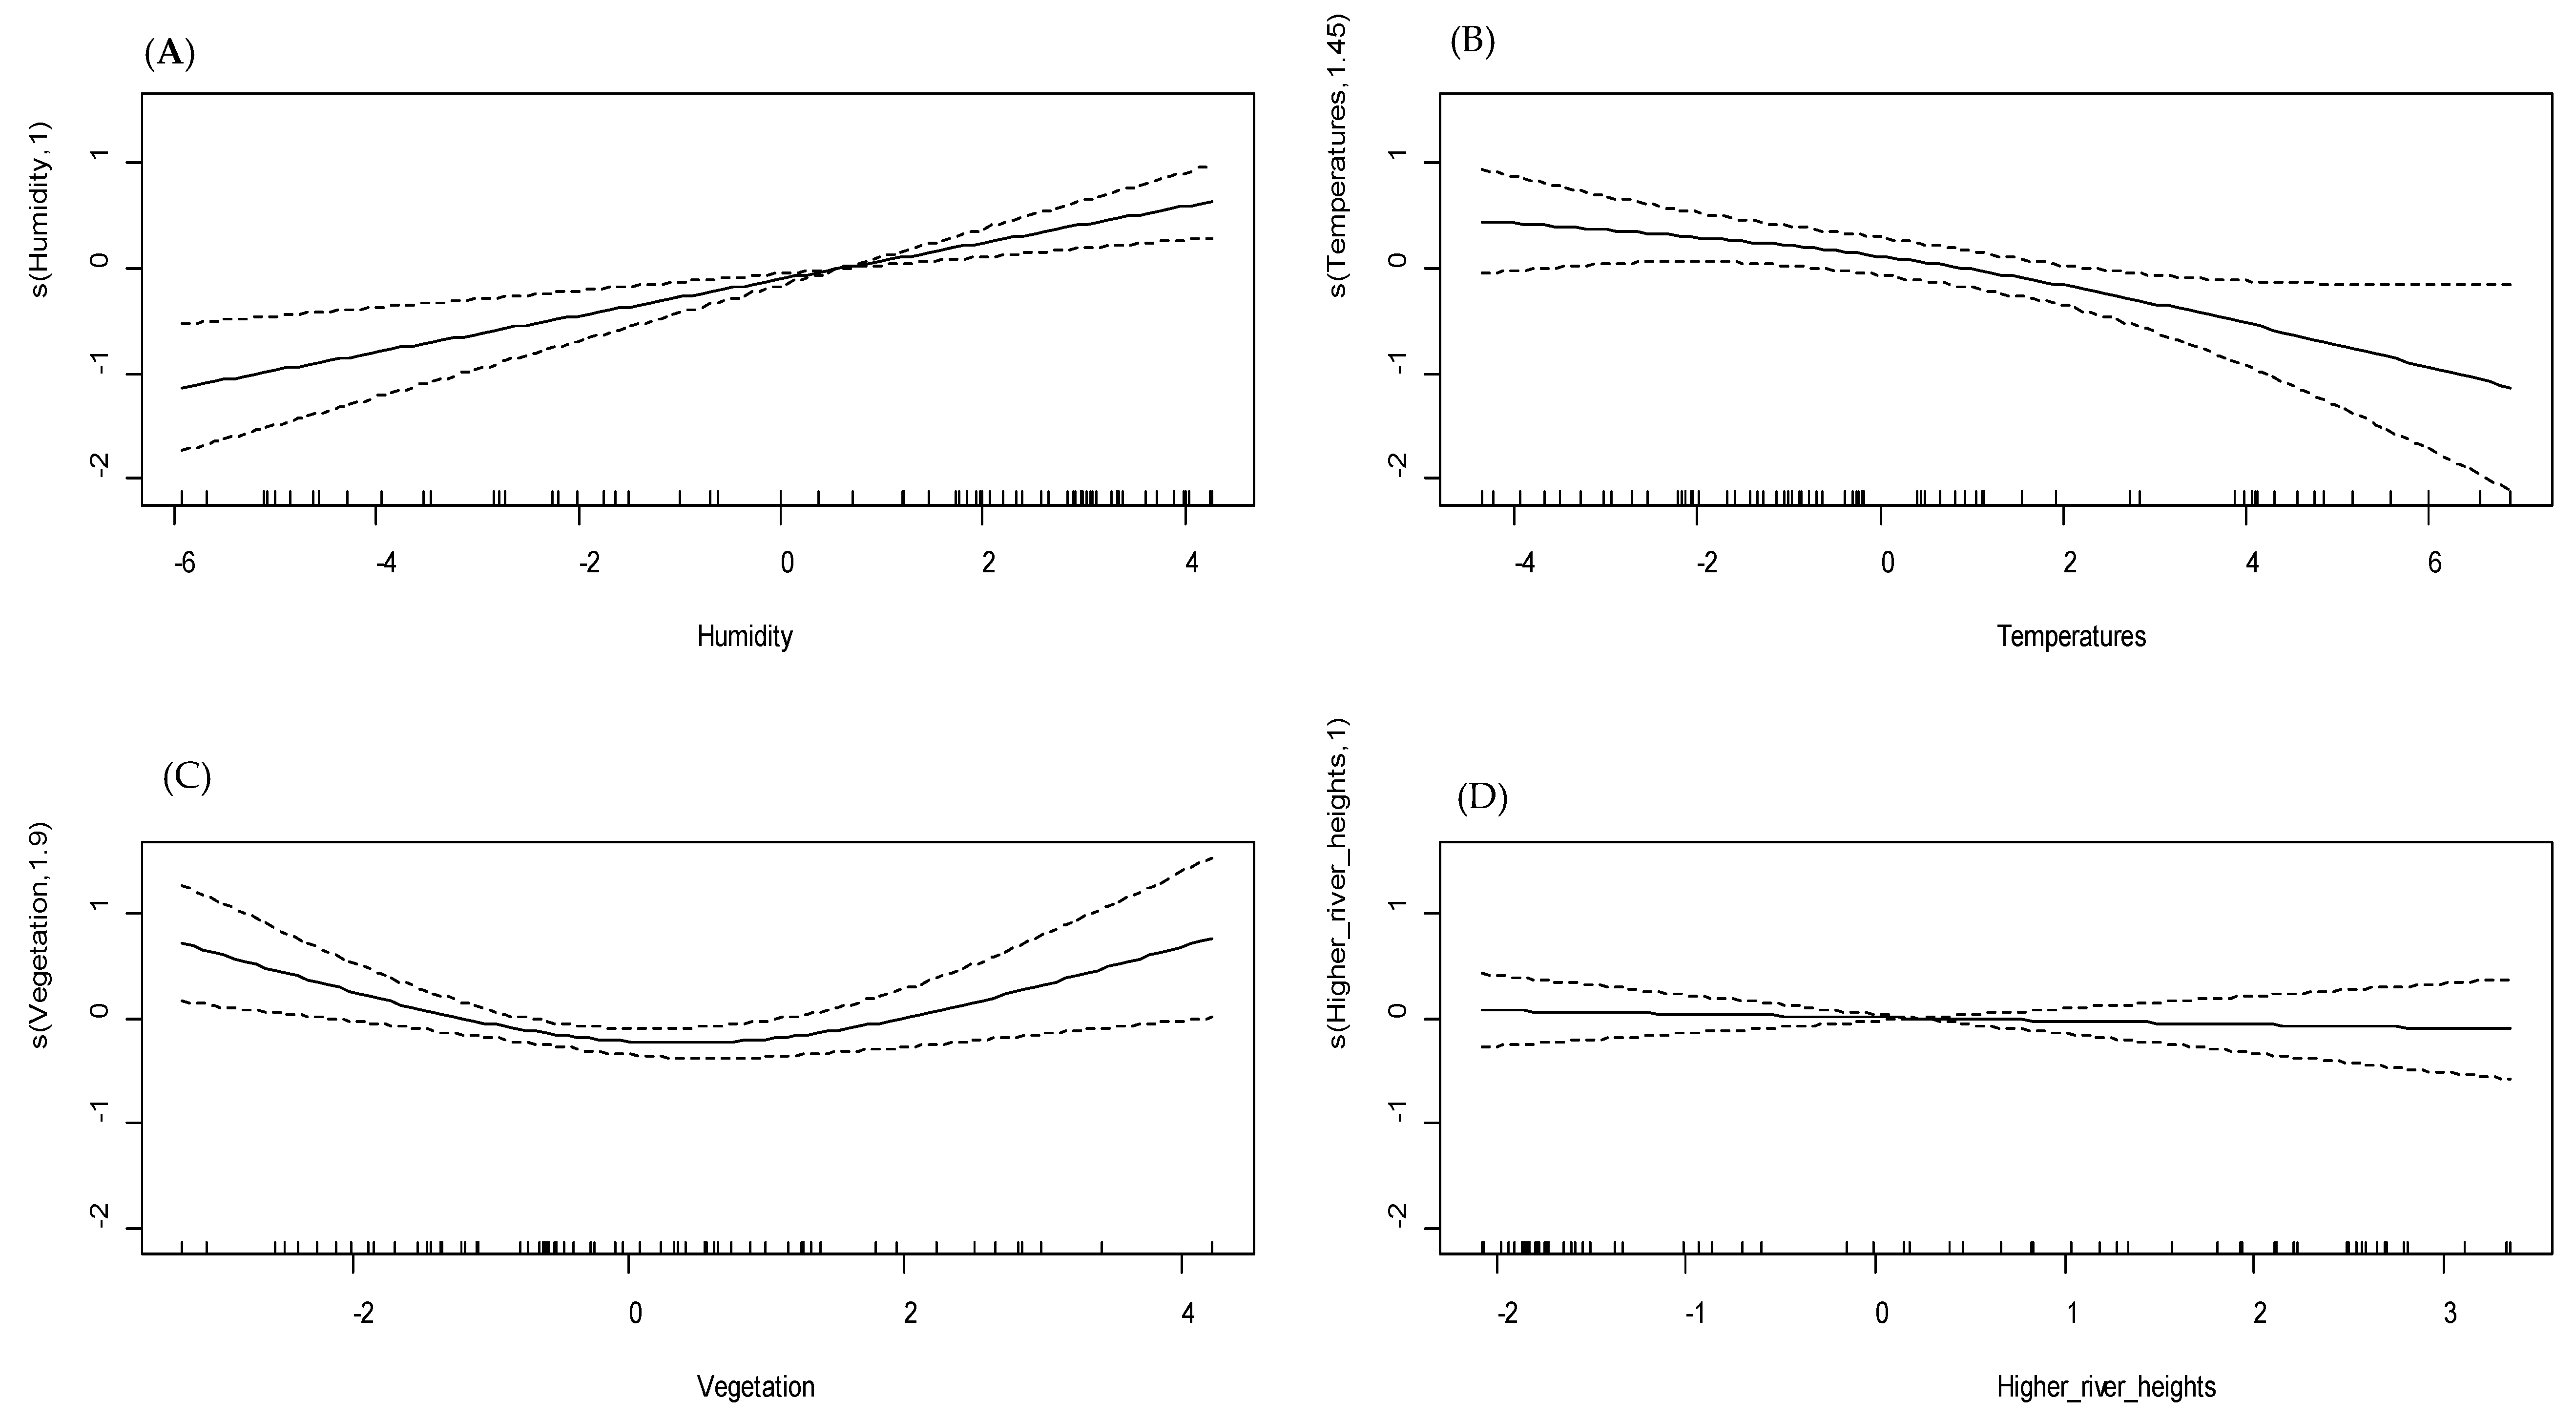
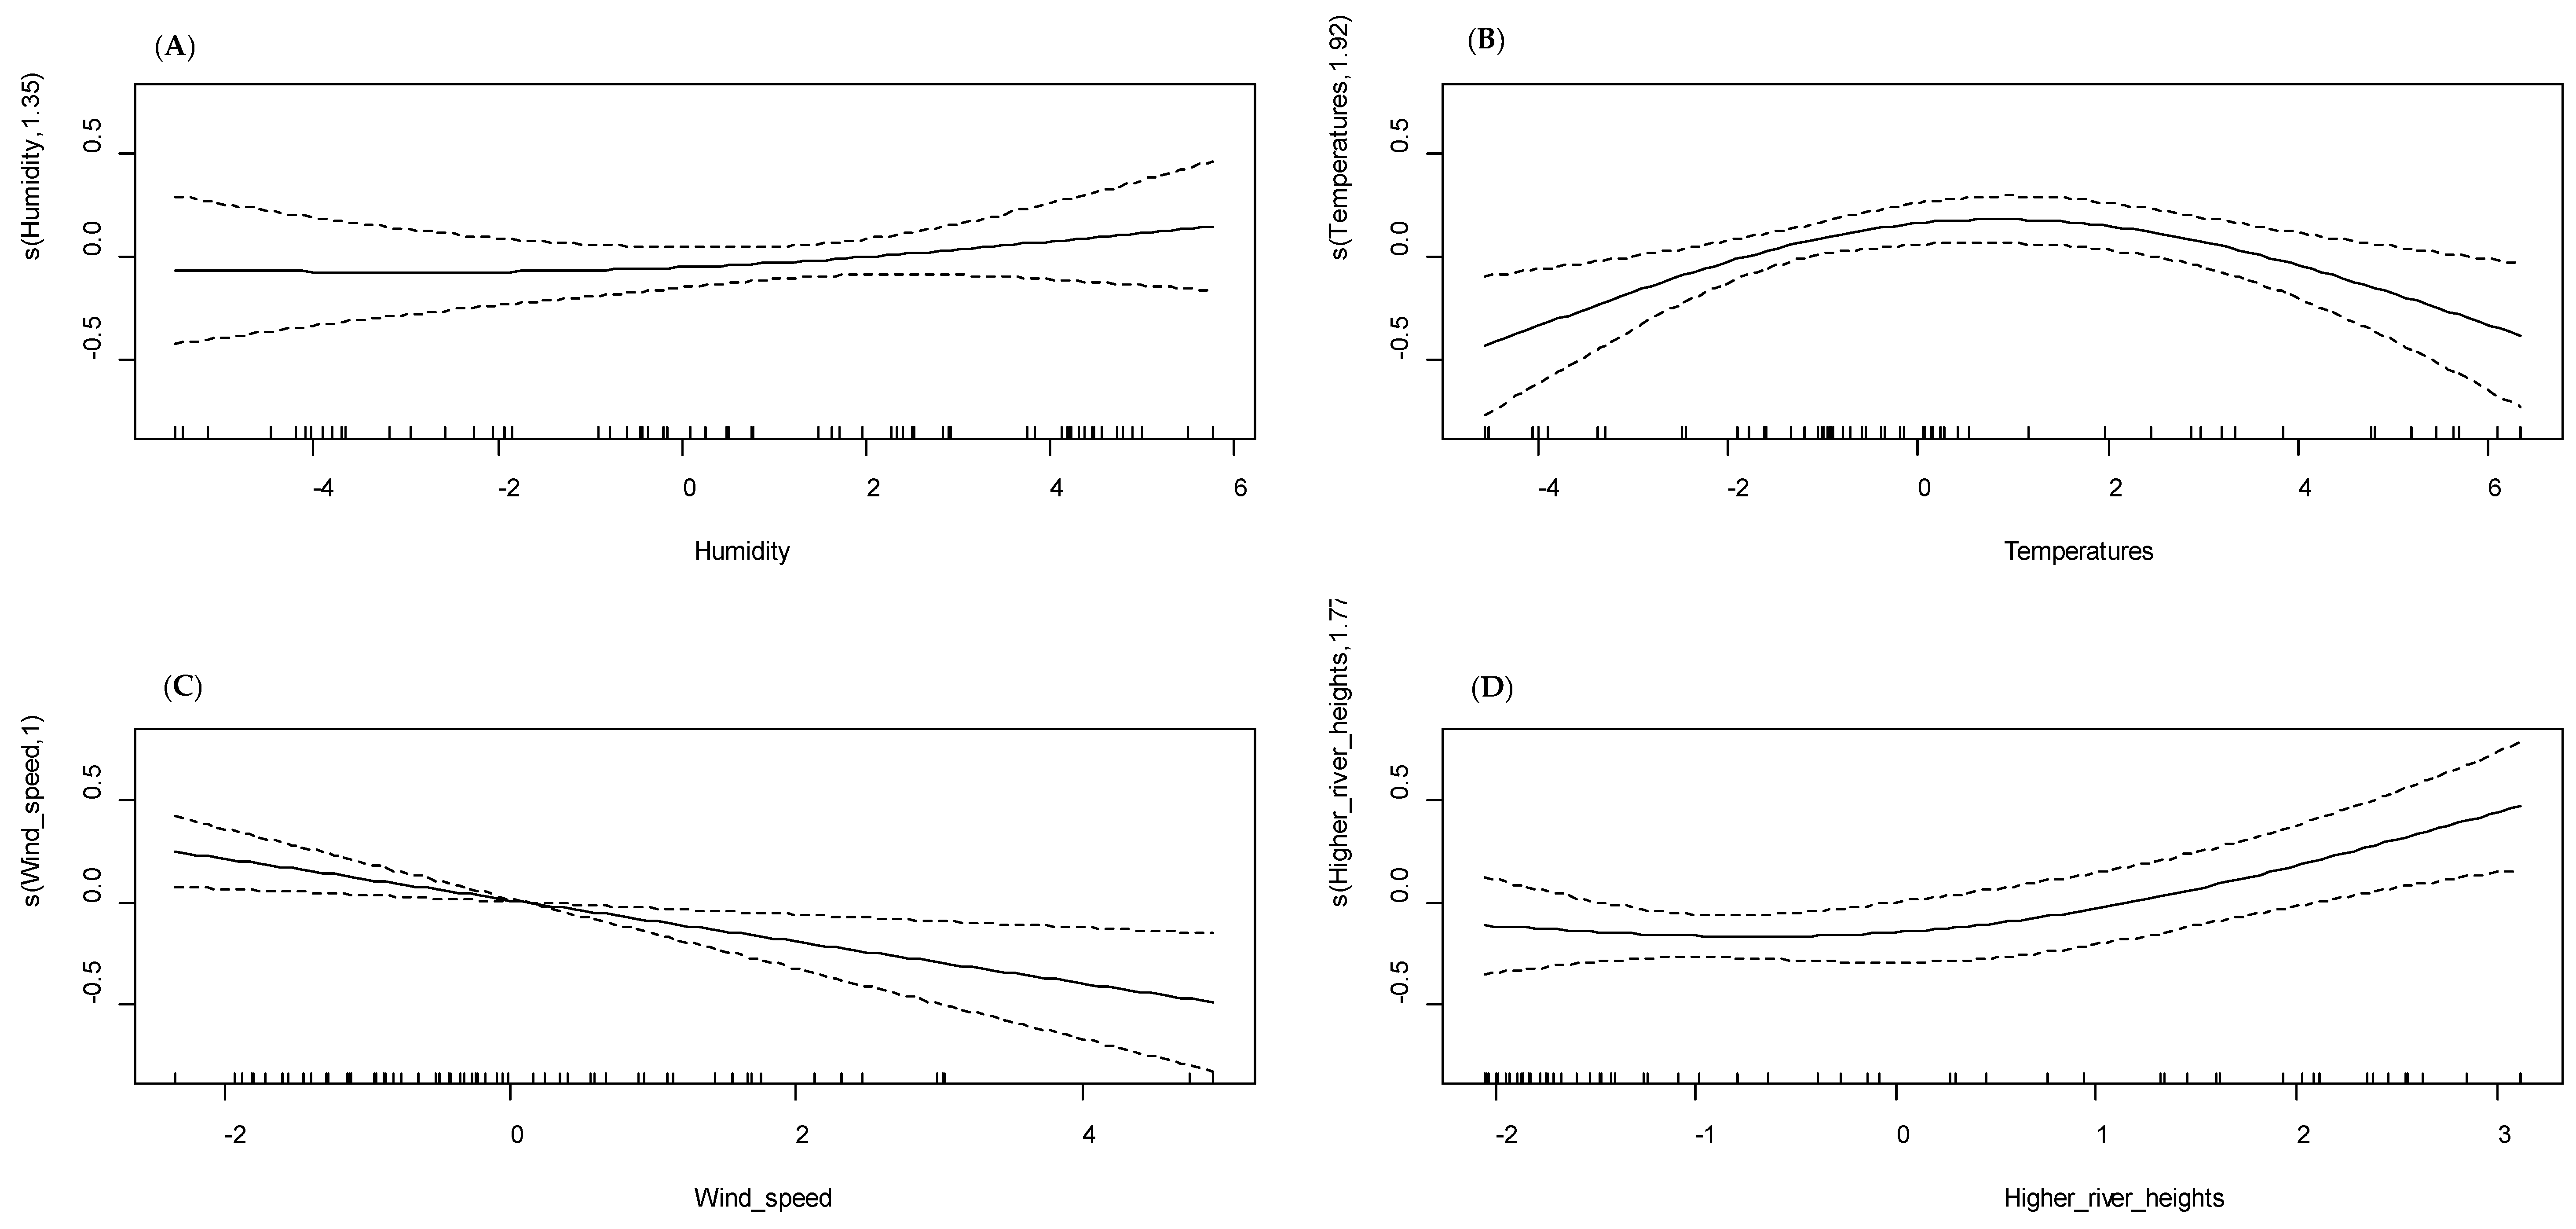
3.3. Univariate GAM Modeling
3.4. Multivariate GAM Modeling of Malaria Incidence
4. Discussion
5. Conclusions
Author Contributions
Funding
Acknowledgments
Conflicts of Interest
Abbreviations
| ACTs | Artemisinin-Based Combination Therapies |
| EOSDIS | Earth Observing System Data and Information System |
| IPTp | Intermittent Preventive Treatment during Pregnancy |
| LLINS | Long Lasting Insecticidal Nets |
| NASA | National Aeronautics and Space Administration |
| NDVI | Normalized Difference Vegetation Index |
| NGO | Non-Governmental Organization |
| PCA | Principal Components Analysis |
| PCD | Passive Detection Case |
| RDT | Rapid Diagnostic Test |
| SMC | Seasonal Malaria Chemoprevention |
| UBRE | Unbiased risk estimator |
References
- Yé, Y.; Eisele, T.P.; Eckert, E.; Korenromp, E.; Shah, J.A.; Hershey, C.L.; Ivanovich, E.; Newby, H.; Carvajal-Velez, L.; Lynch, M.; et al. Framework for Evaluating the Health Impact of the Scale-Up of Malaria Control Interventions on All-Cause Child Mortality in Sub-Saharan Africa. Am. J. Trop. Med. Hyg. 2017, 97, 9–19. [Google Scholar] [CrossRef] [Green Version]
- WHO World Malaria Report 2018. Available online: http://www.who.int/malaria/publications/world-malaria-report-2018/en/ (accessed on 20 January 2019).
- Cellule de Planification et de Statistique Secteur Santé Développement Social et Promotion de la Famille Canevas de Synthèse. Des Rapports D’activités 2018 et de Programmation 2020 Pour les Journées D’évaluation des Structures Centrales; Cellule de Planification et de Statistique Secteur Santé Développement Social et Promotion de la Famille Canevas de Synthèse: Bamako, Mali, 2018. [Google Scholar]
- Ministère de la Santé. Annuaire Système Local d’Information Sanitaire (SLIS); Ministère de la Santé: Bamako, Mali, 2015. [Google Scholar]
- Parker, D.M.; Carrara, V.I.; Pukrittayakamee, S.; McGready, R.; Nosten, F.H. Malaria ecology along the Thailand–Myanmar border. Malar. J. 2015, 14, 388. [Google Scholar] [CrossRef] [Green Version]
- Morris, A.; Gozlan, R.E.; Hassani, H.; Andreou, D.; Couppié, P.; Guégan, J.-F. Complex temporal climate signals drive the emergence of human water-borne disease. Emerg. Microbes Infect. 2014, 3, 56. [Google Scholar] [CrossRef]
- Merkord, C.L.; Liu, Y.; Mihretie, A.; Gebrehiwot, T.; Awoke, W.; Bayabil, E.; Henebry, G.M.; Kassa, G.T.; Lake, M.; Wimberly, M.C. Integrating malaria surveillance with climate data for outbreak detection and forecasting: The EPIDEMIA system. Malar. J. 2017, 16, 89. [Google Scholar] [CrossRef] [PubMed] [Green Version]
- Doumbo, O.; Sangare, O.; Toure, T.Y. Le paludisme dans le Sahel: L’exemple du Mali. In Maladies Tropicales Transmissible; John Libbey Eurotex: Paris, France, 1989; pp. 11–32. [Google Scholar]
- Doumbo, O. Epidémiologie du Paludisme au Mali: Étude de la Chloroquinorésistance, Essai de Stratégie de Contrôle Basée sur L’utilisation de Rideaux Imprégnés de Perméthrine Associée au Traitement Systématique des Accès Fébriles. Available online: http://www.theses.fr/1992MON20039 (accessed on 27 February 2019).
- Sissoko, M.S.; Sissoko, K.; Kamate, B.; Samake, Y.; Goita, S.; Dabo, A.; Yena, M.; Dessay, N.; Piarroux, R.; Doumbo, O.K.; et al. Temporal dynamic of malaria in a suburban area along the Niger River. Malar. J. 2017, 16, 1–10. [Google Scholar] [CrossRef] [PubMed] [Green Version]
- Coulibaly, D.; Travassos, M.A.; Tolo, Y.; Laurens, M.B.; Kone, A.K.; Traore, K.; Sissoko, M.; Niangaly, A.; Diarra, I.; Daou, M.; et al. Spatio-Temporal Dynamics of Asymptomatic Malaria: Bridging the Gap Between Annual Malaria Resurgences in a Sahelian Environment. Am. J. Trop. Med. Hyg. 2017, 97, 1761–1769. [Google Scholar] [CrossRef] [PubMed] [Green Version]
- Ouedraogo, B.; Inoue, Y.; Kambiré, A.; Sallah, K.; Dieng, S.; Tine, R.; Rouamba, T.; Herbreteau, V.; Sawadogo, Y.; Ouedraogo, L.S.L.W.; et al. Spatio-temporal dynamic of malaria in Ouagadougou, Burkina Faso, 2011-2015. Malar. J. 2018, 17, 138. [Google Scholar] [CrossRef] [PubMed] [Green Version]
- Landier, J.; Rebaudet, S.; Piarroux, R.; Gaudart, J. Spatiotemporal analysis of malaria for new sustainable control strategies. BMC Med. 2018, 16, 226. [Google Scholar] [CrossRef] [Green Version]
- Institut National de la Statistique (INSTAT/MPATP). Cellule de Planifcation et de Statistique (CPS/SSDSPF), Institut National de la Statistique (INSTAT/MPATP), INFO-STAT et ICF International. Enquête Démographique et de Santé au Mali 2012–2013; CPS, INSTAT: Rockville, MD, USA, 2013.
- Castellanos, A.; Chaparro-Narváez, P.; Morales-Plaza, C.D.; Alzate, A.; Padilla, J.; Arévalo, M.; Herrera, S. Malaria in gold-mining areas in Colombia. Memorias do Instituto Oswaldo Cruz 2016, 111, 59–66. [Google Scholar] [CrossRef]
- Sanchez, J.F.; Carnero, A.M.; Rivera, E.; Rosales, L.A.; Baldeviano, G.C.; Asencios, J.L.; Edgel, K.A.; Vinetz, J.M.; Lescano, A.G. Unstable Malaria Transmission in the Southern Peruvian Amazon and Its Association with Gold Mining, Madre de Dios, 2001–2012. Am. J. Trop. Med. Hyg. 2017, 96, 304–311. [Google Scholar] [CrossRef] [Green Version]
- Giovanni. Available online: https://giovanni.gsfc.nasa.gov/giovanni/ (accessed on 15 June 2019).
- Shaffer, J.G.; Doumbia, S.O.; Ndiaye, D.; Diarra, A.; Gomis, J.F.; Nwakanma, D.; Abubakar, I.; Ahmad, A.; Affara, M.; Lukowski, M.; et al. Development of a data collection and management system in West Africa: Challenges and sustainability. Infect. Dis. Poverty 2018, 7, 125. [Google Scholar] [CrossRef] [PubMed]
- Hastie, T.; Tibshirani, R. Generalized Additive Models; Chapman & Hall/CRC: Boca Raton, FL, USA, 1999; ISBN 978-0-412-34390-2. [Google Scholar]
- Wood, S.N. Modelling and smoothing parameter estimation with multiple quadratic penalties. J. R. Stat. Soc. Ser. B 2000, 62, 413–428. [Google Scholar] [CrossRef] [Green Version]
- Wood, S.N. Generalized Additive Models: An. Introduction with R, 1st ed.; Chapman & Hall/CRC: Boca Raton, FL, USA, 2006; ISBN 1-58488-474-6. [Google Scholar]
- Wood, S.N. Fast stable direct fitting and smoothness selection for generalized additive models. J. R. Stat. Soc. Ser. B 2008, 70, 495–518. [Google Scholar] [CrossRef] [Green Version]
- Wood, S.N. Fast stable restricted maximum likelihood and marginal likelihood estimation of semiparametric generalized linear models: Estimation of Semiparametric Generalized Linear Models. J. R. Stat. Soc. Ser. B 2011, 73, 3–36. [Google Scholar] [CrossRef] [Green Version]
- Marra, G.; Wood, S.N. Practical variable selection for generalized additive models. Comput. Stat. Data Anal. 2011, 55, 2372–2387. [Google Scholar] [CrossRef]
- Marra, G.; Wood, S.N. Coverage Properties of Confidence Intervals for Generalized Additive Model Components: Coverage properties of GAM intervals. Scand. J. Stat. 2012, 39, 53–74. [Google Scholar] [CrossRef] [Green Version]
- Wood, S.N.; Pya, N.; Säfken, B. Smoothing Parameter and Model Selection for General Smooth Models. J. Am. Stat. Assoc. 2016, 111, 1548–1563. [Google Scholar] [CrossRef]
- Ceesay, S.J.; Bojang, K.A.; Nwakanma, D.; Conway, D.J.; Koita, O.A.; Doumbia, S.O.; Ndiaye, D.; Coulibaly, T.F.; Diakité, M.; Traoré, S.F.; et al. Sahel, Savana, Riverine and Urban Malaria in West Africa: Similar Control Policies with Different Outcomes. Acta Trop. 2012, 121, 166–174. [Google Scholar] [CrossRef] [Green Version]
- Hundessa, S.; Williams, G.; Li, S.; Liu, D.L.; Cao, W.; Ren, H.; Guo, J.; Gasparrini, A.; Ebi, K.; Zhang, W.; et al. Projecting potential spatial and temporal changes in the distribution of Plasmodium vivax and Plasmodium falciparum malaria in China with climate change. Sci. Total Environ. 2018, 627, 1285–1293. [Google Scholar] [CrossRef]
- Wood, S.N. Generalized Additive Models: An. Introduction with R, 2rd ed.; Chapman & Hall/CRC Texts in Statistical Science; CRC Press/Taylor & Francis Group: Boca Raton, FL, USA, 2017; ISBN 978-1-4987-2833-1. [Google Scholar]
- R: The R Project for Statistical Computing. Available online: https://www.r-project.org/ (accessed on 27 April 2019).
- Lê, S.; Josse, J.; Husson, F. FactoMineR: An R Package for Multivariate Analysis. J. Stat. Softw. 2008, 25, 1–18. [Google Scholar] [CrossRef] [Green Version]
- Sarkar, D. Lattice: Multivariate Data Visualization with R; Springer: New York, NY, USA, 2008; ISBN 978-0-387-75968-5. [Google Scholar]
- Hyndman, R.J.; Khandakar, Y. Automatic Time Series Forecasting: The forecast Package for R. J. Stat. Softw. 2008, 27. [Google Scholar] [CrossRef] [Green Version]
- Kassambara, A.; Mundt, F. Factoextra: Extract and Visualize the Results of Multivariate Data Analyses; R Package Factoextra Version 1.0.5. Available online: https://cran.r-project.org/web/packages/factoextra/index.html (accessed on 27 April 2019).
- Wei, A.T. Visualization of a Correlation Matrix: Package ‘Corrplot’. Available online: https://cran.r-project.org/web/packages/corrplot/corrplot.pdf (accessed on 27 April 2019).
- Moritz, S.; Bartz-Beielstein, T. imputeTS: Time Series Missing Value Imputation in R. R J. 2017, 9. [Google Scholar] [CrossRef] [Green Version]
- ESRI Esri: GIS Mapping Software, Spatial Data Analytics & Location Intelligence. Available online: https://www.esri.com/en-us/home (accessed on 13 January 2019).
- Koram, K.A.; Bennett, S.; Adiamah, J.H.; Greenwood, B.M. Socio-economic risk factors for malaria in a peri-urban area of The Gambia. Trans. R. Soc. Trop. Med. Hyg. 1995, 89, 146–150. [Google Scholar] [CrossRef]
- Chuquiyauri, R.; Paredes, M.; Peñataro, P.; Torres, S.; Marin, S.; Tenorio, A.; Brouwer, K.C.; Abeles, S.; Llanos-Cuentas, A.; Gilman, R.H.; et al. Socio-demographics and the development of malaria elimination strategies in the low transmission setting. Acta Trop. 2012, 121, 292–302. [Google Scholar] [CrossRef] [Green Version]
- Custodio, E.; Descalzo, M.Á.; Villamor, E.; Molina, L.; Snchez, I.; Lwanga, M.; Bernis, C.; Benito, A.; Roche, J. Nutritional and socio-economic factors associated with Plasmodium falciparum infection in children from Equatorial Guinea: Results from a nationally representative survey. Malar. J. 2009, 8, 225. [Google Scholar] [CrossRef] [Green Version]
- Lorenz, L.M.; Koella, J.C. Maternal environment shapes the life history and susceptibility to malaria of Anopheles gambiae mosquitoes. Malar. J. 2011, 10, 382. [Google Scholar] [CrossRef] [Green Version]
- Hasyim, H.; Dale, P.; Groneberg, D.A.; Kuch, U.; Müller, R. Social determinants of malaria in an endemic area of Indonesia. Malar. J. 2019, 18, 134. [Google Scholar] [CrossRef]
- Gunda, R.; Chimbari, M.J.; Shamu, S.; Sartorius, B.; Mukaratirwa, S. Malaria incidence trends and their association with climatic variables in rural Gwanda, Zimbabwe, 2005–2015. Malar. J. 2017, 16, 1–13. [Google Scholar] [CrossRef] [Green Version]
- Hajison, P.L.; Mwakikunga, B.W.; Mathanga, D.P.; Feresu, S.A. Seasonal variation of malaria cases in children aged less than 5 years old following weather change in Zomba district, Malawi. Malar. J. 2017, 16, 1–12. [Google Scholar] [CrossRef] [Green Version]
- Midekisa, A.; Beyene, B.; Mihretie, A.; Bayabil, E.; Wimberly, M.C. Seasonal associations of climatic drivers and malaria in the highlands of Ethiopia. Parasites Vectors 2015, 8, 1–11. [Google Scholar] [CrossRef] [Green Version]
- Thomson, M.C.; Muñoz, Á.G.; Cousin, R.; Shumake-Guillemot, J. Climate drivers of vector-borne diseases in Africa and their relevance to control programmes. Infect. Dis. Poverty 2018, 7, 81. [Google Scholar] [CrossRef] [PubMed] [Green Version]
- Teklehaimanot, H.D.; Lipsitch, M.; Teklehaimanot, A.; Schwartz, J. Weather-based prediction of Plasmodium falciparum malaria in epidemic-prone regions of Ethiopia I. Patterns of lagged weather effects reflect biological mechanisms. Malar. J. 2004, 3, 41. [Google Scholar] [CrossRef] [Green Version]
- Ferraguti, M.; Martínez-de la Puente, J.; Roiz, D.; Ruiz, S.; Soriguer, R.; Figuerola, J. Effects of landscape anthropization on mosquito community composition and abundance. Sci. Rep. 2016, 6, 1–9. [Google Scholar] [CrossRef] [Green Version]
- Beck-Johnson, L.M.; Nelson, W.A.; Paaijmans, K.P.; Read, A.F.; Thomas, M.B.; Bjørnstad, O.N. The Effect of Temperature on Anopheles Mosquito Population Dynamics and the Potential for Malaria Transmission. PLoS ONE 2013, 8, e79276. [Google Scholar] [CrossRef] [PubMed]
- Gilioli, G.; Mariani, L. Sensitivity of Anopheles gambiae population dynamics to meteo-hydrological variability: A mechanistic approach. Malar. J. 2011, 10, 294. [Google Scholar] [CrossRef] [Green Version]
- Mali, M. De la santé de la R. In Du Plan Stratégique de Lutte Contre le Paludisme au Mali.2013–2017; Programme national de lutte contre le paludisme: Bamako, Mali, 2013. [Google Scholar]
- Touré Halimatou, A.; Kalifa, T.; Kyei-Baffour, N. Assessment of changing trends of daily precipitation and temperature extremes in Bamako and Ségou in Mali from 1961–2014. Weather Clim. Extremes 2017, 18, 8–16. [Google Scholar] [CrossRef]
- Mukhtar, A.Y.A.; Munyakazi, J.B.; Ouifki, R. Assessing the role of climate factors on malaria transmission dynamics in South Sudan. Math. Biosci. 2019, 310, 13–23. [Google Scholar] [CrossRef]
- Taddese, A.A.; Baraki, A.G.; Gelaye, K.A. Spatial modeling, prediction and seasonal variation of malaria in northwest Ethiopia. BMC Res. Notes 2019, 12, 1–6. [Google Scholar] [CrossRef] [Green Version]
- Le, P.V.V.; Kumar, P.; Ruiz, M.O.; Mbogo, C.; Muturi, E.J. Predicting the direct and indirect impacts of climate change on malaria in coastal Kenya. PLoS ONE 2019, 14, e0211258. [Google Scholar] [CrossRef] [Green Version]
- Tanser, F.C.; Sharp, B.; Le Sueur, D. Potential effect of climate change on malaria transmission in Africa. Lancet 2003, 362, 1792–1798. [Google Scholar] [CrossRef]
- Rossati, A.; Bargiacchi, O.; Kroumova, V.; Zaramella, M.; Caputo, A.; Garavelli, P.L. Climate, environment and transmission of malaria. Infez. Med. 2016, 24, 93–104. [Google Scholar]
- Ngarakana-Gwasira, E.T.; Bhunu, C.P.; Masocha, M.; Mashonjowa, E. Assessing the Role of Climate Change in Malaria Transmission in Africa. Malar. Res. Treat. 2016. [Google Scholar] [CrossRef] [PubMed] [Green Version]
- Arab, A.; Jackson, M.C.; Kongoli, C. Modelling the effects of weather and climate on malaria distributions in West Africa. Malar. J. 2014, 13, 126. [Google Scholar] [CrossRef] [PubMed] [Green Version]
- Yamana, T.K.; Bomblies, A.; Eltahir, E.A.B. Climate change unlikely to increase malaria burden in West Africa. Nat. Clim. Chang. 2016, 6, 1009–1013. [Google Scholar] [CrossRef]
- Alemu, A.; Abebe, G.; Tsegaye, W.; Golassa, L. Climatic variables and malaria transmission dynamics in Jimma town, South West Ethiopia. Parasites Vectors 2011, 4, 30. [Google Scholar] [CrossRef] [PubMed] [Green Version]
- Kim, Y.M.; Park, J.W.; Cheong, H.K. Estimated effect of climatic variables on the transmission of plasmodium vivax malaria in the republic of Korea. Environ. Health Perspect. 2012, 120, 1314–1319. [Google Scholar] [CrossRef] [Green Version]
- Bi, Y.; Yu, W.; Hu, W.; Lin, H.; Guo, Y.; Zhou, X.N.; Tong, S. Impact of climate variability on Plasmodium vivax and Plasmodium falciparum malaria in Yunnan Province, China. Parasites Vectors 2013, 6, 357. [Google Scholar] [CrossRef] [Green Version]


| Study Site and Characteristic | Univariate Analysis | Multivariate Analysis | ||
|---|---|---|---|---|
| p Value | Dev (%) a | p Value | Dev (%) a | |
| Dangassa | ||||
| Humidity | <0.0001 | 34.4 | 0.54 | 65 |
| Higher temperatures | <0.001 | 17.5 | 0.009 | |
| Wind speed | 0.204 | 11.8 | 0.005 | |
| High river heights | 0.002 | 22.8 | 0.01 | |
| Variations in river heights | 0.32 | 1.56 | ||
| Koila | ||||
| Humidity | 0.001 | 24.8 | <0.001 | 48.2 |
| Higher temperatures | 0.205 | 13.4 | 0.03 | |
| Vegetation | 0.531 | 4.27 | 0.004 | |
| High river heights | 0.353 | 10.2 | 0.66 | |
| Variations in river heights | 0.27 | 10.3 | ||
© 2020 by the authors. Licensee MDPI, Basel, Switzerland. This article is an open access article distributed under the terms and conditions of the Creative Commons Attribution (CC BY) license (http://creativecommons.org/licenses/by/4.0/).
Share and Cite
Ateba, F.F.; Sagara, I.; Sogoba, N.; Touré, M.; Konaté, D.; Diawara, S.I.; Diakité, S.A.S.; Diarra, A.; Coulibaly, M.D.; Dolo, M.; et al. Spatio-Temporal Dynamic of Malaria Incidence: A Comparison of Two Ecological Zones in Mali. Int. J. Environ. Res. Public Health 2020, 17, 4698. https://doi.org/10.3390/ijerph17134698
Ateba FF, Sagara I, Sogoba N, Touré M, Konaté D, Diawara SI, Diakité SAS, Diarra A, Coulibaly MD, Dolo M, et al. Spatio-Temporal Dynamic of Malaria Incidence: A Comparison of Two Ecological Zones in Mali. International Journal of Environmental Research and Public Health. 2020; 17(13):4698. https://doi.org/10.3390/ijerph17134698
Chicago/Turabian StyleAteba, François Freddy, Issaka Sagara, Nafomon Sogoba, Mahamoudou Touré, Drissa Konaté, Sory Ibrahim Diawara, Séidina Aboubacar Samba Diakité, Ayouba Diarra, Mamadou D. Coulibaly, Mathias Dolo, and et al. 2020. "Spatio-Temporal Dynamic of Malaria Incidence: A Comparison of Two Ecological Zones in Mali" International Journal of Environmental Research and Public Health 17, no. 13: 4698. https://doi.org/10.3390/ijerph17134698