
Exploring the Determinants of Repeated-Sprint Ability in Adult Women Soccer Players

 , , ,
, , ,  , and
, and 
Abstract
:1. Introduction
2. Materials and Methods
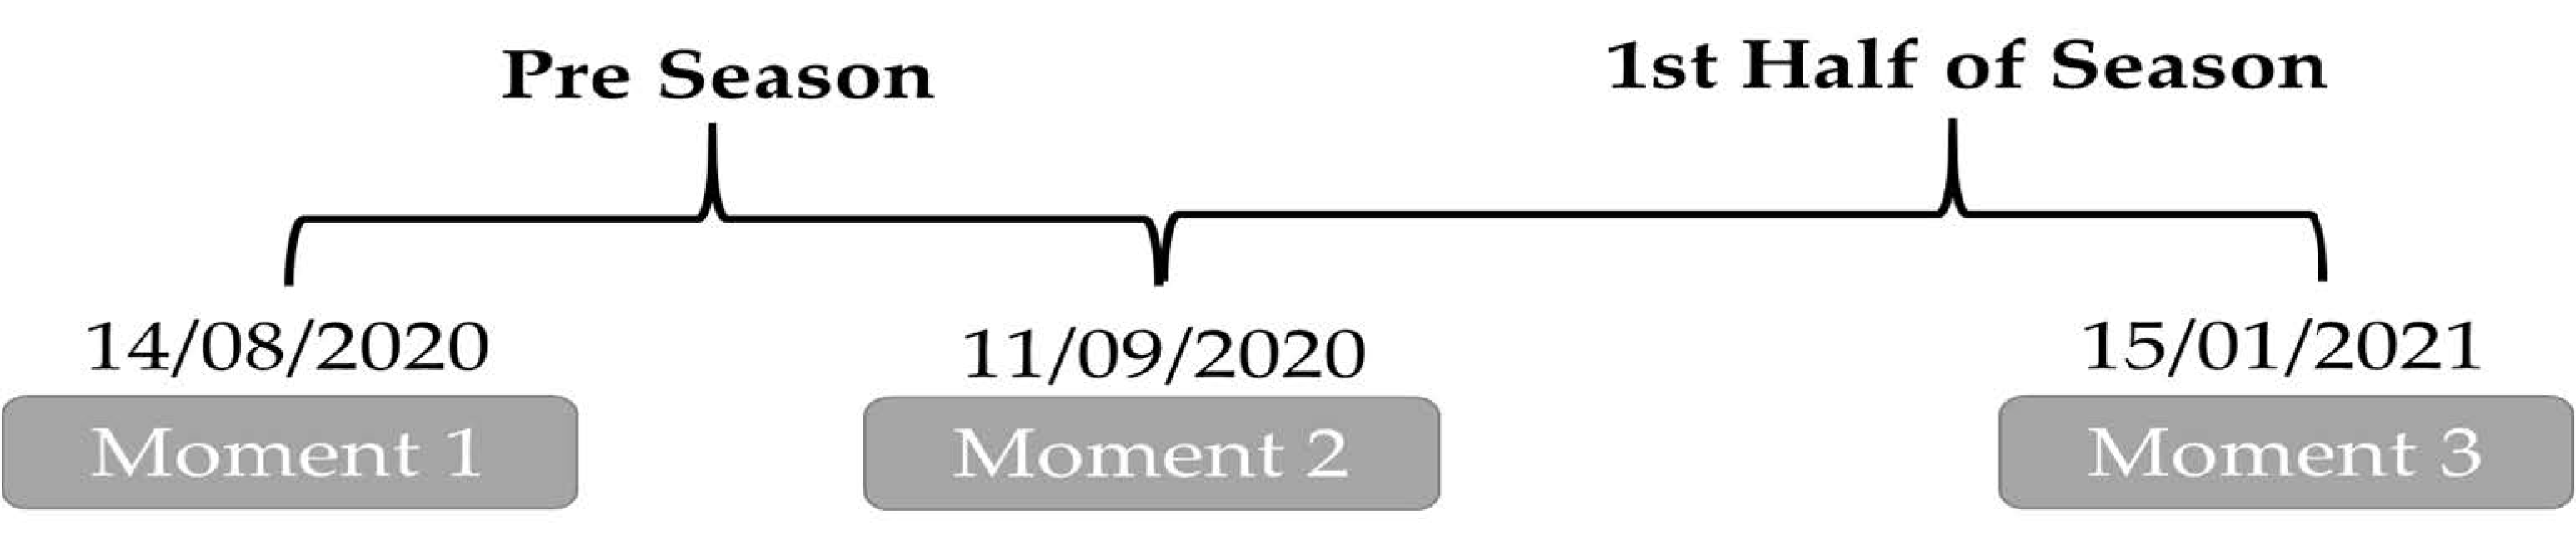
2.1. Experimental Approach to the Study
2.2. Participants
2.3. Data Collection
2.3.1. Anthropometry
2.3.2. Hip Adductor and Abductor Isometric Strength
2.3.3. Squat and Countermovement Jump
2.3.4. Change-of-Direction Test
2.3.5. Linear Sprinting
2.3.6. Running Anaerobic Sprint test
2.3.7. Yo-Yo Intermittent Recovery Test—Level 1
2.4. Statistical Analysis
3. Results
4. Discussion
5. Conclusions
Author Contributions
Funding
Institutional Review Board Statement
Informed Consent Statement
Acknowledgments
Conflicts of Interest
References
- Sedan, S.; Vaeyens, R.; Philippaerts, R.M.; Redondo, J.C.; Cuadrado, G. Anthropometric and anaerobic fitness profile of elite and non-elite female soccer players. J. Sports Med. Phys. Fit. 2009, 49, 387–394. [Google Scholar]
- Haugen, T.A.; Tønnessen, E.; Seiler, S. Speed and countermovement-jump characteristics of elite female soccer players, 1995–2010. Int. J. Sports Physiol. Perform. 2012, 7, 340–349. [Google Scholar] [CrossRef]
- Milanović, Z.; Sporiš, G.; James, N.; Trajković, N.; Ignjatović, A.; Sarmento, H.; Trecroci, A.; Mendes, B. Physiological demands, morphological characteristics, physical abilities and injuries of female soccer players. J. Hum. Kinet. 2017, 60, 77–83. [Google Scholar] [CrossRef] [PubMed] [Green Version]
- Manson, S.; Brughelli, M.; Harris, N. Physological characteristics of International female soccer players. J. Strength Cond. Res. 2014, 28, 308–318. [Google Scholar] [CrossRef] [PubMed]
- Mufty, S.; Bollars, P.; Vanlommel, L.; Van Crombrugge, K.; Corten, K.; Bellemans, J. Injuries in male versus female soccer players: Epidemiology of a nationwide study. Acta Orthop. Belg. 2015, 81, 289–295. [Google Scholar] [PubMed]
- Reilly, T. Energetics of high-intensity exercise (soccer) with particular reference to fatigue. J. Sports Sci. 1997, 15, 257–263. [Google Scholar] [CrossRef] [PubMed]
- Ramos, G.; Nakamura, F.Y.; Pereira, L.A.; Wilke, C.F. Movement patterns of an U-20 National female soccer team during competitive matches: Influence of playing position and performance in the first half. Int. J. Sports Med. 2017, 38, 747–754. [Google Scholar] [PubMed]
- Ingebrigtsen, J.; Dillern, T.; Shalfawi, S.A.I. Aerobic Capacities and Anthtropometric Characteristics of Elite Female Soccer Players. J. Strength Cond. Res. 2011, 25, 3352–3357. [Google Scholar] [CrossRef] [PubMed]
- Mohr, M.; Krustrup, P.; Andersson, H.; Kirkendal, D.; Bangsbo, J. Match Activities of Elite Women Soccer Players at Different Performance Levels. J. Strength Cond. Res. 2008, 22, 341–349. [Google Scholar] [CrossRef] [PubMed]
- McCormack, W.; Stout, J.; Wells, A.; Gonzalez, A.; Mangine, G.; Hoffman, J. Predictors of high-intensity running capacity in collegiate women during a soccer game. J. Stregth Cond. Res. 2014, 28, 964–970. [Google Scholar] [CrossRef] [Green Version]
- Wells, A.; Hoffman, J.; Beyer, K.; Hoffman, M.; Jajtner, A.; Fukuda, D.; Stout, J. Regular and postseason comparisons of playing time and measures of running performance in NCAA Division I women soccer players. App. Phys. Nut. Metab. 2015, 40, 907–917. [Google Scholar] [CrossRef] [PubMed] [Green Version]
- Mohr, M.; Krustrup, P.; Bangsbo, J. Match performance of high-standard soccer players with special reference to development of fatigue. J. Sports Sci. 2003, 21, 519–528. [Google Scholar] [CrossRef] [PubMed] [Green Version]
- Datson, N.; Drust, B.; Weston, M.; Jarman, I.; Lisboa, P.; Gregson, W. Match physical performance of elite female soccer player during international competition. J. Stregth Cond. Res. 2017, 31, 2379–2387. [Google Scholar] [CrossRef] [PubMed]
- Datson, N.; Hulton, A.; Andersson, H.; Lewis, T.; Weston, M.; Drust, B.; Gregson, W. Applied physiology of female soccer: An update. Sports Med. 2014, 44, 1225–1240. [Google Scholar] [CrossRef] [PubMed] [Green Version]
- Davis, J.A.; Brewer, J. Applied physiology of female soccer players. Sports Med. 1993, 16, 180–189. [Google Scholar] [CrossRef]
- Krustrup, P.; Mohr, M.; Ellinsgaard, H.; Bangsbo, J. Physical Demands during an Elite Female Soccer Game: Importance of Training Status. Med. Sci. Sports Exerc. 2005, 37, 1242–1248. [Google Scholar] [CrossRef]
- Bangsbo, J.; Mohr, M.; Krustrup, P. Physical and metabolic demands of training and match-play in the elite football player. J. Sports Sci. 2006, 24, 665–674. [Google Scholar] [CrossRef]
- Chaouachi, A.; Manzi, V.; Wong, D.; Chaalali, A.; Laurencelle, L.; Chamari, K.; Castagna, C. Intermittent endurance and repeated sprint ability in soccer players. J. Strength Cond. Res. 2010, 24, 2663–2669. [Google Scholar] [CrossRef]
- Krustrup, P.; Mohr, M.; Steensberg, A.; Bencke, J.; Klær, M.; Bangsbo, J. Muscle and blood metabolites during a soccer game: Implications for sprint performance. Med. Sci. Sports Exerc. 2006, 38, 1165–1174. [Google Scholar] [CrossRef]
- Rampinini, E.; Coutts, A.J.; Castagna, C.; Sassi, R.; Impellizzeri, F.M. Variation in top level soccer match performance. Int. J. Sports Med. 2007, 28, 1018–1024. [Google Scholar] [CrossRef] [Green Version]
- Gabbett, T.; Wiig, H.; Spencer, M. Repeated high-intensity running and sprinting in elite women’s soccer competition. Int. J. Sports Physiol. Perform. 2013, 8, 130–138. [Google Scholar] [CrossRef] [Green Version]
- Stolen, T.; Chamari, K.; Castagna, C.; Wisloff, U. Physiology of soccer. Sports Med. 2005, 3, 50–60. [Google Scholar]
- Krustrup, P.; Mohr, M.; Amstrup, T.; Rysgaard, T.; Johansen, J.; Steensberg, A.; Pedersen, P.K.; Bangsbo, J. The Yo-Yo Intermittent Recovery Test: Physiological Response, Reliability, and Validity. Med. Sci. Sports Exerc. 2003, 35, 697–705. [Google Scholar] [CrossRef] [PubMed]
- Krustrup, P.; Mohr, M.; Nybo, L.; Bangsbo, J. The Yo-Yo IR2 Test: Physiological response, reliability and application to elite soccer. Med. Sci. Sports Exerc. 2006, 38, 1666–1673. [Google Scholar] [CrossRef] [PubMed]
- Buchheit, M.; Bishop, D.; Haydar, B.; Nakamura, F.; Ahmaidi, S. Physiological responses to shuttle repeated sprint running. Int. J. Sports Med. 2010, 31, 402–409. [Google Scholar] [CrossRef] [PubMed] [Green Version]
- Buchheit, M.; Mendez-villanueva, A. Improving Repeated Sprint Ability in Young Elite Soccer Players: Repeated Shuttle Sprints Vs. Explosive Strength Training. J. Strength Cond. Res. 2010, 24, 2715–2722. [Google Scholar] [CrossRef] [PubMed]
- Bishop, D.; Edge, J. Determinants of repeated-sprint ability in females matched for single-sprint performance. Eur. J. Appl. Physiol. 2006, 97, 373–379. [Google Scholar] [CrossRef] [PubMed]
- Bogdanis, G.C.; Nevill, M.E. Contribution of phosphocreatine and aerobic metabolism to energy supply during repeated sprint exercise. J. Appl. Physiol. 1996, 80, 876–884. [Google Scholar] [CrossRef]
- Archiza, B.; Andaku, D.K.; Beltrame, T.; Libardi, C.A.; Borghi-Silva, A. The Relationship between Repeated-Sprint Ability, Aerobic Capacity, and Oxygen Uptake Recovery Kinetics in Female Soccer Athletes. J. Hum. Kinet. 2020, 75, 115–126. [Google Scholar] [CrossRef]
- Datson, N.; Drust, B.; Weston, M.; Gregson, W. Repeated high-speed running in elite female soccer players during international competition. Sci. Med. Footb. 2019, 3, 150–156. [Google Scholar] [CrossRef]
- Doyle, B.; Browne, D.; Horan, D. The relationship of aerobic endurance and linear speed on repeat sprint ability performance in female international footballers. Int. J. Hum. Mov. Sports Sci. 2020, 8, 147–153. [Google Scholar] [CrossRef]
- Pyne, D.B.; Saunders, P.; Montgomery, P.; Hewitt, A.; Sheehan, K. Relationships between repeated sprint testing, speed and endurance. J. Stregth Cond. Res. 2008, 22, 1633–1637. [Google Scholar] [CrossRef]
- López-Segovia, M.; Pareja-Blanco, F.; Jiménez-Reyes, P.; González-Badillo, J. Determinant Factors of Repeat Sprint Sequences in Young Soccer Players. Int. J. Sports Med. 2014, 36, 130–136. [Google Scholar] [CrossRef]
- Gunnar, M.; Svein, A.P. The effect of speed training on sprint and agility performance in female youth soccer players. J. Phys. Educ. Sport 2015, 15, 395–399. [Google Scholar]
- Buchheit, M.; Haydar, B.; Ahmaidi, S. Repeated sprints with directional changes: Do angles matter? J. Sports Sci. 2012, 30, 555–562. [Google Scholar] [CrossRef]
- Vescovi, J.D.; Mcguigan, M.R. Relationships between sprinting, agility, and jump ability in female athletes. J. Sports Sci. 2008, 26, 97–107. [Google Scholar] [CrossRef] [PubMed]
- Spencer, M.; Bishop, D.; Dawson, B.; Goodman, C. Physiological and metabolic responses of repeated-sprint activities: Specific to field-based team sports. Sports Med. 2005, 35, 1025–1044. [Google Scholar] [CrossRef] [PubMed]
- Oliveras, R.; Bizzini, M.; Brunner, R.; Maffiuletti, N.A. Field-based evaluation of hip adductor and abductor strength in professional male ice hockey players: Reference values and influencing factors. Phys. Ther. Sport 2020, 43, 204–209. [Google Scholar] [CrossRef] [PubMed]
- Gollin, M.; Scarafiotti, E. The Repeatability of Jump tests measured with the Opto Jump. Sport Sci. Health 2012, 8, 36. [Google Scholar]
- Little, T.; Williams, A.G. Specificity of Acceleration, Maximum Speed, and Agility in Professional Soccer Players. J. Strength Cond. Res. 2005, 19, 76–78. [Google Scholar]
- Bond, C.W.; Willaert, E.M.; Rudningen, K.E.; Noonan, B.C. Reliability of Three Timing Systems Used to Time Short on Ice-Skating Sprints in Ice Hockey Players. J. Strength Cond. Res. 2017, 31, 3279–3286. [Google Scholar] [CrossRef]
- Cipryan, L.; Gajda, V. The influence of aerobic power on repeated anaerobic exercise in junior soccer players. J. Hum. Kinet. 2011, 28, 63–71. [Google Scholar] [CrossRef]
- MacKenzie, B. 101 Performance Evaluation Tests; Electric Word plc.: London, UK, 2005. [Google Scholar]
- Bangsbo, J.; Iaia, F.M.; Krustrup, P. The Yo-Yo Intermittent Recovery Test. Sports Med. 2008, 38, 37–51. [Google Scholar] [CrossRef]
- Granier, P.; Mercier, B.; Mercier, J.; Anselme, F.; Préfaut, C. Aerobic and anaerobic contribution to Wingate test performance in sprint and middle-distance runners. Eur. J. Appl. Physiol. Occup. Physiol. 1995, 70, 58–65. [Google Scholar] [CrossRef]
- Buchheit, M.; Mendez-Villanueva, A.; Simpson, B.M.; Bourdon, P.C. Match Running Performance and Fitness in Youth Soccer. Int. J. Sports Med. 2010, 31, 818–825. [Google Scholar] [CrossRef] [PubMed]
- Castagna, C.; Manzi, V.; Impellizzeri, F.; Weston, M.; Barbero Alvarez, J.C. Relationship between Endurance Field Tests and Match Performance in Young Soccer Players. J. Strength Cond. Res. 2010, 24, 3227–3233. [Google Scholar] [CrossRef] [Green Version]
- Nobari, H.; Alves, A.R.; Clemente, F.M.; Pérez-Gómez, J.; Clark, C.C.T.; Granacher, U.; Zouhal, H. Associations Between Variations in Accumulated Workload and Physiological Variables in Young Male Soccer Players Over the Course of a Season. Front. Physiol. 2021, 12, 233. [Google Scholar] [CrossRef] [PubMed]
- Lesinski, M.; Prieske, O.; Helm, N.; Granacher, U. Effects of soccer training on anthropometry, body composition, and physical fitness during a soccer season in female elite young athletes: A prospective cohort study. Front. Physiol. 2017, 8, 1093. [Google Scholar] [CrossRef] [PubMed] [Green Version]
- Pino-Ortega, J.; Rojas-Valverde, D.; Gómez-Carmona, C.D.; Rico-González, M. Training Design, Performance Analysis, and Talent Identification—A Systematic Review about the Most Relevant Variables through the Principal Component Analysis in Soccer, Basketball, and Rugby. Int. J. Environ. Res. Public Health 2021, 18, 2642. [Google Scholar] [CrossRef] [PubMed]
- Haugen, T.; Tønnessen, E.; Hisdal, J.; Seiler, S. The role and development of sprinting speed in soccer. Int. J. Sports Physiol. Perform. 2014, 9, 432–441. [Google Scholar] [CrossRef] [PubMed] [Green Version]
- Nuell, S.; Illera-Domínguez, V.R.; Carmona, G.; Alomar, X.; Padullés, J.M.; Lloret, M.; Cadefau, J.A. Hypertrophic muscle changes and sprint performance enhancement during a sprint-based training macrocycle in national-level sprinters. Eur. J. Sport Sci. 2020, 20, 793–802. [Google Scholar] [CrossRef]
- Fredericson, M.; Weir, A. Practical management of iliotibial band friction syndrome in runners. Clin. J. Sport Med. 2006, 16, 261–268. [Google Scholar] [CrossRef]
- Tottori, N.; Suga, T.; Miyake, Y.; Tsuchikane, R.; Otsuka, M.; Nagano, A.; Fujita, S.; Isaka, T. Hip Flexor and Knee Extensor Muscularity Are Associated with Sprint Performance in Sprint-Trained Preadolescent Boys. Pediatr. Exerc. Sci. 2018, 30, 115–123. [Google Scholar] [CrossRef] [PubMed]
- Miyake, Y.; Suga, T.; Otsuka, M.; Tanaka, T.; Misaki, J.; Kudo, S.; Nagano, A.; Isaka, T. The knee extensor moment arm is associated with performance in male sprinters. Eur. J. Appl. Physiol. 2017, 117, 533–539. [Google Scholar] [CrossRef]
- Sugisaki, N.; Kobayashi, K.; Tsuchie, H.; Kanehisa, H. Associations Between Individual Lower-Limb Muscle Volumes and 100-m Sprint Time in Male Sprinters. Int. J. Sports Physiol. Perform. 2018, 13, 214–219. [Google Scholar] [CrossRef] [PubMed]
- Gabrys, T.; Stanula, A.; Szmatlan-Gabrys, U.; Garnys, M.; Charvát, L.; Gupta, S. Metabolic and Cardiorespiratory Responses of Semiprofessional Football Players in Repeated Ajax Shuttle Tests and Curved Sprint Tests, and Their Relationship with Football Match Play. Int. J. Environ. Res. Public Health 2020, 17, 7745. [Google Scholar] [CrossRef] [PubMed]
- Granero-Gil, P.; Bastida-Castillo, A.; Rojas-Valverde, D.; Gómez-Carmona, C.D.; de la Cruz Sánchez, E.; Pino-Ortega, J. Accuracy, inter-unit reliability and comparison between GPS and UWB-based tracking systems for measuring centripetal force during curvilinear locomotion. Proc. Inst. Mech. Eng. Part P J. Sports Eng. Technol. 2021. [Google Scholar] [CrossRef]
- Granero-Gil, P.; Gómez-Carmona, C.D.; Bastida-Castillo, A.; Rojas-Valverde, D.; de la Cruz, E.; Pino-Ortega, J. Influence of playing position and laterality in centripetal force and changes of direction in elite soccer players. PLoS ONE 2020, 15, e0232123. [Google Scholar] [CrossRef] [PubMed] [Green Version]
- Granero-Gil, P.; Bastida-Castillo, A.; Rojas-Valverde, D.; Gómez-Carmona, C.D.; de la Cruz Sánchez, E.; Pino-Ortega, J. Influence of Contextual Variables in the Changes of Direction and Centripetal Force Generated during an Elite-Level Soccer Team Season. Int. J. Environ. Res. Public Health 2020, 17, 967. [Google Scholar] [CrossRef] [Green Version]


| Women Soccer Players (n = 22) | |||||||
|---|---|---|---|---|---|---|---|
| Moment 1 | Moment 2 | Moment 3 | CI (95%) | Upper CI (95%) | Lower CI (95%) | Repeated Measures ANOVA (p) | |
| Hip strength | |||||||
| ADDs (kg) | 34.66 ± 7.81 | 35.06 ± 8.12 | 3.39 | 37.93 | 31.15 | p = 0.97, η2 = 0.001. | |
| ABDs (kg) | 33.48 ± 5.87 | 34.19 ± 6.23 | 2.72 | 36.14 | 30.69 | p = 0.98, η2 = 0.001. | |
| Squat and countermovement jump | |||||||
| SJ (cm) | 25.33 ± 2.98 | 26.24 ± 3.09 | 24.39 ± 3.95 | 1.38 | 26.62 | 23.84 | p = 0.003 *, η2 = 0.35. |
| CMJ (cm) | 27.26 ± 2.98 | 27.40 ± 3.51 | 24.65 ± 3.93 | 1.39 | 27.70 | 24.90 | p = 0.001 *, η2 = 0.60. |
| Linear sprinting | |||||||
| 10 m (s) | 1.87 ± 0.08 | 1.90 ± 0.10 | 1.88 ± 0.10 | 0.05 | 1.94 | 1.85 | p = 0.26, η2 = 0.09. |
| 30 m (s) | 4.79 ± 0.23 | 4.78 ± 0.22 | 4.75 ± 0.23 | 0.11 | 4.90 | 4.68 | p = 0.07, η2 = 0.16. |
| Change-of-direction test | |||||||
| COD (s) | 5.73 ± 0.19 | 5.75 ± 0.18 | 5.79 ± 0.23 | 0.09 | 5.86 | 5.67 | p = 0.32, η2 = 0.08. |
| Repeated sprint ability test (RSA test) | |||||||
| Pmin (s) | 240.44 ± 46.87 | 267.15 ± 46.29 | 293.09 ± 36.49 | 18.29 | 281.51 | 244.93 | p = 0.001 *, η2 = 0.48. |
| Pmax (s) | 380.81 ± 68.38 | 401.77 ± 74.47 | 444.38 ± 72.96 | 31.40 | 441.72 | 378.92 | p = 0.001 *, η2 = 0.40. |
| FI (%) | 4.61 ± 1.85 | 4.42 ± 1.66 | 4.96 ± 1.87 | 0.70 | 5.53 | 4.11 | p = 0.38, η2 = 0.07. |
| Yo-Yo intermittent recovery test- Level 1 | |||||||
| YYIR1. Distance (m) | 677.78 ± 203.72 | 788.00 ± 219.89 | 863.33 ± 218.73 | 89.40 | 833.84 | 655.04 | p = 0.001 *, η2 = 0.53. |
| VO2max (mL/kg/min) | 41.74 ± 5.33 | 43.02 ± 1.85 | 43.82 ± 1.82 | 0.82 | 43.40 | 41.75 | p = 0.001 *, η2 = 0.55. |
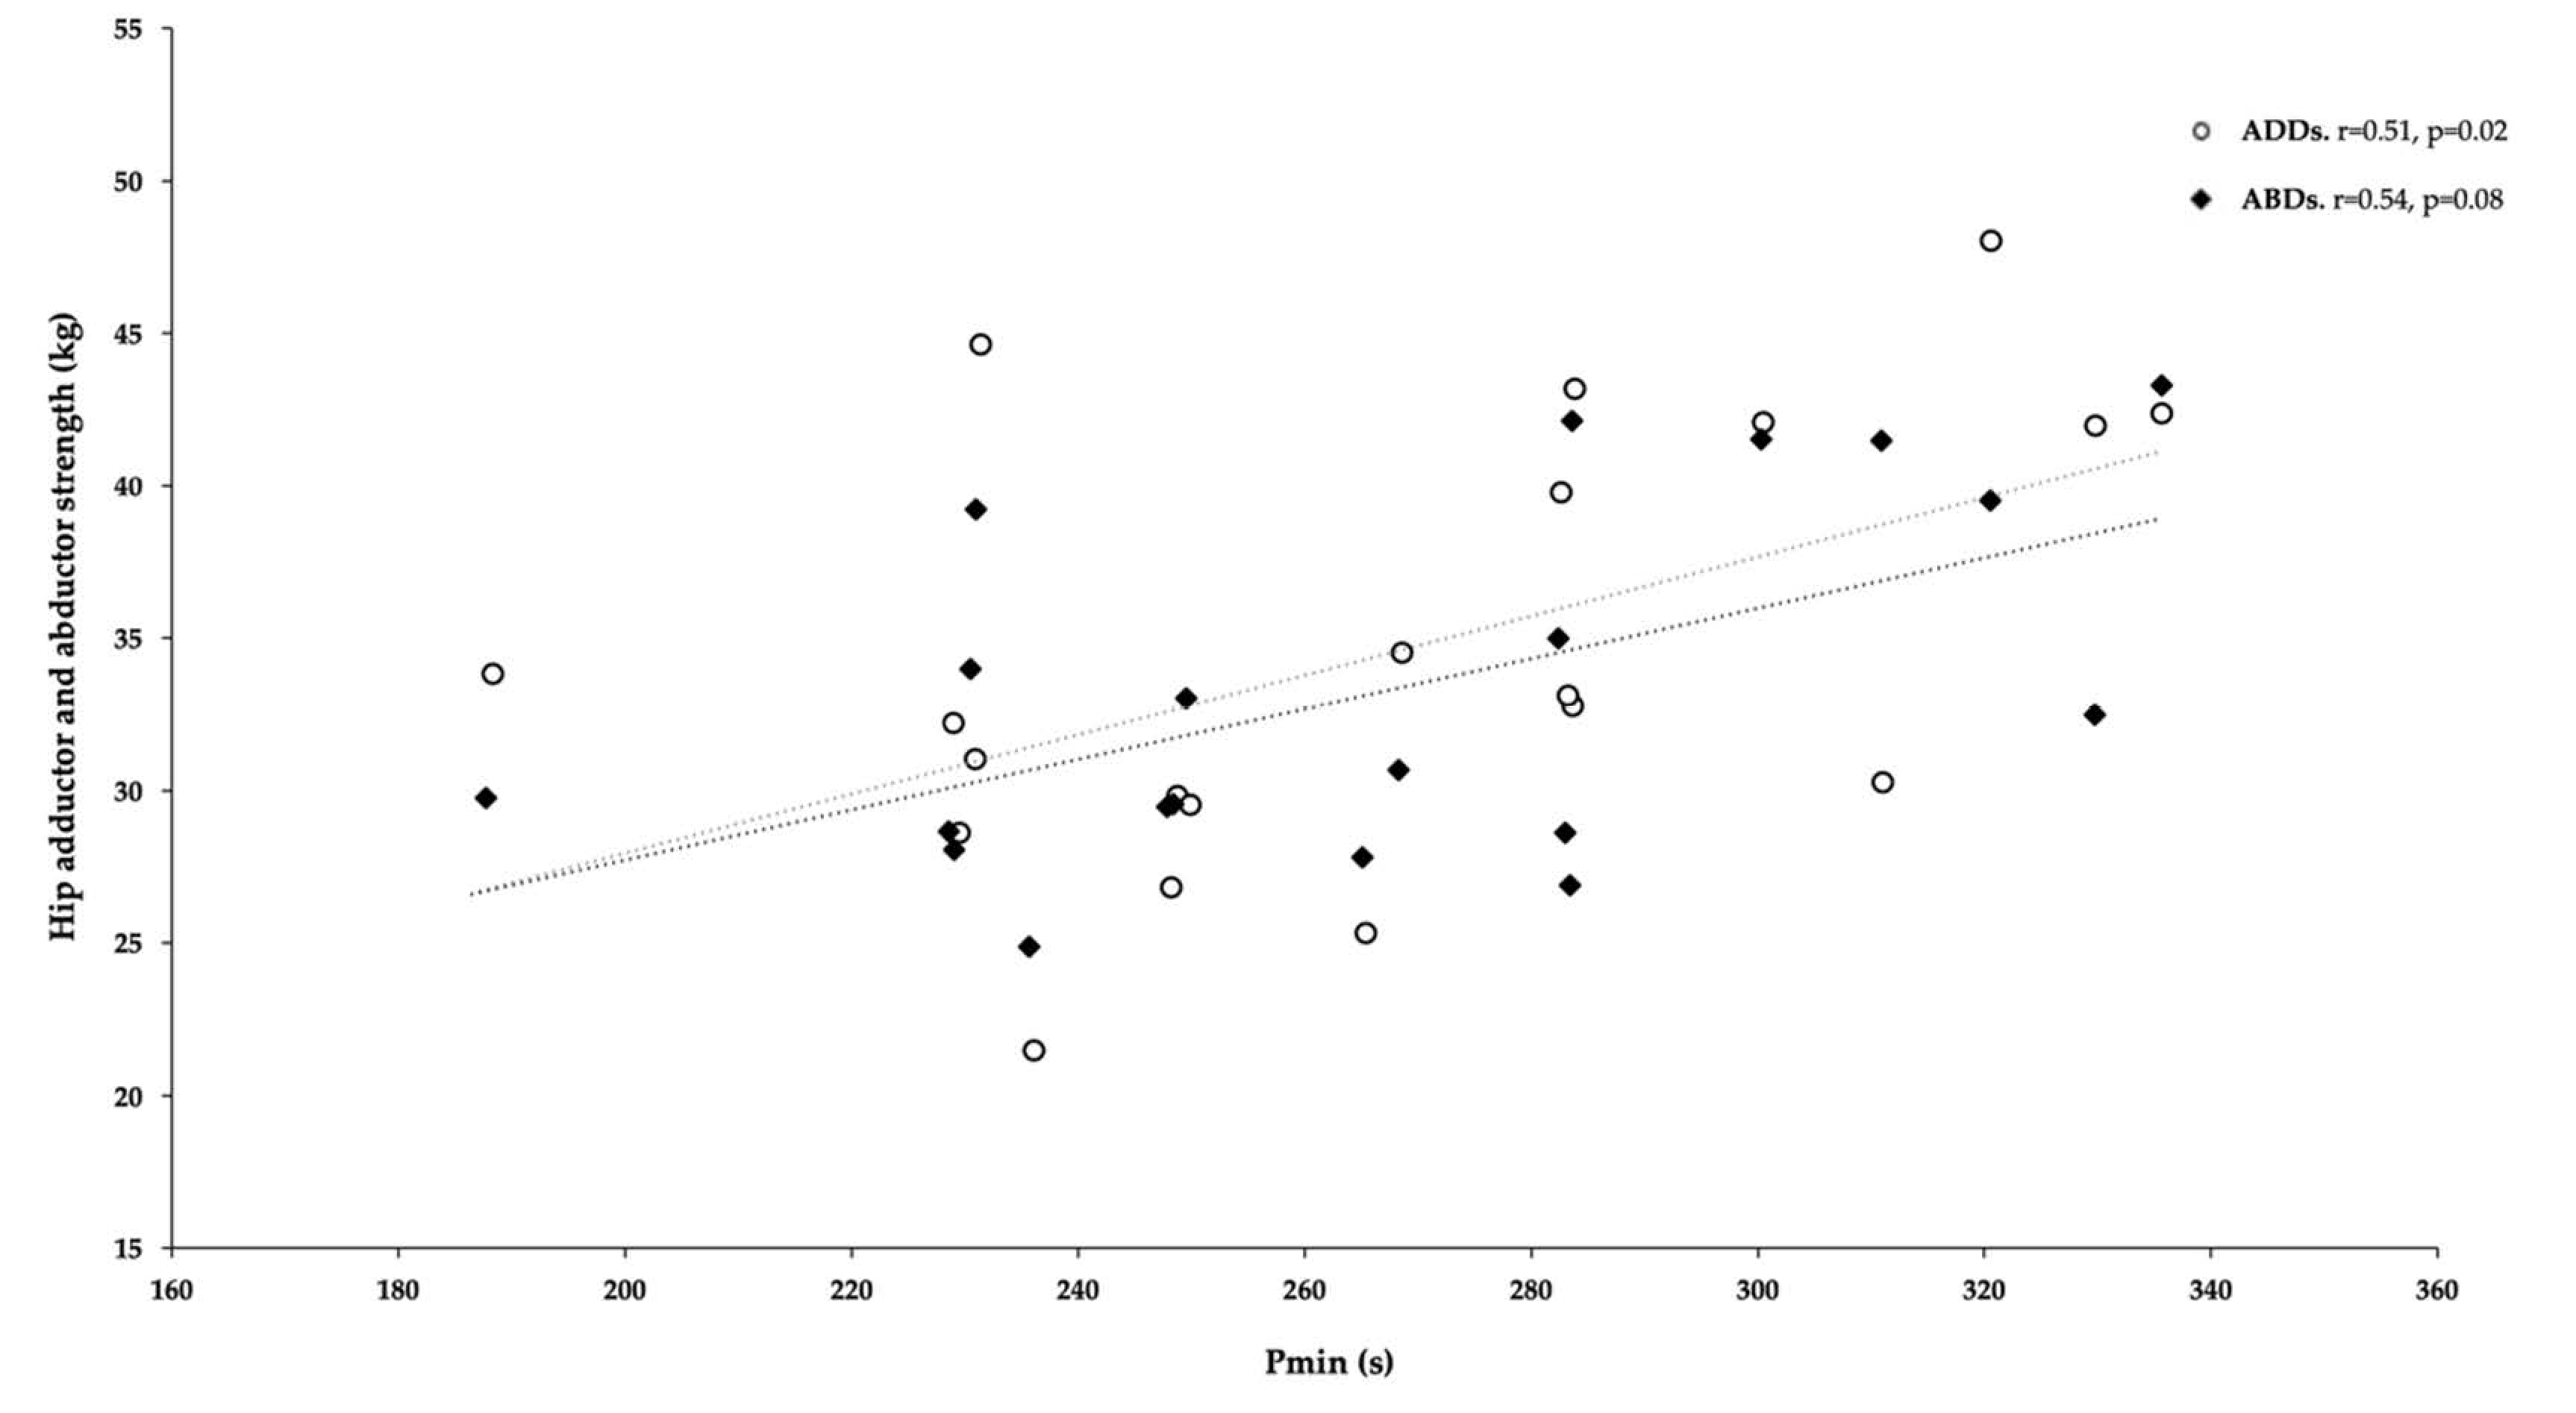
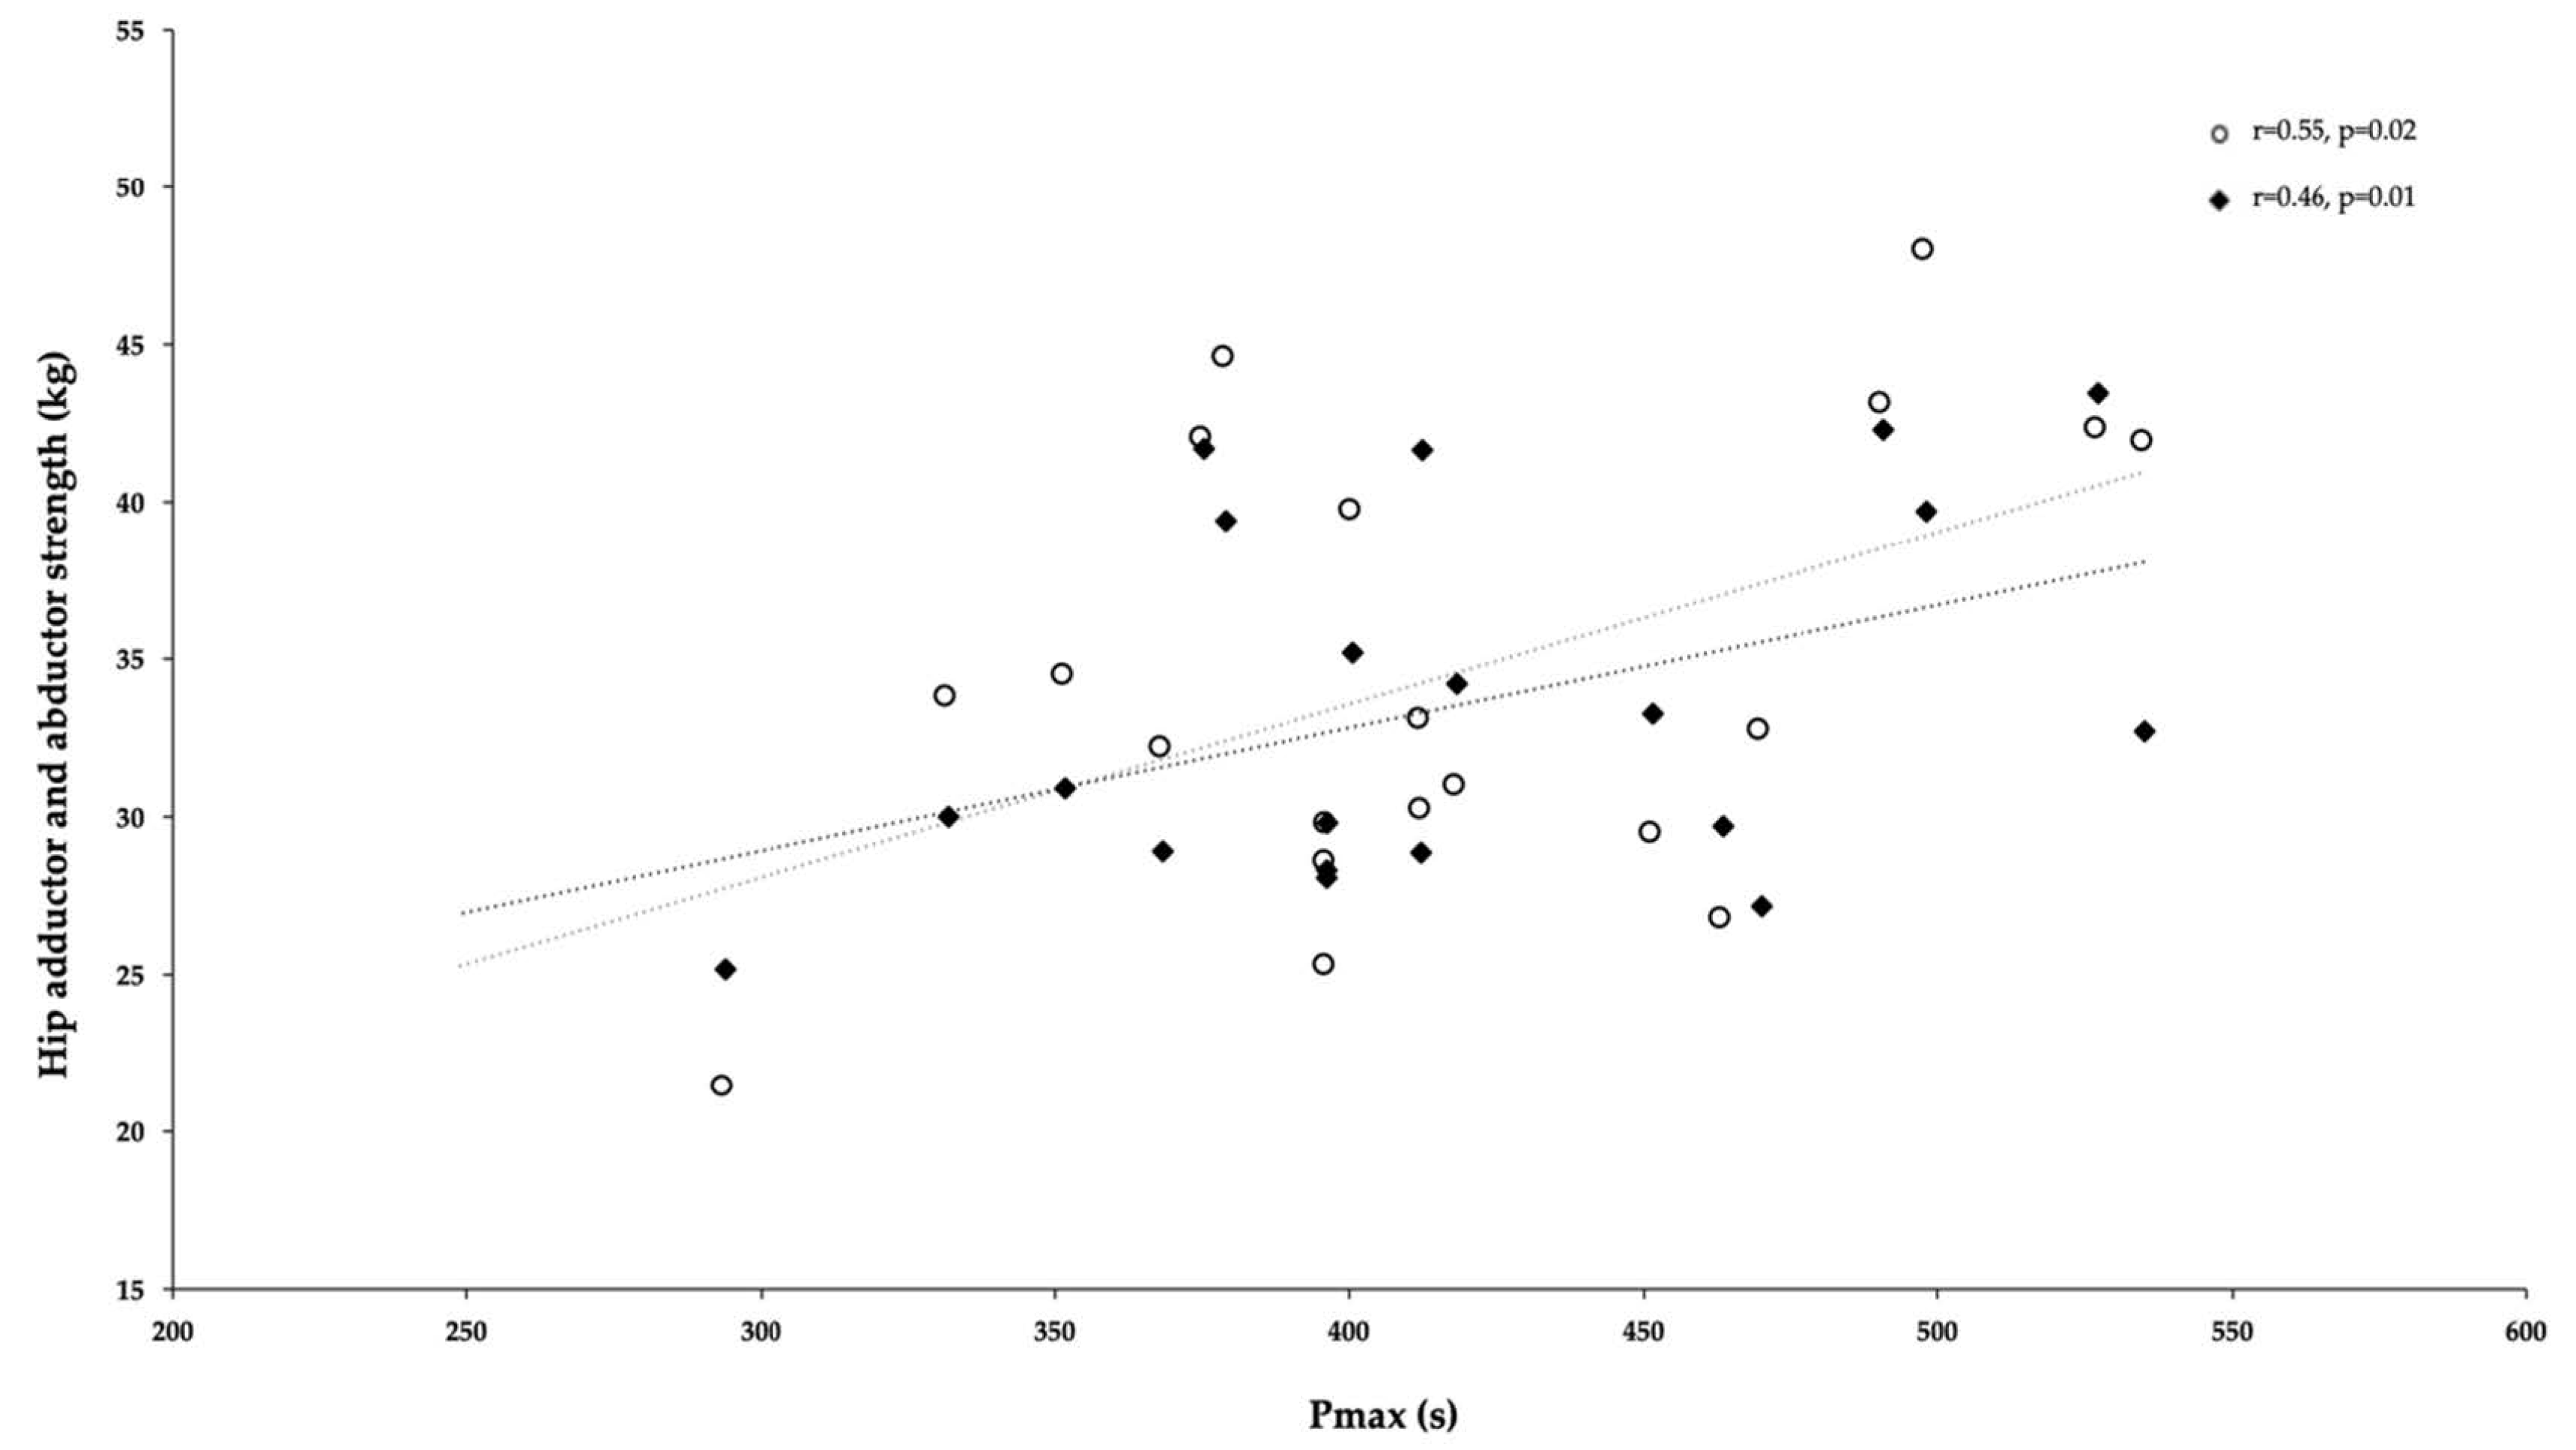
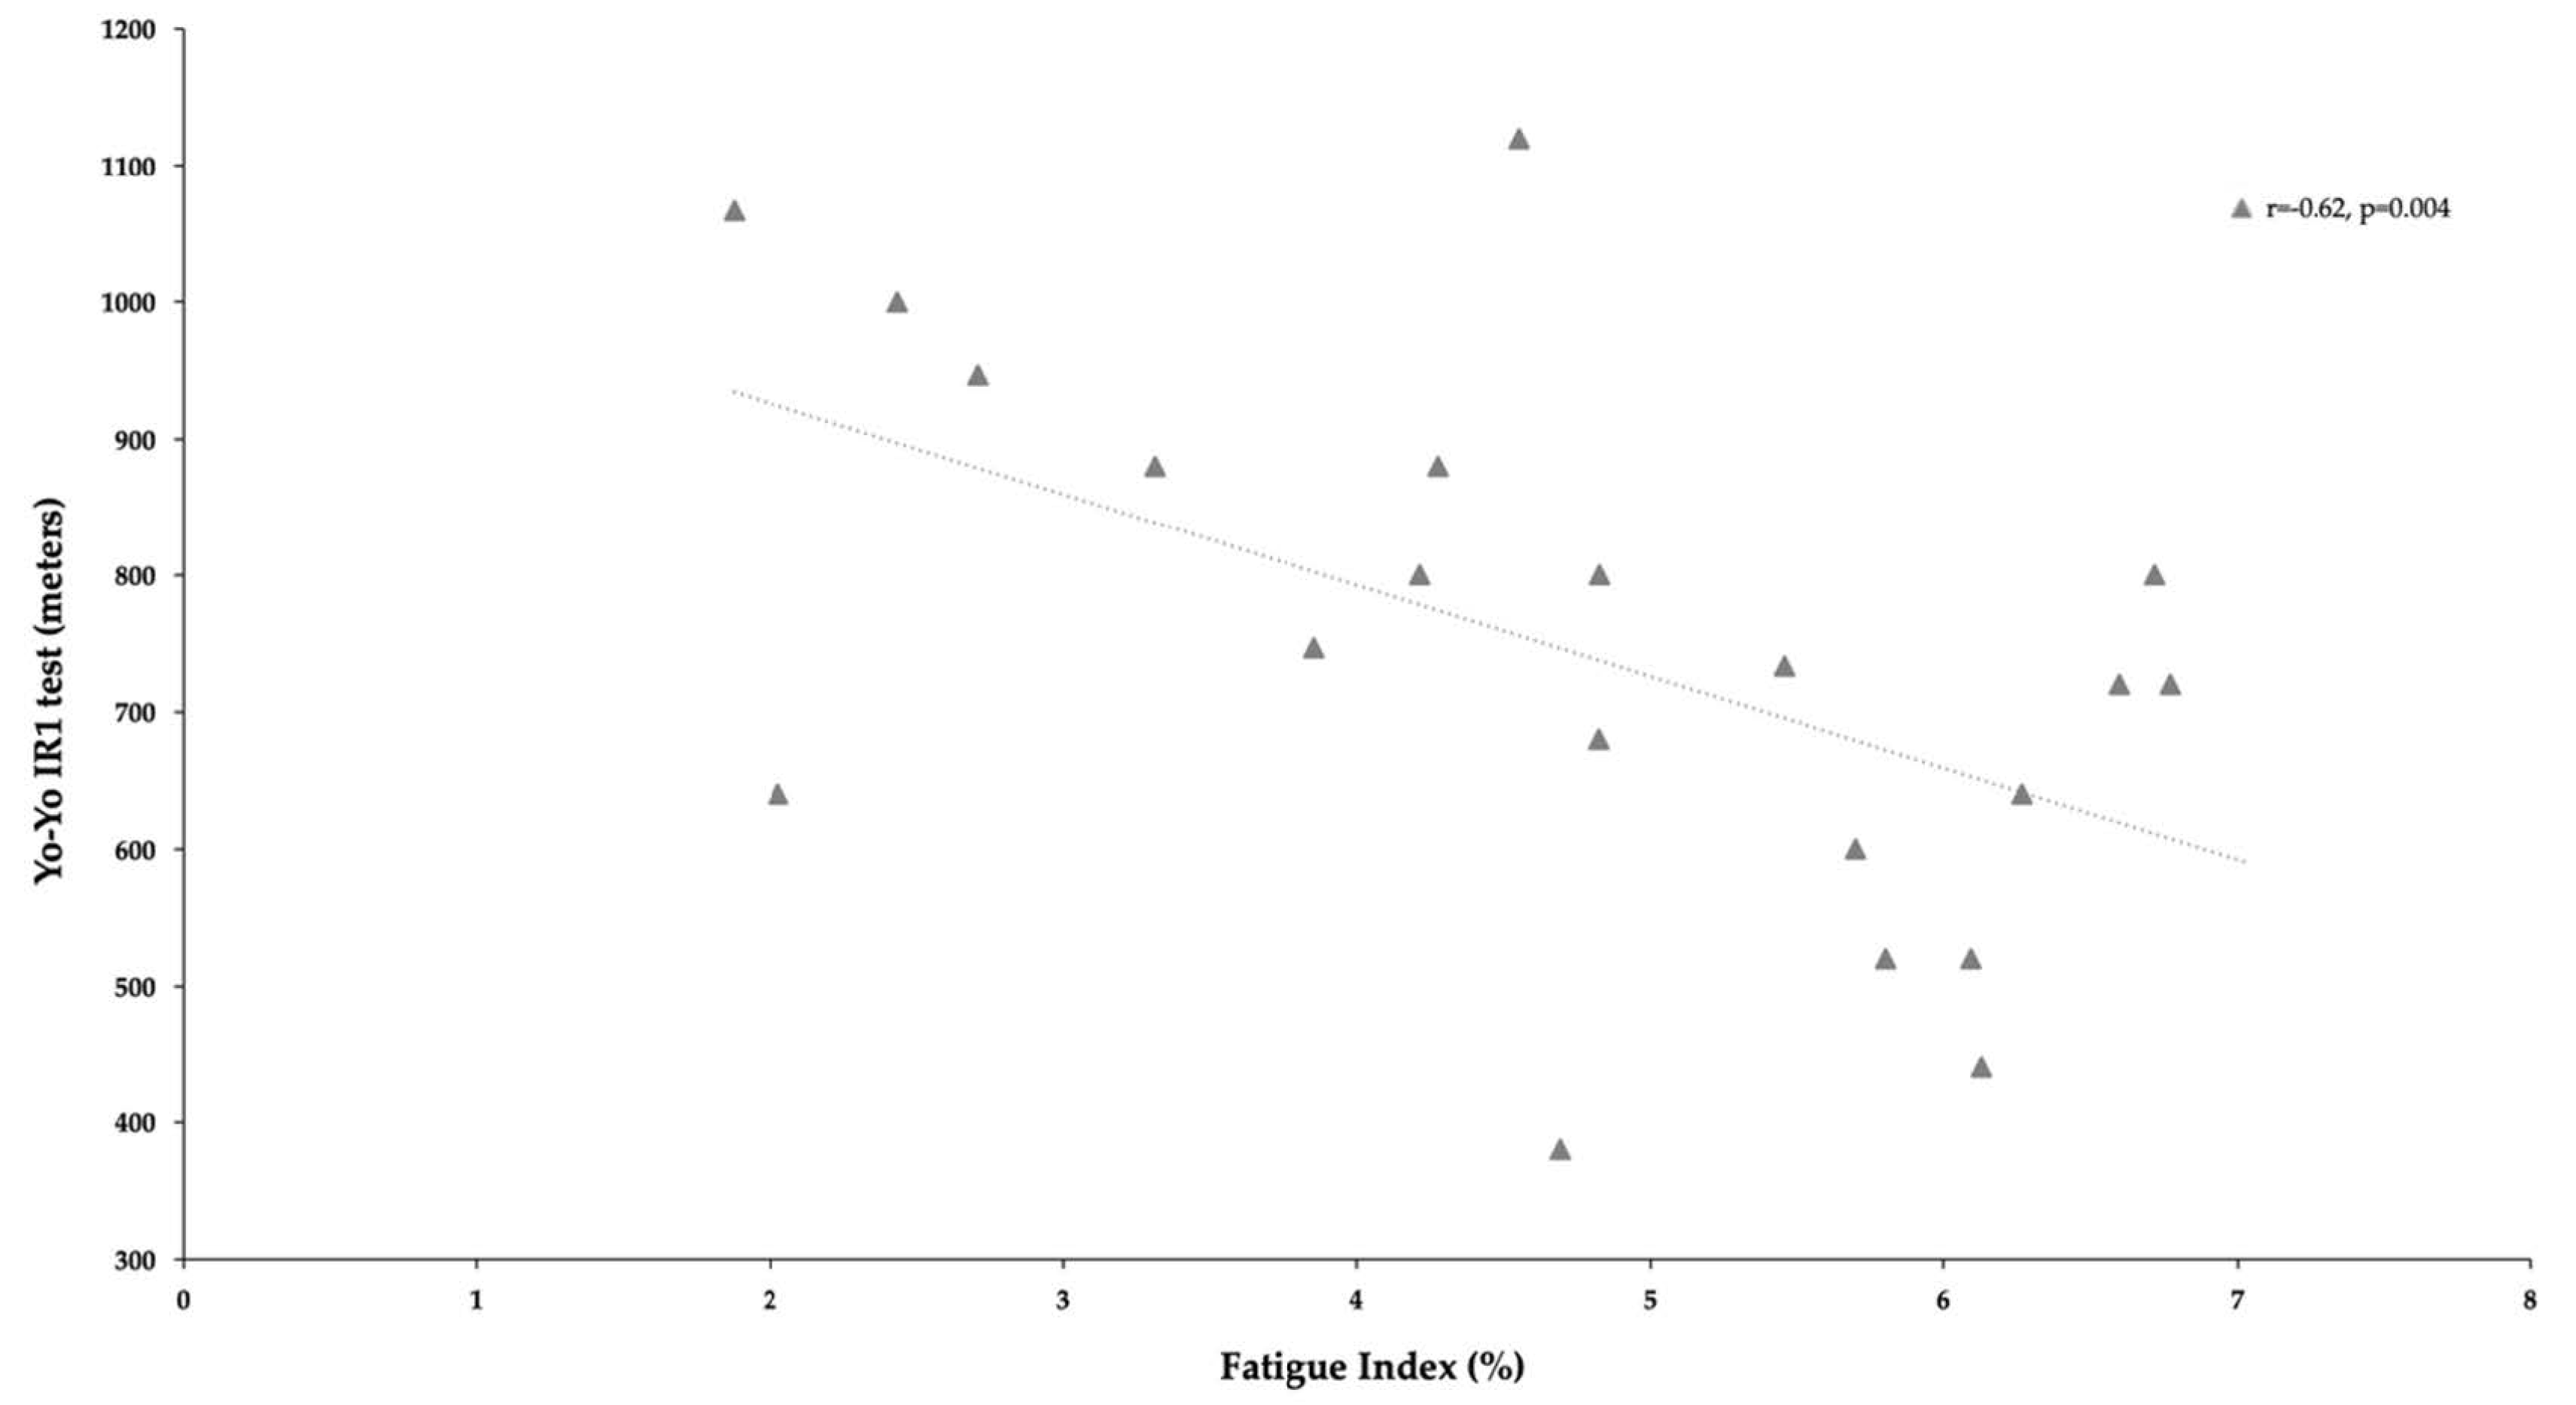
| RSA Indices | ADDs (kg) | ABDs (kg) | SJ (cm) | CMJ (cm) | 10m (s) | 30m (s) | COD (s) | YYIR1 (m) |
|---|---|---|---|---|---|---|---|---|
| Pmin (s) | r = 0.51 p = 0.02 ** | r = 0.54 p = 0.01 ** | r = 0.13 p = 0.58 | r = 0.04 p = 0.84 | R = 0.10 p = 0.67 | r = 0.09 p = 0.70 | r = −0.00 p = 0.99 | r = −0.08 p = 0.72 |
| Pmax (s) | r = 0.55 p = 0.01 ** | r = 0.46 p = 0.04 * | r = 0.19 p = 0.41 | r = 0.05 p = 0.81 | r = −0.10 p = 0.65 | r = −0.24 p = 0.30 | r = −0.12 p = 0.61 | r = −0.38 p = 0.10 |
| FI (%) | r = 0.33 p = 0.16 | r = 0.18 p = 0.45 | r = 0.16 p = 0.50 | r = 0.03 p = 0.87 | r = −0.24 p = 0.30 | r = −0.43 p = 0.06 | r = −0.17 p = 0.47 | r = −0.62 p = 0.04 * |
| RSA Indices | R | R2 | Adjusted R2 | F | P | SE | |
|---|---|---|---|---|---|---|---|
| Pmin (s) | ADDS | 0.53 | 0.27 | 0.23 | 6.86 | 0.01 | 34.25 |
| ABDs | 0.55 | 0.30 | 0.26 | 8.01 | 0.01 | 33.49 | |
| Pmax (s) | ADDs | 0.48 | 0.23 | 0.19 | 5.52 | 0.03 | 57.60 |
| FI (%) | YYIR1 | −0.53 | 0.28 | 0.24 | 7.39 | 0.01 | 1.35 |
Publisher’s Note: MDPI stays neutral with regard to jurisdictional claims in published maps and institutional affiliations. |
© 2021 by the authors. Licensee MDPI, Basel, Switzerland. This article is an open access article distributed under the terms and conditions of the Creative Commons Attribution (CC BY) license (https://creativecommons.org/licenses/by/4.0/).
Share and Cite
Gonçalves, L.; Clemente, F.M.; Barrera, J.I.; Sarmento, H.; González-Fernández, F.T.; Rico-González, M.; Carral, J.M.C. Exploring the Determinants of Repeated-Sprint Ability in Adult Women Soccer Players. Int. J. Environ. Res. Public Health 2021, 18, 4595. https://doi.org/10.3390/ijerph18094595
Gonçalves L, Clemente FM, Barrera JI, Sarmento H, González-Fernández FT, Rico-González M, Carral JMC. Exploring the Determinants of Repeated-Sprint Ability in Adult Women Soccer Players. International Journal of Environmental Research and Public Health. 2021; 18(9):4595. https://doi.org/10.3390/ijerph18094595
Chicago/Turabian StyleGonçalves, Lillian, Filipe Manuel Clemente, Joel Ignacio Barrera, Hugo Sarmento, Francisco Tomás González-Fernández, Markel Rico-González, and José María Cancela Carral. 2021. "Exploring the Determinants of Repeated-Sprint Ability in Adult Women Soccer Players" International Journal of Environmental Research and Public Health 18, no. 9: 4595. https://doi.org/10.3390/ijerph18094595