
Hydrogeochemical Characterization and Identification of Factors Influencing Groundwater Quality in Coastal Aquifers, Case: La Yarada, Tacna, Peru

 ,
,  ,
,  , and
, and
Abstract
:1. Introduction
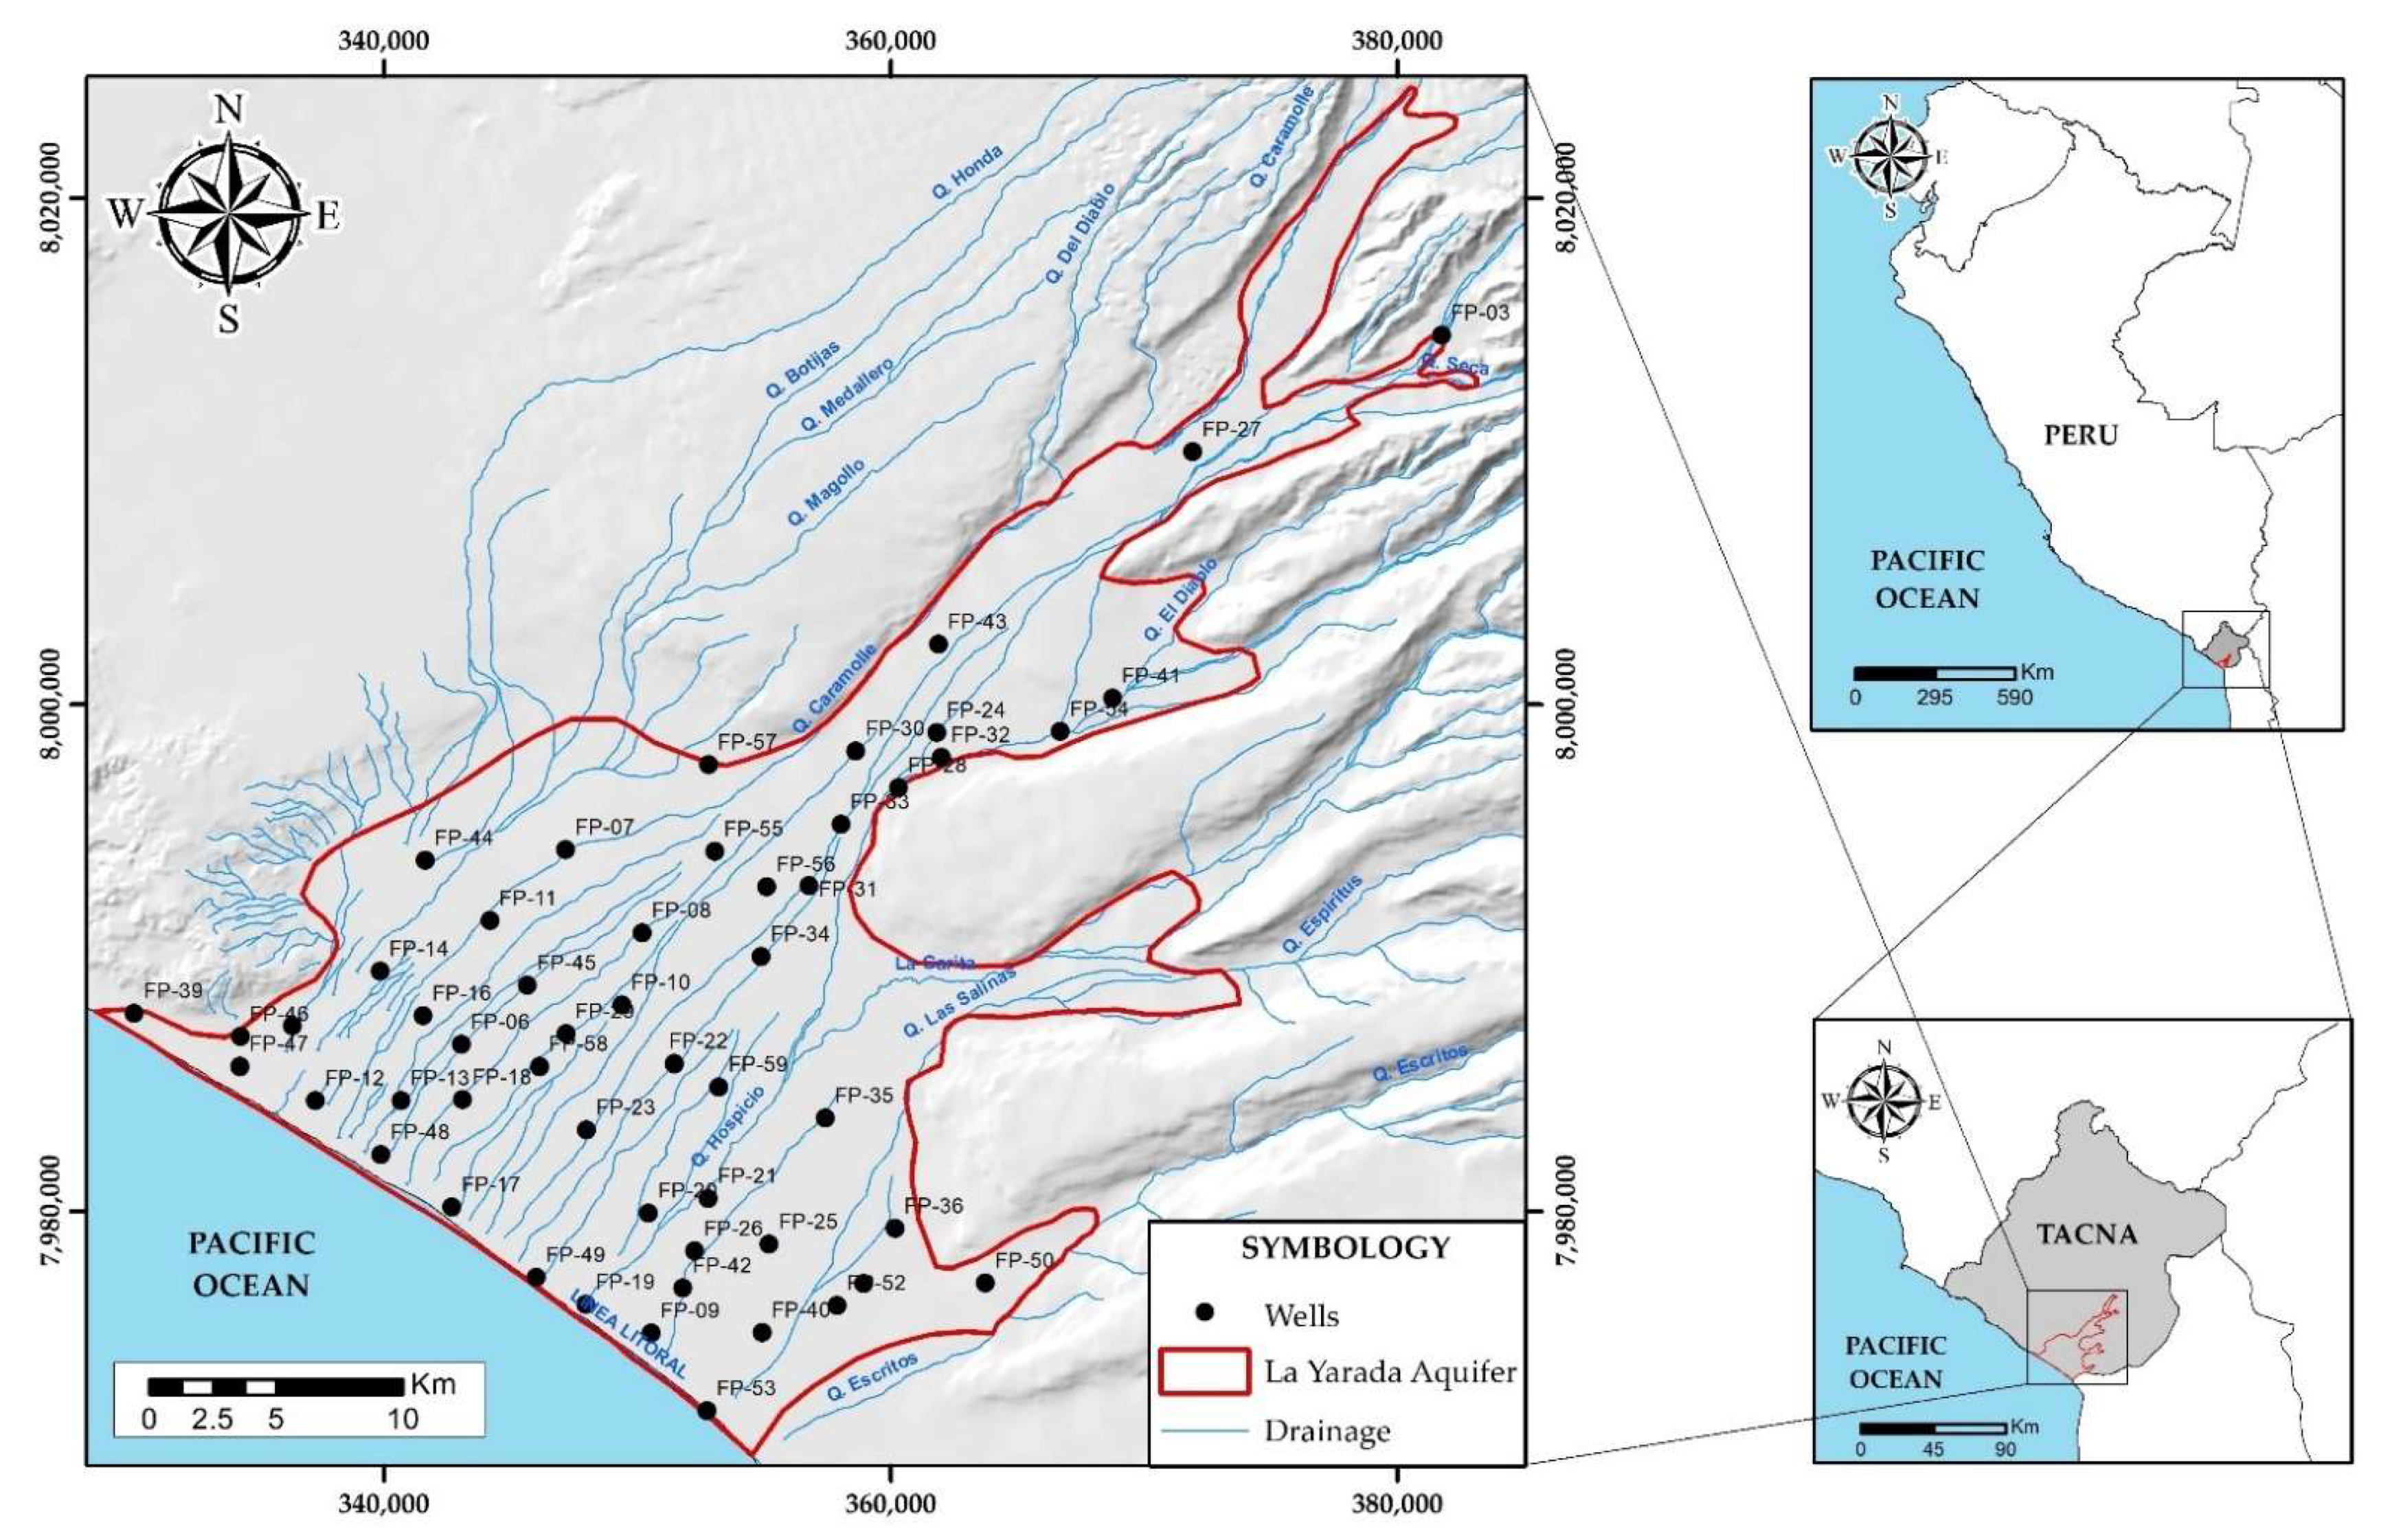
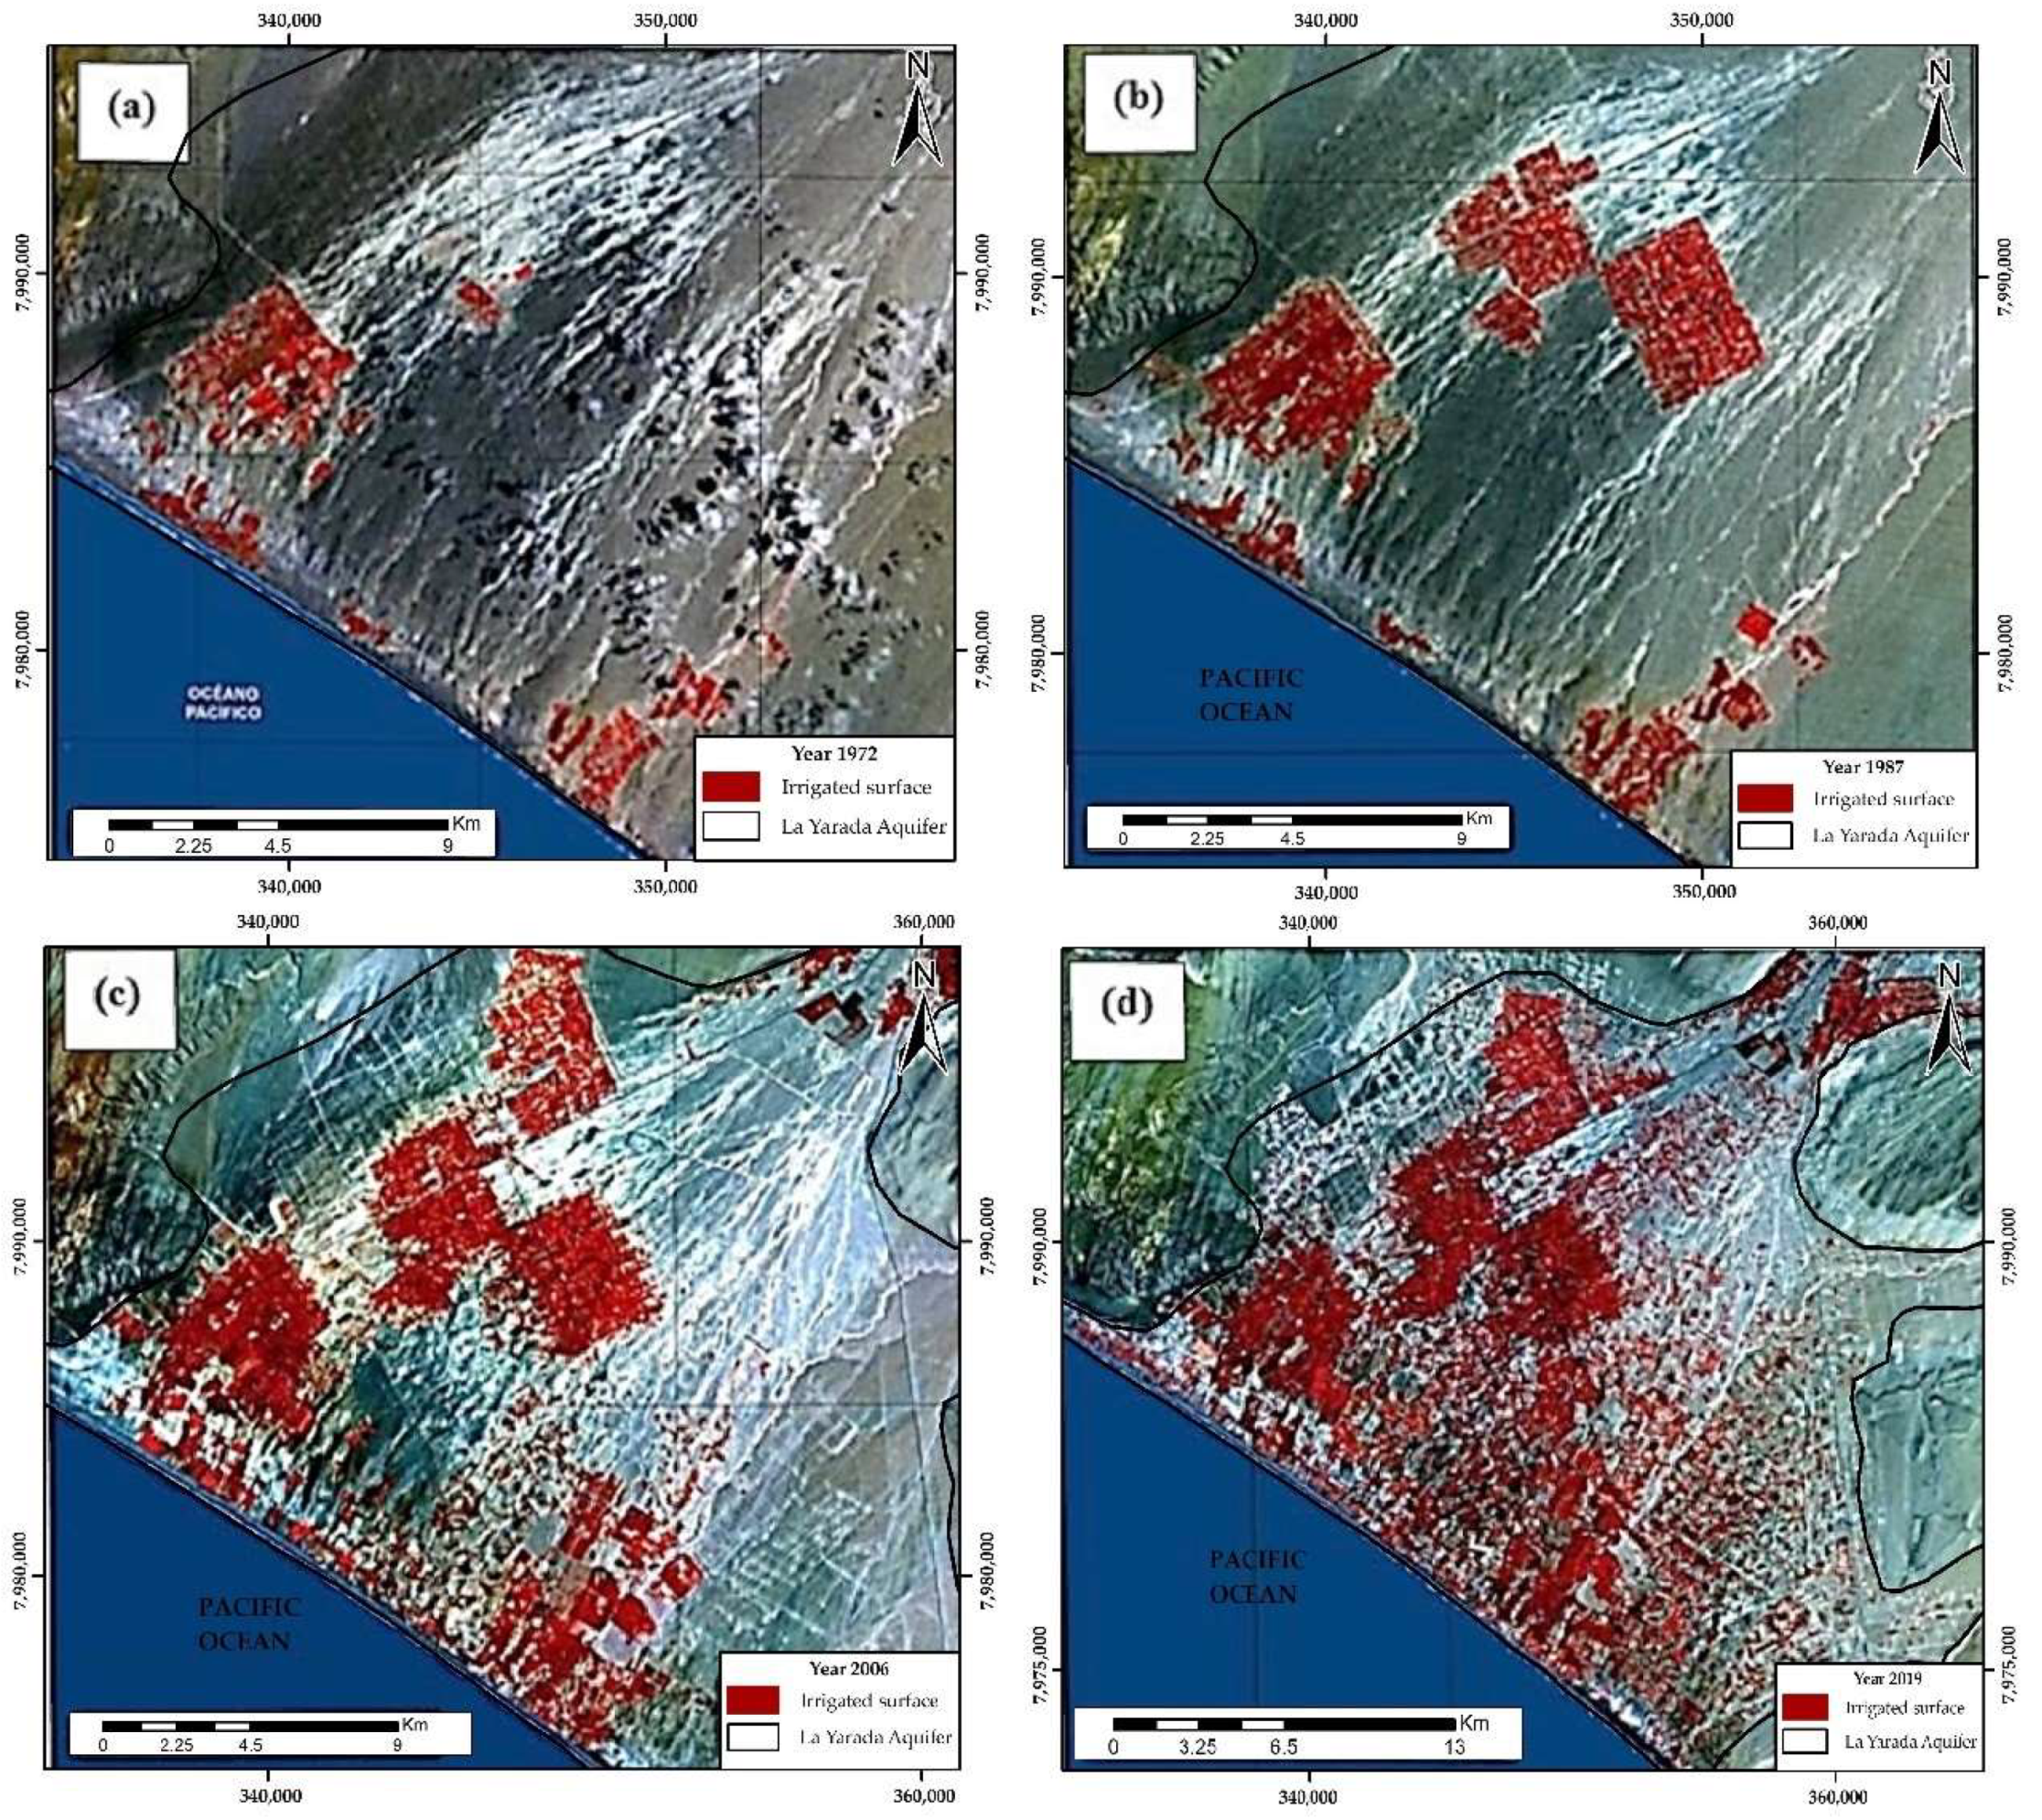
2. Study Area
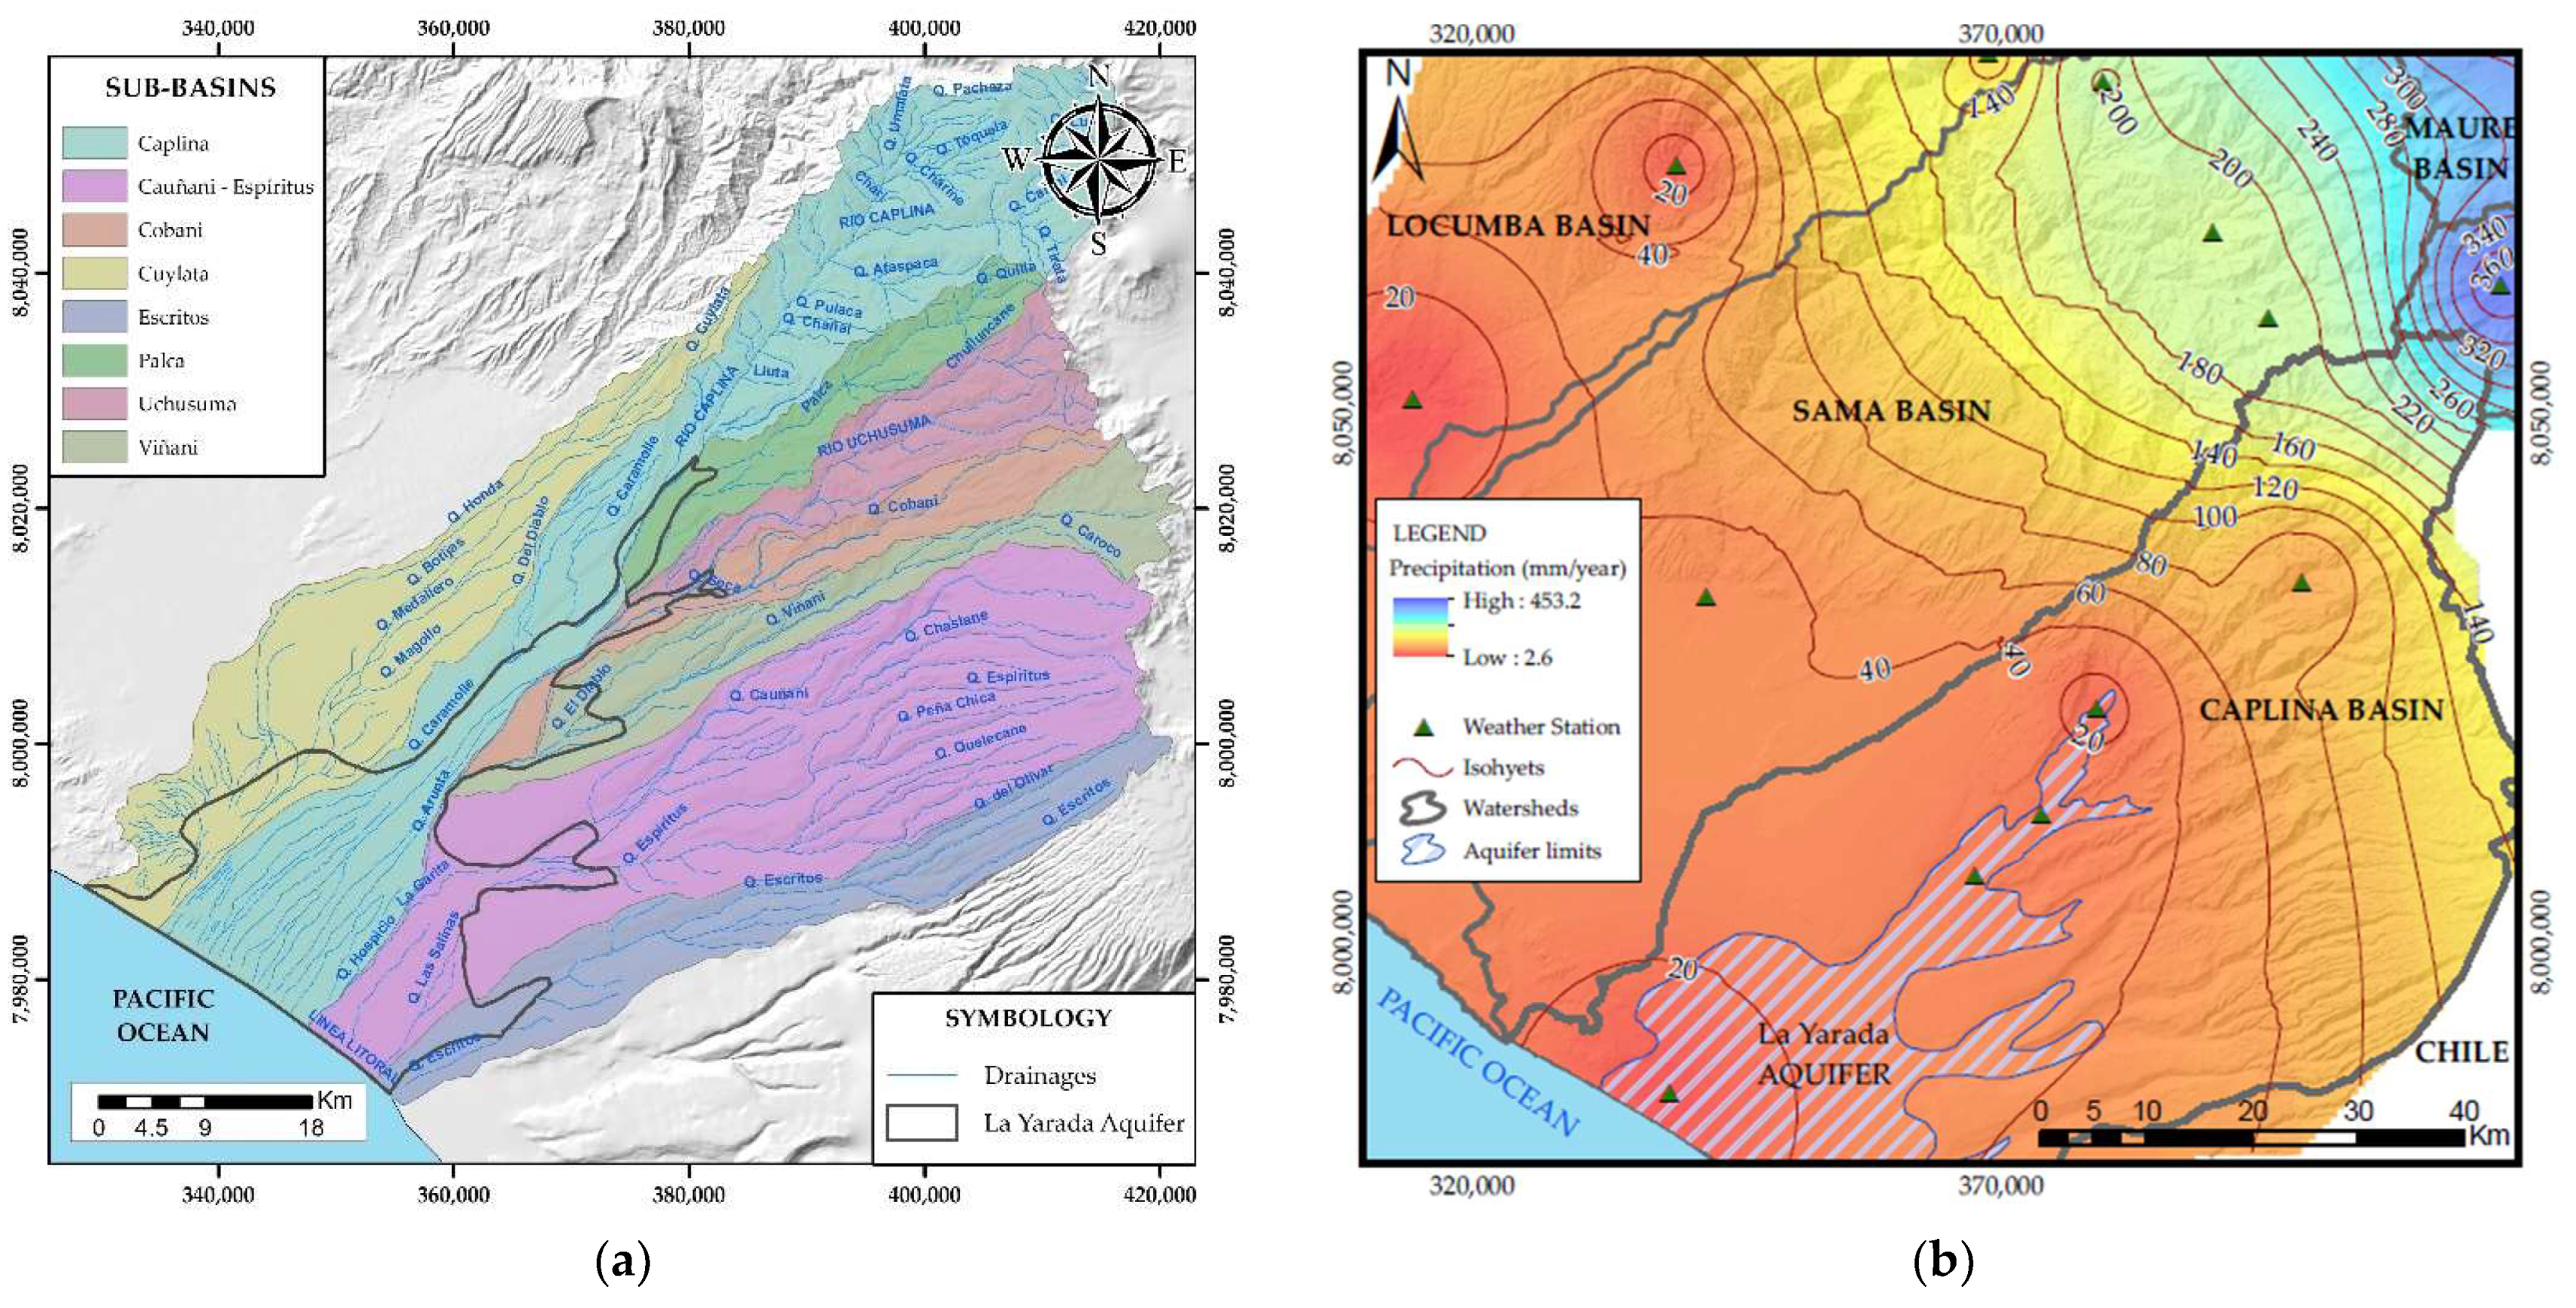
2.1. Climate and Vegetation
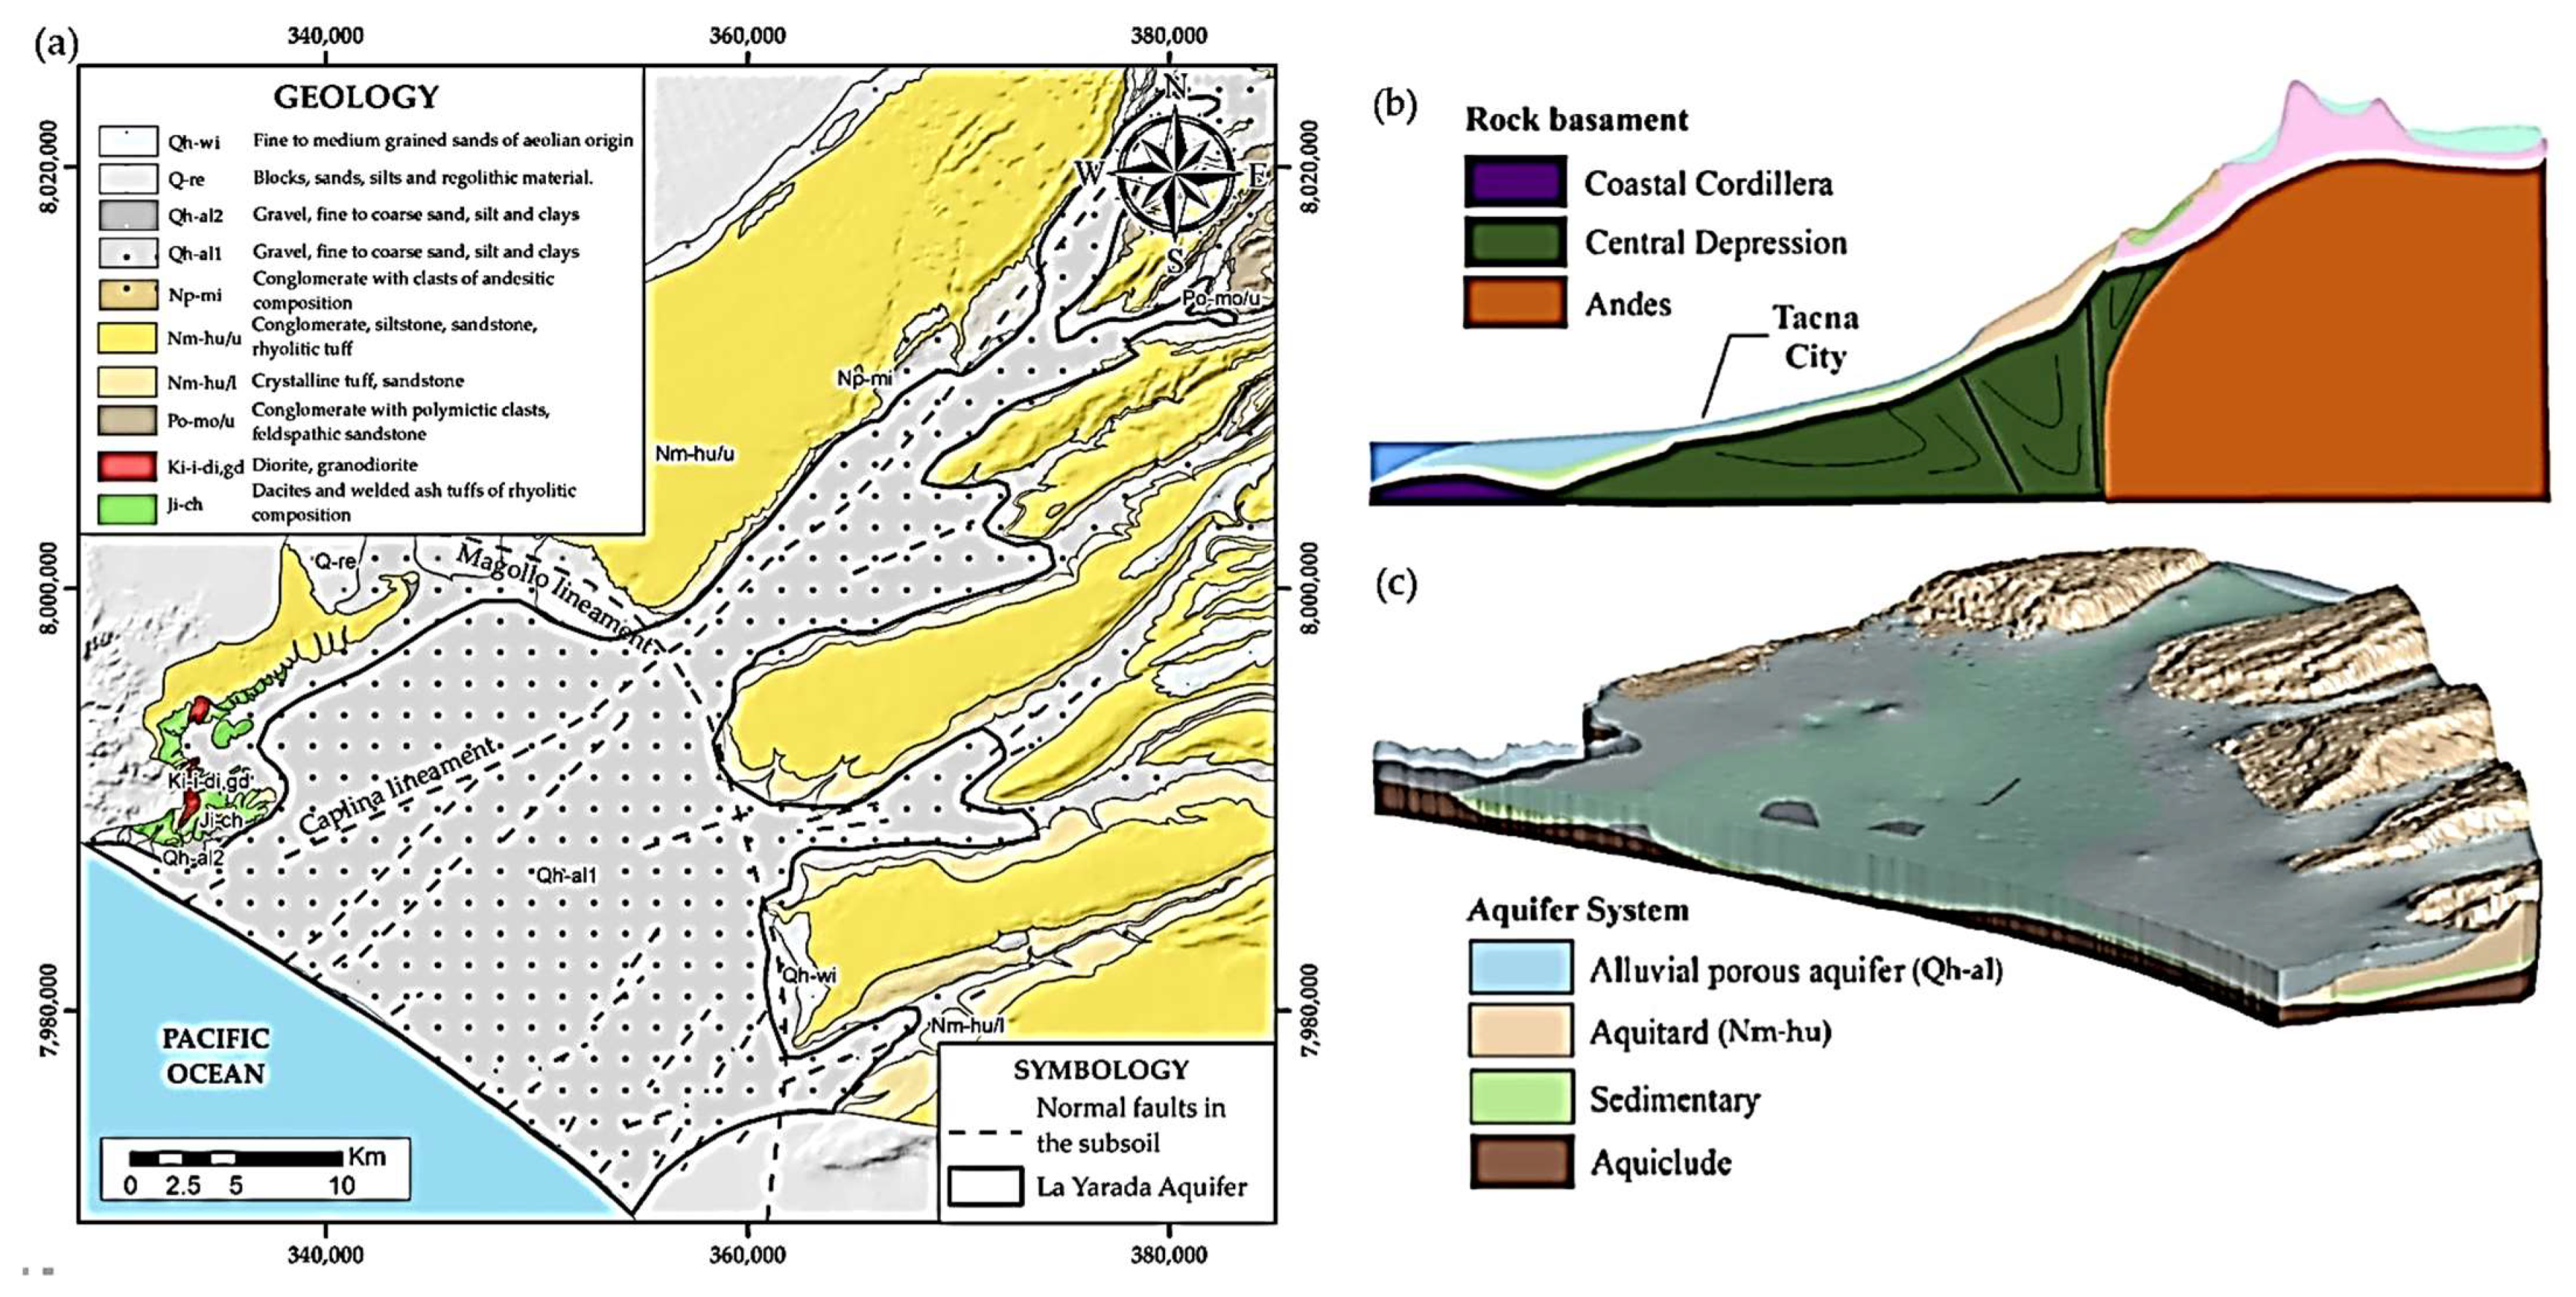
2.2. Hydrogeological Settings
2.3. Hydrology
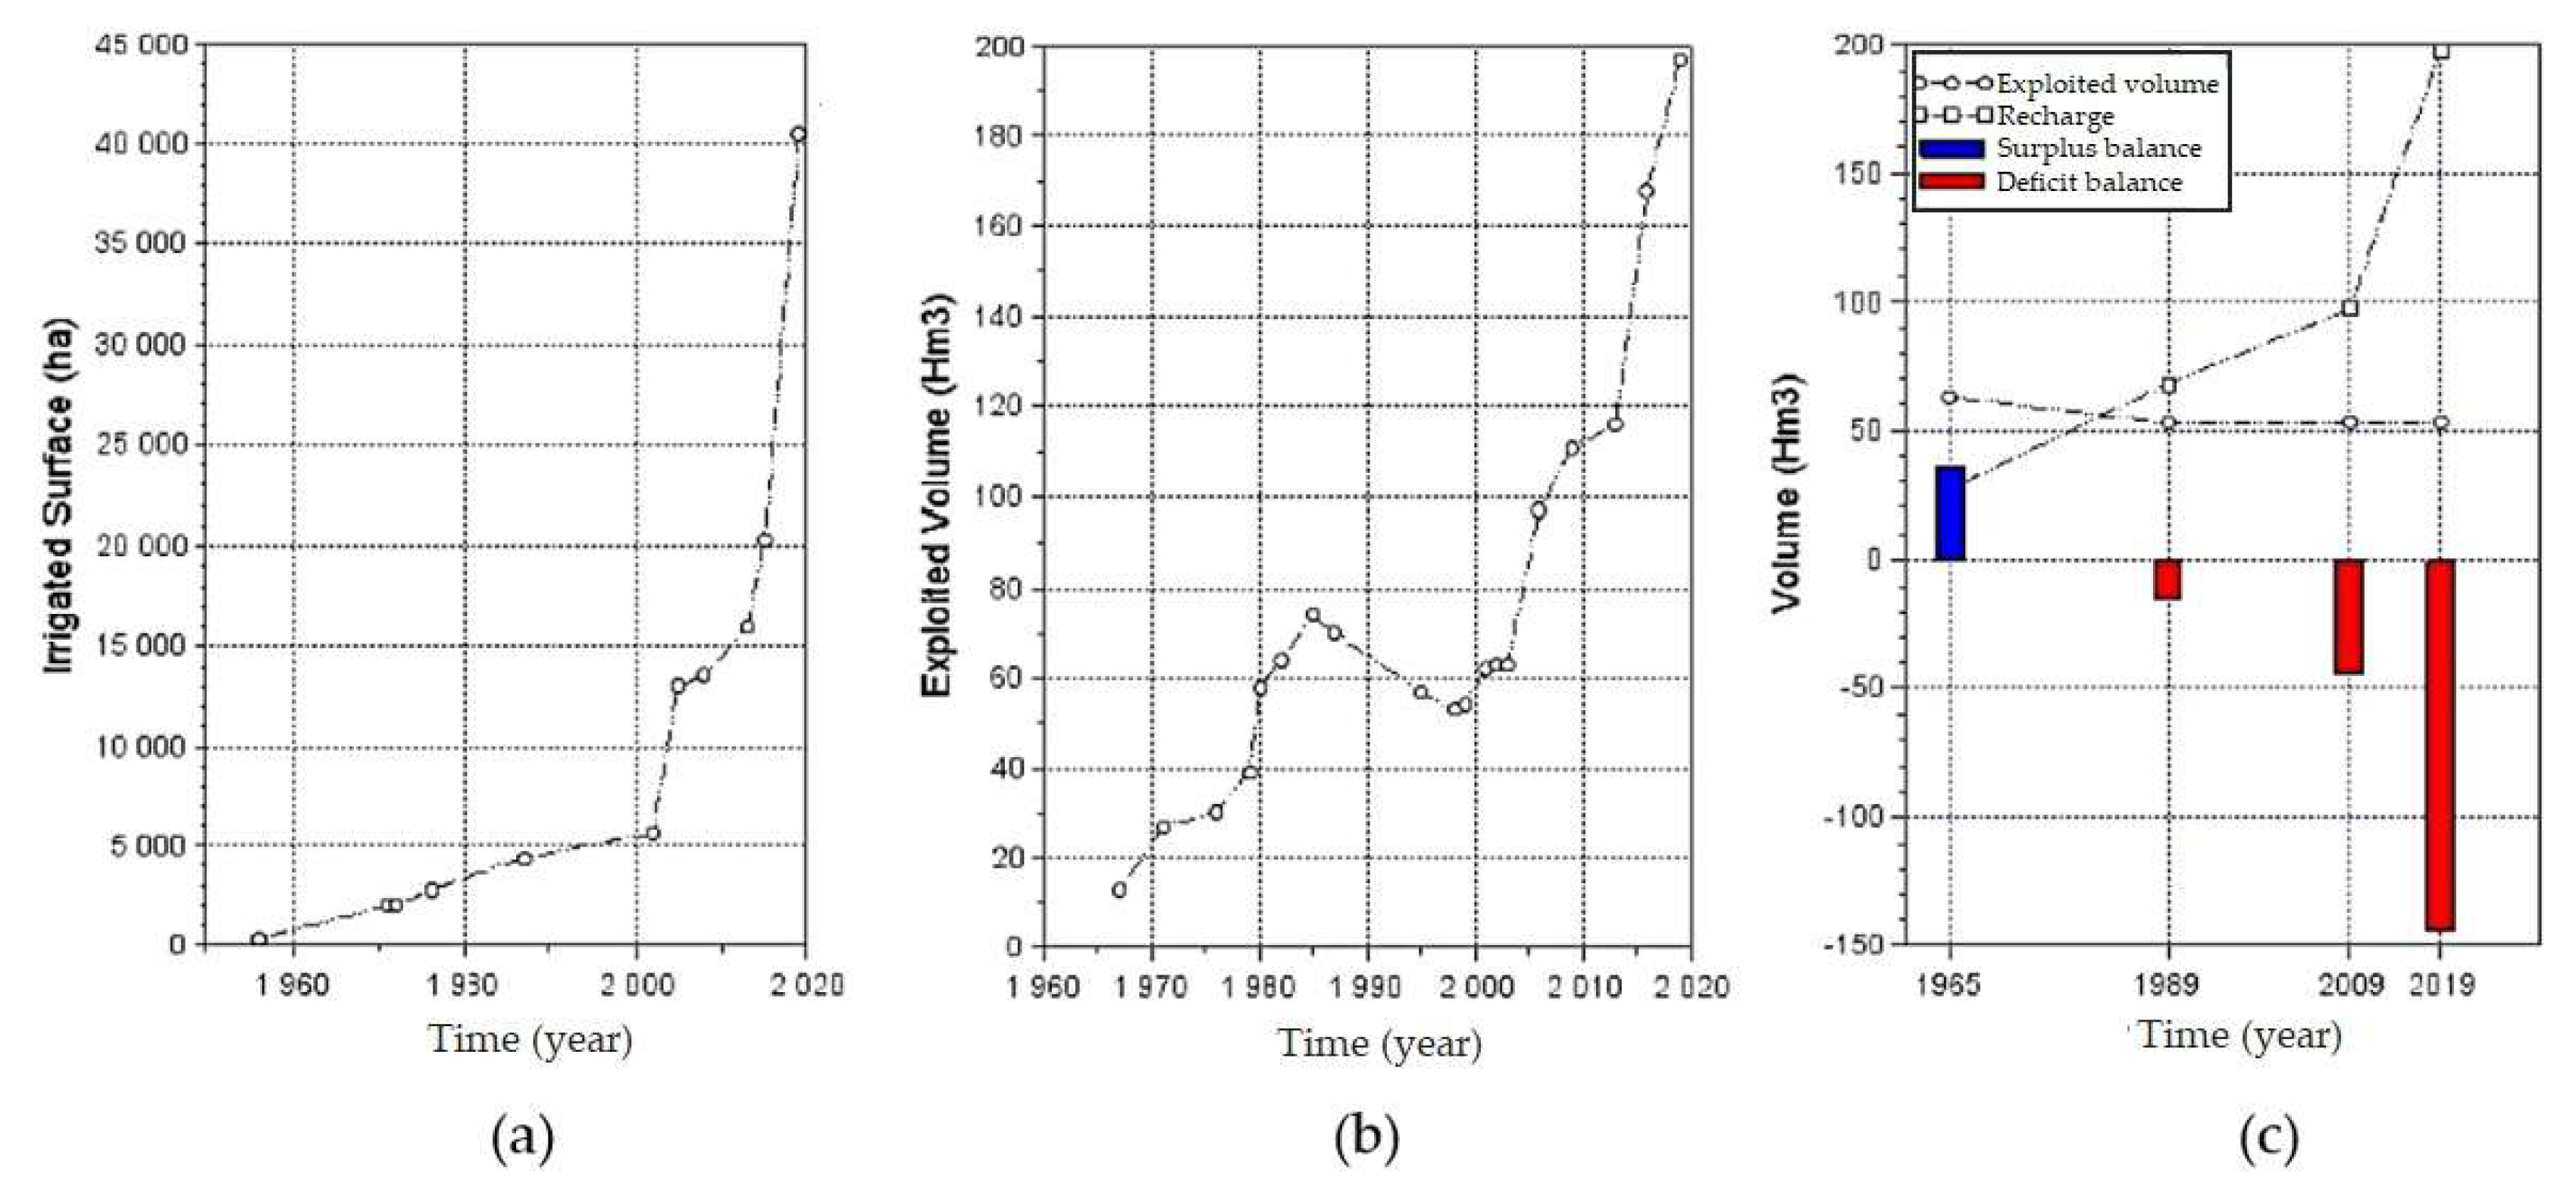
2.4. Water Balance
3. Materials and Methods
3.1. Monitoring Network and Sampling
3.2. Data Quality
3.2.1. Quality Analysis of Hydrochemical Data
3.2.2. Statistical Preparation
3.3. Multivariate Statistical Analysis
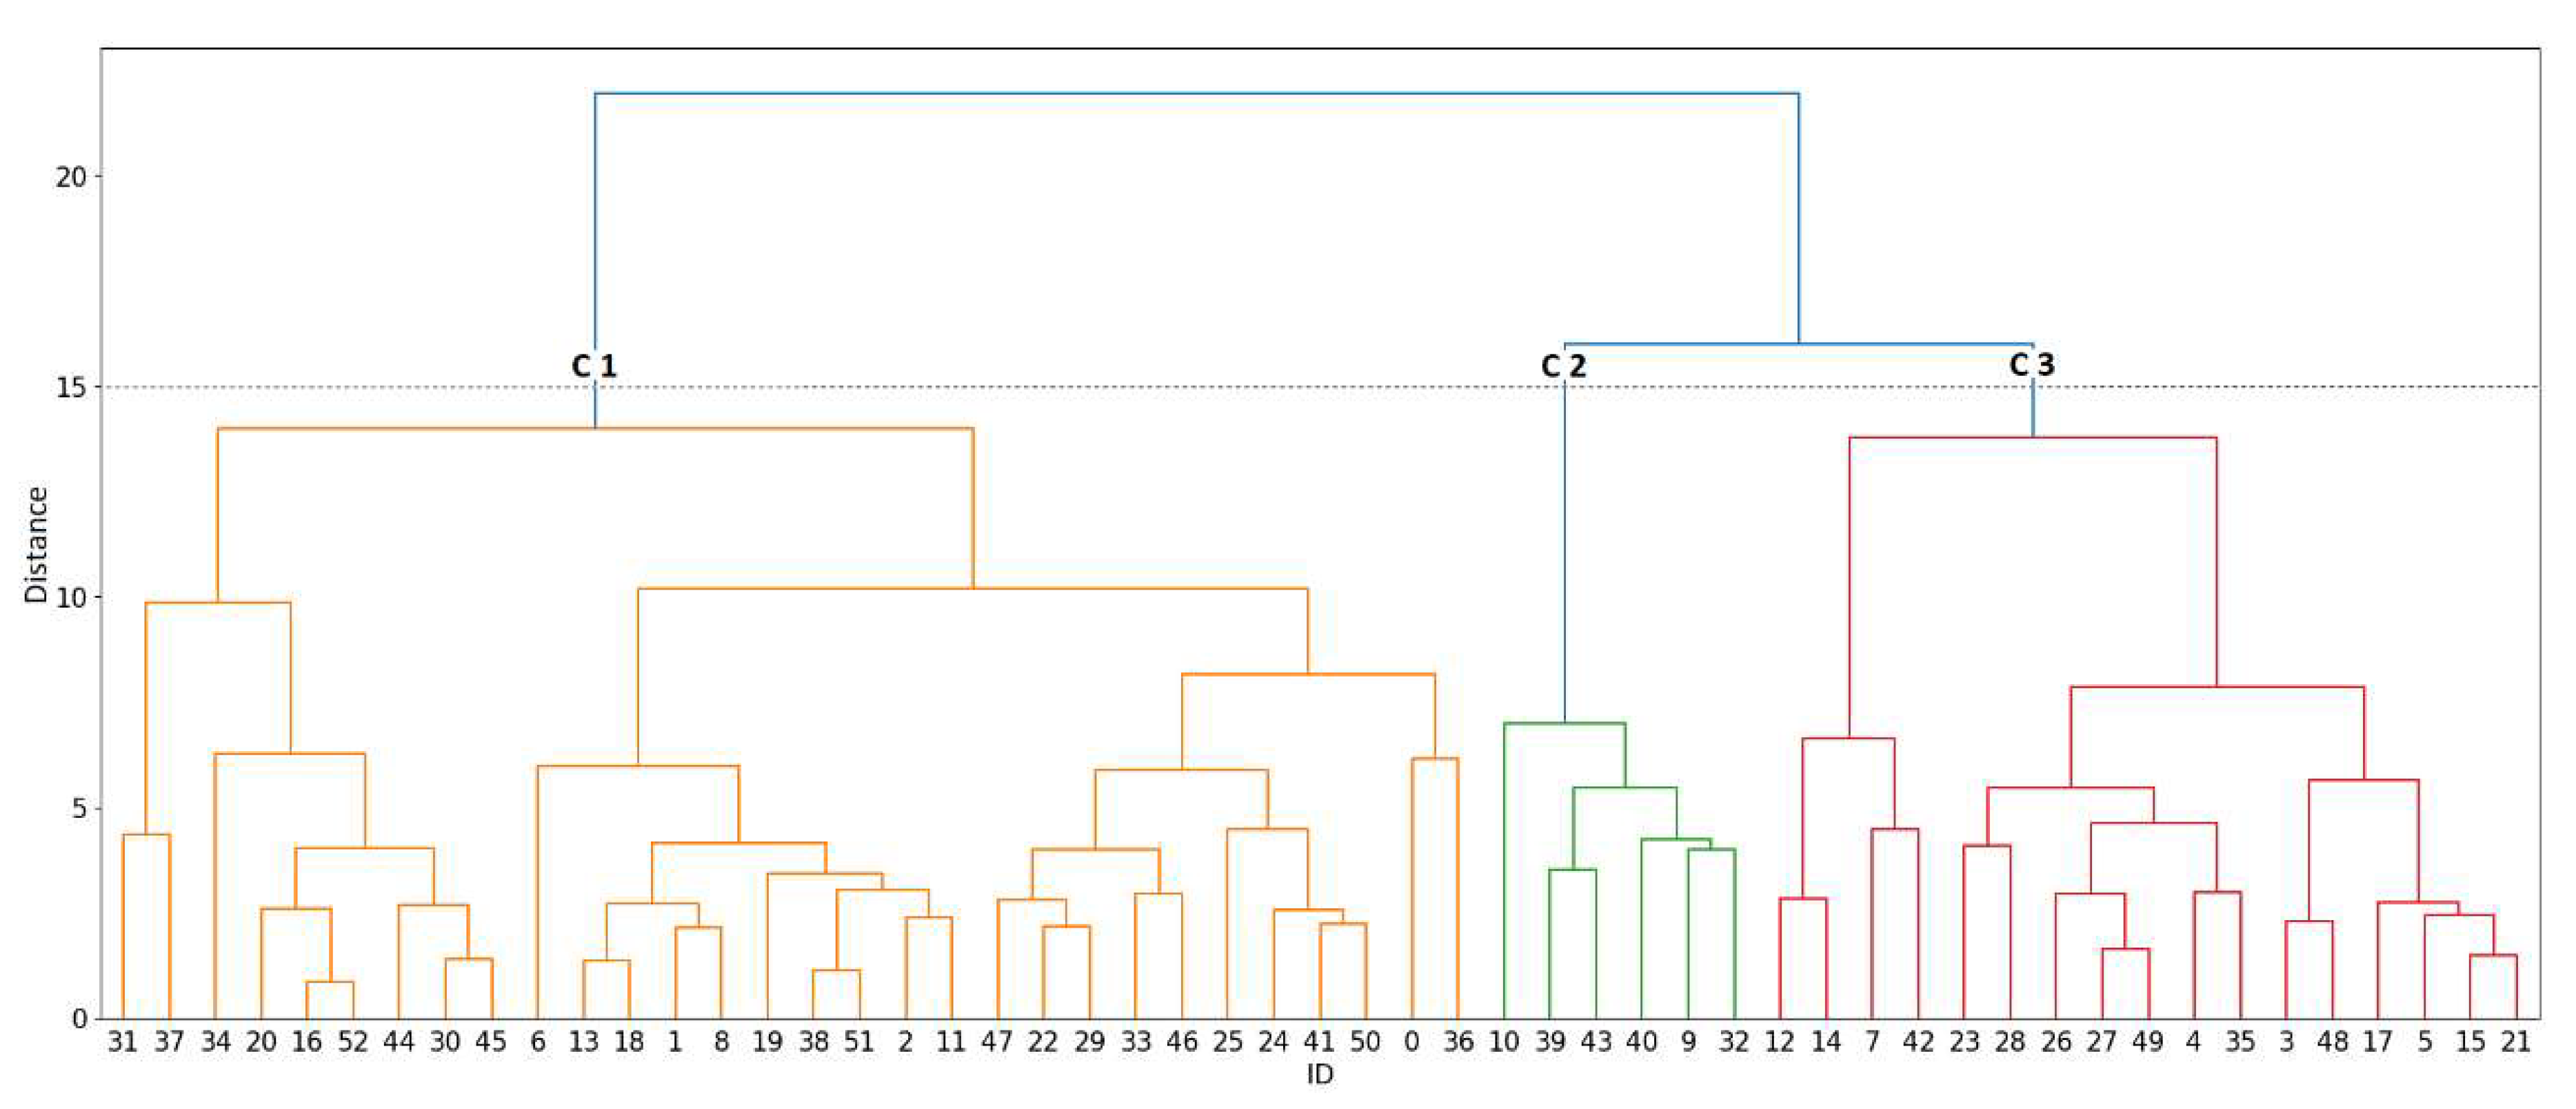
3.3.1. Cluster Analysis
3.3.2. Factor Analysis
3.4. Water Quality
4. Results and Discussion
4.1. Hydrogeochemical Grouping
Ionic Relations
4.2. Hydrochemical Associations
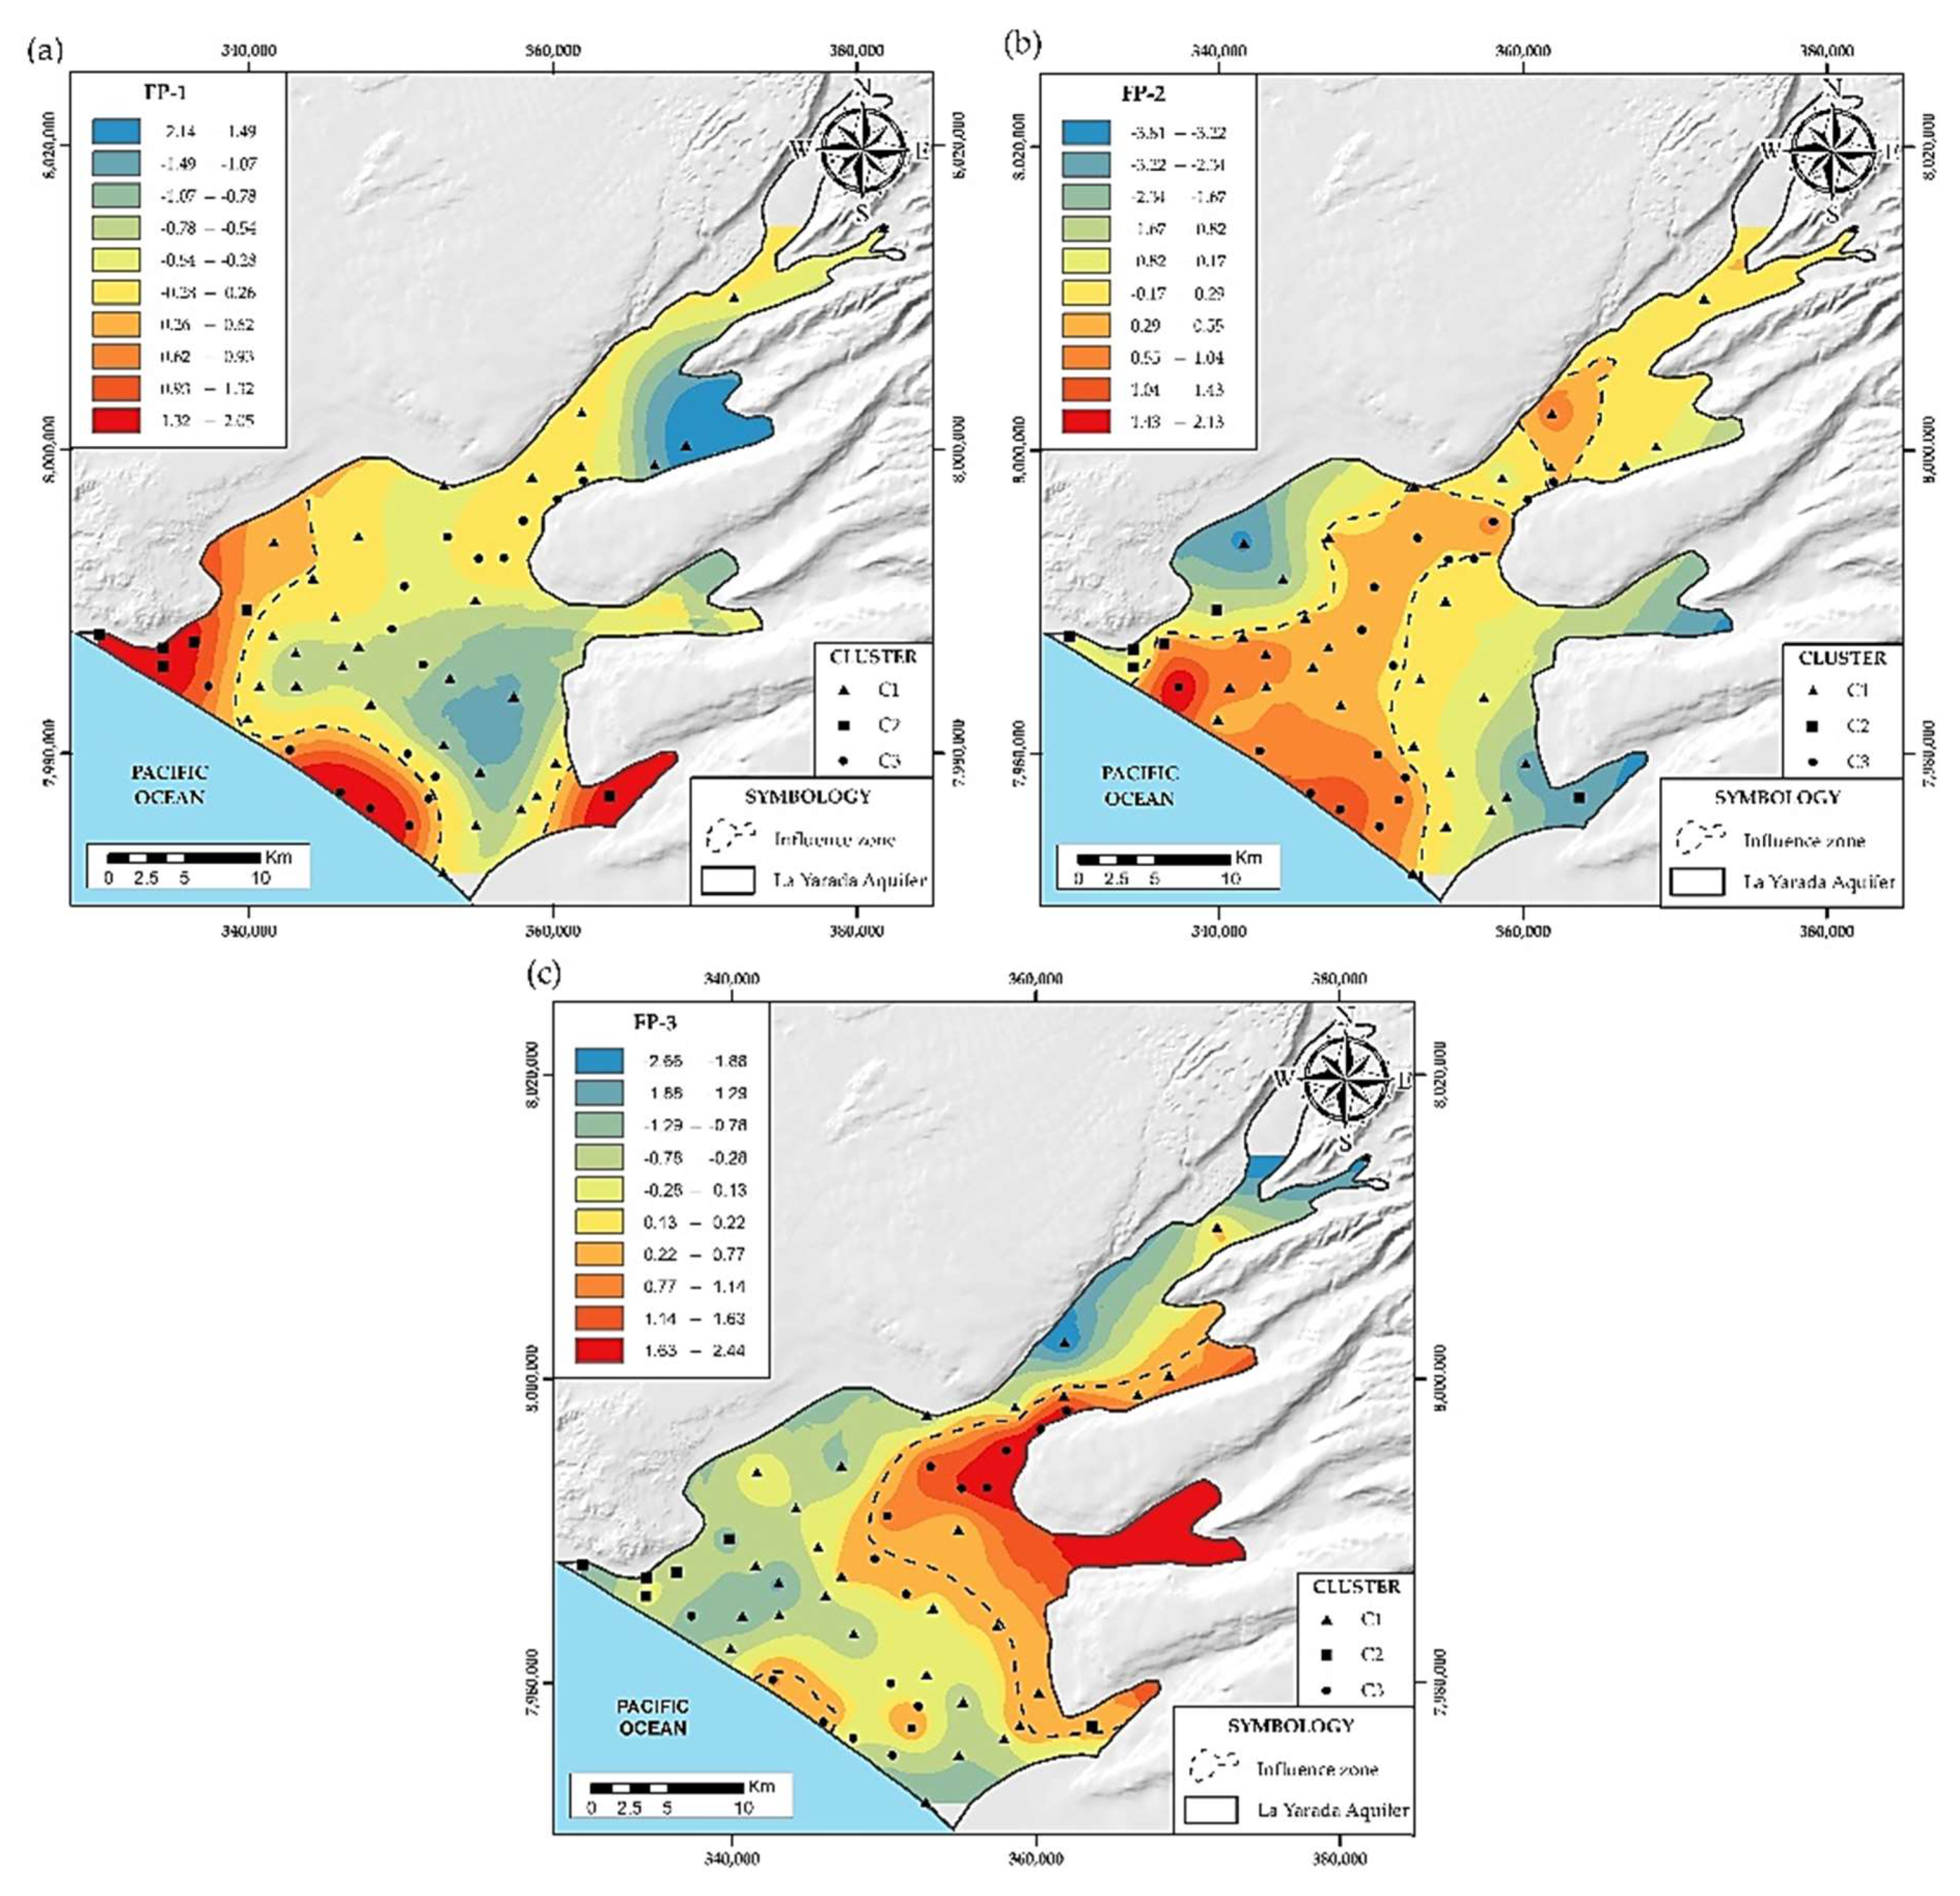
4.2.1. Main Elements (FP)
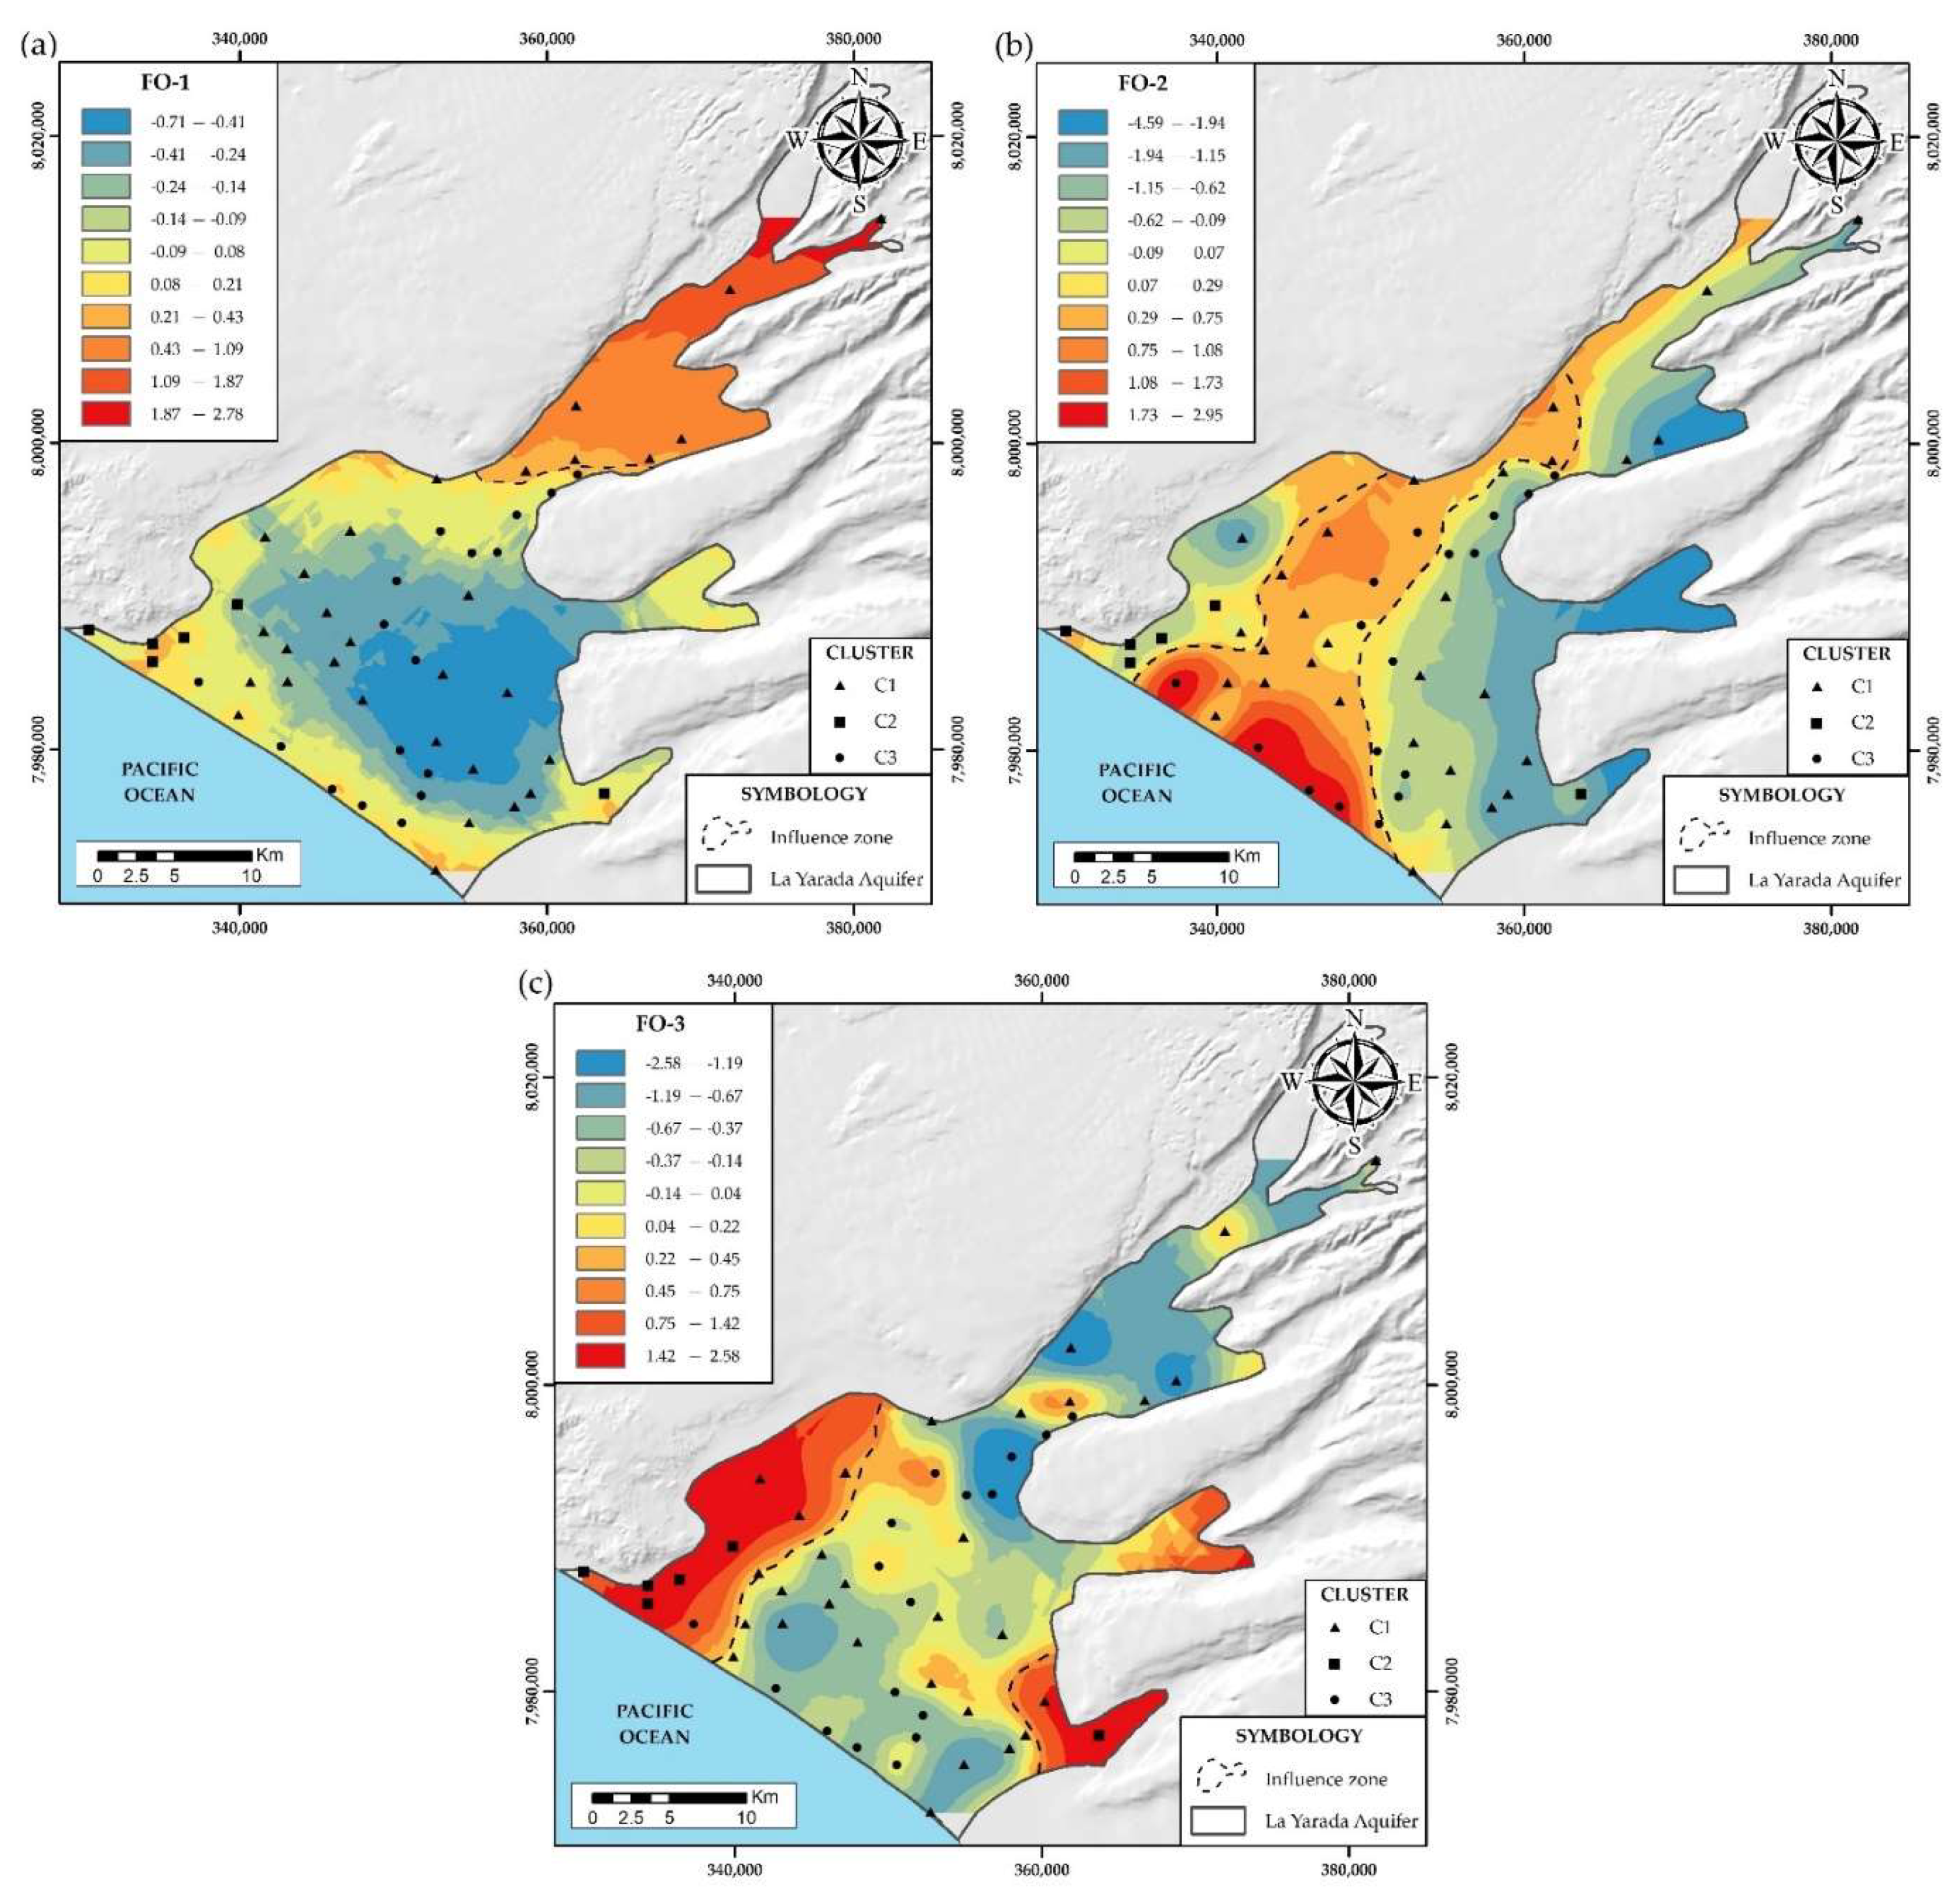
4.2.2. Trace Elements (FO)
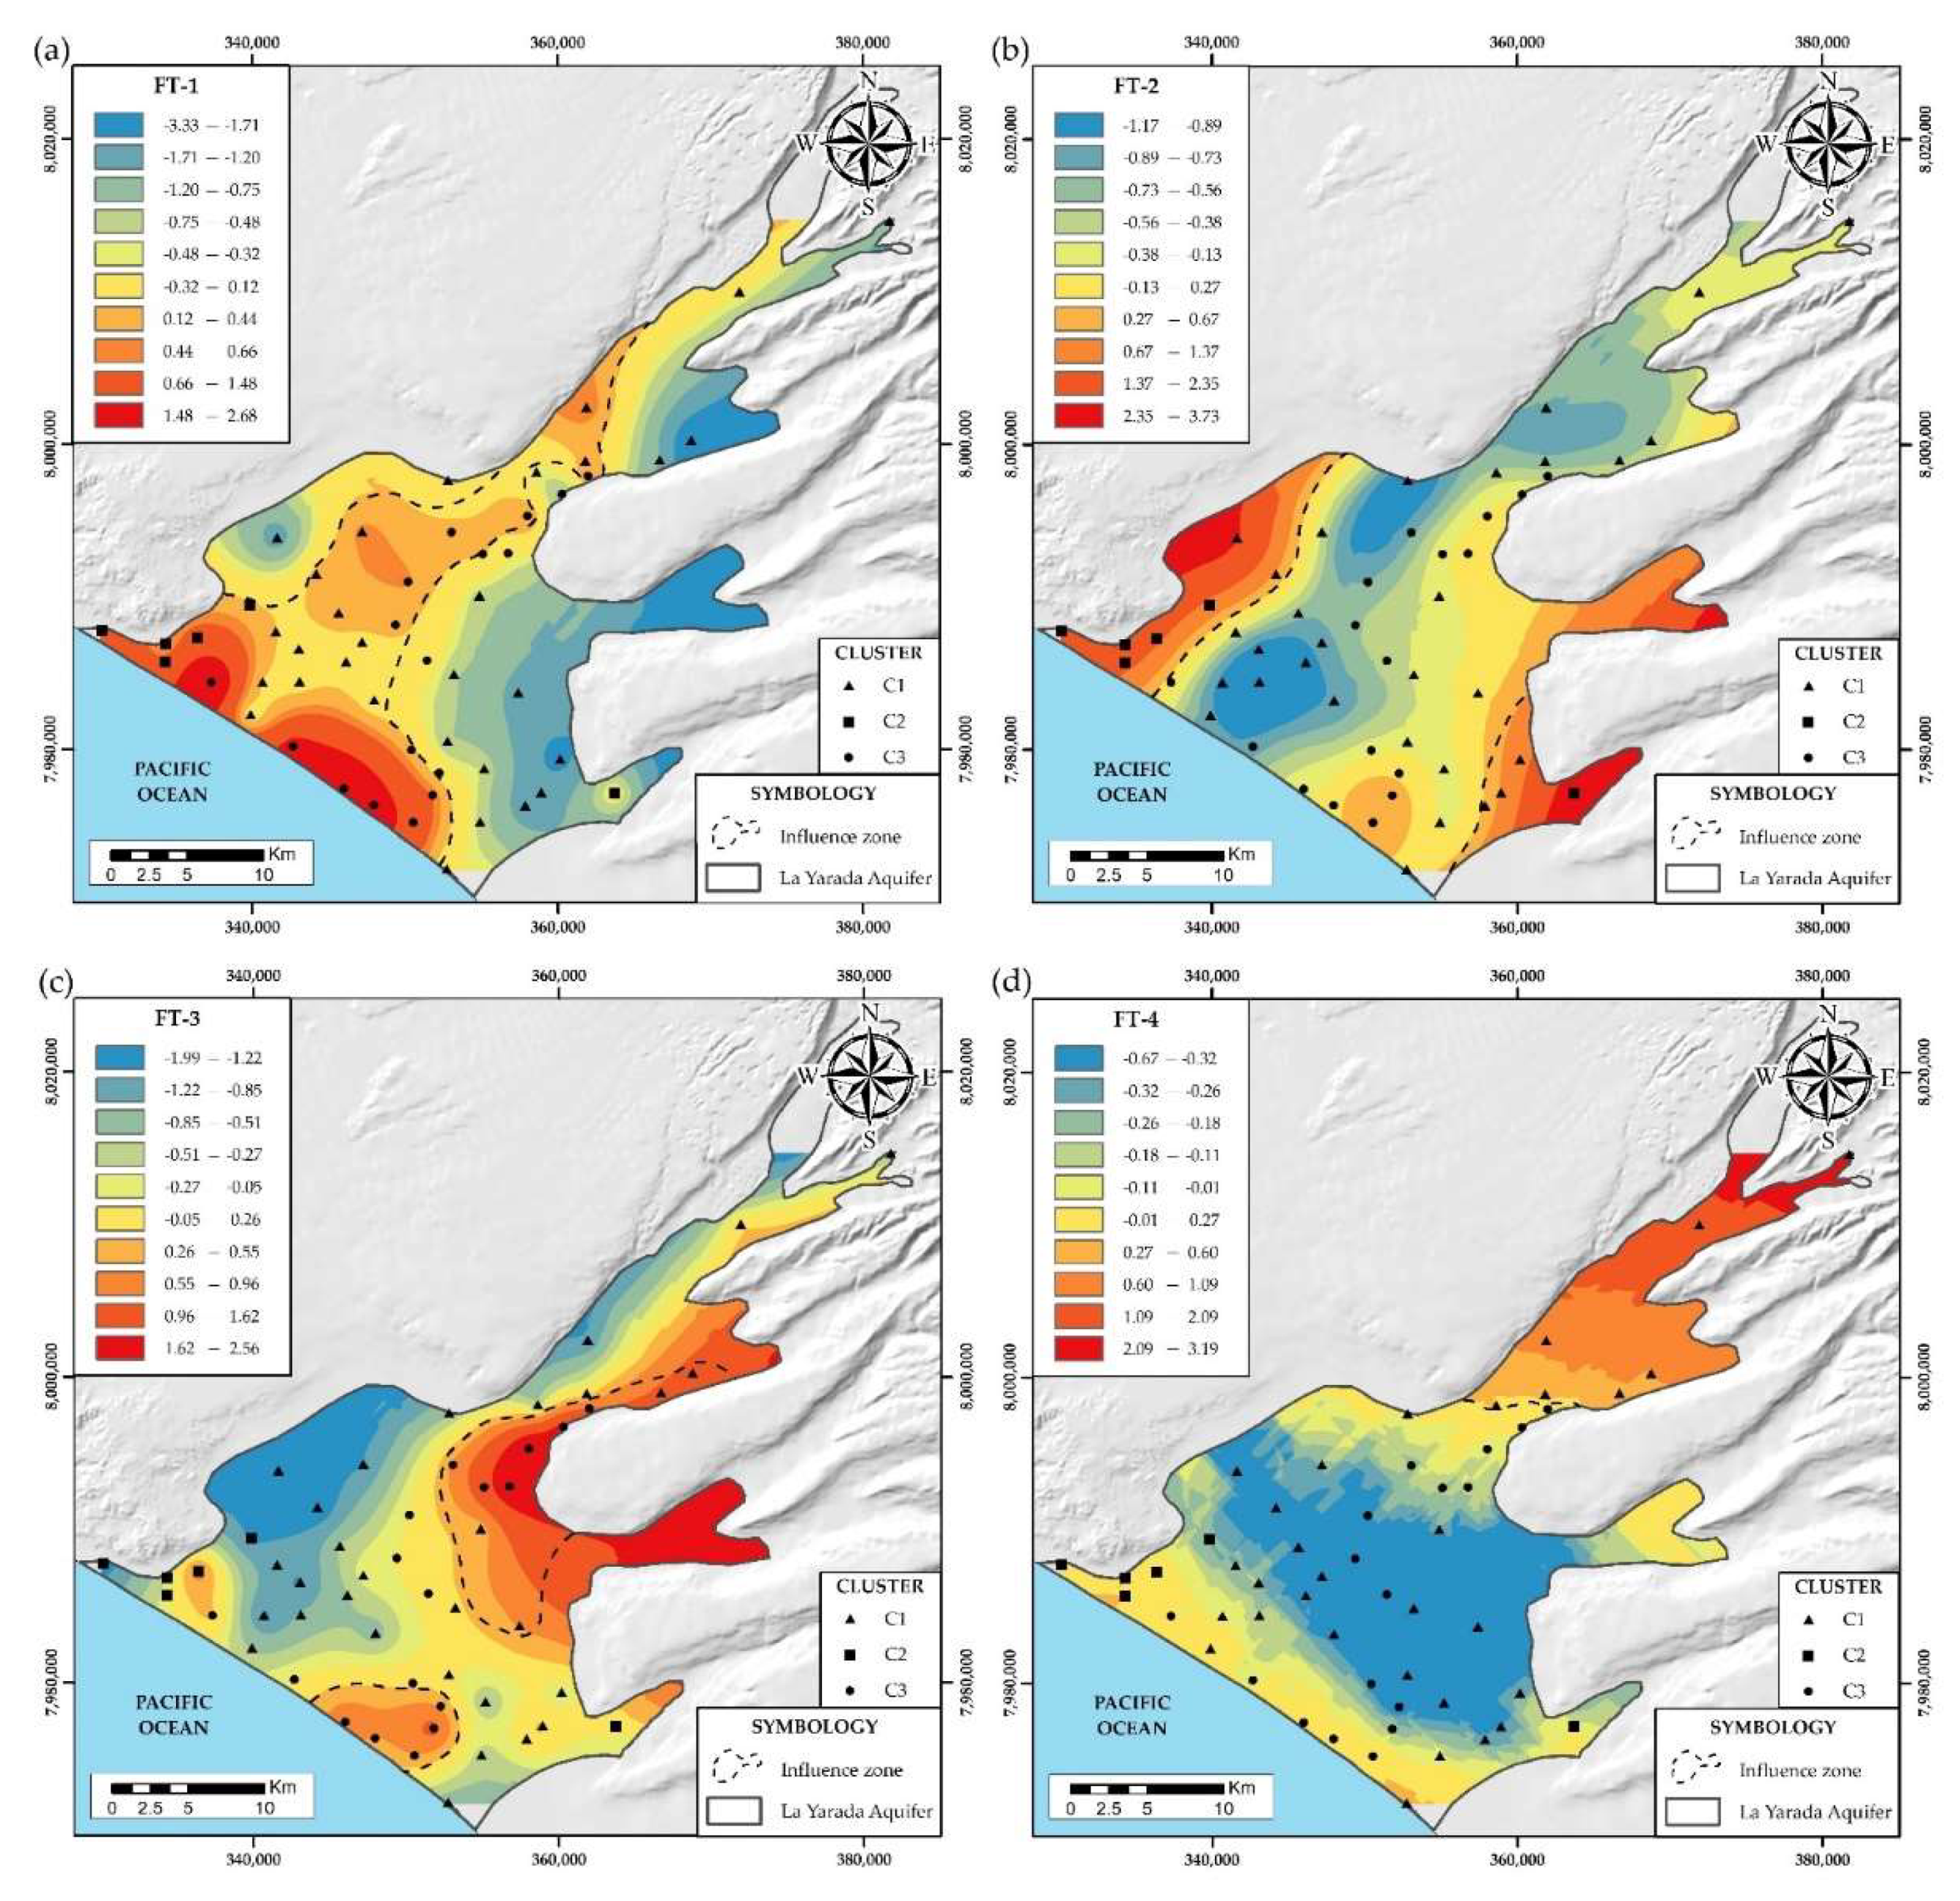
4.2.3. Physicochemical and Isotopic Parameters (FT)
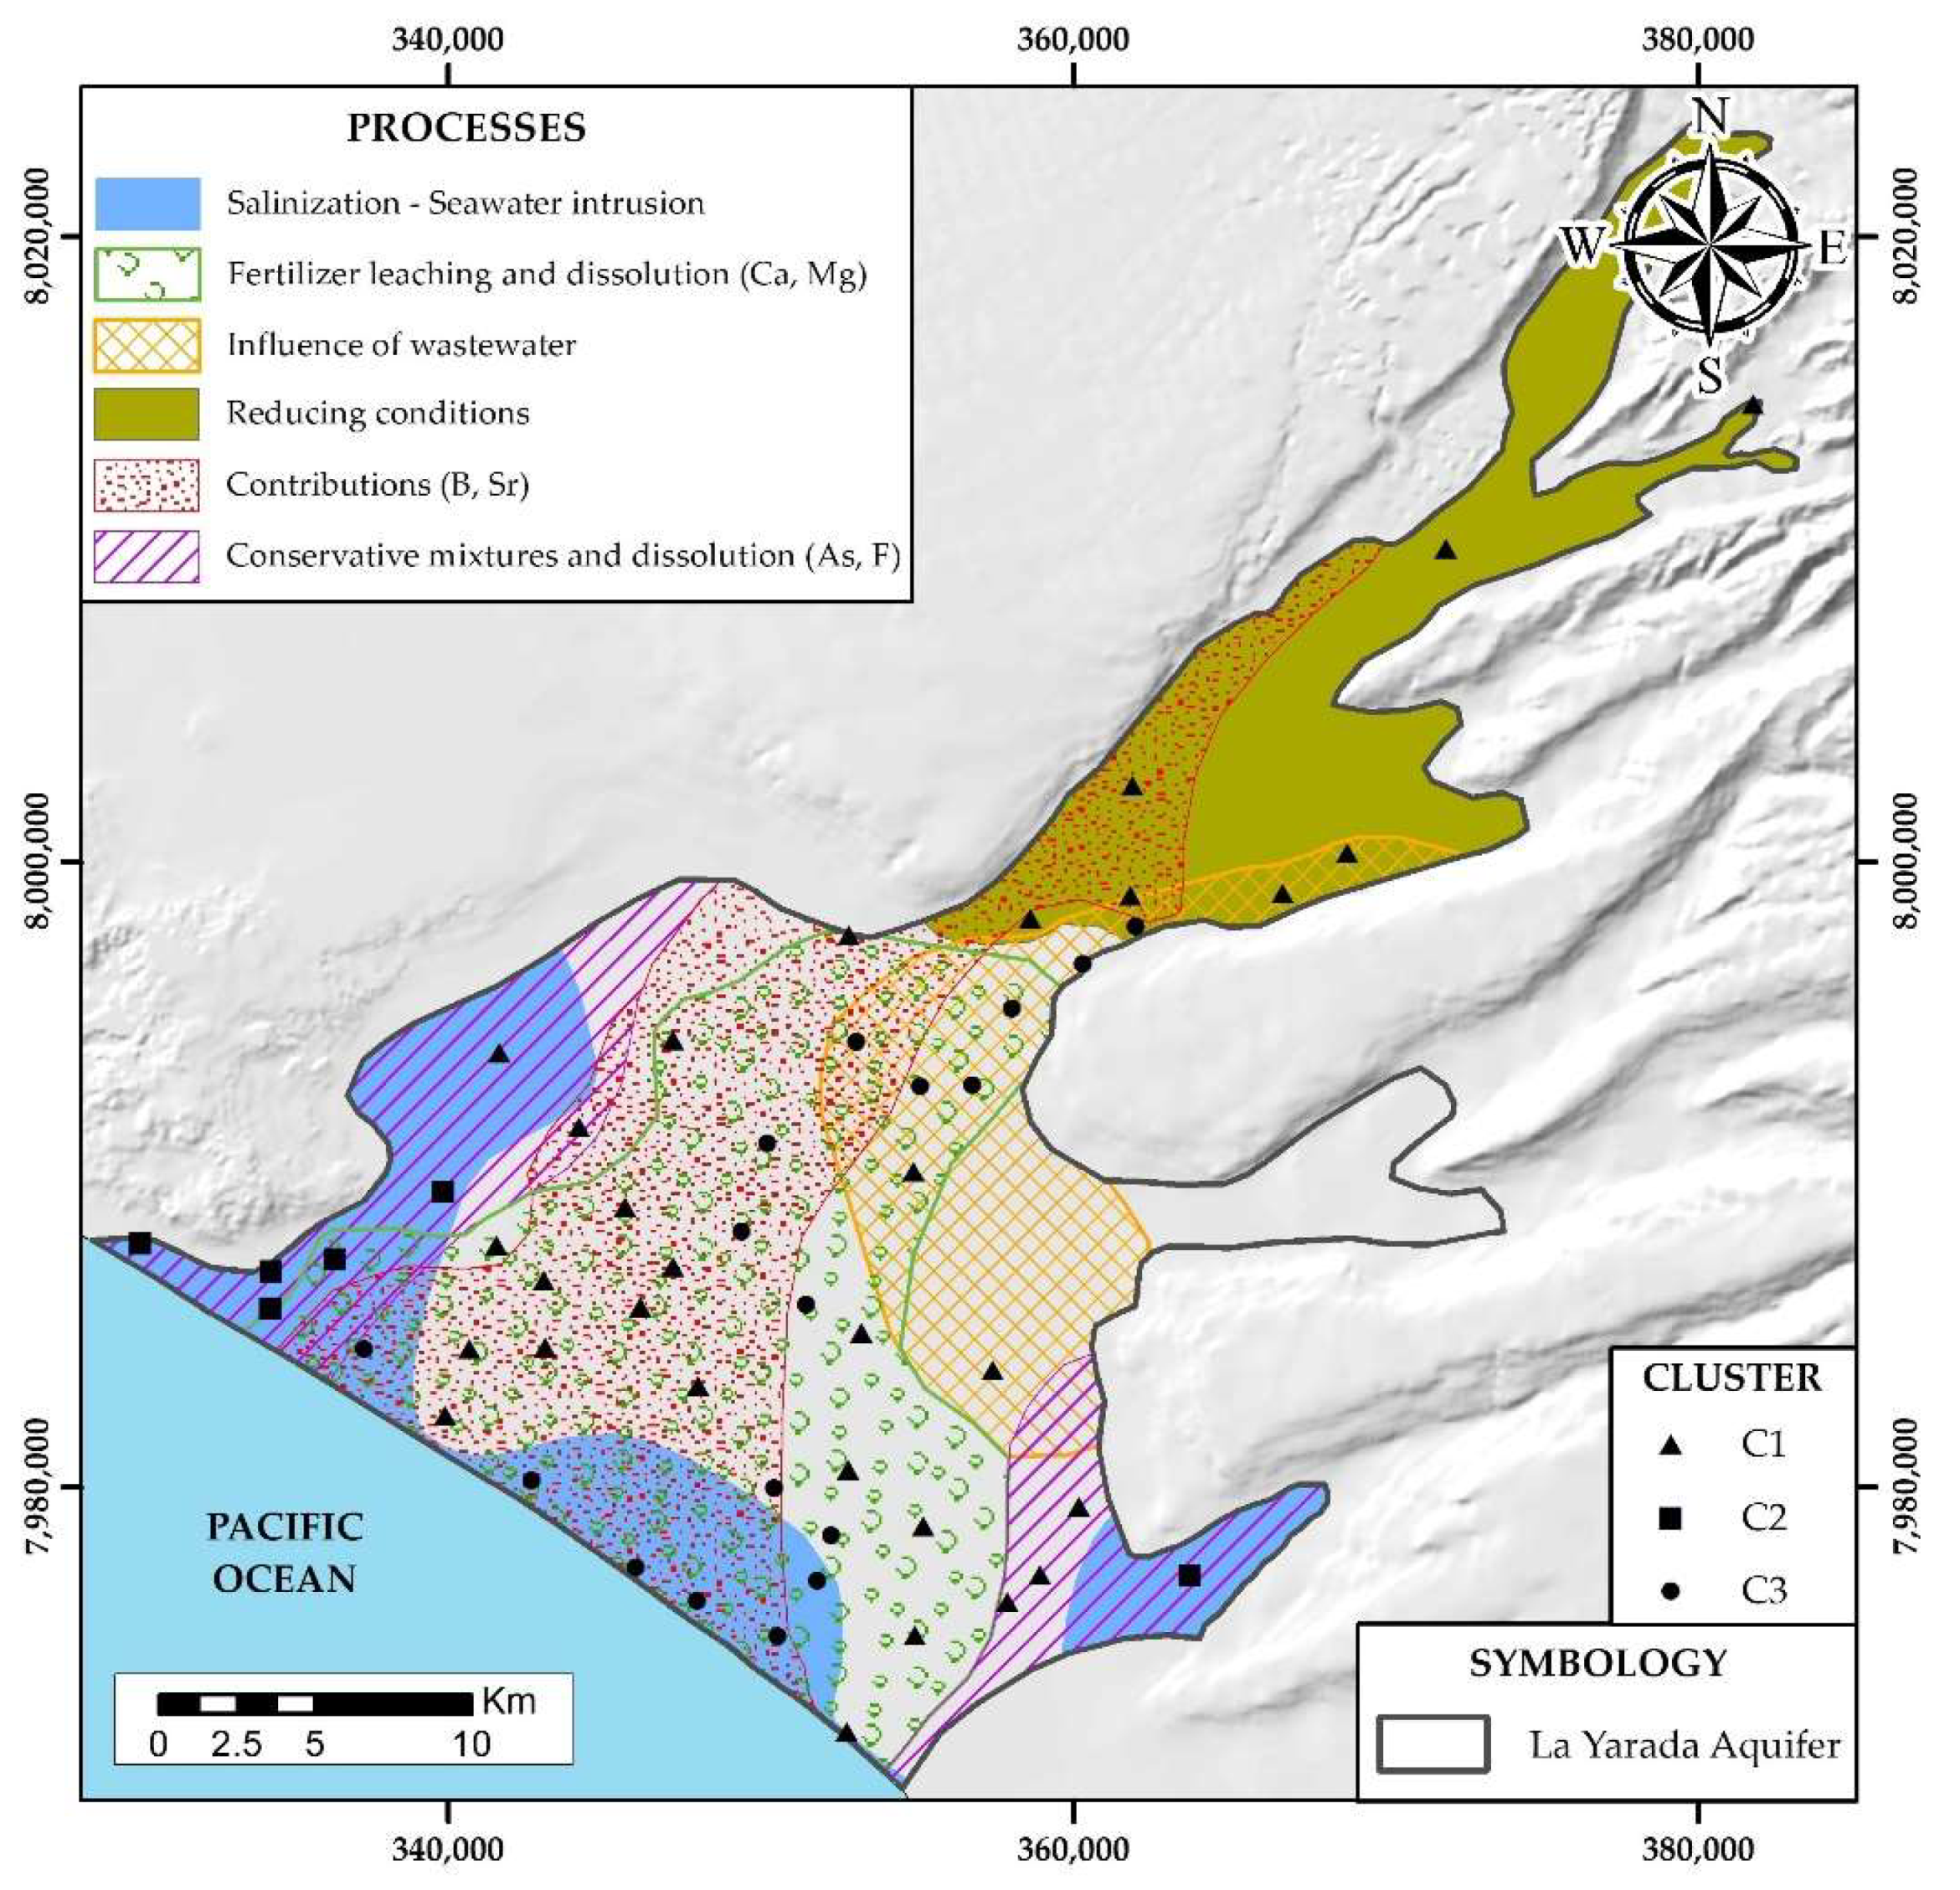
4.3. Hydrogeochemical Processes
4.3.1. Salinization by Marine Intrusion
4.3.2. Fertilizer Leaching and Dissolution (Ca2+, Mg2+)
4.3.3. Wastewater Mixture (NO3−)
4.3.4. Reducing Conditions
4.3.5. Contributions from (B, Sr)
4.3.6. Conservative Mixtures and Dissolution (As, F)
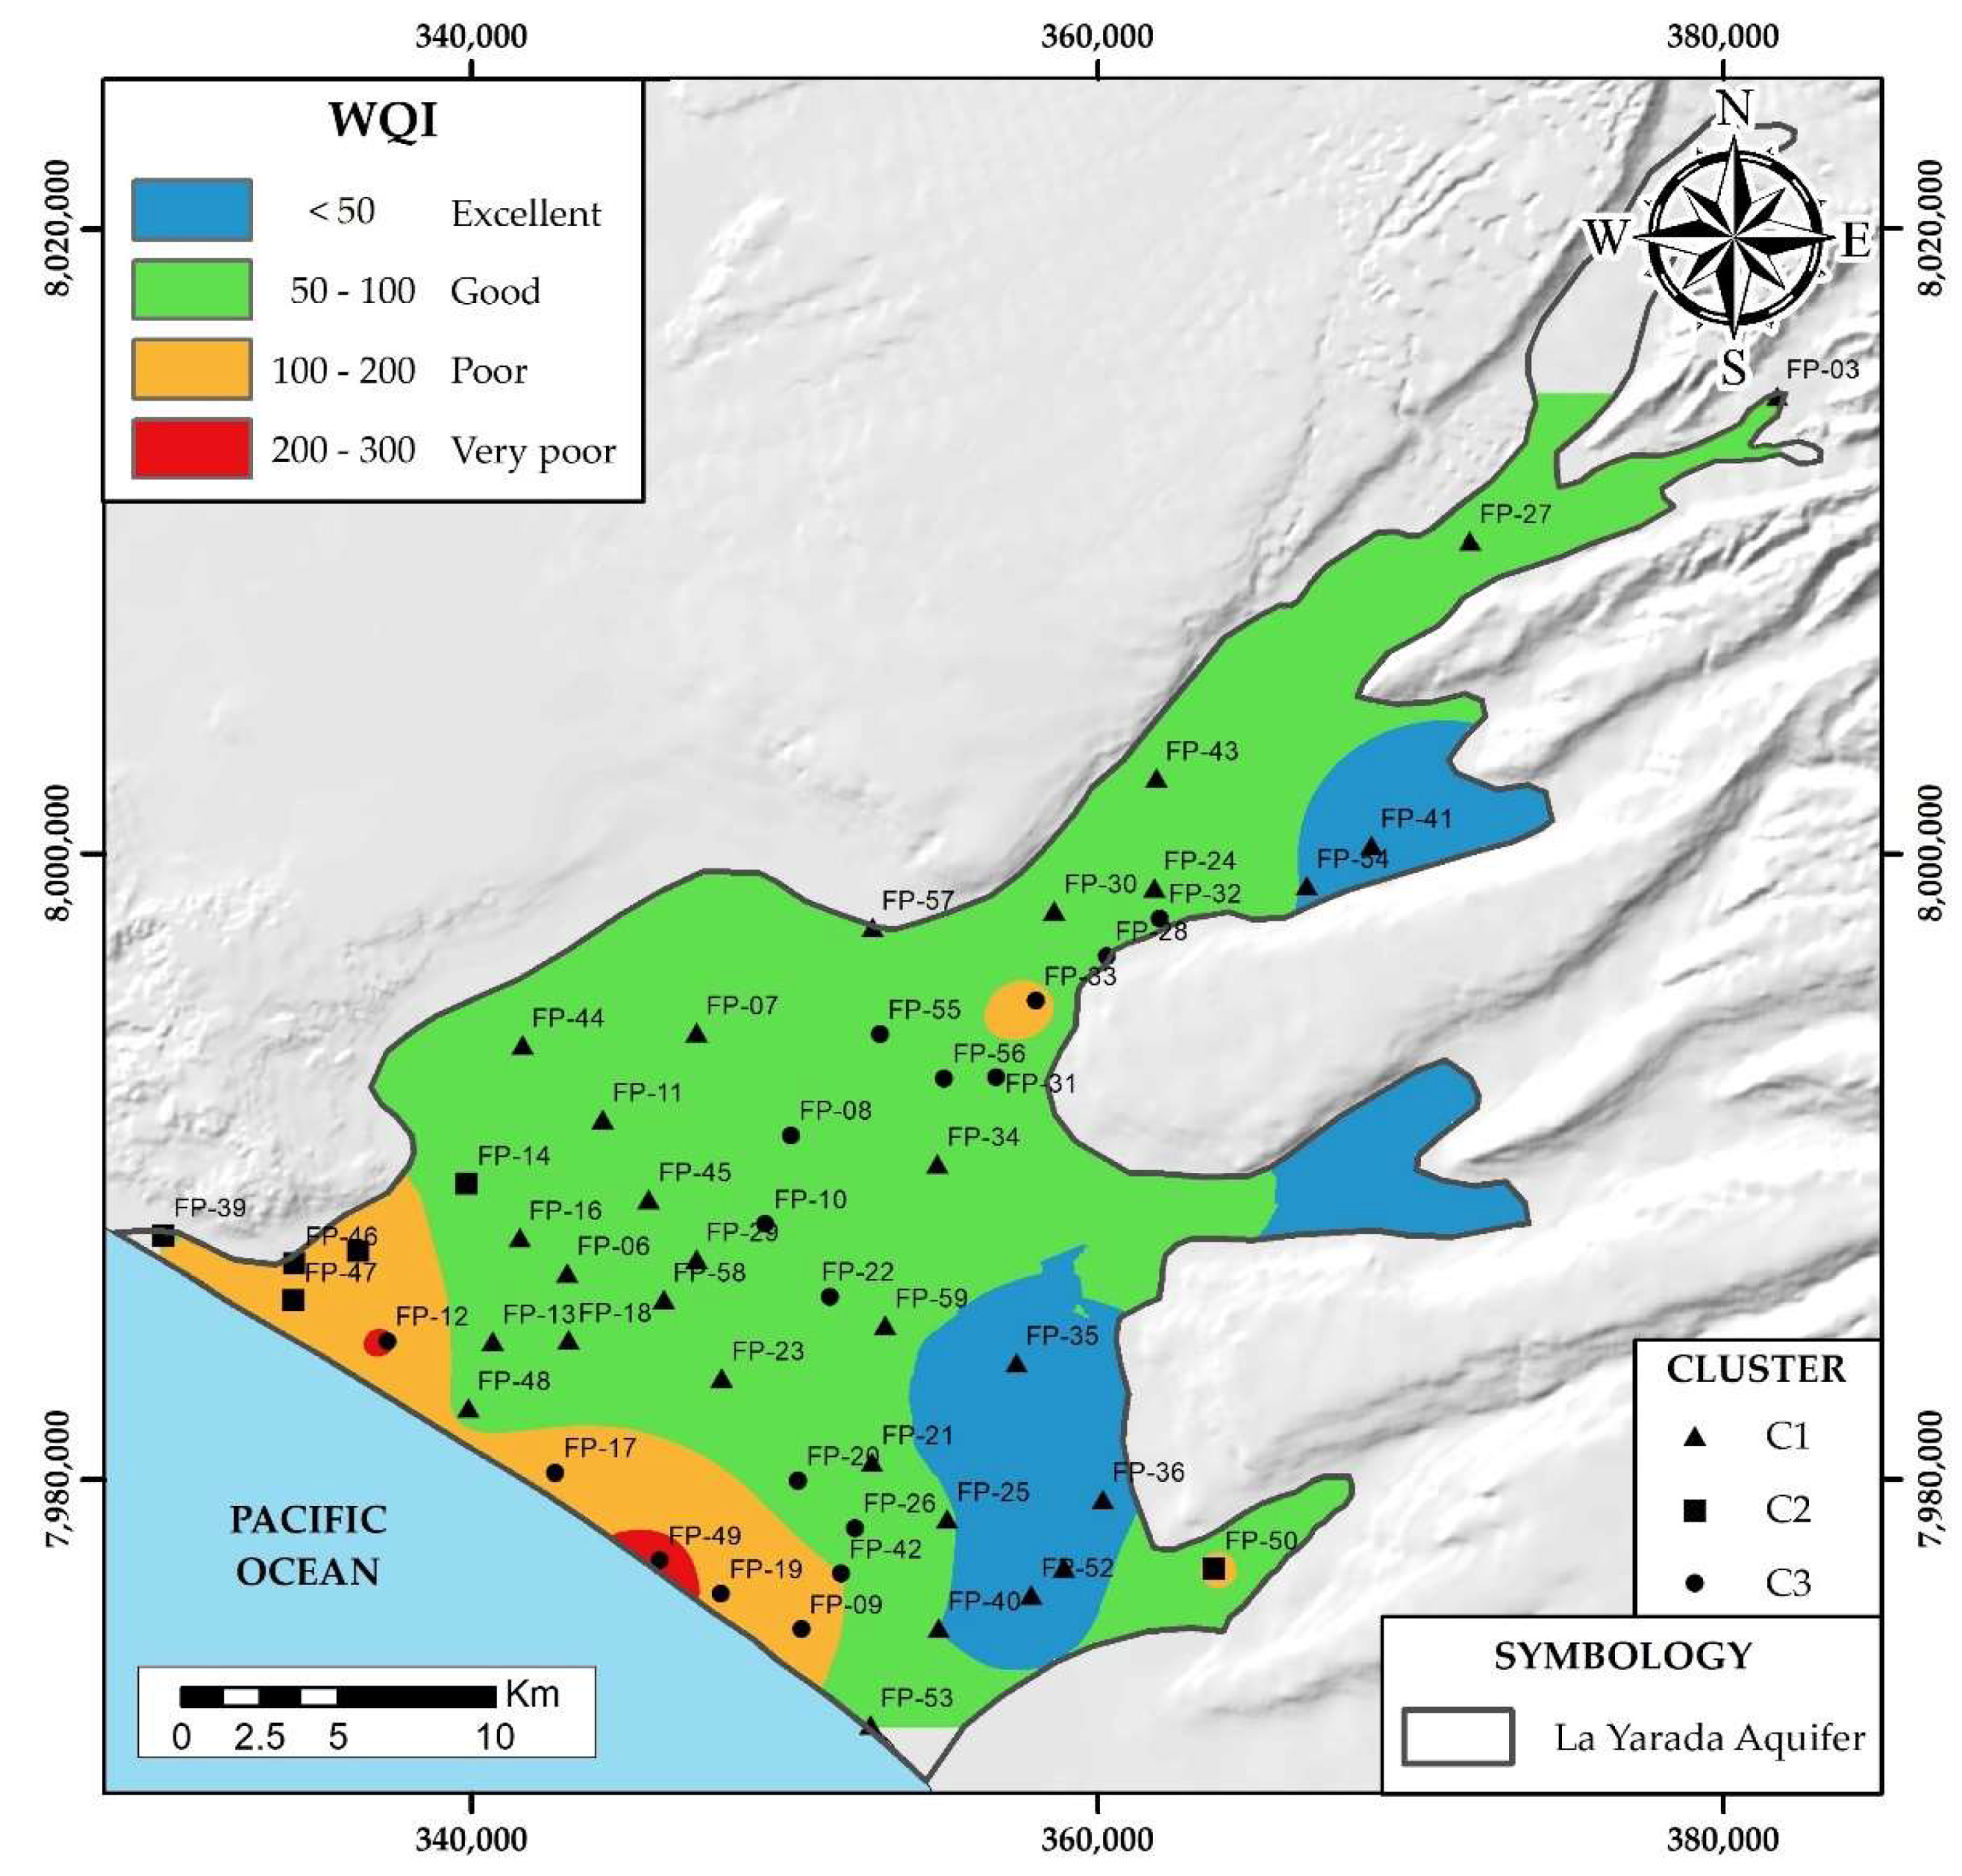
4.4. Quality of Drinking Water
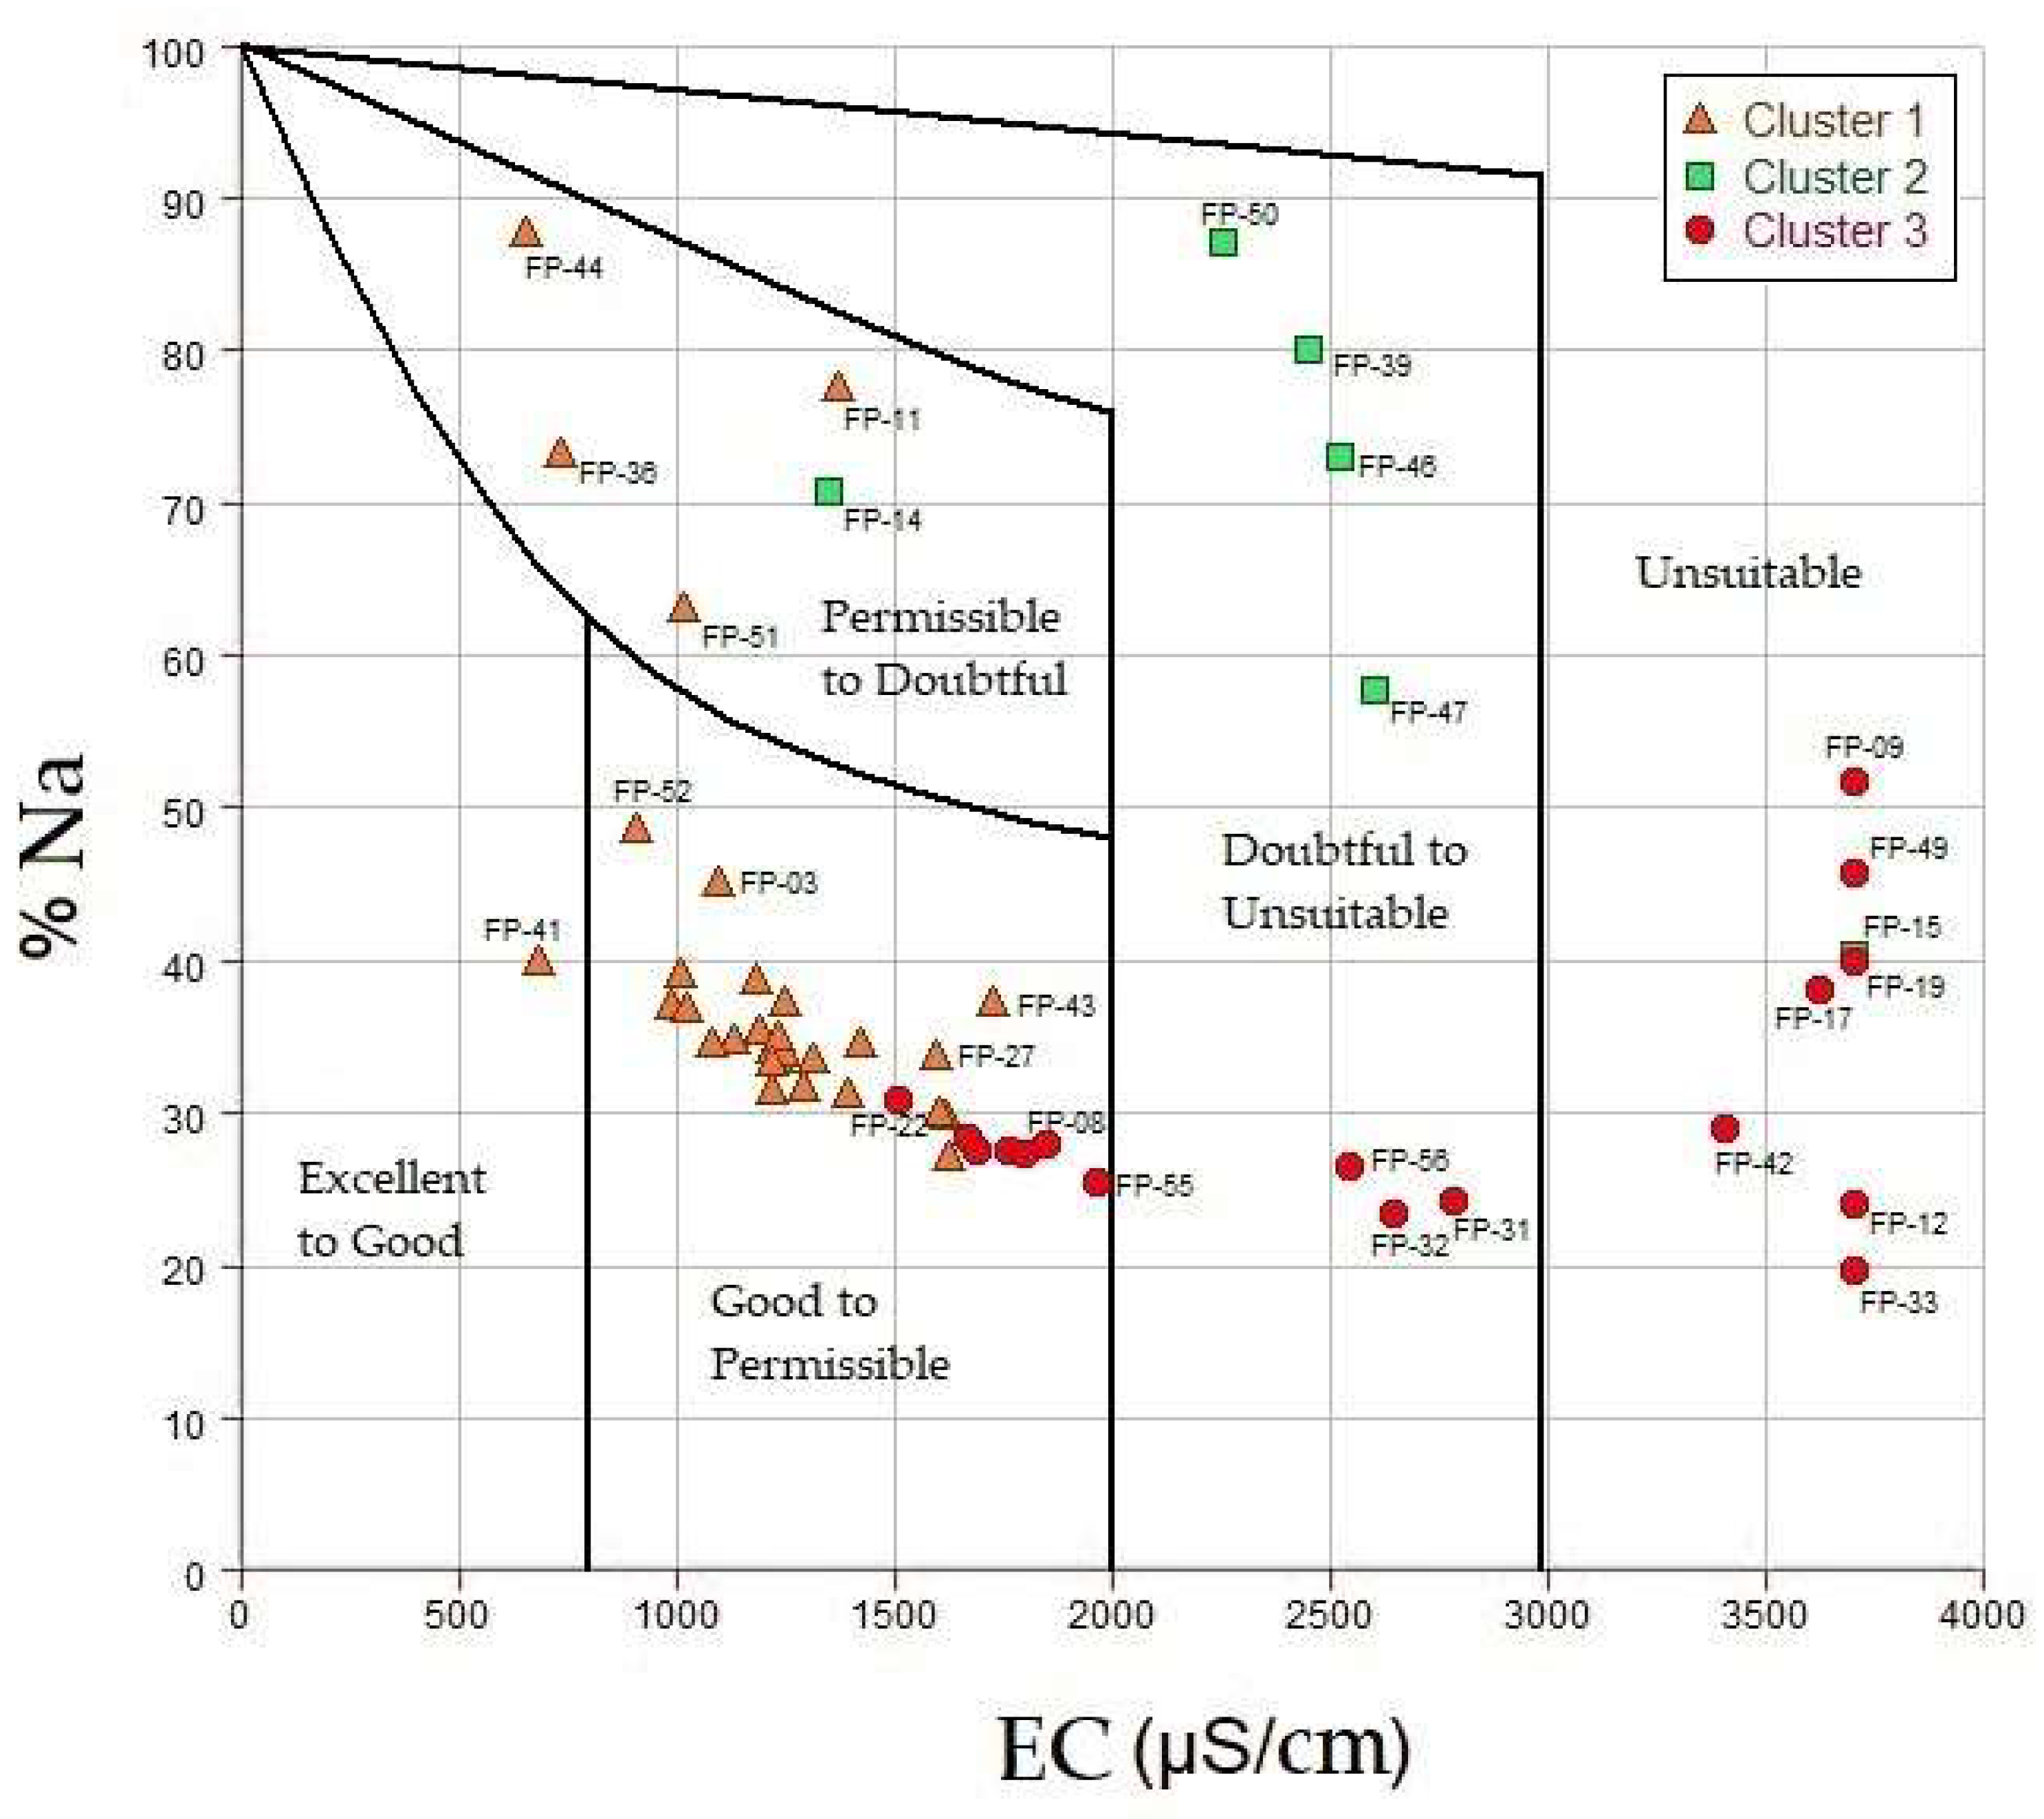
4.5. Water Quality for Irrigation Purposes
5. Conclusions
- The contrast of areas with the highest values of the three factorial analysis approaches, it was possible to delimit the area of maximum influence by the hydrogeochemical processes that govern the degradation of water quality in La Yarada aquifer: (i) salinization—intrusion marine, (ii) fertilizer leaching and dissolution (Ca2+, Mg2+), (iii) wastewater mixture (NO3−), (iv) reducing conditions (Fe, Mn, Al), (v) contributions of (B, Sr), (vi) conservative mixtures and dissolution (As, F).
- Integration of regional geology with the few recharge areas in Caplina basin, show a preferential direction by the structural lineaments (NE-SO), forming different facies, grouping wells according to their similarity: (i) C1 low mineralized waters, with minimum influence of hydrogeochemical processes, (ii) C2 waters affected by marine intrusion with low recharges, (iii) C3 waters affected by marine intrusion and other mixtures with high recharges.
- It was validated with the water quality indices (WQI), that the areas near the coast are “bad” to “very bad” for human consumption. Therefore, they should not be used for drinking without any prior treatment otherwise health problems could arise.
- It was validated with the Wilcox diagram that the areas near the coast are unsuitable for irrigation, and this is due to the increase in sodium and salinity.
Author Contributions
Funding
Institutional Review Board Statement
Informed Consent Statement
Data Availability Statement
Conflicts of Interest
References
- Pino, E.; Chávarri, E. Evidencias de cambio climático en la región hiperárida de la Costa sur de Perú, cabecera del Desierto de Atacama. Tecnol. Y Cienc. Del Agua. 2022, 13, 1–34. [Google Scholar]
- Narvaez-Montoya, C.; Torres-Martínez, J.A.; Pino-Vargas, E.; Cabrera-Olivera, F.; Loge, F.J.; Mahlknecht, J. Predicting adverse scenarios for a transboundary coastal aquifer system in the Atacama Desert (Peru/Chile). Sci. Total Environ. 2022, 806, 150386. [Google Scholar] [CrossRef] [PubMed]
- Vera, A.; Pino-Vargas, E.; Verma, M.P.; Chucuya, S.; Chávarri, E.; Canales, M. Hydrodynamics, Hydrochemistry, and Stable Isotope Geochemistry to Assess Temporal Behavior of Seawater Intrusion in the La Yarada Aquifer in the Vicinity of Atacama Desert, Tacna, Peru. Water 2021, 13, 3161. [Google Scholar] [CrossRef]
- Pino, E.; Steenken, A. Governance and Governability of Groundwater in Arid Areas. In Groundwater Management and Resources; Bahareh, K., Ed.; IntechOpen: London, UK, 2020. [Google Scholar]
- Pino, E.; Coarita, F. Caracterización hidrogeológica para determinar el deterioro de la calidad del agua en el acuifero la yarada media. Rev. Investig. Altoandinas. 2018, 20, 477–490. [Google Scholar] [CrossRef]
- Pino, E.; Chávarri, E.; Ramos, L. Governability and governance crisis its implications in the inadequate use of groundwater, case coastal aquifer of La Yarada, Tacna, Perú. Idesia 2018, 36, 77–85. [Google Scholar]
- Milovanovic, M. Water quality assessment and determination of pollution sources along the Axios/Vardar River, Southeastern Europe. Desalination 2007, 213, 159–173. [Google Scholar] [CrossRef]
- Pino, E.; Montalván, I.; Vera, A.; Ramos, L. La conductancia estomática y su relación con la temperatura foliar y humedad del suelo en el cultivo del olivo (Olea europaea L.), en periodo de maduración de frutos, en zonas áridas, La Yarada, Tacna, Perú. Idesia 2019, 37, 55–64. [Google Scholar] [CrossRef]
- Bouderbala, A. Groundwater salinization in semi-arid zones: An example from Nador plain (Tipaza, Algeria). Environ. Earth Sci. 2015, 73, 5479–5496. [Google Scholar] [CrossRef]
- Agoubi, B.; Kharroubi, A.; Abida, H. Saltwater intrusion modelling in Jorf coastal aquifer, South-eastern Tunisia: Geochemical, geoelectrical and geostatistical application. Hydrol. Process. 2013, 27, 1191–1199. [Google Scholar] [CrossRef]
- Locsey, K.L.; Cox, M.E. Statistical and hydrochemical methods to compare basalt- and basement rock-hosted groundwaters: Atherton Tablelands, north-eastern Australia. Environ. Geol. 2003, 43, 698–713. [Google Scholar] [CrossRef]
- Ismail, A.; Shareef, M.; Alatar, F. Hydrochemistry of Groundwater and its Suitability for Drinking and Irrigation in Baghdad, Iraq. Environ. Process. 2019, 6, 543–560. [Google Scholar] [CrossRef]
- Howladar, M.; Al Numanbakth, M.; Faruque, M. An application of Water Quality Index (WQI) and multivariate statistics to evaluate the water quality around Maddhapara Granite Mining Industrial Area, Dinajpur, Bangladesh. Environ. Syst. Res. 2017, 6, 1–18. [Google Scholar] [CrossRef] [Green Version]
- Boateng, T.; Opoku, F.; Acquaah, S.O.; Akoto, O. Groundwater quality assessment using statistical approach and water quality index in Ejisu-Juaben Municipality, Ghana. Environ. Earth Sci. 2016, 75, 489. [Google Scholar] [CrossRef]
- Uddin, M.; Nash, S.; Olbert, A. A review of water quality index models and their use for assessing surface water quality. Ecol. Indic. 2021, 122, 107218. [Google Scholar] [CrossRef]
- ANA. Estudio de la Caracterización Hidrogeoquímica del Acuífero Caplina; ANA: Lima, Peru, 2009. [Google Scholar]
- Pino, E. El acuífero costero La Yarada, después de 100 años de explotación como sustento de una agricultura en zonas áridas: Una revisión histórica. Idesia 2019, 37, 39–45. [Google Scholar] [CrossRef] [Green Version]
- Peña-Laureano, F.; Cotrina-Chávez, G.J.; Acosta-Pereira, H. Hidrogeología de la Cuenca del Río Caplina-Región Tacna-[Boletín H1]; INGEMMET: Lima, Peru, 2009. [Google Scholar]
- Pino-Vargas, E.; Chávarri-Velarde, E.; Ingol-Blanco, E.; Mejía, F.; Cruz, A.; Vera, A. Impacts of Climate Change and Variability on Precipitation and Maximum Flows in Devil’s Creek, Tacna, Peru. Hydrology 2022, 9, 10. [Google Scholar] [CrossRef]
- Gonzales, H. Modelo Sostenible de Infraestructura Zoológica-Botánica Para Mejorar Las Condiciones de Habitabilidad Animal en El Parque Zoológico Del Bosque Municipal de Tacna. Bachelor’s Thesis, Universidad Nacional Jorge Basadre Grohmann, Tacna, Peru, 2021. [Google Scholar]
- Pino, E.; Ramos, L.; Mejía, J.; Chávarri, E.; Ascensios, D. Medidas de mitigación para el acuífero costero La Yarada, un sistema sobreexplotado en zonas áridas. Idesia 2020, 38, 21–31. [Google Scholar] [CrossRef]
- Zenteno-Tupiño, E.; Rojas-Vega, C.; Castañeda-Zavaleta, M.; Tueros-Giler, C.; Chunga-Tapia, J.; Rubio-Flores, R. Evaluación de la Zona de Veda en el Acuífero Caplina; ANA: Lima, Peru, 2018. [Google Scholar]
- Martínez, C.; Vargas, R.; Montoya, J.; Chamorro, C.; Zenteno, E.; Ascue, C. Estudio hidrogeológico de las pampas de La Yarada y Hospicio–Tacna; INRENA: Lima, Peru, 1996. [Google Scholar]
- Acosta-Pereira, H.; Alván-De la Cruz, A.; Cutipa-Cornejo, M.; Mamani-Huisa, M.; Rodríguez-Manrique, J. Geología de los Cuadrángulos de La Yarada, Tacna y Huaylillas, hojas 37-u, 37-v y 37-x, escala 1: 50,000–[Boletín A 145]; INGEMMET: Lima, Peru, 2012. [Google Scholar]
- PET. Estudio Hidrogeológico de las Pampas de La Yarada y Hospicio; PET: Tacna, Peru, 2004. [Google Scholar]
- Domenico, P.; Schwartz, F. Physical and Chemical Hydrogeology, 2nd ed.; Wiley: New York, NY, USA, 1997; p. 528. [Google Scholar]
- Davis, J. Statistics and Data Analysis in Geology, 3rd ed.; Wiley: Nueva York, NY, USA, 1986; p. 328. [Google Scholar]
- Güler, C.; Kurt, M.; Alpaslan, M.; Akbulut, C. Assessment of the impact of anthropogenic activities on the groundwater hydrology and chemistry in Tarsus coastal plain (Mersin, SE Turkey) using fuzzy clustering, multivariate statistics and GIS techniques. J. Hydrol. 2012, 11, 435–451. [Google Scholar] [CrossRef]
- Wang, H.; Jiang, X.; Wan, L.; Han, G.; Guo, H. Hydrogeochemical characterization of groundwater flow systems in the discharge area of a river basin. J. Hydrol. 2015, 527, 433–441. [Google Scholar] [CrossRef]
- Güler, C.; Thyne, G.; McCray, J.; Turner, K. Evaluation of graphical and multivariate statistical methods for classification of water chemistry data. J. Hydrogeol. 2002, 10, 455–474. [Google Scholar] [CrossRef]
- Machiwal, D.; Jha, M.K. Identifying sources of groundwater contamination in a hard-rock aquifer system using multivariate statistical analyses and GIS-based geostatistical modeling techniques. J. Hydrol. Reg. Stud. 2015, 4, 80–110. [Google Scholar] [CrossRef] [Green Version]
- Hiscock, K.M.; Bense, V.F. Hydrogeology: Principles and Practice, 2nd ed.; Wiley-Blackwell: Hoboken, NJ, USA, 2014; p. 522. [Google Scholar]
- Kaiser, H.F. The varimax criterion for analytic rotation in factor analysis. Psychometrika 1958, 23, 187–200. [Google Scholar] [CrossRef]
- Huang, G.; Liu, C.; Sun, J.; Zhang, M.; Jing, J.; Li, L. A regional scale investigation on factors controlling the groundwater chemistry of various aquifers in a rapidly urbanized area: A case study of the Pearl River Delta. Sci. Total Environ. 2018, 625, 510–518. [Google Scholar] [CrossRef] [PubMed]
- Kazakis, N.; Kantiranis, N.; Kalaitzidou, K.; Kaprara, M.; Mitrakas, M.; Frei, R.; Vargemezis, G.; Tsourlos, P.; Zouboulis, A.; Filippidis, A. Origin of hexavalent chromium in groundwater: The example of Sarigkiol Basin. Sci. Total Environ. 2017, 552, 66. [Google Scholar]
- Dalton, M.G.; Upchurch, S.B. Interpretation of Hydrochemical Facies by Factor Analysis. Groundwater 1978, 16, 228–233. [Google Scholar] [CrossRef]
- Machiwal, D.; Cloutier, V.; Güler, C.; Kazakis, N. A review of GIS-integrated statistical techniques for groundwater quality evaluation and protection. Environ. Earth Sci. 2018, 77, 681. [Google Scholar] [CrossRef]
- Masoud, A.; El-Horiny, M.; Atwia, M.; Gemail, K.; Koike, K. Assessment of groundwater and soil quality degradation using multivariate and geostatistical analyses, Dakhla Oasis, Egypt. J. Afr. Earth Sci. 2018, 142, 64–81. [Google Scholar] [CrossRef]
- Redwan, M.; Moneim, A. Factors controlling groundwater hydrogeochemistry in the area west of Tahta, Sohag, Upper Egypt. J. Afr. Earth Sci. 2016, 118, 328–338. [Google Scholar] [CrossRef]
- Horton, R.K. An Index Number System for Rating Water Quality. J. Water Pollut. Control Fed. 1965, 37, 300–306. [Google Scholar]
- MINSA. Reglamento de la Calidad del Agua para Consumo Humano. Lima Perú Dir. Gen. De Salud Ambient. Del Minist. De Salud 2011, 1, 46. [Google Scholar]
- Sahu, P.; Sikdar, P.K. Hydrochemical framework of the aquifer in and around East Kolkata Wetlands, West Bengal, India. Environ. Geol. 2007, 55, 823–835. [Google Scholar] [CrossRef]
- Wilcox, L. Classification and Use of Irrigation Waters; Natural Science: Washington, DC, USA, 1955; Volume 3, p. 969. [Google Scholar]
- Pino, E.; Tacora, P.; Steenken, A.; Alfaro, L.; Valle, A.; Chávarri, E.; Ascencios, D.; Mejía, J. Efecto de las características ambientales y geológicas sobre la calidad del agua en la cuenca del río Caplina, Tacna, Perú. Tecnol. Y Cienc. Del Agua. 2017, 8, 77–99. [Google Scholar] [CrossRef]
- Farrag, A.; Ibrahim, H.; El-Hussaini, A.; Kader, A. Geophysical and hydrogeological tools for groundwater exploration and evaluation in the area around idfu-marsa alam road eastern desert, Egypt. Assiut. Univ. Bull. Environ. Res. 2005, 8, 67–86. [Google Scholar]
- Liao, F.; Wang, G.; Shi, Z.; Huang, X.; Xu, F.; Xu, Q.; Guo, L. Distributions, Sources, and Species of Heavy Metals/Trace Elements in Shallow Groundwater Around the Poyang Lake, East China. Expo. Health 2018, 10, 211–227. [Google Scholar] [CrossRef]
- Morelli, G.; Rimondi, V.; Benvenuti, M.; Medas, D.; Costagliola, P.; Gasparon, M. Experimental simulation of arsenic desorption from Quaternary aquifer sediments following sea water intrusion. Appl. Geochem. 2017, 87, 176–187. [Google Scholar] [CrossRef]
- Chaudhuri, S.; Ale, S. Long term (1960–2010) trends in groundwater contamination and salinization in the Ogallala aquifer in Texas. J. Hydrol. 2014, 513, 376–390. [Google Scholar] [CrossRef]
- Abu Al Naeem, M.; Yusoff, I.; Ng, T.F.; Maity, J.P.; Alias, Y.; May, R.; Alborsh, H. A study on the impact of anthropogenic and geogenic factors on groundwater salinization and seawater intrusion in Gaza coastal aquifer, Palestine: An integrated multi-techniques approach. J. Afr. Earth Sci. 2019, 156, 75–93. [Google Scholar] [CrossRef]
- Fryar, A.; Mullican, W.; Macko, S.; Fryar, A.; Mullican, W.; Macko, S. Groundwater recharge and chemical evolution in the southern High Plains of Texas, USA. Hydrogeol. J. 2001, 9, 522–542. [Google Scholar] [CrossRef]
- Böhlke, J.K. Groundwater recharge and agricultural contamination. Hydrogeol. J. 2002, 10, 153–179. [Google Scholar] [CrossRef]
- Vengosh, A.; Kloppmann, W.; Marei, A.; Livshitz, Y.; Gutierrez, A.; Banna, M.; Guerrot, C.; Pankratov, I.; Raanan, H. Sources of salinity and boron in the Gaza strip: Natural contaminant flow in the southern Mediterranean coastal aquifer. Water Resour. Res. 2005, 41, 1–19. [Google Scholar] [CrossRef] [Green Version]
- Slama, F.; Bouhlila, R. Multivariate statistical analysis and hydrogeochemical modelling of seawater-freshwater mixing along selected flow paths: Case of Korba coastal aquifer Tunisia. Estuar. Coast Shelf Sci. 2017, 198, 636–647. [Google Scholar] [CrossRef]
- Carol, E.S.; Kruse, E. Hydrochemical characterization of the water resources in the coastal environments of the outer Río de la Plata estuary, Argentina. J. S. Am. Earth Sci. 2012, 37, 113–121. [Google Scholar] [CrossRef]
- Małecki, J.; Kadzikiewicz-Schoeneich, M.; Eckstein, Y.; Szostakiewicz-Hołownia, M.; Gruszczyński, T. Mobility of copper and zinc in near-surface groundwater as a function of the hypergenic zone lithology at the Kampinos National Park. Environ. Earth Sci. 2017, 76, 276. [Google Scholar] [CrossRef]
- Shotyk, W.; Krachler, M.; Aeschbach-Hertig, W.; Hillier, S.; Zheng, J. Trace elements in recent groundwater of an artesian flow system and comparison with snow: Enrichments, depletions, and chemical evolution of the water. J. Environ. Monit. 2010, 12, 208–217. [Google Scholar] [CrossRef] [PubMed]
- Bassett, R.L.; Buszka, P.M.; Davidson, G.R.; Chong-Diaz, D. Identification of Groundwater Solute Sources Using Boron Isotopic Composition. Environ. Sci. Technol. 1995, 29, 2915–2922. [Google Scholar] [CrossRef] [PubMed]
- Bouzidi, A.; Ararem, A.; Imessaoudene, D.; Yabrir, B. Sequential extraction of Cs and Sr from Ain Oussera soils around Es-Salam research reactor facility. J. Environ. Sci. 2015, 36, 163–172. [Google Scholar] [CrossRef]
- Wang, G.; Um, W. Facilitated strontium transport by remobilization of strontium-containing secondary precipitates in Hanford Site subsurface. J. Hazard Mater. 2013, 248, 364–370. [Google Scholar] [CrossRef]
- Guber, R.; Tefaha, L.; Arias, N.; Sandoval, N.; Toledo, R.; Fernández, M. Contenido de arsénico en el agua de consumo en Leales y Graneros (Provincia de Tucumán-Argentina). Acta Bioquím. Clín. Latinoam. 2009, 43, 201–207. [Google Scholar]
- Ortega-Guerrero, M. Presencia, distribución, hidrogeoquímica y origen de arsénico, fluoruro y otros elementos traza disueltos en agua subterránea, a escala de cuenca hidrológica tributaria de Lerma-Chapala, México. Rev. Mex. Cienc. Geológicas 2009, 26, 143–161. [Google Scholar]
- Vivona, R.; Preziosi, E.; Madé, B.; Giuliano, G. Occurrence of minor toxic elements in volcanic-sedimentary aquifers: A case study in central Italy. Hydrogeol. J. 2007, 15, 1183–1196. [Google Scholar] [CrossRef]
- Bundschuh, J.; Farias, B.; Martin, R.; Storniolo, A.; Bhattacharya, P.; Cortes, J.; Bonorino, G.; Albouy, R. Groundwater arsenic in the Chaco-Pampean Plain, Argentina: Case study from Robles county, Santiago del Estero Province. Appl. Geochem. 2004, 19, 31–43. [Google Scholar] [CrossRef]
- Krishnakumar, P.; Lakshumanan, C.; Kishore, V.P.; Sundararajan, M.; Santhiya, G.; Chidambaram, S. Assessment of groundwater quality in and around Vedaraniyam, South India. Environ. Earth Sci. 2014, 71, 2211–2225. [Google Scholar] [CrossRef]
- Kumar, P.J.; Elango, L.; James, E. Assessment of hydrochemistry and groundwater quality in the coastal area of South Chennai, India. Arab. J. Geosci. 2014, 7, 2641–2653. [Google Scholar] [CrossRef]
- Brindha, K.; Pavelic, P.; Sotoukee, T.; Douangsavanh, S.; Elango, L. Geochemical Characteristics and Groundwater Quality in the Vientiane Plain. Laos. Expo. Health 2016, 9, 89–104. [Google Scholar] [CrossRef]
- Nematollahi, M.J.; Ebrahimi, P.; Ebrahimi, M. Evaluating Hydrogeochemical Processes Regulating Groundwater Quality in an Unconfined Aquifer. Environ. Process. 2016, 3, 1021–1043. [Google Scholar] [CrossRef]


| FP | Factors | ||
|---|---|---|---|
| 1 | 2 | 3 | |
| pH | −0.08 | −0.68 | −0.44 |
| EC | 0.81 | 0.54 | 0.23 |
| TDS | 0.80 | 0.54 | 0.24 |
| Cl− | 0.76 | 0.28 | 0.38 |
| SO42− | 0.31 | 0.74 | −0.02 |
| NO3− | 0.28 | 0.18 | 0.94 |
| HCO3− | 0.01 | 0.09 | 0.69 |
| Ca2+ | 0.34 | 0.86 | 0.31 |
| Mg2+ | 0.34 | 0.93 | 0.11 |
| Na+ | 0.98 | 0.07 | 0.03 |
| K+ | 0.64 | 0.40 | −0.05 |
| %Var | 33 | 32 | 18 |
| Acum | 33 | 65 | 83 |
| FO | Factors | ||
|---|---|---|---|
| 1 | 2 | 3 | |
| B | 0.02 | 0.99 | 0.04 |
| Mn | 0.94 | 0.06 | −0.03 |
| Fe | 0.87 | 0.01 | 0.07 |
| As | −0.24 | −0.42 | 0.51 |
| Sr | 0.01 | 0.65 | −0.25 |
| F | 0.08 | −0.07 | 0.99 |
| Al | 0.78 | 0.03 | −0.10 |
| %Var | 33 | 23 | 19 |
| Acum | 33 | 56 | 75 |
| FT | Factors | |||
|---|---|---|---|---|
| 1 | 2 | 3 | 4 | |
| 0.04 | 0.78 | −0.02 | 0.10 | |
| −0.07 | 0.83 | 0.17 | 0.18 | |
| pH | −0.35 | 0.43 | −0.69 | −0.15 |
| EC | 0.88 | 0.15 | 0.43 | 0.09 |
| TDS | 0.87 | 0.16 | 0.44 | 0.10 |
| Cl− | 0.63 | 0.37 | 0.58 | 0.08 |
| SO42− | 0.83 | −0.47 | 0.01 | 0.01 |
| NO3− | 0.25 | 0.08 | 0.78 | −0.34 |
| HCO3− | 0.05 | −0.02 | 0.51 | −0.38 |
| Ca2+ | 0.71 | −0.36 | 0.56 | 0.05 |
| Mg2+ | 0.79 | −0.41 | 0.37 | 0.05 |
| Na+ | 0.77 | 0.52 | 0.11 | 0.10 |
| K+ | 0.78 | 0.14 | 0.03 | −0.05 |
| B | 0.86 | −0.30 | −0.24 | −0.01 |
| Mn | 0.06 | 0.03 | −0.03 | 0.87 |
| Fe | 0.02 | 0.10 | −0.10 | 0.86 |
| As | −0.30 | 0.55 | −0.06 | −0.33 |
| Sr | 0.82 | −0.26 | 0.40 | 0.05 |
| F | 0.05 | 0.69 | −0.40 | −0.05 |
| Al | 0.04 | −0.02 | −0.07 | 0.80 |
| %Var | 33 | 17 | 15 | 13 |
| Acum | 33 | 50 | 65 | 78 |
| Water Quality Parameters | Permissible Limit MINSA | wi | Wi |
|---|---|---|---|
| pH | 6.5–8.5 | 1 | 0.02 |
| TDS | 1000 | 5 | 0.09 |
| Cl− | 250 | 5 | 0.09 |
| SO42− | 250 | 5 | 0.09 |
| NO3− | 50 | 5 | 0.09 |
| Ca2+ | 200 | 3 | 0.06 |
| Mg2+ | 150 | 3 | 0.06 |
| Na+ | 200 | 4 | 0.08 |
| B | 1.5 | 5 | 0.09 |
| Mn | 0.4 | 2 | 0.04 |
| Fe | 0.3 | 2 | 0.04 |
| As | 0.01 | 5 | 0.09 |
| F | 1.0 | 5 | 0.09 |
| Al | 0.2 | 3 | 0.06 |
Publisher’s Note: MDPI stays neutral with regard to jurisdictional claims in published maps and institutional affiliations. |
© 2022 by the authors. Licensee MDPI, Basel, Switzerland. This article is an open access article distributed under the terms and conditions of the Creative Commons Attribution (CC BY) license (https://creativecommons.org/licenses/by/4.0/).
Share and Cite
Chucuya, S.; Vera, A.; Pino-Vargas, E.; Steenken, A.; Mahlknecht, J.; Montalván, I. Hydrogeochemical Characterization and Identification of Factors Influencing Groundwater Quality in Coastal Aquifers, Case: La Yarada, Tacna, Peru. Int. J. Environ. Res. Public Health 2022, 19, 2815. https://doi.org/10.3390/ijerph19052815
Chucuya S, Vera A, Pino-Vargas E, Steenken A, Mahlknecht J, Montalván I. Hydrogeochemical Characterization and Identification of Factors Influencing Groundwater Quality in Coastal Aquifers, Case: La Yarada, Tacna, Peru. International Journal of Environmental Research and Public Health. 2022; 19(5):2815. https://doi.org/10.3390/ijerph19052815
Chicago/Turabian StyleChucuya, Samuel, Alissa Vera, Edwin Pino-Vargas, André Steenken, Jürgen Mahlknecht, and Isaac Montalván. 2022. "Hydrogeochemical Characterization and Identification of Factors Influencing Groundwater Quality in Coastal Aquifers, Case: La Yarada, Tacna, Peru" International Journal of Environmental Research and Public Health 19, no. 5: 2815. https://doi.org/10.3390/ijerph19052815