
Socioeconomic Inequalities in the Prevalence of Diabetes in Argentina: A Repeated Cross-Sectional Study in Urban Women and Men


Abstract
:1. Introduction
2. Methods
2.1. Data Source
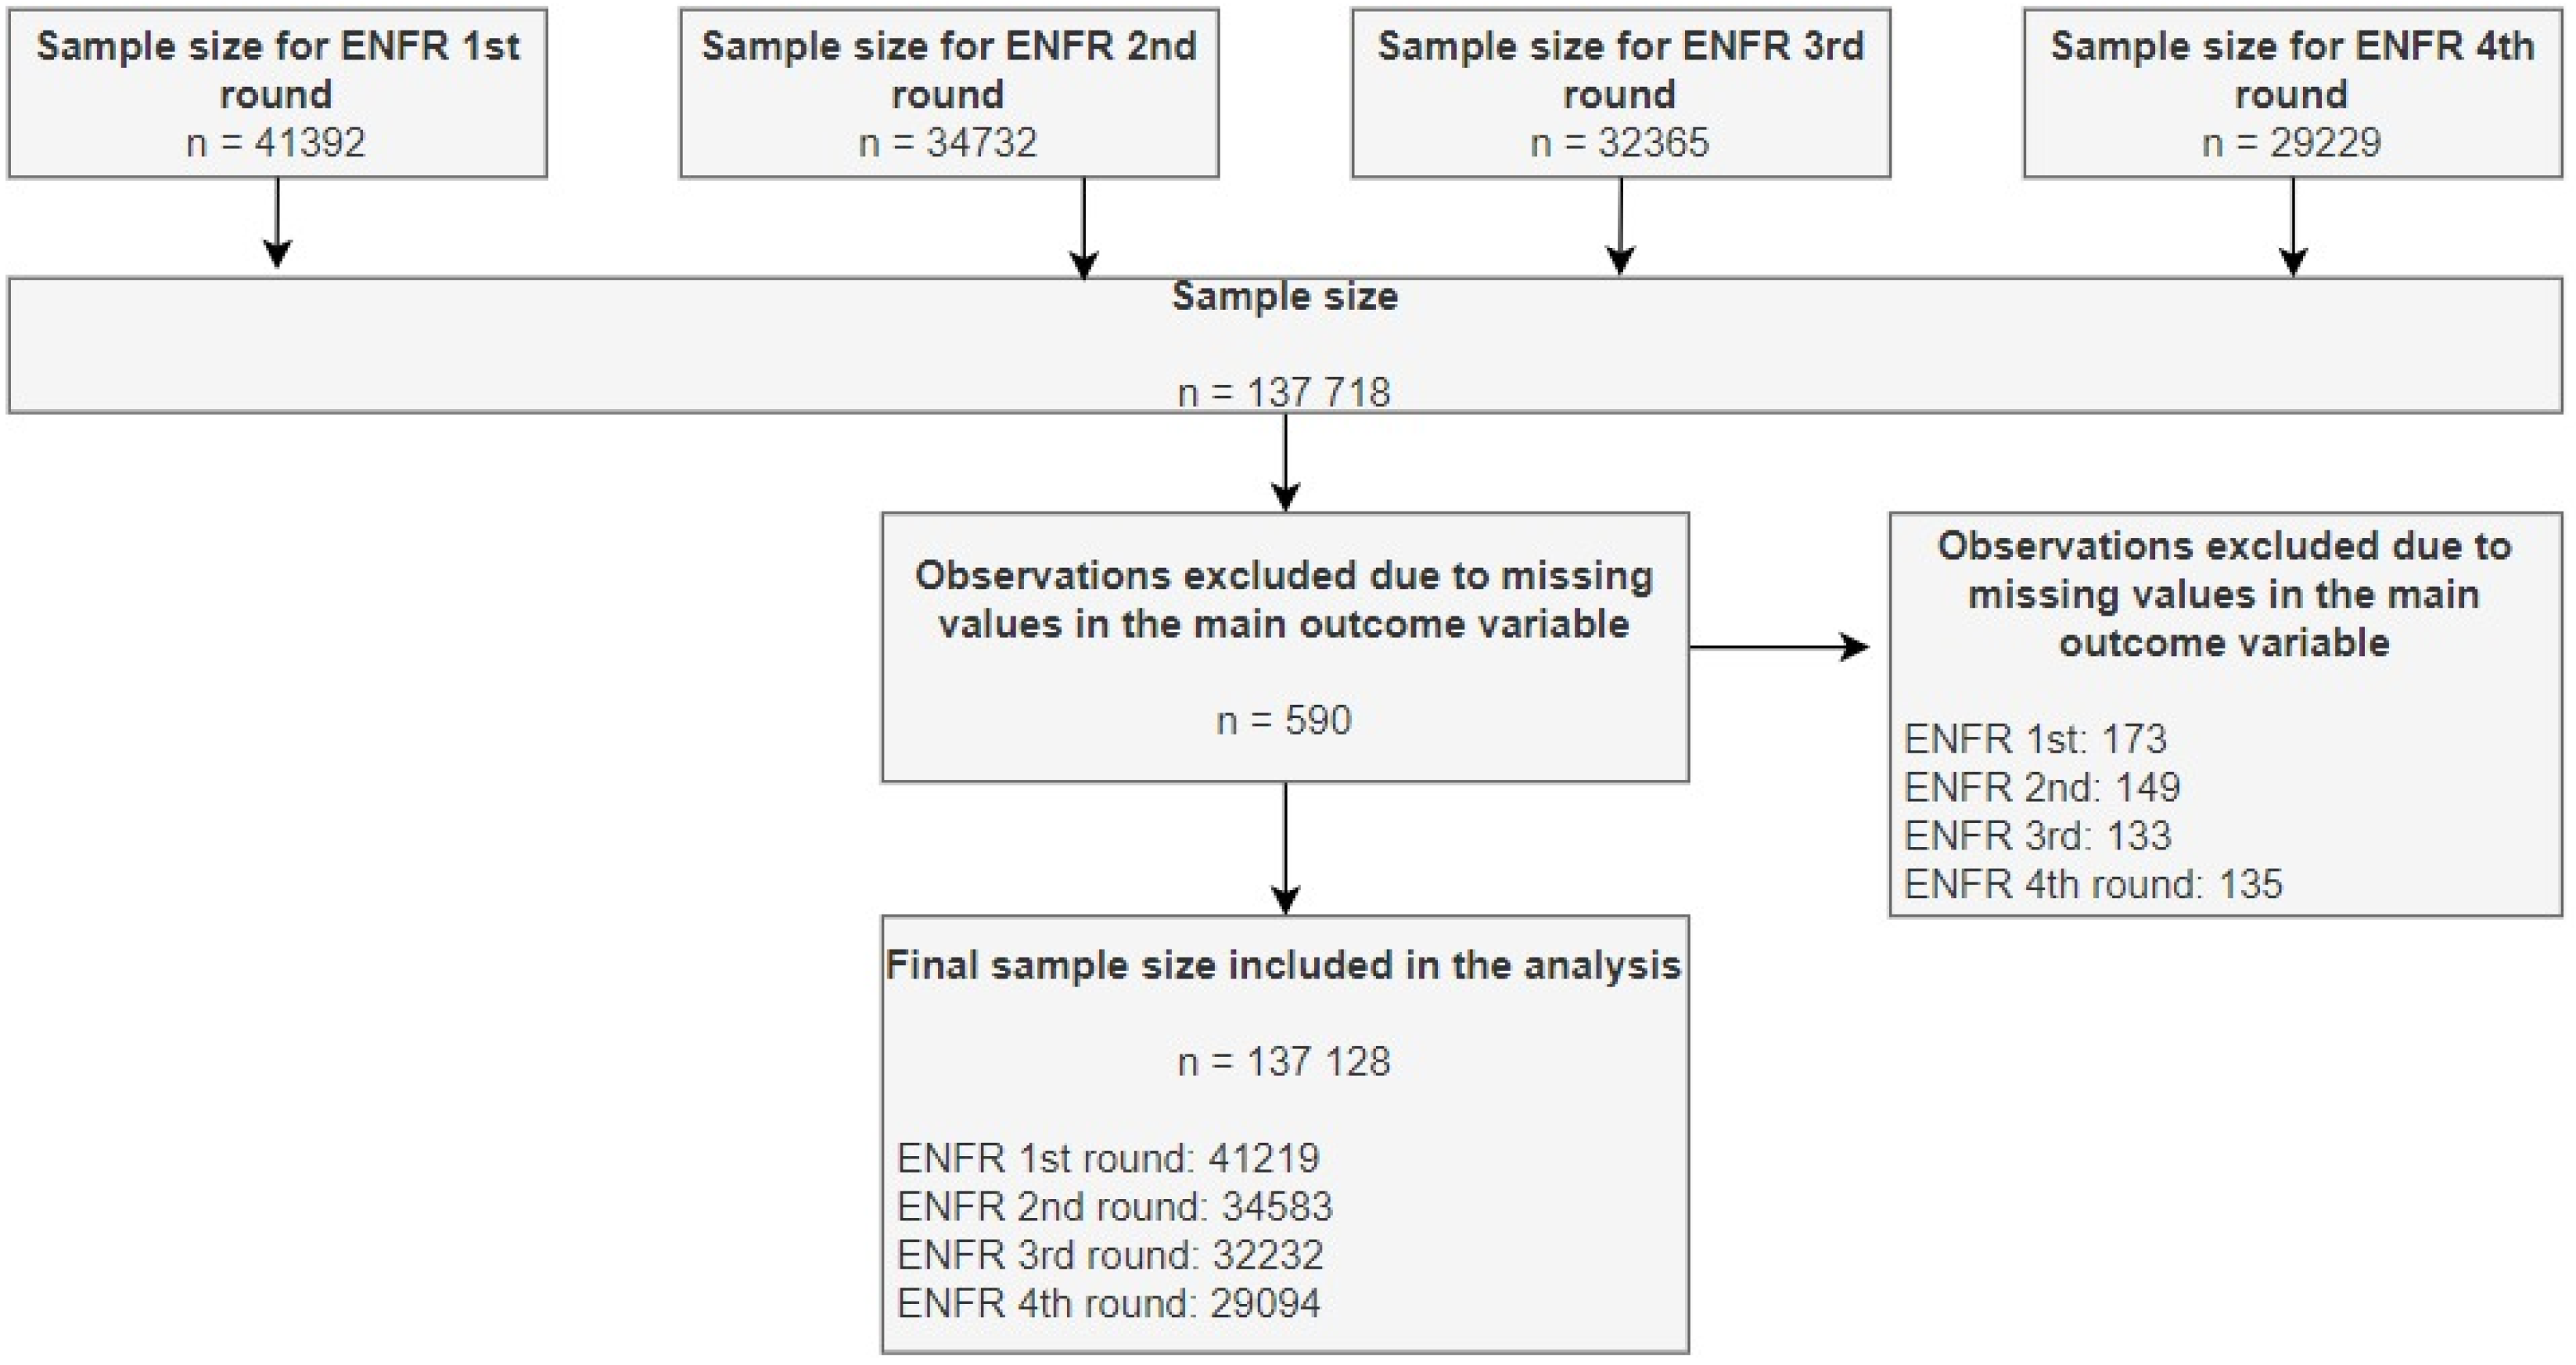
2.2. Sample Size
2.3. Outcome Variable
2.4. Independent Variables
2.5. Statistical Analysis
2.6. Ethics Statement
3. Results
4. Discussion
5. Conclusions
Author Contributions
Funding
Institutional Review Board Statement
Data Availability Statement
Conflicts of Interest
References
- World Health Organization. Global Report on Diabetes. Available online: https://www.who.int/publications/i/item/9789241565257 (accessed on 20 January 2021).
- World Health Organization. The Top 10 Causes of Death. Available online: https://www.who.int/news-room/fact-sheets/detail/the-top-10-causes-of-death (accessed on 28 January 2021).
- Emerging Risk Factors Collaboration; Sarwar, N.; Gao, P. Diabetes mellitus, fasting blood glucose concentration, and risk of vascular disease: A collaborative meta-analysis of 102 prospective studies. Lancet 2010, 375, 2215–2222. [Google Scholar] [CrossRef] [Green Version]
- Dávila-Cervantes, C.A.; Agudelo-Botero, M. Health inequalities in Latin America: Persistent gaps in life expectancy. Lancet Planet Health 2019, 3, e492–e493. [Google Scholar] [CrossRef] [Green Version]
- Gallardo-Rincón, H.; Cantoral, A.; Arrieta, A.; Espinal, C.; Magnus, M.H.; Palacios, C.; Tapia-Conyer, R. Review: Type 2 diabetes in Latin America and the Caribbean: Regional and country comparison on prevalence, trends, costs and expanded prevention. Prim. Care Diabetes 2020, 15, 352–359. [Google Scholar] [CrossRef]
- Barengo, N.C.; Trejo, R.; Sposetti, G. Prevalence of type 2 diabetes in Argentina 1979–2012. Diabetes Metab. Res. Rev. 2013. [Google Scholar] [CrossRef]
- Rubinstein, A.; Gutierrez, L.; Beratarrechea, A.; Irazola, V.E. Increased prevalence of diabetes in Argentina is due to easier health care access rather than to an actual increase in prevalence. PLoS ONE 2014, 9, e92245. [Google Scholar] [CrossRef]
- Tatulashvili, S.; Fagherazzi, G.; Dow, C.; Cohen, R.; Fosse, S.; Bihan, H. Socioeconomic inequalities and type 2 diabetes complications: A systematic review. Diabetes Metab. 2020, 46, 89–99. [Google Scholar] [CrossRef]
- Ferrante, D.; Jörgensen, N.; Langsam, M.; Marchioni, C.; Torales, S.; Torres, R. Inequalities in the Distribution of Cardiovascular Disease Risk Factors in Argentina. A Study from the 2005, 2009 and 2013 National Risk Factor Survey (NRFS). Rev. Argent. Cardiol. 2016, 84, 133–139. [Google Scholar] [CrossRef]
- INDEC; Ministry of Health of Argentina. Fourth National Survey of Risk Factors. Definitive Results; National Institute of Statistic and Census: Buenos Aires, Argentina; The Ministry of Health of Argentina: Buenos Aires, Argentina, 2019. [Google Scholar]
- Ning, M.; Zhang, Q.; Yang, M. Comparison of self-reported and biomedical data on hypertension and diabetes: Findings from the China Health and Retirement Longitudinal Study (CHARLS). BMJ Open 2016, 6, e009836. [Google Scholar] [CrossRef] [PubMed] [Green Version]
- Huerta, J.M.; Tormo, M.J.; Egea-Caparrós, J.M.; Ortolá-Devesa, J.B.; Navarro, C. Accuracy of self-reported diabetes, hypertension and hyperlipidemia in the adult Spanish population. DINO study findings. Rev. Esp. Cardiol. 2009, 62, 143–152. [Google Scholar] [CrossRef]
- Al-Hanawi, M.K.; Chirwa, G.C.; Pulok, M.H. Socio-economic inequalities in diabetes prevalence in the Kingdom of Saudi Arabia. Int. J. Health Plan. Manag. 2020, 35, 233–246. [Google Scholar] [CrossRef] [PubMed] [Green Version]
- Espelt, A.; Borrell, C.; Palència, L.; Goday, A.; Spadea, T.; Gnavi, R.; Font-Ribera, L.; Kunst, A.E. Socioeconomic inequalities in the incidence and prevalence of type 2 diabetes mellitus in Europe. Gac. Sanit. 2013, 27, 494–501. [Google Scholar] [CrossRef] [PubMed] [Green Version]
- Wang, Z.; Li, X.; Chen, M. Socioeconomic Factors and Inequality in the Prevalence and Treatment of Diabetes among Middle-Aged and Elderly Adults in China. J. Diabetes Res. 2018, 2018, 1471808. [Google Scholar] [CrossRef] [Green Version]
- The Organisation for Economic Co-Operation and Development (OECD). OECD Framework for Statistics on the Distribution of Household Income, Consumption and Wealth; OECD: Paris, France, 2013. [Google Scholar] [CrossRef] [Green Version]
- Solar, O.; Irwin, A. A Conceptual Framework for Action on the Social Determinants of Health; The World Health Organization: Geneva, Switzerland, 2010; Available online: https://www.who.int/sdhconference/resources/ConceptualframeworkforactiononSDH_eng.pdf (accessed on 11 January 2021).
- De Silva, A.P.; Haniffa, R.; Liyanage, I.K.; Jayasinghe, S.; Katulanda, P.; Wijeratne, C.N.; Wijeratne, S.; Rajapaksa, L.C. Inequalities in the prevalence of diabetes mellitus and its risk factors in Sri Lanka: A lower middle income country. Int. J. Equity Health 2018, 17, 45. [Google Scholar] [CrossRef]
- Mutyambizi, C.; Booysen, F.; Stokes, A.; Pavlova, M.; Groot, W. Lifestyle and socio-economic inequalities in diabetes prevalence in South Africa: A decomposition analysis. PLoS ONE 2019, 14, e0211208. [Google Scholar] [CrossRef] [PubMed]
- Sortsø, C.; Lauridsen, J.; Emneus, M.; Green, A.; Jensen, P.B. Social inequality in diabetes patients’ morbidity patterns from diagnosis to death—A Danish register-based investigation. Scand. J Public Health 2018, 46, 92–101. [Google Scholar] [CrossRef] [PubMed] [Green Version]
- Kunkel, S.R.; Atchley, R.C. Why gender matters: Being female is not the same as not being male. Am. J. Prev. Med. 1996, 12, 294–296. [Google Scholar] [CrossRef]
- Yitzhaki, S.; Schechtman, E. The Lorenz Curve and the Concentration Curve. In The Gini Methodology: A Primer on a Statistical Methodology; Yitzhaki, S., Schechtman, E., Eds.; Springer: New York, NY, USA, 2013; pp. 75–98. [Google Scholar] [CrossRef]
- O’Donnell, O.; Van Doorslaer, E.; Wagstaff, A.; Lindelow, M. Analyzing Health Equity Using Household Survey Data; The World Bank: Washington, DC, USA, 2007. [Google Scholar] [CrossRef]
- Wagstaff, A. The bounds of the concentration index when the variable of interest is binary, with an application to immunization inequality. Health Econ. 2005, 14, 429–432. [Google Scholar] [CrossRef]
- Erreygers, G. Correcting the concentration index. J. Health Econ. 2009, 28, 504–515. [Google Scholar] [CrossRef] [Green Version]
- O’Donnell, O.; O’Neill, S.; Van Ourti, T.; Walsh, B. Conindex: Estimation of concentration indices. Stata J. 2016, 16, 112–138. [Google Scholar] [CrossRef] [Green Version]
- Yiengprugsawan, V.; Lim, L.L.; Carmichael, G.A.; Dear, K.B.; Sleigh, A.C. Decomposing socioeconomic inequality for binary health outcomes: An improved estimation that does not vary by choice of reference group. BMC Res. Notes 2010, 3, 57. [Google Scholar] [CrossRef] [Green Version]
- World Health Organization. Diabetes Country Profiles. 2016. Available online: https://www.who.int/diabetes/country-profiles/arg_en.pdf (accessed on 28 January 2021).
- World Health Organization. Diabetes. Available online: https://www.who.int/news-room/fact-sheets/detail/diabetes (accessed on 1 February 2021).
- International Diabetes Federation. IDF Diabetes Atlas, 9th ed.; International Diabetes Federation: Brussels, Belgium, 2019. [Google Scholar]
- Willey, J.; Wakefield, M.; Silver, H.J. Exploring the Diets of Adults with Obesity and Type II Diabetes from Nine Diverse Countries: Dietary Intakes, Patterns, and Quality. Nutrients 2020, 12, 2027. [Google Scholar] [CrossRef] [PubMed]
- Sinisterra-Loaiza, L.; Cardelle-Cobas, A.; Abraham, A.G.; Calderon, M.N.; Espinoza, M.A.; González-Olivares, L.G. Diabetes in Latin America: Prevalence, complications, and Socio-economic impact. Int. J. Diabetes Clin. Res. 2019, 6, 112. [Google Scholar] [CrossRef]
- Caporale, J.E.; Elgart, J.F.; Gagliardino, J.J. Diabetes in Argentina: Cost and management of diabetes and its complications and challenges for health policy. Glob. Health 2013, 9, 54. [Google Scholar] [CrossRef] [PubMed] [Green Version]
- Chaturvedi, S.K.; Manche Gowda, S.; Ahmed, H.U.; Alosaimi, F.D.; Andreone, N.; Bobrov, A.; Bulgari, V.; Carra, G.; Castelnuovo, G.; Gondek, T.; et al. More anxious than depressed: Prevalence and correlates in a 15-nation study of anxiety disorders in people with type 2 diabetes mellitus. Gen. Psychiatry 2019, 32, e100076. [Google Scholar] [CrossRef] [Green Version]
- Hilawe, E.H.; Yatsuya, H.; Kawaguchi, L.; Aoyama, A. Differences by sex in the prevalence of diabetes mellitus, impaired fasting glycaemia and impaired glucose tolerance in sub-Saharan Africa: A systematic review and meta-analysis. Bull. World Health Organ. 2013, 91, 671D–682D. [Google Scholar] [CrossRef]
- Huebschmann, A.G.; Huxley, R.R.; Kohrt, W.M.; Zeitler, P.; Regensteiner, J.G.; Reusch, J.E.B. Sex differences in the burden of type 2 diabetes and cardiovascular risk across the life course. Diabetologia 2019, 62, 1761–1772. [Google Scholar] [CrossRef] [Green Version]
- Gonzalez, L.; Caporale, J.E.; Elgart, J.F.; Gagliardino, J.J. The burden of diabetes in Argentina. Glob. J. Health Sci. 2014, 7, 124–133. [Google Scholar] [CrossRef] [Green Version]
- Norhammar, A. Diabetes and cardiovascular mortality: The impact of sex. Lancet Diabetes Endocrinol. 2018, 6, 517–519. [Google Scholar] [CrossRef]
- Talukder, A.; Hossain, M.Z. Prevalence of Diabetes Mellitus and Its Associated Factors in Bangladesh: Application of Two-level Logistic Regression Model. Sci. Rep. 2020, 10, 10237. [Google Scholar] [CrossRef]
- Tareque, M.I.; Koshio, A.; Tiedt, A.D.; Hasegawa, T. Are the rates of hypertension and diabetes higher in people from lower socioeconomic status in Bangladesh? Results from a nationally representative survey. PLoS ONE 2015, 10, e0127954. [Google Scholar] [CrossRef] [Green Version]
- Ortiz, M.S.; Cabieses, B.; Oyarte, M.; Repetto, P. Disentangling socioeconomic inequalities of type 2 diabetes mellitus in Chile: A population-based analysis. PLoS ONE 2020, 15, e0238534. [Google Scholar] [CrossRef] [PubMed]
- De Maio, F.G.; Linetzky, B.; Virgolini, M. An average/deprivation/inequality (ADI) analysis of chronic disease outcomes and risk factors in Argentina. Popul. Health Metr. 2009, 7, 8. [Google Scholar] [CrossRef] [Green Version]
- Leite, I.D.C.; Valente, J.G.; Schramm, J.M.D.A.; Daumas, R.P.; Rodrigues, R.; Santos, M.D.F.; De Oliveira, A.F.; Da Silva, R.S.; Campos, M.R.; Da Mota, J.C. Burden of disease in Brazil and its regions, 2008. Cad. Saude. Publica 2015, 31, 1551–1564. [Google Scholar] [CrossRef] [Green Version]
- Marro, M.J.; Cardoso, A.M.; Leite, I.D.C. Desigualdades regionales en la mortalidad por diabetes mellitus y en el acceso a la salud en Argentina [Regional inequalities in mortality from diabetes mellitus and access to health in Argentina]. Cad. Saúde Pública 2017, 33, e00113016. [Google Scholar] [CrossRef] [Green Version]
- Irazola, V.; Rubinstein, A.; Bazzano, L.; Calandrelli, M.; Chung-Shiuan, C.; Elorriaga, N.; Gutierrez, L.; Lanas, F.; Manfredi, J.A.; Mores, N.; et al. Prevalence, awareness, treatment and control of diabetes and impaired fasting glucose in the Southern Cone of Latin America. PLoS ONE 2017, 12, e0183953. [Google Scholar] [CrossRef]
- Leveau, C.M.; Marro, M.J.; Alonso, V.; Lawrynowicz, A.E.B. ¿El contexto geográfico importa en la mortalidad por diabetes mellitus? Tendencias espacio-temporales en Argentina, 1990–2012. [Does geographic context matter in diabetes-related mortality? Spatial and time trends in Argentina, 1990–2012]. Cad. Saude Publica 2017, 33, e00169615. [Google Scholar] [CrossRef] [Green Version]
- Uusitupa, M.; Khan, T.A.; Viguiliouk, E.; Kahleova, H.; Rivellese, A.A.; Hermansen, K.; Pfeiffer, A.; Thanopoulou, A.; Salas-Salvadó, J.; Schwab, U.; et al. Prevention of Type 2 Diabetes by Lifestyle Changes: A Systematic Review and Meta-Analysis. Nutrients 2019, 11, 2611. [Google Scholar] [CrossRef] [Green Version]
- Aune, D.; Norat, T.; Leitzmann, M.; Tonstad, S.; Vatten, L.J. Physical activity and the risk of type 2 diabetes: A systematic review and dose-response meta-analysis. Eur. J. Epidemiol. 2015, 30, 529–542. [Google Scholar] [CrossRef]
- Salgado, M.V.; Penko, J.; Fernandez, A.; Konfino, J.; Coxson, P.G.; Bibbins-Domingo, K.; Mejia, R. Projected impact of a reduction in sugar-sweetened beverage consumption on diabetes and cardiovascular disease in Argentina: A modeling study. PLoS Med. 2020, 17, e1003224. [Google Scholar] [CrossRef]
- Chun, H.; Kim, I.-H.; Min, K.-D. Accuracy of Self-reported Hypertension, Diabetes, and Hypercholesterolemia: Analysis of a Representative Sample of Korean Older Adults. Osong Public Health Res. Perspect. 2016, 7, 108–115. [Google Scholar] [CrossRef] [Green Version]


| 2005 (n = 41,219) | 2009 (n = 34,583) | 2013 (n = 32,232) | 2018 (n = 29,094) | |
|---|---|---|---|---|
| Variables | % (95% CI) | % (95% CI) | % (95% CI) | % (95% CI) |
| Sex | ||||
| Men | 47.4 (46.25–48.46) | 46.6 (45.77–47.48) | 47.5 (46.39–48.53) | 47.6 (46.53–48.58) |
| Women | 52.6 (51.54–53.75) | 53.4 (52.52–54.23) | 52.5 (51.47–53.61) | 52.4 (51.42–53.47) |
| Age in years | ||||
| Mean (standard deviation) | 43.3 (17.94) | 43.6 (17.99) | 43.3 (17.87) | 43.9 (17.77) |
| Married or cohabiting | ||||
| Yes | 60.6 (60.56–60.60) | 59.1 (59.03–59.07) | 58.2 (58.13–58.17) | 56.8 (56.74–56.78) |
| No | 39.4 (39.40–39.44) | 40.9 (40.93–40.97) | 41.8 (41.83–41.87) | 43.2 (43.22–43.26) |
| Education | ||||
| None | 1.8 (1.83–1.84) | 1.5 (1.53–1.54) | 1.3 (1.30–1.31) | 0.9 (0.96–0.97) |
| Primary | 37.2 (37.20–37.24) | 31.9 (31.84–31.88) | 30.1 (30.09–30.12) | 24.1 (24.13–24.16) |
| Secondary | 36.9 (36.84–36.88) | 39.7 (39.67–39.71) | 41.2 (41.23–41.26) | 43.1 (43.06–43.10) |
| Higher | 24.1 (24.06–24.10) | 26.9 (26.90–26.93) | 27.4 (27.33–27.37) | 31.8 (31.79–31.83) |
| Type of health insurance a | ||||
| Private insurance | 15.3 (15.30–15.33) | 14.9 (14.89–14.92) | 13.9 (13.92–13.94) | 15.7 (15.71–15.73) |
| Social Security insurance | 47.9 (47.89–47.94) | 58.9 (58.87–58.91) | 57.0 (56.94–56.98) | 52.3 (52.24–52.28) |
| Public insurance | 36.8 (36.75–36.79) | 26.2 (26.18–26.22) | 29.1 (29.09–29.13) | 32.0 (32.00–32.04) |
| Currently employed? | ||||
| Yes | 62.7 (62.65–62.69) | 62.9 (62.87–62.91) | 62.7 (62.72–62.76) | 61.7 (61.64–61.67) |
| No | 37.3 (37.31–37.35) | 37.1 (37.09–37.13) | 37.3 (37.24–37.28) | 38.3 (38.33–38.36) |
| Household income per capita quintile b | ||||
| Q1 (Poorest) | 20.3 (20.31–20.34) | 20.4 (20.45–20.48) | 20.0 (20.02–20.05) | 20.3 (20.28–20.31) |
| Q2 | 20.2 (20.19–20.22) | 19.7 (19.64–19.67) | 20.7 (20.73–20.76) | 21.4 (21.34–21.38) |
| Q3 | 19.9 (19.95–19.98) | 20.0 (19.98–20.01) | 19.2 (19.22–19.25) | 19.4 (19.35–19.38) |
| Q4 | 20.7 (20.70–20.73) | 19.9 (19.85–19.88) | 20.0 (20.04–20.07) | 19.8 (19.79–19.82) |
| Q5 (Wealthiest) | 18.8 (18.74–18.78) | 20.0 (19.98–20.01) | 19.9 (19.89–19.92) | 19.1 (19.13–19.16) |
| Geographical region | ||||
| Metropolitan | 39.3 (39.26–39.30) | 36.3 (36.32–36.36) | 37.4 (37.39–37.43) | 38.8 (38.78–38.82) |
| Pampeana | 33.2 (33.13–33.17) | 35.1 (35.07–35.11) | 33.4 (33.34–33.37) | 30.9 (30.85–30.89) |
| Northwest | 9.9 (9.88–9.90) | 10.4 (10.36–10.38) | 10.3 (10.24–10.26) | 10.7 (10.70–10.73) |
| Northeast | 6.8 (6.83–6.85) | 7.2 (7.23–7.25) | 7.3 (7.32–7.34) | 7.7 (7.66–7.68) |
| Cuyo | 6.4 (6.41–6.43) | 6.5 (6.44–6.46) | 6.5 (6.44–6.46) | 6.5 (6.51–6.53) |
| Patagonia | 4.4 (4.41–4.43) | 4.5 (4.51–4.53) | 5.2 (5.20–5.22) | 5.4 (5.42–5.43) |
| 2005 Men | 2018 Men | 2005 Women | 2018 Women | |||||||||||||
|---|---|---|---|---|---|---|---|---|---|---|---|---|---|---|---|---|
| Variable | Elasticity | CI | Contribution | % Contribution | Elasticity | CI | Contribution | % Contribution | Elasticity | CI | Contribution | % Contribution | Elasticity | CI | Contribution | % Contribution |
| Age group, in years | ||||||||||||||||
| 18–29 | Base | Base | Base | Base | Base | Base | Base | Base | Base | Base | Base | Base | Base | Base | Base | Base |
| 30–59 | 0.1691 | 0.0749 | 0.0127 | −117.7130 | 0.2139 | 0.1165 | 0.0249 | −246.3620 | 0.1298 | 0.1321 | 0.0172 | −37.5261 | 0.1036 | 0.1424 | 0.0148 | −41.1064 |
| 60 or more | 0.1128 | –0.0561 | −0.0063 | 51.8197 | 0.1455 | –0.0473 | −0.0069 | 68.0948 | 0.1085 | –0.0948 | −0.0103 | 22.4872 | 0.0775 | –0.0626 | −0.0049 | 13.5258 |
| Married or cohabiting | ||||||||||||||||
| Yes | 0.0205 | 0.0233 | 0.0005 | −4.2448 | 0.0575 | 0.1159 | 0.0067 | −65.8559 | 0.0343 | 0.1665 | 0.0057 | −12.4906 | 0.0379 | 0.1845 | 0.0070 | −19.4643 |
| No | Base | Base | Base | Base | Base | Base | Base | Base | Base | Base | Base | Base | Base | Base | Base | Base |
| Education | ||||||||||||||||
| None | 0.0010 | −0.0318 | 0.0000 | 0.2962 | −0.0019 | –0.0118 | 0.0000 | −0.2222 | 0.0040 | –0.0360 | −0.0001 | 0.3157 | 0.0036 | –0.0144 | −0.0001 | 0.1460 |
| Primary | 0.0468 | −0.3678 | −0.0172 | 159.9779 | 0.0042 | −0.2448 | −0.0010 | 10.2248 | 0.0377 | –0.3769 | −0.0142 | 31.1138 | 0.0673 | –0.2245 | −0.0151 | 42.0503 |
| Secondary | 0.0235 | 0.0122 | 0.0003 | −2.6606 | −0.0079 | −0.0729 | 0.0006 | −5.7288 | 0.0048 | 0.0313 | 0.0002 | −0.3315 | 0.0504 | –0.1145 | −0.0058 | 16.0739 |
| Higher | Base | Base | Base | Base | Base | Base | Base | Base | Base | Base | Base | Base | Base | Base | Base | Base |
| Type of health insurance | ||||||||||||||||
| Private insurance | 0.0098 | 0.1892 | 0.0019 | −17.2940 | 0.0282 | 0.1892 | 0.0053 | −52.7814 | 0.2111 | 0.0211 | 0.0042 | −9.2671 | -0.0181 | 0.2137 | −0.0039 | 10.7629 |
| Social Security insurance | 0.0364 | 0.2851 | 0.0104 | −96.5498 | 0.1214 | 0.1916 | 0.0233 | −230.0361 | 0.0860 | 0.2552 | 0.0219 | −48.0006 | −0.0599 | 0.1434 | −0.0086 | 23.9317 |
| Public insurance | 0.0121 | −0.4625 | −0.0056 | 52.1129 | 0.0571 | −0.3804 | −0.0217 | 214.6260 | 0.0786 | −0.4621 | −0.0363 | 79.4977 | –0.0387 | −0.3502 | 0.0136 | −37.7785 |
| Currently employed? | ||||||||||||||||
| Yes | −0.1010 | 0.1069 | −0.0108 | 100.3942 | −0.0974 | 0.1522 | −0.0148 | 146.5333 | −0.0299 | 0.1658 | −0.0050 | 10.8341 | −0.0476 | 0.2039 | −0.0097 | 27.0251 |
| No | Base | Base | Base | Base | Base | Base | Base | Base | Base | Base | Base | Base | Base | Base | Base | Base |
| Household income per capita quintile a | ||||||||||||||||
| Q1 (Poorest) | 0.0010 | −0.5309 | −0.0005 | 4.7730 | 0.0166 | –0.5794 | −0.0096 | 95.3637 | 0.0275 | −0.6709 | −0.0269 | 57.7319 | −0.0094 | −0.6385 | 0.0060 | −16.7285 |
| Q2 | 0.0002 | −0.3371 | −0.0001 | 0.5097 | 0.0063 | −0.2979 | −0.0019 | 18.5930 | 0.0331 | −0.2525 | −0.0083 | 18.2575 | 0.0079 | −0.2543 | −0.0020 | 5.5669 |
| Q3 | −0.0191 | −0.0581 | 0.0011 | −10.3427 | –0.0018 | −0.0125 | 0.0000 | −0.2262 | 0.0312 | 0.0455 | 0.0014 | −3.1105 | 0.0110 | 0.0199 | 0.0002 | −0.6104 |
| Q4 | 0.0040 | 0.2888 | 0.0012 | −10.8355 | −0.0020 | 0.2713 | −0.0005 | 5.3929 | 0.0362 | 0.3462 | 0.0125 | −27.4487 | –0.0074 | 0.3043 | −0.0022 | 6.2332 |
| Q5 (Wealthiest) | Base | Base | Base | Base | Base | Base | Base | Base | Base | Base | Base | Base | Base | Base | Base | Base |
| Explained inequality | −0.0126 | 110.2433 | 0.0043 | −42.3842 | −0.0380 | 82.0629 | −0.0106 | 29.6277 | ||||||||
| Residual | −0.0019 | −10.2433 | 0.0144 | 142.3842 | 0.0077 | 17.9371 | 0.0253 | 70.3723 | ||||||||
Publisher’s Note: MDPI stays neutral with regard to jurisdictional claims in published maps and institutional affiliations. |
© 2022 by the authors. Licensee MDPI, Basel, Switzerland. This article is an open access article distributed under the terms and conditions of the Creative Commons Attribution (CC BY) license (https://creativecommons.org/licenses/by/4.0/).
Share and Cite
Rojas-Roque, C.; Hernández-Vásquez, A.; Azañedo, D.; Bendezu-Quispe, G. Socioeconomic Inequalities in the Prevalence of Diabetes in Argentina: A Repeated Cross-Sectional Study in Urban Women and Men. Int. J. Environ. Res. Public Health 2022, 19, 8888. https://doi.org/10.3390/ijerph19158888
Rojas-Roque C, Hernández-Vásquez A, Azañedo D, Bendezu-Quispe G. Socioeconomic Inequalities in the Prevalence of Diabetes in Argentina: A Repeated Cross-Sectional Study in Urban Women and Men. International Journal of Environmental Research and Public Health. 2022; 19(15):8888. https://doi.org/10.3390/ijerph19158888
Chicago/Turabian StyleRojas-Roque, Carlos, Akram Hernández-Vásquez, Diego Azañedo, and Guido Bendezu-Quispe. 2022. "Socioeconomic Inequalities in the Prevalence of Diabetes in Argentina: A Repeated Cross-Sectional Study in Urban Women and Men" International Journal of Environmental Research and Public Health 19, no. 15: 8888. https://doi.org/10.3390/ijerph19158888