Article

Functioning of the EROS-R Scale in a Clinical Sample of Psychiatric Patients: New Psychometric Evidence from the Classical Test Theory and the Item Response Theory

by
Lindsey W. Vilca
1,*,
Evelyn L. Chambi-Mamani
2,
Emely D. Quispe-Kana
2,
Mónica Hernández-López
3 and
Tomás Caycho-Rodríguez
4
1
South American Center for Education and Research in Public Health, Universidad Norbert Wiener, Lima 15011, Peru
2
Department of Psychology, Universidad Peruana Unión, Lima 15472, Peru
3
Department of Psychology, Universidad de Jaén, 23071 Jaén, Spain
4
Facultad de Ciencias de la Salud, Carrera de Psicología, Universidad Privada del Norte, Lima 15314, Peru
*
Author to whom correspondence should be addressed.
Int. J. Environ. Res. Public Health 2022, 19(16), 10062; https://doi.org/10.3390/ijerph191610062
Submission received: 22 June 2022 / Revised: 5 August 2022 / Accepted: 7 August 2022 / Published: 15 August 2022

Abstract

:
Reliable and valid assessment instruments that can be applied briefly and easily in clinical and outpatient settings that provide information about the sources of reinforcement that the patient finds in his life are especially relevant in therapy. The study aimed to evaluate the psychometric properties of the Environmental Reward Observation Scale (EROS-R) in a sample of psychiatric patients. A sample of 228 psychiatric patients of both sexes (56.1% men and 43.9% women) aged between 18 and 70 years was selected. Along with the EROS-R, other instruments were administered to assess depression and anxiety. The results show that the scale fits a unidimensional model, presenting adequate fit indices (RMSEA = 0.077 (IC 90% 0.055–0.100); SRMR = 0.048; CFI = 0.98; TLI = 0.98). It was also shown that the degree of reward provided by the environment (EROS-R) correlates negatively with the level of depression (ρ = −0.54; p < 0.01) and anxiety (ρ = −0.34; p < 0.01). From the IRT perspective, all the items present adequate discrimination indices, where item 4 is the most precise indicator to measure the degree of environmental reward. All this leads us to conclude that the EROS-R is an instrument with robust psychometric guarantees from TCT and IRT’s perspectives, making it suitable for use in clinical contexts.

1. Introduction

Behavioral activation (BA) is a therapeutic approach encompassed in so-called third-generation therapies [1]. Its efficacy has been demonstrated in several systematic reviews and meta-analysis studies in children and adolescents [2], adults [3,4], older adults [5] and in people with neurological conditions [6]. At a theoretical level, it starts from a basic premise: the key to changing how a person feels begins by helping them change what they do [7]. This idea is perfectly consistent with classical behavioral models of depression that assume that when people have a low level of positive reinforcement or a high level of punishment, they can develop depressive behavior patterns [8]. If people behave and do not obtain desirable results, they are likely to avoid punitive or non-reinforcing contexts and stop doing those things that are important to them. The less they do, the less they want to do (or feel they cannot do), entering a vicious circle. The withdrawal from life leads them to focus on how they feel. Their struggle now centers on avoiding bothersome thoughts and feelings and the conditions that cause them. By failing to act and follow what matters to them in life, they reduce contact with potential reinforcers in the environment, thus increasing their feelings of sadness and making problems worse in a characteristic pattern of experiential avoidance [9]. BA proposes, through a brief and structured program: (1) to increase behaviors that allow the person to be in an environment that provides reinforcing contingencies and (2) to break with the dysfunctional pattern of experiential avoidance [10,11]. It is precisely its brief and structured nature and the relative simplicity of its administration that make BA a cost-effective intervention approach whose adoption for the treatment of psychiatric inpatients with depressive symptomatology has produced positive results [12,13,14]. These positive results appear to be preceded by an increase in reinforcement contingencies provided by the environment [15,16], which is coherent with the theory underlying BA. It is well-known that an increase in the sources of reinforcement subsequently produces an increase in psychiatric inpatients’ motivation, facilitating the development of new skills and the pursuit of personally relevant goals, as well as an increase in their levels of self-efficacy [17].
One of the keys to treatment in BA is the use of records in which patients monitor the activities they carry out, as well as the variations that getting involved in these activities generates in their state of mind and in the emotions they experience [18]. These records serve as an evaluation tool and function as an active part of the therapy [7] and, therefore, are irreplaceable. However, reliable and valid evaluation instruments that can be applied briefly and easily in clinical and outpatient settings and that provide information about the sources of reinforcement the patient finds in his life can be a particularly relevant complement to assessing the changes resulting from activation.
In this sense, the Environmental Reward Observation Scale [19] (EROS) is one of the most used instruments to measure the behavioral change in patients and monitor the objectives set in BA. The EROS is a brief ten-item scale that, according to its authors, makes it possible to measure the availability of reinforcement and the person’s ability to obtain positive reinforcement from their environment. The scale has been widely used both in correlational studies that explore the relationship between reinforcement availability and symptomatology [20,21,22,23] and in intervention studies focused on determining the effectiveness of treatments and their processes of change [16,24,25,26,27,28]. However, it is essential to note that the psychometric properties of the EROS were originally explored with a non-clinical population, and there is hardly any evidence of the psychometric properties of the scale and its operation in a clinical population (patients with a diagnosis of depression, anxiety, psychosis, or other psychiatric disorders).
Barraca and Pérez-Álvarez [29] carried out the first adaptation of the instrument for a Spanish population and found that the scale had adequate internal consistency. Conducting an exploratory factor analysis, they found a two-factor solution; although the first factor explained more than 45% of the variance, they concluded that the unifactorial structure of the original instrument could be accepted. In addition, they found that the EROS presented significant correlations with measures of anxiety, depression, and experiential avoidance and made it possible to discriminate between clinical and non-clinical samples, but not between clinical samples with different diagnoses. Recently, Fernández-Rodríguez et al. [30] validated the instrument with a sample of female breast cancer survivors. However, from the classical test theory (CTT) perspective, the study showed that the one-dimensional model presented adjustment problems (CFI = 0.95; RMSEA = 0.116 (IC 90% 0.096–0.137)) and from the perspective of the item response theory (IRT), items 2 (a = 0.72) and 10 (a = 0.95) presented low levels of discrimination. Additionally, with a Spanish-speaking population, Vilca et al. [31] developed a version of only positive items (EROS-R) of the EROS scale. This instrument presented more robust psychometric properties compared to the original positive and negative item scale. In addition, it showed excellent psychometric properties in internal structure-based validity (RMSEA = 0.07; CFI = 0.98; TLI = 0.98), relationship-based validity with other variables, and test–retest reliability (0.70 (CI 95% 0.593–0.788)). It also showed strict factorial invariance according to the sex of the participants (Δχ2 = 0.34; p > 0.05; ΔCFI = 0.003) and over time (Δχ2 = 0.29; p > 0.05; ΔCFI = 0.004). However, the psychometric properties of the EROS-R scale were studied in a non-clinical population, specifically, university students. Therefore, psychometric evidence of the EROS-R scale has not yet been reported using item response theory (IRT) in a clinical population.
It is essential to point out that IRT models have three fundamental advantages that can be used in the clinical context [32]: (a) Invariance of the item parameters; that is, the item parameters do not vary, although the people who answer are different. (b) Invariance of the evaluated trait parameter concerning the instrument used for its estimation; that is, the person’s skill level does not depend on the test. (c) It provides local precision measures through the item information curve (IIC) and the test information curve (TIC). These characteristics allow knowing in detail the area in which the trait measured by the test is being measured better. In other words, it allows knowing for which trait level the instrument is best designed. These characteristics also allow for more reliable comparisons between those evaluated.
Based on the preceding, evaluating and guaranteeing the proper psychometric performance of the scale in clinical samples is essential. We believe the scale will be helpful in applied contexts and with patients with psychological disorders, mainly for two reasons. First, the scale provides information that could be used to make clinical decisions about the process and the extent of treatment. Second, it could allow a better understanding of how patients, in a clinical context, perceive the availability of positive reinforcement from their environment and how this variable could mediate intervention results.
For all the above, the present study was carried out with the following objectives: (a) to evaluate the validity based on the internal structure through CFA and IRT models, (b) to evaluate the validity based on its relationship with other variables, and (c) to estimate the reliability of the scale in psychiatric patients.

2. Method

2.1. Design

The present study has an instrumental design since the objectives are oriented to the evaluation of the psychometric properties of a measurement instrument [33].

2.2. Participants

A sample of 228 Peruvian psychiatric patients of both genders (128 (56.1%) male and 100 (43.9%) female) between the ages of 18 and 70 years (M = 42.1, SD = 14.1) who attended two mental health centers as outpatients were collected. The most frequent diagnoses were schizophrenia (152 (66.5%)), bipolar disorder (35 (15.4%)), major depression (14 (6.1%)), borderline personality disorder (11 (4.6%)), and obsessive compulsive disorder (7 (3.1%)). Regarding their educational level, the majority completed secondary school (122 (53.5%)) and the others, to a lesser extent, completed primary school (64 (28.1%)) and higher education (42 (18.4%)). Regarding the treatment time received in both centers, the highest proportion of patients received one month to one year of treatment (74.1%). Furthermore, all participants lived in an urban area.
The following exclusion criteria were used: (a) active suicidal ideation, (b) moderate or severe neurological deficit, (c) active symptoms of psychosis that do not allow adequate contact with reality, and (d) medical conditions that prevent the patient from participating in the study.

3. Measures

3.1. Environmental Reward Observation Scale (EROS-R)

The original EROS scale was developed by Armento and Hopko [19] to measure the degree of reward provided by the environment. For the present study, the version adapted into Spanish by Vilca et al. [31], where it showed adequate reliability indices (ω = 0.93 (IC 95% = 0.92–0.94)) and validity based on the internal structure (CFI = 0.98; TLI = 0.98; RMSEA = 0.075) in university students, was used. The scale is made up of 10 items (Supplementary Materials) that are answered with a Likert-type scale with four response categories ranging from: “totally disagree” (1) to “totally agree” (4), and where a higher score shows a greater experience of reinforcing experiences from the environment. The version used does not have reverse items.

3.2. Generalized Anxiety Disorder Scale (GAD-7)

The GAD-7 instrument was developed by Spitzer et al. [34] to measure generalized anxiety in primary care settings. The version adapted into Spanish by García-Campayo et al. [35] was used for the study, where the one-dimensional model presented adequate fit indices (AGFI = 0.91; GFI = 0.96; CFI = 0.99; NFI = 0.98; RMSEA = 0.080) and internal consistency (α = 0.94). The scale consists of seven items that are answered using a Likert-type scale with four response categories ranging from “never” (0) to “almost every day” (3), where a higher score indicates a greater presence of the disorder. In the present study, the one-dimensional model presented adequate reliability indices (α = 0.88; ω = 0.85).

3.3. Patient Health Questionnaire (PHQ-9)

Developed by Spitzer et al. [36] and adapted to Spanish by Zhong et al. [37], the PHQ-9 aims to detect depression in primary care settings. The version adapted into Spanish demonstrated unidimensionality, local independence, and an acceptable fit for the Rasch IRT model [37]. The questionnaire is made up of nine items that have four categories ranging from “not at all” (0) to “almost every day” (3). A higher score on the questionnaire indicates the presence of depression. In the present study, the one-dimensional model presented adequate reliability indices (α = 0.84; ω = 0.81).

3.4. Procedure

The study obtained the approval of the ethics committee of the Center for Research and Innovation in Health (CIISA) of the Universidad Peruana Unión (2021-CE-FCS-UPeU-00227). In addition, the study complied with the standards established by the Declaration of Helsinki [38].
For data collection, non-probabilistic sampling was used for convenience. Two clinical psychologists, who previously coordinated with the two mental health centers, developed the list of possible participants. For the application of the instruments, a specific session was scheduled, directed by the two clinical psychologists, and lasted approximately 20 min. It is important to point out that the evaluation of the patients was carried out individually. Before application, the legal guardians were informed of the study’s objectives, and their permission to participate in the study was obtained. During the data collection, the anonymity and confidentiality of the results were ensured. In addition, the study’s objectives were explained to the patients, and doubts related to the procedure were resolved. A previous evaluation was also carried out to determine the attention and understanding capacity of the patients. Only lucid patients who had their legal guardians’ approval and consent to participate in the study completed the instruments. It is important to note that the instruments were self-administered by the patients themselves.

3.5. Data Analysis

A confirmatory factor analysis (CFA) was performed using the diagonally weighted least squares with mean- and variance-corrected (WLSMV) estimator since the items are at the ordinal level [39]. The root mean square error of approximation (RMSEA), standardized root mean squared residual (SRMR), comparative fit index (CFI), and Tucker–Lewis index (TLI) were used to evaluate the model’s fit. For the RMSEA and SRMR indices, values less than 0.08 were considered acceptable [40]. For the CFI and TLI, values greater than 0.95 were considered adequate [41]. To evaluate the internal consistency of the scale, Cronbach’s alpha coefficient [42], the omega coefficient corrected for correlated errors [43] and the omega coefficient for ordinal items [44] were used, where a value of ω > 0.80 was considered appropriate [45].
For item response theory (IRT), a graded response model [46] was used, specifically, an extension of the 2-parameter logistic model (2-PLM) for ordered polytomous items [47]. The M2* test was used to estimate the fit of the one-dimensional model [48], and the following fit criteria were used: RMSEA ≤ 0.08 and SRMSR ≤ 0.05 [49]. The CFI and TLI values were also taken into account, using the same adjustment criteria (≥0.95) used in SEM models [50]. Additionally, a generalization of the S-X2 estimator for polytomous items was used to assess the fit of the items [51]. Items with a p-value < 0.001 showed poor fit [52]. In addition, the size of the RMSEA was evaluated, where small values (<0.06) showed a good fit [53].
Two parameters were estimated for each item: discrimination (a) and location (b). The discrimination parameter (a) determines the slope by which responses to items change as a function of the level in the latent trait, and the item location parameters (b) determine how much of the latent trait the item requires to be answered. Since the scales have four response categories, there are three location estimates per threshold. Estimates for these three thresholds indicate the latent variable level at which an individual has a 50% chance of scoring at or above a particular response category. The item and test information curves (IIC and TIC, respectively) were also calculated.
An SEM model was used for the validity based on the relationship with other variables. In this model, the degree of reward provided by the environment is related to the level of anxiety and depression. The WLSMV estimator was used to estimate the model, and the same adjustment indicators made in the confirmatory factor analysis (CFA) were taken into account.
All statistical analyses were performed using the “lavaan” package [54] and the “ltm” package for the GRM [55]. Both cases used the RStudio environment [56] in R [57].

4. Results

4.1. Descriptive Analysis

It can be seen in Table 1 that in the polychoric correlation matrix, all the items have a moderate correlation coefficient. It can also be seen that item 10 (“The activities I do normally go well”) presents the highest average score (M = 2.70), whereas item 5 (“My life is as rewarding as other people’s”) presents the lowest average score (M = 2.52) in the clinical sample. Regarding the asymmetry and kurtosis indices, it can be seen in Table 1 that the items present adequate indices.

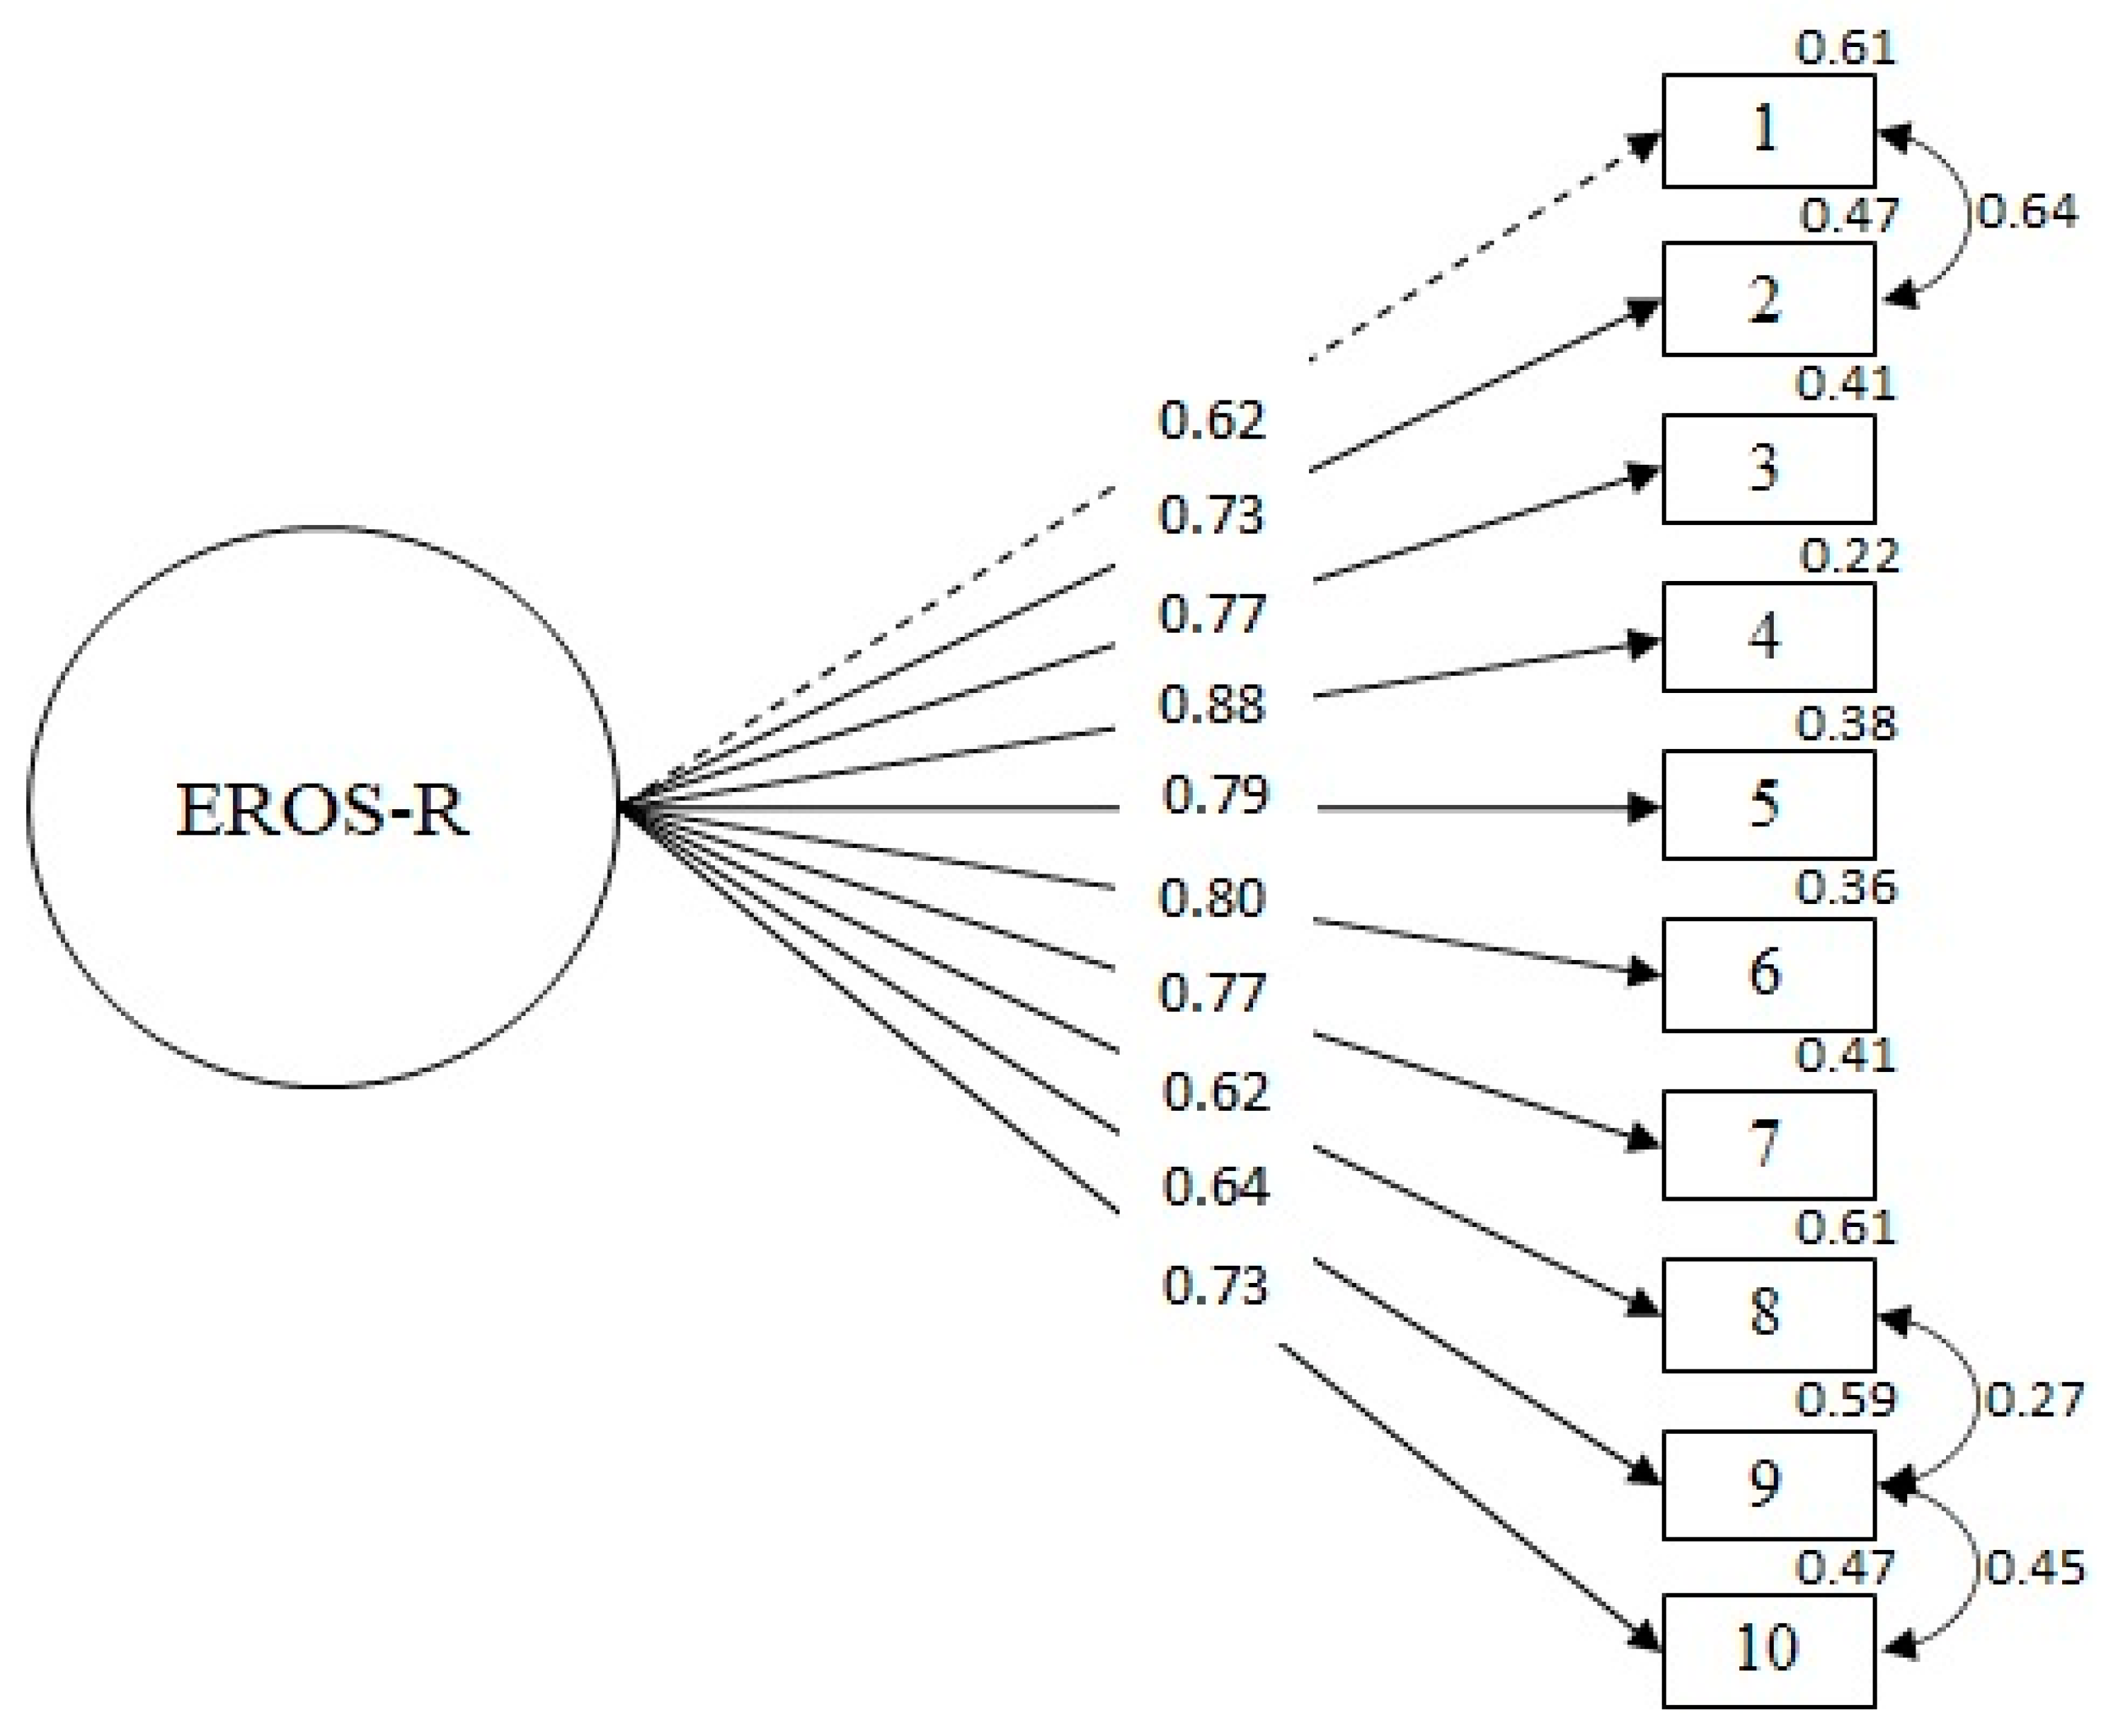
4.2. Validity Based on Internal Structure

The results of the study show evidence in favor of a one-dimensional model (χ2 = 75.60; df = 32; p = 0.000; RMSEA = 0.077 (IC 90% 0.055–0.100); SRMR = 0.048; CFI = 0.98; TLI = 0.98). Figure 1 shows that the factorial weight of the latent variable with each of its observed variables is high and significant. In addition, following the method Saris et al. [58] used to evaluate the relevance of the modification indices (MI) and according to the content analysis of items, a correlation was specified between the errors of items 1 and 2 (0.64), 8 and 9 (0.27), and 9 and 10 (0.45).

4.3. Reliability

The scale shows adequate levels of reliability since it presents an adequate corrected omega coefficient (ωc = 0.87). Similarly, it presents an adequate ordinal omega (ωo = 0.88) and a Cronbach’s alpha coefficient that can be considered acceptable (α = 0.89).

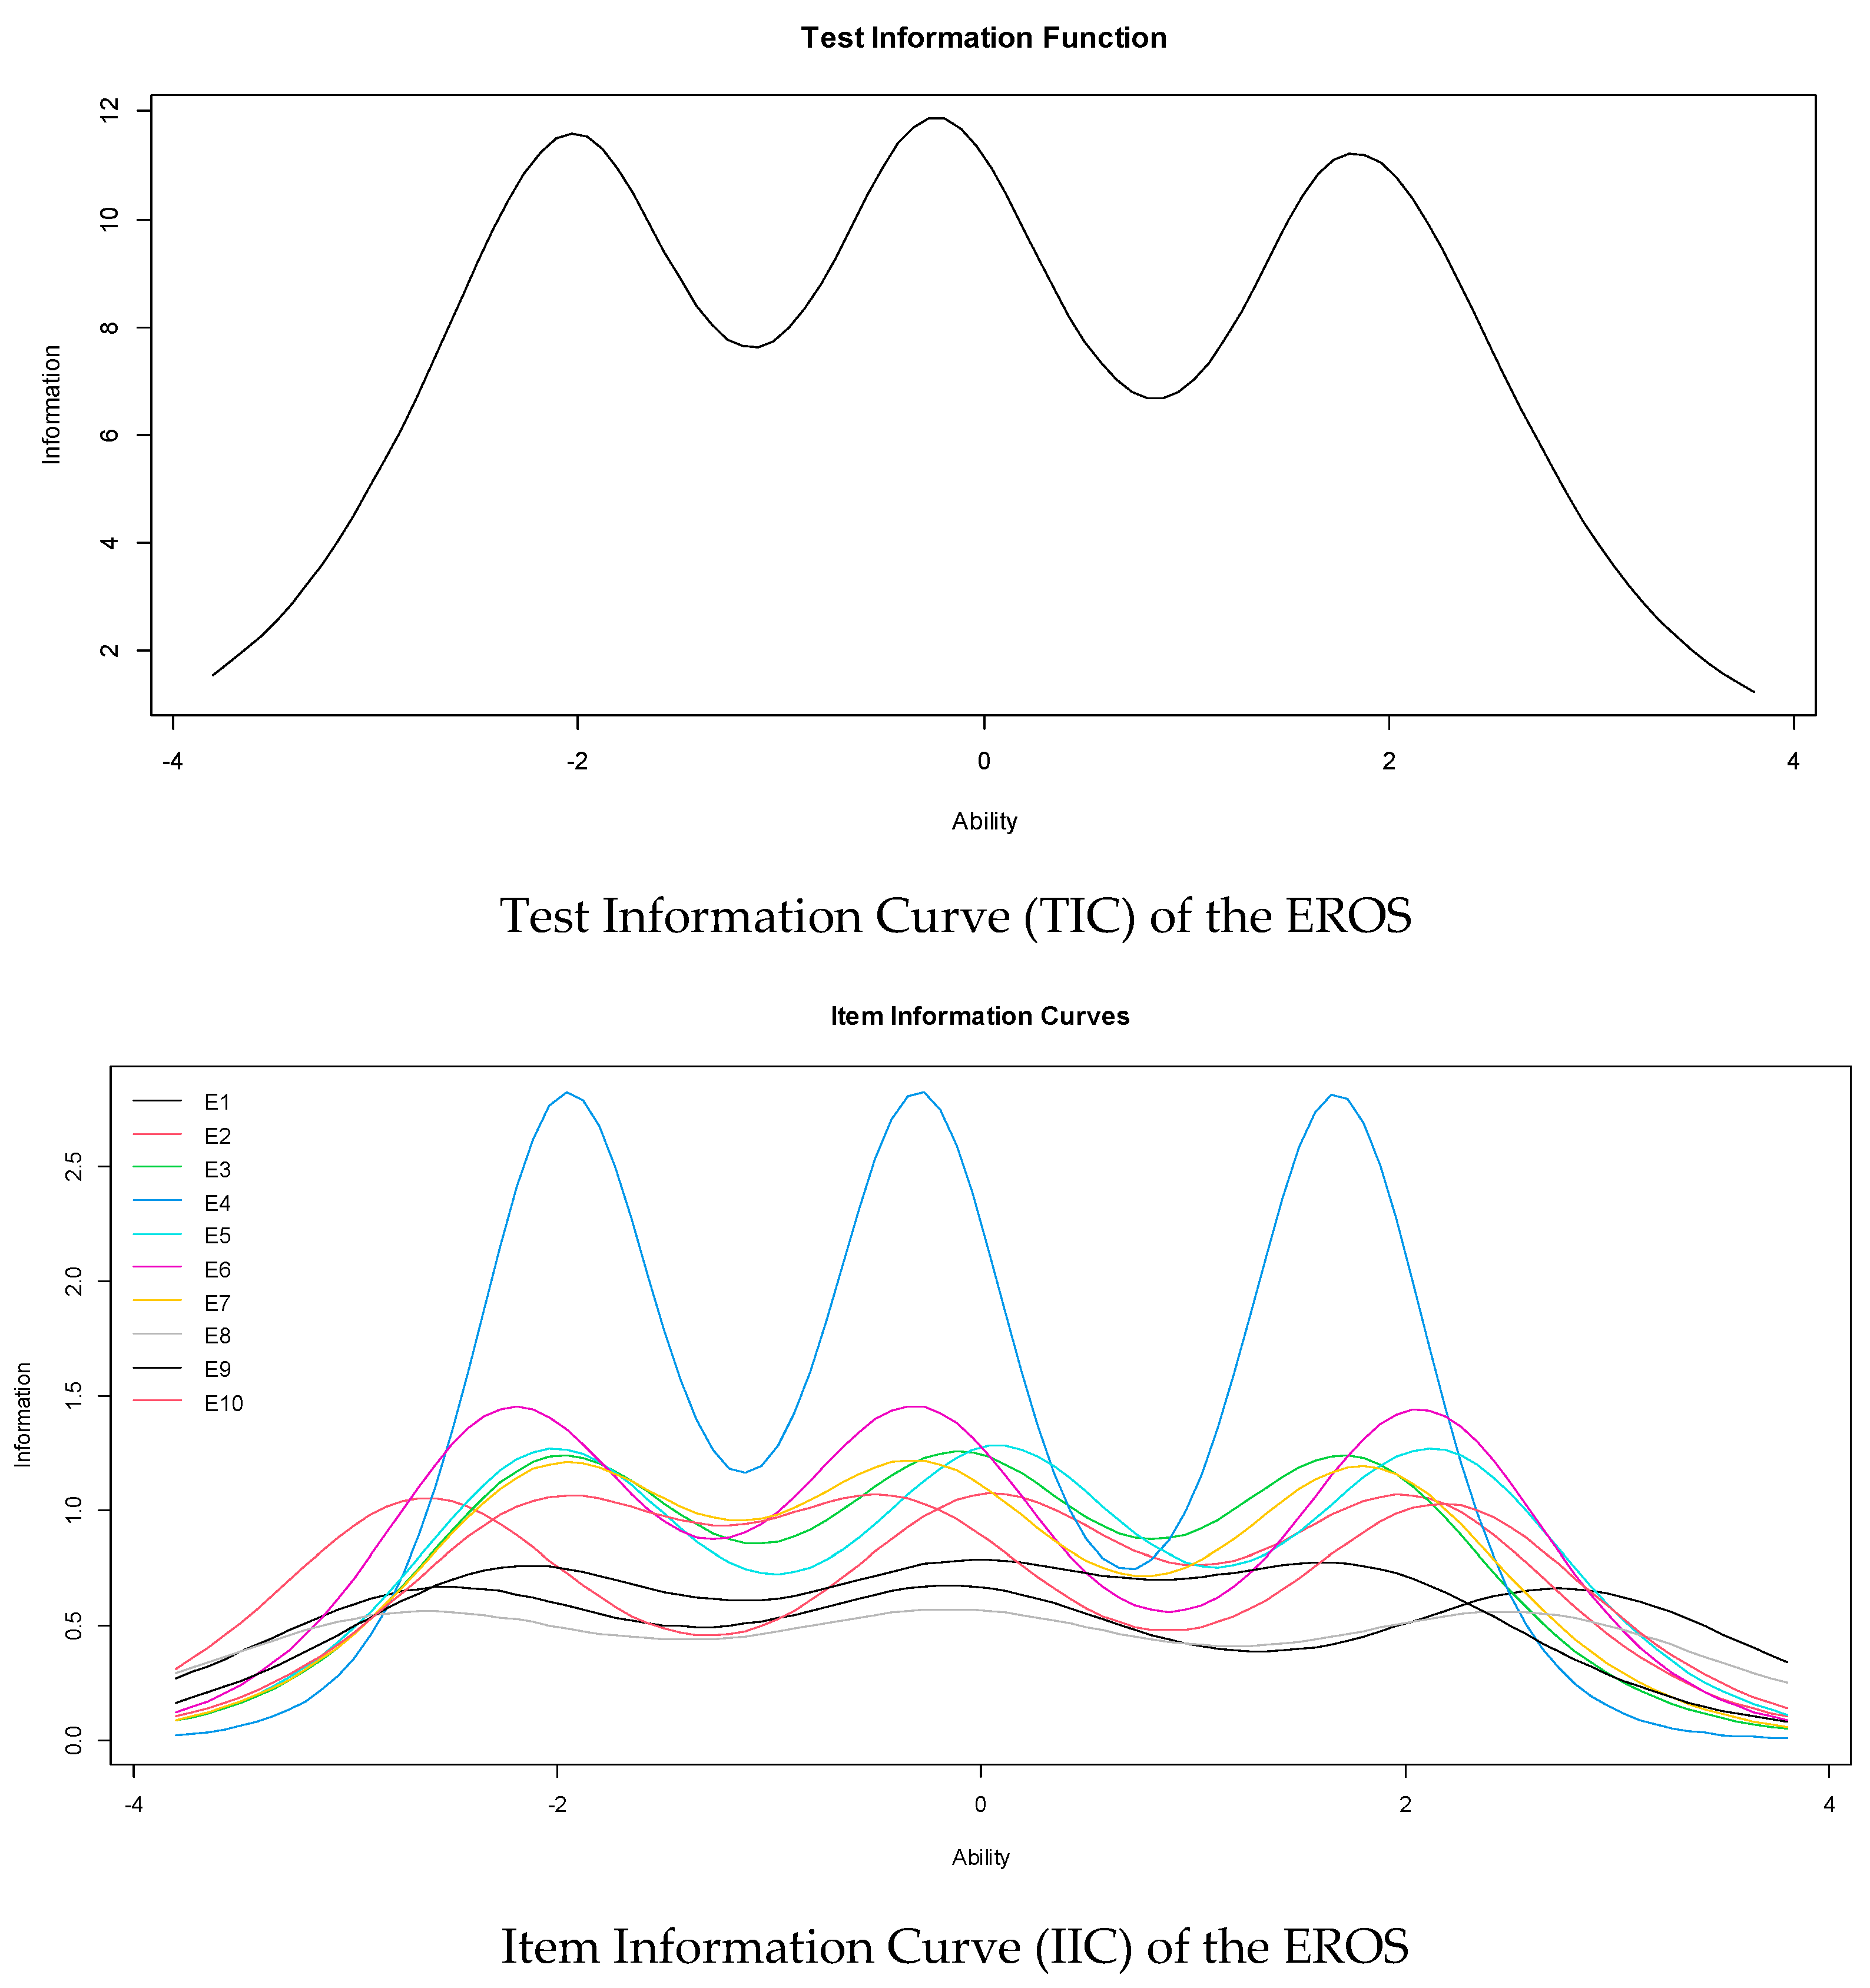
4.4. Item Response Theory Model

The results found in the confirmatory factor analysis (CFA) allow us to fulfill the unidimensionality assumption. However, the presence of correlated errors in three pairs of items in the CFA model indicates a possible violation of the local independence assumption. To assess the impact of this violation on the item parameters, we first examined the discrimination values of the three pairs of items in the IRT model. As can be seen in Table 2, the discrimination parameters for these five items were not excessively high (1.48 to 2.05) and, on the contrary, they presented the lowest values in the range of model scores (1.48 to 3.35). Second, a sensitivity analysis was performed to examine the change in discrimination values by removing items 2 and 9. The range of item values was very similar to the original model results (1.48 to 3.35 for the 10 items; 1.43 to 3.37 without items 2 and 9). In addition, the order of classification of the items according to their discrimination values was almost identical, and items 1 (1.46), 8 (1.43), and 10 (1.89) continued to present the lowest discrimination values. Finally, the changes in the discrimination parameters between the two models were minimal (<0.16). Taking all of the above into account, it can be stated that the original ten-item model is sufficiently robust against correlated errors in the CFA model.
A gradual response model (GRM) was used to estimate the model, specifically, an extension of the 2-parameter logistic model (2-PLM) for ordered polytomous items. Table 2 shows that the GRM model presents adequate fit indices (M2 (df) = 29.05 (15); p = 0.016; RMSEA = 0.064; SRMSR = 0.068; TLI = 0.95; CFI = 0.97). In addition, it is observed in Table 2 that all the items present p-values associated with an S-χ2 less than 0.001 and small RMSEA values (<0.06). Therefore, it can be affirmed that the items present adequate fit indices in the GRM model. Concerning the parameters of the model, in Table 2, it can be seen that all the discrimination parameters of the items are above the value of 1, which is generally considered good discrimination [47]. Regarding the location parameters, all the threshold estimators increased monotonically. A greater presence of the latent trait is required to answer the higher response categories.
Figure 2 shows the item and test information curves (IIC and TIC, respectively). In the IIC, it can be seen that item 4 is the most precise of the scale to evaluate the latent trait. In addition, the TIC shows that the test is more reliable (accurate) in the scale range between −2.5 and 2.5.

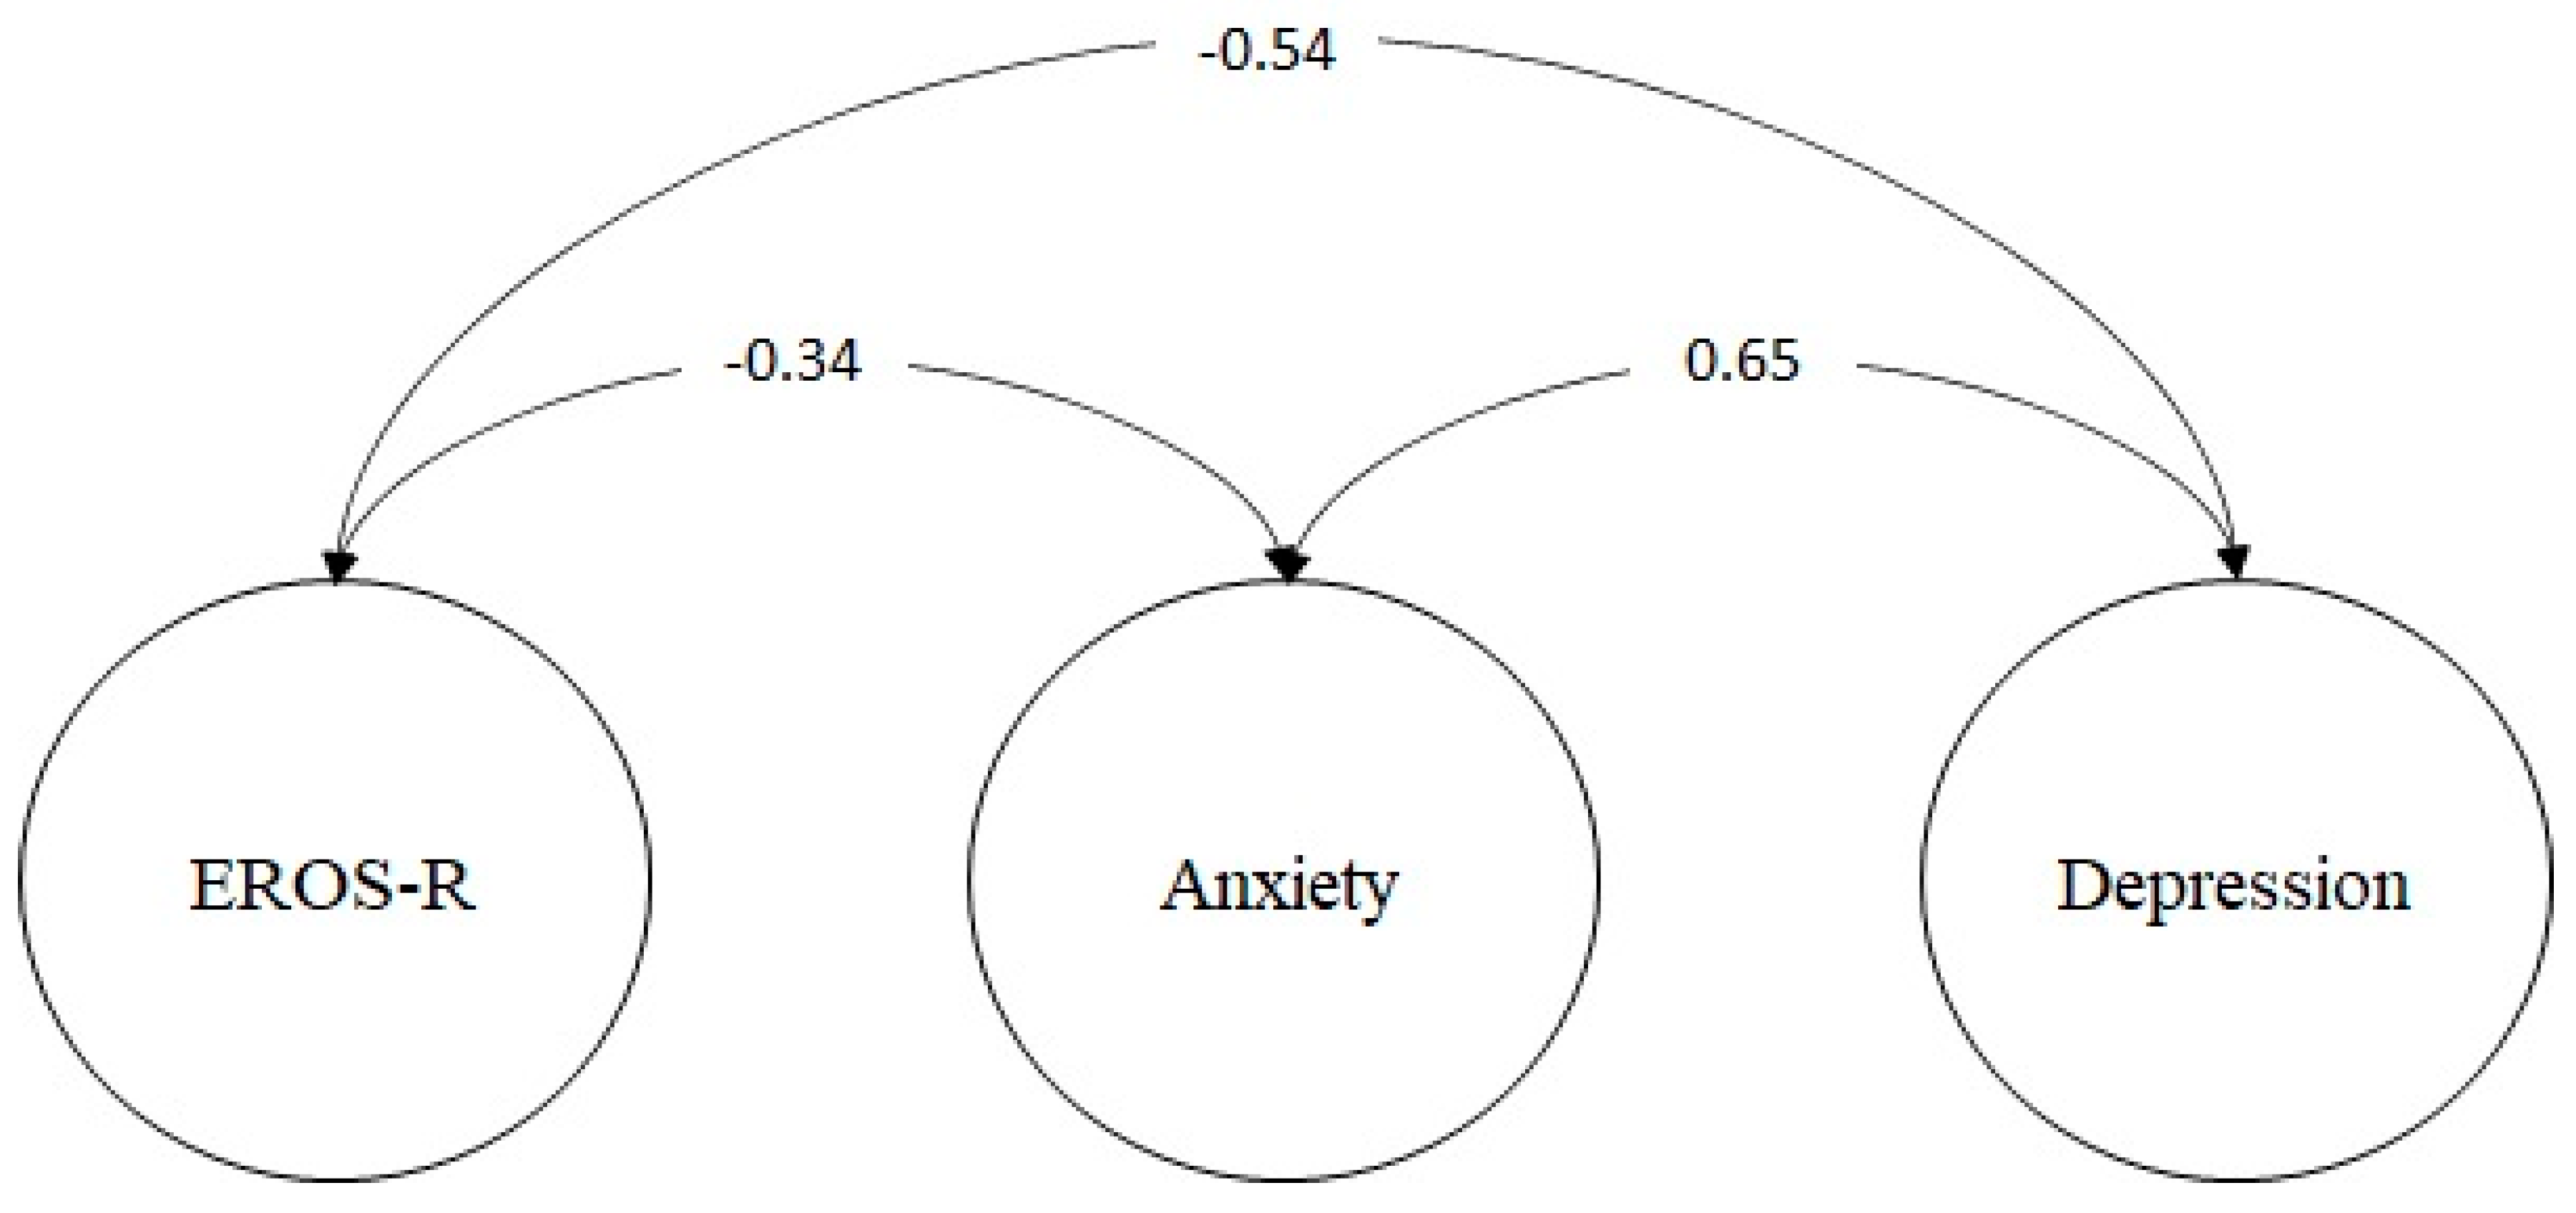
4.5. Validity Based on the Relationship to Other Constructs

Considering the literature review, an SEM model was proposed to evaluate the latent relationship between the EROS scale and the level of anxiety and depression. It can be seen in Table 3 that the structural model presents adequate adjustment indices (χ2 = 581.03; df = 293; p = 0.000; RMSEA = 0.066 (IC 90% 0.058–0.074); SRMR = 0.086; CFI = 0.92; TLI = 0.91) and the measurement models are adequately represented by their items.
Figure 3 shows that the degree of reward provided by the environment (EROS-R) is negatively related to the level of depression (ρ = −0.54; p < 0.01) and anxiety (ρ = −0.34; p < 0.01). Taking these results into account, it can be concluded that the scale has validity based on the relationship with other constructs.

5. Discussion

The main objective of the study was to evaluate the psychometric properties of the EROS-R scale in psychiatric patients; in this sense, EROS is one of the most used instruments to evaluate the effectiveness of BA [23,25,28,59,60,61,62]; however, data on its psychometric performance in the clinical context are limited. The adaptation and validation of the scale to Spanish revealed some psychometric problems [29,30]. In contrast, the recent validation of the EROS-R instrument in Spanish, with only positive items, showed better psychometric performance [31]. However, this version has not been validated with a clinical population. The present study is the first to evaluate the psychometric properties of the EROS-R scale in psychiatric patients. The results show that this version of the EROS, with only positive items, has robust psychometric guarantees from the perspective of TCT and IRT, making it suitable for clinical use.
Regarding the factorial structure of the scale, the results of the CFA confirmed the presence of a one-dimensional model, thus replicating the model of the original scale [19] and the validation results of the EROS-R, both developed with the general population. Additionally, some correlated errors between the items could be attributed to similar conceptual content [39]. These correlated errors (1~2, 8~9, 9~10) are similar to those reported in the study by Vilca et al. [31], except for the correlation of items 9 (“My life is interesting”) and 10 (“The activities I do normally go well”). Both items share a positive evaluative relationship, referring to positive affectivity in one’s personal experience. Although these items have the lowest factorial weights in the model, they are still adequate since their values are above 0.60 [63,64,65]. In other words, the factor manages to extract enough variance from the items; therefore, these items manage to represent the construct adequately. Future studies should explore these results with different samples. In any case, it is essential to point out that these results constitute the first psychometric evidence of the existence of a unidimensional model of the EROS-R scale in the clinical population, both in Spanish-speaking countries and in the rest of the world.
Concerning the scale’s reliability, although the α coefficient shows an adequate level of internal consistency, different researchers have pointed out that this coefficient can produce biased estimates in the presence of correlated errors, as is the case in Gu et al. [66]. In addition, its use is not recommended for items that are answered with ordinal scales, which are so popular in psychology. Since this index does not guarantee the fulfillment of assumptions such as the tau-equivalence of the items [67], its use as the only measure of the reliability of the scales is not recommended [68]. For this reason, in the present study, two additional measures of internal consistency were reported, both the omega coefficient corrected for correlated errors (0.88) and the omega coefficient for ordinal items (0.87), which show excellent levels of reliability. This evidence guarantees a lower measurement error and greater precision of the scores obtained, which is especially important in tests for clinical use [69]. These results constitute the first empirical evidence of the scale’s internal consistency, using more robust indicators of reliability.
From the perspective of the item response theory (IRT), all the items showed adequate discrimination indices; that is, they adequately differentiate between the responses of people with high behavioral activation and those with moderate or low levels. Item 4 (“It is easy for me to find reasons to enjoy life”) best takes advantage of this characteristic. This item seems especially suitable for detecting the availability of reinforcement and the person’s ability to do things that allow him to obtain positive reinforcement from his environment. This result could be helpful in intervention processes since the content of this item is related to the emotional state and, therefore, would support the effectiveness of behavioral interventions aimed at increasing reinforcement to reduce emotional stress levels [70,71]. Regarding the location indices, all the items show increasing monotonous values; that is, people with low levels of behavioral activation tend to choose the first or second category, and those with a higher trait level choose the higher categories. This pattern reflects that the content proposed in each item allows for taking advantage of all the response alternatives, and there is no loss of information.
Regarding the validity based on the relationship with other variables, in the present study, it was shown that the perception of availability of positive reinforcement from the environment (EROS-R) is negatively related to the level of anxiety (ρ = −0.34; p < 0.01) and depression (ρ = −0.54; p < 0.01). This relationship is perfectly consistent with the AC model. As previously indicated, depressive symptoms are strongly associated with less availability and less sensitivity to perceive positive environmental reinforcement [72,73]. The absence of reinforcers (or the presence of punishment) leads people to engage in avoidance behaviors that end up aggravating and making problems chronic. Negative thoughts and emotions are experienced as a barrier to engaging in antidepressant behaviors that would allow positive reinforcement from the environment [74,75]. Similarly, anxiety-associated escape and avoidance behaviors would reduce the person’s exposure to environmental reward sources [76,77].
We believe that the present study shows that the EROS-R can be successfully applied in clinical settings. The EROS-R, a brief scale containing only positive items, is likely to be particularly useful for use in patients with severe mental illness, although in this study participants with neurological deficits or other medical conditions that made it difficult to fill out the instruments were excluded. Due to similar characteristics of the disorders, such as being very focused on symptoms and fighting them, psychiatric patients could experience fatigue and difficulty concentrating on tasks or focusing attention. This could affect their ability to answer positive and negative questions alternately. Some studies show that answering scales with negative items induces more fatigue in the participants [78,79]. Additionally, people with cognitive difficulties, lower educational levels, and lower reading comprehension capacity show more biases in their response when negative items are introduced [80,81]. In this sense, the study participants did not have significant difficulties responding to this scale version. In addition, the consistent results found in the criterion validity or relation to other variables indicate that the response pattern of the participants follows the same direction (negative relationship with anxiety and depression) as the general population samples in previous studies [19,31]. This leads us to think that the EROS-R could be used to evaluate the effectiveness of treatments based on BA in clinical samples and to analyze change processes in line with new therapeutic approaches that advocate cognitive-based, therapy process-based behavior [82,83].
Despite its strengths, the study is not without limitations. First, since a non-probabilistic convenience sampling was used where males and patients with schizophrenia were predominant, this could limit the generalization of the results. On the one hand, it has been suggested that cultural factors could affect how people perceive and value the degree of reward obtained by the environment [84,85]. In this sense, it could be that men and women, who have traditionally been socialized differently, could therefore respond differently to the scale. On the other hand, people diagnosed with psychotic disorders often have a diminished or disorganized sense of self and, as a result, may have difficulty making sense of how they act and direct their own lives [59]. This aspect could introduce a differentiating factor for people suffering from other disorders. Therefore, future studies should select more representative samples of the clinical population and conduct factor invariance analyses based on the gender or psychiatric diagnosis of the participants. Second, the study used only self-report measures, and social desirability could have affected the patients’ responses. Future studies could explore using behavioral logs or peer reports to assess participants’ activity levels as a supplement to self-report measures. Third, in the present study, the temporal stability of the scale was not evaluated; therefore, it is suggested that future studies evaluate reliability through the test–retest method. Despite these limitations, we believe that the study’s results support the use of the EROS-R scale in clinical and research contexts.

6. Conclusions

In conclusion, the study aimed to fill a gap in measuring and investigating behavioral activation in a clinical context. The results showed that the EROS-R scale is an instrument with solid psychometric evidence based on techniques from the classical test theory and the item response theory. In addition, the study constitutes a significant contribution to the measurement in the clinical context of the processes involved in BA therapy, which can facilitate a rapid and efficient evaluation of the degree of environmental reward perceived by the patient. In this sense, we believe that the EROS-R will allow systematic monitoring of advances in therapy (including change processes), and thus, will help in evaluating the effectiveness of therapy in patients.

Supplementary Materials

The following supporting information can be downloaded at: https://www.mdpi.com/article/10.3390/ijerph191610062/s1.

Author Contributions

Conceptualization, L.W.V., E.L.C.-M. and E.D.Q.-K.; data curation, L.W.V., E.L.C.-M., E.D.Q.-K. and T.C.-R.; formal analysis, L.W.V.; investigation, T.C.-R.; methodology, M.H.-L. and T.C.-R.; project administration, L.W.V.; validation, L.W.V.; visualization, M.H.-L.; writing—original draft, L.W.V., E.L.C.-M. and E.D.Q.-K.; writing—review and editing, L.W.V., M.H.-L. and T.C.-R. All authors have read and agreed to the published version of the manuscript.

Funding

Open access publication fees were funded by the Universidad Norbert Wiener.

Institutional Review Board Statement

The study obtained the approval of the ethics committee of the Center for Research and Innovation in Health of the Universidad Peruana Unión (2021-CE-FCS-UPeU-00230), and the standards of the Declaration of Helsinki were met (World Medical Association, 2013).

Informed Consent Statement

Informed consent was obtained from all individual participants included in the study.

Data Availability Statement

Upon request, authors are prepared to send relevant documentation or data in order to verify the validity of the results.

Acknowledgments

We thank the Universidad Norbert Wiener for excellently implementing its research support policies. They helped a lot in the culmination and publication of the study..

Conflicts of Interest

The authors declares that there is no conflict of interest with respect to the research, authorship, and/or publication of this article.

References

  1. Hayes, S.C. Acceptance and commitment therapy, relational frame theory, and the third wave of behavioral and cognitive therapies. Behav. Ther. 2004, 35, 639–665. [Google Scholar] [CrossRef]
  2. Martin, F.; Oliver, T. Behavioral activation for children and adolescents: A systematic review of progress and promise. Eur. Child Adolesc. Psychiatry 2019, 28, 427–441. [Google Scholar] [CrossRef] [PubMed]
  3. Martínez-Vispo, C.; Martínez, Ú.; López-Durán, A.; Fernández del Río, E.; Becoña, E. Effects of behavioural activation on substance use and depression: A systematic review. Subst. Abuse Treat. Prev. Policy 2018, 13, 36. [Google Scholar] [CrossRef] [PubMed]
  4. Tindall, L.; Mikocka-Walus, A.; McMillan, D.; Wright, B.; Hewitt, C.; Gascoyne, S. Is behavioural activation effective in the treatment of depression in young people? A systematic review and meta-analysis. Psychol. Psychother. Theory Res. Pract. 2017, 90, 770–796. [Google Scholar] [CrossRef]
  5. Orgeta, V.; Brede, J.; Livingston, G. Behavioural activation for depression in older people: Systematic review and meta-analysis. Br. J. Psychiatry 2017, 211, 274–279. [Google Scholar] [CrossRef]
  6. Oates, L.L.; Moghaddam, N.; Evangelou, N.; Das Nair, R. Behavioural activation treatment for depression in individuals with neurological conditions: A systematic review. Clin. Rehabil. 2020, 34, 310–319. [Google Scholar] [CrossRef]
  7. Martell, C.R.; Dimidjian, S.; Herman-Dunn, R. Behavioral Activation for Depression. In A Clinician’s Guide, 2nd ed.; The Guilford Press: New York, NY, USA, 2022. [Google Scholar]
  8. Lewinsohn, P.M. A behavioral approach to depresion. In The Psychology of Depression: Contemporary Theory and Research; Friedman, R.M., Katz, M.M., Eds.; Wiley: Hoboken, NJ, USA, 1974; pp. 157–185. [Google Scholar]
  9. Hayes, S.C.; Wilson, K.G.; Gifford, E.V.; Follette, V.M.; Strosahl, K. Experiential Avoidance and Behavioral Disorders: A Functional Dimensional Approach to Diagnosis and Treatment Kirk Strosahl Group Health Cooperative. J. Consult. Clin. Psychol. 1996, 64, 1152–1168. [Google Scholar] [CrossRef]
  10. Kanter, J.W.; Manos, R.C.; Bowe, W.M.; Baruch, D.E.; Busch, A.; Rusch, L.C. What is behavioral activation? A review of the empirical literature. Clin. Psychol. Rev. 2010, 30, 608–620. [Google Scholar] [CrossRef] [PubMed]
  11. Dimidjian, S.; Barrera, M.; Martell, C.; Muñoz, R.F.; Lewinsohn, P.M. The Origins and Current Status of Behavioral Activation Treatments for Depression. Annu. Rev. Clin. Psychol. 2011, 7, 1–38. [Google Scholar] [CrossRef] [PubMed]
  12. Hopko, D.R.; Lejuez, C.; Lepage, J.P.; Hopko, S.D.; McNeil, D.W. A Brief Behavioral Activation Treatment for Depression: A randomized pilot trial within an inpatient psychiatric hospital. Behav. Modif. 2003, 27, 458–469. [Google Scholar] [CrossRef]
  13. Curran, J.; Lawson, P.; Houghton, S.; Gournay, K. Implementing behavioural activation in inpatient psychiatric wards. J. Ment. Health Train. Educ. Pract. 2007, 2, 28–35. [Google Scholar] [CrossRef]
  14. Snarski, M.; Scogin, F.; DiNapoli, E.; Presnell, A.; McAlpine, J.; Marcinak, J. The Effects of Behavioral Activation Therapy with Inpatient Geriatric Psychiatry Patients. Behav. Ther. 2011, 42, 100–108. [Google Scholar] [CrossRef] [PubMed]
  15. Collado, A.; Castillo, S.D.; Maero, F.; Lejuez, C.; MacPherson, L. Pilot of the Brief Behavioral Activation Treatment for Depression in Latinos With Limited English Proficiency: Preliminary Evaluation of Efficacy and Acceptability. Behav. Ther. 2014, 45, 102–115. [Google Scholar] [CrossRef]
  16. Folke, F.; Hursti, T.; Tungström, S.; Söderberg, P.; Kanter, J.W.; Kuutmann, K.; Olofsson, H.; Ekselius, L. Behavioral activation in acute inpatient psychiatry: A multiple baseline evaluation. J. Behav. Ther. Exp. Psychiatry 2015, 46, 170–181. [Google Scholar] [CrossRef]
  17. LeComte, T.; Liberman, R.P.; Wallace, C.J. Identifying and Using Reinforcers to Enhance the Treatment of Persons with Serious Mental Illness. Psychiatr. Serv. 2000, 51, 1312–1314. [Google Scholar] [CrossRef]
  18. Hopko, D.R.; Sanchez, L.; Hopko, S.D.; Dvir, S.; Lejuez, C. Behavioral Activation and the Prevention of Suicidal Behaviors in Patients With Borderline Personality Disorder. J. Pers. Disord. 2003, 17, 460–478. [Google Scholar] [CrossRef]
  19. Armento, M.E.; Hopko, D.R. The Environmental Reward Observation Scale (EROS): Development, Validity, and Reliability. Behav. Ther. 2007, 38, 107–119. [Google Scholar] [CrossRef]
  20. Aoki, S.; Doi, S.; Horiuchi, S.; Takagaki, K.; Kawamura, A.; Umeno, R.; Fujita, M.; Kitagawa, N.; Sakano, Y. Mediating effect of environmental rewards on the relation between goal-directed behaviour and anhedonia. Curr. Psychol. 2019, 40, 3651–3658. [Google Scholar] [CrossRef]
  21. Doi, S.; Yokomitsu, K.; Sakano, Y. Relationships among Valued Action, Behavioral Activation, Avoidance, and Reinforcement in a Sample of College Students. Psychol. Rep. 2016, 118, 5–22. [Google Scholar] [CrossRef]
  22. Maitland, D.W.M.; Neilson, E.C.; Munoz, E.A.; Ybanez, A.; Murray, A.L. The Impact of an Enriched Environment on the Relationship Between Activation and Depression in Latinx and Non-Latinx Students. Psychol. Rec. 2019, 69, 541–550. [Google Scholar] [CrossRef]
  23. Vázquez, F.L.; López, L.; Blanco, V.; Otero, P.; Torres, Á.J.; Ferraces, M.J. The impact of decreased environmental reward in predicting depression severity in caregivers. An Psicol. 2019, 35, 357–363. [Google Scholar] [CrossRef]
  24. Takagaki, K.; Okamoto, Y.; Jinnin, R.; Mori, A.; Nishiyama, Y.; Yamamura, T.; Yokoyama, S.; Shiota, S.; Okamoto, Y.; Miyake, Y.; et al. Behavioral activation for late adolescents with subthreshold depression: A randomized controlled trial. Eur. Child Adolesc. Psychiatry 2016, 25, 1171–1182. [Google Scholar] [CrossRef] [PubMed]
  25. Kern, D.; Busch, A.; Schneider, K.L.; Miller, S.A.; Appelhans, B.M.; Waring, M.E.; Whited, M.C.; Pagoto, S. Psychosocial factors associated with treatment outcomes in women with obesity and major depressive disorder who received behavioral activation for depression. J. Behav. Med. 2019, 42, 522–533. [Google Scholar] [CrossRef]
  26. Otero, P.; Hita, I.; Torres, J.; Vázquez, F.L. Brief Psychological Intervention Through Mobile App and Conference Calls for the Prevention of Depression in Non-Professional Caregivers: A Pilot Study. Int. J. Environ. Res. Public Health 2020, 17, 4578. [Google Scholar] [CrossRef]
  27. Fernández-Rodríguez, C.; González-Fernández, S.; Coto-Lesmes, R.; Pedrosa, I. Behavioral Activation and Acceptance and Commitment Therapy in the Treatment of Anxiety and Depression in Cancer Survivors: A Randomized Clinical Trial. Behav. Modif. 2021, 45, 822–859. [Google Scholar] [CrossRef]
  28. Takagaki, K.; Jinnin, R.; Yokoyama, S.; Mori, A.; Kambara, K.; Okamoto, Y.; Miyake, Y.; Kagawa, F.; Okamoto, Y. Relations Among Clinical Factors After Behavioral Activation for Subthreshold Depression. Int. J. Cogn. Ther. 2021, 14, 612–622. [Google Scholar] [CrossRef]
  29. Barraca, J.; Pérez-Álvarez, M. Adaptación española del Environmental Reward Observation (EROS). Ansiedad Estrés 2010, 16, 95–107. [Google Scholar]
  30. Fernández-Rodríguez, C.; González-Fernández, S.; Pedrosa, I. Psychometric validation of the Environmental Reward Observation Scale (EROS) in breast cancer survivors. Anales Psicología Ann. Psychol. 2020, 36, 74–83. [Google Scholar] [CrossRef]
  31. Vilca, L.W.; Echebaudes-Ilizarbe, R.I.; Aquino-Hidalgo, J.M.; Ventura-León, J.; Martinez-Munive, R.; White, M. Psychometric Properties of the Environmental Reward Observation Scale: Study on Its Internal Structure, Factor Invariance, and Method Effect Associated with Its Negative Items. Psychol. Rep. 2022, 125, 649–675. [Google Scholar] [CrossRef]
  32. Zanon, C.; Hutz, C.; Yoo, H.; Hambleton, R.K. An application of item response theory to psychological test development. Psicol. Reflexão Crítica 2016, 29, 1–10. [Google Scholar] [CrossRef]
  33. Ato, M.; López-García, J.J.; Benavente, A. Un sistema de clasificación de los diseños de investigación en psicología. An. Psicol. Ann. Psychol. 2013, 29, 1038–1059. [Google Scholar] [CrossRef]
  34. Spitzer, R.L.; Kroenke, K.; Williams, J.B.W.; Löwe, B. A Brief Measure for Assessing Generalized Anxiety Disorder: The GAD-7. Arch. Intern. Med. 2006, 166, 1092–1097. [Google Scholar] [CrossRef] [PubMed]
  35. Garcia-Campayo, J.; Zamorano, E.; A Ruiz, M.; Pardo, A.; Perez-Paramo, M.; Lopez-Gomez, V.; Freire, O.; Rejas, J. Cultural adaptation into Spanish of the generalized anxiety disorder-7 (GAD-7) scale as a screening tool. Health Qual. Life Outcomes 2010, 8, 8. [Google Scholar] [CrossRef]
  36. Spitzer, R.L.; Kroenke, K.; Williams, J.B. Validation and utility of a self-report version of PRIME-MD: The PHQ primary care study. Primary Care Evaluation of Mental Disorders. Patient Health Questionnaire. JAMA 1999, 282, 1737–1744. [Google Scholar] [CrossRef]
  37. Zhong, Q.; Gelaye, B.; Fann, J.R.; Sanchez, S.E.; Williams, M.A. Cross-cultural validity of the Spanish version of PHQ-9 among pregnant Peruvian women: A Rasch item response theory analysis. J. Affect. Disord. 2014, 158, 148–153. [Google Scholar] [CrossRef]
  38. World Medical Association. World Medical Association Declaration of Helsinki Ethical Principles for Medical Research Involving Human Subjects. Clin. Rev. Educ. Spec. 2013, 27, 2191–2194. [Google Scholar] [CrossRef]
  39. Brown, T.A. Confirmatory Factor Analysis for Applied Research, 2nd ed.; The Guilford Press: New York, NY, USA, 2015. [Google Scholar]
  40. Kline, R.B. Principles and Practice of Structural Equation Modeling, 4th ed.; The Guilford Press: New York, NY, USA, 2015. [Google Scholar]
  41. Schumacker, R.E.; Lomax, R.G. A Beginner’s Guide to Structural Equation Modeling, 4th ed.; Routledge: London, UK, 2015. [Google Scholar]
  42. Cronbach, L.J. Coefficient alpha and the internal structure of tests. Psychometrika 1951, 16, 297–334. [Google Scholar] [CrossRef]
  43. Bentler, P.M. Alpha, Dimension-Free, and Model-Based Internal Consistency Reliability. Psychometrika 2009, 74, 137–143. [Google Scholar] [CrossRef]
  44. Green, S.B.; Yang, Y. Reliability of Summed Item Scores Using Structural Equation Modeling: An Alternative to Coefficient Alpha. Psychometrika 2009, 74, 155–167. [Google Scholar] [CrossRef]
  45. Raykov, T.; Hancock, G.R. Examining change in maximal reliability for multiple-component measuring instruments. Br. J. Math. Stat. Psychol. 2005, 58, 65–82. [Google Scholar] [CrossRef]
  46. Samejima, F. Graded Response Model. In Handbook of Modern Item Response Theory; van der Linden, W.J., Hambleton, R.K., Eds.; Springer: Berlin/Heidelberg, Germany, 1997; pp. 85–100. [Google Scholar] [CrossRef]
  47. Hambleton, R.K.; van der Linden, W.J.; Wells, C.S. IRT models for the analysis of polytomously scored data: Brief and selected history of model building advances. In Handbook of Polytomous Item Response Theory Models; Nering, M.L., Ostini, R., Eds.; Routledge/Taylor & Francis Group: Abingdon, UK, 2010; pp. 21–42. [Google Scholar]
  48. Cai, L.; Hansen, M. Limited-information goodness-of-fit testing of hierarchical item factor models. Br. J. Math. Stat. Psychol. 2013, 66, 245–276. [Google Scholar] [CrossRef]
  49. Maydeu-Olivares, A.; Joe, H. Assessing Approximate Fit in Categorical Data Analysis. Multivar. Behav. Res. 2014, 49, 305–328. [Google Scholar] [CrossRef] [PubMed]
  50. Lubbe, D.; Schuster, C. A Graded Response Model Framework for Questionnaires with Uniform Response Formats. Appl. Psychol. Meas. 2019, 43, 290–302. [Google Scholar] [CrossRef]
  51. Kang, T.; Chen, T.T. Performance of the Generalized S-X2 Item Fit Index for Polytomous IRT Models. J. Educ. Meas. 2008, 45, 391–406. [Google Scholar] [CrossRef]
  52. Reeve, B.B.; Hays, R.D.; Bjorner, J.B.; Cook, K.F.; Crane, P.K.; Teresi, J.A.; Thissen, D.; Revicki, D.A.; Weiss, D.J.; Hambleton, R.K.; et al. Psychometric evaluation and calibration of health-related quality of life item banks: Plans for the Patient-Reported Outcomes Measurement Information System (PROMIS). Med. Care 2007, 45 (Suppl. S1), S22–S31. [Google Scholar] [CrossRef]
  53. Bean, G.J.; Bowen, N.K. Item Response Theory and Confirmatory Factor Analysis: Complementary Approaches for Scale Development. J. Evid. Based Soc. Work 2021, 18, 597–618. [Google Scholar] [CrossRef]
  54. Rosseel, Y. lavaan: AnRPackage for Structural Equation Modeling. J. Stat. Softw. 2012, 48, 1–36. [Google Scholar] [CrossRef]
  55. Rizopoulos, D. ltm: An R Package for Latent Variable Modeling and Item Response Theory Analyses. J. Stat. Softw. 2006, 17, 1–25. [Google Scholar] [CrossRef]
  56. RStudio Team. RStudio: Integrated Development Environment for R; RStudio, Inc.: Boston, MA, USA, 2022; Available online: http://www.rstudio.com/ (accessed on 22 March 2022).
  57. R Core Team. A Language and Environment for Statistical Computing, R version 3.6.1; R Foundation for Statistical Computing: Vienna, Austria, 2019; Available online: http://www.r-project.org/ (accessed on 22 March 2022).
  58. Saris, W.E.; Satorra, A.; Van Der Veld, W.M. Testing Structural Equation Models or Detection of Misspecifications? Struct. Equ. Model. 2009, 16, 561–582. [Google Scholar] [CrossRef]
  59. Hasson-Ohayon, I.; Arnon-Ribenfeld, N.; Hamm, J.A.; Lysaker, P.H. Agency before action: The application of behavioral activation in psychotherapy with persons with psychosis. Psychotherapy 2017, 54, 245–251. [Google Scholar] [CrossRef]
  60. González-Fernández, S.; Fernández-Rodríguez, C.; Paz-Caballero, M.D. Treating anxiety and depression of cancer survivors: Behavioral activation versus acceptance and commitment therapy. Psicothema 2018, 30, 14–20. [Google Scholar] [CrossRef]
  61. Okumura, A. Terapia grupal de Activación Conductual en pacientes de un centro de intervención comunitario de Lima, Perú. Acta Psicológica Peru. 2018, 2, 380–397. Available online: http://revistas.autonoma.edu.pe/index.php/ACPP/article/view/137/113 (accessed on 22 March 2022).
  62. Martínez-Vispo, C.; Rodríguez-Cano, R.; López-Durán, A.; Senra, C.; Del Río, E.F.; Becoña, E. Cognitive-behavioral treatment with behavioral activation for smoking cessation: Randomized controlled trial. PLoS ONE 2019, 14, e0214252. [Google Scholar] [CrossRef]
  63. Malhotra, N.K.; Kim, S.S.; Patil, A. Common Method Variance in IS Research: A Comparison of Alternative Approaches and a Reanalysis of Past Research. Manag. Sci. 2006, 52, 1865–1883. [Google Scholar] [CrossRef]
  64. Hair, J.F.; Anderson, R.E.; Babin, B.J.; Black, W.C. Multivariate Data Analysis: A Global Perspective, 7th ed.; Pearson Education: London, UK, 2010. [Google Scholar]
  65. Mueller, M.O.; Hancock, G.R. Structural equation modeling. In The Reviewer’s Guide to Quantitative Methods in the Social Sciences, 2nd ed.; Hancock, G.R., Stapleton, L.M., Mueller, R., Eds.; Routledge: London, UK, 2018. [Google Scholar]
  66. Gu, F.; Little, T.D.; Kingston, N.M. Misestimation of Reliability Using Coefficient Alpha and Structural Equation Modeling When Assumptions of Tau-Equivalence and Uncorrelated Errors Are Violated. Methodology 2013, 9, 30–40. [Google Scholar] [CrossRef]
  67. Dunn, T.J.; Baguley, T.; Brunsden, V. From alpha to omega: A practical solution to the pervasive problem of internal consistency estimation. Br. J. Psychol. 2014, 105, 399–412. [Google Scholar] [CrossRef]
  68. Crutzen, R.; Peters, G.-J.Y. Scale quality: Alpha is an inadequate estimate and factor-analytic evidence is needed first of all. Health Psychol. Rev. 2017, 11, 242–247. [Google Scholar] [CrossRef] [PubMed]
  69. McDowell, I. Measuring Health: A Guide to Rating Scales and Questionnaires, 3rd ed.; Oxford University Press: Oxford, UK, 2006. [Google Scholar] [CrossRef]
  70. Cuijpers, P.; van Straten, A.; Warmerdam, L. Behavioral activation treatments of depression: A meta-analysis. Clin. Psychol. Rev. 2007, 27, 318–326. [Google Scholar] [CrossRef]
  71. Manos, R.C.; Kanter, J.W.; Busch, A.M. A critical review of assessment strategies to measure the behavioral activation model of depression. Clin. Psychol. Rev. 2010, 30, 547–561. [Google Scholar] [CrossRef]
  72. Huys, Q.J.; A Pizzagalli, D.; Bogdan, R.; Dayan, P. Mapping anhedonia onto reinforcement learning: A behavioural meta-analysis. Biol. Mood Anxiety Disord. 2013, 3, 12. [Google Scholar] [CrossRef] [PubMed]
  73. Safra, L.; Chevallier, C.; Palminteri, S. Depressive symptoms are associated with blunted reward learning in social contexts. PLoS Comput. Biol. 2019, 15, e1007224. [Google Scholar] [CrossRef] [PubMed]
  74. McCauley, E.; Gudmundsen, G.; Schloredt, K.; Martell, C.; Rhew, I.; Hubley, S.; Dimidjian, S. The Adolescent Behavioral Activation Program: Adapting Behavioral Activation as a Treatment for Depression in Adolescence. J. Clin. Child Adolesc. Psychol. 2015, 45, 291–304. [Google Scholar] [CrossRef]
  75. Stein, A.T.; Carl, E.; Cuijpers, P.; Karyotaki, E.; Smits, J.A.J. Looking beyond depression: A meta-analysis of the effect of behavioral activation on depression, anxiety, and activation. Psychol. Med. 2021, 51, 1491–1504. [Google Scholar] [CrossRef]
  76. Grant, D.M.; White, E.J. The Influence of Anxiety on Cognitive Control Processes. In Oxford Research Encyclopedia of Psychology; Oxford University Press: Oxford, UK, 2016. [Google Scholar] [CrossRef]
  77. Harlé, K.M.; Guo, D.; Zhang, S.; Paulus, M.P.; Yu, A.J. Anhedonia and anxiety underlying depressive symptomatology have distinct effects on reward-based decision-making. PLoS ONE 2017, 12, e0186473. [Google Scholar] [CrossRef] [PubMed]
  78. Colosi, R. Negatively worded questions cause respondent confusion. In Proceedings of the Survey Research Methods Section; American Statistical Association: Suitland Road, Suitland, 2005; pp. 2896–2903. [Google Scholar]
  79. Merritt, S.M. The Two-Factor Solution to Allen and Meyer’s (1990) Affective Commitment Scale: Effects of Negatively Worded Items. J. Bus. Psychol. 2012, 27, 421–436. [Google Scholar] [CrossRef]
  80. Weems, G.H.; Onwuegbuzie, A.J.; Collins, K.M. The Role of Reading Comprehension in Responses to Positively and Negatively Worded Items on Rating Scales. Eval. Res. Educ. 2006, 19, 3–20. [Google Scholar] [CrossRef]
  81. Meisenberg, G.; Williams, A. Are acquiescent and extreme response styles related to low intelligence and education? Pers. Individ. Differ. 2008, 44, 1539–1550. [Google Scholar] [CrossRef]
  82. Hayes, S.C.; Hofmann, S.G. Process-Based CBT: The Science and Core Clinical Competencies of Cognitive Behavioral Therapy; New Harbinger Publications: Oakland, CA, USA, 2018. [Google Scholar]
  83. Hofmann, S.G.; Hayes, S.C. The Future of Intervention Science: Process-Based Therapy. Clin. Psychol. Sci. 2019, 7, 37–59. [Google Scholar] [CrossRef]
  84. Tull, M.T.; Gratz, K.L.; Latzman, R.D.; Kimbrel, N.A.; Lejuez, C. Reinforcement Sensitivity Theory and emotion regulation difficulties: A multimodal investigation. Pers. Individ. Differ. 2010, 49, 989–994. [Google Scholar] [CrossRef]
  85. Ryba, M.M.; Hopko, D.R. Gender Differences in Depression: Assessing Mediational Effects of Overt Behaviors and Environmental Reward through Daily Diary Monitoring. Depress. Res. Treat. 2012, 2012, 865679. [Google Scholar] [CrossRef]
Figure 1. Confirmatory factor analysis of the scale. Note. All factorial weights are statistically significant (p < 0.01).
Ijerph 19 10062 g001
Figure 2. Item and test information curves.
Ijerph 19 10062 g002
Figure 3. Relationship model with other constructs.
Ijerph 19 10062 g003
Table 1. Polychoric correlation matrix and descriptive analysis of the items.
ItemsE1E2E3E4E5E6E7E8E9E10
E11
E20.801
E30.500.621
E40.630.650.671
E50.550.600.550.731
E60.410.530.520.730.701
E70.430.520.580.640.590.621
E80.300.420.560.480.410.510.511
E90.400.350.530.560.420.560.530.561
E100.430.520.530.580.500.570.660.530.701
M2.602.592.632.682.522.632.662.562.632.70
SD0.640.680.700.630.670.620.670.630.730.59
g1−0.060.22−0.06−0.13−0.23−0.26−0.460.030.19−0.83
g2−0.19−0.31−0.19−0.07−0.16−0.030.24−0.25−0.430.84
Note. M = mean; SD = standard deviation; g1 = skewness; g2 = kurtosis.
Table 2. Discrimination parameters and location for the items of each dimension.
ItemsItem ParametersItem FitModel Fit Indices
ab1b2b3S-X2 (df)pRMSEA.S-X2M2 (df)pRMSEA SRMSRTLICFI
E11.62−2.55−0.122.7513.65 (13)0.3990.01529.05 (15)0.0160.0640.0680.950.97
E22.05−2.620.042.0814.60 (14)0.4060.014
E32.21−1.99−0.111.7424.32 (16)0.0830.048
E43.35−1.95−0.291.6713.96 (12)0.3030.027
E52.25−2.020.082.1420.55 (13)0.0820.051
E62.40−2.21−0.312.0721.09 (13)0.0710.052
E72.17−1.99−0.291.8128.13 (14)0.0140.060
E81.48−2.68−0.142.5215.74 (16)0.4720.000
E91.72−2.19−0.081.7417.09 (18)0.5160.000
E102.02−2.03−0.412.1821.94 (14)0.0800.050
Note. a = discrimination parameters; b = location parameters.
Table 3. Relationship of EROS-R with other variables.
Structural Model
χ2dfpRMSEACI 90%SRMRCFITLI
581.022930.0000.0660.058–0.0740.0860.920.91
Measurement Models
ItemsEROS-RAnxietyDepression
λ (error)λ (error)λ (error)
10.65 (0.57)0.73 (0.47)0.56 (0.68)
20.70 (0.51)0.75 (0.43)0.72 (0.49)
30.72 (0.47)0.77 (0.40)0.67 (0.54)
40.89 (0.22)0.77 (0.41)0.65 (0.57)
50.79 (0.37)0.78 (0.39)0.58 (0.66)
60.80 (0.36)0.58 (0.66)0.59 (0.66)
70.74 (0.44)0.69 (0.51)0.52 (0.72)
80.61 (0.63) 0.51 (0.73)
90.70 (0.51) 0.81 (0.34)
100.79 (0.38)
Note: χ2 = chi-square test; gf = degrees of freedom; p = p-value; RMSEA = root mean square error of approximation; SRMR = standardized root mean squared residual; CFI = comparative fit index; TLI = Tucker–Lewis index; λ = factor loading.
Publisher’s Note: MDPI stays neutral with regard to jurisdictional claims in published maps and institutional affiliations.

