
The Association between Altitude and Waist–Height Ratio in Peruvian Adults: A Cross-Sectional Data Analysis of a Population-Based Survey


Abstract
:1. Introduction
2. Materials and Methods
2.1. Data Source and Data Description
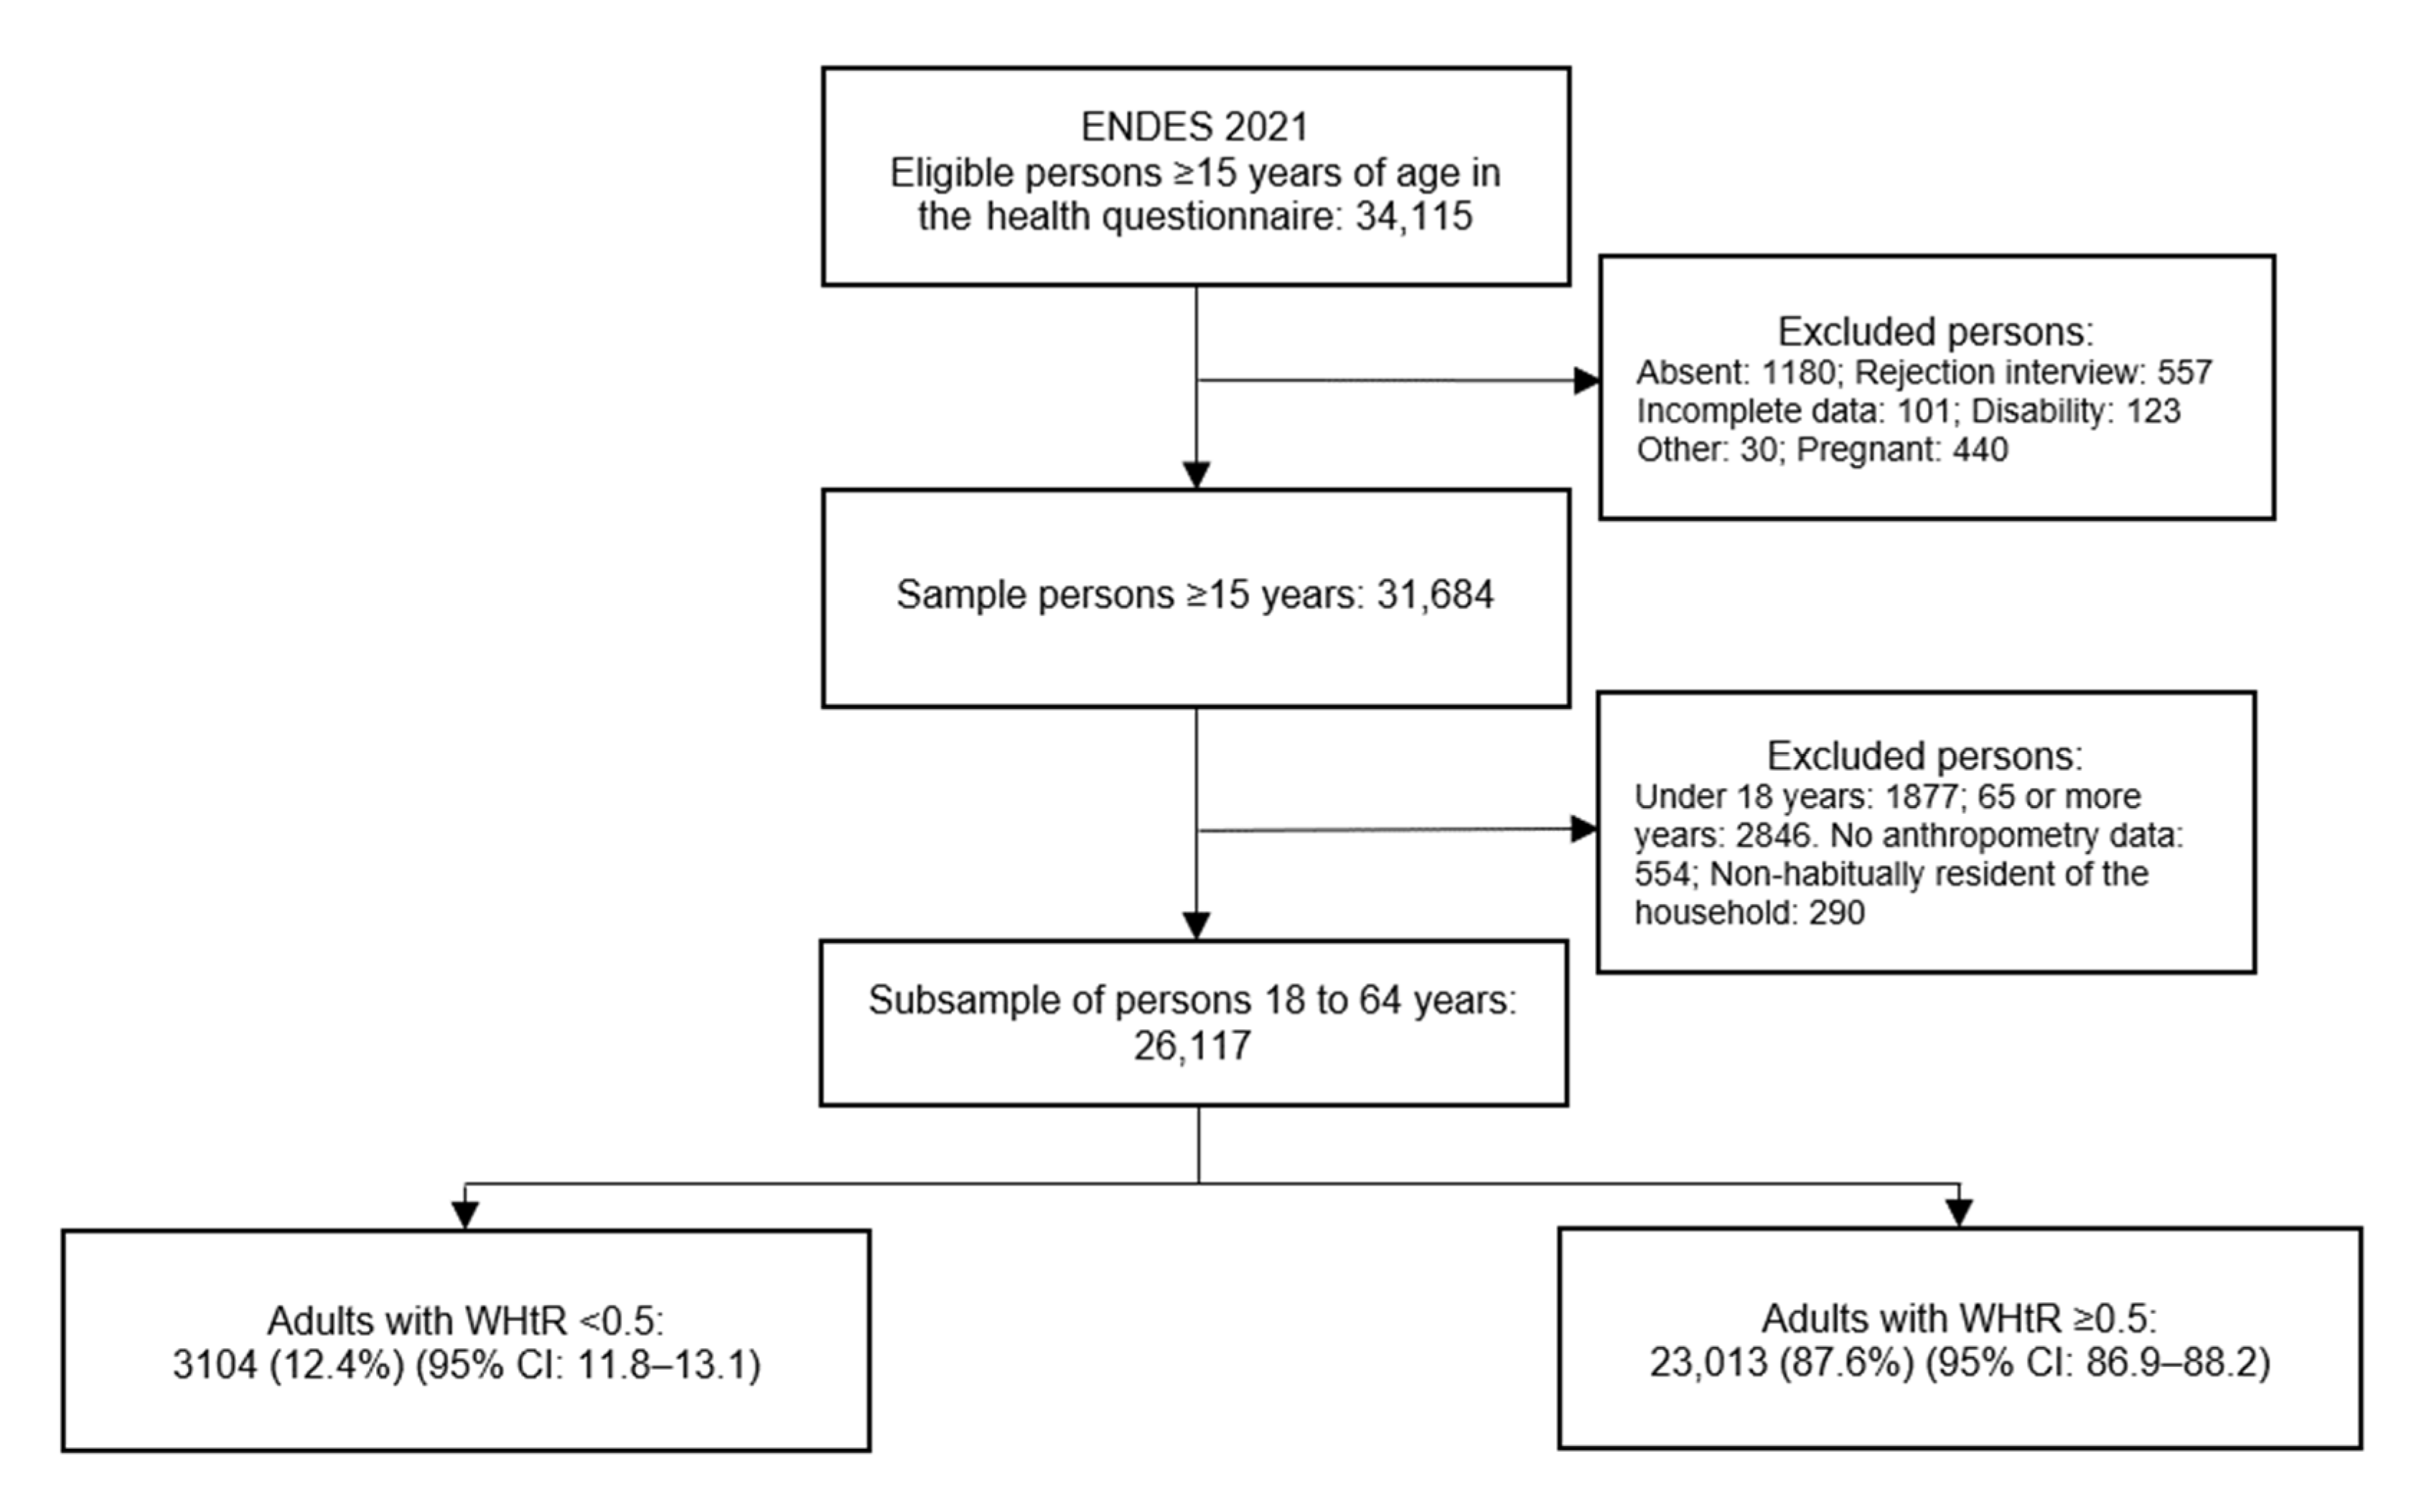
2.2. Sampling and Data Collection
2.3. Dependent Variable
2.4. Exposure Variable
2.5. Covariates
2.6. Statistical Analysis
2.7. Ethical Considerations
3. Results
4. Discussion
5. Conclusions
Author Contributions
Funding
Institutional Review Board Statement
Informed Consent Statement
Data Availability Statement
Acknowledgments
Conflicts of Interest
References
- World Health Organization Obesity and Overweight. Available online: https://www.who.int/news-room/fact-sheets/detail/obesity-and-overweight (accessed on 22 July 2022).
- The Food and Agriculture Organization; Fondo Internacional de Desarrollo Agrícola; Organización Panamericana de la Salud; World Food Programme; United Nations Children’s Fund. América Latina y el Caribe—Panorama Regional de la Seguridad Alimentaria y Nutricional 2021; FAO; FIDA; OPS; WFP y UNICEF: Santiago de Chile, Chile, 2021; ISBN 978-92-5-135399-8. [Google Scholar]
- Instituto Nacional de Estadística e Informática. Perú: Enfermedades No Transmisibles y Transmisibles, 2021; INEI: Lima, Peru, 2022.
- Global Obesity Observatory Peru. Available online: https://data.worldobesity.org/country/peru-171/#data_trends (accessed on 22 July 2022).
- Pajuelo-Ramírez, J.; Torres-Aparcana, H.; Agüero-Zamora, R.; Quispe, A.M. Altitude and Its Inverse Association with Abdominal Obesity in an Andean Country: A Cross-Sectional Study. F1000Research 2019, 8, 1738. [Google Scholar] [CrossRef] [PubMed]
- Woolcott, O.O.; Gutierrez, C.; Castillo, O.A.; Elashoff, R.M.; Stefanovski, D.; Bergman, R.N. Inverse Association between Altitude and Obesity: A Prevalence Study among Andean and Low-Altitude Adult Individuals of Peru: Altitude and Obesity. Obesity 2016, 24, 929–937. [Google Scholar] [CrossRef] [PubMed]
- Bernabe-Ortiz, A.; Carrillo-Larco, R.M. Urbanization, Altitude and Cardiovascular Risk. Glob. Heart 2022, 17, 42. [Google Scholar] [CrossRef] [PubMed]
- Kaptoge, S.; Pennells, L.; De Bacquer, D.; Cooney, M.T.; Kavousi, M.; Stevens, G.; Riley, L.M.; Savin, S.; Khan, T.; Altay, S.; et al. World Health Organization Cardiovascular Disease Risk Charts: Revised Models to Estimate Risk in 21 Global Regions. Lancet Glob. Health 2019, 7, e1332–e1345. [Google Scholar] [CrossRef]
- Frankenfield, D.C.; Rowe, W.A.; Cooney, R.N.; Smith, J.S.; Becker, D. Limits of Body Mass Index to Detect Obesity and Predict Body Composition. Nutrition 2001, 17, 26–30. [Google Scholar] [CrossRef]
- Humphreys, S. The Unethical Use of BMI in Contemporary General Practice. Br. J. Gen. Pract. 2010, 60, 696–697. [Google Scholar] [CrossRef]
- Piers, L.S.; Soares, M.J.; Frandsen, S.L.; O’Dea, K. Indirect Estimates of Body Composition Are Useful for Groups but Unreliable in Individuals. Int. J. Obes. Relat. Metab. Disord. 2000, 24, 1145–1152. [Google Scholar] [CrossRef]
- Nuttall, F.Q. Body Mass Index. Nutr. Today 2015, 50, 117–128. [Google Scholar] [CrossRef]
- Asgari, S.; Luo, Y.; Akbari, A.; Belbin, G.M.; Li, X.; Harris, D.N.; Selig, M.; Bartell, E.; Calderon, R.; Slowikowski, K.; et al. A Positively Selected FBN1 Missense Variant Reduces Height in Peruvian Individuals. Nature 2020, 582, 234–239. [Google Scholar] [CrossRef]
- NCD Risk Factor Collaboration (NCD-RisC). A Century of Trends in Adult Human Height. eLife 2016, 5, e13410. [Google Scholar] [CrossRef]
- Tremblay, J.C.; Ainslie, P.N. Global and Country-Level Estimates of Human Population at High Altitude. Proc. Natl. Acad. Sci. USA 2021, 118, e2102463118. [Google Scholar] [CrossRef] [PubMed]
- Ashwell, M.; Gunn, P.; Gibson, S. Waist-to-Height Ratio Is a Better Screening Tool than Waist Circumference and BMI for Adult Cardiometabolic Risk Factors: Systematic Review and Meta-Analysis. Obes. Rev. 2012, 13, 275–286. [Google Scholar] [CrossRef] [PubMed]
- Hernández-Vásquez, A.; Azañedo, D.; Vargas-Fernández, R.; Aparco, J.P.; Chaparro, R.M.; Santero, M. Cut-off Points of Anthropometric Markers Associated with Hypertension and Diabetes in Peru: Demographic and Health Survey 2018. Public Health Nutr. 2020, 24, 611–621. [Google Scholar] [CrossRef] [PubMed]
- Savva, S.C.; Lamnisos, D.; Kafatos, A.G. Predicting Cardiometabolic Risk: Waist-to-Height Ratio or BMI. A Meta-Analysis. Diabetes Metab. Syndr. Obes. 2013, 6, 403–419. [Google Scholar] [CrossRef]
- Restrepo, B.J. Obesity Prevalence among U.S. Adults During the COVID-19 Pandemic. Am. J. Prev. Med. 2022, 63, 102–106. [Google Scholar] [CrossRef]
- Instituto Nacional de Estadística e Informática. Ficha Técnica ENDES 2021; Instituto Nacional de Estadística e Informática: Lima, Peru, 2022.
- Ashwell, M.; Hsieh, S.D. Six Reasons Why the Waist-to-Height Ratio Is a Rapid and Effective Global Indicator for Health Risks of Obesity and How Its Use Could Simplify the International Public Health Message on Obesity. Int. J. Food Sci. Nutr. 2005, 56, 303–307. [Google Scholar] [CrossRef]
- Instituto Nacional de Estadística e Informática. Encuesta Demográfica y de Salud Familiar 2021: Manual de la Entrevistadora; Instituto Nacional de Estadistica e Informática: Lima, Peru, 2021.
- Barry, P.W. Altitude Illness. BMJ 2003, 326, 915–919. [Google Scholar] [CrossRef]
- Miranda, J.J.; Barrientos-Gutiérrez, T.; Corvalan, C.; Hyder, A.A.; Lazo-Porras, M.; Oni, T.; Wells, J.C.K. Understanding the Rise of Cardiometabolic Diseases in Low- and Middle-Income Countries. Nat. Med. 2019, 25, 1667–1679. [Google Scholar] [CrossRef]
- Dünnwald, T.; Gatterer, H.; Faulhaber, M.; Arvandi, M.; Schobersberger, W. Body Composition and Body Weight Changes at Different Altitude Levels: A Systematic Review and Meta-Analysis. Front. Physiol. 2019, 10, 430. [Google Scholar] [CrossRef]
- NCD Risk Factor Collaboration (NCD-RisC). Rising Rural Body-Mass Index Is the Main Driver of the Global Obesity Epidemic in Adults. Nature 2019, 569, 260–264. [Google Scholar] [CrossRef] [Green Version]
- Carrasco-Escobar, G.; Manrique, E.; Tello-Lizarraga, K.; Miranda, J.J. Travel Time to Health Facilities as a Marker of Geographical Accessibility Across Heterogeneous Land Coverage in Peru. Front. Public Health 2020, 8, 498. [Google Scholar] [CrossRef] [PubMed]
- Scheil-Adlung, X. Global Evidence on Inequities in Rural Health Protection: New Data on Rural Deficits in Health Coverage for 174 Countries; International Labour Organization: Geneva, Switzerland, 2015. [Google Scholar]
- Hernández-Vásquez, A.; Vargas-Fernández, R.; Chacón-Diaz, M. Association between Altitude and the Framingham Risk Score: A Cross-Sectional Study in the Peruvian Adult Population. Int. J. Environ. Res. Public Health 2022, 19, 3838. [Google Scholar] [CrossRef] [PubMed]
- International Fund for Agricultural Development. Enabling Poor Rural People to Overcome Poverty in Peru. 2013. Available online: https://www.ifad.org/documents/38714170/39972349/Enabling+poor+rural+people+to+overcome+poverty+in+Peru_e.pdf/bd91abe9-491c-4074-b91a-a1b0797a1437 (accessed on 22 July 2022).
- Rolfe, E.D.L.; de França, G.V.A.; Vianna, C.A.; Gigante, D.P.; Miranda, J.J.; Yudkin, J.S.; Horta, B.L.; Ong, K.K. Associations of Stunting in Early Childhood with Cardiometabolic Risk Factors in Adulthood. PLoS ONE 2018, 13, e0192196. [Google Scholar] [CrossRef]
- Ashwell, M.; Gibson, S. Waist-to-Height Ratio as an Indicator of ‘Early Health Risk’: Simpler and More Predictive than Using a ‘Matrix’ Based on BMI and Waist Circumference. BMJ Open 2016, 6, e010159. [Google Scholar] [CrossRef] [PubMed] [Green Version]


| Characteristics | n | % * |
|---|---|---|
| Sex | ||
| Men | 11,114 | 48.8 |
| Women | 15,003 | 51.2 |
| Age groups (years) | ||
| 18–29 | 8303 | 31.2 |
| 30–39 | 8903 | 24.9 |
| 40–49 | 4665 | 21.1 |
| 50–64 | 4246 | 22.8 |
| Education level | ||
| Up to primary | 5730 | 17.6 |
| Secondary | 12,054 | 46.0 |
| Higher | 8333 | 36.4 |
| Wealth Index | ||
| Poorest | 8159 | 18.2 |
| Poorer | 6756 | 20.8 |
| Middle | 4900 | 21.3 |
| Richer | 3765 | 20.7 |
| Richest | 2537 | 19.1 |
| Area of residence | ||
| Urban | 17,180 | 81.6 |
| Rural | 8937 | 18.4 |
| Altitude of residence (in masl) | ||
| <1500 | 16,125 | 73.5 |
| 1500–2499 | 2263 | 6.7 |
| 2500–3499 | 4540 | 12.7 |
| 3500 or more | 3189 | 7.2 |
| Weight–height ratio | ||
| Mean (SD) | 0.59 (0.08) |
| Altitude | |||||
|---|---|---|---|---|---|
| <1500 (n = 16,125) | 1500–2499 (n = 2263) | 2500–3499 (n = 4540) | 3500 or More (n = 3189) | ||
| Characteristics | % (95% CI) | % (95% CI) | % (95% CI) | % (95% CI) | p Value * |
| Weight–Height Ratio, mean (SD) | 0.594 (0.07) | 0.581 (0.09) | 0.579 (0.09) | 0.575 (0.1) | <0.001 |
| Waist to Height Risk | |||||
| No | 11.5 (10.7–12.3) | 14.0 (12.0–16.1) | 14.5 (13.0–16.0) | 17.2 (15.4–19.1) | <0.001 |
| Yes | 88.5 (87.7–89.3) | 86.0 (83.9–88.0) | 85.5 (84.0–87.0) | 82.8 (80.9–84.6) | |
| Sex | |||||
| Men | 49.0 (47.9–50.2) | 51.3 (48.5–54.1) | 47.6 (45.7–49.4) | 46.3 (44.0–48.7) | 0.040 |
| Women | 51.0 (49.8–52.1) | 48.7 (45.9–51.5) | 52.4 (50.6–54.3) | 53.7 (51.3–56.0) | |
| Age groups (years) | |||||
| 18–29 | 31.1 (30.0–32.2) | 30.8 (28.1–33.6) | 32.4 (30.4–34.4) | 30.2 (28.0–32.5) | 0.424 |
| 30–39 | 25.1 (24.2–26.1) | 24.7 (22.6–27.0) | 24.5 (23.0–26.1) | 23.8 (22.2–25.6) | |
| 40–49 | 21.2 (20.2–22.2) | 20.7 (18.4–23.2) | 21.1 (19.6–22.7) | 20.3 (18.2–22.5) | |
| 50–64 | 22.5 (21.5–23.6) | 23.8 (21.1–26.6) | 22.0 (20.1–24.0) | 25.7 (23.7–27.8) | |
| Educational level | |||||
| Up to primary | 13.6 (12.8–14.4) | 26.7 (23.5–30.2) | 27.0 (24.8–29.3) | 33.2 (30.3–36.1) | <0.001 |
| Secondary | 48.0 (46.7–49.3) | 37.9 (34.8–41.0) | 40.9 (38.7–43.1) | 42.7 (40.1–45.3) | |
| Higher | 38.4 (37.1–39.7) | 35.4 (32.1–38.9) | 32.2 (30.0–34.4) | 24.1 (21.8–26.7) | |
| Wealth Index | |||||
| Poorest | 10.0 (9.3–10.8) | 35.6 (30.7–40.8) | 37.3 (34.2–40.4) | 51.7 (47.7–55.8) | <0.001 |
| Poorer | 19.8 (18.8–20.9) | 18.3 (15.6–21.3) | 25.2 (23.1–27.4) | 25.1 (22.1–28.5) | |
| Middle | 23.1 (22.0–24.3) | 17.4 (14.4–20.9) | 17.8 (16.1–19.6) | 13.0 (10.8–15.6) | |
| Richer | 23.9 (22.8–25.1) | 13.9 (11.5–16.7) | 12.6 (10.9–14.6) | 7.5 (6.1–9.2) | |
| Richest | 23.1 (21.8–24.4) | 14.9 (12.4–17.8) | 7.2 (6.1–8.5) | 2.6 (1.7–3.9) | |
| Area of residence | |||||
| Urban | 90.7 (89.7–91.5) | 57.4 (51.6–63.0) | 62.6 (58.8–66.2) | 44.3 (40.2–48.4) | <0.001 |
| Rural | 9.3 (8.5–10.3) | 42.6 (37.0–48.4) | 37.4 (33.8–41.2) | 55.7 (51.6–59.8) | |
| Waist to Height Risk | |||
|---|---|---|---|
| No (n = 3104) | Yes (n = 23,013) | ||
| Characteristics | % (95% CI) | % (95% CI) | p Value * |
| Overall | 12.4 (11.8–13.1) | 87.6 (86.9–88.2) | |
| Sex | |||
| Men | 66.4 (64.0–68.7) | 46.3 (45.3–47.3) | <0.001 |
| Women | 33.6 (31.3–36.0) | 53.7 (52.7–54.7) | |
| Age groups (years) | |||
| 18–29 | 69.8 (67.4–72.0) | 25.7 (24.9–26.6) | <0.001 |
| 30–39 | 16.2 (14.6–18.0) | 26.2 (25.4–27.0) | |
| 40–49 | 6.8 (5.7–8.1) | 23.1 (22.3–24.0) | |
| 50–64 | 7.2 (5.8–8.8) | 25.0 (24.1–25.9) | |
| Education level | |||
| Up to primary | 12.3 (10.8–13.9) | 18.3 (17.6–19.0) | <0.001 |
| Secondary | 51.2 (48.5–53.8) | 45.3 (44.2–46.4) | |
| Higher | 36.6 (34.0–39.2) | 36.4 (35.3–37.4) | |
| Wealth Index | |||
| Poorest | 24.5 (22.6–26.4) | 17.3 (16.6–17.9) | <0.001 |
| Poorer | 21.1 (19.1–23.4) | 20.7 (19.9–21.6) | |
| Middle | 18.7 (16.6–21.1) | 21.7 (20.8–22.6) | |
| Richer | 18.0 (15.9–20.3) | 21.0 (20.1–22.0) | |
| Richest | 17.6 (15.4–20.2) | 19.3 (18.3–20.3) | |
| Area of residence | |||
| Urban | 75.8 (73.9–77.6) | 82.4 (81.8–83.0) | <0.001 |
| Rural | 24.2 (22.4–26.1) | 17.6 (17.0–18.2) | |
| Characteristics | Crude Model | Adjusted Model | ||
|---|---|---|---|---|
| PR (95% CI) | p Value | aPR (95% CI) | p Value | |
| Overall | ||||
| Altitude (masl) * | ||||
| <1500 | Reference | Reference | ||
| 1500–2499 | 0.97 (0.95–1.00) | 0.280 | 0.99 (0.96–1.01) | 0.341 |
| 2500–3499 | 0.97 (0.95–0.99) | 0.001 | 0.98 (0.96–1.00) | 0.024 |
| 3500 or more | 0.94 (0.91–0.96) | <0.001 | 0.95 (0.93–0.97) | <0.001 |
| Men | ||||
| Altitude (masl) ** | ||||
| <1500 | Reference | Reference | ||
| 1500–2499 | 0.95 (0.91–0.99) | 0.017 | 0.97 (0.93–1.01) | 0.150 |
| 2500–3499 | 0.90 (0.87–0.94) | <0.001 | 0.94 (0.91–0.97) | 0.001 |
| 3500 or more | 0.90 (0.86–0.94) | <0.001 | 0.94 (0.90–0.99) | 0.011 |
| Women | ||||
| Altitude (masl) ** | ||||
| <1500 | Reference | Reference | ||
| 1500–2499 | 1.00 (0.98–1.02) | 0.946 | 1.00 (0.98–1.03) | 0.680 |
| 2500–3499 | 1.02 (1.00–1.03) | 0.058 | 1.01 (1.00–1.03) | 0.157 |
| 3500 or more | 0.96 (0.94–0.98) | 0.001 | 0.95 (0.93–0.97) | <0.001 |
Publisher’s Note: MDPI stays neutral with regard to jurisdictional claims in published maps and institutional affiliations. |
© 2022 by the authors. Licensee MDPI, Basel, Switzerland. This article is an open access article distributed under the terms and conditions of the Creative Commons Attribution (CC BY) license (https://creativecommons.org/licenses/by/4.0/).
Share and Cite
Hernández-Vásquez, A.; Azañedo, D. The Association between Altitude and Waist–Height Ratio in Peruvian Adults: A Cross-Sectional Data Analysis of a Population-Based Survey. Int. J. Environ. Res. Public Health 2022, 19, 11494. https://doi.org/10.3390/ijerph191811494
Hernández-Vásquez A, Azañedo D. The Association between Altitude and Waist–Height Ratio in Peruvian Adults: A Cross-Sectional Data Analysis of a Population-Based Survey. International Journal of Environmental Research and Public Health. 2022; 19(18):11494. https://doi.org/10.3390/ijerph191811494
Chicago/Turabian StyleHernández-Vásquez, Akram, and Diego Azañedo. 2022. "The Association between Altitude and Waist–Height Ratio in Peruvian Adults: A Cross-Sectional Data Analysis of a Population-Based Survey" International Journal of Environmental Research and Public Health 19, no. 18: 11494. https://doi.org/10.3390/ijerph191811494