
Inhibition of Very Long Chain Fatty Acids Synthesis Mediates PI3P Homeostasis at Endosomal Compartments

 ,
,  , and
, and 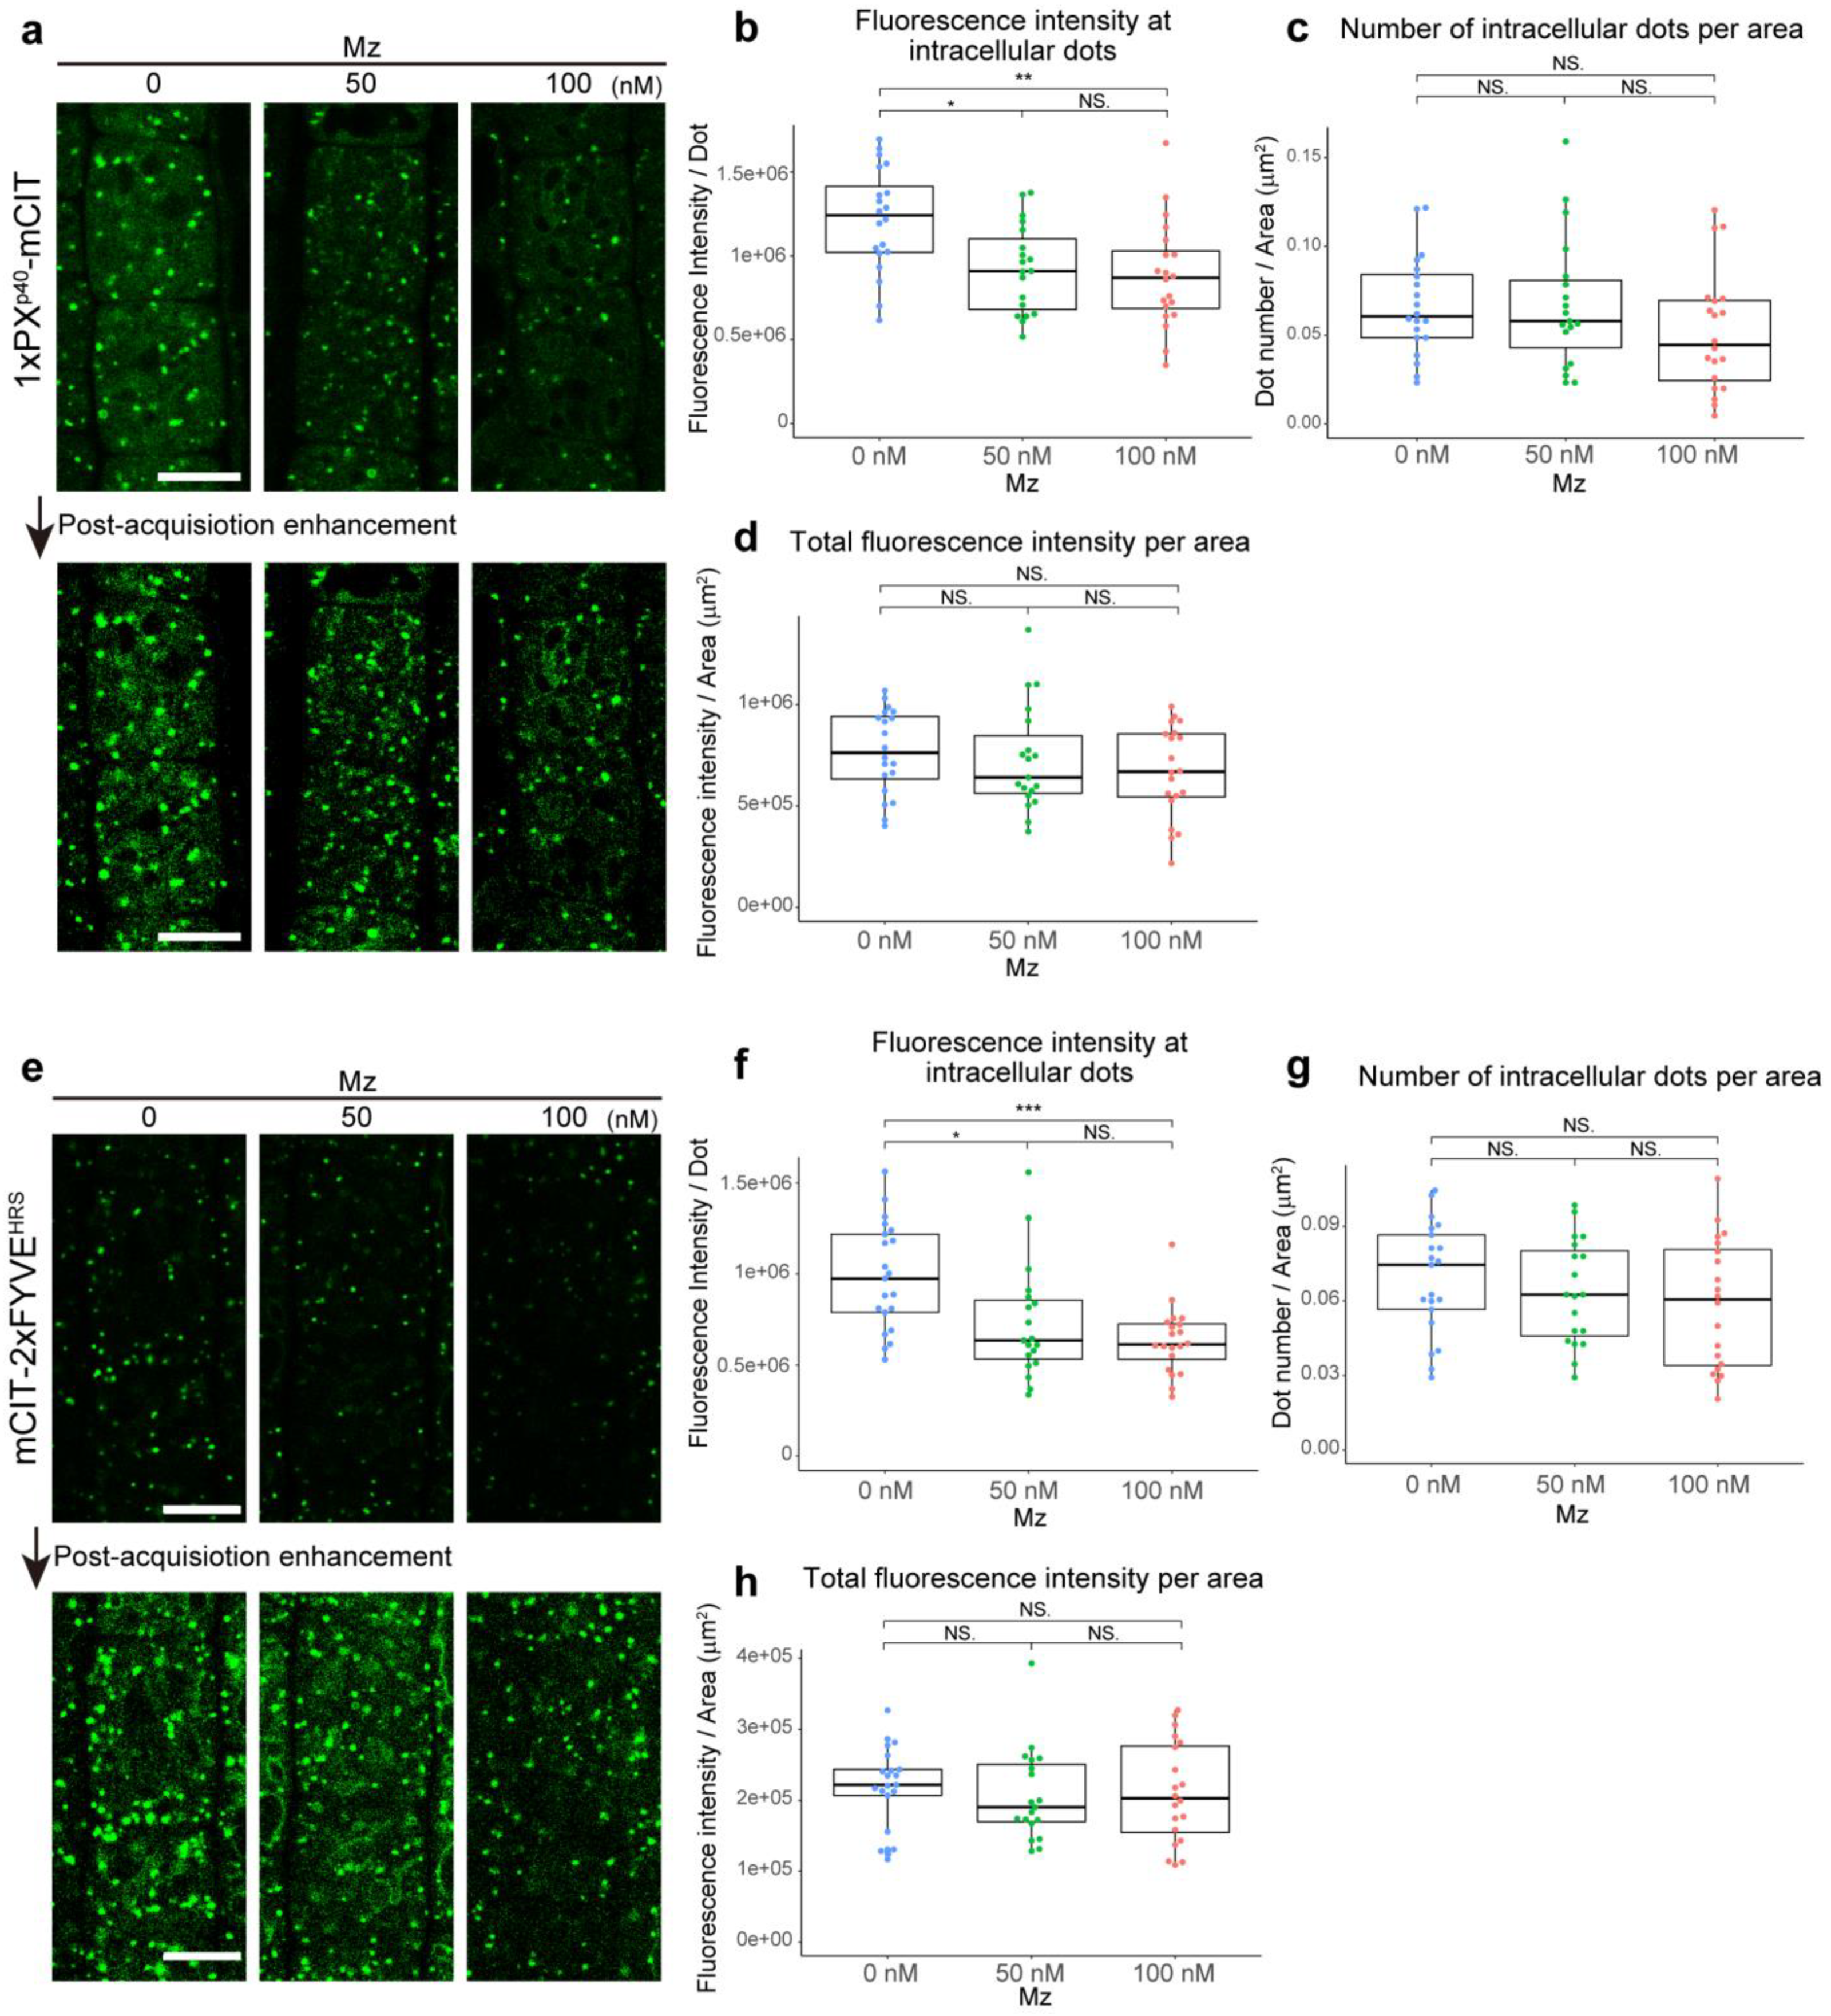
Abstract
:1. Introduction
2. Results
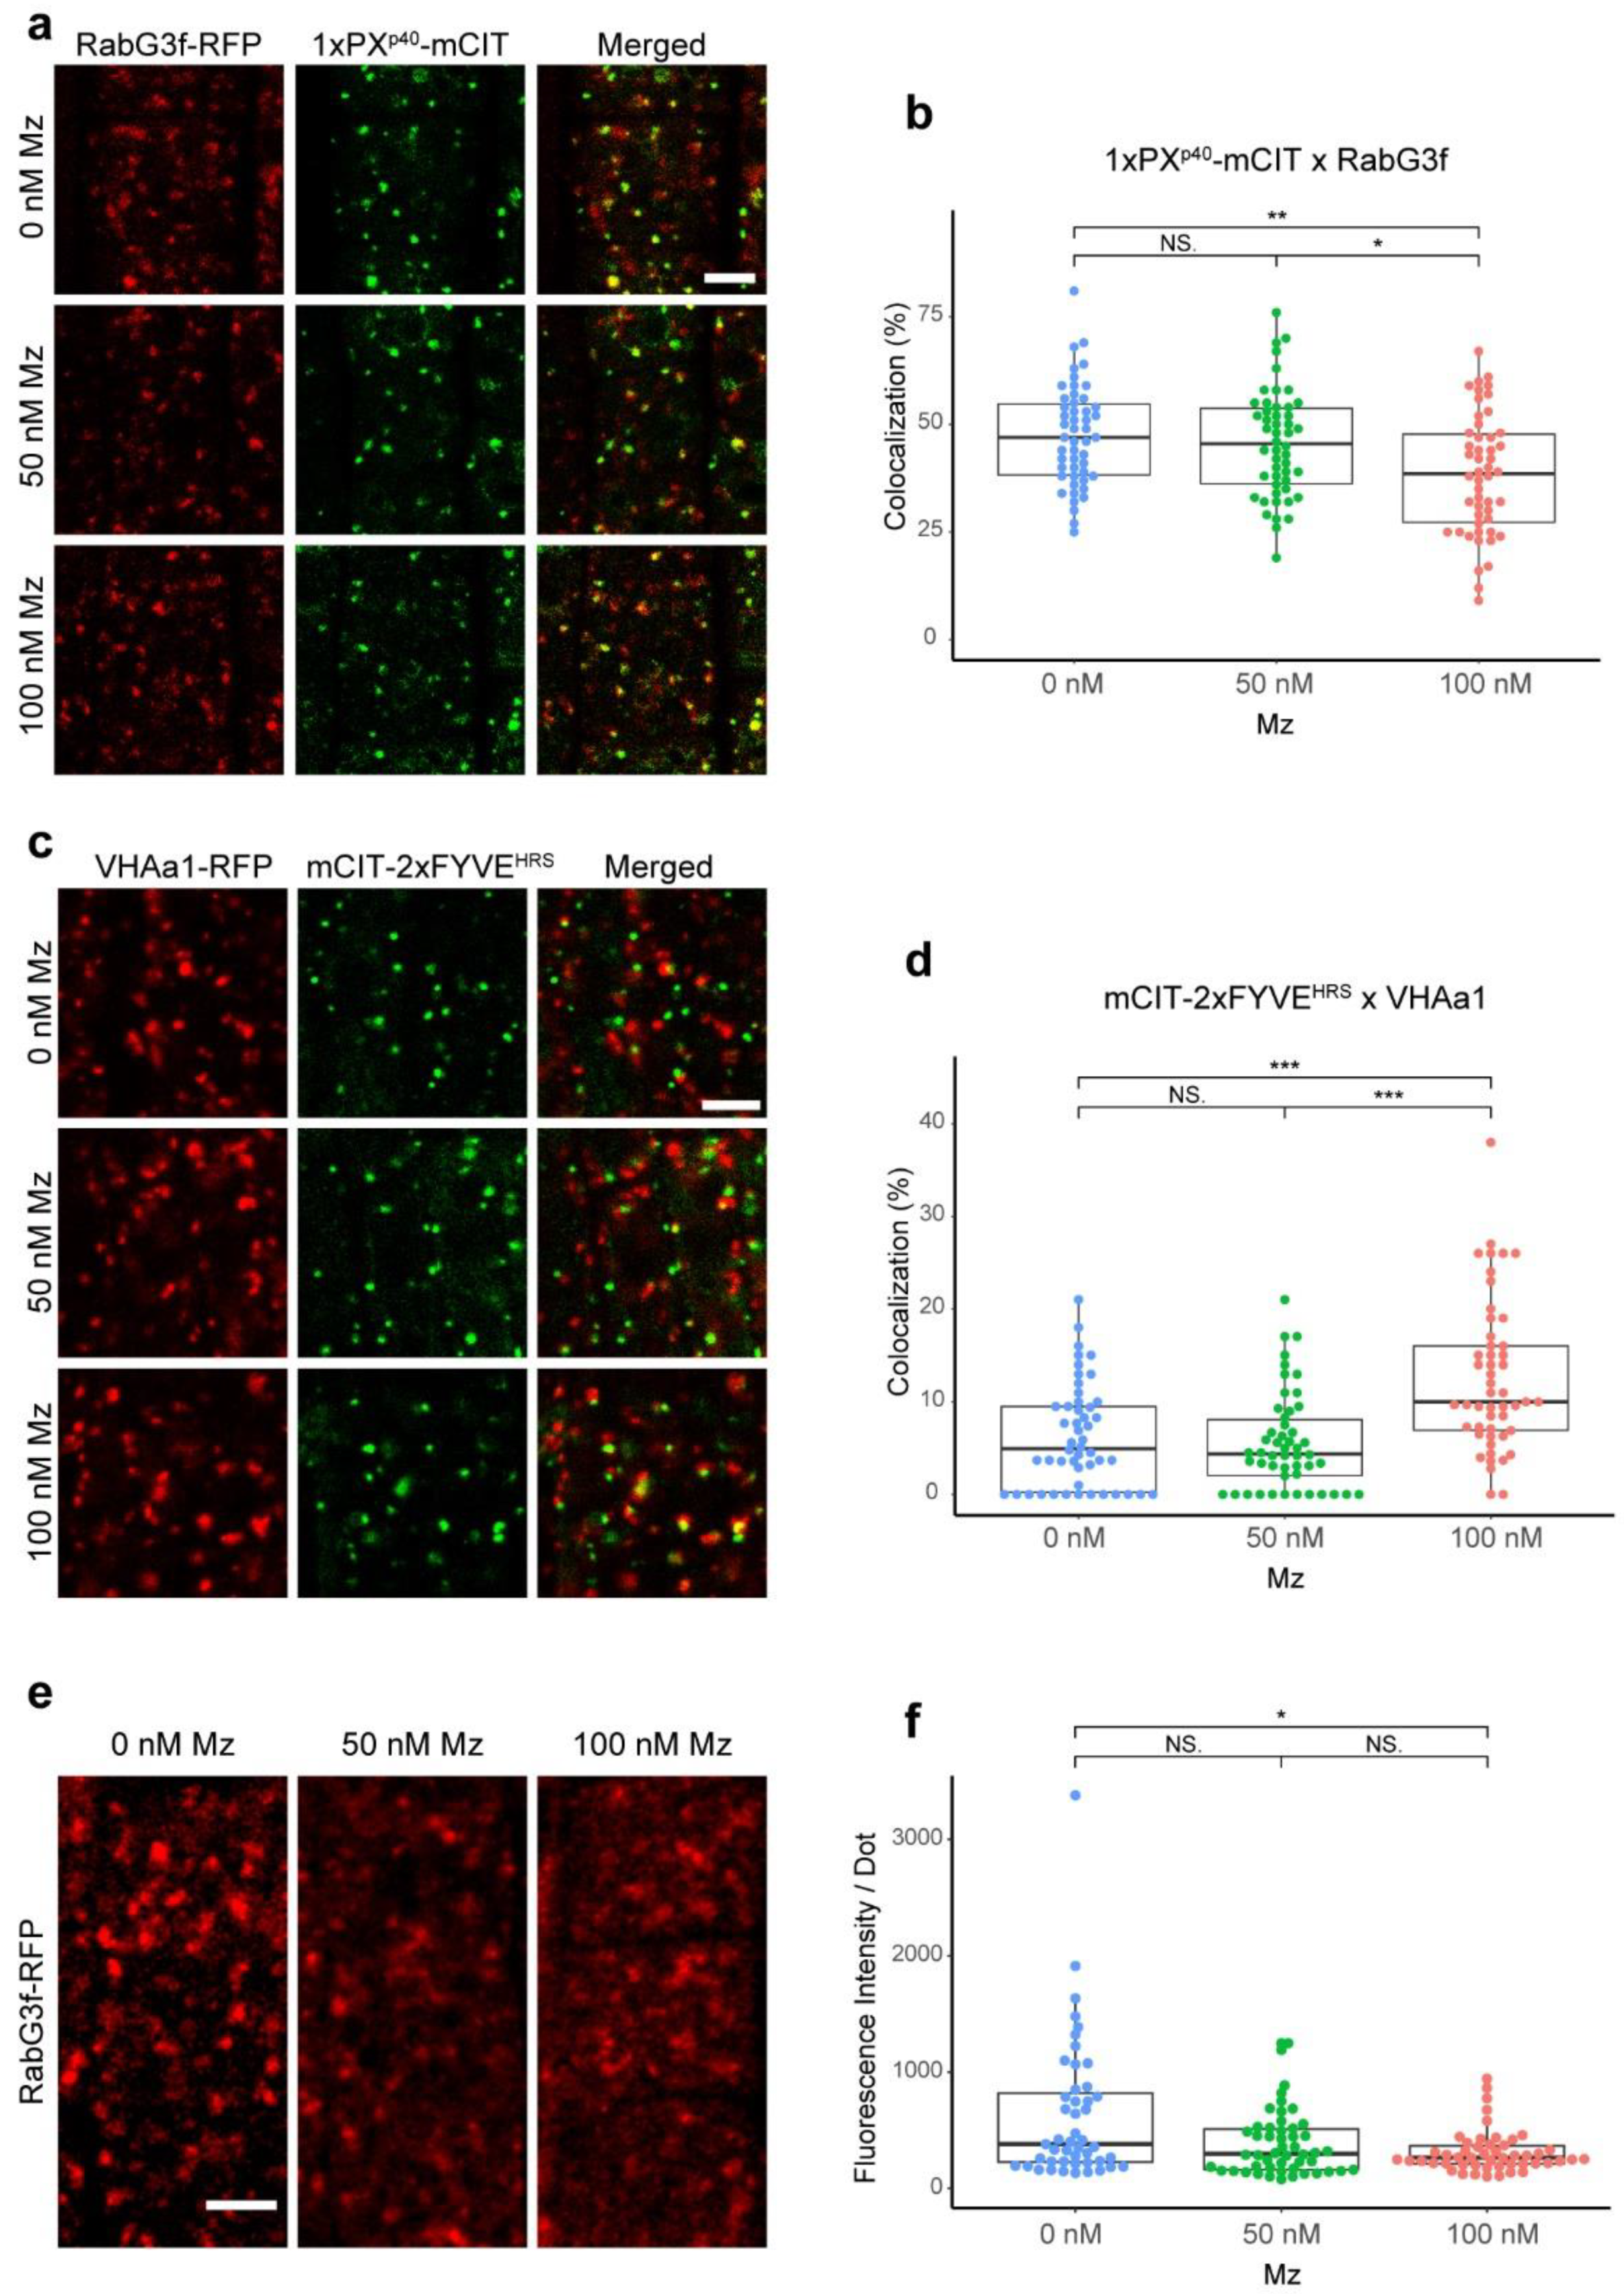
2.1. Very Long Chain Fatty Acids Impact Sub-Cellular PI3P Homeostasis and Distribution
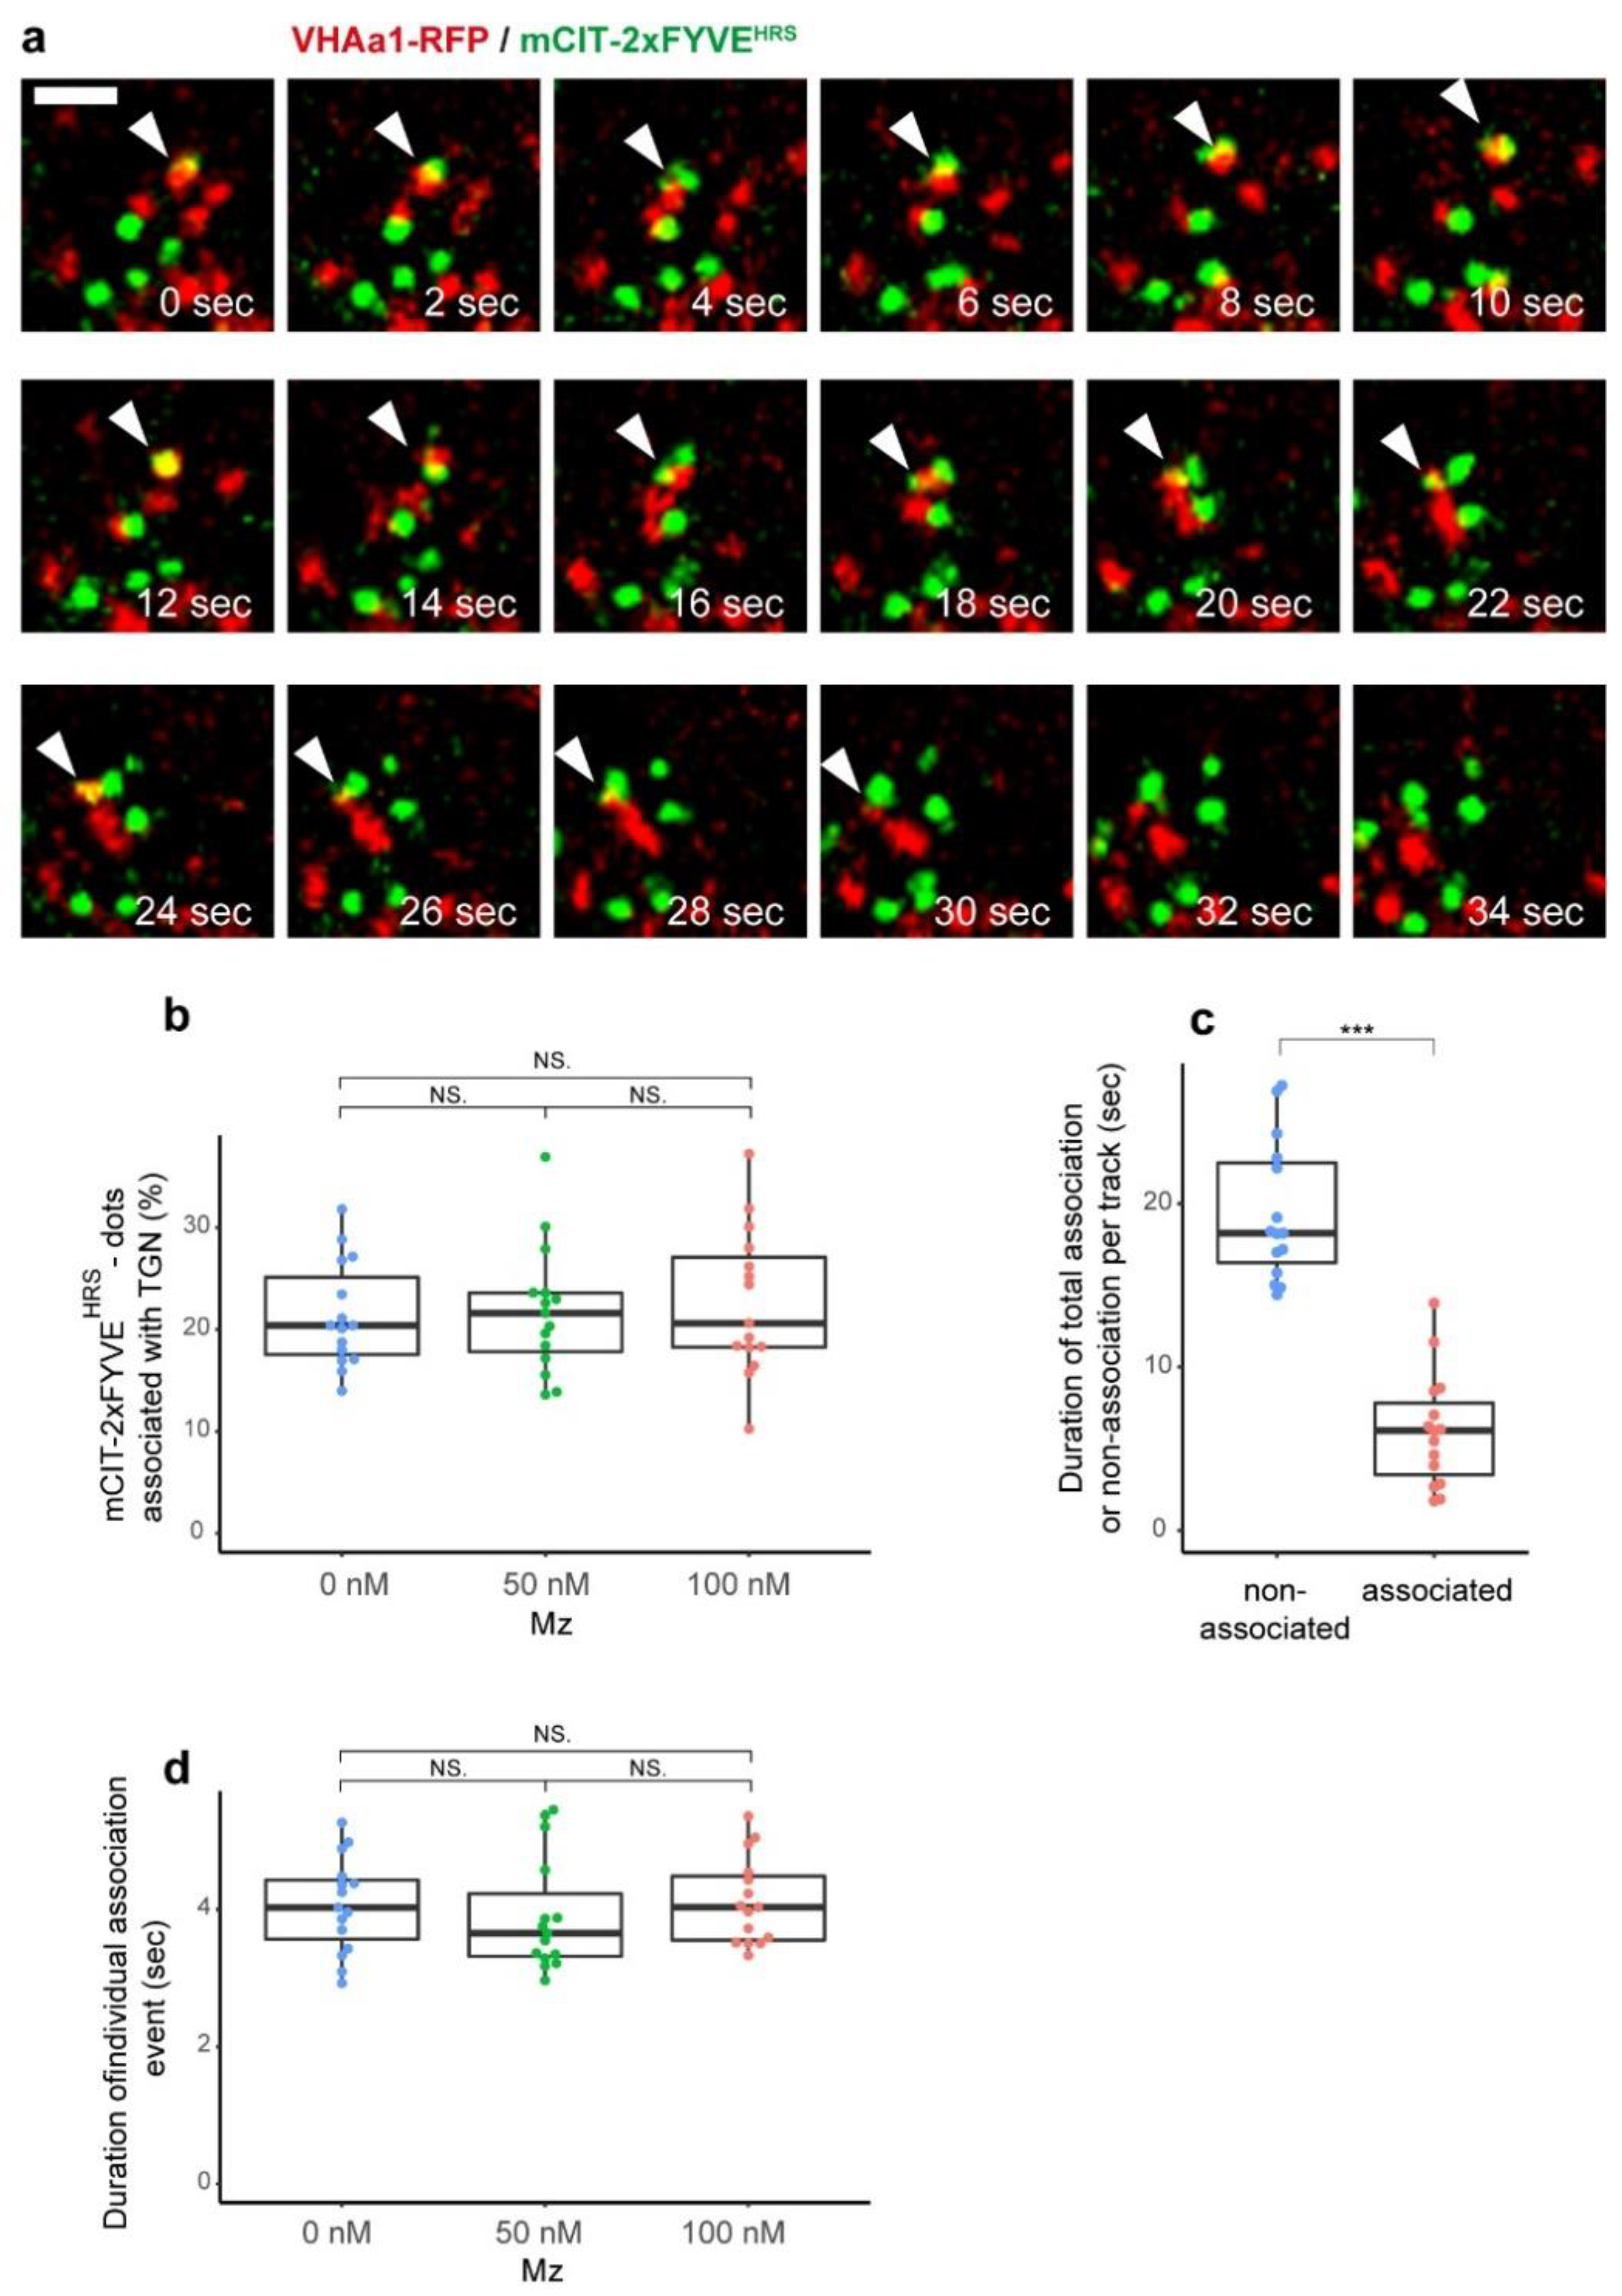
2.2. The TGN Transiently Associates with PI3P-Positive Compartments but VLCFAs Are Not Involved in This Process
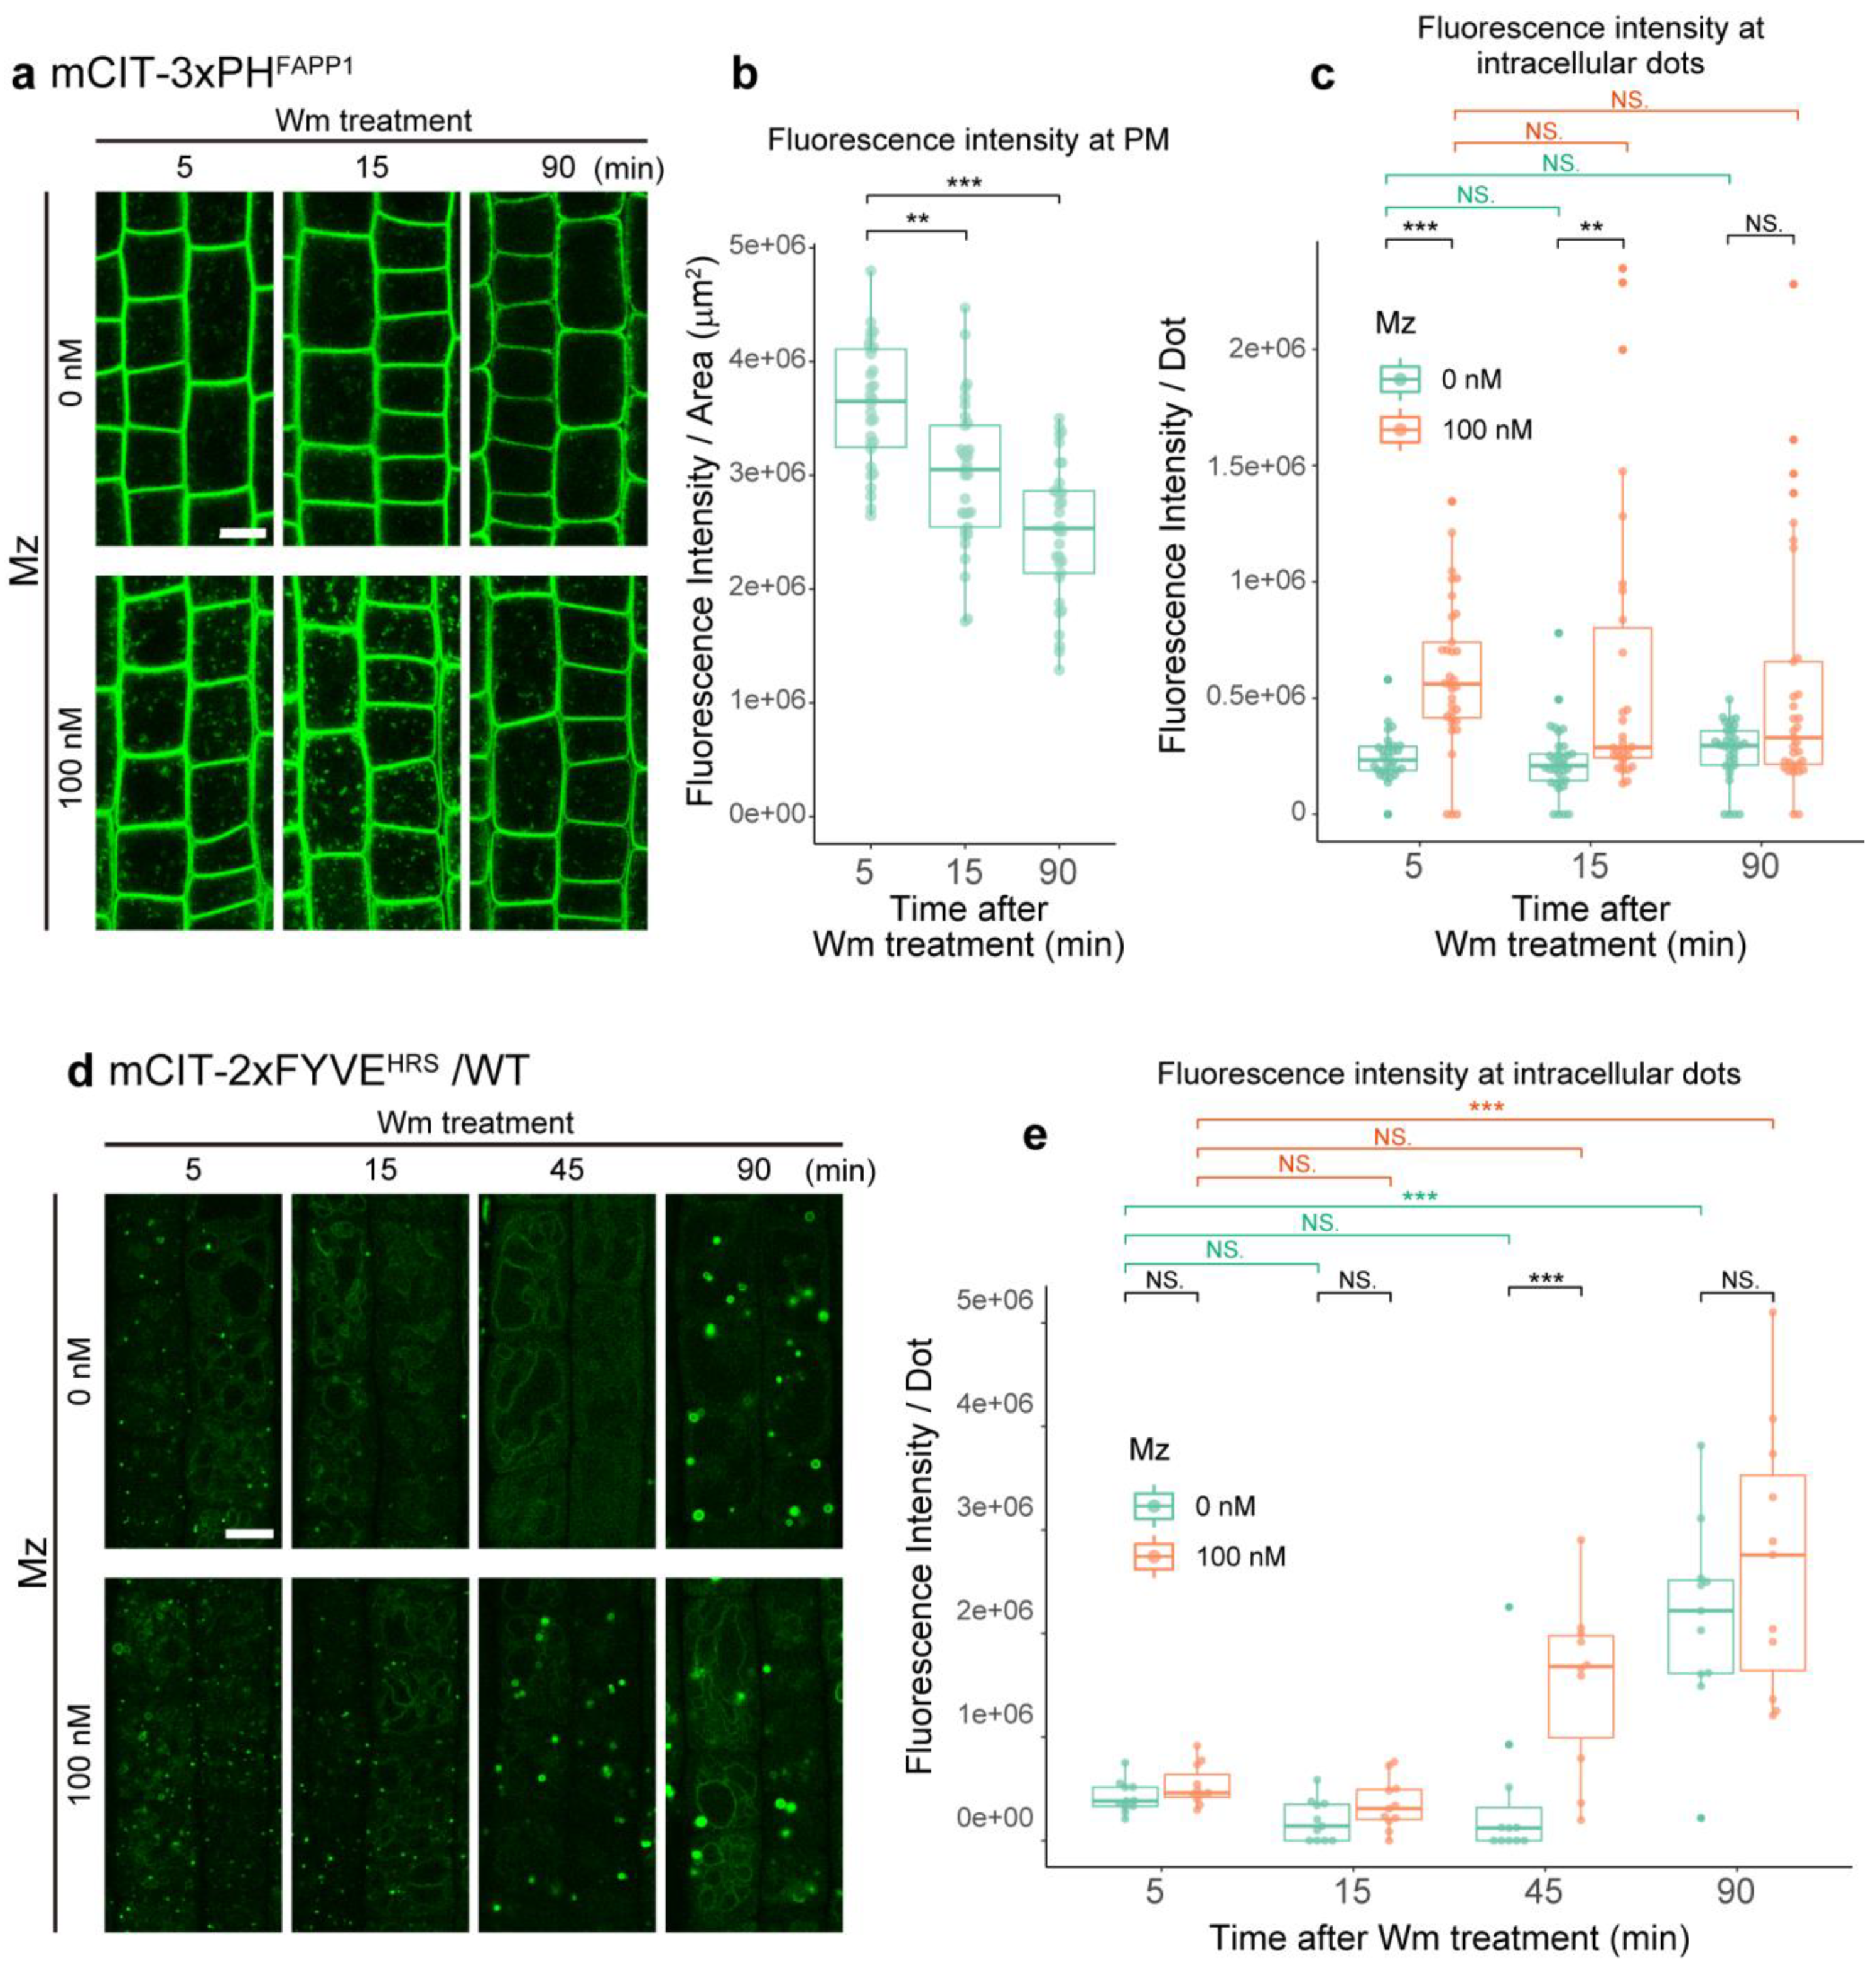
2.3. Metazachlor Prevents the Loss of PI3P upon Inhibition of the Phosphatidylinositol 3-Kinase
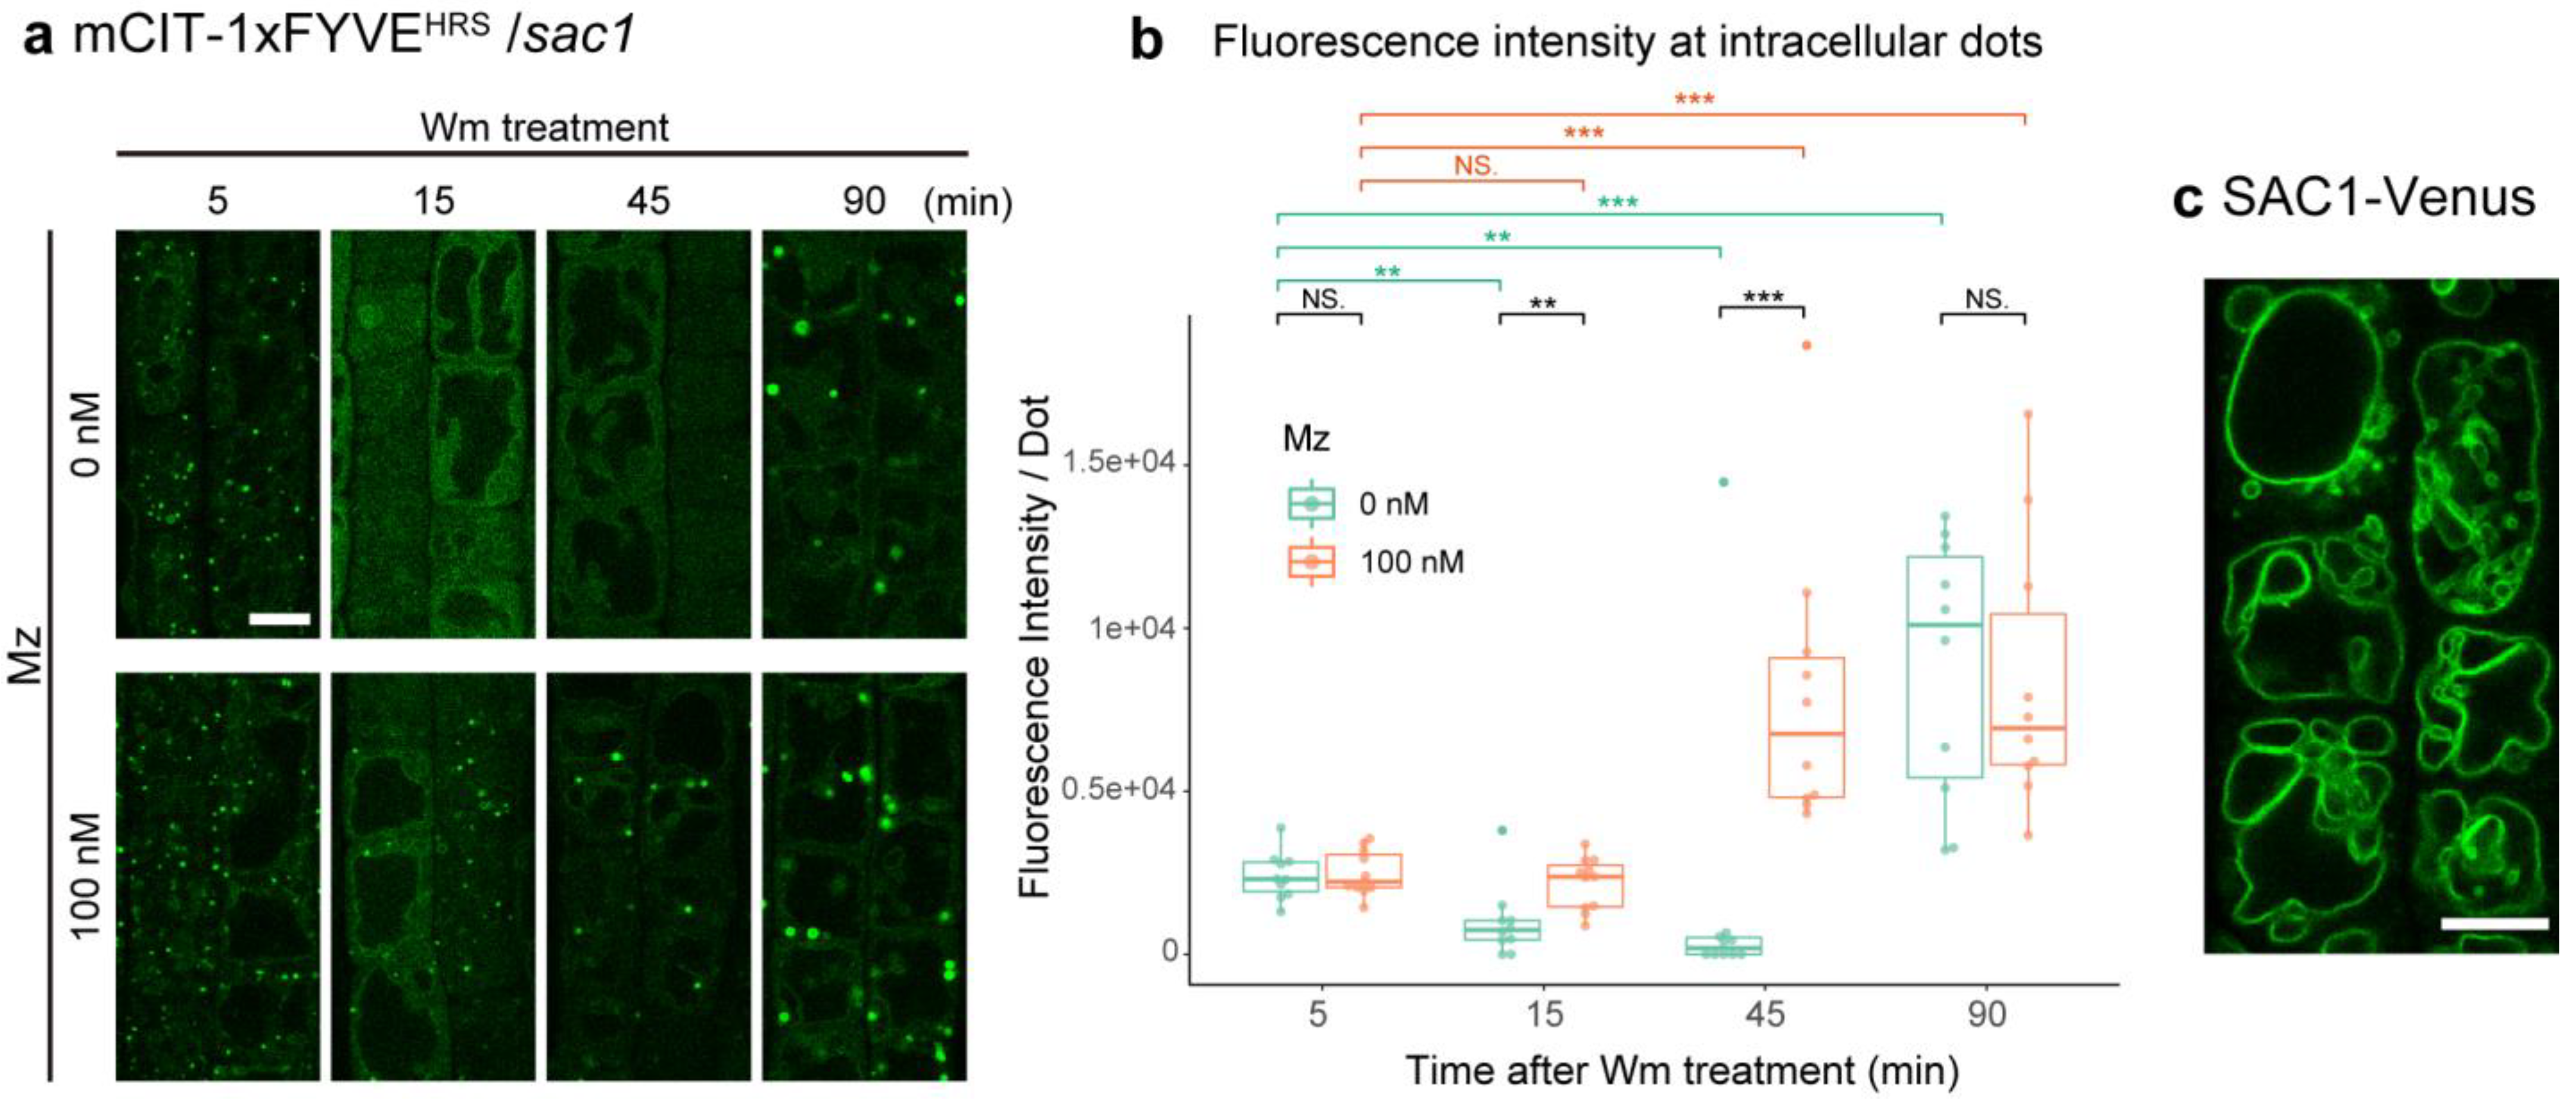
2.4. VLCFA-Mediated PI3P Homeostasis Is Not Dependent upon PI(3,5)P2 Degradation by SAC1
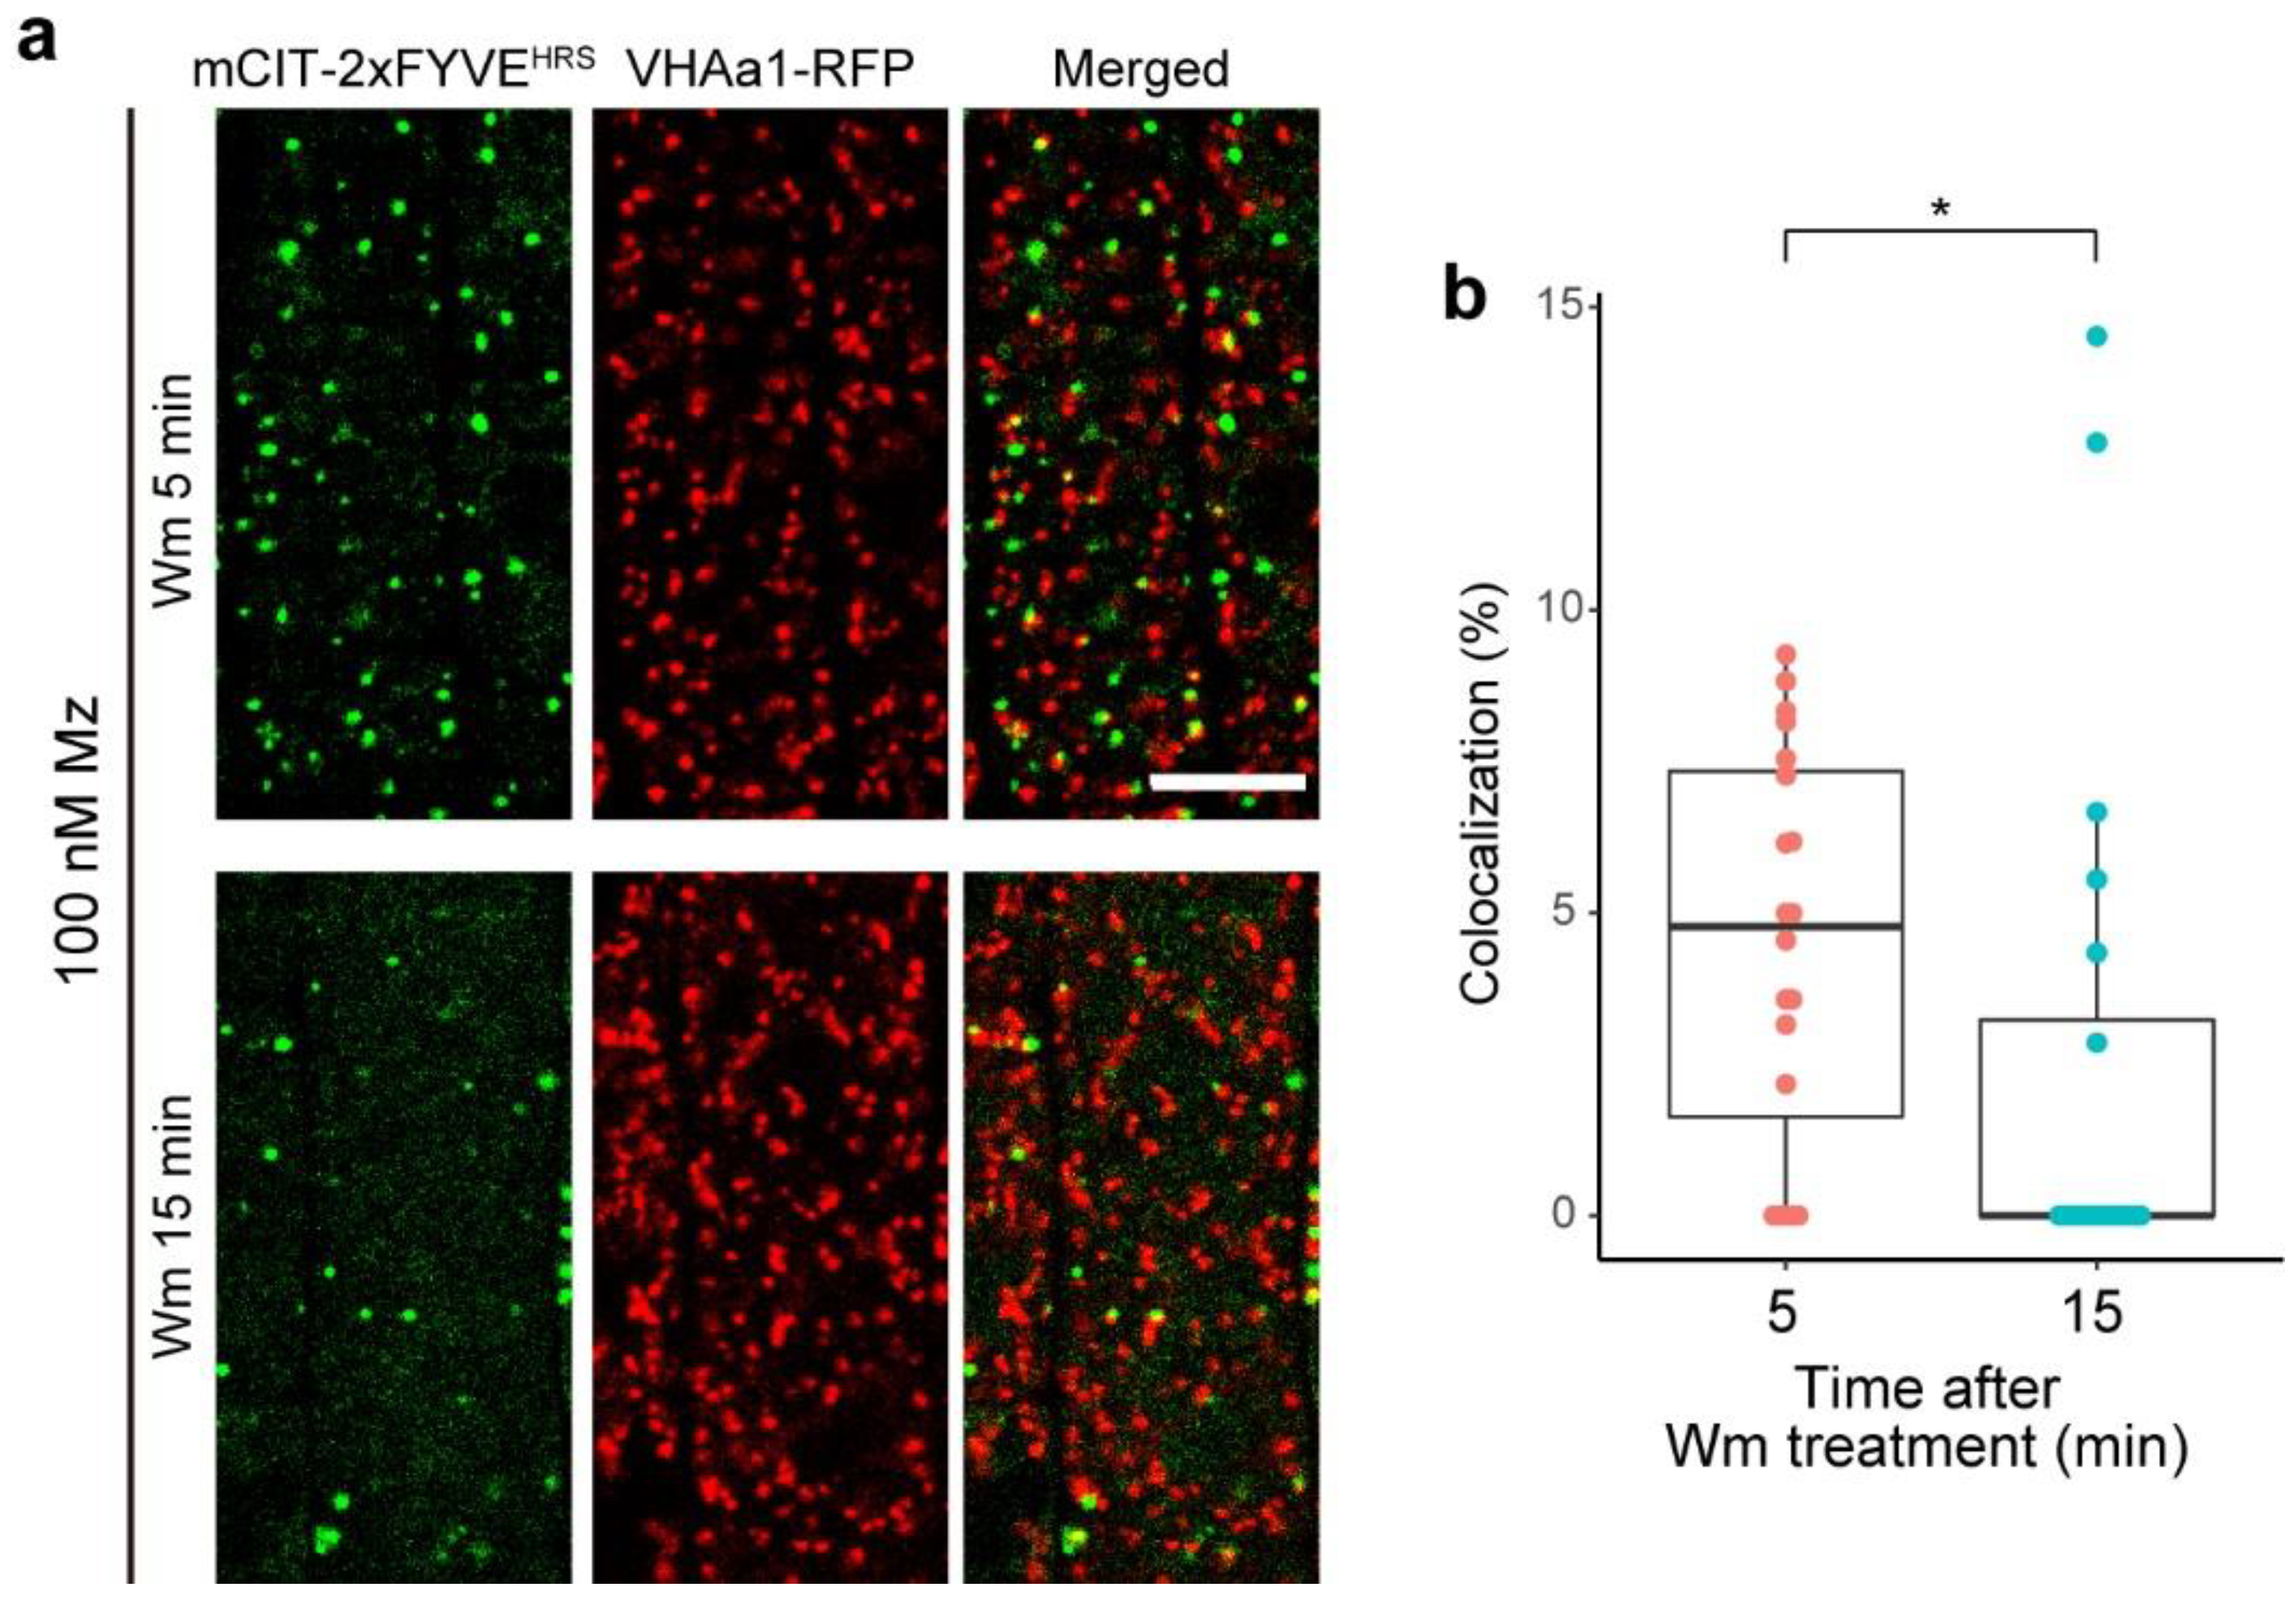
2.5. PI3P of TGN Might Be Transferable to MVBs
3. Discussion
4. Materials and Methods
4.1. Plant Material and Growth Conditions
4.2. Cloning and Plant Transformation
4.3. Inhibitor Treatments
4.4. Confocal Microscopy and Image Analyses
4.5. Statistical Analyses
Author Contributions
Funding
Institutional Review Board Statement
Informed Consent Statement
Data Availability Statement
Acknowledgments
Conflicts of Interest
References
- Gendre, D.; Jonsson, K.; Boutté, Y.; Bhalerao, R.P. Journey to the cell surface—the central role of the trans-Golgi network in plants. Protoplasma 2015, 252, 385–398. [Google Scholar] [CrossRef]
- Rosquete, M.R.; Davis, D.J.; Drakakaki, G. The Plant Trans.-Golgi Network: Not Just a Matter of Distinction. Plant Physiol. 2018, 176, 187–198. [Google Scholar] [CrossRef] [Green Version]
- Viotti, C.; Bubeck, J.; Stierhof, Y.D.; Krebs, M.; Langhans, M.; van den Berg, W.; van Dongen, W.; Richter, S.; Geldner, N.; Takano, J.; et al. Endocytic and secretory traffic in Arabidopsis merge in the trans-Golgi network/early endosome, an independent and highly dynamic organelle. Plant Cell 2010, 22, 1344–1357. [Google Scholar] [CrossRef] [Green Version]
- Uemura, T.; Suda, Y.; Ueda, T.; Nakano, A. Dynamic behavior of the trans-golgi network in root tissues of Arabidopsis revealed by super-resolution live imaging. Plant Cell Physiol. 2014, 55, 694–703. [Google Scholar] [CrossRef] [Green Version]
- Kang, B.-H.; Nielsen, E.; Preuss, M.L.; Mastronarde, D.; Staehelin, L.A. Electron Tomography of RabA4b- and PI-4Kβ1-Labeled Trans. Golgi Network Compartments in Arabidopsis. Traffic 2011, 12, 313–329. [Google Scholar] [CrossRef]
- Boutté, Y.; Jonsson, K.; McFarlane, H.E.; Johnson, E.; Gendre, D.; Swarup, R.; Friml, J.; Samuels, L.; Robert, S.; Bhalerao, R.P. ECHIDNA-mediated post-Golgi trafficking of auxin carriers for differential cell elongation. Proc. Natl. Acad. Sci. USA 2013, 110. [Google Scholar] [CrossRef] [Green Version]
- Dettmer, J.; Hong-Hermesdorf, A.; Stierhof, Y.D.; Schumacher, K. Vacuolar H+-ATPase activity is required for endocytic and secretory trafficking in Arabidopsis. Plant Cell 2006, 18, 715–730. [Google Scholar] [CrossRef] [PubMed] [Green Version]
- Gendre, D.; Oh, J.; Boutté, Y.; Best, J.G.; Samuels, L.; Nilsson, R.; Uemura, T.; Marchant, A.; Bennett, M.J.; Grebe, M.; et al. Conserved Arabidopsis ECHIDNA protein mediates trans-Golgi-network trafficking and cell elongation. Proc. Natl. Acad. Sci. USA 2011, 108. [Google Scholar] [CrossRef] [Green Version]
- Gendre, D.; McFarlane, H.E.; Johnson, E.; Mouille, G.; Sjödin, A.; Oh, J.; Levesque-Tremblay, G.; Watanabe, Y.; Samuels, L.; Bhalerao, R.P. Trans.-Golgi network localized ECHIDNA/Ypt interacting protein complex is required for the secretion of cell wall polysaccharides in Arabidopsis. Plant Cell 2013, 25, 2633–2646. [Google Scholar] [CrossRef] [Green Version]
- Wattelet-Boyer, V.; Brocard, L.; Jonsson, K.; Esnay, N.; Joubès, J.; Domergue, F.; Mongrand, S.; Raikhel, N.; Bhalerao, R.P.; Moreau, P.; et al. Enrichment of hydroxylated C24-and C26-acyl-chain sphingolipids mediates PIN2 apical sorting at trans-Golgi network subdomains. Nat. Commun. 2016, 7. [Google Scholar] [CrossRef] [Green Version]
- Narasimhan, M.; Johnson, A.; Prizak, R.; Kaufmann, W.A.; Tan, S.; Casillas-Pérez, B.; Friml, J. Evolutionarily unique mechanistic framework of clathrin-mediated endocytosis in plants. Elife 2020, 9. [Google Scholar] [CrossRef] [PubMed]
- Konopka, C.A.; Backues, S.K.; Bednarek, S.Y. Dynamics of Arabidopsis dynamin-related protein 1C and a clathrin light chain at the plasma membrane. Plant Cell 2008, 20, 1363–1380. [Google Scholar] [CrossRef] [Green Version]
- Ito, E.; Fujimoto, M.; Ebine, K.; Uemura, T.; Ueda, T.; Nakano, A. Dynamic behavior of clathrin in Arabidopsis thaliana unveiled by live imaging. Plant J. 2012, 69, 204–216. [Google Scholar] [CrossRef] [PubMed]
- Lee, G.-J.; Kim, H.; Kang, H.; Jang, M.; Lee, D.W.; Lee, S.; Hwang, I. EpsinR2 Interacts with Clathrin, Adaptor Protein-3, AtVTI12, and Phosphatidylinositol-3-Phosphate. Implications for EpsinR2 Function in Protein Trafficking in Plant Cells. Plant Physiol. 2007, 143, 1561–1575. [Google Scholar] [CrossRef] [Green Version]
- Reyes, F.C.; Buono, R.; Otegui, M.S. Plant endosomal trafficking pathways. Curr. Opin. Plant Biol. 2011, 14, 666–673. [Google Scholar] [CrossRef]
- Robinson, D.G.; Pimpl, P. Clathrin and post-Golgi trafficking: A very complicated issue. Trends Plant Sci. 2014, 19, 134–139. [Google Scholar] [CrossRef]
- Shimizu, Y.; Takagi, J.; Ito, E.; Ito, Y.; Ebine, K.; Komatsu, Y.; Goto, Y.; Sato, M.; Toyooka, K.; Ueda, T.; et al. Cargo sorting zones in the trans-Golgi network visualized by super-resolution confocal live imaging microscopy in plants. Nat. Commun. 2021, 12, 1–14. [Google Scholar] [CrossRef] [PubMed]
- Fuji, K.; Shirakawa, M.; Shimono, Y.; Kunieda, T.; Fukao, Y.; Koumoto, Y.; Takahashi, H.; Hara-Nishimura, I.; Shimada, T. The adaptor complex AP-4 regulates vacuolar protein sorting at the trans-golgi network by interacting with VACUOLAR SORTING RECEPTOR11. Plant Physiol. 2016, 170, 211–219. [Google Scholar] [CrossRef] [PubMed] [Green Version]
- Uemura, T.; Nakano, R.T.; Takagi, J.; Wang, Y.; Kramer, K.; Finkemeier, I.; Nakagami, H.; Tsuda, K.; Ueda, T.; Schulze-Lefert, P.; et al. A Golgi-Released Subpopulation of the Trans.-Golgi Network Mediates Protein Secretion in Arabidopsis. Plant Physiol. 2019, 179, 519–532. [Google Scholar] [CrossRef] [Green Version]
- Ebine, K.; Okatani, Y.; Uemura, T.; Goh, T.; Shoda, K.; Niihama, M.; Morita, M.T.; Spitzer, C.; Otegui, M.S.; Nakano, A.; et al. A SNARE complex unique to seed plants is required for protein storage vacuole biogenesis and seed development of Arabidopsis thaliana. Plant Cell 2008, 20, 3006–3021. [Google Scholar] [CrossRef] [Green Version]
- Scheuring, D.; Viotti, C.; Krüger, F.; Künzl, F.; Sturm, S.; Bubeck, J.; Hillmer, S.; Frigerio, L.; Robinson, D.G.; Pimpl, P.; et al. Multivesicular bodies mature from the trans-Golgi network/early endosome in Arabidopsis. Plant Cell 2011, 23, 3463–3481. [Google Scholar] [CrossRef] [Green Version]
- Singh, M.K.; Krüger, F.; Beckmann, H.; Brumm, S.; Vermeer, J.E.M.; Munnik, T.; Mayer, U.; Stierhof, Y.-D.; Grefen, C.; Schumacher, K.; et al. Protein Delivery to Vacuole Requires SAND Protein-Dependent Rab GTPase Conversion for MVB-Vacuole Fusion. Curr. Biol. 2014, 24, 1383–1389. [Google Scholar] [CrossRef] [PubMed] [Green Version]
- Ebine, K.; Inoue, T.; Ito, J.; Ito, E.; Uemura, T.; Goh, T.; Abe, H.; Sato, K.; Nakano, A.; Ueda, T. Plant vacuolar trafficking occurs through distinctly regulated pathways. Curr. Biol. 2014, 24, 1375–1382. [Google Scholar] [CrossRef] [PubMed] [Green Version]
- Stierhof, Y.D.; El Kasmi, F. Strategies to improve the antigenicity, ultrastructure preservation and visibility of trafficking compartments in Arabidopsis tissue. Eur. J. Cell Biol. 2010, 89, 285–297. [Google Scholar] [CrossRef]
- Vermeer, J.E.M.; Van Leeuwen, W.; Tobeña-Santamaria, R.; Laxalt, A.M.; Jones, D.R.; Divecha, N.; Gadella, T.W.J.; Munnik, T. Visualization of PtdIns3P dynamics in living plant cells. Plant J. 2006, 47, 687–700. [Google Scholar] [CrossRef]
- Simon, M.L.A.; Platre, M.P.; Assil, S.; van Wijk, R.; Chen, W.Y.; Chory, J.; Dreux, M.; Munnik, T.; Jaillais, Y. A multi-colour/multi-affinity marker set to visualize phosphoinositide dynamics in Arabidopsis. Plant J. 2014, 77, 322–337. [Google Scholar] [CrossRef] [Green Version]
- Sakurai, H.T.; Inoue, T.; Nakano, A.; Ueda, T. ENDOSOMAL RAB EFFECTOR WITH PX-DOMAIN, an interacting partner of RAB5 GTPases, regulates membrane trafficking to protein storage vacuoles in Arabidopsis. Plant Cell 2016, 28, 1490–1503. [Google Scholar] [CrossRef] [Green Version]
- Gao, C.; Luo, M.; Zhao, Q.; Yang, R.; Cui, Y.; Zeng, Y.; Xia, J.; Jiang, L. A Unique plant ESCRT component, FREE1, regulates multivesicular body protein sorting and plant growth. Curr. Biol. 2014, 24, 2556–2563. [Google Scholar] [CrossRef] [Green Version]
- Geldner, N.; Dénervaud-Tendon, V.; Hyman, D.L.; Mayer, U.; Stierhof, Y.D.; Chory, J. Rapid, combinatorial analysis of membrane compartments in intact plants with a multicolor marker set. Plant J. 2009, 59, 169–178. [Google Scholar] [CrossRef] [Green Version]
- von der Fecht-Bartenbach, J.; Bogner, M.; Krebs, M.; Stierhof, Y.-D.; Schumacher, K.; Ludewig, U. Function of the anion transporter AtCLC-d in the trans-Golgi network. Plant J. 2007, 50, 466–474. [Google Scholar] [CrossRef] [Green Version]
- Cui, Y.; Zhao, Q.; Gao, C.; Ding, Y.; Zeng, Y.; Ueda, T.; Nakano, A.; Jiang, L. Activation of the Rab7 GTPase by the MON1-CCZ1 complex is essential for PVC-to-vacuole trafficking and plant growth in Arabidopsis. Plant Cell 2014, 26, 2080–2097. [Google Scholar] [CrossRef] [PubMed] [Green Version]
- Huff, J. The Airyscan detector from ZEISS: Confocal imaging with improved signal-to-noise ratio and super-resolution. Nat. Methods 2015, 12, 1–2. [Google Scholar] [CrossRef]
- Matsuoka, K.; Bassham, D.C.; Raikhel, N.V.; Nakamura, K. Different sensitivity to wortmannin of two vacuolar sorting signals indicates the presence of distinct sorting machineries in tobacco cells. J. Cell Biol. 1995, 130, 1307–1318. [Google Scholar] [CrossRef] [PubMed]
- Takáč, T.; Pechan, T.; Šamajová, O.; Ovečka, M.; Richter, H.; Eck, C.; Niehaus, K.; Šamaj, J. Wortmannin treatment induces changes in arabidopsis root proteome and Post-Golgi compartments. J. Proteome Res. 2012, 11, 3127–3142. [Google Scholar] [CrossRef] [PubMed]
- Wang, J.; Cai, Y.; Miao, Y.; Lam, S.K.; Jiang, L. Wortmannin induces homotypic fusion of plant prevacuolar compartments. J. Exp. Bot. 2009, 60, 3075–3083. [Google Scholar] [CrossRef] [PubMed] [Green Version]
- Xue, H.-W.; Pical, C.; Brearley, C.; Elge, S.; Müller-Röber, B. A Plant 126-kDa Phosphatidylinositol 4-Kinase with a Novel Repeat Structure. J. Biol. Chem. 1999, 274, 5738–5745. [Google Scholar] [CrossRef] [PubMed] [Green Version]
- Krinke, O.; Ruelland, E.; Valentová, O.; Vergnolle, C.; Renou, J.-P.; Taconnat, L.; Flemr, M.; Burketová, L.; Zachowski, A. Phosphatidylinositol 4-kinase activation is an early response to salicylic acid in Arabidopsis suspension cells. Plant Physiol. 2007, 144, 1347–1359. [Google Scholar] [CrossRef] [PubMed] [Green Version]
- Ito, Y.; Esnay, N.; Platre, M.P.; Noack, L.; Menzel, W.; Claverol, S.; Moreau, P.; Jaillais, Y.; Boutté, Y. Sphingolipids mediate polar sorting of PIN2 through phosphoinositide consumption at the trans -Golgi Network. Nat. Commun. 2020, 12, 4267. [Google Scholar] [CrossRef] [PubMed]
- Simon, M.L.A.; Platre, M.P.; Marquès-Bueno, M.M.; Armengot, L.; Stanislas, T.; Bayle, V.; Caillaud, M.-C.; Jaillais, Y. A PtdIns(4)P-driven electrostatic field controls cell membrane identity and signalling in plants. Nat. Plants 2016, 2, 16089. [Google Scholar] [CrossRef]
- Zhong, R.; Ye, Z.H. The SAC domain-containing protein gene family in Arabidopsis. Plant Physiol. 2003, 132, 544–555. [Google Scholar] [CrossRef] [Green Version]
- Zhong, R.; Burk, D.H.; Nairn, C.J.; Wood-Jones, A.; Morrison, W.H.; Ye, Z.H. Mutation of SAC1, an Arabidopsis SAC domain phosphoinositide phosphatase, causes alterations in cell morphogenesis, cell wall synthesis, and actin organization. Plant Cell 2005, 17, 1449–1466. [Google Scholar] [CrossRef] [PubMed] [Green Version]
- Nováková, P.; Hirsch, S.; Feraru, E.; Tejos, R.; Van Wijk, R.; Viaene, T.; Heilmann, M.; Lerche, J.; De Rycke, R.; Feraru, M.I.; et al. SAC phosphoinositide phosphatases at the tonoplast mediate vacuolar function in Arabidopsis. Proc. Natl. Acad. Sci. USA 2014, 111, 2818–2823. [Google Scholar] [CrossRef] [Green Version]
- Poteryaev, D.; Datta, S.; Ackema, K.; Zerial, M.; Spang, A. Identification of the switch in early-to-late endosome transition. Cell 2010, 141, 497–508. [Google Scholar] [CrossRef] [PubMed] [Green Version]
- Santiago-Tirado, F.H.; Bretscher, A. Membrane-trafficking sorting hubs: Cooperation between PI4P and small GTPases at the trans-Golgi network. Trends Cell Biol. 2011, 21, 515–525. [Google Scholar] [CrossRef] [PubMed] [Green Version]
- Capasso, S.; Sticco, L.; Rizzo, R.; Pirozzi, M.; Russo, D.; Dathan, N.A.; Campelo, F.; Galen, J.; Hölttä-Vuori, M.; Turacchio, G.; et al. Sphingolipid metabolic flow controls phosphoinositide turnover at the trans -Golgi network. EMBO J. 2017, 36, 1736–1754. [Google Scholar] [CrossRef]
- Mesmin, B.; Bigay, J.; Polidori, J.; Jamecna, D.; Lacas-Gervais, S.; Antonny, B. Sterol transfer, PI 4P consumption, and control of membrane lipid order by endogenous OSBP. EMBO J. 2017, 36, 3156–3174. [Google Scholar] [CrossRef] [PubMed]
- Platre, M.P.; Noack, L.C.; Doumane, M.; Bayle, V.; Simon, M.L.A.; Maneta-Peyret, L.; Fouillen, L.; Stanislas, T.; Armengot, L.; Pejchar, P.; et al. A Combinatorial Lipid Code Shapes the Electrostatic Landscape of Plant Endomembranes. Dev. Cell 2018, 45, 465–480.e11. [Google Scholar] [CrossRef] [Green Version]
- Murata, N.; Sato, N.; Takahashi, N. Very-long-chain saturated fatty acids in phosphatidylserine from higher plant tissues. Biochim. Biophys. Acta (BBA)/Lipids Lipid Metab. 1984, 795, 147–150. [Google Scholar] [CrossRef]
- Markham, J.E.; Li, J.; Cahoon, E.B.; Jaworski, J.G. Separation and identification of major plant sphingolipid classes from leaves. J. Biol. Chem. 2006, 281, 22684–22694. [Google Scholar] [CrossRef] [Green Version]
- Li, R.; Sun, R.; Hicks, G.R.; Raikhel, N.V. Arabidopsis ribosomal proteins control vacuole trafficking and developmental programs through the regulation of lipid metabolism. Proc. Natl. Acad. Sci. USA 2015, 112, E89–E98. [Google Scholar] [CrossRef] [Green Version]
- Brillada, C.; Rojas-Pierce, M. Vacuolar trafficking and biogenesis: A maturation in the field. Curr. Opin. Plant Biol. 2017, 40, 77–81. [Google Scholar] [CrossRef]
- Noack, L.C.; Jaillais, Y. Functions of Anionic Lipids in Plants. Annu. Rev. Plant Biol. 2020, 71, 71–102. [Google Scholar] [CrossRef] [PubMed]
- Karimi, M.; De Meyer, B.; Hilson, P. Modular cloning in plant cells. Trends Plant Sci. 2005, 10, 103–105. [Google Scholar] [CrossRef] [PubMed]
- Clough, S.J.; Bent, A.F. Floral dip: A simplified method for Agrobacterium-mediated transformation of Arabidopsis thaliana. Plant J. 1998, 16, 735–743. [Google Scholar] [CrossRef] [Green Version]
- Bolte, S.; Cordelières, F.P. A guided tour into subcellular colocalization analysis in light microscopy. J. Microsc. 2006, 224, 213–232. [Google Scholar] [CrossRef] [PubMed]
- Gilles, J.F.; Dos Santos, M.; Boudier, T.; Bolte, S.; Heck, N. DiAna, an ImageJ tool for object-based 3D co-localization and distance analysis. Methods 2017, 115, 55–64. [Google Scholar] [CrossRef] [Green Version]


Publisher’s Note: MDPI stays neutral with regard to jurisdictional claims in published maps and institutional affiliations. |
© 2021 by the authors. Licensee MDPI, Basel, Switzerland. This article is an open access article distributed under the terms and conditions of the Creative Commons Attribution (CC BY) license (https://creativecommons.org/licenses/by/4.0/).
Share and Cite
Ito, Y.; Esnay, N.; Fougère, L.; Platre, M.P.; Cordelières, F.; Jaillais, Y.; Boutté, Y. Inhibition of Very Long Chain Fatty Acids Synthesis Mediates PI3P Homeostasis at Endosomal Compartments. Int. J. Mol. Sci. 2021, 22, 8450. https://doi.org/10.3390/ijms22168450
Ito Y, Esnay N, Fougère L, Platre MP, Cordelières F, Jaillais Y, Boutté Y. Inhibition of Very Long Chain Fatty Acids Synthesis Mediates PI3P Homeostasis at Endosomal Compartments. International Journal of Molecular Sciences. 2021; 22(16):8450. https://doi.org/10.3390/ijms22168450
Chicago/Turabian StyleIto, Yoko, Nicolas Esnay, Louise Fougère, Matthieu Pierre Platre, Fabrice Cordelières, Yvon Jaillais, and Yohann Boutté. 2021. "Inhibition of Very Long Chain Fatty Acids Synthesis Mediates PI3P Homeostasis at Endosomal Compartments" International Journal of Molecular Sciences 22, no. 16: 8450. https://doi.org/10.3390/ijms22168450