
Progress toward Room-Temperature Synthesis and Functionalization of Iron-Oxide Nanoparticles

 , , , and
Abstract
:1. Introduction
2. Results and Discussion
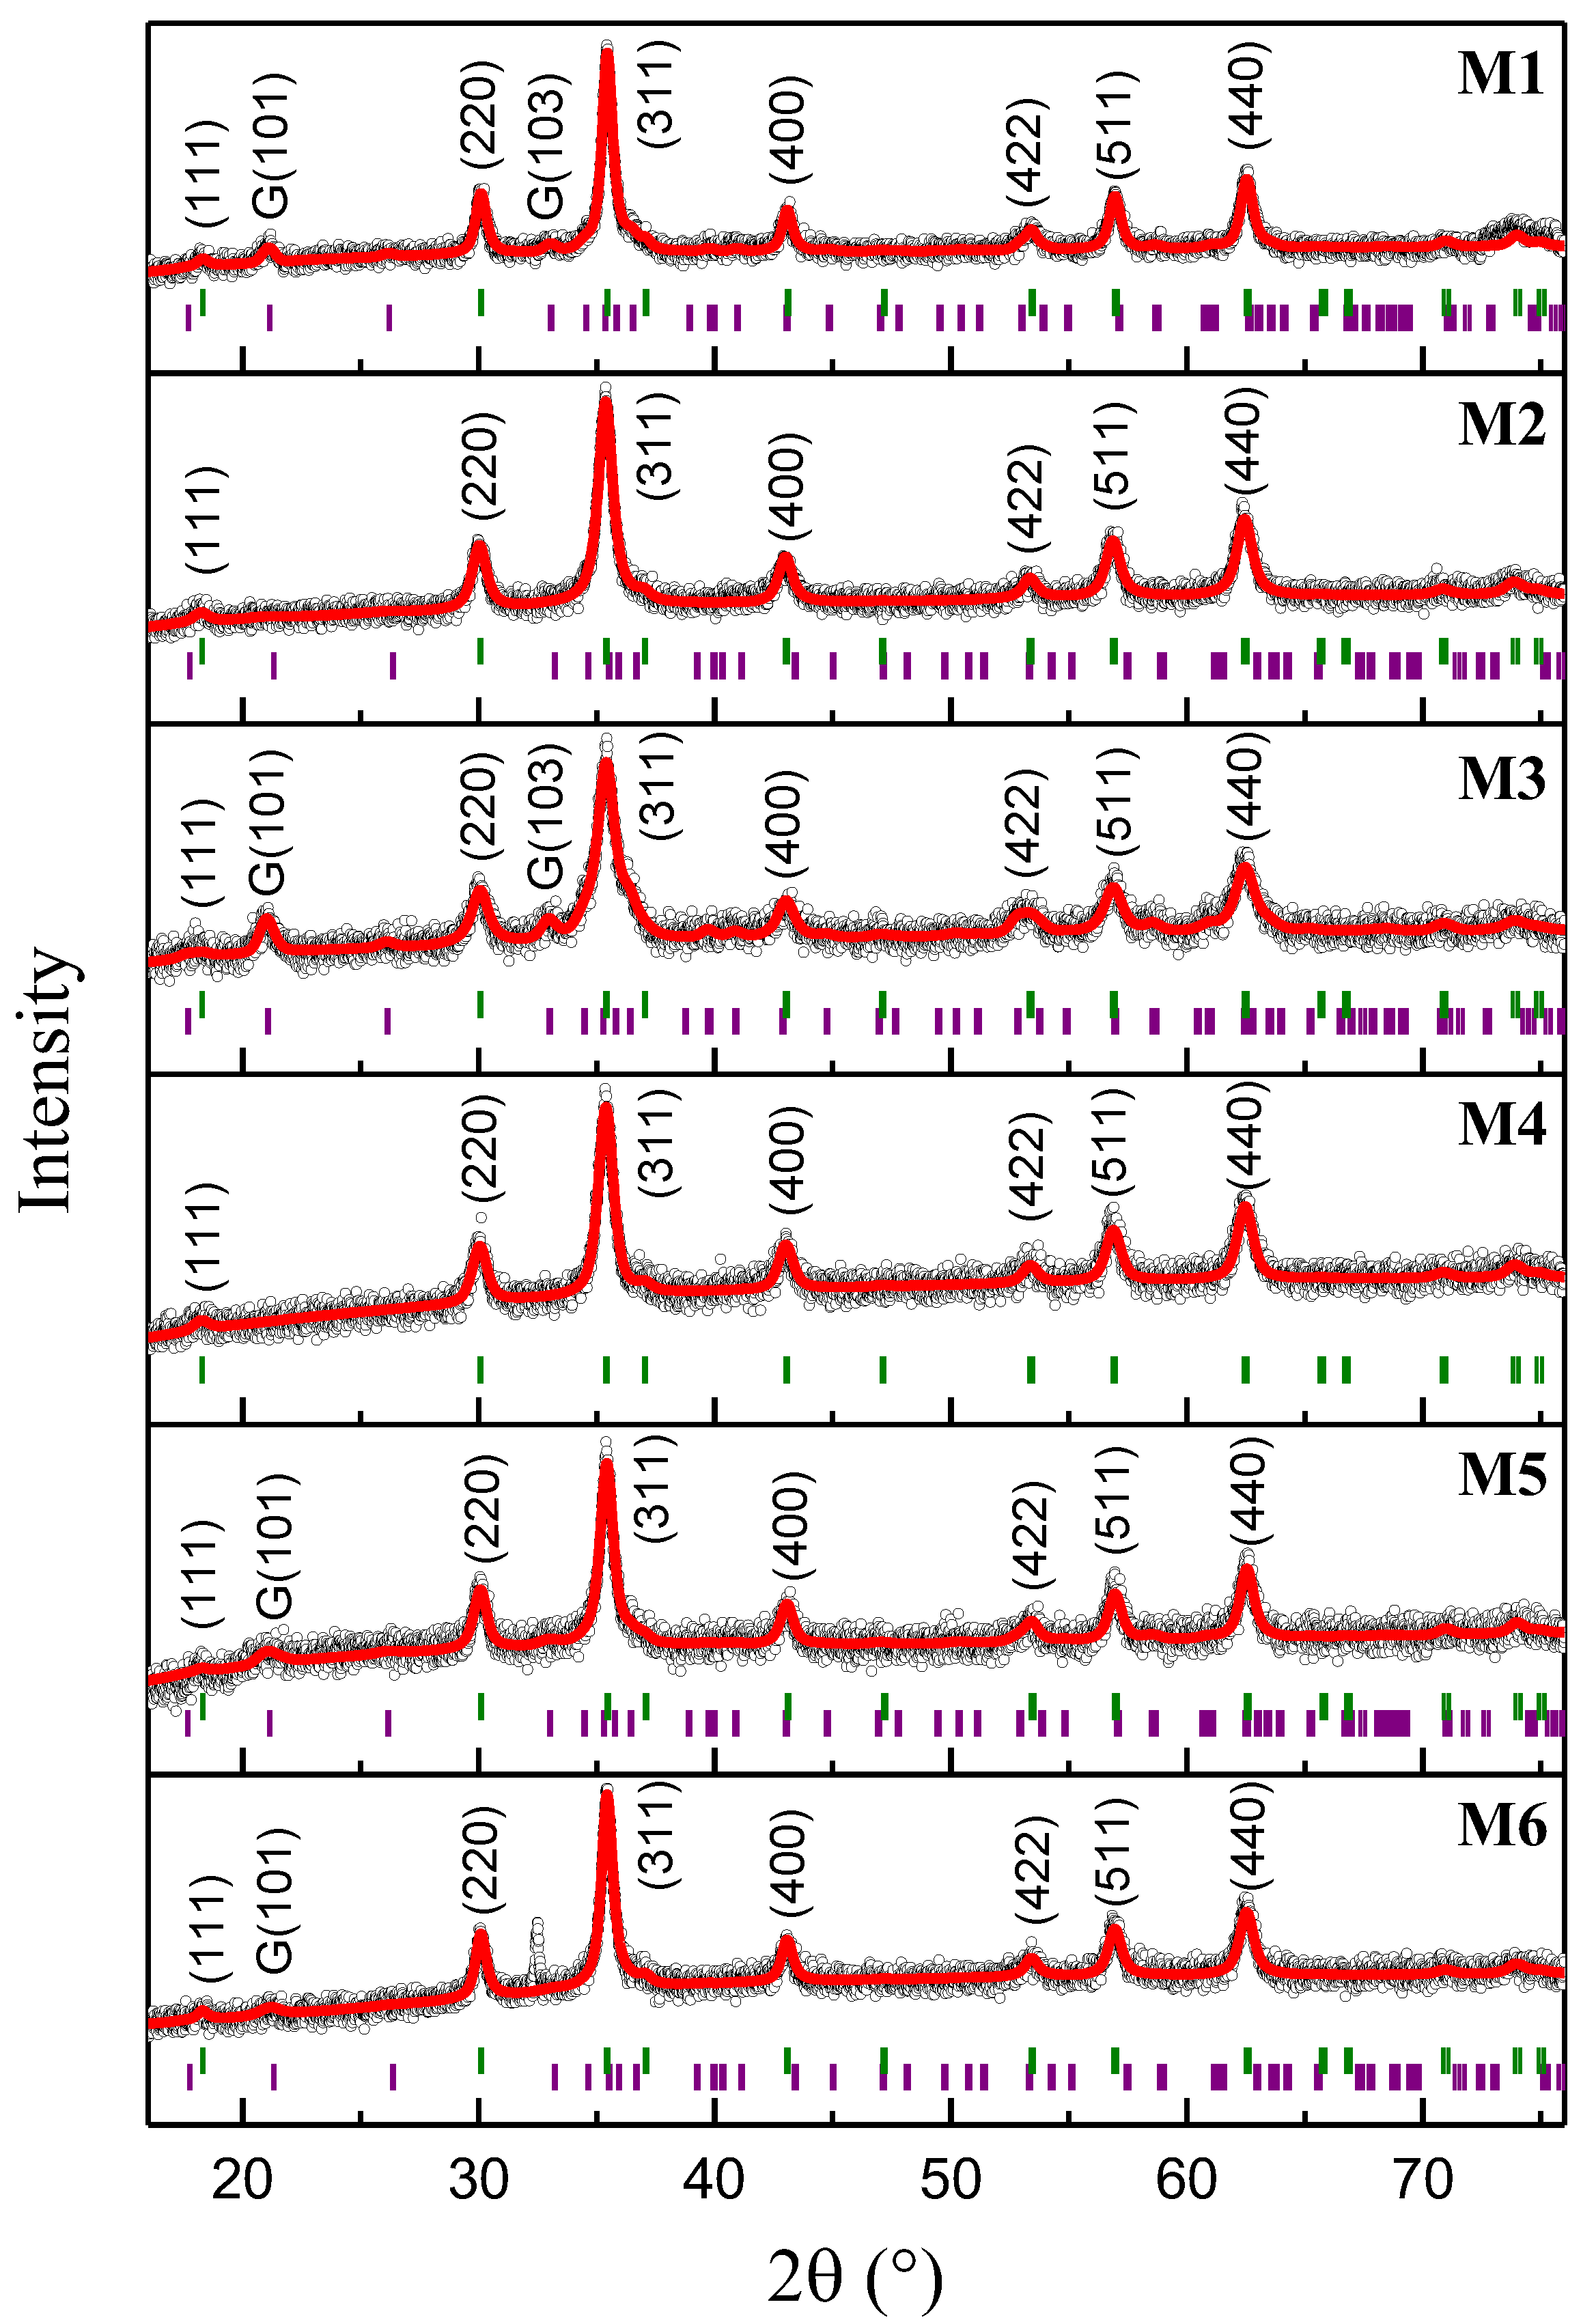
2.1. X-ray Diffraction Analysis and Rietveld Refinement
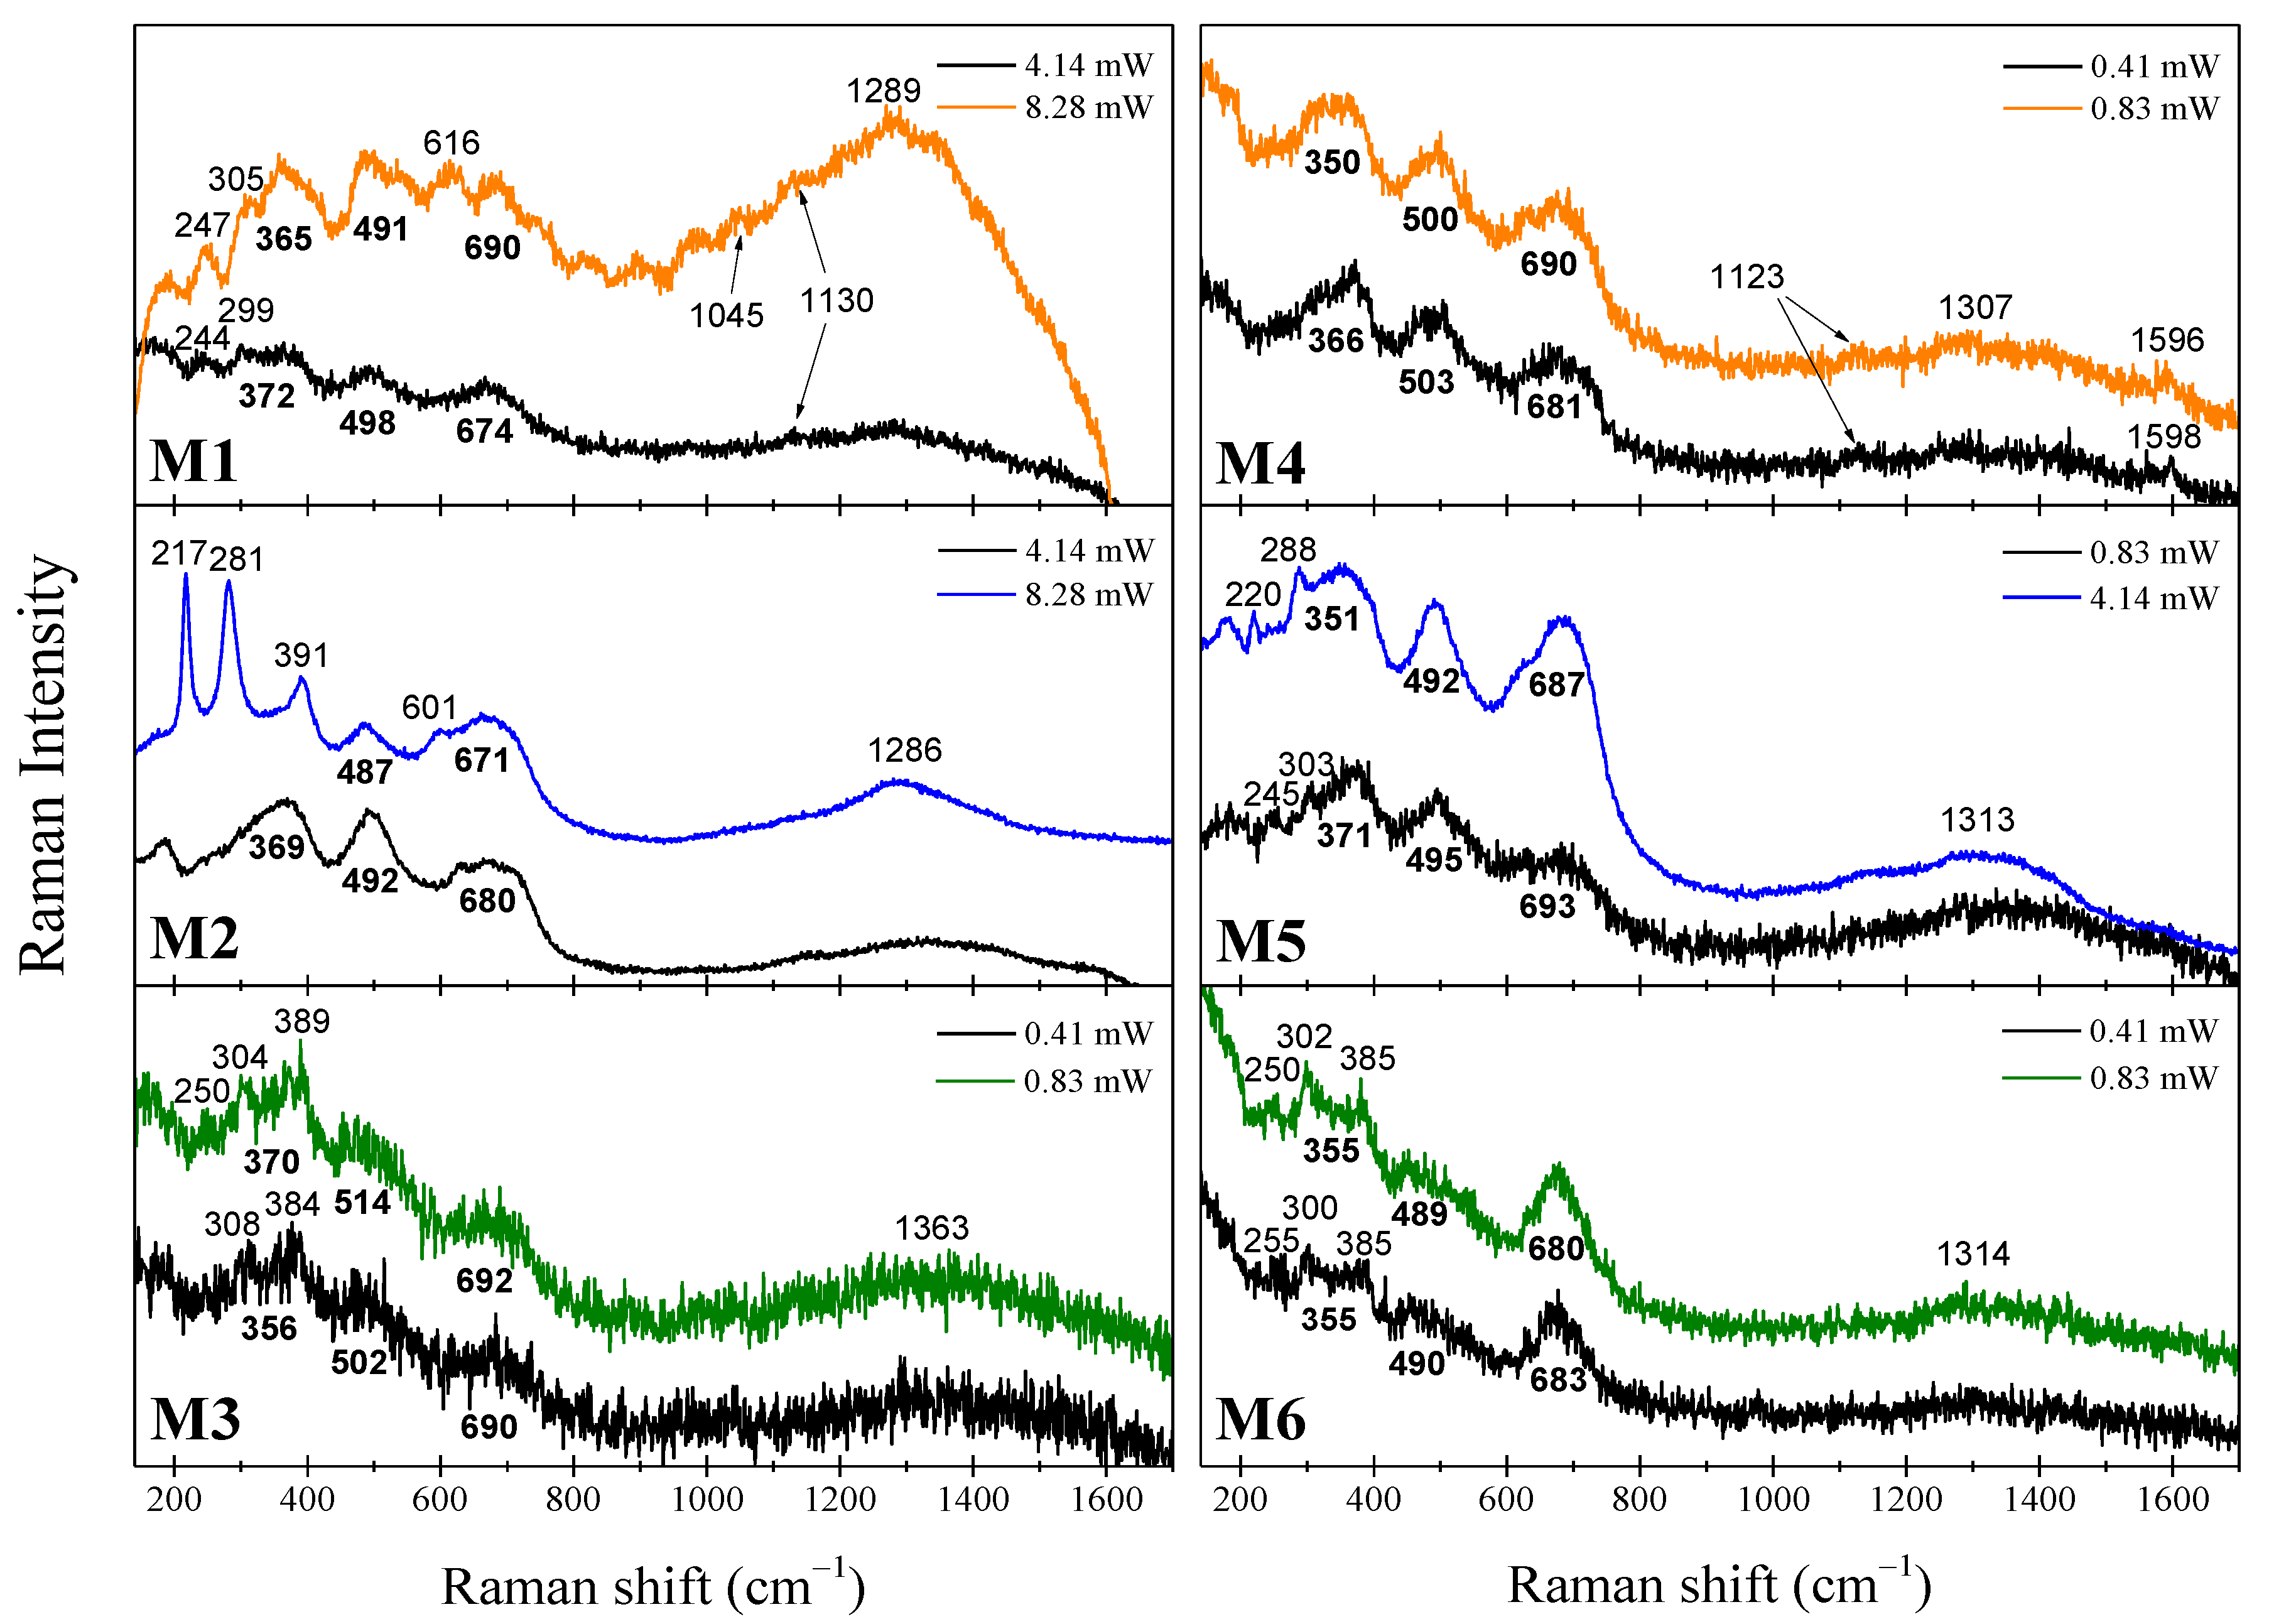
2.2. µ-Raman Analysis
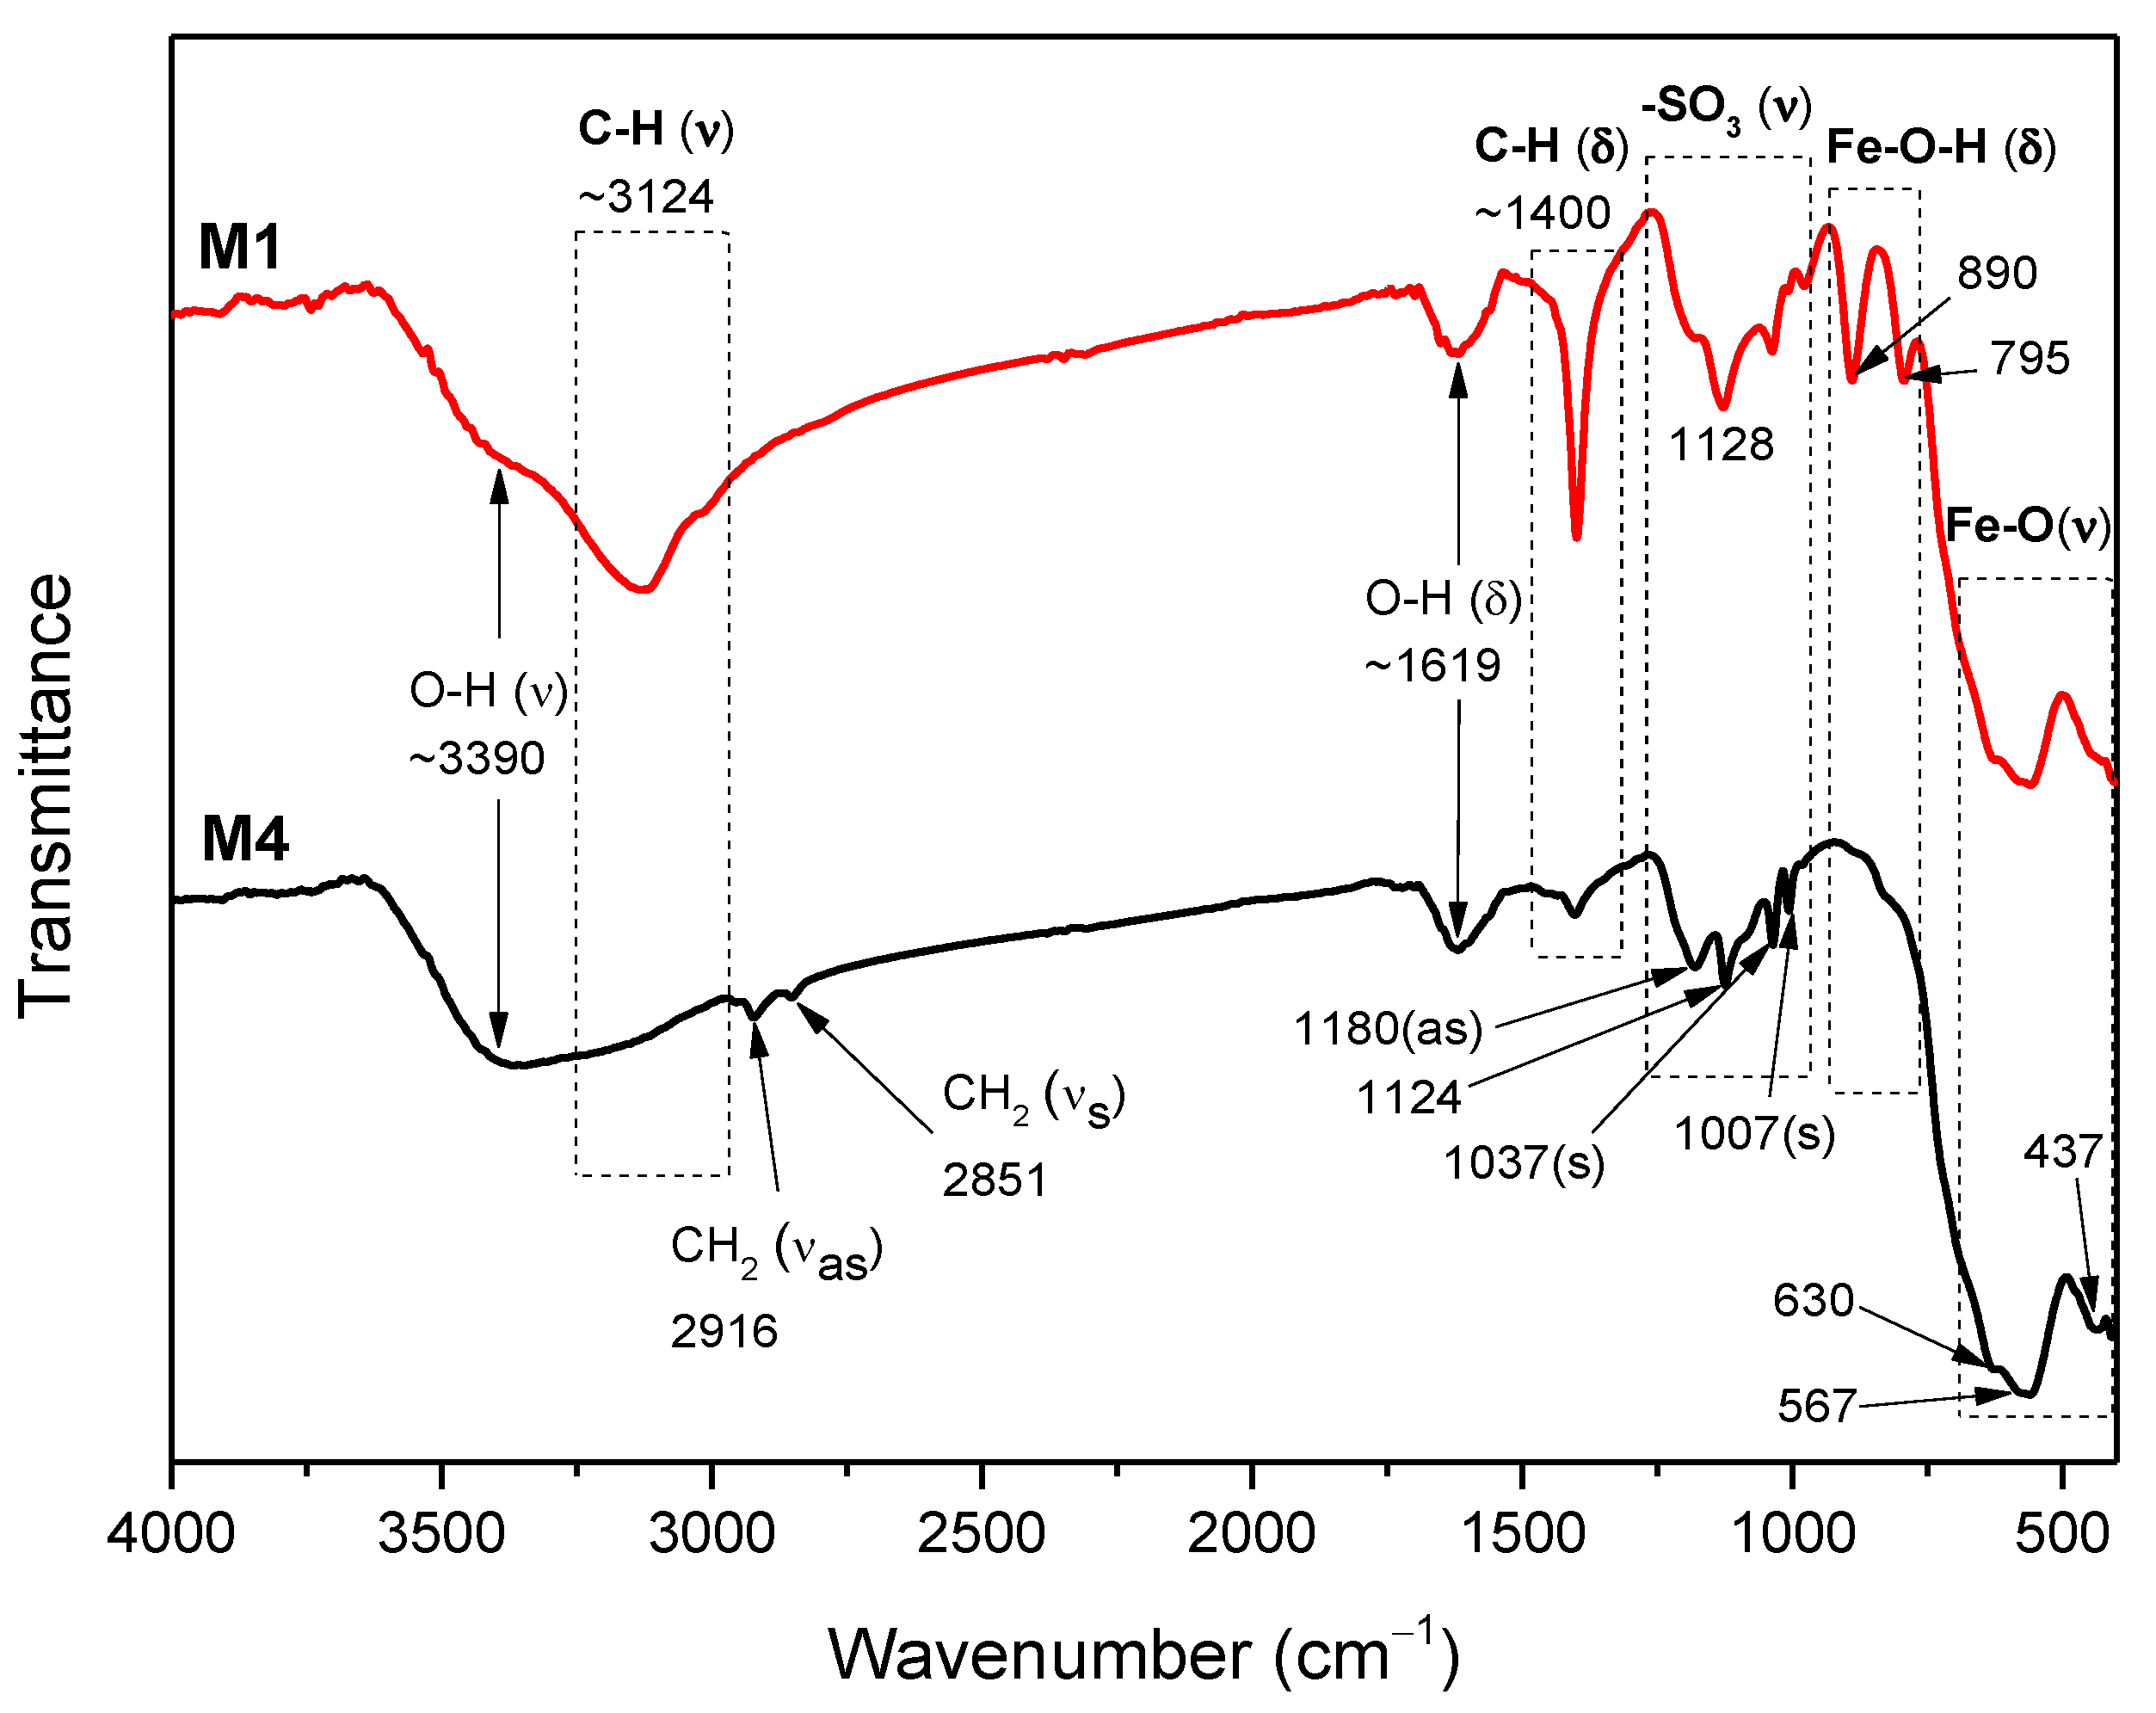
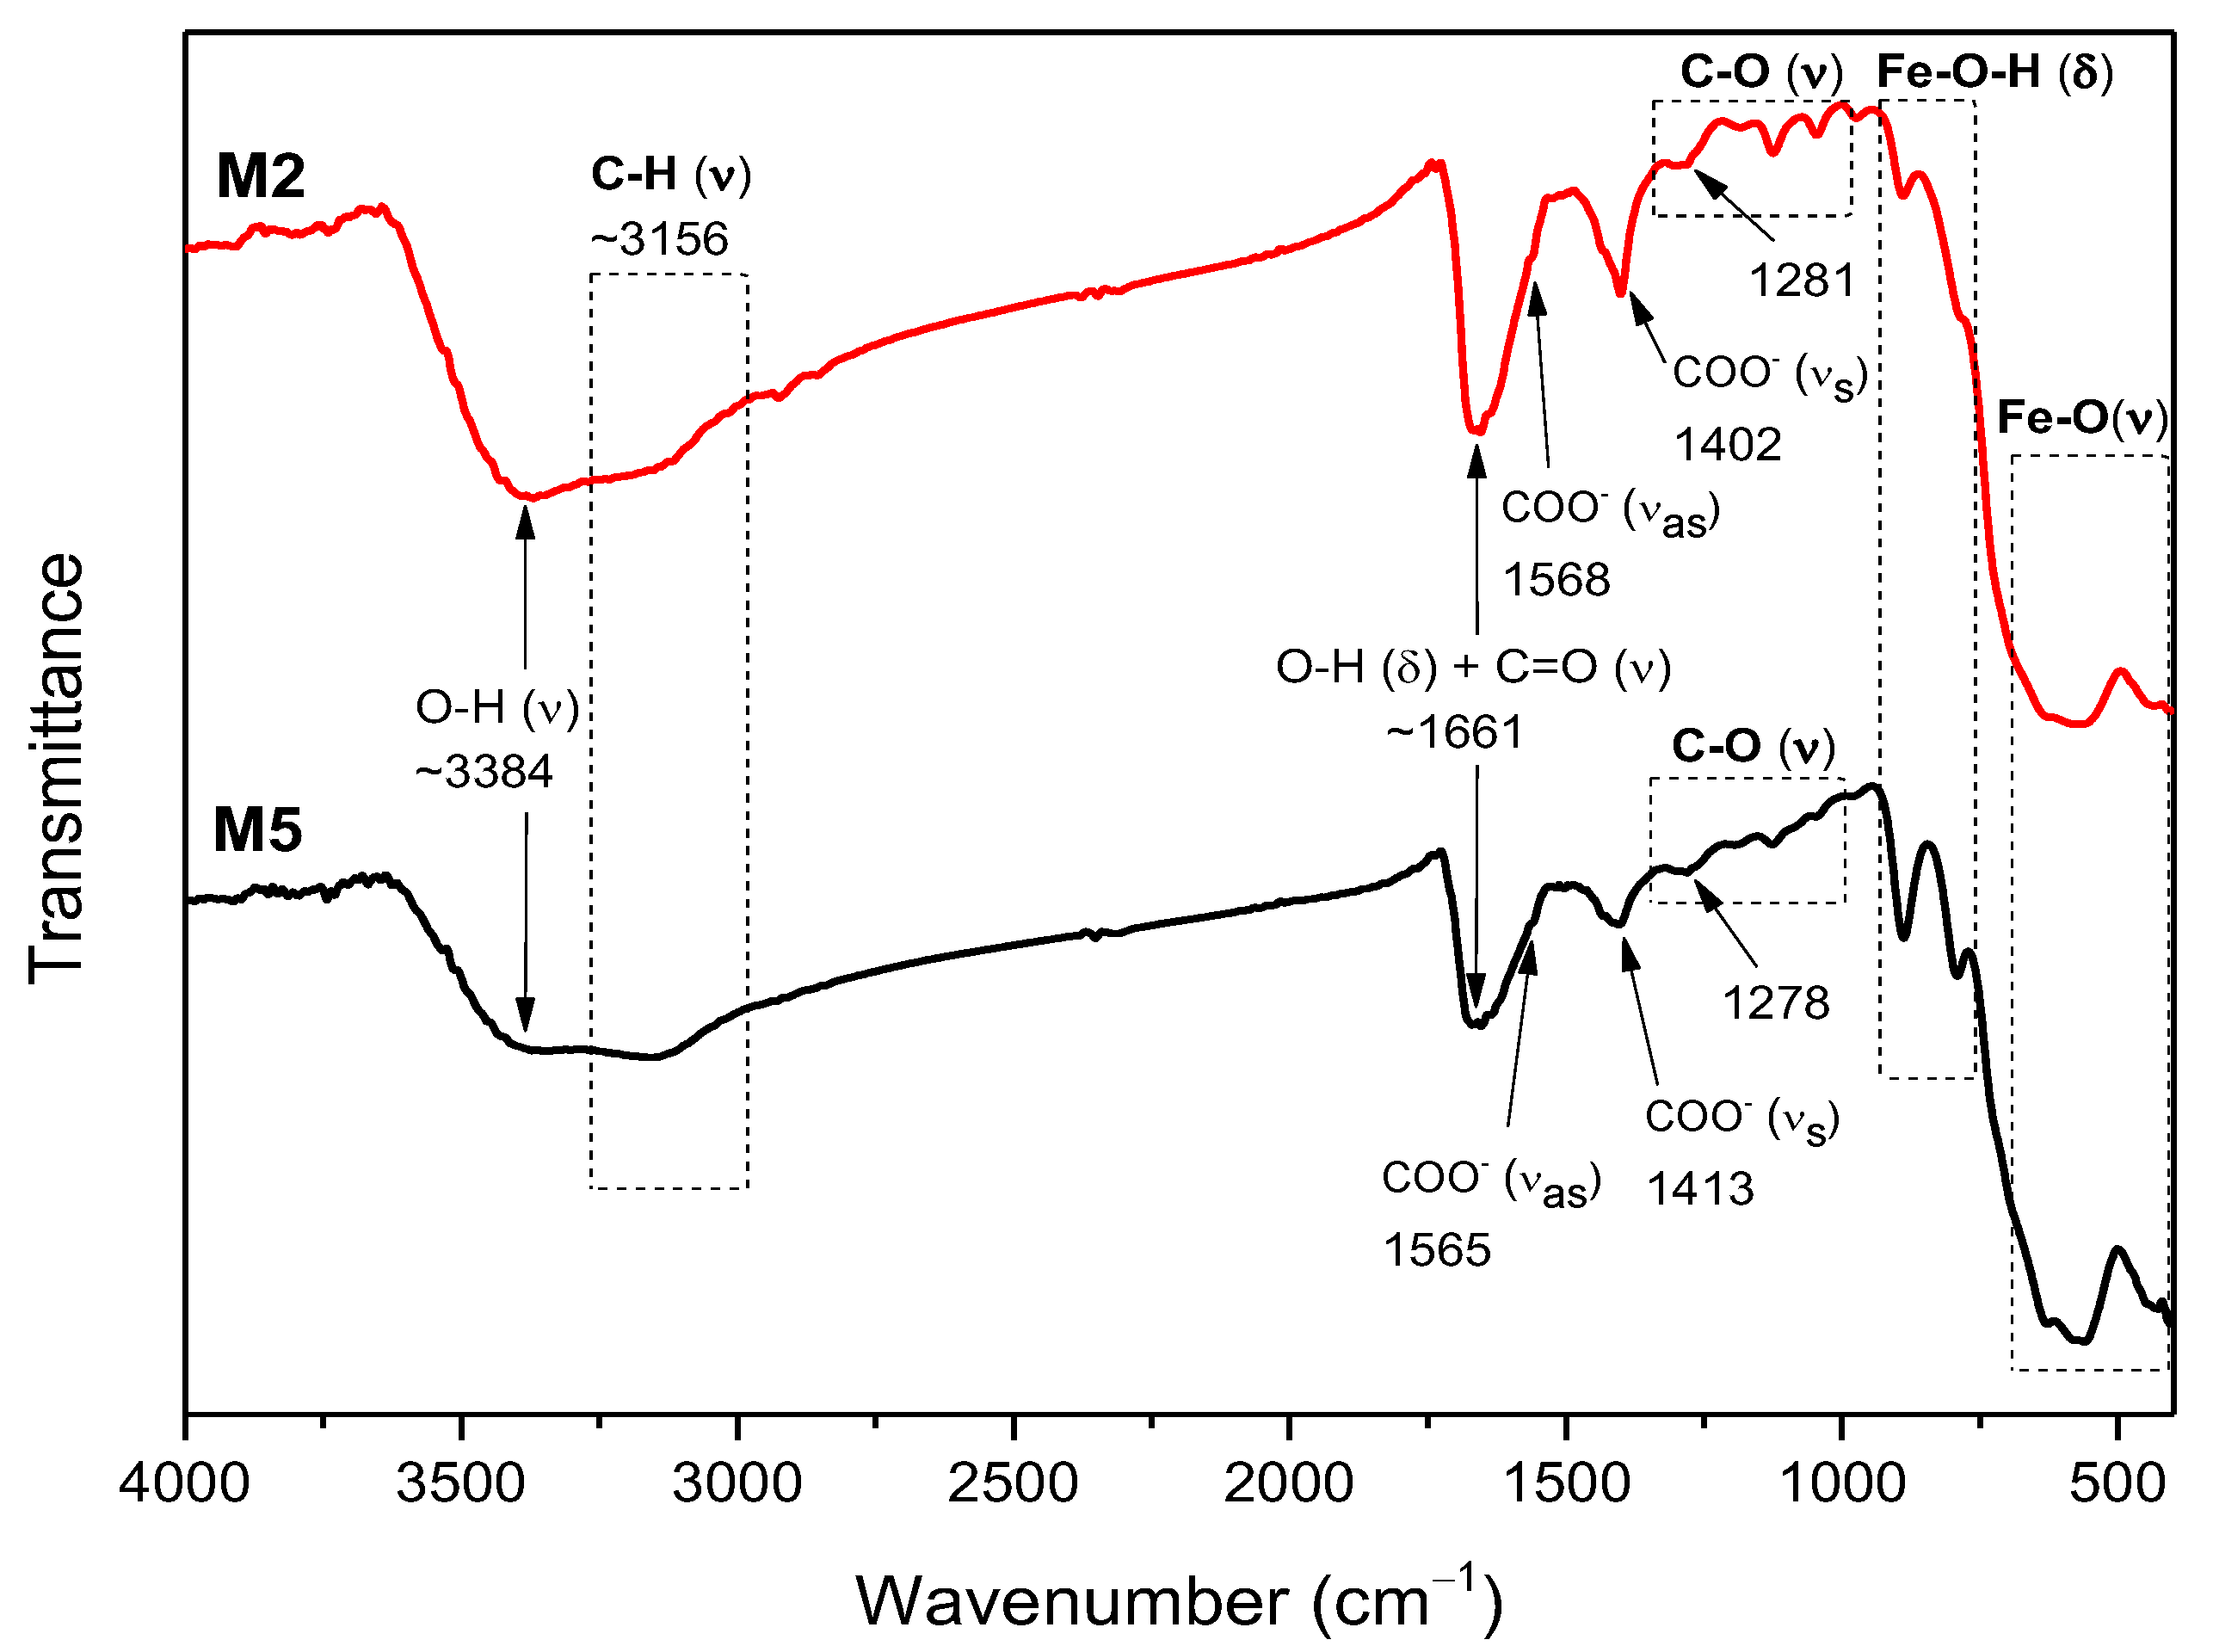
2.3. FTIR Analysis
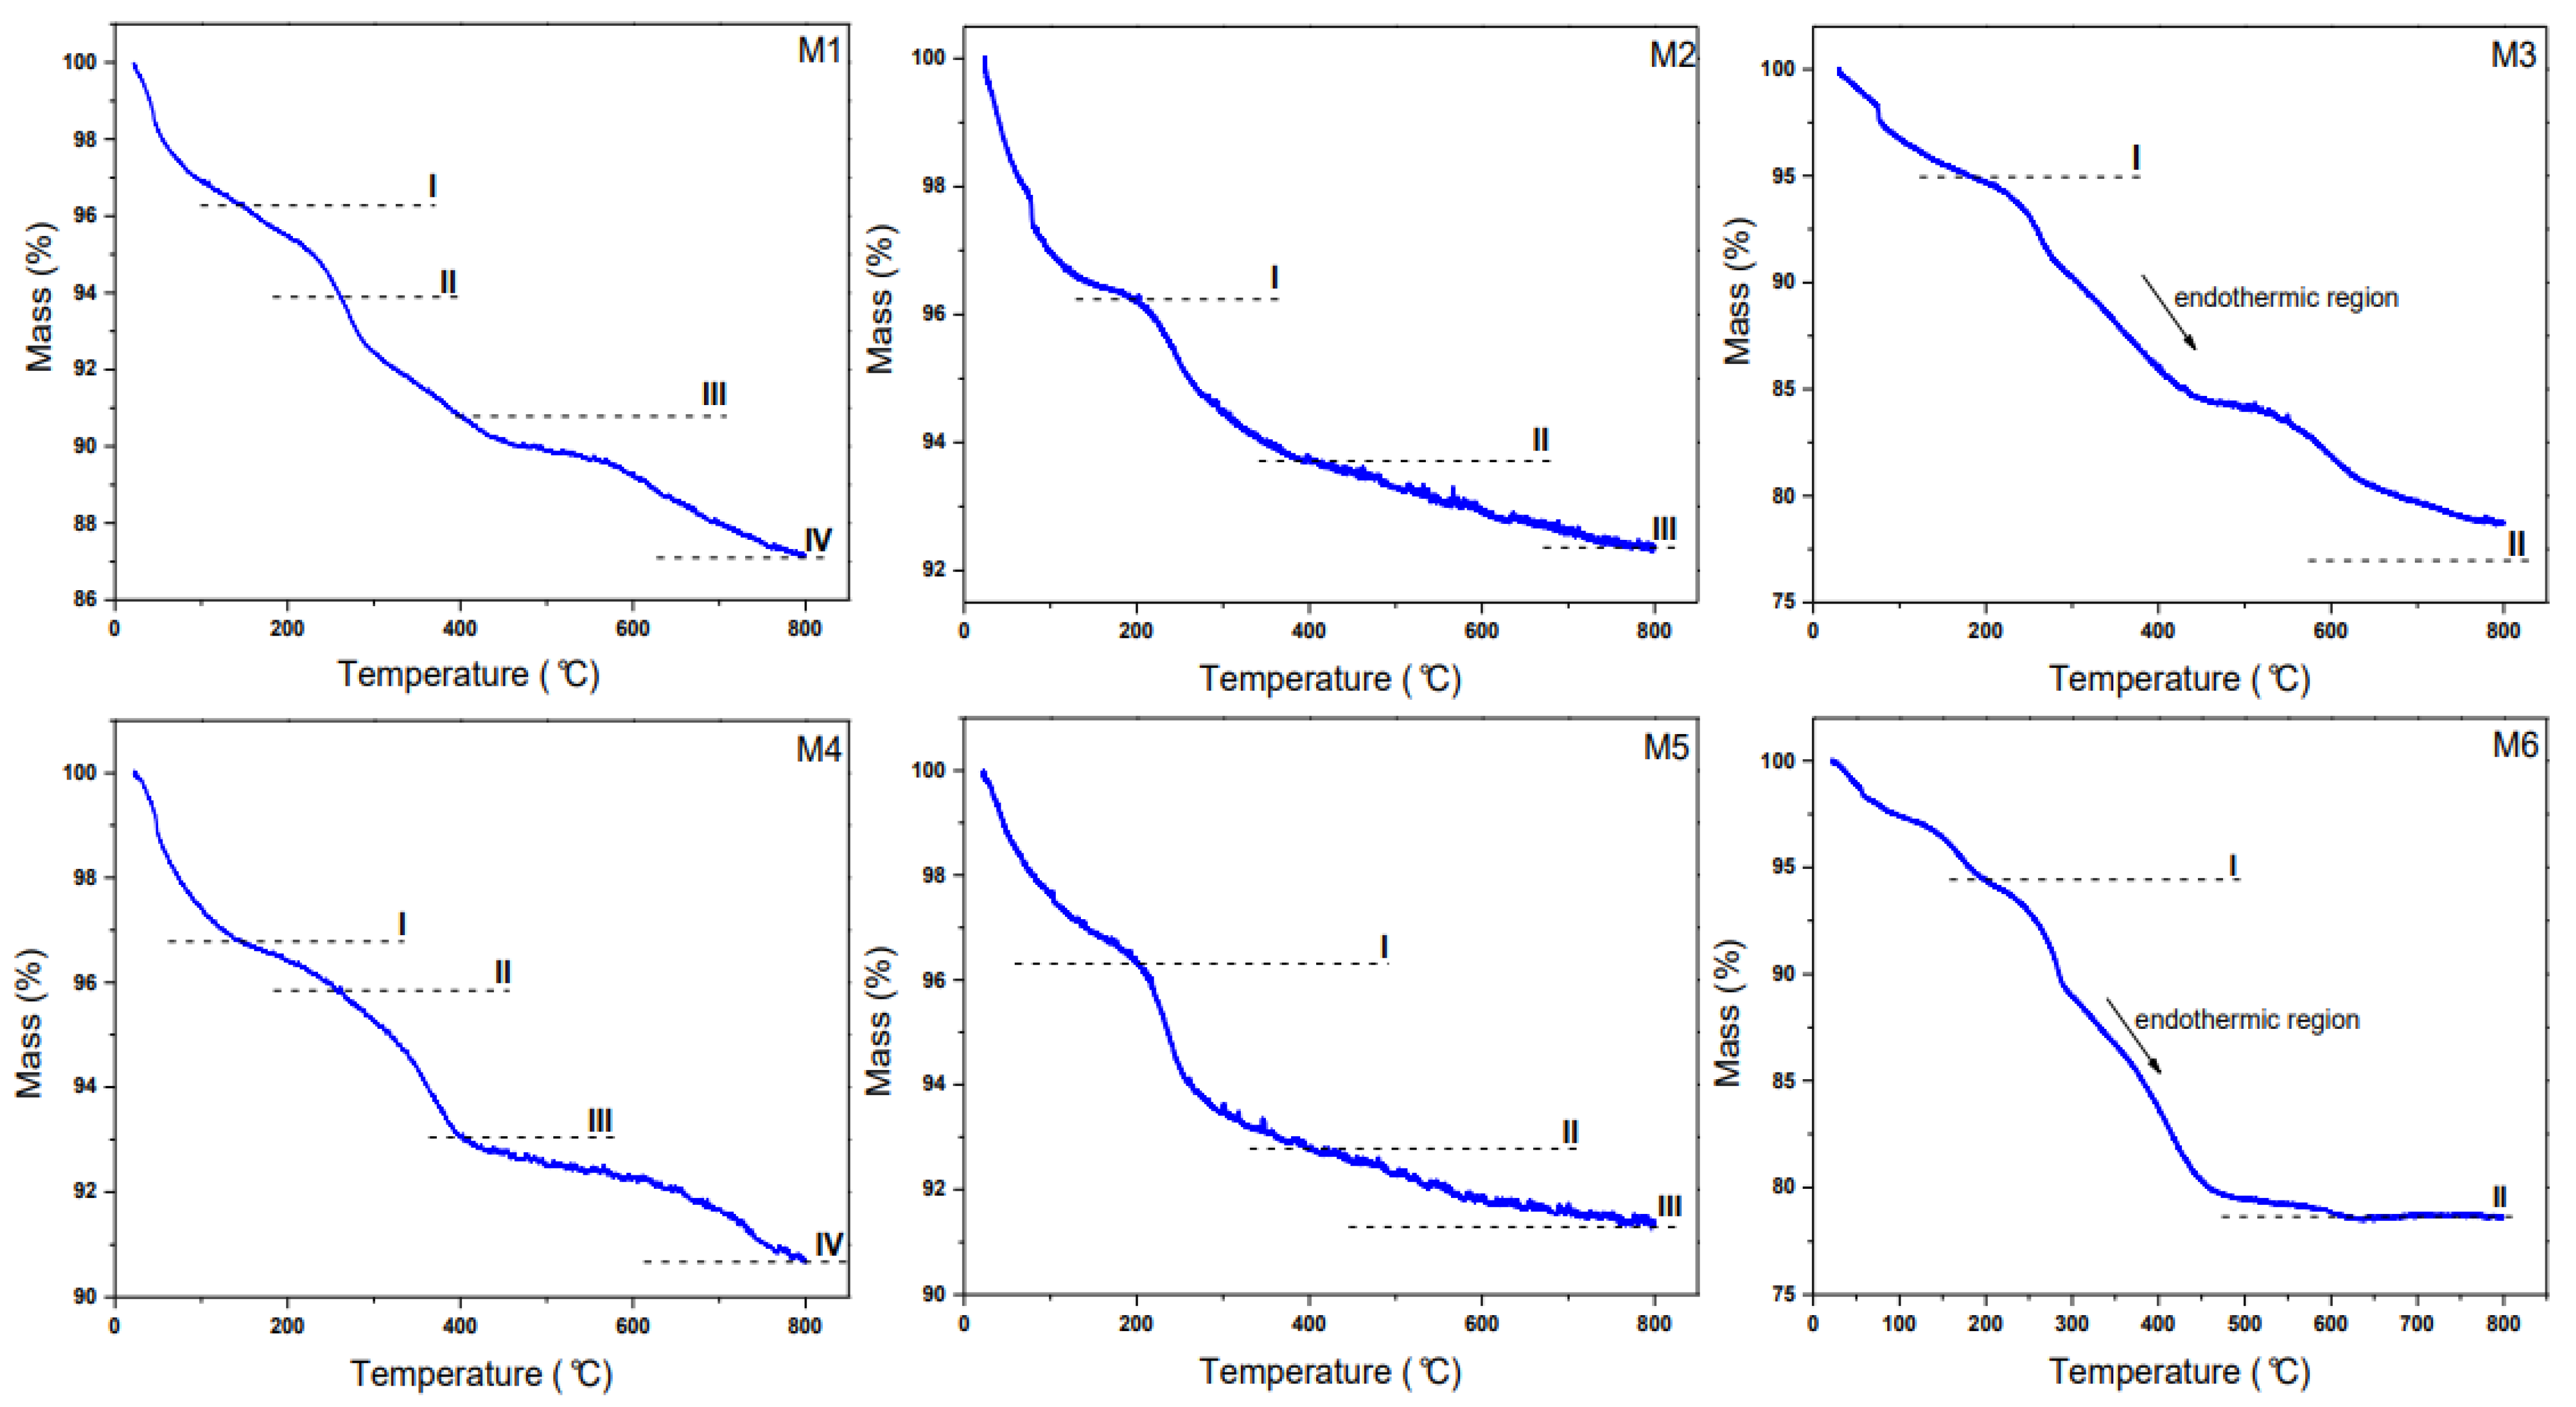
2.4. TG Analysis
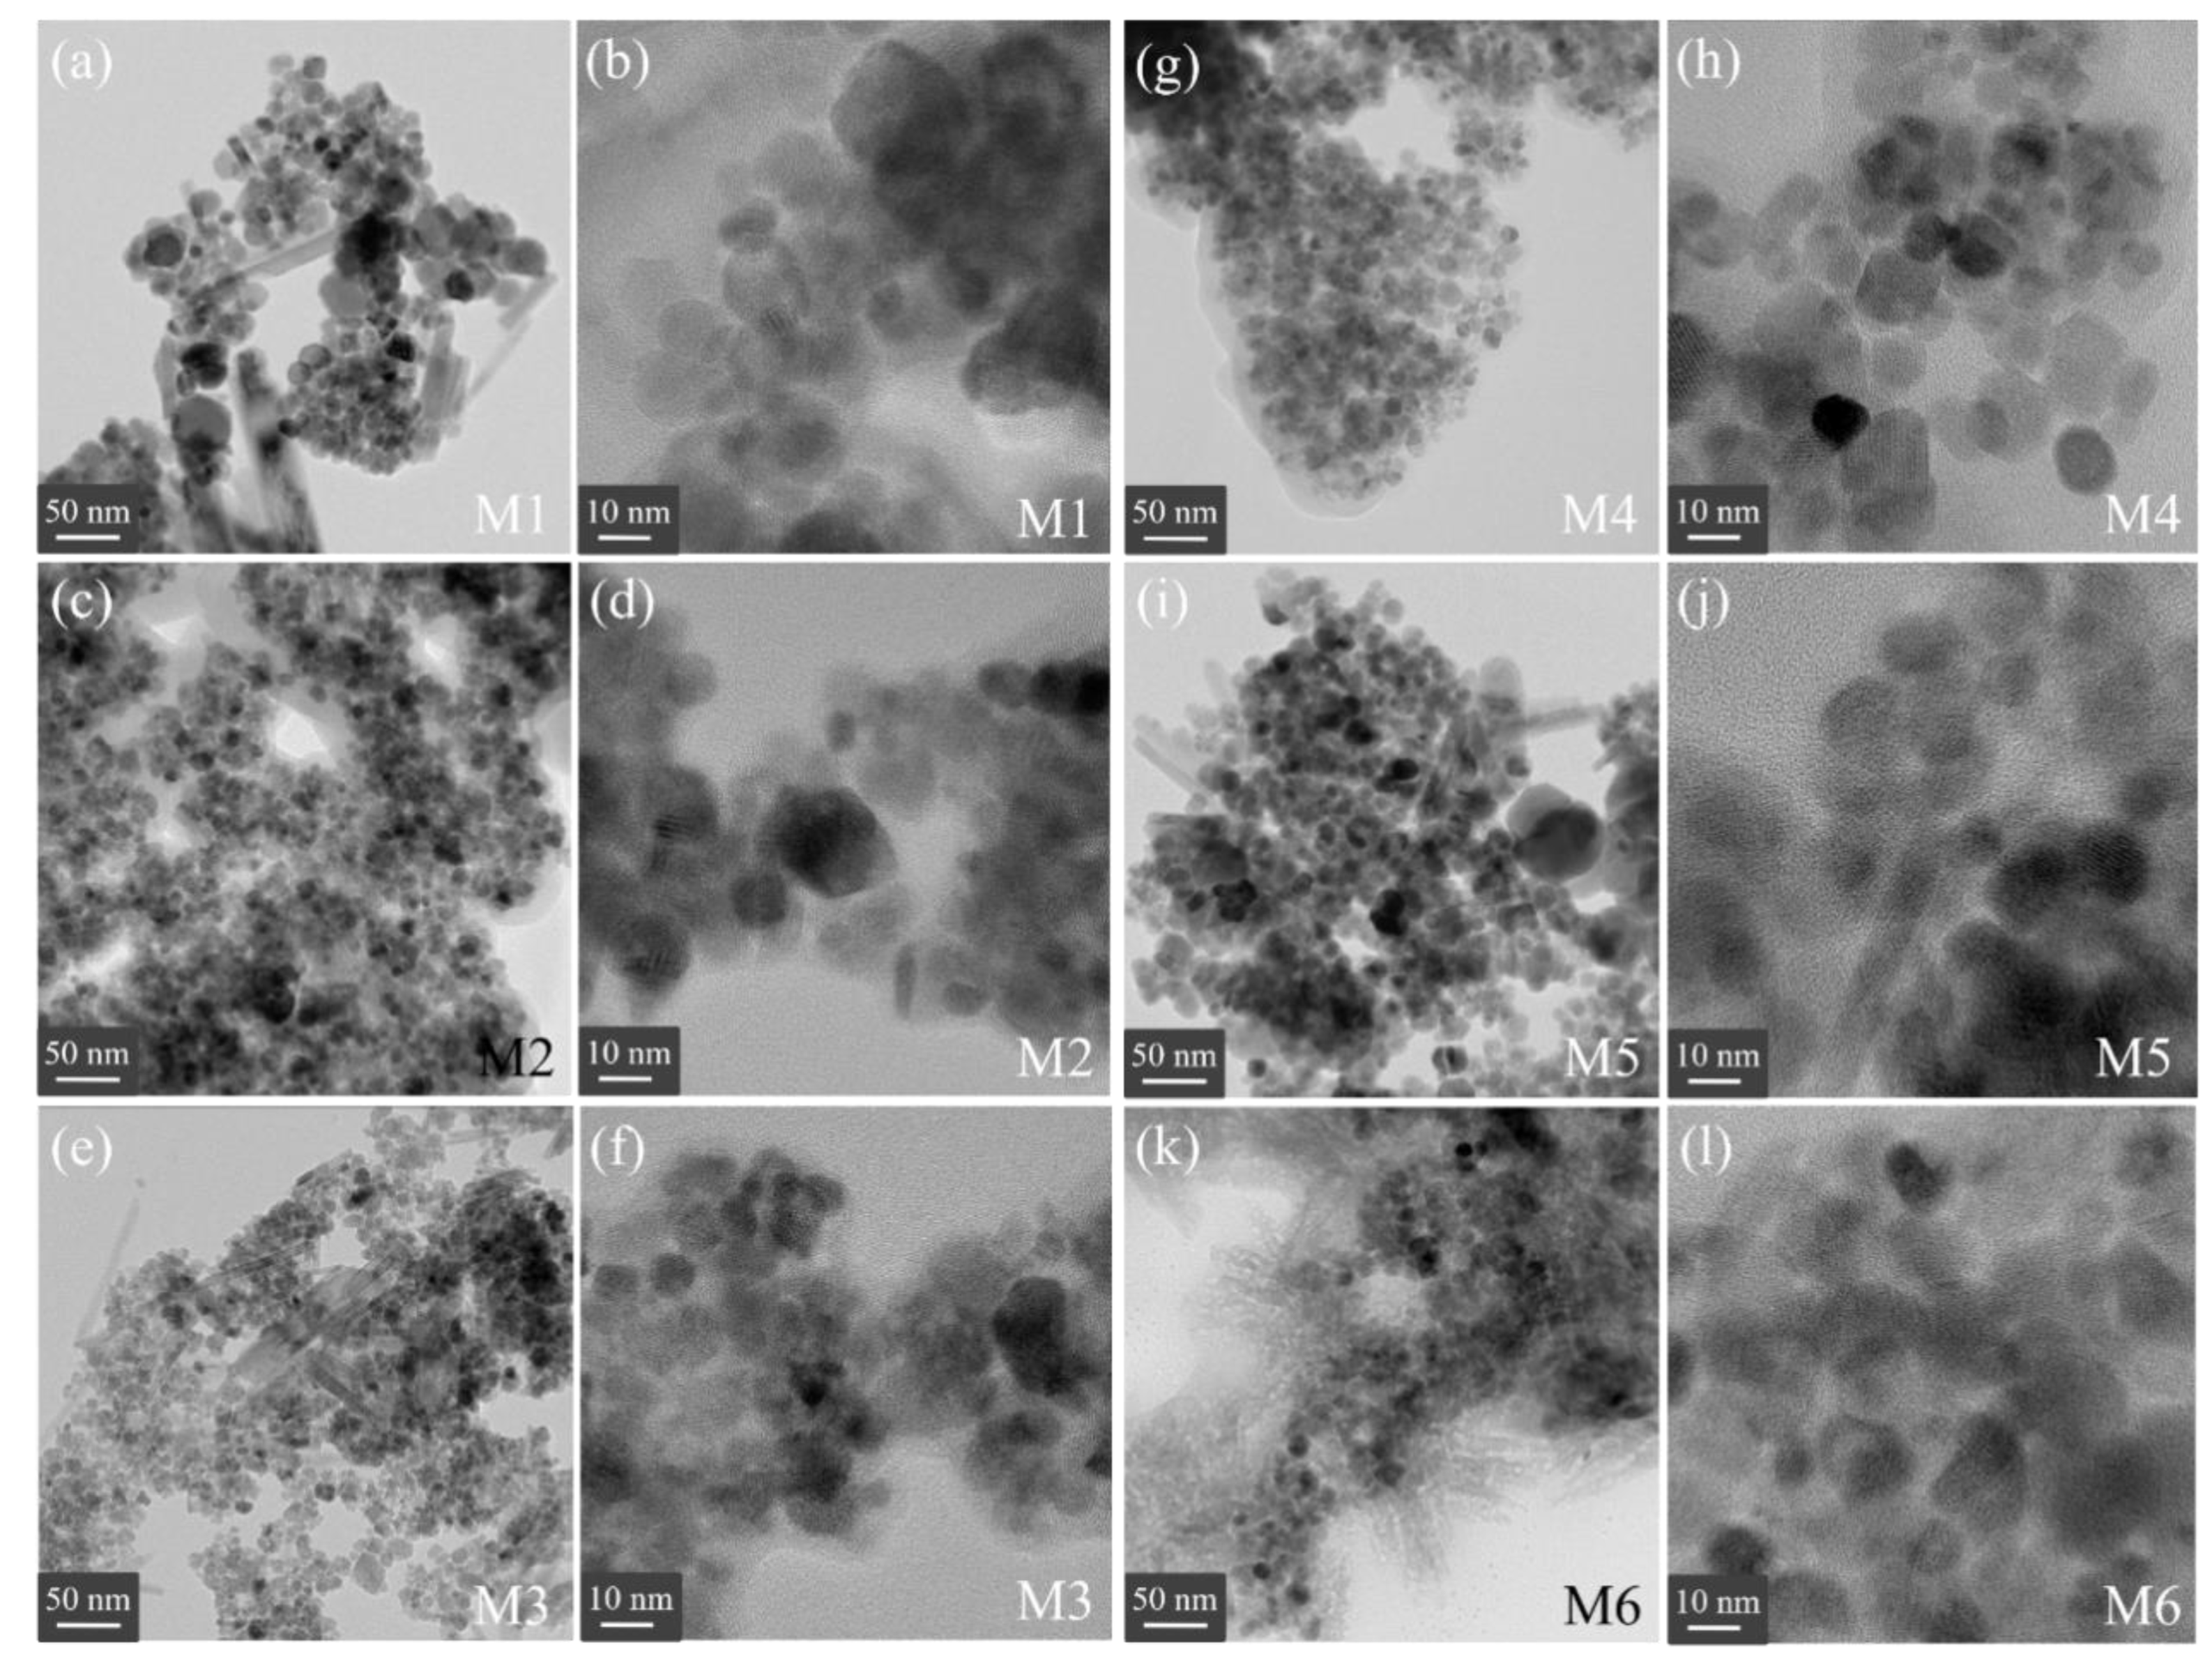
2.5. TEM Analysis
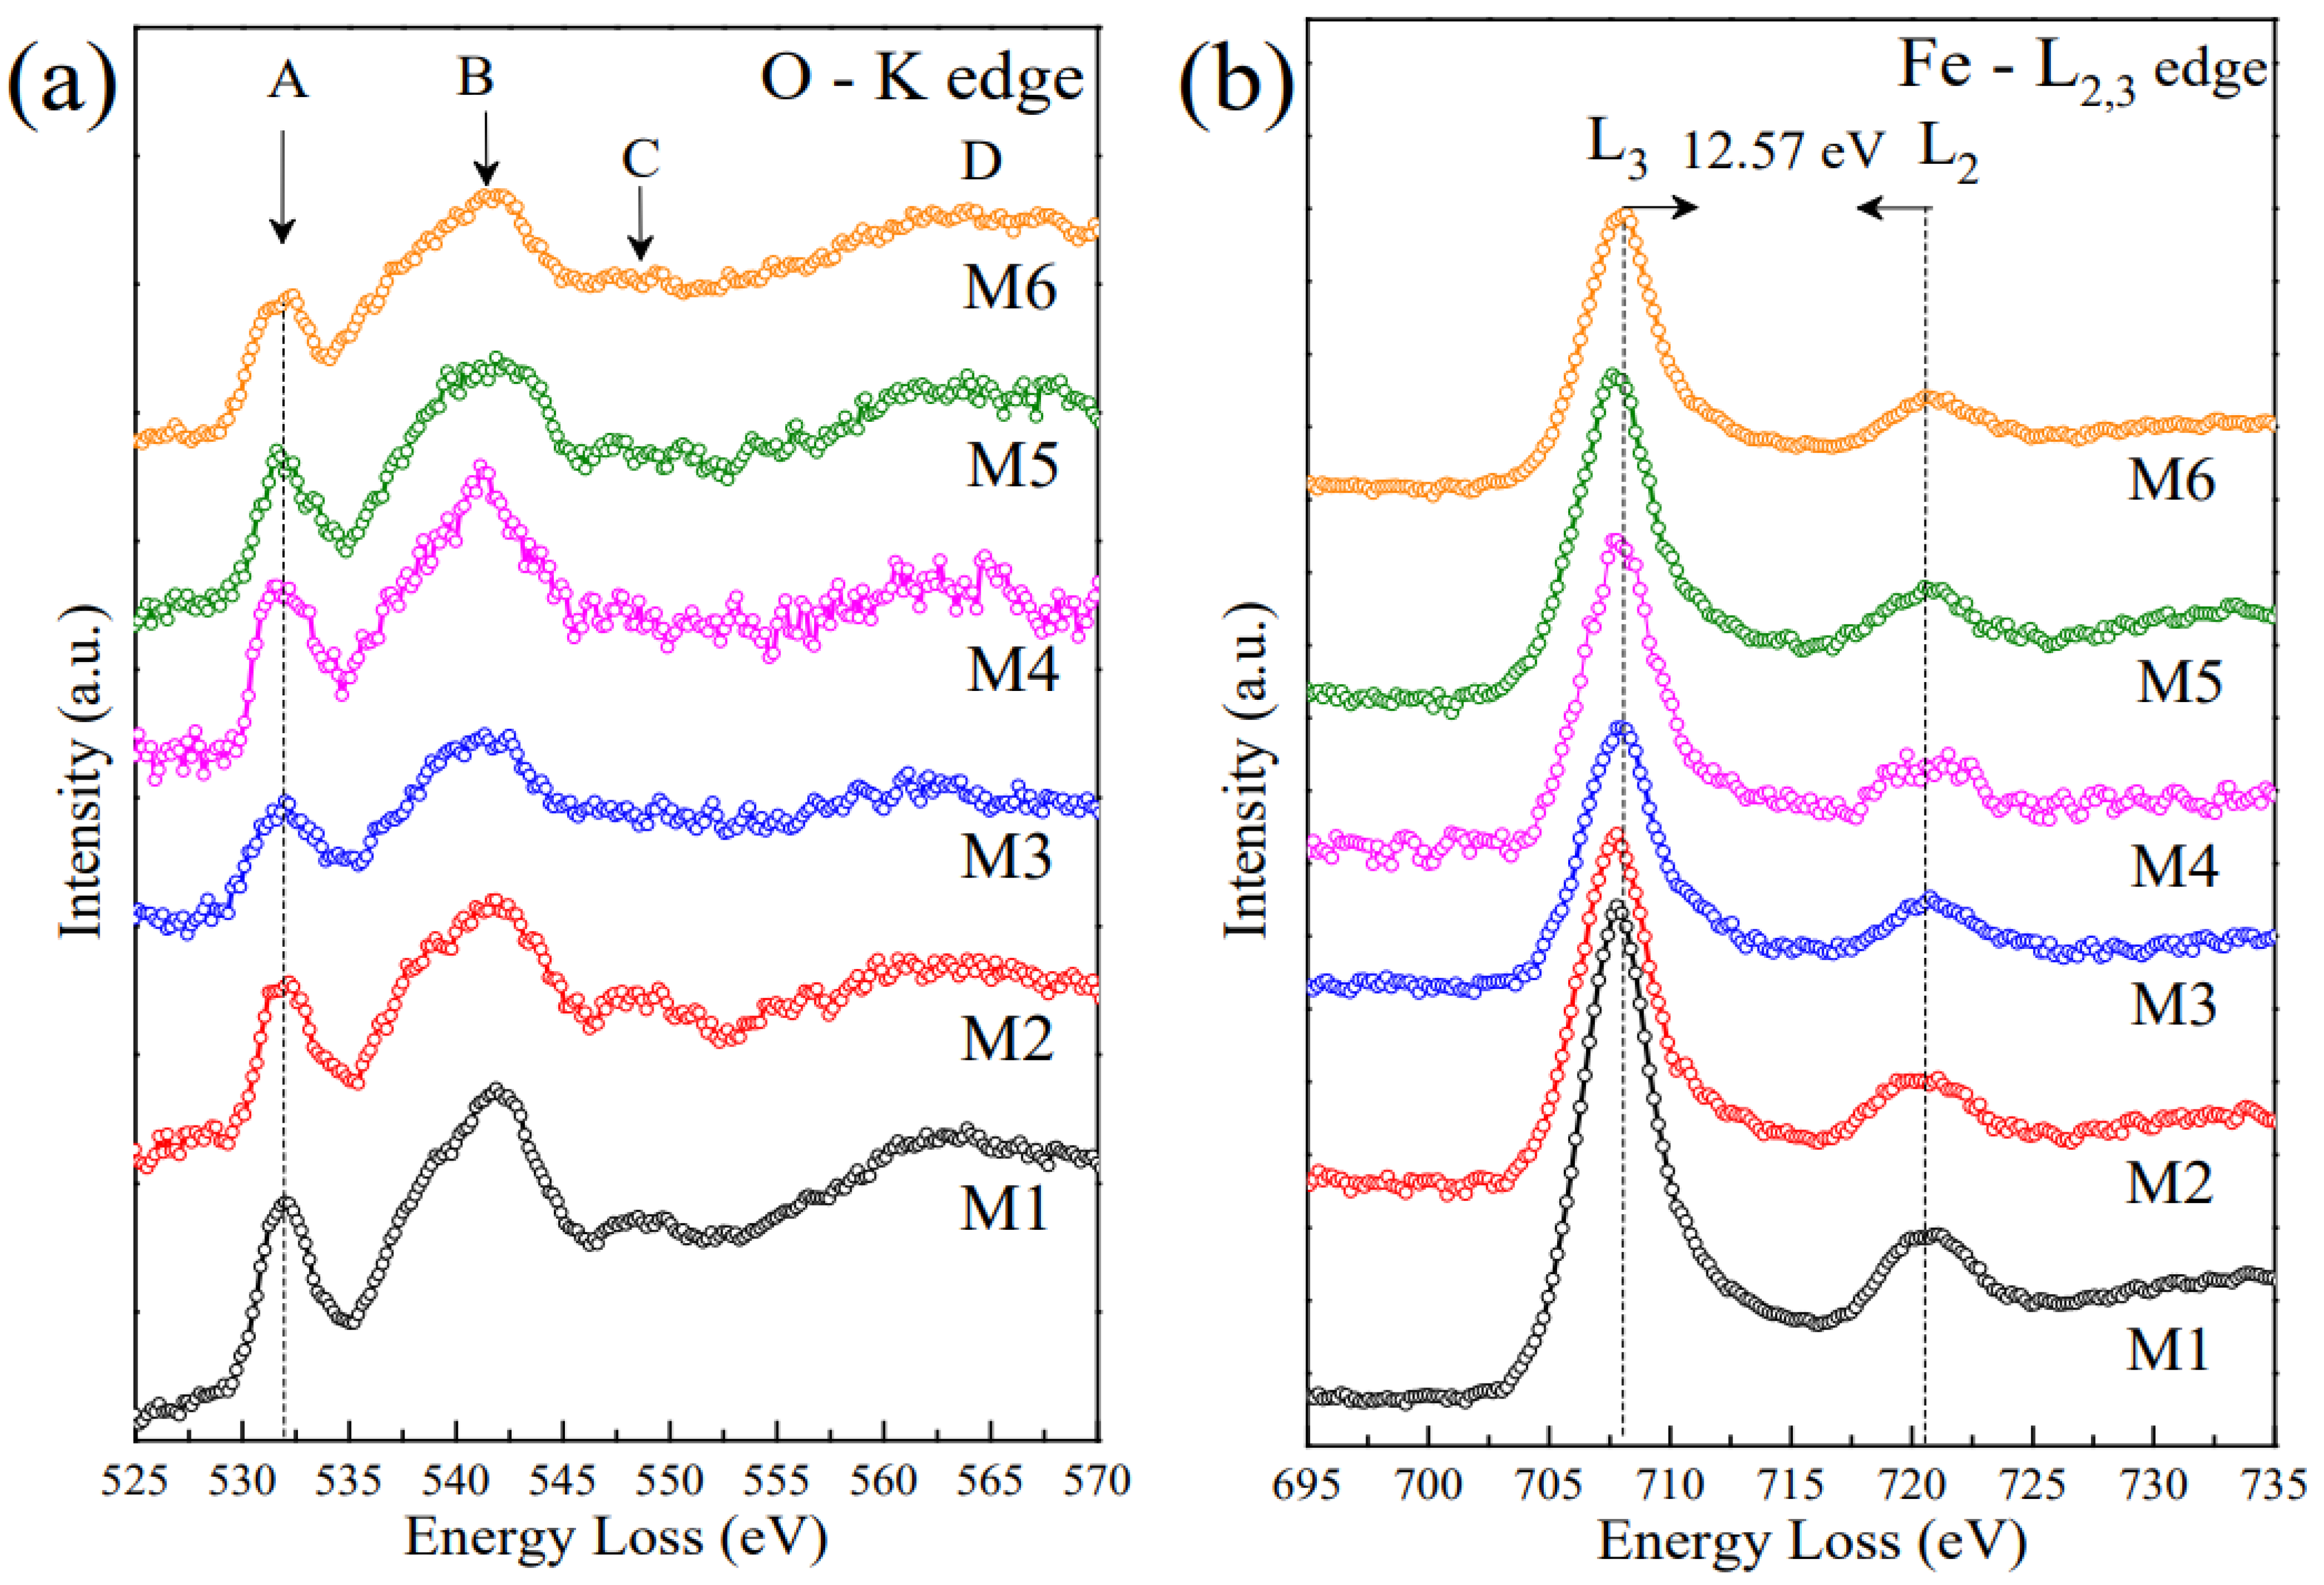
2.6. EELS Analysis
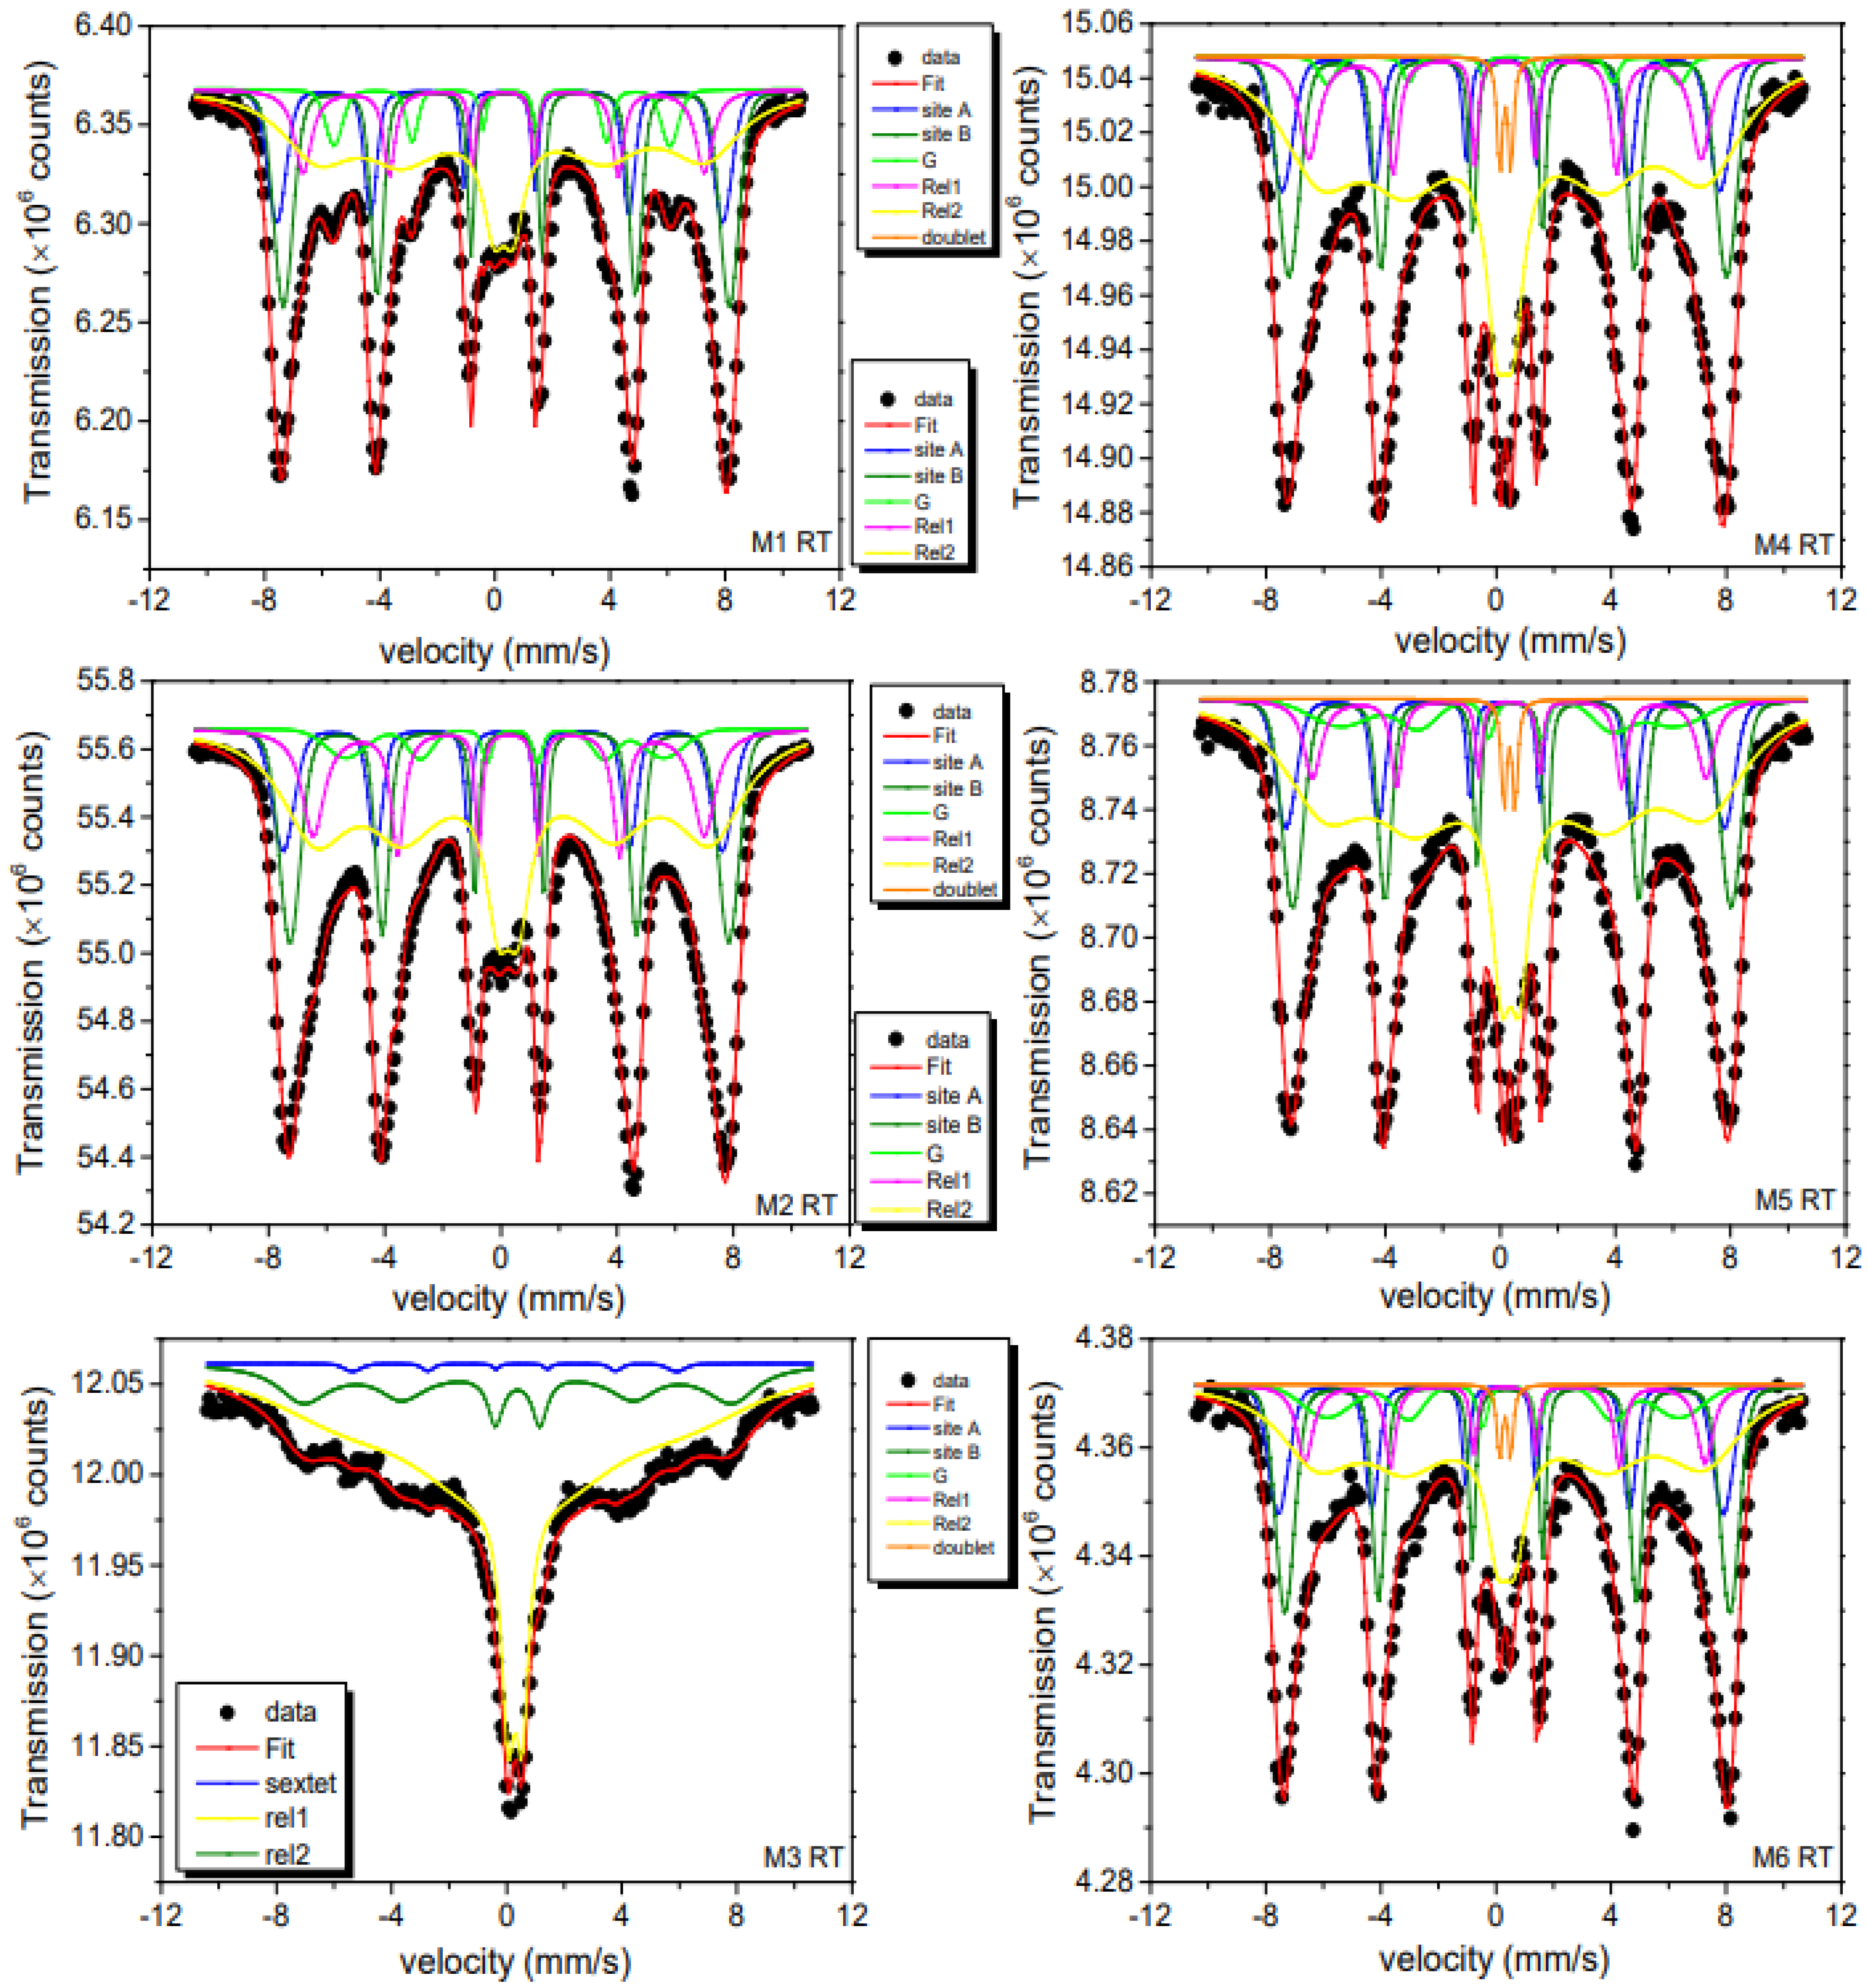
2.7. Mössbauer Spectroscopy Analysis
- (i)
- Two sextet patterns with static hyperfine fields Bhf and Gaussian-shaped inhomogeneous hyperfine fine field distributions σ. These patterns are associated with Fe3+ in the A (tetrahedral) and B (octahedral) sites of γ-Fe2O3 in the magnetically blocked state. The ratio of spectral areas of A and B spectra could be kept fixed to the ideal one of 3/5, as found in the bulk crystalline compound. Magnetic hyperfine fields Bhf, isomer shifts δ, and quadrupole splittings Q are close to those reported in literature [2,25,53,54].
- (ii)
- A third component represents the secondary α-FeOOH phase identified by its hyperfine parameters, again in agreement with literature values. This component can be clearly seen in Figure 8 as a green-marked subspectrum. The relative absorption areas (RAA) of total spectral area ranges from 2–8%, values that agree with the results obtained from XRD measurements. This presence of the α-FeOOH phase was also supported by vibration IR and Raman analysis.
- (iii)
- For reproducing the dynamic spectral parts caused by fluctuating magnetic hyperfine fields, we used, in a simplifying phenomenological approach, two relaxation patterns (Rel 1 and Rel 2) of Blume-Tjon type [55]. The dynamic aspects not being here in the center of the present discussion, we only mention that these spectra are typical for magnetically interacting NPs with fluctuation rates (see differing rate parameters γ1 and γ2 for up and down fluctuations between two levels) of the order of 8–9. Rel 2 (yellow) represents the small particles of the samples with its fraction varying from 42% to 79% of RAA. The highest fraction value is obtained for the 8.8 nm M3 sample, which showed the smallest particle size of the M series according to TEM data.
- (iv)
- Finally, considering Raman results, we tried to include a possible spectral contribution by Fe3O4. Again, the hyperfine spectra of Fe3O4 can be clearly distinguished from those of γ-Fe2O3 at RT. All B-sites are now in a mixed valence state, resulting in an increased isomer shift value when compared to the pure γ-Fe2O3 phase. We, therefore, allowed for an additional subspectrum with the known fixed hyperfine parameters for nanomagnetite [52]. For the M1 and M2 samples, this component gave RAA values of (5 ± 2)%, while for the other samples, it was even lower, i.e., within fit uncertainty. Therefore, in general, due to above features one can assume that the magnetite layer is not homogenously covering the nanomaghemite surface.
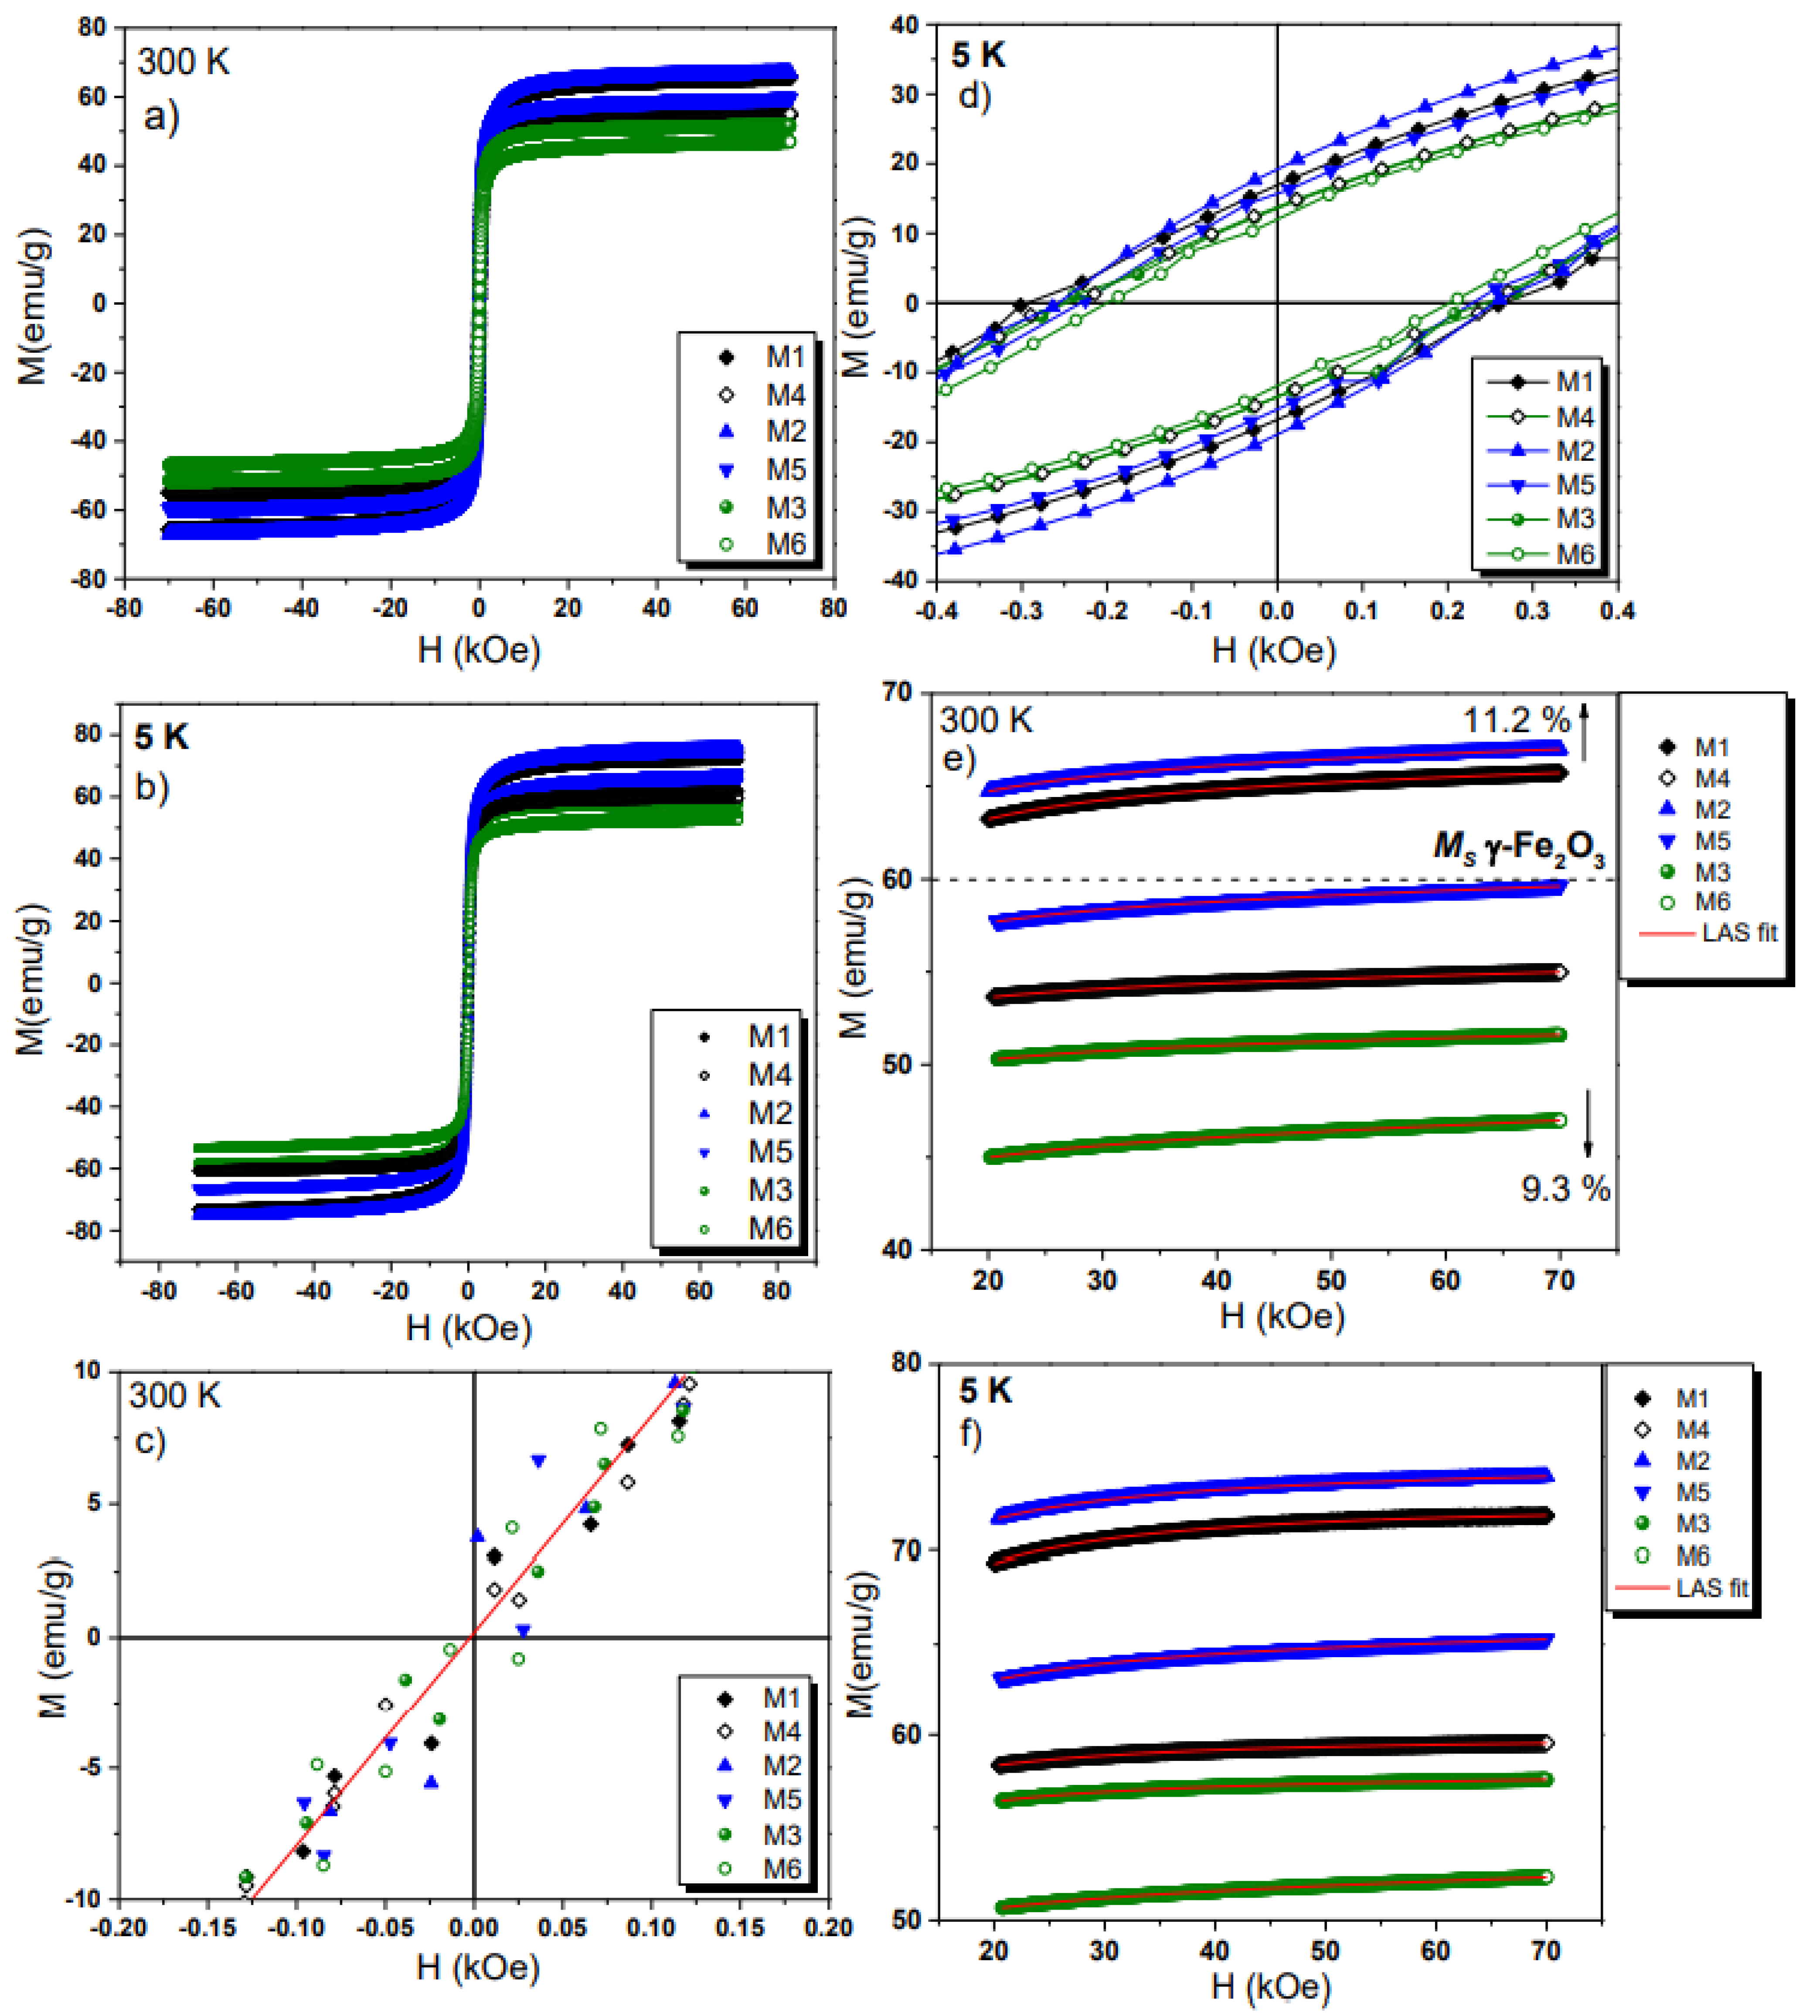
2.8. VSM Analysis
3. Methods and Materials
3.1. Synthesis and Functionalization of Magnetic Nanoparticles (NPs)
3.2. Characterization of Functionalized Nanohybrids
4. Conclusions
Supplementary Materials
Author Contributions
Funding
Data Availability Statement
Acknowledgments
Conflicts of Interest
References
- Kuhn, R.; Bryant, I.M.; Jensch, R.; Böllmann, J. Applications of environmental nanotechnologies in remediation, wastewater treatment, drinking water treatment, and agriculture. Appl. Nano 2022, 3, 54–90. [Google Scholar] [CrossRef]
- Ramos-Guivar, J.A.; Flores-Cano, D.A.; Passamani, E.C. Differentiating nanomaghemite and nanomagnetite and discussing their importance in arsenic and lead removal from contaminated effluents: A critical review. Nanomaterials 2021, 11, 2310. [Google Scholar] [CrossRef]
- Ali, A.; Shah, T.; Ullah, R.; Zhou, P.; Guo, M.; Ovais, M.; Tan, Z.; Rui, Y. Review on recent progress in magnetic nanoparticles: Synthesis, characterization, and diverse applications. Front. Chem. 2021, 9, 629054. [Google Scholar] [CrossRef]
- Leonel, A.G.; Mansur, A.A.P.; Mansur, H.S. Advanced functional nanostructures based on magnetic iron oxide nanomaterials for water remediation: A review. Water Res. 2021, 190, 116693. [Google Scholar] [CrossRef]
- Demangeat, E.; Pédrot, M.; Dia, A.; Bouhnik-Le-Coz, M.; Roperch, P.; Compaoré, G.; Cabello-Hurtado, F. Investigating the remediation potential of iron oxide nanoparticles in Cu-polluted soil-plant systems: Coupled geochemical, geophysical and biological approaches. Nanoscale Adv. 2021, 3, 2017–2029. [Google Scholar] [CrossRef]
- Tawfik, M.M.; Mohamed, M.H.; Sadak, M.S.; Thalooth, A.T. Iron oxide nanoparticles effect on growth, physiological traits and nutritional contents of Moringa oleifera grown in saline environment. Bull. Natl. Res. Cent. 2021, 45, 177. [Google Scholar] [CrossRef]
- Cao, X.; Yue, L.; Wang, C.; Luo, X.; Zhang, C.; Zhao, X.; Wu, F.; White, J.C.; Wang, Z.; Xing, B. Foliar application with iron oxide nanomaterials stimulate nitrogen fixation, yield, and nutritional quality of soybean. ACS Nano 2022, 16, 1170–1181. [Google Scholar] [CrossRef]
- Aragaw, T.A.; Bogale, F.M.; Aragaw, B.A. Iron-based nanoparticles in wastewater treatment: A review on synthesis methods, applications, and removal mechanisms. J. Saudi Chem. Soc. 2021, 25, 101280. [Google Scholar] [CrossRef]
- Fang, X.; Cheng, X.; Zhang, Y.; Zhang, L.G.; Keidar, M. Single-step synthesis of carbon encapsulated magnetic nanoparticles in arc plasma and potential biomedical applications. J. Colloid Interface Sci. 2018, 509, 414–421. [Google Scholar] [CrossRef]
- Tee, G.T.; Gok, X.Y.; Yong, W.F. Adsorption of pollutants in wastewater via biosorbents, nanoparticles and magnetic biosorbents: A review. Environ. Res. 2022, 212, 113248. [Google Scholar] [CrossRef]
- Ramos-Guivar, J.A.; Taipe, K.; Schettino, M.A., Jr.; Silva, E.; Torres, M.A.M.; Passamani, E.C.; Litterst, F.J. Improved removal capacity and equilibrium time of maghemite nanoparticles growth in zeolite type 5A for Pb(II) adsorption. Nanomaterials 2020, 10, 1668. [Google Scholar] [CrossRef]
- Kuncser, A.C.; Vlaicu, I.D.; Pavel, O.D.; Zavoianu, R.; Badea, M.; Radu, D.; Culita, D.C.; Rostas, A.M.; Olar, R. Soft synthesis and characterization of goethite-based nanocomposites as promising cyclooctene oxidation catalysts. RSC Adv. 2021, 11, 27589–27602. [Google Scholar] [CrossRef]
- Gilbert, F.; Refait, P.; Lévêque, F.; Remazeilles, C.; Conforto, E. Synthesis of goethite from Fe(OH)2 precipitates: Influence of Fe(II) concentration and stirring speed. J. Phys. Chem. Solids 2008, 69, 2124–2130. [Google Scholar] [CrossRef] [Green Version]
- Ramos-Guivar, J.A.; Gonzalez-Gonzalez, J.C.; Litterst, F.J.; Passamani, E.C. Rietveld Refinement, μ-Raman, X-ray Photoelectron, and Mössbauer studies of metal oxide-nanoparticles growth on multiwall carbon nanotubes and graphene oxide. Cryst. Growth Des. 2021, 21, 2128–2141. [Google Scholar] [CrossRef]
- Testa-Anta, M.; Ramos-Docampo, M.A.; Comesaña-Hermo, M.; Rivas-Murias, B.; Salgueiriño, V. Raman spectroscopy to unravel the magnetic properties of iron oxide nanocrystals for bio-related applications. Nanoscale Adv. 2019, 1, 2086. [Google Scholar] [CrossRef] [Green Version]
- Slavov, L.; Abrashev, M.V.; Merodiiska, T.; Gelev, C.; Vandenberghe, R.R.; Markova-Deneva, I.; Nedkov, I. Raman spectroscopy investigation of magnetite nanoparticles in ferrofluids. J. Magn. Magn. Mater. 2010, 322, 1904–1911. [Google Scholar] [CrossRef] [Green Version]
- Jubb, A.M.; Allen, H.C. Vibrational spectroscopic characterization of hematite, maghemite, and magnetite thin films produced by vapor deposition. ASC Appl. Mater. Interfaces 2010, 2, 2804–2812. [Google Scholar] [CrossRef]
- De Faria, D.L.A.; Lopes, F.N. Heated goethite and natural hematite: Can Raman spectroscopy be used to differentiate them? Vib. Spectrosc. 2007, 45, 117–121. [Google Scholar] [CrossRef]
- Abrashev, M.V.; Ivanov, V.G.; Stefanov, B.S.; Todorov, N.D.; Rosell, J.; Skumryev, V. Raman spectroscopy of alpha-FeOOH (goethite) near antiferromagnetic to paramagnetic phase transition. J. Appl. Phys. 2020, 127, 205108. [Google Scholar] [CrossRef]
- Hanesch, M. Raman spectroscopy of iron oxides and (oxy)hydroxides at low laser power and possible applications in environmental magnetic studies. Geophys. J. Int. 2009, 177, 941–948. [Google Scholar] [CrossRef]
- Chang, S.H.; Chiang, C.-H.; Kao, F.-S.; Tien, C.-L.; Wu, C.-G. Unraveling the enhanced electrical conductivity of PEDOT:PSS thin films for ITO-Free organic photovoltaics. IEEE Photon. J. 2014, 6, 4. [Google Scholar] [CrossRef]
- Riri, M.; Benajjar, A.; Eljaddi, T.; Sefiani, N.; Touaj, K.; Cherif, A.; Hlaïbi, M. Characterization of two dinuclear complexes of the gadolinium ion by IR and Raman. J. Mater. Environ. Sci. 2013, 4, 961–966. Available online: http://www.jmaterenvironsci.com/Document/vol4/vol4_N6/129-JMES-462-2013-Riri.pdf (accessed on 24 July 2022).
- Dendramis, A.L.; Schwinn, E.W.; Sperline, R.P. A surface-enhanced Raman scattering study of CTAB adsorption on copper. Surf. Sci. 1983, 134, 675–688. [Google Scholar] [CrossRef]
- Liu, H.; Chen, T.; Chang, J.; Zou, X.; Frost, R.L. The effect of hydroxyl groups and surface area of hematite derived from annealing goethite for phosphate removal. J. Colloid Interface Sci. 2013, 398, 88–94. [Google Scholar] [CrossRef]
- Guivar, J.A.R.; Sadrollahi, E.; Menzel, D.; Fernandes, E.G.R.; López, E.O.; Torres, M.M.; Arsuaga, J.M.; Arencibia, A.; Litterst, F.J. Magnetic, structural and surface properties of functionalized maghemite nanoparticles for copper and lead adsorption. RSC Adv. 2017, 7, 28763. [Google Scholar] [CrossRef] [Green Version]
- Patekari, M.D.; Pawar, K.K.; Salunkhe, G.B.; Kodam, P.M.; Padvi, M.N.; Waifalkar, P.P.; Sharma, K.K.; Patil, P.S. Synthesis of Maghemite nanoparticles for highly sensitive and selective NO2 sensing. Mater. Sci. Eng. B 2021, 272, 115339. [Google Scholar] [CrossRef]
- Parida, K.; Das, J. Studies on ferric oxide hydroxides: II. Structural properties of goethite samples (α-FeOOH) prepared by homogeneous precipitation from Fe(NO3)3 solution in the presence of sulfate ions. J. Colloid Interface Sci. 1996, 178, 586–593. [Google Scholar] [CrossRef]
- Cui, H.; Ren, W.; Lin, P.; Liu, Y. Structure control synthesis of iron oxide polymorph nanoparticles through an epoxide precipitation route. J. Exp. Nanosci. 2013, 8, 869–875. [Google Scholar] [CrossRef]
- Veneranda, M.; Aramendia, J.; Bellot-Gurlet, L.; Colomban, P.; Castro, K.; Madariaga, J.M. FTIR spectroscopic semi-quantification of iron phases: A new method to evaluate the protection ability index (PAI) of archaeological artefacts corrosion systems. Corros. Sci. 2018, 133, 68–77. [Google Scholar] [CrossRef] [Green Version]
- Khan, A.S.; Nasir, M.F.; Khan, M.T.; Murtaza, A.; Hamayun, M.A. Study of structural, magnetic and radio frequency heating aptitudes of pure and (Fe-III) doped manganite (La1−x SrxMnO3) and their incorporation with Sodium Poly-Styrene Sulfonate (PSS) for magnetic hyperthermia applications. Phys. B Condens. Matter. 2021, 600, 412627. [Google Scholar] [CrossRef]
- Kausar, A. Fabrication and characteristics of poly(benzimidazole/fluoro/ether/siloxane/amide)/sulfonated polystyrene/silica nanoparticle-based proton exchange membranes doped with phosphoric acid. Int. J. Polym. Mater. 2015, 64, 184–191. [Google Scholar] [CrossRef]
- Al-Sabagh, A.M.; Moustafa, Y.M.; Hamdy, A.; Killa, H.M.; Ghanem, R.T.M.; Morsi, R.E. Preparation and characterization of sulfonated polystyrene/magnetite nanocomposites for organic dye adsorption. Egypt. J. Pet. 2018, 27, 403–413. [Google Scholar] [CrossRef]
- Urian, Y.A.; Atoche-Medrano, J.J.; Quispe, L.T.; Félix, L.L.; Coaquira, J.A.H. Study of the surface properties and particle-particle interactions in oleic acid-coated Fe3O4 nanoparticles. J. Magn. Magn. Mater. 2021, 525, 167686. [Google Scholar] [CrossRef]
- Muthukumaran, T.; Philip, J. Effect of phosphate and oleic acid capping on structure, magnetic properties and thermal stability of iron oxide nanoparticles. J. Alloys Compd. 2016, 689, 959–968. [Google Scholar] [CrossRef]
- Nalle, F.C.; Wahid, R.; Wulandari, I.O.; Sabarudin, A. Synthesis and characterization of magnetic Fe3O4 nanoparticles using oleic acid as stabilizing agent. Rasayan J. Chem. 2019, 12, 14–21. [Google Scholar] [CrossRef]
- Burnham, P.; Dollahon, N.; Li, C.H.; Viescas, A.J.; Papaefthymiou, G.C. Magnetization and Specific Absorption Rate Studies of Ball-Milled Iron Oxide Nanoparticles for Biomedicine. J. Nanopart. 2013, 2013, 181820. [Google Scholar] [CrossRef]
- Coury, C.; Dillner, A.M. A method to quantify organic functional groups and inorganic compounds in ambient aerosols using attenuated total reflectance FTIR spectroscopy and multivariate chemometric techniques. Atmos. Environ. 2008, 42, 5923–5932. [Google Scholar] [CrossRef]
- Guivar, J.A.R.; Sanches, E.A.; Magon, C.J.; Fernandes, E.G.R. Preparation and characterization of cetyltrimethylammonium bromide (CTAB)-stabilized Fe3O4 nanoparticles for electrochemistry detection of citric acid. J. Electroanal. Chem. 2015, 755, 158–166. [Google Scholar] [CrossRef]
- Anas, N.A.A.; Fen, Y.W.; Yusof, N.A.; Omar, N.A.S.; Ramdzan, N.S.M.; Daniyal, W.M.E.M.M. Investigating the properties of cetyltrimethylammonium bromide/hydroxylated graphene quantum dots thin film for potential optical detection of heavy metal ions. Materials 2020, 13, 2591. [Google Scholar] [CrossRef]
- Su, G.; Yang, C.; Zhu, J.-J. Fabrication of gold nanorods with tunable longitudinal surface plasmon resonance peaks by reductive dopamine. Langmuir 2015, 31, 817–823. [Google Scholar] [CrossRef]
- Elfeky, S.A.; Mahmoud, S.E.; Youssef, A.F. Applications of CTAB modified magnetic nanoparticles for removal of chromium (VI) from contaminated water. J. Adv. Res. 2017, 8, 435–443. [Google Scholar] [CrossRef] [PubMed]
- Muthuselvi, C.; Arunkumar, A.; Rajaperumal, G. Growth and characterization of oxalic acid doped with tryptophan crystal for antimicrobial activity. Der Chem. Sin. 2016, 7, 55–62. Available online: https://www.imedpub.com/articles/growth-and-characterization-of-oxalic-acid-doped-with-tryptophan-crystalfor-antimicrobial-activity.php?aid=18130 (accessed on 24 July 2022).
- Goebbert, D.J.; Garand, E.; Wende, T.; Bergmann, R.; Meijer, G.; Asmis, K.R.; Neumark, D.M. Infrared spectroscopy of the microhydrated nitrate ions NO(3)(-)(H2O)(1-6). J. Phys. Chem. 2009, 113, 7584–7592. [Google Scholar] [CrossRef] [Green Version]
- Nurdin, I.; Johan, M.R.; Yaacob, I.I.; Ang, B.C. Effect of nitric acid concentrations on synthesis and stability of maghemite nanoparticles suspension. Sci. World J. 2014, 2014, 589479. [Google Scholar] [CrossRef]
- Gialanella, S.; Girardi, F.; Ischia, G.; Lonardelli, I.; Mattarelli, M.; Montagna, M. On the goethite to hematite phase transformation. J. Therm. Anal. Calorim. 2010, 102, 867–873. [Google Scholar] [CrossRef]
- Chen, B.-W.; He, Y.-C.; Sung, S.-Y.; Le, T.T.H.; Hsieh, C.-L.; Chen, J.-Y.; Wei, Z.-H.; Yao, D.-J. Synthesis and characterization of magnetic nanoparticles coated with polystyrene sulfonic acid for biomedical applications. Sci. Technol. Adv. Mater. 2020, 21, 471–581. [Google Scholar] [CrossRef]
- Rudolph, M.; Erler, J.; Peuker, U.A. A TGA–FTIR perspective of fatty acid adsorbed on magnetite nanoparticles–Decomposition steps and magnetite reduction. Colloids Surf. A Physicochem. Eng. Asp. 2012, 397, 16–23. [Google Scholar] [CrossRef]
- Ramimoghadam, D.; Hussein, M.Z.B.; Taufiq-Yap, Y.H. The effect of sodium dodecyl sulfate (SDS) and cetyltrimethylammonium bromide (CTAB) on the properties of ZnO synthesized by hydrothermal method. Int. J. Mol. Sci. 2012, 13, 13275–13293. [Google Scholar] [CrossRef] [Green Version]
- Ristić, M.; Opačak, I.; Musić, S. The synthesis and microstructure of goethite particles precipitated in highly alkaline media. J. Alloys Compd. 2013, 559, 49–56. [Google Scholar] [CrossRef]
- Chen, S.-Y.; Gloter, A.; Zobelli, A.; Wang, L.; Chen, C.-H.; Colliex, C. Electron energy loss spectroscopy and ab initio investigation of iron oxide nanomaterials grown by a hydrothermal process. Phys. Rev. B 2009, 79, 104103. [Google Scholar] [CrossRef]
- Colliex, C.; Manoubi, T.; Ortiz, C. Electron-energy-loss-spectroscopy near-edge fine structures in the iron-oxygen system. Phys. Rev. B 1991, 44, 11402. [Google Scholar] [CrossRef]
- Dézsi, I.; Fetzer, C.; Gombkötö, Á.; Szücs, I.; Gubicsa, J.; Ungár, T. Phase transition in nanomagnetite. J. Appl. Phys. 2008, 103, 104312. [Google Scholar] [CrossRef] [Green Version]
- Ramos-Guivar, J.A.; López, E.O.; Greneche, J.-M.; Litterst, F.J.; Passamani, E.C. Effect of EDTA organic coating on the spin canting behavior of maghemite nanoparticles for lead (II) adsorption. Appl. Surf. Sci. 2021, 538, 148021. [Google Scholar] [CrossRef]
- Ramos-Guivar, J.A.; Passamani, E.C.; Litterst, J. Superspinglass state in functionalized zeolite 5A-maghemite nanoparticles. AIP Adv. 2021, 11, 035223. [Google Scholar] [CrossRef]
- Blume, M.; TJon, J.A. Mössbauer spectra in a fluctuating environment. Phys. Rev. 1968, 165, 446–456. [Google Scholar] [CrossRef]
- Koushika, E.M.; Shanmugavelayutham, G.; Saravanan, P.; Balasubramanian, C. Rapid synthesis of nano-magnetite by thermal plasma route and its magnetic properties. Mater. Manuf. 2018, 33, 1–7. [Google Scholar] [CrossRef]
- Neto, W.S.; Dutra, G.V.S.; Jensen, A.T.; Araújo, O.A.; Garg, V.; de Oliveira, A.C.; Valadares, L.F.; de Souza, F.G., Jr.; Machado, F. Superparamagnetic nanoparticles stabilized with free-radical polymerizable oleic acid-based coating. J. Alloys Compd. 2018, 739, 1025–1036. [Google Scholar] [CrossRef]
- Soares, P.P.; Barcellos, G.S.; Petzhold, C.L.; Lavayen, V. Iron oxide nanoparticles modified with oleic acid: Vibrational and phase determination. J. Phys. Chem. Solids 2016, 99, 111–118. [Google Scholar] [CrossRef]


| Sample | <D> (nm) | Dm (nm) | Standard Deviation |
|---|---|---|---|
| M1 | 12.2 | 11.5 | 2.95 |
| M2 | 10.0 | 9.4 | 2.60 |
| M3 | 8.8 | 8.4 | 1.88 |
| M4 | 11.1 | 10.2 | 3.18 |
| M5 | 13.8 | 13.1 | 3.29 |
| M6 | 11.7 | 10.9 | 3.20 |
| RAA (%) | δ vs. Fe 300 K (mm/s) | Bhf (T) | Q (mm/s) | σ (T) | W (mm/s) | ||
|---|---|---|---|---|---|---|---|
| M1 | γ-Fe2O3 A | 31 | 0.30 | 51.9 | 0 | 1.6 | 0.24 |
| γ-Fe2O3 B | 51 | 0.53 | 52.5 | 0 | 1.6 | 0.24 | |
| α-FeOOH | 11 | 0.47 | 50.6 | −0.25 | 1.1 | 0.24 | |
| Octahedral Fe3+ | 7 | 0.56 | 46.3 | 0 | 1.7 | 0.24 | |
| M2 | γ-Fe2O3 A | 34 | 0.28 | 51.9 | 0 | 1.1 | 0.24 |
| γ-Fe2O3 B | 56 | 0.51 | 52.5 | 0 | 1.5 | 0.24 | |
| α-FeOOH | 5 | 0.47 | 47.5 | −0.25 | 4.3 | 0.24 | |
| Octahedral Fe3+ | 6 | 0.56 | 47.5 | 0 | 0.9 | 0.24 | |
| M3 | γ-Fe2O3 A | 24 | 0.29 | 51.6 | 0 | 1.7 | 0.24 |
| γ-Fe2O3 B | 40 | 0.52 | 52.2 | 0 | 1.5 | 0.24 | |
| α-FeOOH | 22 | 0.47 | 50.6 | −0.25 | 1.3 | 0.24 | |
| Octahedral Fe3+ | 14 | 0.56 | 46.6 | 0 | 4.2 | 0.24 | |
| M4 | γ-Fe2O3 A | 32 | 0.30 | 52.0 | 0 | 1.2 | 0.24 |
| γ-Fe2O3 B | 53 | 0.53 | 52.6 | 0 | 1.3 | 0.24 | |
| α-FeOOH | 3 | 0.47 | 50.6 | −0.25 | 0.8 | 0.24 | |
| Octahedral Fe3+ | 11 | 0.56 | 47.5 | 0 | 2.6 | 0.24 | |
| M5 | γ-Fe2O3 A | 29 | 0.30 | 52.1 | 0 | 1.4 | 0.24 |
| γ-Fe2O3 B | 48 | 0.53 | 52.7 | 0 | 1.4 | 0.24 | |
| α-FeOOH | 14 | 0.47 | 50.6 | −0.25 | 0.9 | 0.24 | |
| Octahedral Fe3+ | 9 | 0.56 | 47.7 | 0 | 2.5 | 0.24 | |
| M6 | γ-Fe2O3A | 31 | 0.30 | 52.1 | 0 | 1.3 | 0.24 |
| γ-Fe2O3B | 52 | 0.53 | 52.7 | 0 | 1.3 | 0.24 | |
| α-FeOOH | 9 | 0.42 | 50.6 | −0.25 | 0.9 | 0.24 | |
| Octahedral Fe3+ | 9 | 0.54 | 46.9 | 0 | 2.6 | 0.24 | |
| error | ±3 | ±0.02 | ±0.1 | ±0.1 |
| 300 K | |||
| Sample | Ms (emu g−1) | b (kOe)2 | χ (emu/gOe) |
| M1 | 65.8 (2) | 0.84 (5) | 0.01 (2) |
| M2 | 66.7 (2) | 0.67 (5) | 0.01 (2) |
| M3 | 51.2 (2) | 0.46 (5) | 0.01 (2) |
| M4 | 54.4 (2) | 0.38 (5) | 0.01 (2) |
| M5 | 58.9 (1) | 0.56 (5) | 0.02 (2) |
| M6 | 45.9 (2) | 0.59 (5) | 0.02 (2) |
| 5 K | |||
| M1 | 73.3 (2) | 1.05 (3) | 0.005 (1) |
| M2 | 74.6 (2) | 0.82 (3) | 0.003 (1) |
| M3 | 57.9 (2) | 0.53 (3) | 0.002 (3) |
| M4 | 59.9 (2) | 0.55 (3) | 0.001 (5) |
| M5 | 65.4 (2) | 0.76 (3) | 0.009 (3) |
| M6 | 51.6 (2) | 0.49 (3) | 0.016 (3) |
Publisher’s Note: MDPI stays neutral with regard to jurisdictional claims in published maps and institutional affiliations. |
© 2022 by the authors. Licensee MDPI, Basel, Switzerland. This article is an open access article distributed under the terms and conditions of the Creative Commons Attribution (CC BY) license (https://creativecommons.org/licenses/by/4.0/).
Share and Cite
Flores-Cano, D.A.; Checca-Huaman, N.-R.; Castro-Merino, I.-L.; Pinotti, C.N.; Passamani, E.C.; Litterst, F.J.; Ramos-Guivar, J.A. Progress toward Room-Temperature Synthesis and Functionalization of Iron-Oxide Nanoparticles. Int. J. Mol. Sci. 2022, 23, 8279. https://doi.org/10.3390/ijms23158279
Flores-Cano DA, Checca-Huaman N-R, Castro-Merino I-L, Pinotti CN, Passamani EC, Litterst FJ, Ramos-Guivar JA. Progress toward Room-Temperature Synthesis and Functionalization of Iron-Oxide Nanoparticles. International Journal of Molecular Sciences. 2022; 23(15):8279. https://doi.org/10.3390/ijms23158279
Chicago/Turabian StyleFlores-Cano, Diego A., Noemi-Raquel Checca-Huaman, Isabel-Liz Castro-Merino, Camila N. Pinotti, Edson C. Passamani, Fred Jochen Litterst, and Juan A. Ramos-Guivar. 2022. "Progress toward Room-Temperature Synthesis and Functionalization of Iron-Oxide Nanoparticles" International Journal of Molecular Sciences 23, no. 15: 8279. https://doi.org/10.3390/ijms23158279