3.1. Extraction and Optimization of the Chicken Collagen Process
Table 4 shows the factorial design used in this experiment and the results of the extractions of collagen (
Y), in the experimental setting (
Yexp) and those calculated by the model (
Ycalc), according to each assay performed. It is noted that the extraction varied from 1.7% to 8.5% of collagen in the initial mass of the chicken feet. After execution of each assay, the collagen powder was obtained after drying at 50 °C for 12 h in a vacuum drier.
The yields found in this work are similar to those reported by Lim et al. [
57], which ranged from 1.72% to 5.33% depending on the extraction method used. Hao et al. [
58] in a study with sturgeon skin pretreated with Ca(OH)
2 obtained a gelatin yield of 2.40% to 3.52%. Jamilah and Hervinder [
59] reported gelatin yields of 5.39% and 7.81% upon collagen extraction from red and black tilapia, respectively. Chew et al. [
60] found a gelatin yield of 7.25% from the fin after the extraction process. Therefore, the results presented in trials 5 and 6 were greater than all the results reported previously. However, in a study on ray skin (
Raja kenojei) with 6 h-extraction, Ref. [
61] identified a gelatin yield of 17.48% and Ref. [
54] obtained a gelatin yield of 12% during collagen extraction from giant squid.
The analysis of variance was employed for determining significant variables, as shown in
Table 5. The regression equations were submitted to the
F-test for the coefficient of determination
R2 and explaining the variances at 95% of the confidence level. According to [
31,
32,
33,
34,
35], the first
F-test (
Fcalc/
Ftab) must be more than one for it to be significant, the second
F-test must be less than 1 for it to be predictive, and
R2 explaining the variance must be next at 1.0 and 100, respectively.
Table 5 lists the significant parameters and statistical test results of the models.
The calculated value for the
F1 test was 22.947, being 4.5 times larger than the tabulated
F1 (4.070), while the calculated
F2 was 1.950, being 10 times smaller than the tabulated
F2 (19.160); this indicates that the model is statistically significant and is adjusted to the experimental data. Another parameter that corroborated for the analysis was the coefficient of determination (
R2), which was equal to 0.9806 and is close to 1.0, as indicated by [
31,
32,
33,
34,
35]. In this manner, it can be affirmed that the model is adjusted and can be used to predict the value of the yield of collagen extraction from chicken feet, for the conditions presented in this work.
Equation (7) is the best fitting model to predict the extraction yield (
y) value on the influence of acetic acid (
x1), processing time (
x2), and temperature (
x3):
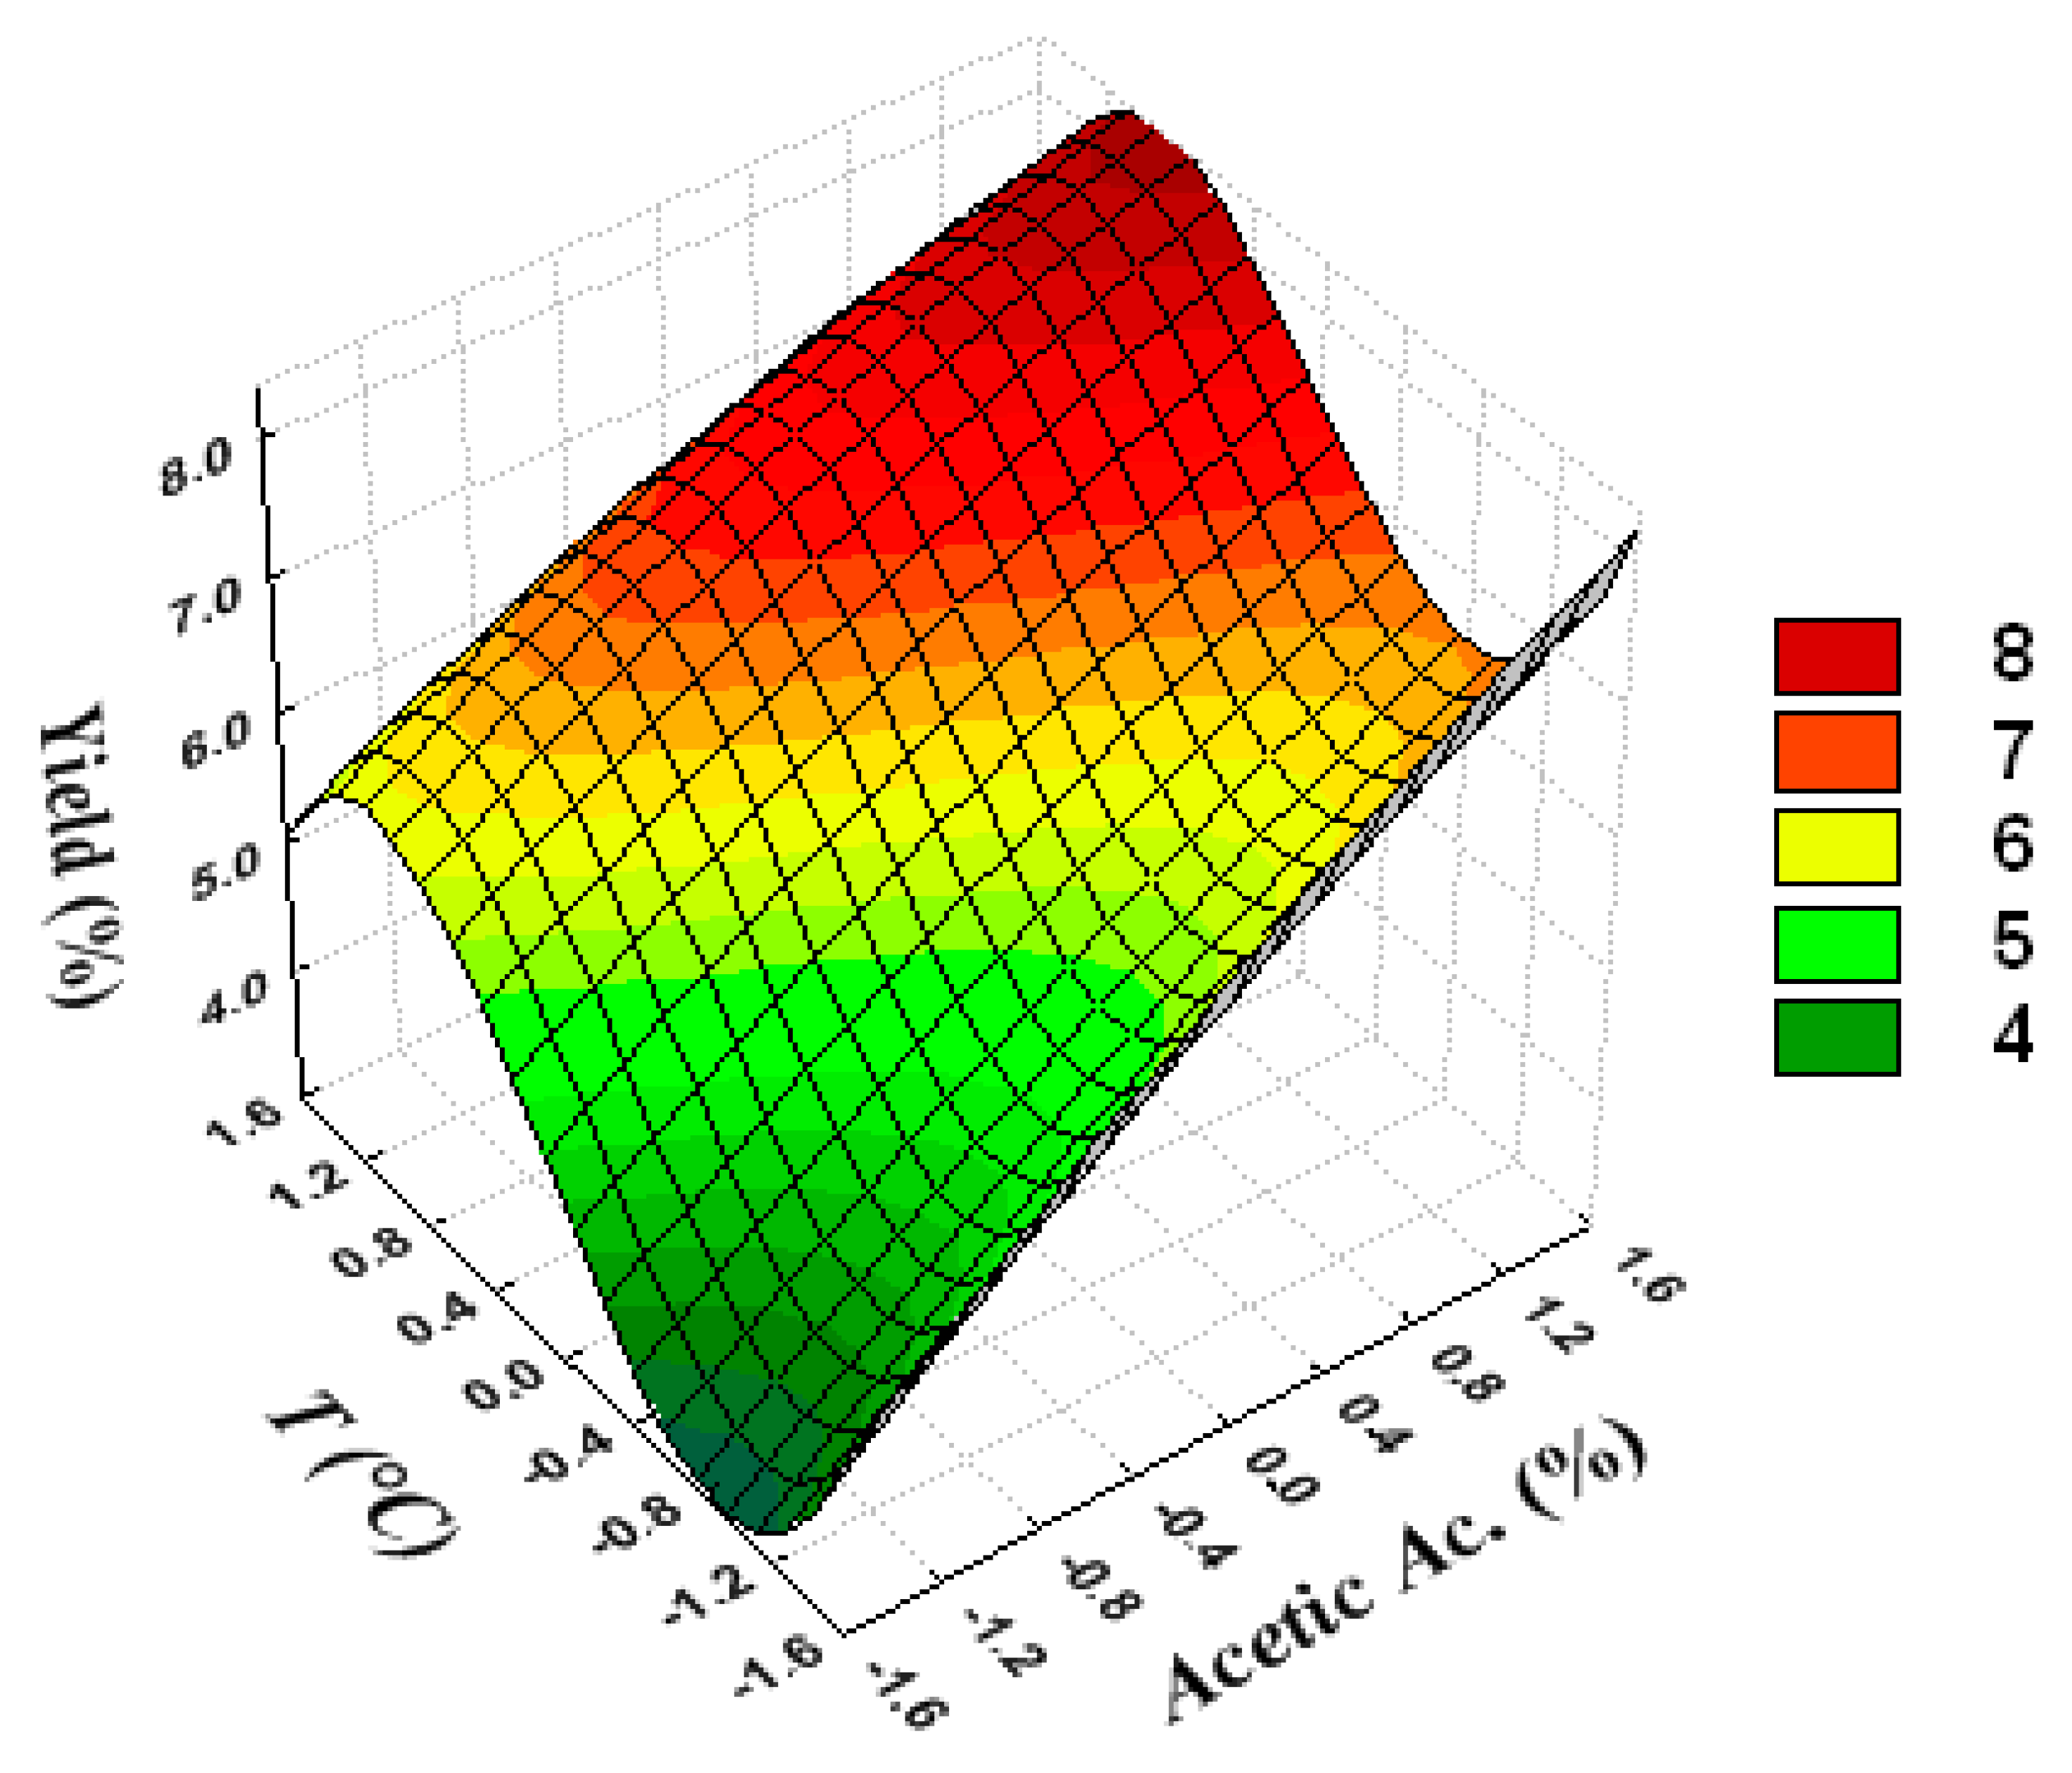
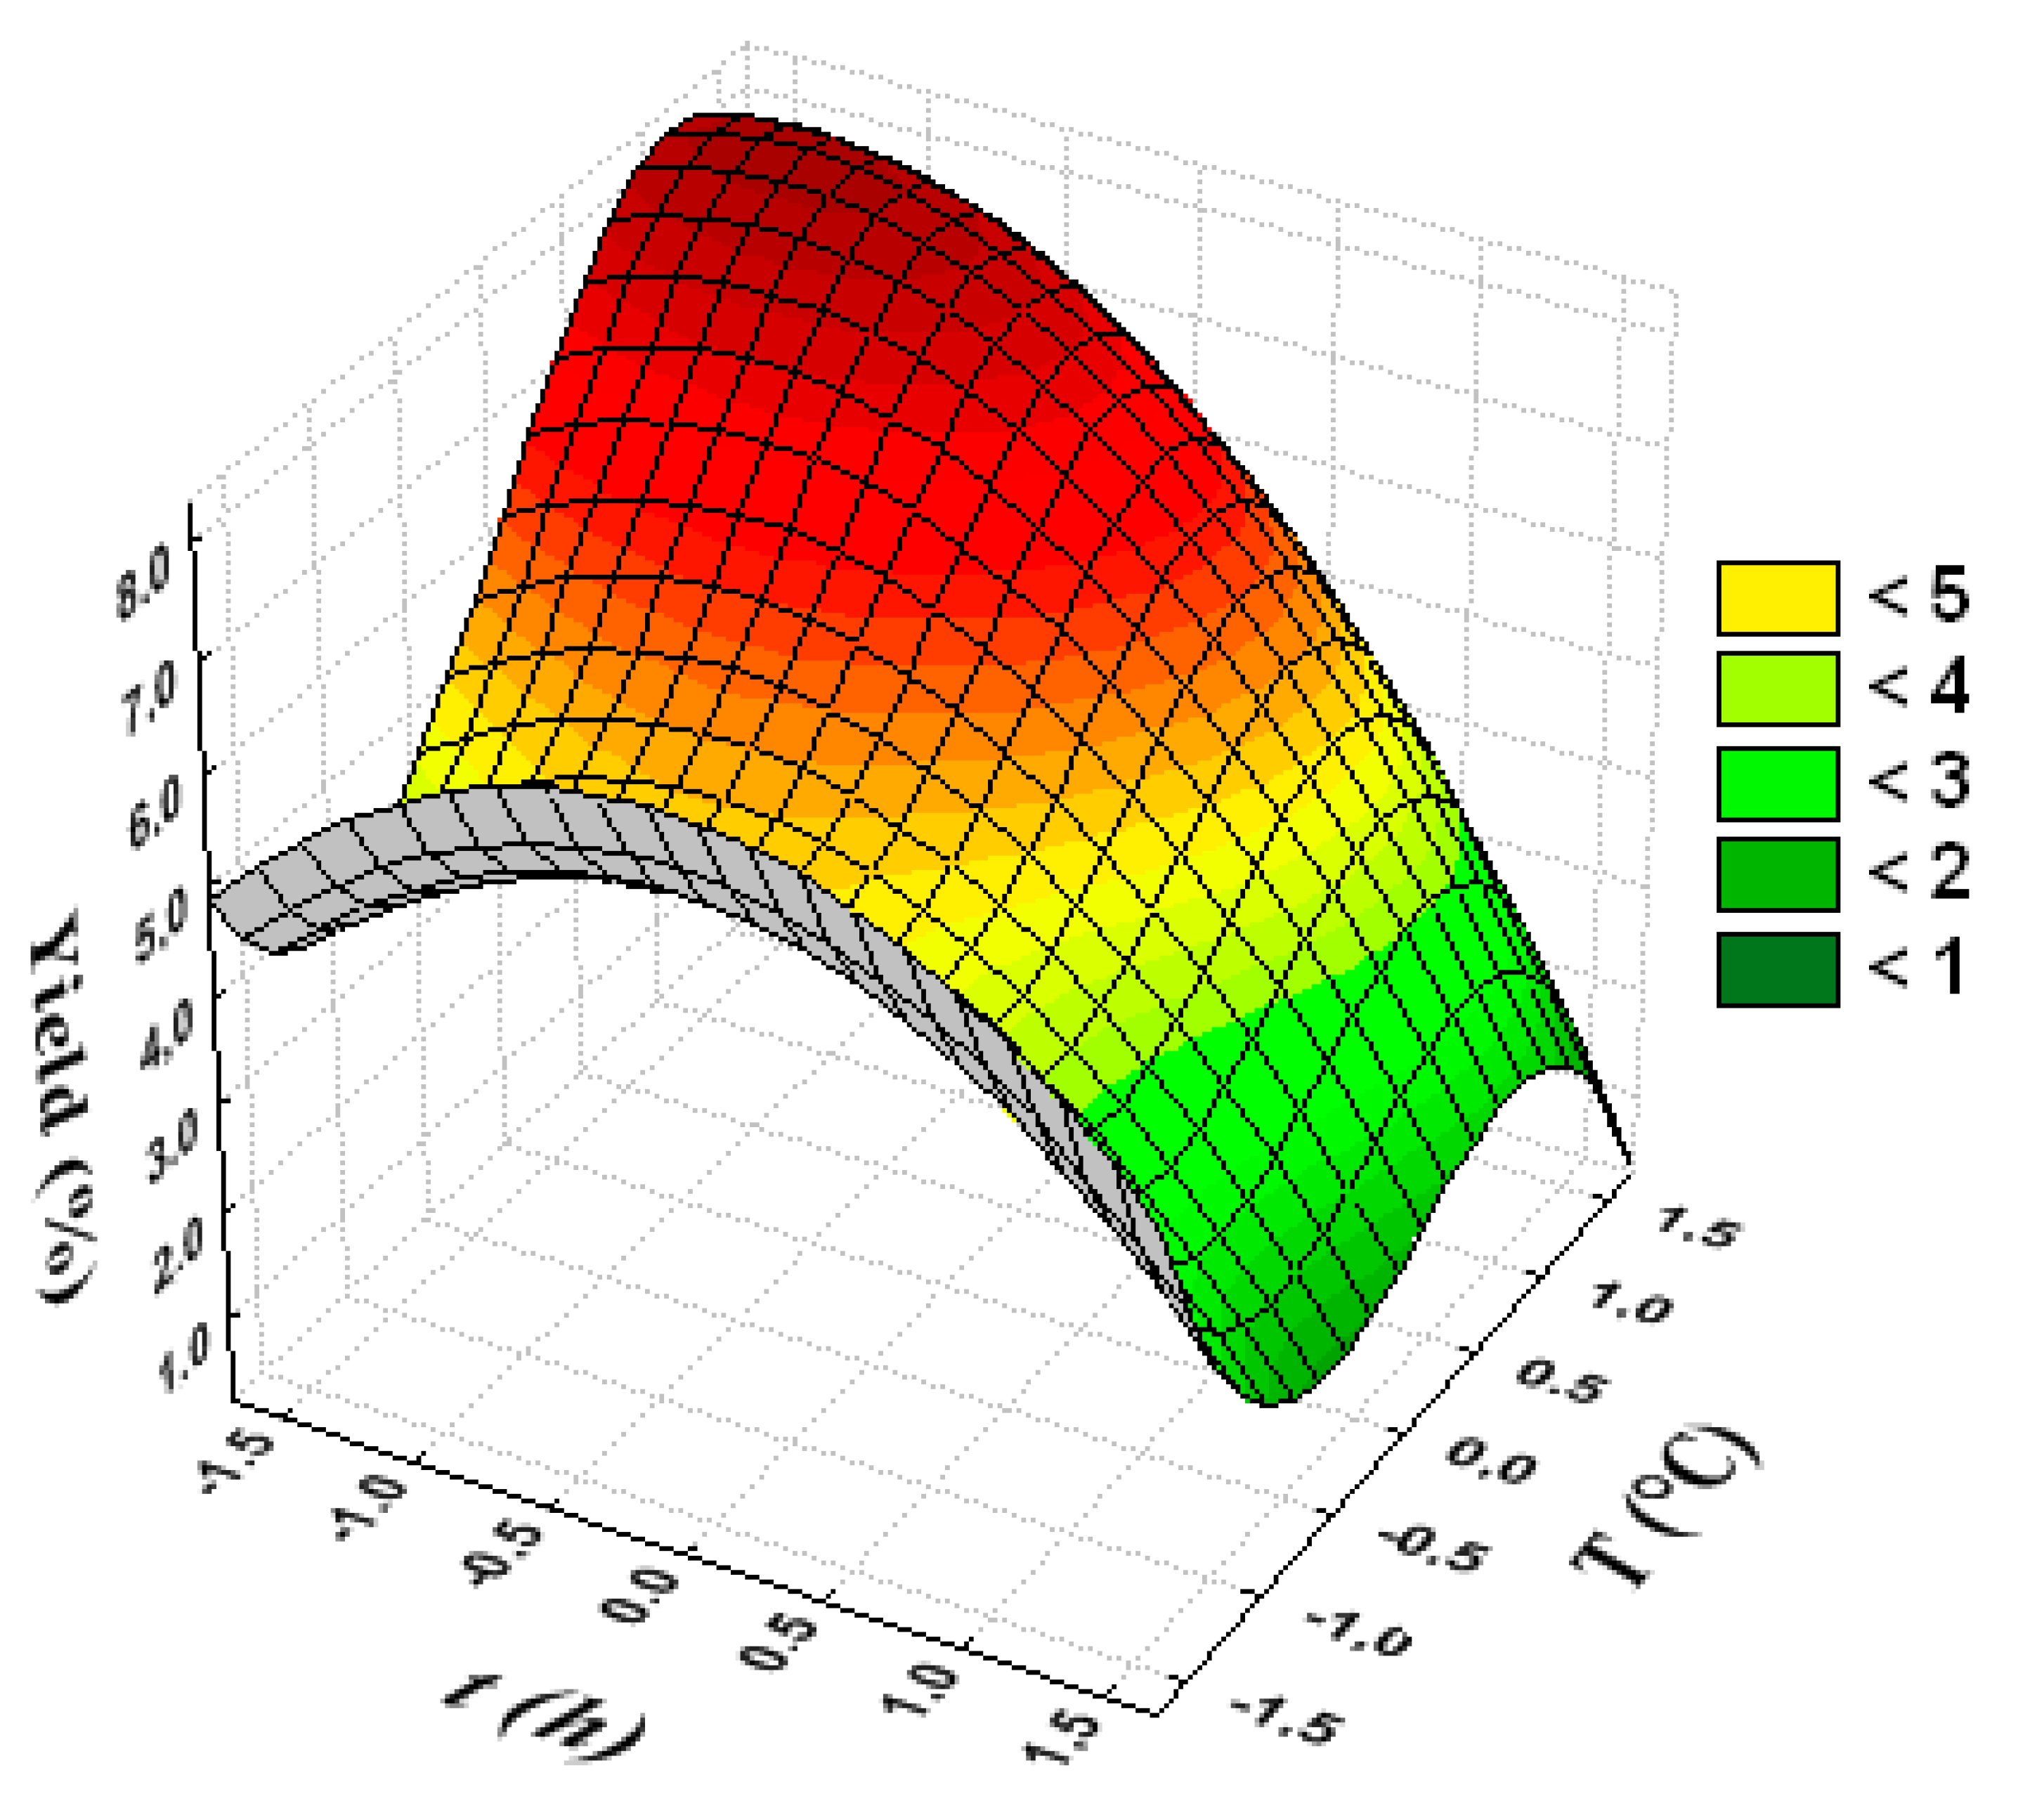
Figure 1,
Figure 2 and
Figure 3 are the response surfaces obtained in the Statistica 6.0
® software and are used in the optimization of collagen extraction from chicken feet. As shown in
Figure 3, the highest yields are found when operated with the highest concentrations of acetic acid and with the shortest processing times.
Figure 2 shows that, if the temperature and acetic acid concentration are at their highest values, the yield is at a maximum.
Figure 3 shows that, in the shortest processing times and the highest temperature values, the yield tends to reach the maximum value. To find the best conditions, one must observe the level curves (lines) on the response surface, which tend to the highest values of extraction yield (in red).
Thus, it can be concluded that, by using acetic acid concentrations between 3.000% and 3.682%, operating times between 1 h and 3 h, and temperatures between 70 °C and 76.82 °C yielding greater than 8.0% collagen can be obtained.
3.2. Chemical and Bloom Analysis
Table 6 shows the chemical composition of chicken feet used for the extraction of collagen, with respect to the protein, lipid, ash, and water content. The powdered collagen composition was 9.7 g, 4.8 g, 6.9 g, and 78.5 g/100 g for moisture, ash, lipids, and proteins, respectively. Cliché et al. [
62] also presented the composition of chicken feet, which had the following crude protein, ash, fat, and moisture content values of 17.42%, 12.04%, 5.98%, and 62.05%, respectively, which is similar to that found in our work.
The results of collagen gel strength from chicken feet are presented in
Table 7. Upon comparing the gel strength of chicken feet gelatin to commercial gelatin at 6.67% collagen, this chicken feet gelatin has roughly 45% greater gel strength than that of commercial gelatin.
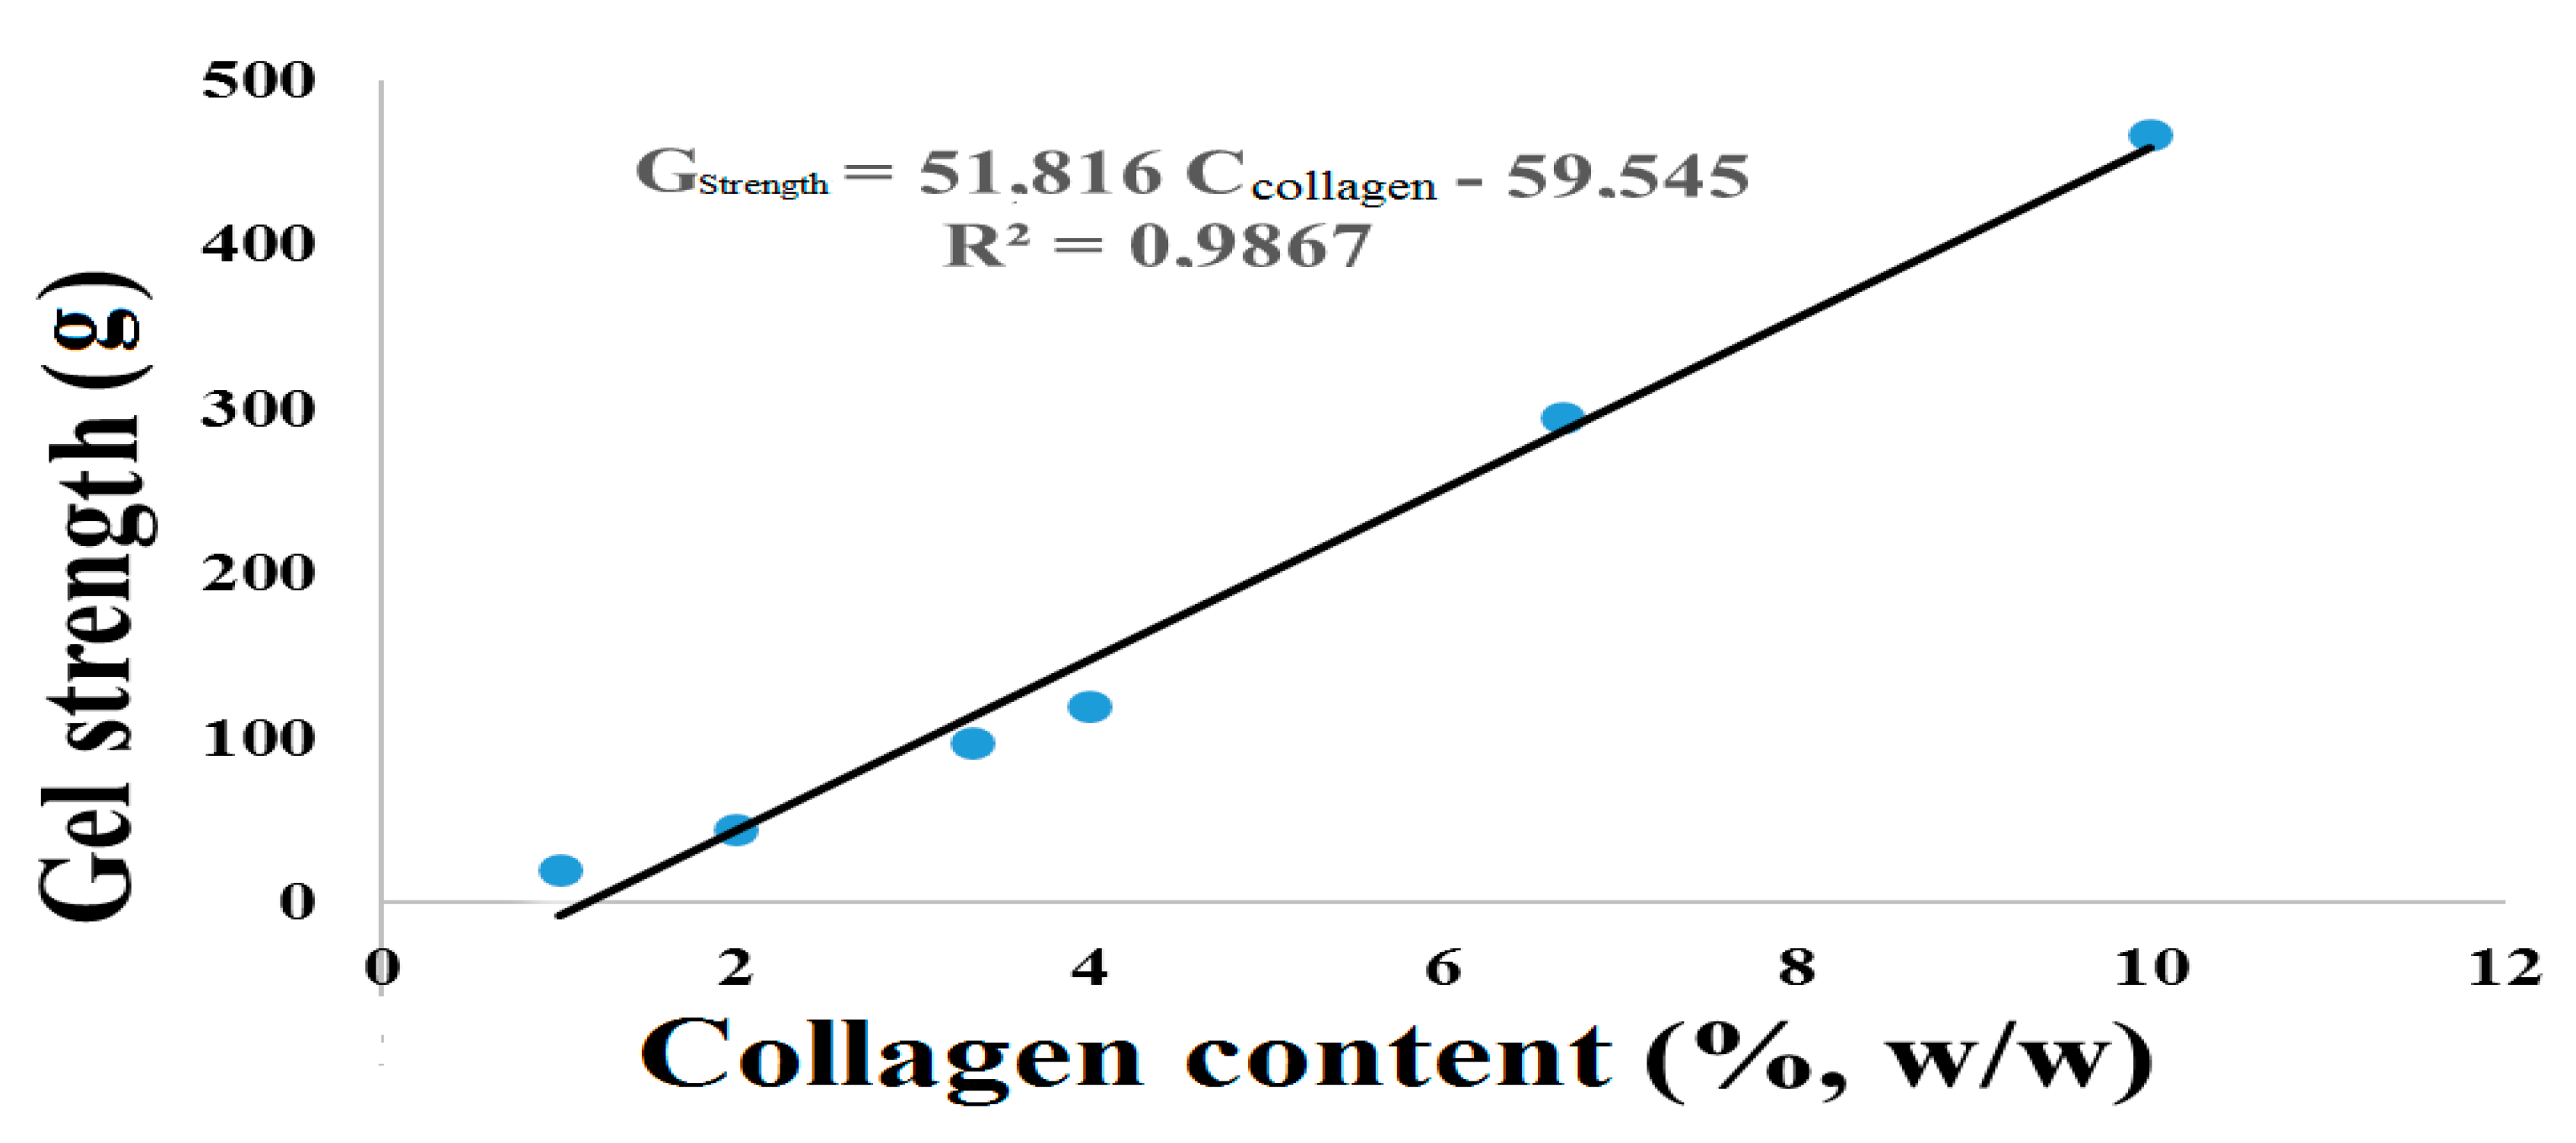
Consequently,
Figure 4 shows the variation in gel strength with the composition of the collagen in the gelatin. As expected, gel strength increases with the collagen composition in gelatin and, in this case, showed a linear increase. Using a linear equation obtained from
Table 7 data, it was observed that, to obtain a gel strength similar to that of commercial gelatin, one requires only 5% collagen concentration from chicken feet gelatin. This equates to a reduction of about 24% (
w/w) in the final gelatin composition, and thus makes chicken feet gelatin more economically feasible than commercial gelatin.
In a study on fish gelatin extraction with or without treatment by transglutaminase enzymes in a hydrolysis process, Norziah et al. [
53] produced gelatin with low gel strength, varying between 70 g and 100 g, in addition to a commercial gelatin from halal bovine with a gel strength of 336.2 g. All gelatins presented in this study had low gel strength; however, in the same work, the authors cite a commercial fish gelatin with gel strength (435.9 g) approaching that found in this study. Thus, it is possible to suggest that the gel strength of chicken feet gelatin found in this work is superior or equal to that reported in previous studies.
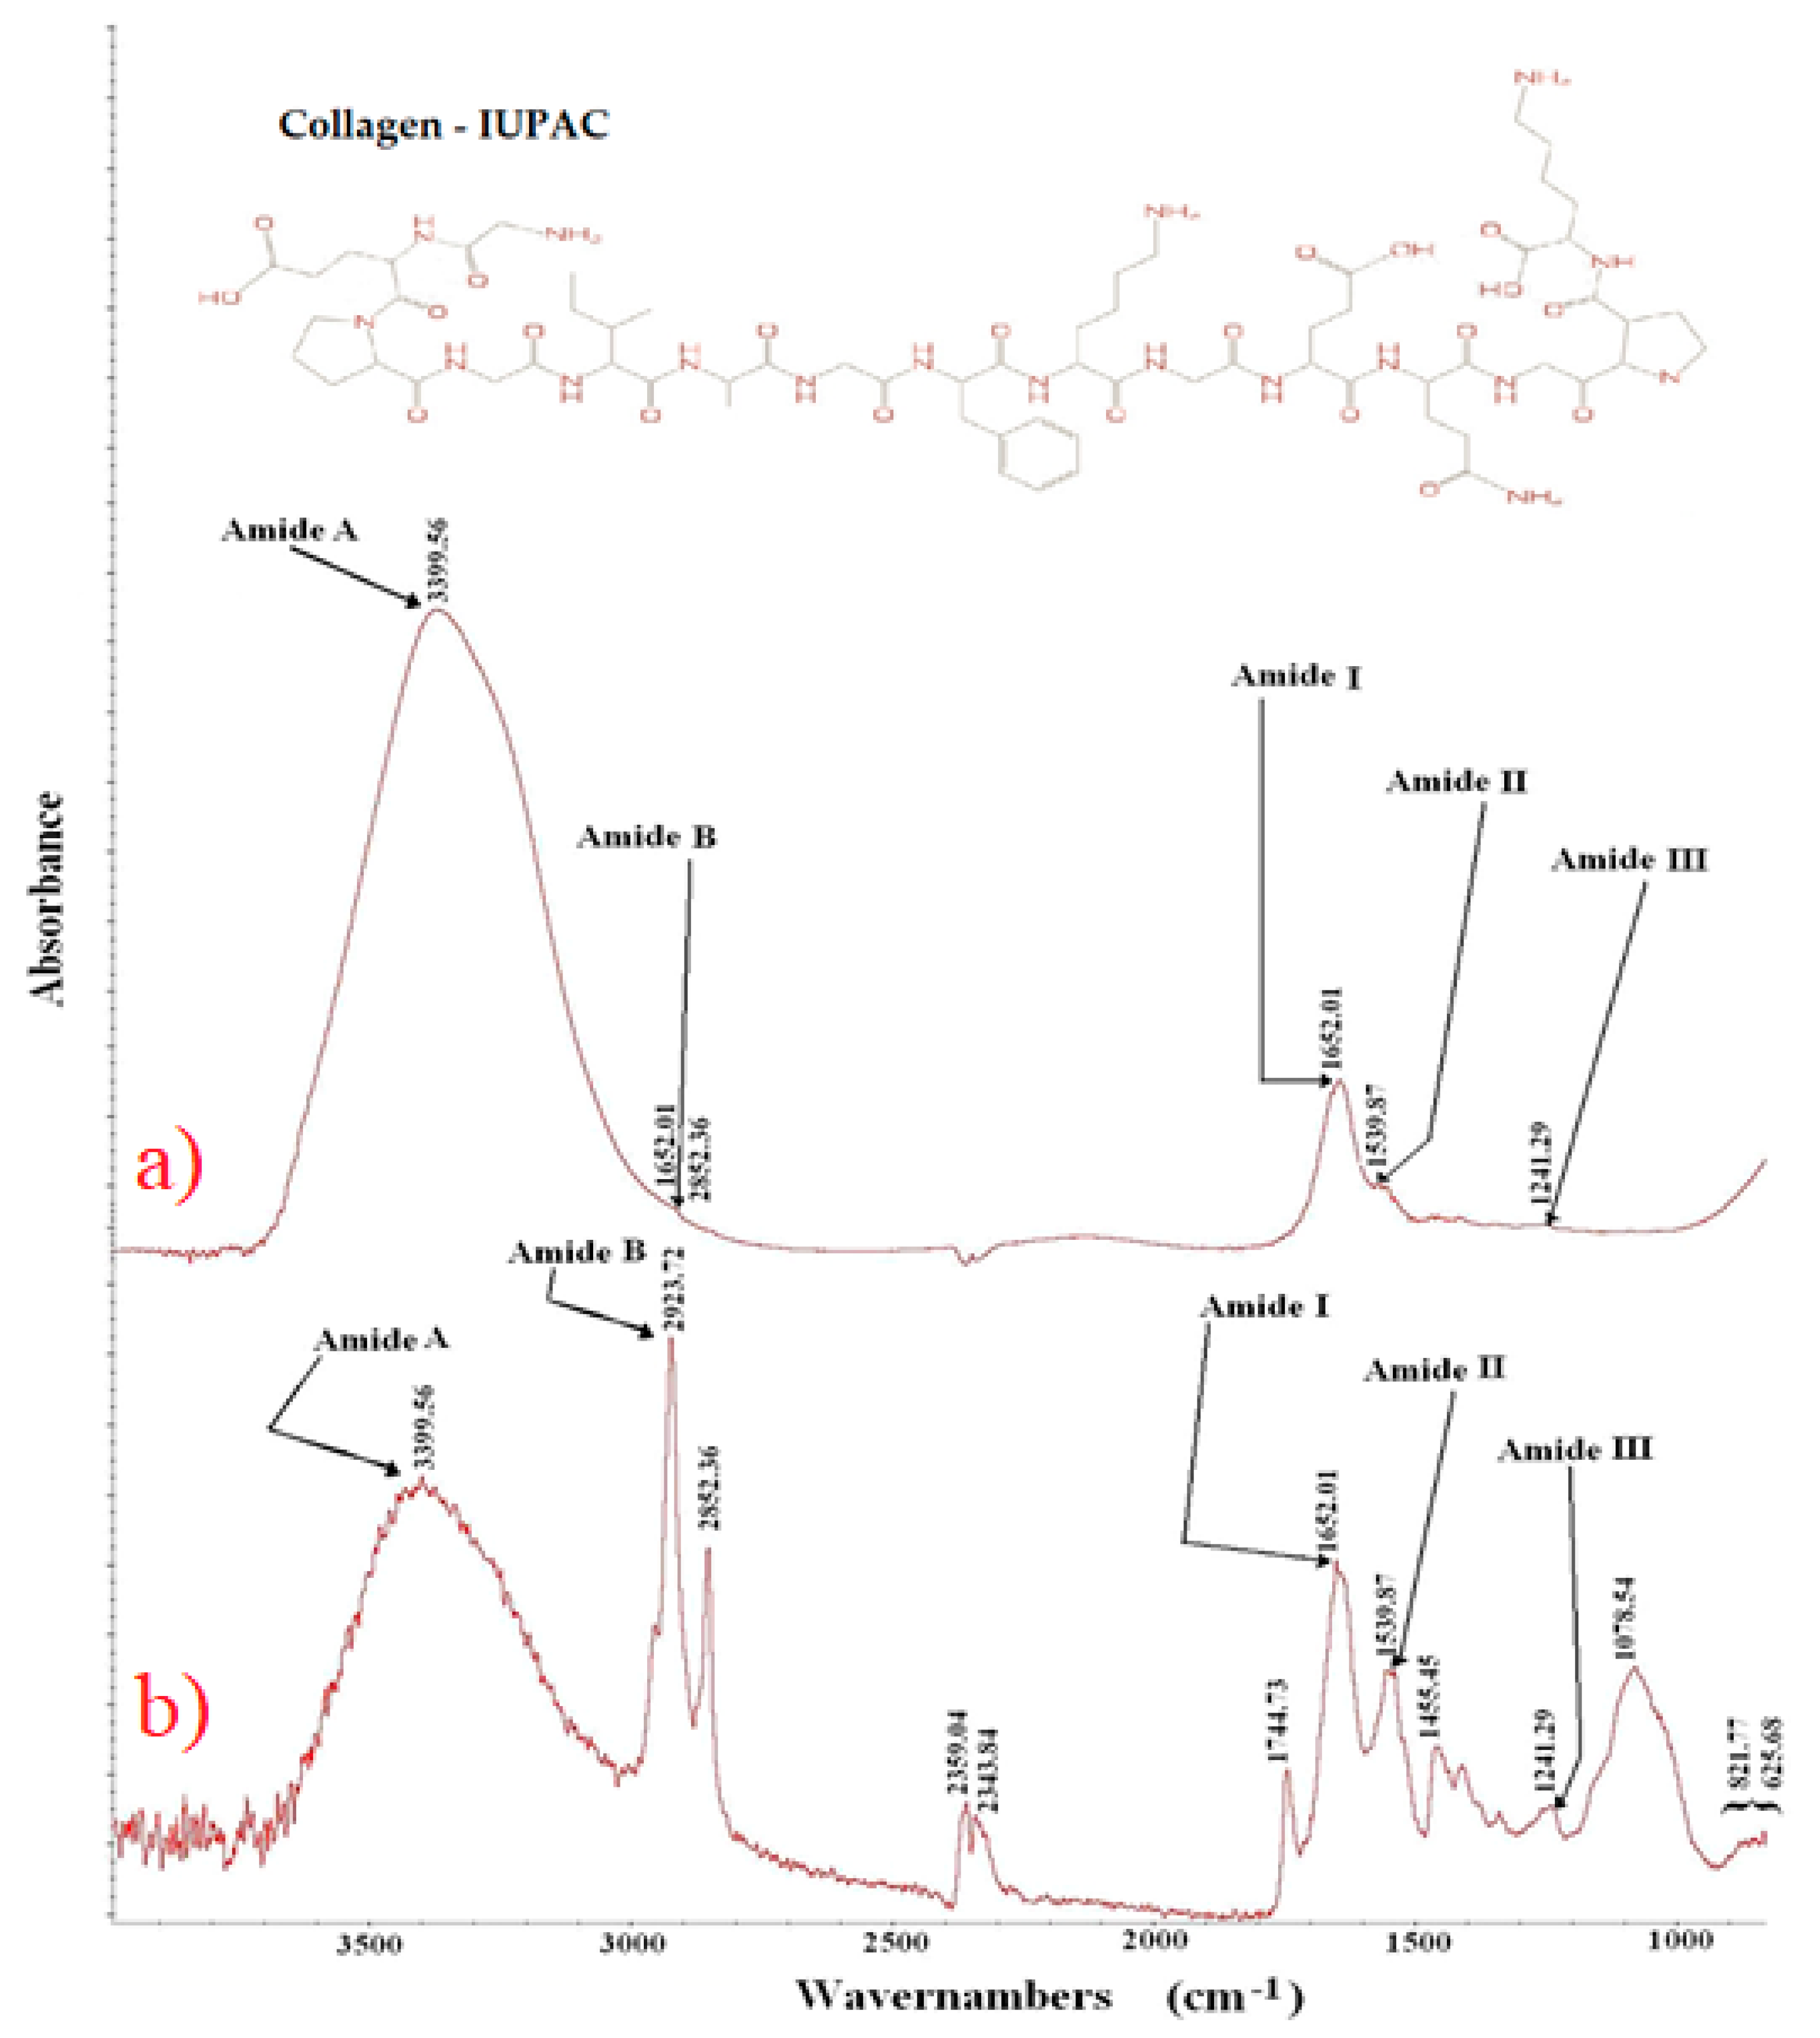
3.3. Collagen Composition from Analysis of the FTIR
Recently, Ref. [
27] used infrared spectroscopy to control the quality of intact chicken breast fillets by predicting the major component scores of qualities. In addition, Ref. [
41] reports that this technique can be used to monitor the shelf life of products and the origin of agricultural products. Thus, in order to contribute to the quality control of chicken products, we used the FTIR technique in chicken jelly and commercial gelatin samples to verify the collagen content of both.
Figure 5a shows the FTIR spectra of collagen extracted from chicken feet on a thermal bath of 4% acetic acid solution at 60 °C for 4 h and
Figure 5b shows the FTIR spectra of collagen from commercial gelatin. Each spectrum is an average of 32 scans of three batches on the optimal extraction conditions presented in the optimization section. FTIR spectra of the collagen extracted from chicken feet showed major peaks in the amide region. Specifically, chicken collagen showed a vibration peak at the wave numbers of 1652.01 cm
−1 for amide I, of 1539.87 cm
−1 for amide II, of 1241.29 cm
−1 for amide III, of 2923.72 cm
−1 for amide B, and of 3399.56 cm
−1 for amide A. The FTIR spectra of commercial gelatin showed Amide II at 1556.53 cm
−1, amide I at 1651.32 cm
−1, Amide B at 2921.49 cm
−1, and amide A in a range of 3391.84–3467.09 cm
−1, and did not show any amide III peaks. However, a high protein content of low molecular weight has been found [
51,
63].
The low molecular weight peptides formed during extraction for long times were more likely to form covalent cross-links during the freeze-drying process [
50,
64,
65,
66]. This affected the collagen content from commercial gelatin and reduced one of the main qualities expected in gelatins. The process used in this work did not have the same effect on chicken gelatin. Results showed that collagen composition from chicken feet was greater than 70.90% while that from cowhide gelatin (commercial) was only 35%.
3.4. Mineral Composition
The chemical composition of ash was determined by mass spectroscopy (ICP-MS) and the results are reported in
Table 8. Macro-minerals (Na, K, Ca, Mg, P, and S) that are of great importance to health human are presented and make up most of the elements (99.44% ash content) in the collagen composition.
As seen in
Table 8, there are high levels of Na, at about 6 mg/g, resulting in 28.546 mg of Na per 100 g of powdered collagen. In the descending of quantity in 100 g of powdered collagen, Na is followed by Mg, Ca, S, and K, with contents of 8.817 mg, 8.136 mg, 7.236 mg, and 4.105 mg, respectively. Phosphorus is an important element for energy changes in cells via adenosine triphosphate transfer/adenosine diphosphate (ATP/ADP), and shows a significant amount in collagen from chicken feet.
Other important micro-minerals to human health such as Cu, Fe, and Mn are present in trace amounts (0.04% of ash). Similarly, the presence of toxic elements such as Pb, Ba, Al, Li, and Be is in trace amounts, which does not compromise this food (0.22% of ash content) [
32,
67], and the elements are all derived from chicken feet.
However, the commercial (powder) gelatin used in this work as a comparison has 108 mg of sodium per 5.7 g of powder, which is equivalent to 1847 mg per 100 g. Thus, the collagen obtained in this work presents low sodium content, which is in conformity with the new Brazilian laws that oblige companies to reduce the levels of sodium in their food products.
Using mass spectroscopy, Haug et al. [
5] have found about 5.08 mg, 0.29 mg, 0.02 mg, and 7.13 mg of Na, Ca, K, and other heavy metals in each 1 g of fish gelatin. These values are 43.50% of the total ash content. Their macro-mineral percentage is lower than that of chicken feet gelatin, indicating that our gelatin is nutritionally superior to fish gelatin with respect to minerals.
Under the conditions used in this work, the quality of collagen powder allows production of gelatins that can be used to produce various cosmetics, facial masks, or even artificial tissues for wound healing in humans [
68]. Thus, these products can be more easily marketed because of a good representation of chemical, nutritional, and sensorial qualities in their labels. This can possibly bring overall health improvement to humans, and being superior to commercial products, can facilitate greater acceptance by consumers [
39].
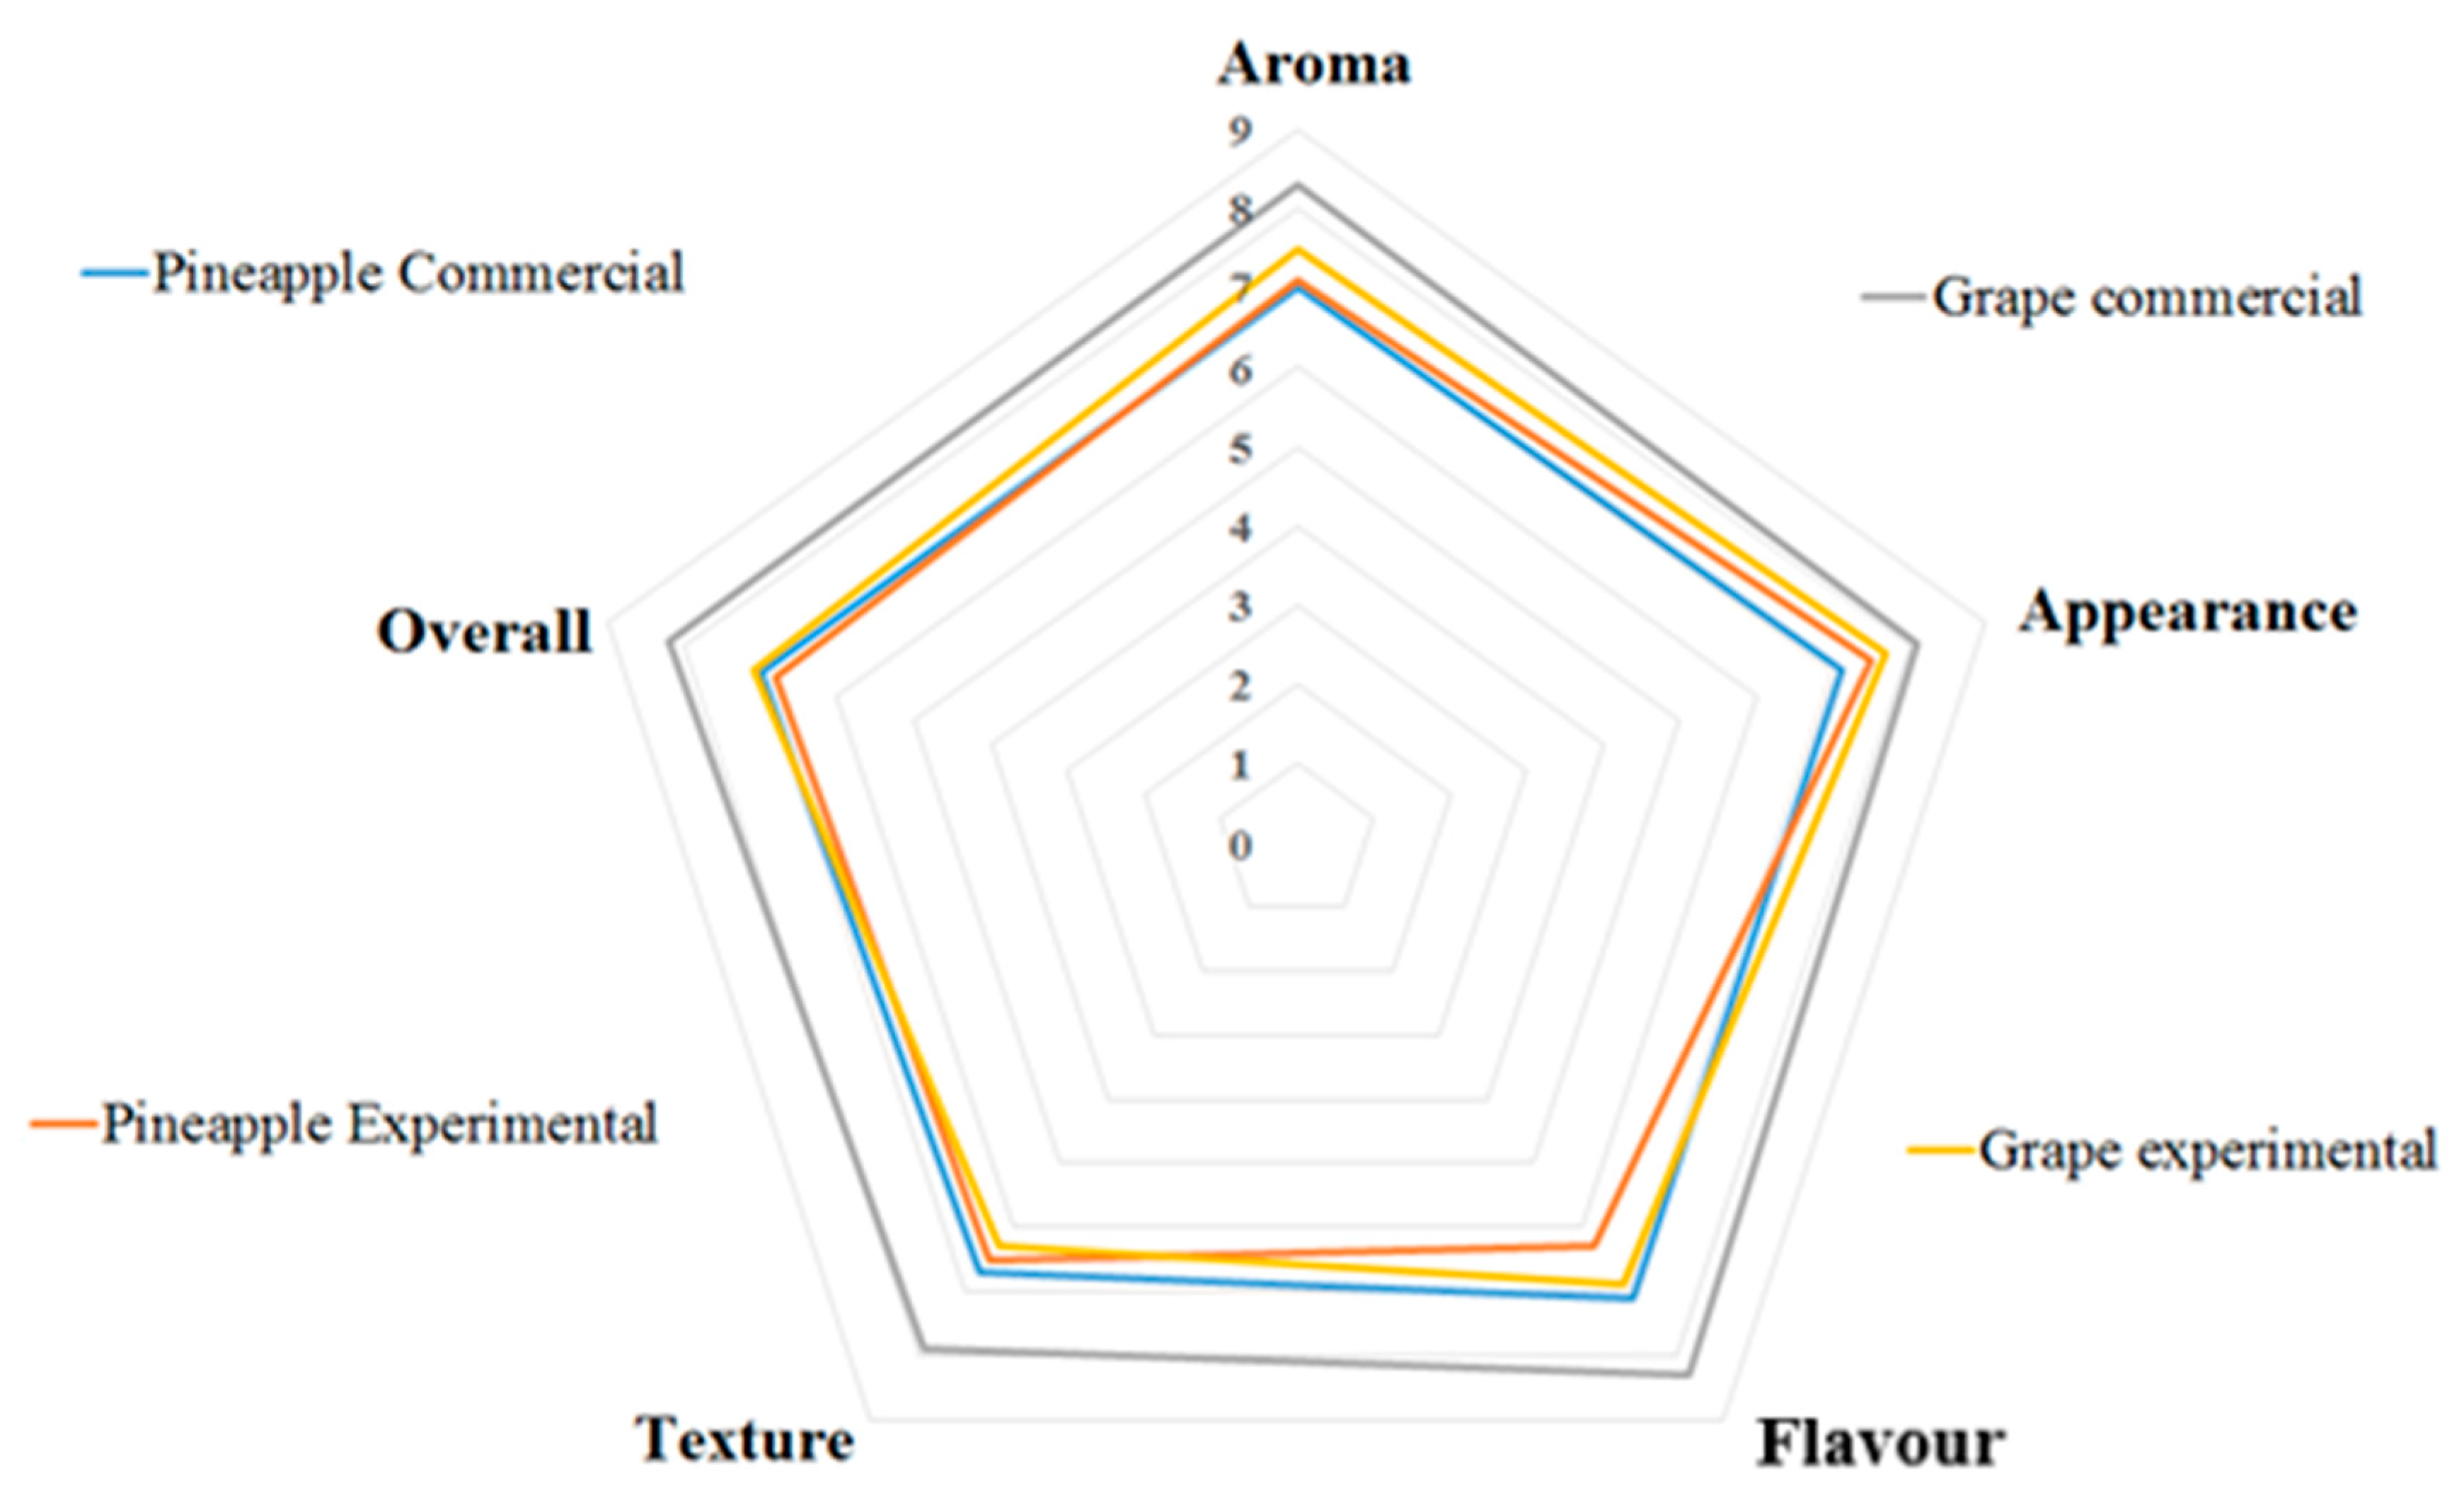
3.5. Sensorial Qualities
Table 9 shows the sensorial comparison between chicken and commercial gelatin for two flavors. The table show that the consumer acceptances were higher than 80% for all samples tested in this study. The Student’s
t-test showed no significant differences between the pineapple flavored gelatins for all sensorial qualities studied. However, for grape-flavored gelatins differences were observed for aroma, flavor, and overall vision; in all cases, commercial gelatins presented higher means than chicken collagen gelatins, mainly with the grape-flavored gelatin. However, since the values attributed to chicken collagen gelatin presented an average between 6.3 and 7.7 on a hedonic scale, they can be considered as accepted by consumers, of which 83% confirmed that they would consume this product.
The high values of commercial gelatin may be because of the high levels of sugar in its composition. The highest averages were obtained by commercial gelatin because of 72% sugar in its composition. Chicken gelatin had lower levels of sugar (28%) and high collagen content (71%), which gives it greater value with respect to health and nutrition for the consumers compared to commercial gelatin. Additionally, it can be more readily consumed by people with diabetes, owing to its low sugar content. Chicken gelatin may thus be considered as the best gelatin, since its sensory qualities were the best as assessed by consumers, with an acceptance average varying between 6.3 and 7.5 times on the hedonic scale for all sensorial attributes.
Figure 6 shows that the majority of gelatins presented similar values for each attribute, which were close to seven points in a hedonic scale, thus indicating the similarity between chicken collagen (experimental) and commercial gelatins. However, grape-flavored commercial gelatin was significantly different among the others, since its average was above eight points on the hedonic scale
All attributes of chicken collagen gelatin were satisfactorily evaluated by consumers, since their average is close to seven points on the hedonic scale, indicating that this product has an excellent sensorial quality.
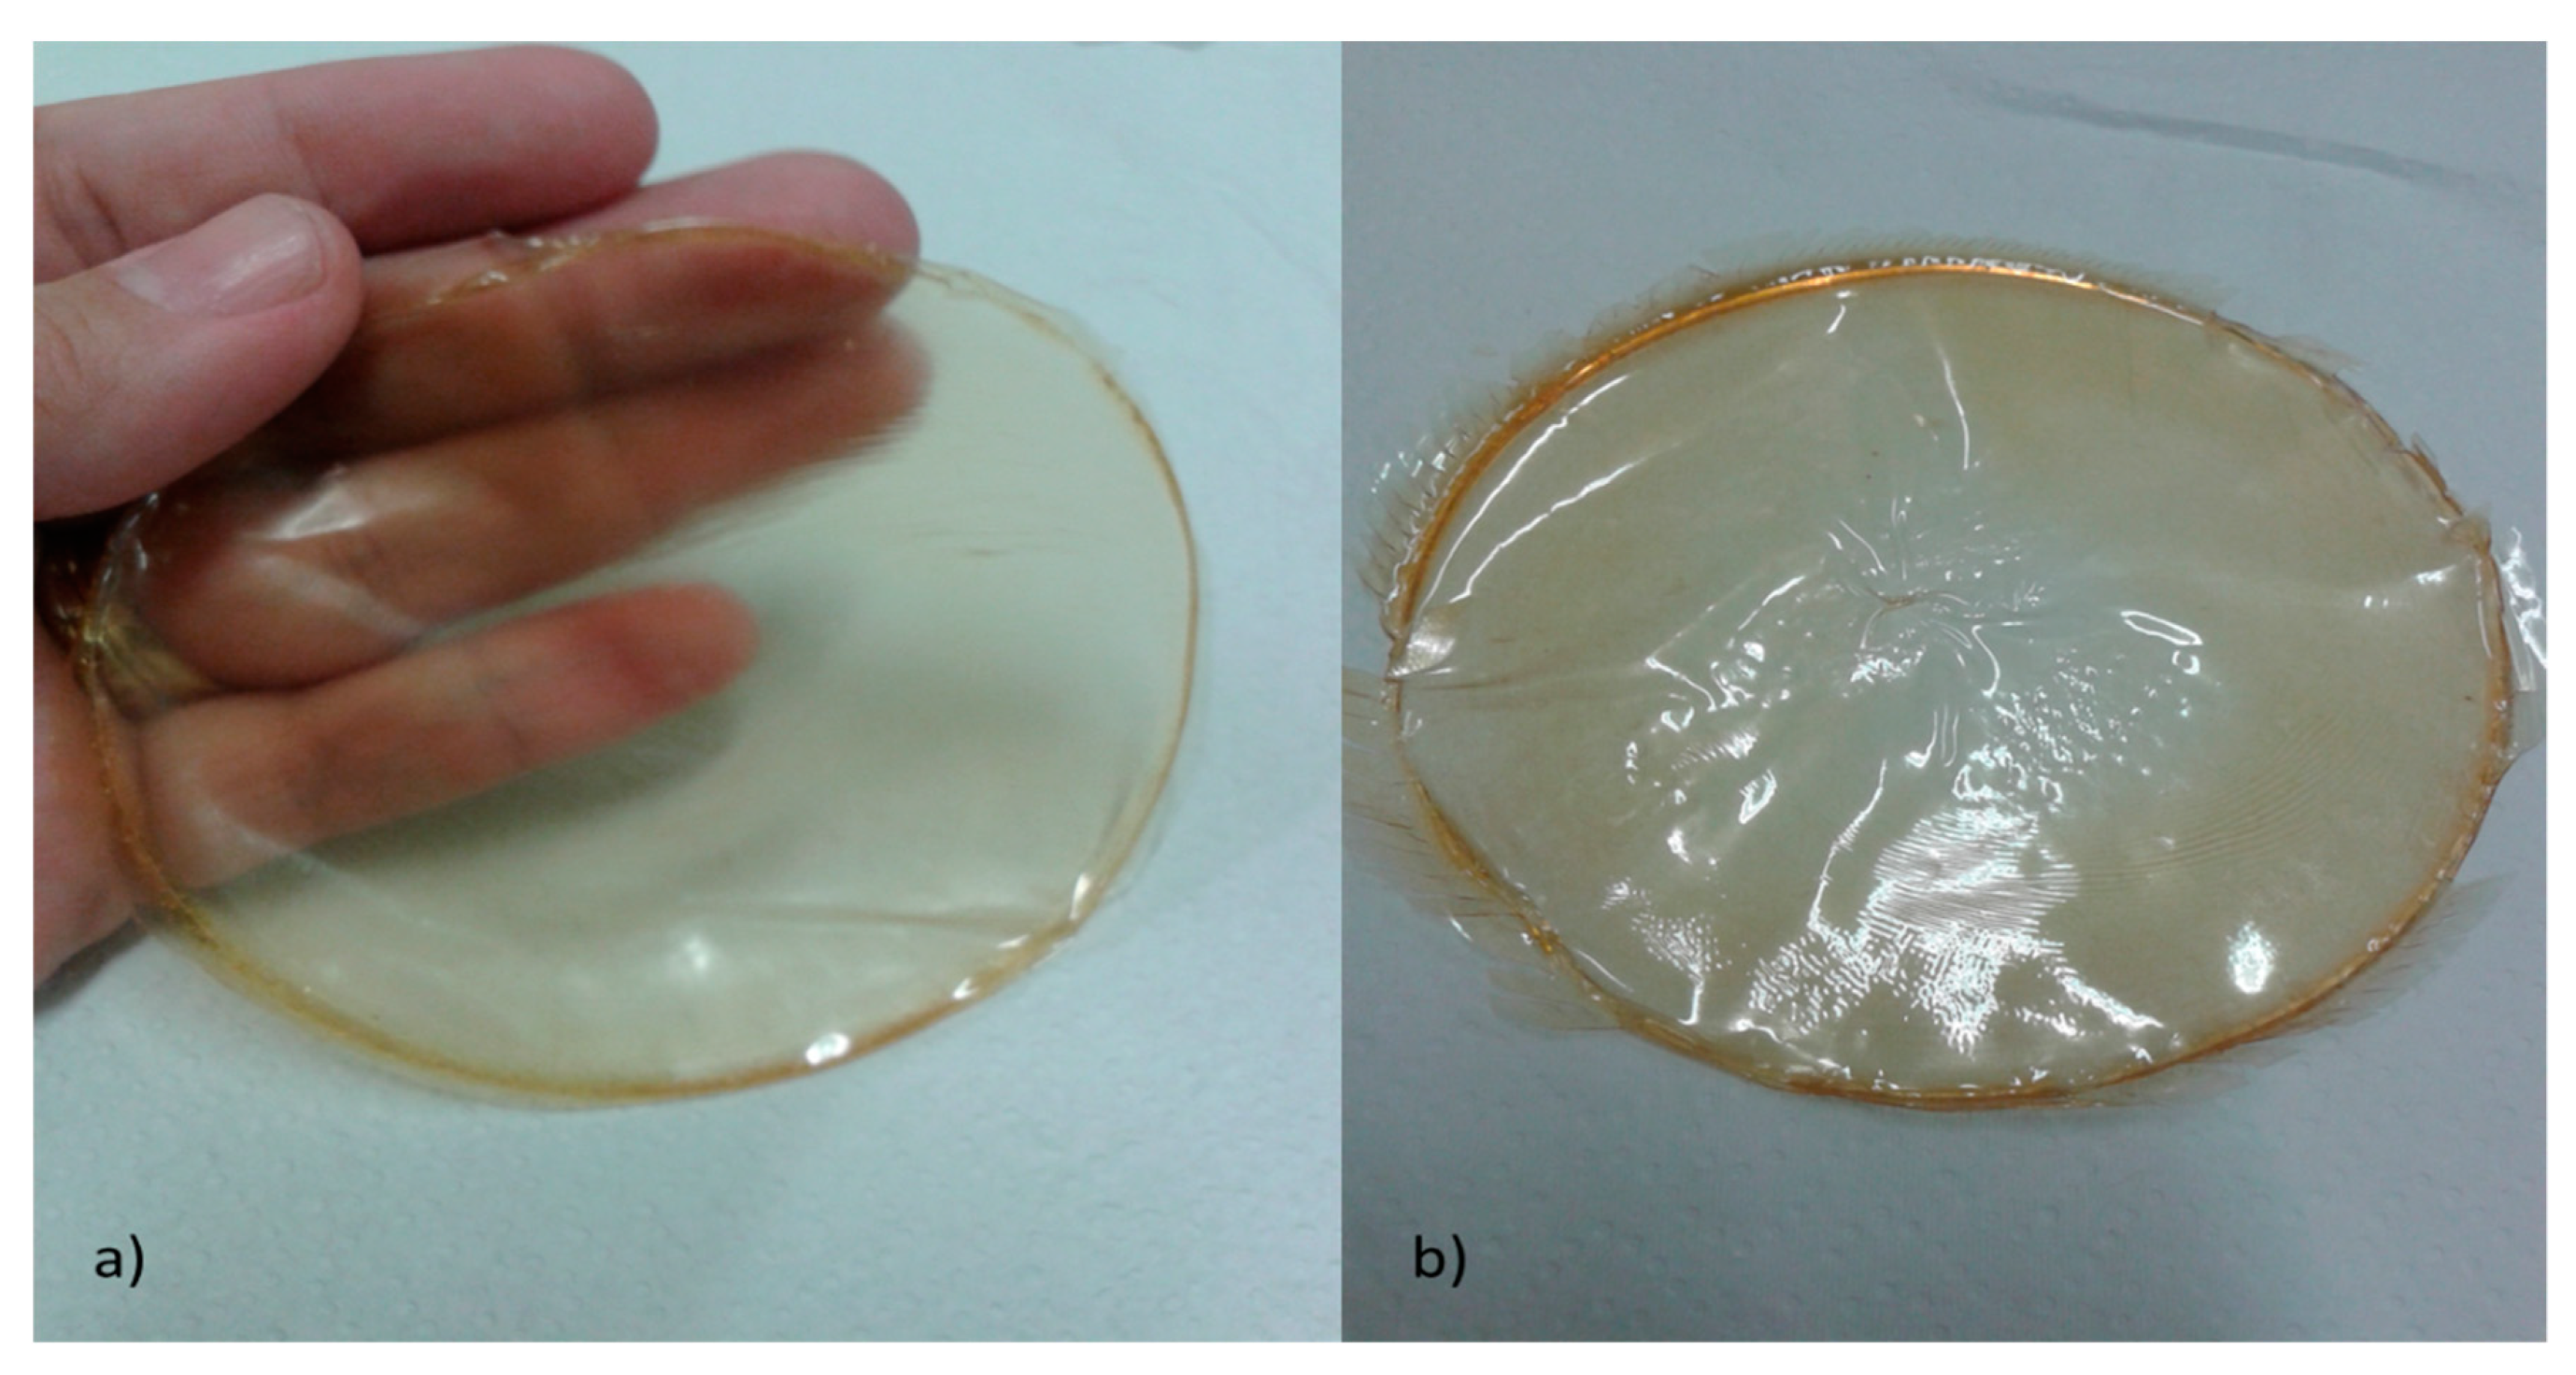
3.6. Biotherapeutic Collagen Films Properties
Table 10 shows that some organoleptic properties collected of biotherapeutic collagen from chicken feet. The films were completed with propylene glycol, and films made with glycerine showed pH, color, and odor, similar characteristics except the texture.
The biotherapeutic collagen film sample as shown in
Figure 7. From this, it can be observed that films A (prepared with glycerin) are softer and than film B (prepared with propylene glycol). The texture found in
Figure 7A showed similarities with texture of the latex used to make disposable gloves and condoms. However, the biotherapeutic collagen films prepared with propylene glycol (see
Figure 7B) proved to be more rustic and rougher, having a similar appearance with cellophane material.
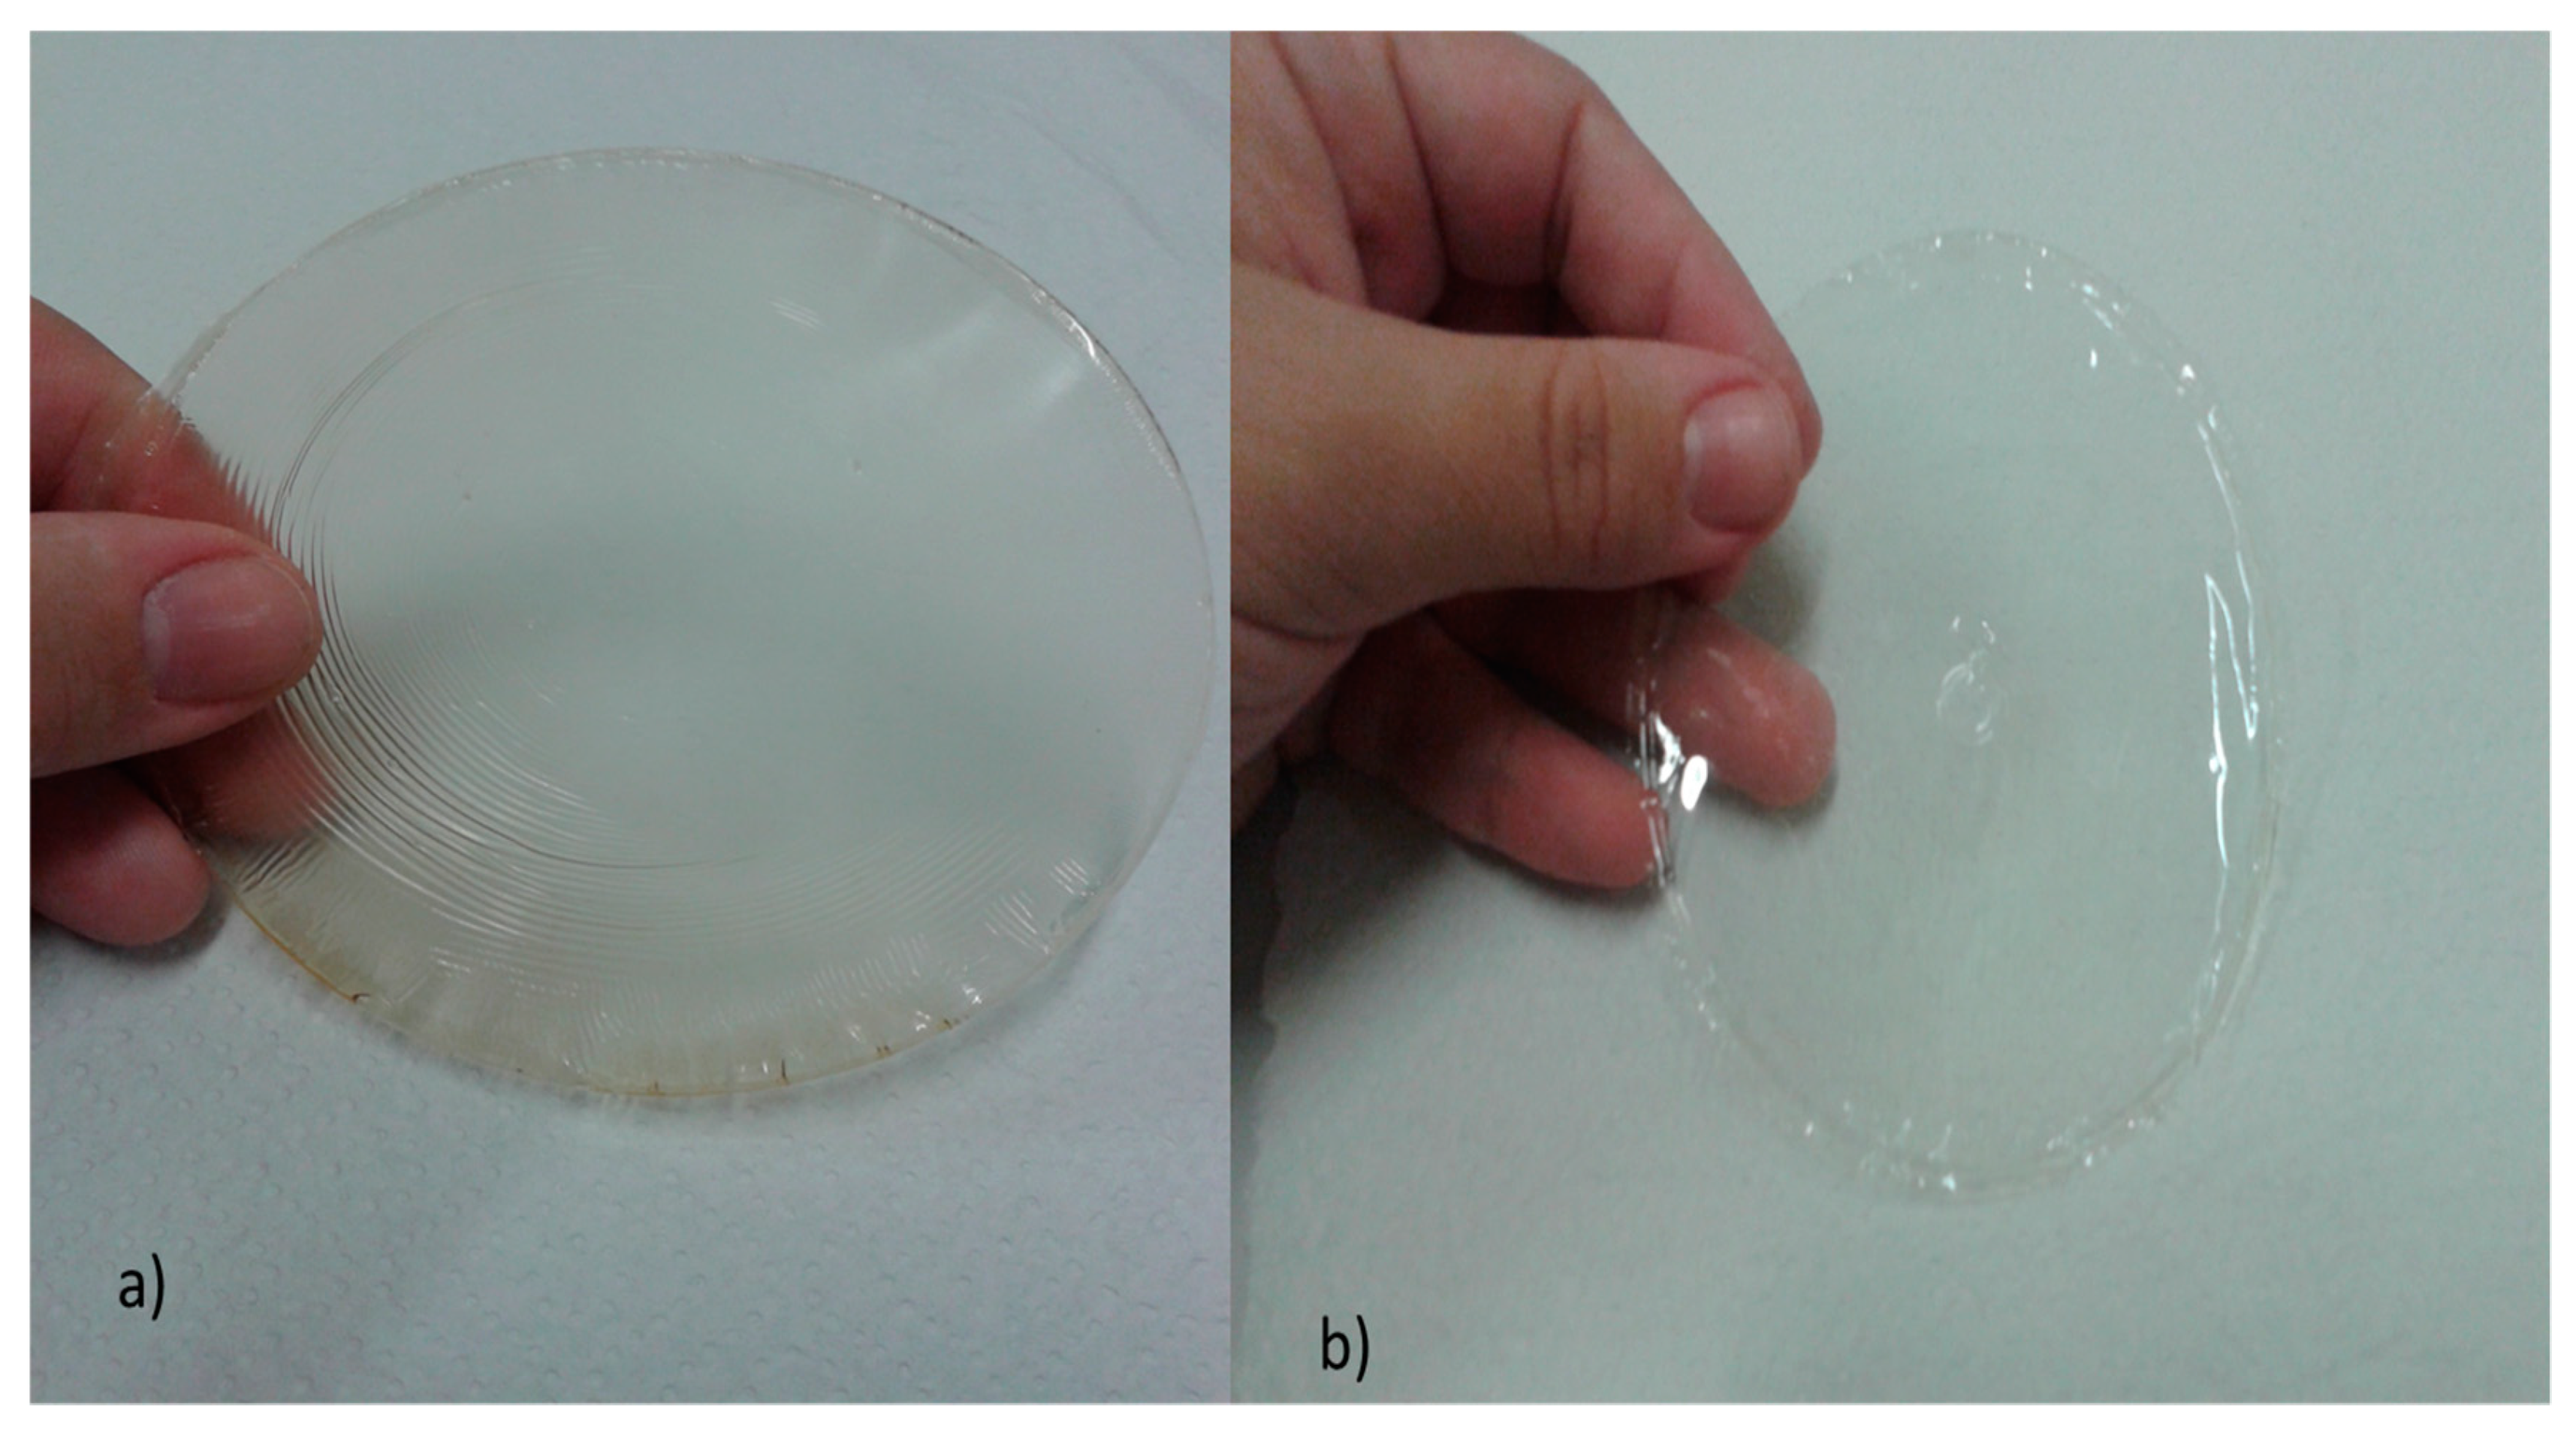
Additionally, for comparative interpretation, biotherapeutic collagen films from swine were produced using one sample with propylene glycol and another sample with glycerin, as are shown in
Figure 8. From this, it can be observed that the results were similar with those films produced from chicken feet, but the films from swine were odorless and lighter in color. In addition, comparative organoleptic characteristics of biotherapeutic collagen films from swine are shown in
Table 11.
3.7. Quality of Biotherapeutic Collagen Films from Chicken and Swine
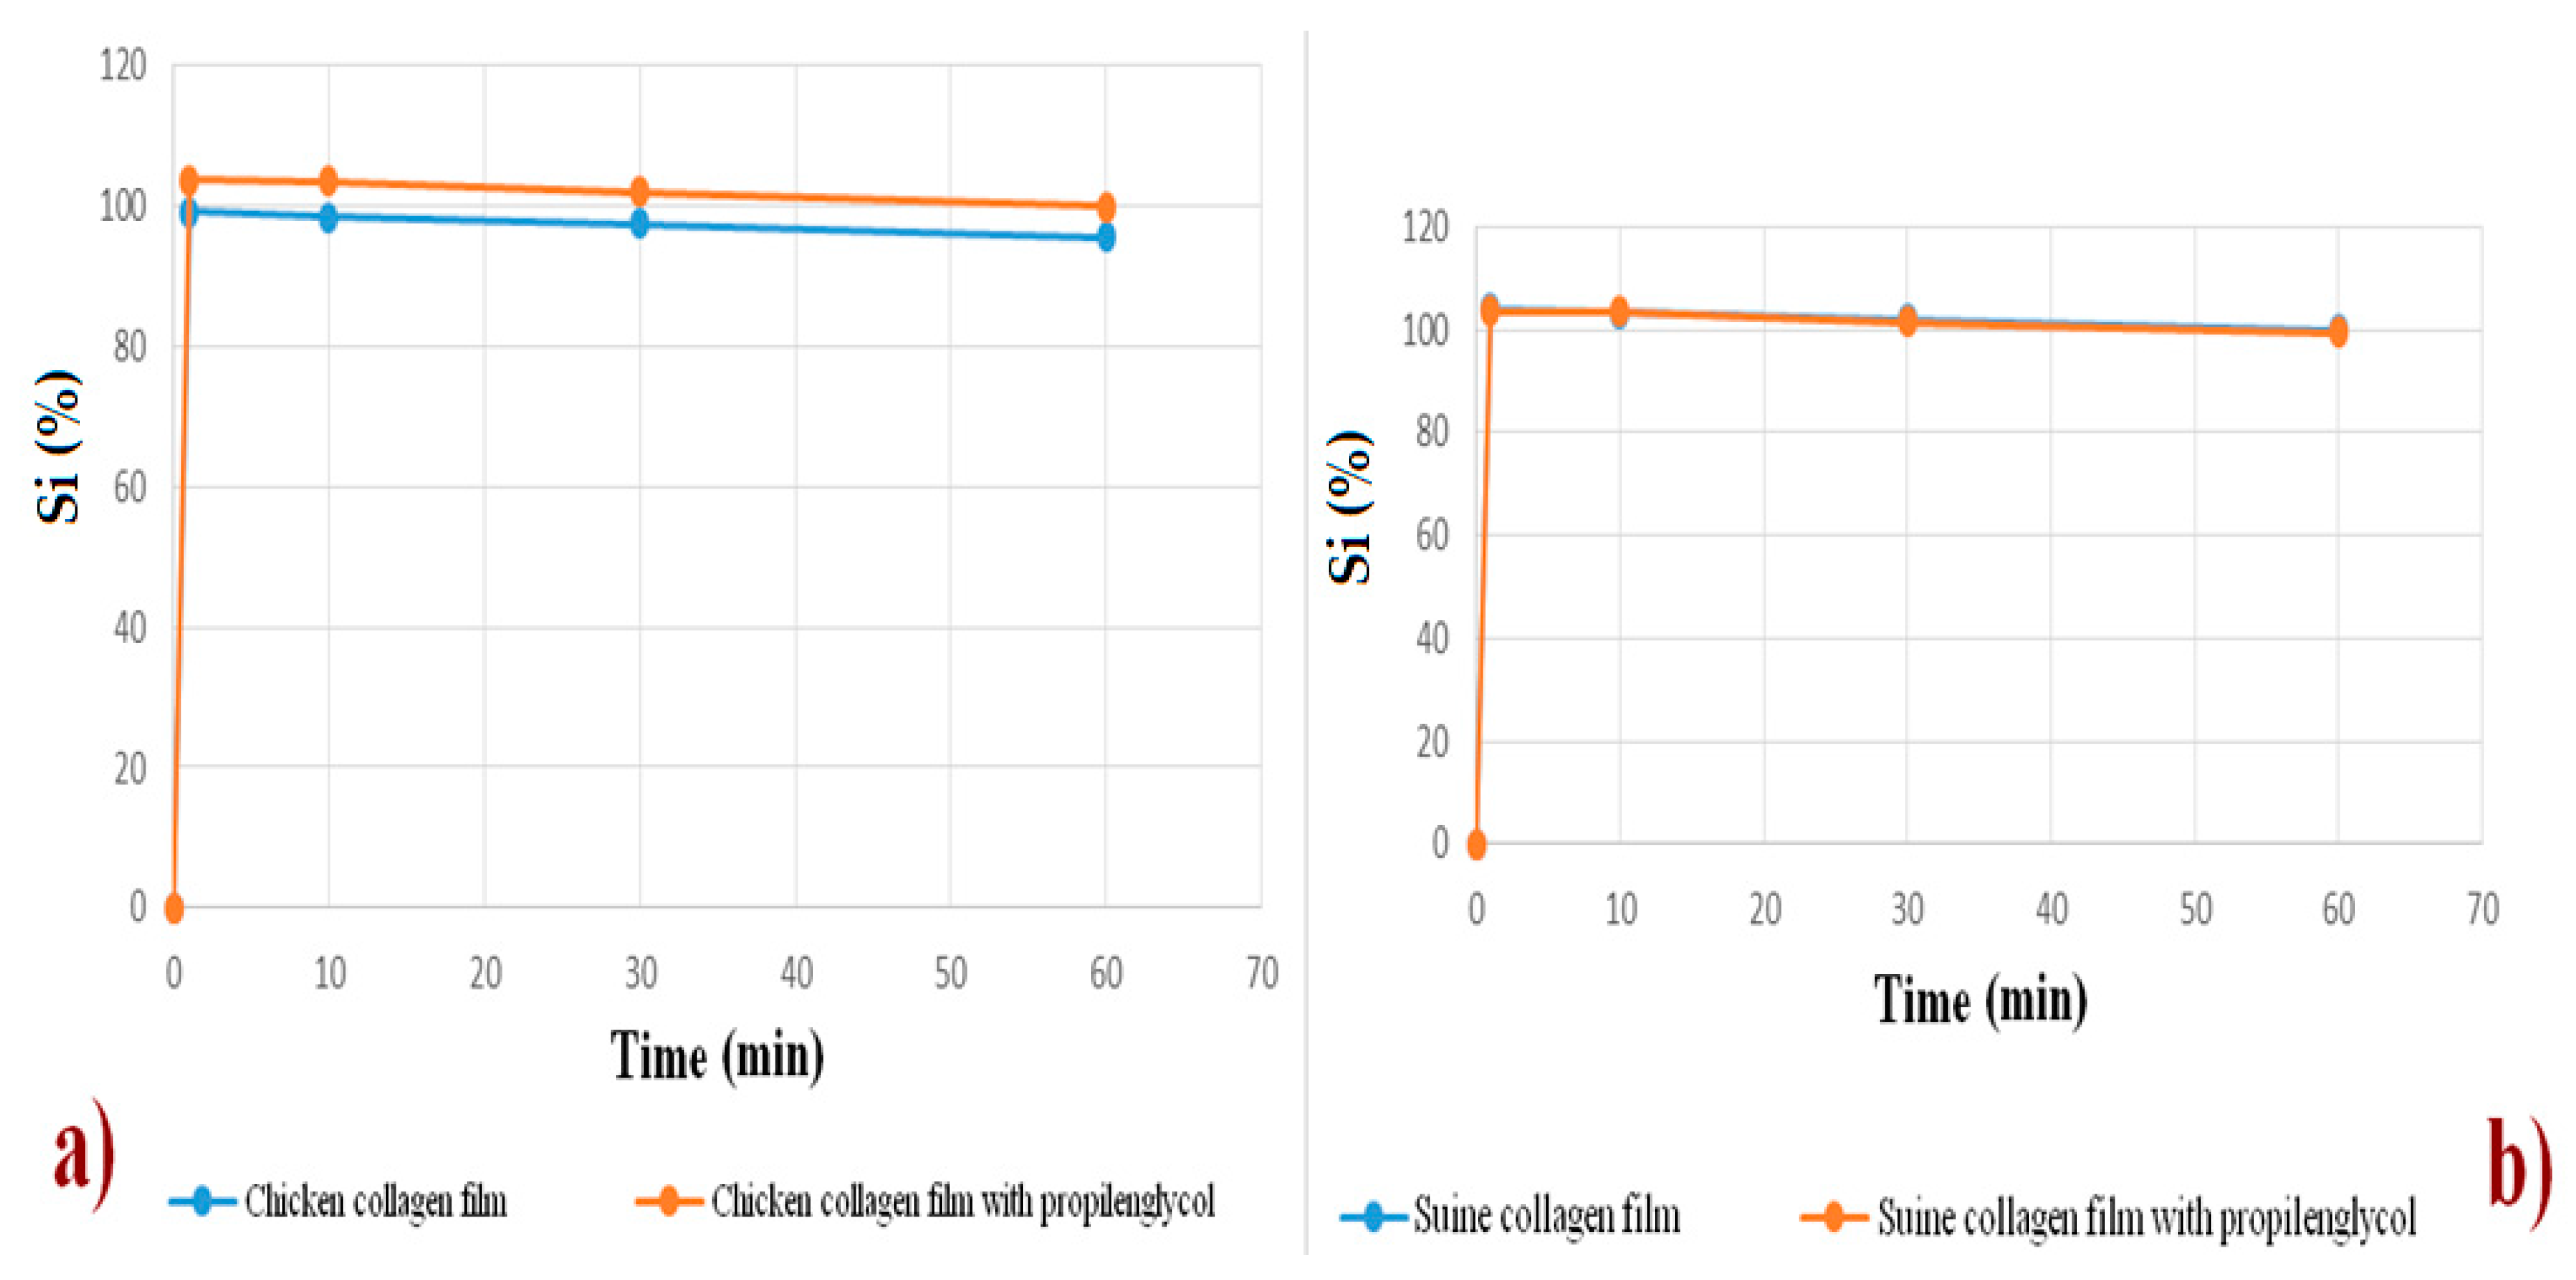
Swelling test allows checking and determining, in advance, the prospect of degradation, which is related to the degree of hydration of the system. These tests are important to verify the qualities and if the material has structural stability during the period necessary for the formation of the new regeneration tissue [
52]. Right after 1 min, both films’ formulations were swollen to 99% of weight, and this remained unchanged until 60 min. This showed that there was a low degradation of the films. Films swell very fast. Comparing
Figure 9a,b, it is noted that there is no difference between the collagen films of chicken feet and that of pig collagen. The swelling of the films is explained by its water absorption power, which is determined by the presence of hydrophilic groups and the high degree of crosslinking of the collagen microspheres [
4,
5].
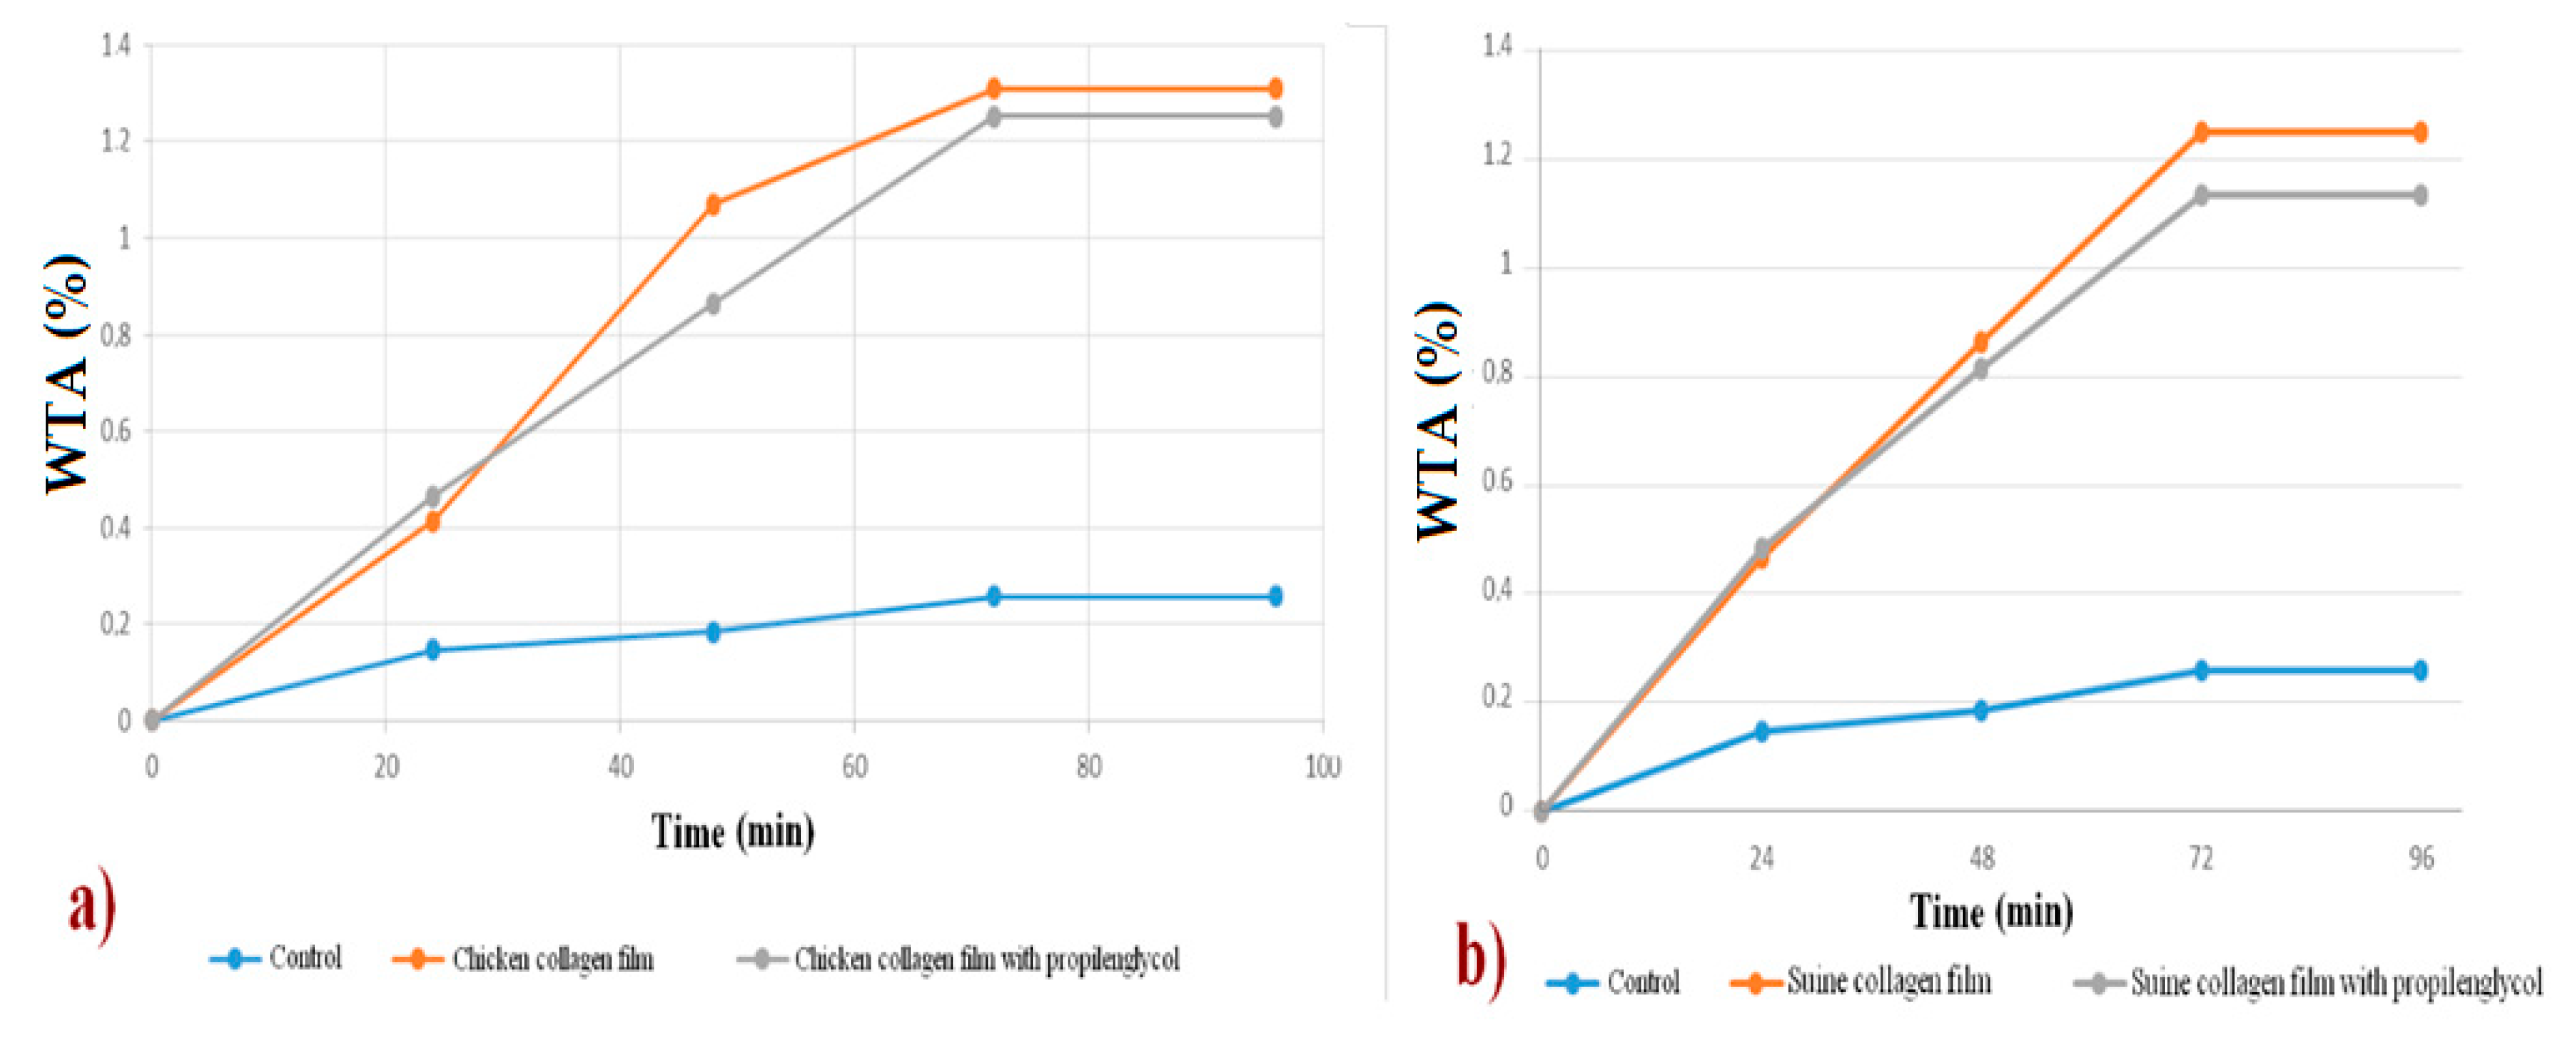
Water vapor transmission rate (
WVT) tests were performed on biofilms produced from collagen of chicken feet and swine collagen, both with the plasticizers: glycerin and propylene glycol. Results are shown in
Figure 10a,b. Regardless of the type of collagen and plasticizer used, all biofilms have similar results, with a satisfactory percentage of water vapor transmission, which allows its use as a biotherapeutic, since both allow similar transpiration to human skin.

 ,
, 


