Polyphenols from Red Vine Leaves Using Alternative Processing Techniques

Chair of Separation Science and Technology, TU Kaiserslautern, 67663 Kaiserslautern, Germany
*
Author to whom correspondence should be addressed.
Processes 2018, 6(12), 262; https://doi.org/10.3390/pr6120262
Submission received: 31 October 2018
/
Revised: 30 November 2018
/
Accepted: 10 December 2018
/
Published: 12 December 2018
(This article belongs to the Special Issue Microwave Applications in Chemical Engineering)
Abstract
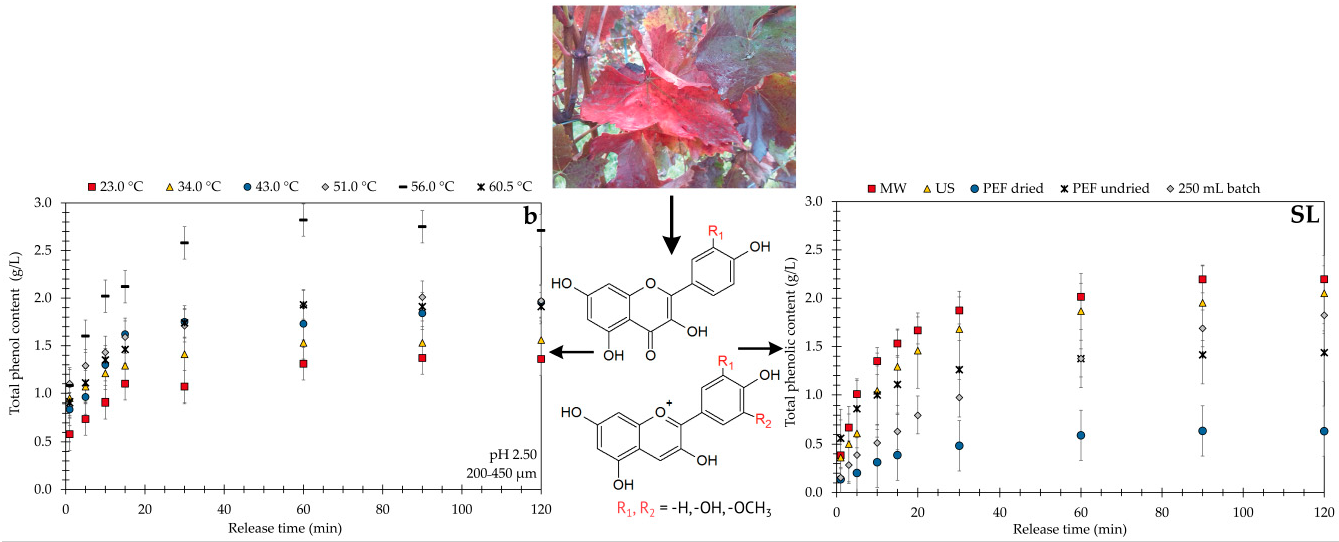
:The extraction kinetics of polyphenols, which are leached from red vine leaves, are studied and evaluated using a laboratory robot and nonconventional processing techniques such as ultrasonic (US)-, microwave (MW)-, and pulsed electric field (PEF)-assisted extraction processes. The robotic high-throughput screening reveals optimal extraction conditions at a pH value of 2.5, a temperature of 56 °C, and a solvent mixture of methanol:water:HCl of 50:49:1 v/v/v. Nonconventional processing techniques, such as MW- and US-assisted extraction, have the fastest kinetics and produce the highest polyphenol yield. The non-conventional techniques yield is 2.29 g/L (MW) resp. 2.47 g/L (US) for particles that range in size from 450 to 2000 µm and 2.20 g/L (MW) resp. 2.05 g/L (US) for particles that range from 2000 to 4000 µm. PEF has the lowest yield of polyphenols with 0.94 g/L (450–2000 µm), resp. 0.64 g/L (2000–4000 µm) in comparison to 1.82 g/L (2000 to 4000 µm) in a standard stirred vessel (50 °C). When undried red vine leaves (2000 to 4000 µm) are used the total phenol content is 1.44 g/L with PEF.

1. Introduction
Extracts from vitis vinifera (red vine leaves) are used in herbal medicine and can help to relieve symptoms related to chronic venous insufficiency, such as swollen legs (edema), varicose veins, a feeling of heaviness, pain, tiredness, itching, and tension [1,2]. Red vine leaf extract primarily consists of secondary plant substances with polyphenols as the most important ones, e.g., flavonols, anthocyanins, and resveratrol [3]. Polyphenols, which have the greatest potential as pharmaceutical drugs, are recovered from red vine leaves by leaching using appropriate solvents [2], like acidified water and methanol due to polarity and stability reasons [4]. In general, the solid–liquid extraction process is limited by the low yield of polyphenols and slow extraction kinetics, which is caused by the morphology of the plant material [5]. For example, 1 kg red vine leaves yield about 70 g polyphenols depending on the strain of vitis vinifera, climate and location where the strain is grown as well as the timing of the harvest.
The cell morphology of red vine leaves mainly influences the thermodynamic partition equilibrium in the solid–liquid extraction process as the localization of polyphenols is in the vacuoles surrounded by robust and stable cell membranes [5,6]. The diffusion and mass transfer of polyphenols can be enhanced and accelerated by alternative methods of natural plant extraction and process intensification that promote cell membrane disruption. The energy to disrupt plant cell membranes is provided by ultrasonic waves (US) [7,8,9], microwaves (MW) [10,11,12], or by the use of pulsed electric fields (PEF) [13,14,15,16,17]. US-assisted extraction generates turbulences and thermal effects promoting extraction, as well as production and growth of bubbles inside liquids causing cavitation leading to structural attacks [18]. Cavitation bubbles can implode near a solid surface as a microjet [19,20] breaking up plant cell membranes [21,22,23]. An alternative to improve efficiency of natural plant extraction processes is by applying MW [24,25,26]. The MW radiation penetrates the target plant material and interacts with polar molecules through ionic conduction and dipole rotation [27] to generate heat. Adsorption and penetration depth, which are dependent on the dielectric constant and the dielectric loss of the material [28], are determined by the frequency of the MW [29]. The MW radiation increases the local temperature leading to an increase of the internal pressure of plant cells. The plant cells are primarily comprised of a vacuole filled with intracellular water and secondary metabolites that consequently rupture under pressure [30] and promote kinetics [31]. The PEF-assisted technique is based on the electroporation phenomenon of the cell membranes, when a potential difference arises across a membrane [32,33]. During electroporation, molecular orientation takes place where the polar molecules align themselves with the electric field and migrate to the membrane induced by the electric field [34]. The electrocompression starts to rupture the membrane and creates pores [35]. This can result in a temporary (reversible) or permanent (irreversible) loss of membrane permeability [36,37]. The extent of the loss in permeability and the pore formation depends on the induction of a critical electric field strength and cell size in a range of 1–2 kV/cm for a plant cell size of 40 to 200 µm [38].
In general, a typical extraction setup consists of a batch stirred vessel with temperature control and has been widely applied in the industry [39]. Even though the set-up is ubiquitous, the optimum extraction conditions which maximizes solid-liquid extraction with minimal energy input and costs has not identified [40,41]. For identifying optimal conditions of a solid–liquid extraction, a laboratory robot provides a systematic and highly reproducible process development [42,43,44]. Temperature, pH value, and solvent composition influence not only extraction kinetics and pseudostationary equilibrium but also solubility and stability of the extracted secondary metabolites [45,46]. A robot workstation allows high-throughput experiments and saves time by permitting unattended overnight operation [47]. Additionally, solid–liquid extraction processing plants require an appropriate design reflecting the unique characteristics of any plant material, as the solute can be in root, leaf, fruit, etc. Thus, effective diffusivity is an important transport property to consider when designing mass transfer equipment and increasing the scale of the process [48]. The most widely accepted models used to describe the extraction kinetics are: Fick’s law of diffusion [49,50,51,52], the modified chemical kinetic equations [53,54,55], and the two-parametric empirical equations [56,57].
In this study, a custom-built laboratory robot is used to screen for the optimal conditions of a natural plant extraction process as temperature, pH value, and solvent composition are varied. For comparison, a standard stirred vessel experiment is used with alternative techniques, such as ultrasonification, microwaves or pulsed electric fields.
2. Materials and Methods
2.1. Preparation of Red Vine Leaves and Chemicals
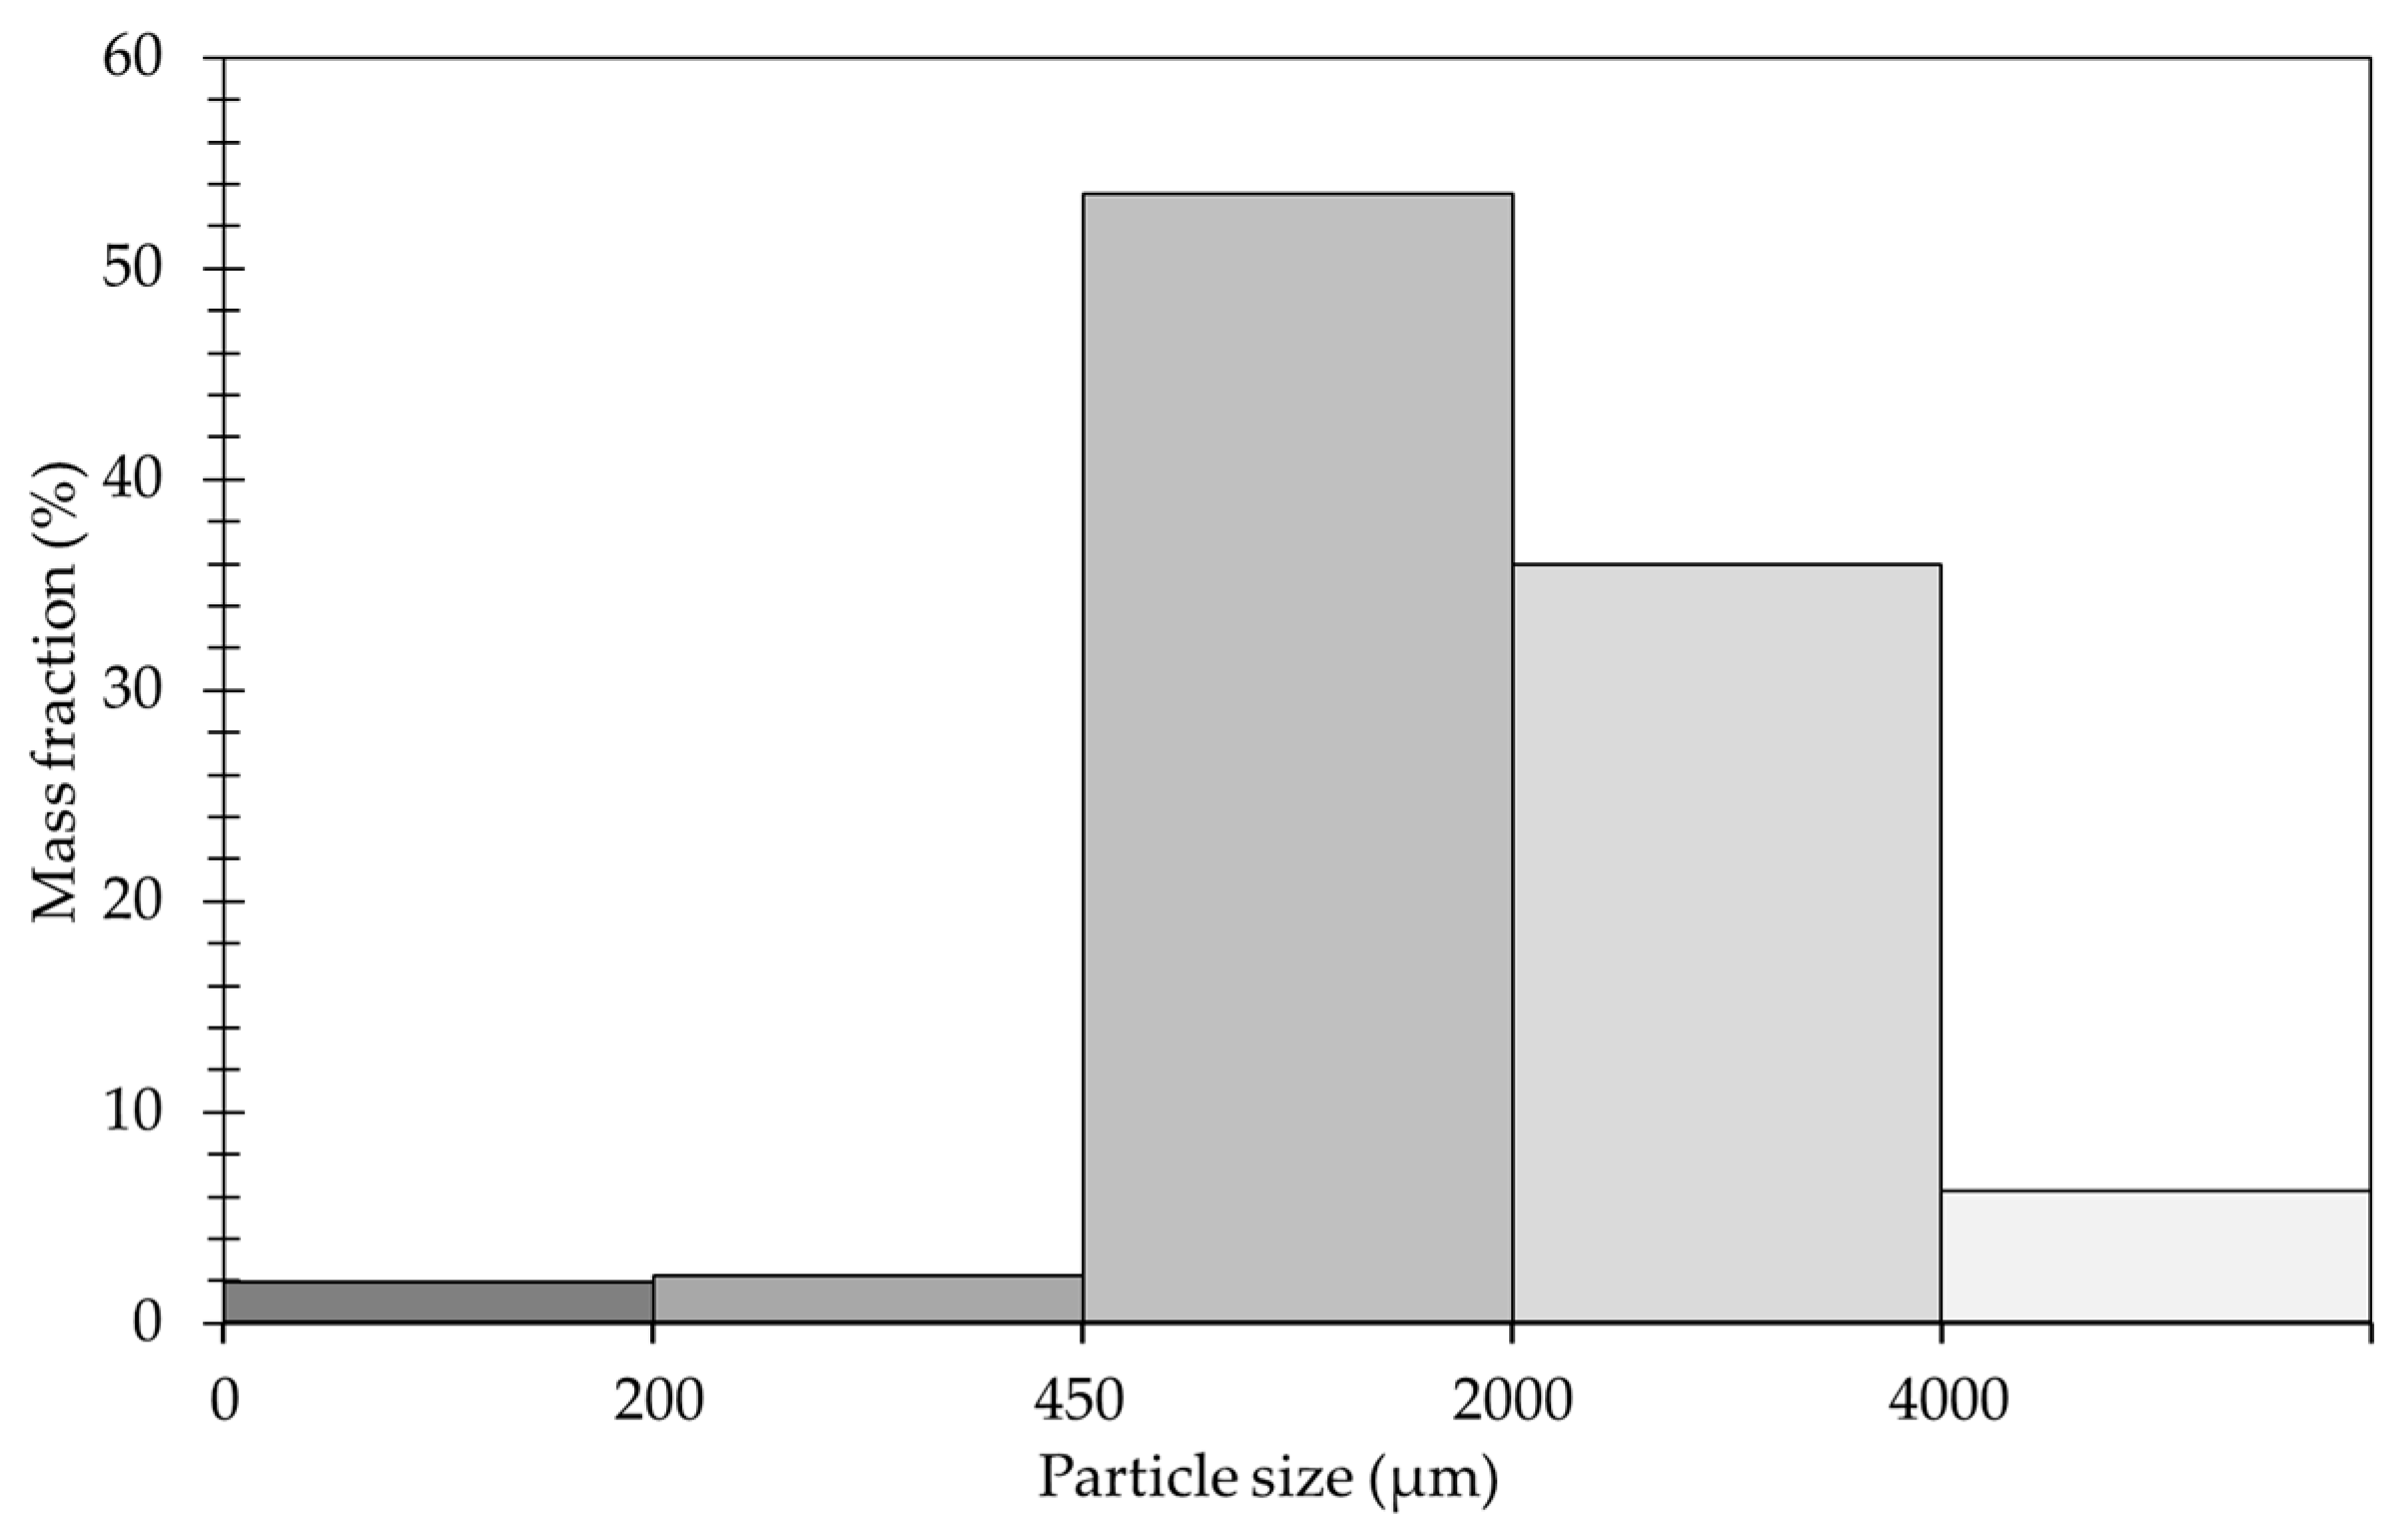
Red vine leaves (Vitis vinifera, DAKAPO GN7225-8 Deckrot x Portugieser Börner) were collected on 3 October 2014 in Geisenheim (RP), Germany, and dried at 75 °C for 48 h (UT6120, Heraeus Holding GmbH, Hanau, Germany). After drying, the red vine leaves were manually ground in a mortar using a pestle. The bruised red vine leaf powder was sieved into 3 fractions by riddle screens (Analysette 3 PRO, Frisch GmbH, Idar-Oberstein, Germany) with 200 µm, 450 µm, 2000 µm, and 4000 µm mesh sizes. Furthermore, the bulk densities were determined by filling a 10 mL measuring cylinder (Brand GmbH & Co KG, Wertheim, Germany) with 5 mL the red vine leaves and the filled measuring cylinder was weighed using an analytical balance (1702, Sartorius AG, Göttingen, Germany). The particle size distribution is displayed in Figure 1 and further details are given in Table 1. For measurements with undried red vine leaves a part of the collection was stored in a freezer (GS26DN11, Siemens AG, München, Germany) at a temperature of −18 °C. After defrosting, the red vine leaves were cut into 2 to 4 mm pieces by a scalpel. To maintain comparability with the dried red vine leaves the moisture content was calculated by weighing the undried red vine leaves and reweighing these red vine leaves after drying. The loss of water averaged 72.7 ± 3.7% in the course of 5 experiments.
The solvents were deionized water (0.01 µS/cm) mixed with hydrochloric acid (35–38%, CHEMSOLUTE®, Th. Geyer GmbH & Co. KG, Renningen, Germany) at pH values of 1.21, 1.53, 2.00, 2.50, and 3.00 and pure methanol (≥99.9%, Sigma-Aldrich, St. Louis, MO, USA). The pH value was measured with a pH meter (pH 526, WTW, Weilheim, Germany).
2.2. Folin–Ciocalteu Assay
Concentration measurement was done by UV/Vis spectrometry (UV-mini 1240, Shimadzu Corporation, Kyōto, Japan). The Folin–Ciocalteu assay was performed as described in detail in [58] using Folin–Ciocalteu reagent (Merck KGaA, Darmstadt, Germany) and Na2CO3 (Bernd Kraft GmbH, Duisburg, Germany).
2.3. Extraction Apparatus
Each extraction measurement was repeated 3 to 5 times and the ratio of red vine leaves to extractant was set to 40 g/L. In detail, the weighed portions and the volumes of the solvents are given in Table 1. In order to determine the optimal extraction conditions and partition equilibria, a custom-built laboratory robot (Lissy 4G200, Zinsser Analytic GmbH, Eschborn, Germany) and red vine leaves with particle size of 200 to 450 µm were used. In 8 vials red vine leave powder is suspended and shaken in time intervals of t = 1, 5, 10, 15, 30, 60, 90, and 120 min. The regulated thermostat temperatures of 25 °C, 35 °C, 45 °C, 55 °C, 60 °C, and 65 °C yielded temperatures in the extraction vials of 23.0 °C, 34.0 °C, 43.0 °C, 51.0 °C, 56.0 °C, and 60.5 °C, respectively. After agitation with a shaking rate of samples were taken and filtered using a mesh size of 1 µm (7700-9905, Whatman plc, Little Chalfont, UK). Details of the laboratory robot and its handling is described in detail in [42].
For comparison an 1 L jacketed tank held at 50 °C was used. The 1 L jacketed tank is equipped with a propeller mixer adjusted to and a metal mesh cage that retains the dried red vine leaves (2000 to 4000 µm) when using a solvent volume of 250 mL.
2.4. Alternative Extraction Techniques
For the alternative extraction techniques, red vine leaves with particle sizes of 450 to 2000 µm (size small, SS) and 2000 to 4000 µm (size large, SL) were used. Additionally, the temperature of the extraction slurry was measured with a PT100 probe when a sample was removed for the UV/Vis analysis (UV-mini 1240, Shimadzu Corporation, Kyōto, Japan).
The microwave assisted extraction (MW) was performed in a microwave oven (MW 4000, Landgraf Laborsysteme HLL GmbH, Langenhagen, Germany) using a 50 mL vessel containing a stirring bar and an immersed PT100 probe and operates at (100%). For temperature control of the extraction batch vessel (50 °C or 60 °C) the immersed PT100 controller is connected to a two-level controller, which regulates the power of the microwave.
The ultrasonic-assisted extraction (US) was executed using an ultrasonic probe (Bioblock Scientific Vibra Cell VC 750, Standard Probe ½”, Thermo Fisher Scientific Inc., Waltham, MA, USA) at a frequency of 20 kHz. The ultrasonic probe was dipped in a stirred 150 mL jacketed tank and the maximum amplitude (114 µm) was reduced to 30% (34.2 µm) or 40% (45.2 µm). During 120 min of application the US probe generates and of energy at 30% and at 40% of the maximal amplitude, respectively. With the energy input is correlated to an effective power of , respectively .
For the pulsed electric field assisted extraction (PEF) the setup consists of a high voltage generator (610C, Trek Inc., Lockport, NY, USA), an impulse generator (8035, Hameg Instruments GmbH, Mainhausen, Germany), a Schmitt trigger circuit, a high voltage switch, an oscilloscope (D1010, Siemens AG, München, Germany), and 2 plate electrodes (1.4301). Plate electrodes with a separation distance of 0.42 cm and a surface of 6 cm2 were located in a 20 mL mixed glass beaker. The pulsed electric field setup generates monopolar exponential pulses for a duration of with intervals between pulses. The voltage was set to or and using the setup generates an electric field strength of 3.33 kV/cm or 1.67 kV/cm, respectively. The electrical power is given by where the current is calculated by Ohm’s law and the electric resistance is defined by . The conductivity was measured after 120 min application time with a conductivity electrode (Seven2GoTM S3, Mettler-Toledo, Columbus, OH, USA) giving for , resp. for . The resulting effective power is , respectively . Using undried red vine leaves the PEF assisted extraction process was executed with a voltage of , a conductivity of and an electric power of .
2.5. Mass Transfer
Fick’s law is used to describe the mass transfer and several simplifications have been made to enable the comparison of different techniques. The diffusion of the polyphenols is not hindered by other components and there is only one pseudo-solute (gallic acid [59,60]) diffusing. It is assumed that the dispersed solid material is an assembly of spherical particles of the same size with radius r and bulk density [61]. The volume of the red vine leaves is then related to their surface area and to their total mass :
A decrease in the thickness of the diffusion layer, which surrounds each particle, as stirring increases, is neglected. Thus, the flux is equal to the amount of polyphenols entering the bulk solution in unit time . The mass transfer from the beginning until equilibrium is analyzed from experimental data. Thus, the flux is given by
where is the diffusion coefficient, is the volume of the bulk, and is the difference of the polyphenol concentrations at the center and at the periphery of a given particle, considering the to ratio:
where is the equilibrium concentration and the mass of the bulk liquid resp. of ms of the solid. With Equation (3), when knowing both masses and the equilibrium concentration, the initial (pseudo)polyphenol content in the particle can be calculated. For calculating the effective diffusion coefficient according to Equation (2), all data are given in Table 1. The mass of the bulk is given by
where and are the mass percentage of water and methanol, neglecting the amount of HCl. The amounts of water and methanol are defined by the density [62] and the volume .
3. Results and Discussion
3.1. Laboratory Robot
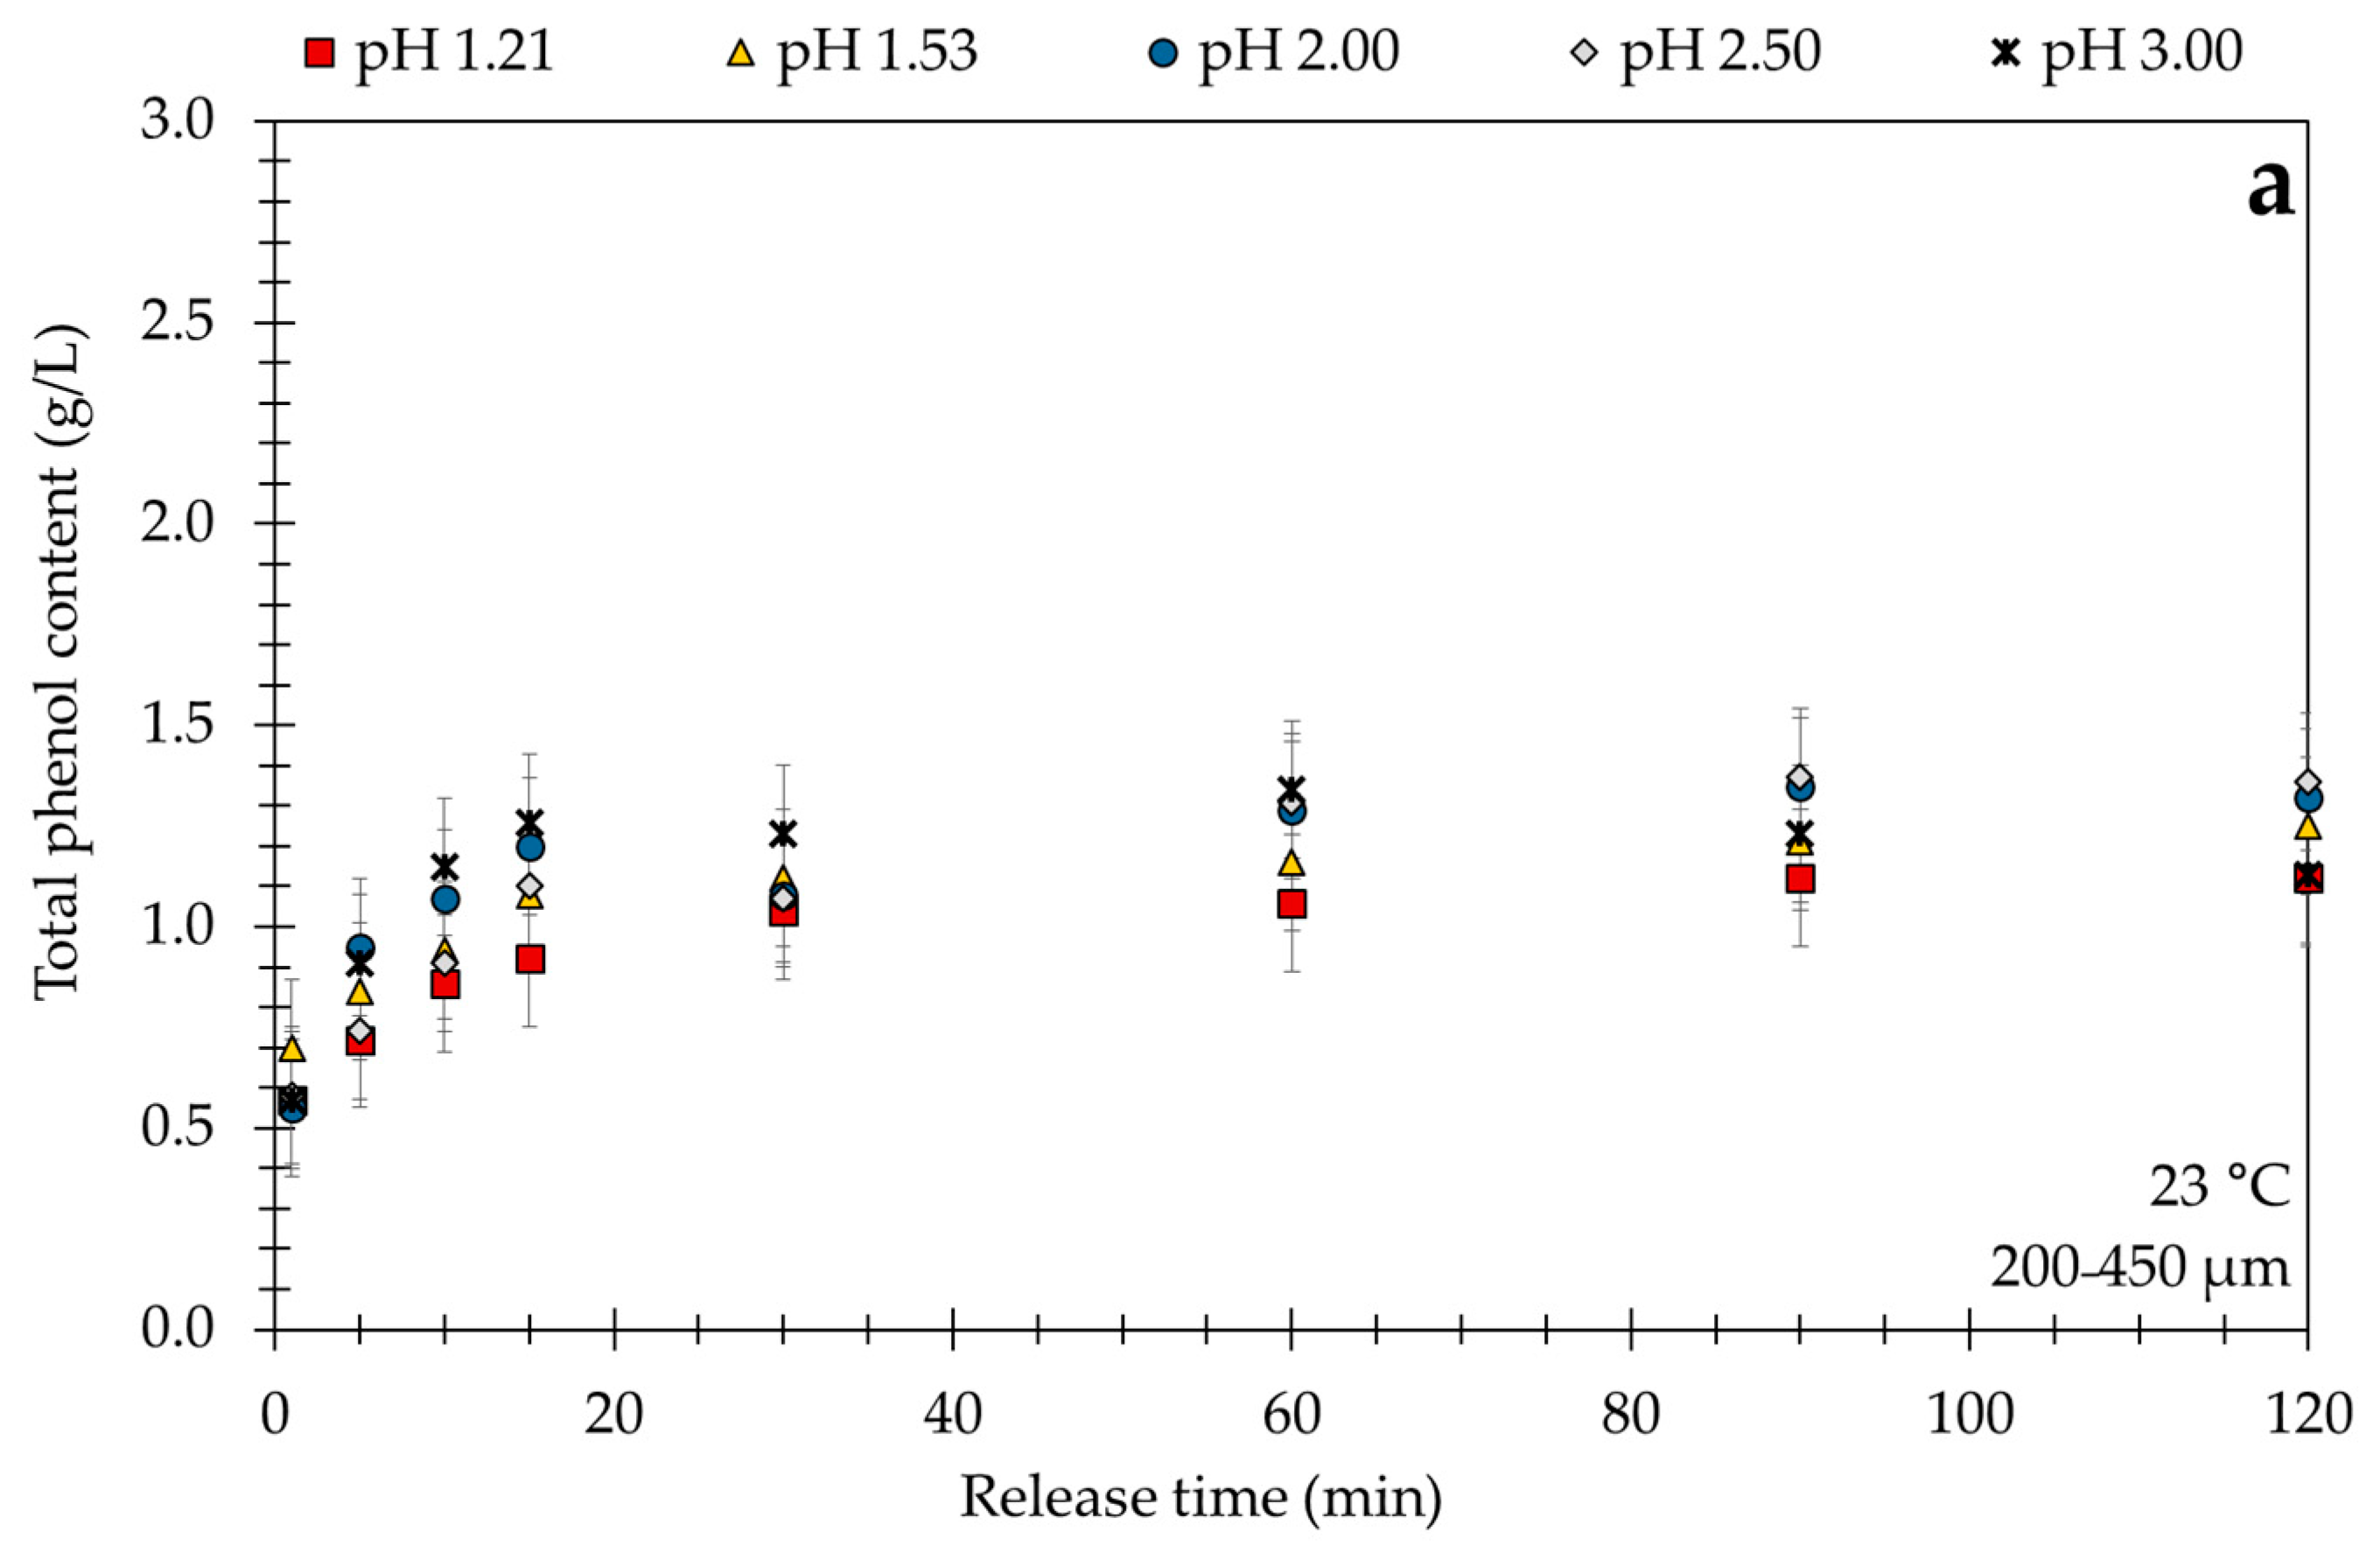
The laboratory robot high throughput system was used for robust and stable screening for a particle size of 200 to 450 µm (SS). Single parameter variation in respect to temperature and the composition of the solvent was performed and results of solute release are shown in Figure 2.
The study of Fossen et al. [63] revealed that pH values between 1.0 and 3.0 are most effective for the stability of anthocyanins, which are, like the flavonoids, a subgroup of polyphenols. Based on these results at 23 °C the pH values of 1.21, 1.53, 2.00, 2.50, and 3.00 were selected. Higher pH values were not applied due to the instability of polyphenols at higher pH values. As seen in Figure 2a, all leaching curves are very similar and acidity does not influence the extraction process significantly. The pseudo-equilibrium concentration is between and as shown in Table 2. The effective diffusion coefficient according to Equation (2) ranges from to , as the highest value of the effective diffusion coefficient was observed at a . However, after 60 min the total polyphenol content gradually decreases from to . This slight decrease indicates that the polyphenols at this condition are becoming unstable and are beginning to degrade. Türker et al. [64] investigated the extraction of anthocyanins from carrots and confirmed the lower stability at a pH value of 3.00 and higher stability at a pH value of 2.00. Due to these results and given the conditions producing related to the highest extraction yield of a pH value of 2.50 was chosen for further measurements.
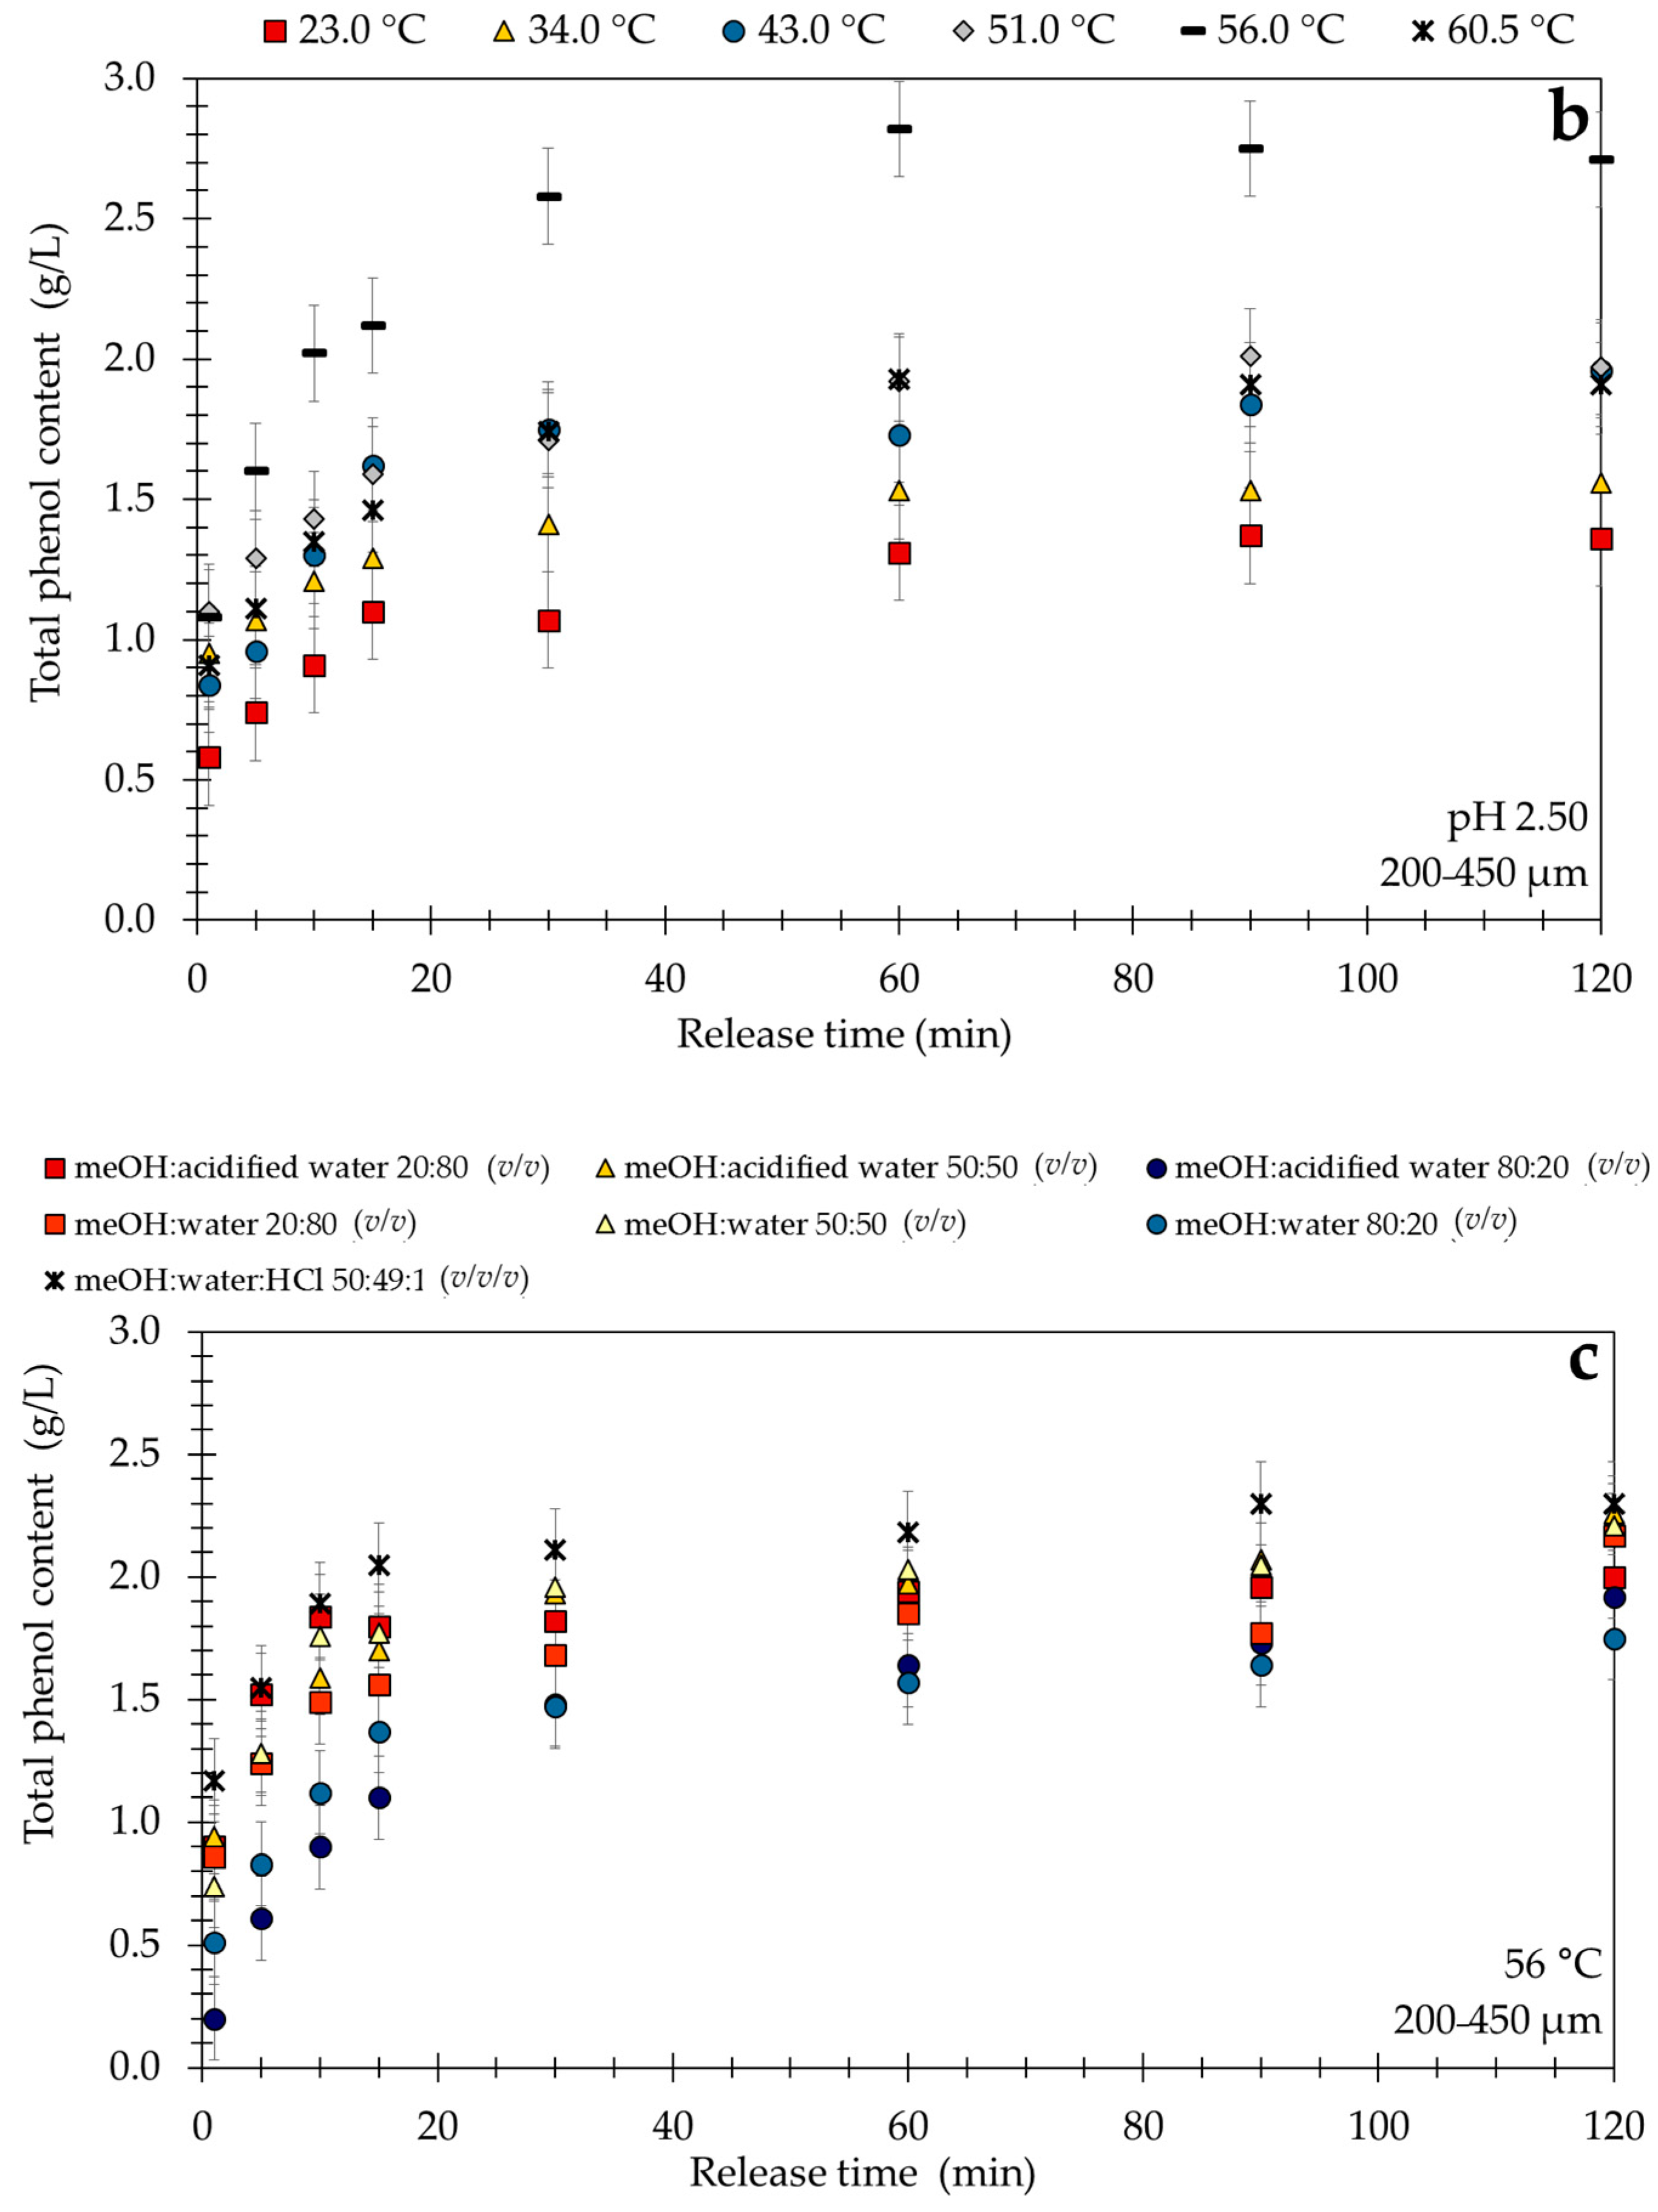
In contrast to pH value, a varying the extraction temperature from 23.0 °C to 60.5 °C most significantly effects the yield of polyphenols as shown in Figure 2b. According to Table 3, the highest concentration of polyphenols of was found at a temperature of 56 °C after 120 min. extraction time with acidified water at a pH = 2.50 with temperature steadily increased from 23.0 °C to 56.0 °C. Generally, it can be concluded that increasing temperature enhances the extraction efficiency, a conclusion supported by the study of Franco et al. [65]. They investigated the extraction of polyphenols from grape marc using water at temperatures of 25 °C and 50 °C and found that at 50 °C the yield is 80% higher than at 25 °C after 90 min of extraction, what is similar to our findings. Nevertheless, there is a temperature limit, which can be seen with the curve at . At this highest temperature, degradation starts already immediately in the plant material leading to reduced yields.
In Figure 2c various solvent combinations of methanol and deionized water, at different acidities, were applied because these solvent mixtures have proven to be efficient for extraction of polyphenols [66,67,68,69]. In that respect combinations of (v/v) methanol and deionized water of 20:80, 50:50, and 80:20; methanol and acidified water at a pH value of 2.50 with a (v/v) of 20:80, 50:50, and 80:20; and methanol:water:HCl with a (v/v/v) of 50:49:1 at 56.0 °C were applied and the data are given in Table 4. The highest total phenol content was produced by the combinations methanol: acidified water 50:50 (v/v) and methanol:water:HCl (50:49:1 v/v/v) directly followed by the combination methanol:water 50:50 with total phenol content . When admixing methanol with water, the pH value does not markedly influence the content of polyphenols similar to the screening results in Figure 2a. Generally, increasing the methanol:water ratio to 80:20 reduces the pseudo-equilibrium concentration of polyphenols and thus the extraction capacity. The extraction process at , which is very close to the boiling point of methanol, requires a closed extraction vessel to avoid methanol loss due to evaporation. Furthermore, the pseudostationary equilibrium is reached very quickly for methanol:water 80:20 (v/v) and methanol:acidified water 80:20 (v/v), which is supported by the highest effective diffusion coefficients of and , respectively.
In summary, unlike temperature increases or methanol admixtures, variations in acidity do not influence the extraction kinetics. Here the extraction temperature of approximately 56.0 °C gives the best yield with acidified water and the combination methanol:water 80:20 (v/v) shows the highest effective diffusion coefficient similar to the results with acidified water at pH = 3.0. The study of Kähkönen et al. [70] confirms that hot water yields the highest polyphenol content and admixtures of organic solvents can be harmful as the extract composition may change [70]. Furthermore, the study of Ju et al. [71] shows a similar outcome to water acidified with HCl () and acidified methanol solution () indicating similar efficiency for extraction of anthocyanins from grape skin.
3.2. Nonconventional Processing Techniques
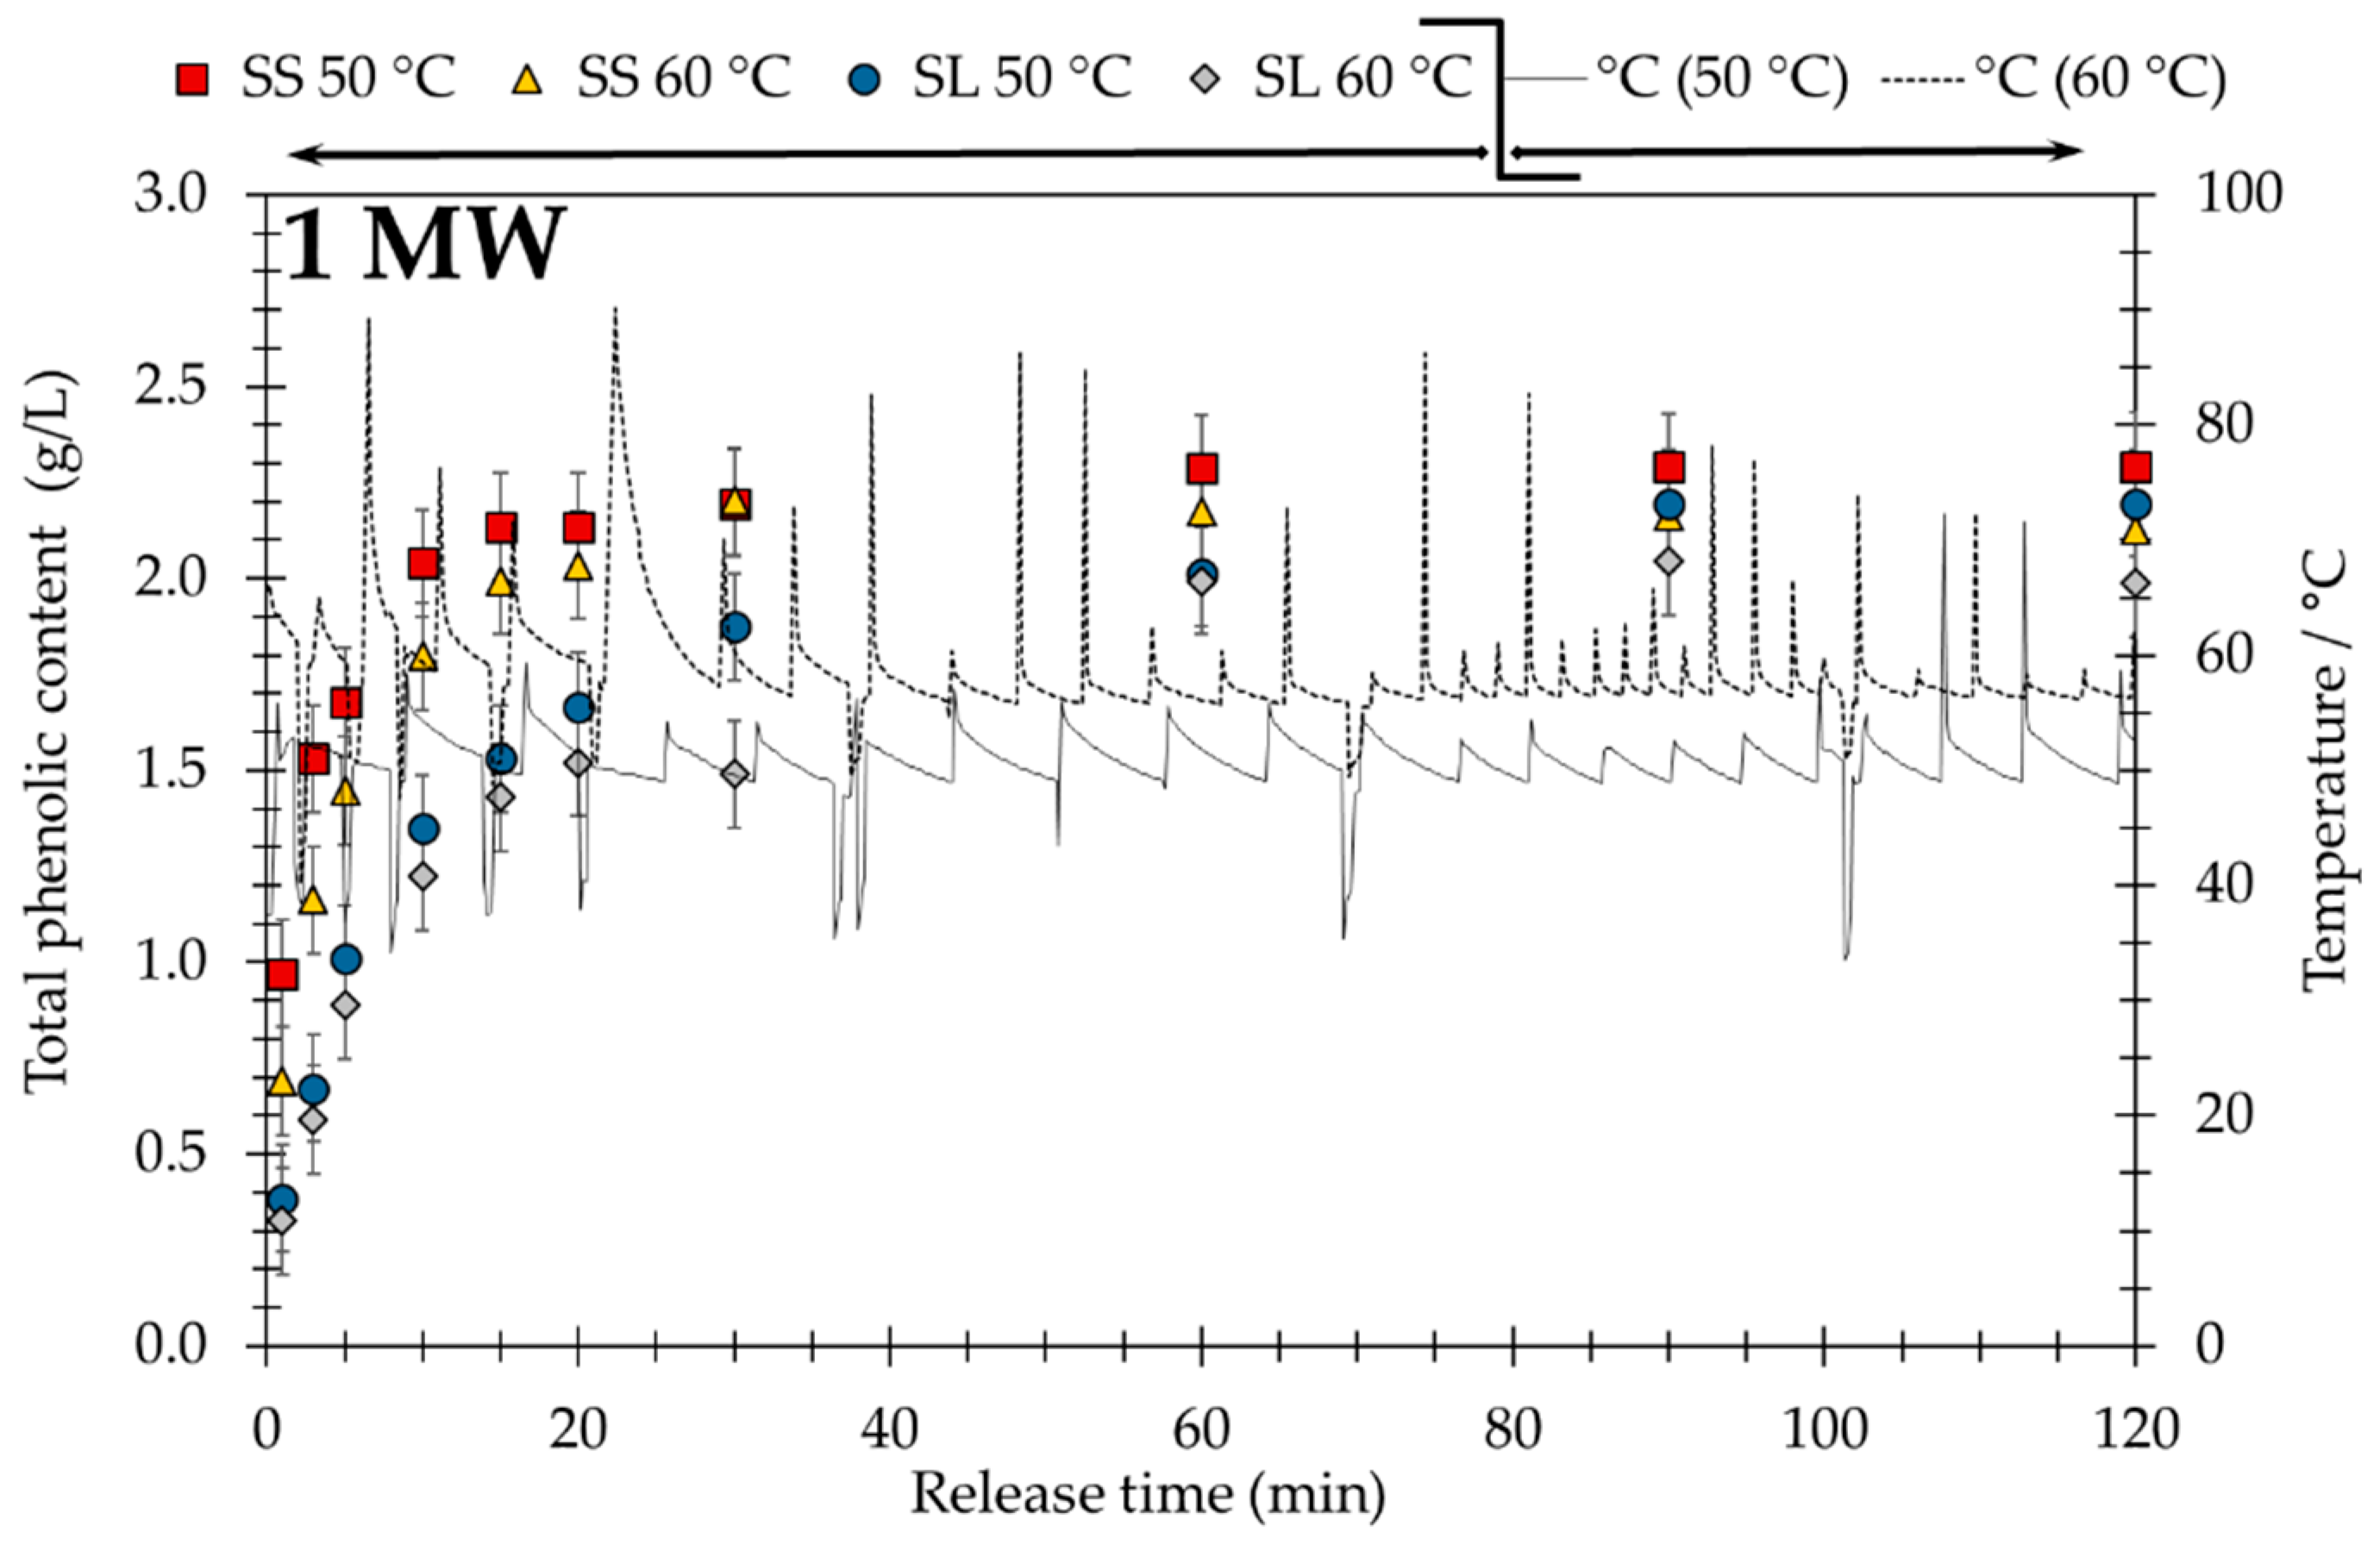
Based on the screening results the two different samples (SS and SL) were extracted in the microwave oven (MW) at 50 °C and 60 °C. Figure 3 (1 MW) depicts the extraction kinetics (the total phenol content on left axis) and measured temperature (right axis) during 120 min application time as full and dash lines. The results are in line with the laboratory robot results at 50 °C or 60 °C, and the short overshooting of the two-level controller (energy input of gives no obvious performance loss.
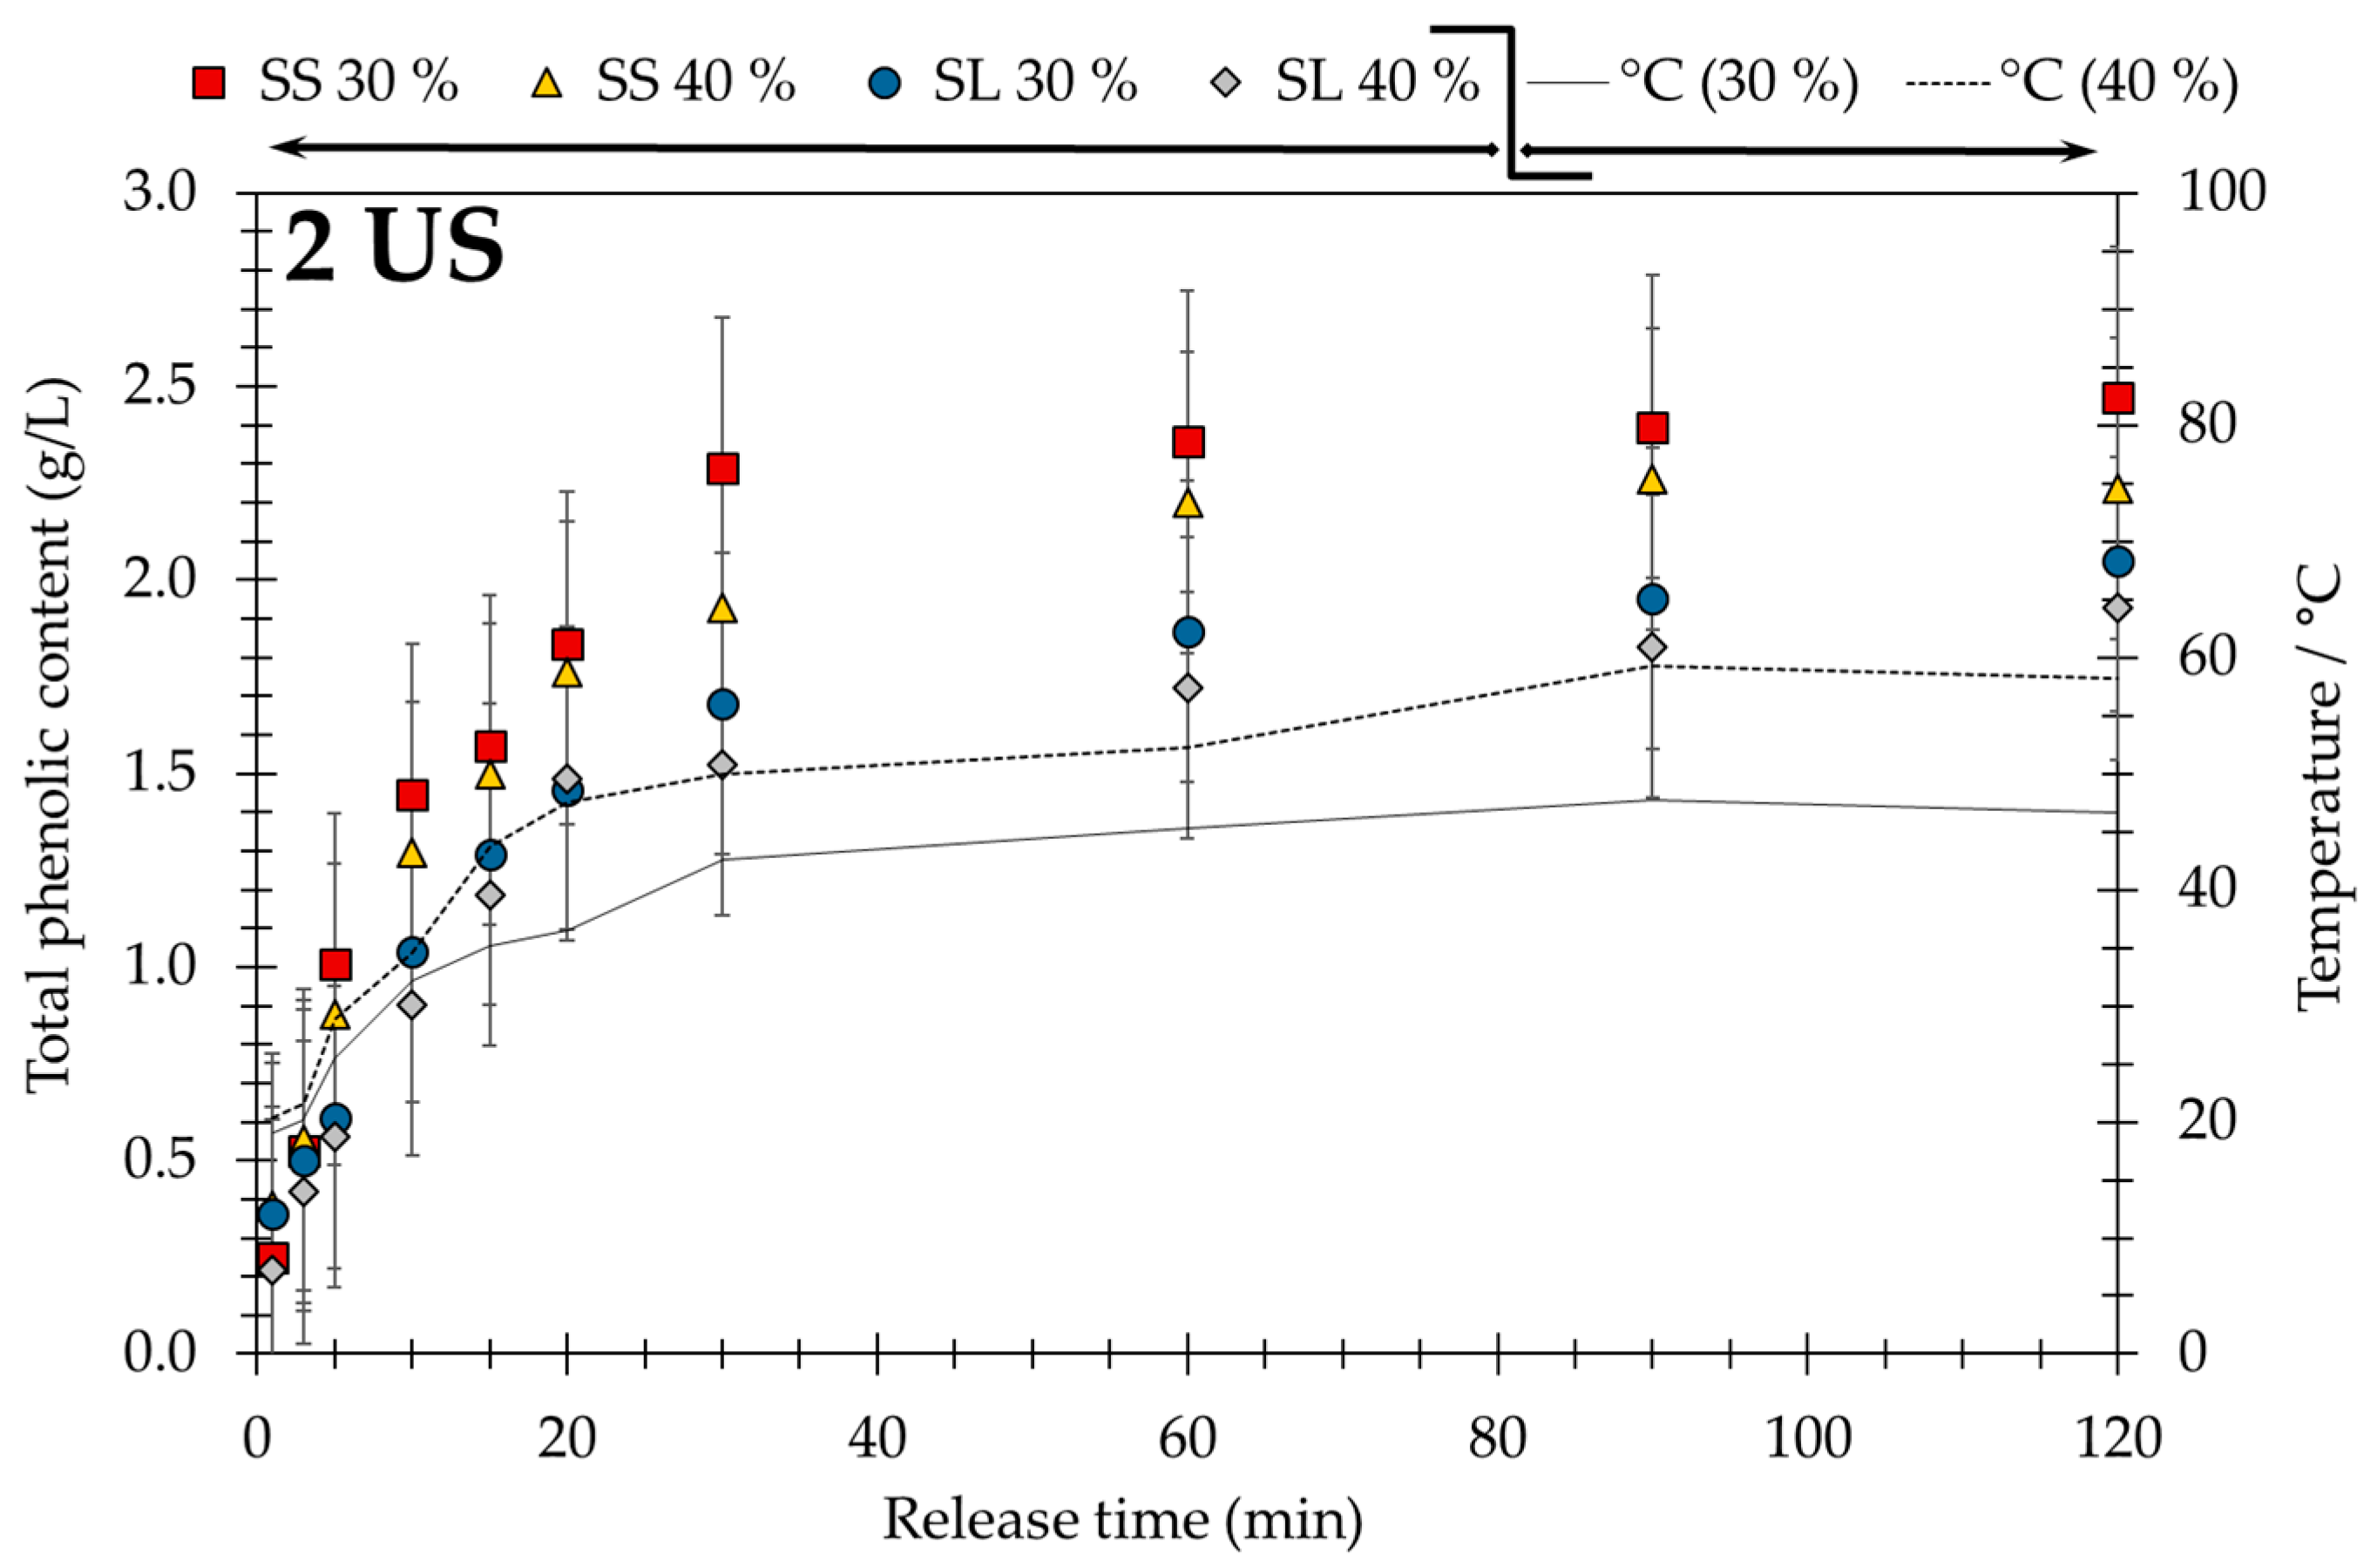
In comparison, the US probe with an amplitude of 30% gives a temperature around 50 °C whereas an amplitude of 40% raises the temperature to almost 60 °C, as depicted in Figure 4 (2 US). The slope of the measured temperature curves (full and dashed lines) follows the slope of the total phenol content curves. This indicates that only a portion of the cavitation bubbles break up the herbal cell membranes and the main energy of the compression waves heats up the extraction slurry and friction loss and limits the yield of polyphenols. It is apparent that changing the amplitude will not significantly improve the extraction.
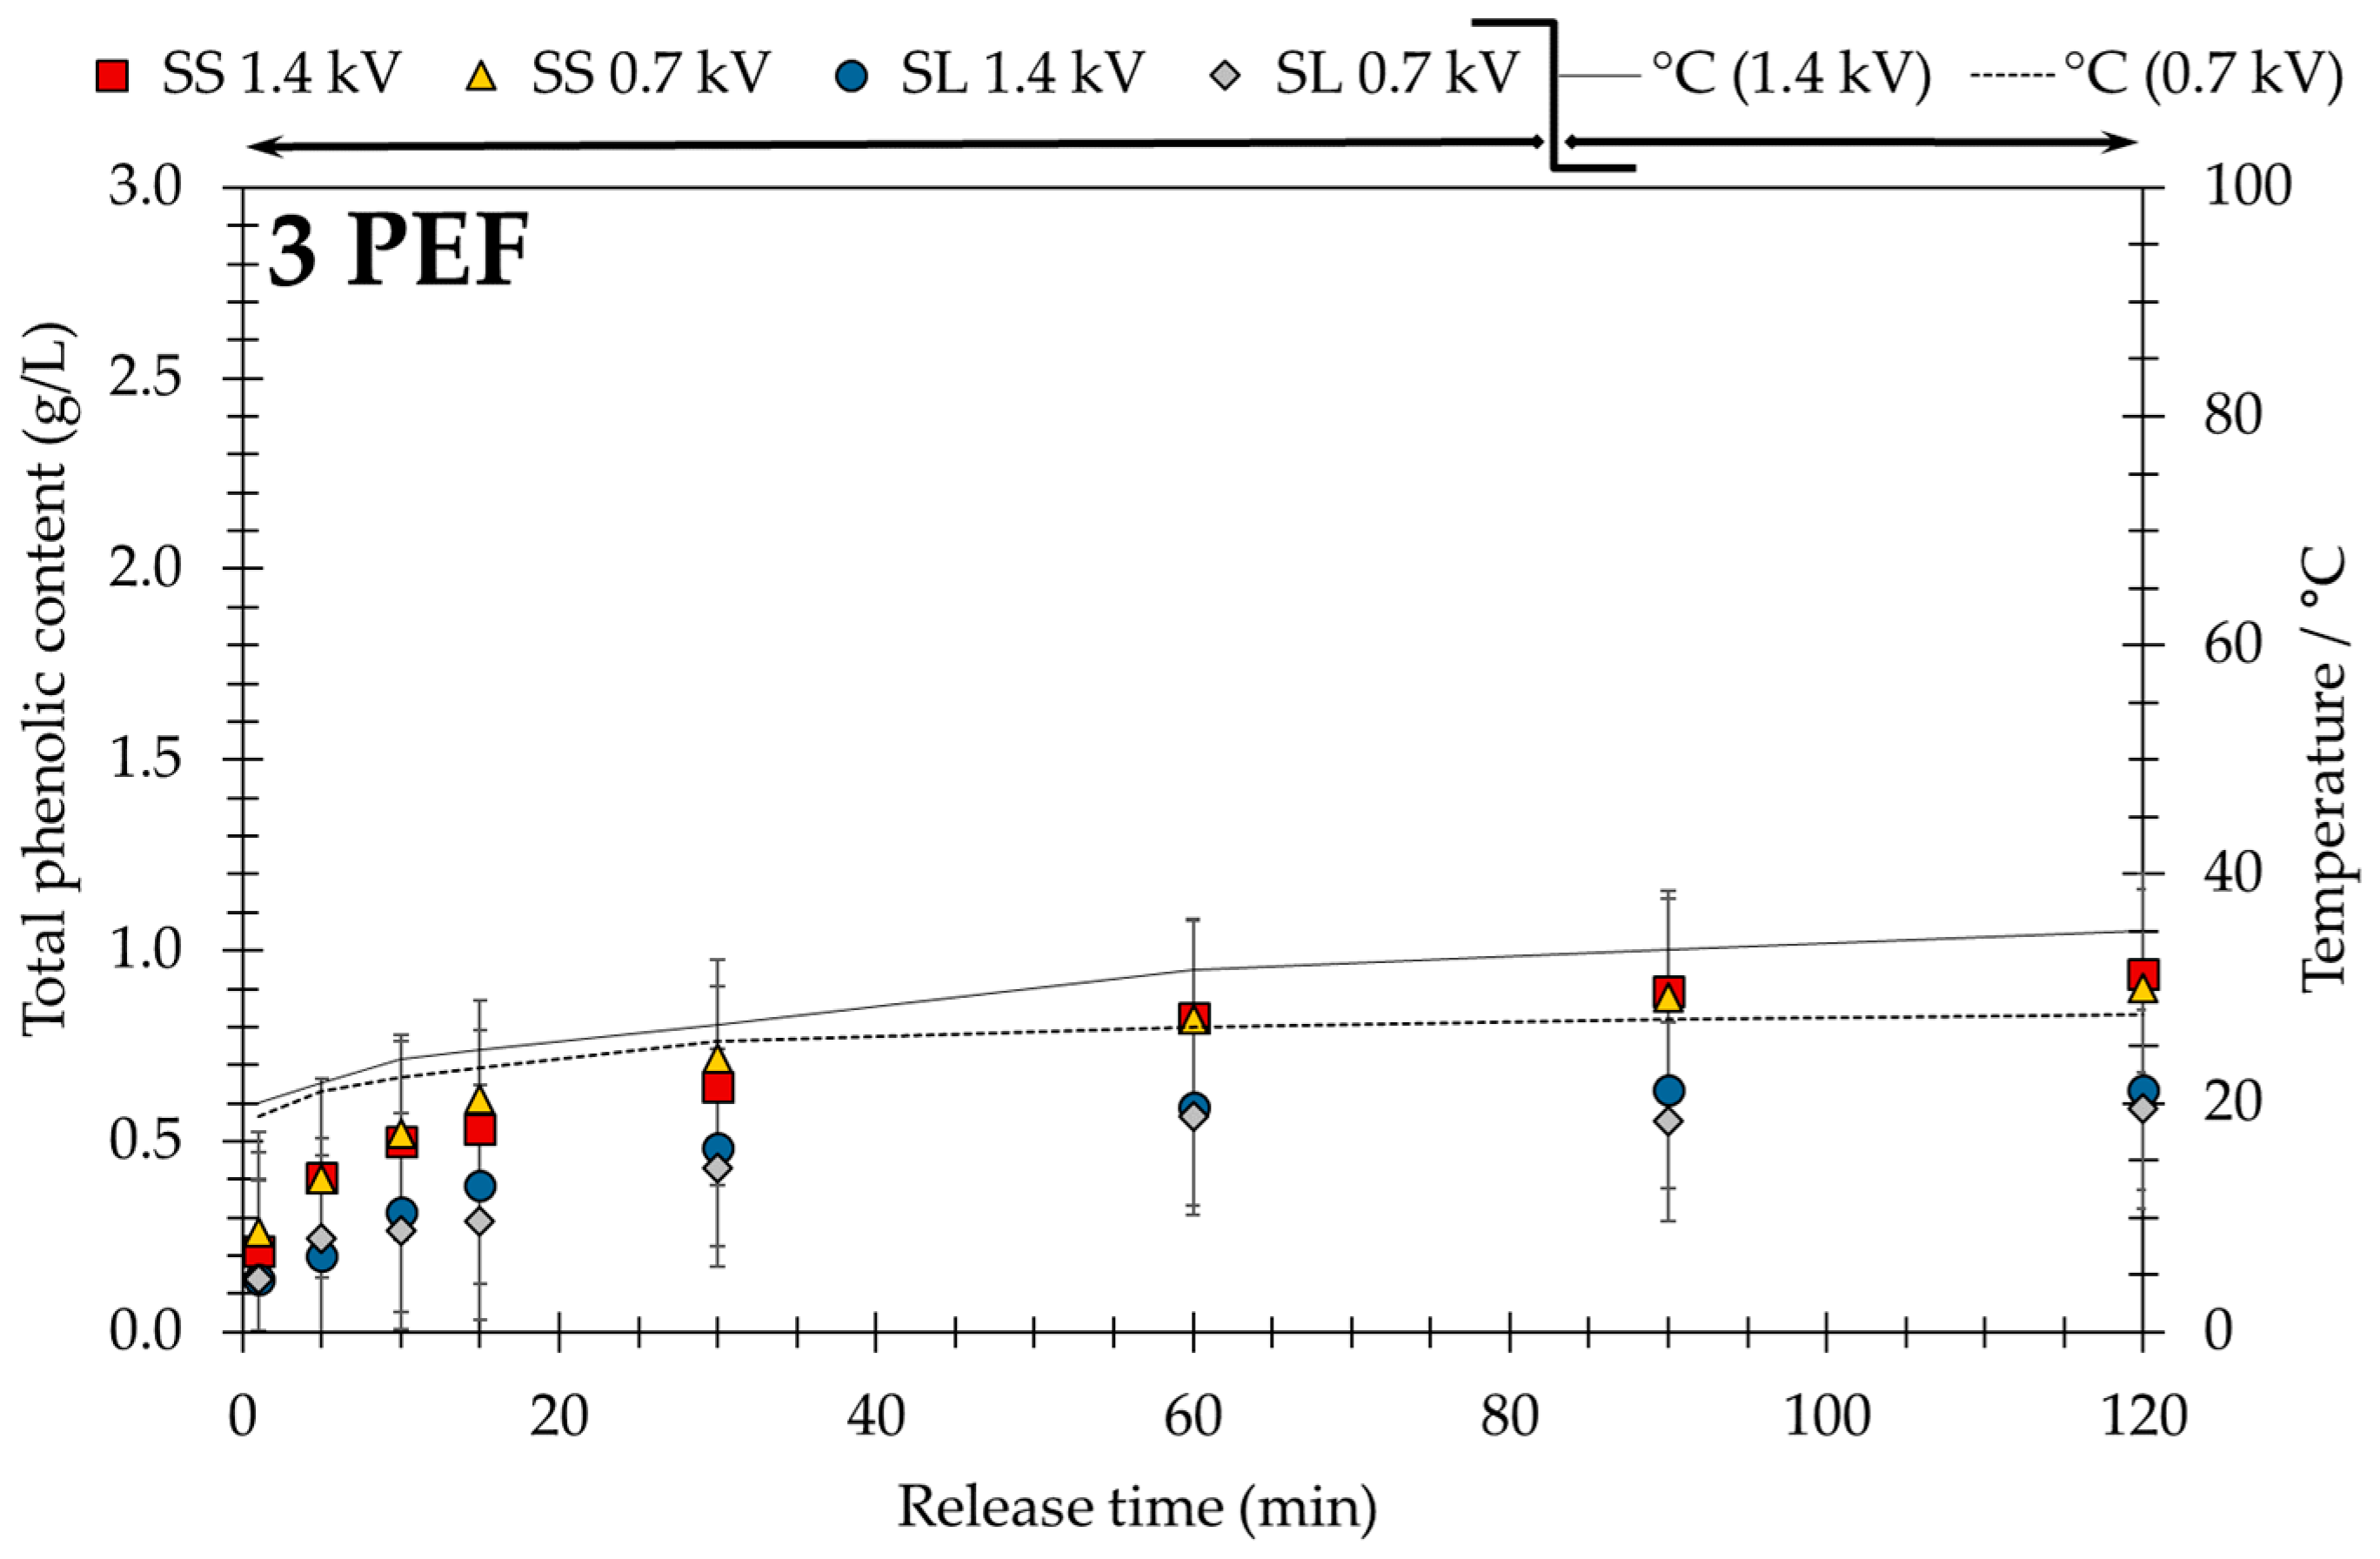
In contrast to MW and US, the PEF-assisted technique (see Figure 5, 3 PEF) increases the temperature of the extraction slurry up to 35.0 °C for and to 27.8 °C for due to Joule heating, although the input of electrical power from to is very high. As can be seen, the increase of temperature is dependent on the intensity of the electric field and on the treatment time [72]. As to this, the application of PEF assisted processes in combination with mild heating presents a promising technique for benign extraction of thermal sensitive solutes. As mentioned, the temperature rise is not dramatic and the pseudo-equilibrium is reached after 60 min. Additionally, in accordance to the screening experiments (pH value, temperature, and solvent) of the laboratory robot, no degradation of polyphenols is observed during 120 min of extraction time.
Generally, bigger particle size causes a lower yield due to longer diffusion paths and consequently a higher diffusion resistance [5,50]. The dependence of yield on particle size indicates that the diffusion of the solvent into the particle and the solvent–solute diffusion out of the particle are rate-determining steps of the process. Because of the dependence of the effective diffusion coefficient on particle size , it is crucial to note that particle size is a decisive variable for process control.
3.3. Comparison of Nonconventional Processing Techniques
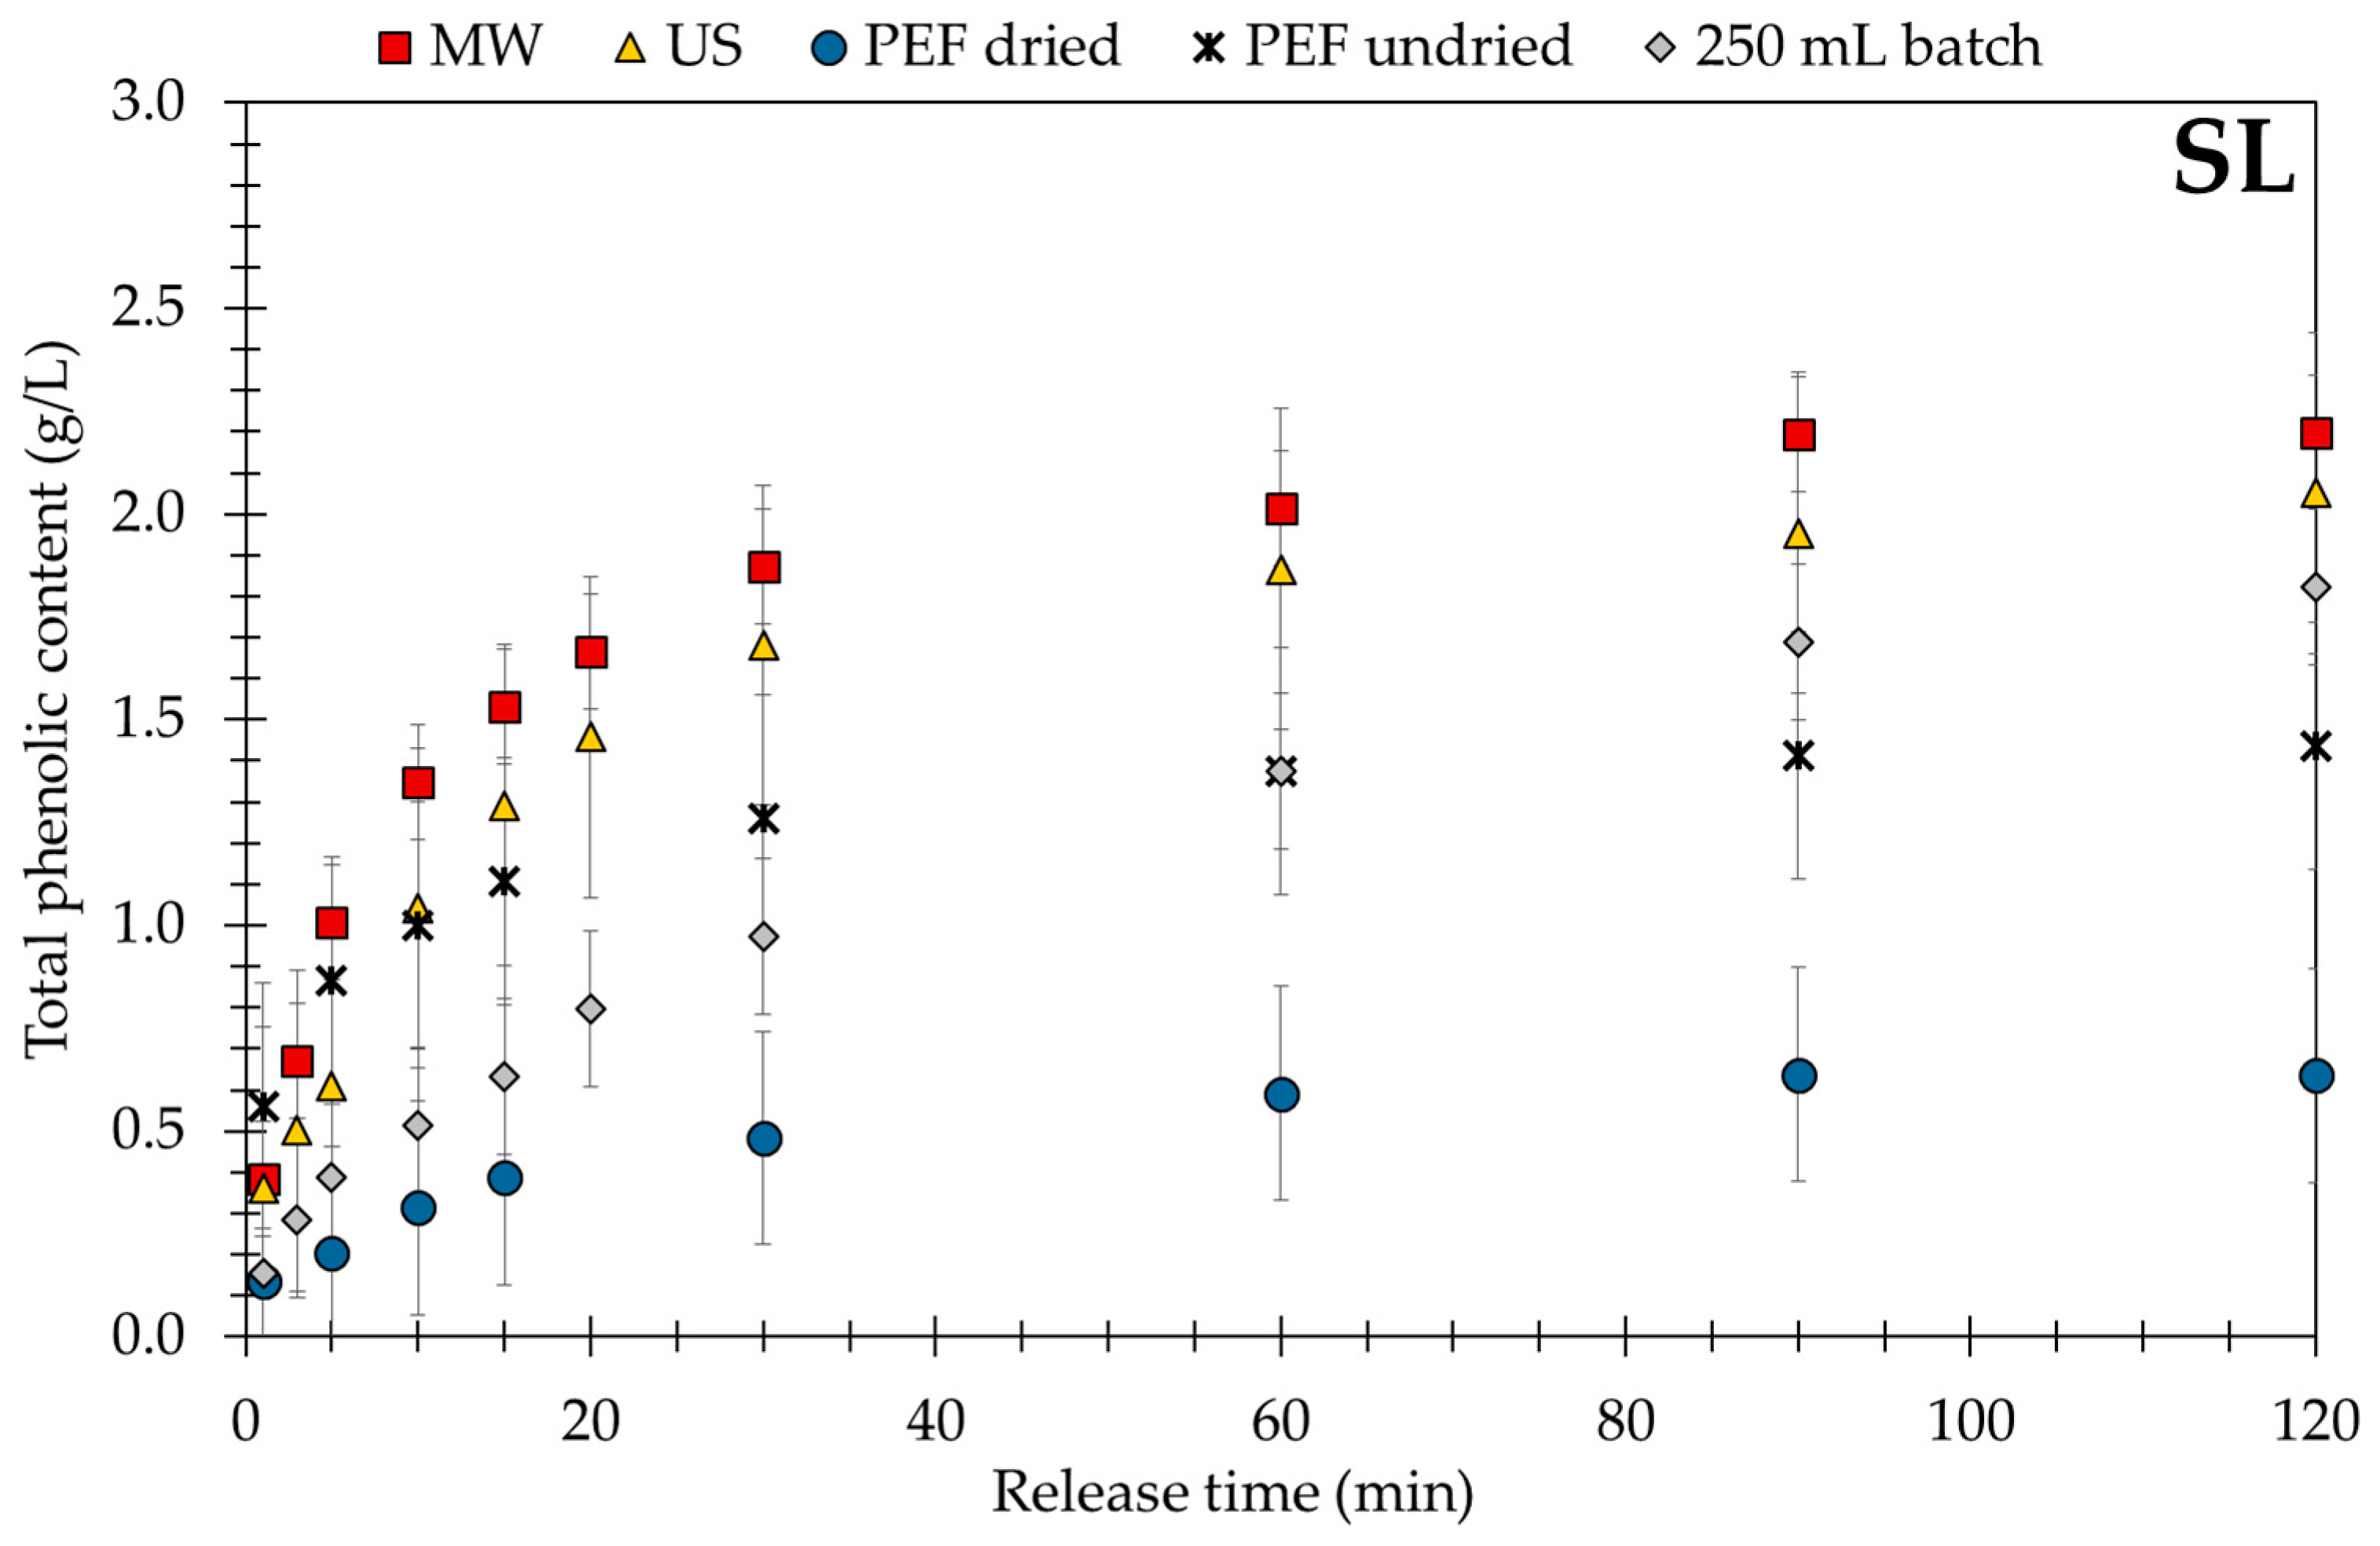
Although nonconventional processing techniques have different active principles, a comparison using the large red vine leaves (SL) is shown in Figure 6 and a conventional batch stirred vessel held at 50 °C is the reference. Generally, within 60 min extraction time the MW-, US-, or PEF-assisted technique achieved a higher yield of polyphenols than the standard extraction process. An exception is the PEF-assisted extraction process using dried red vine leaves. The lower effectiveness of PEF assisted extraction technique can be understood in context of the properties of the dried red vine leaves. It is harder to overcome the transmembrane potential and create pores, which is confirmed by the results of PEF with dried plant material and undried plant material. After harvesting and drying, the red vine leaves not only lose their moisture, especially the intracellular fluid, but also the structural integrity of the cell membrane pores is possibly damaged, which limits the effectiveness of PEF. In contrast, PEF assisted extraction of fresh red vine leaves leads to a total phenol content to (see Table 5). However, MW- and US-assisted extraction techniques are more effective [73] and temperature changes resulting from the energy input is the crucial factor for increasing yield. The MW-assisted extraction process achieves the highest total phenol content followed closely by the US-assisted extraction technique.
Considering the effective diffusion coefficient, the PEF assisted technique that uses undried red vine leaves attains the pseudo-equilibrium most rapidly. In contrast to this, the effective diffusion coefficients of the other processing techniques are much lower as can be seen from Table 5. With the standard jacketed tank has the lowest value and after 120 min release time the pseudo-equilibrium is still not reached (see Figure 6).
4. Conclusions
The influence of temperature and solvent composition on extraction kinetics and saturation and degradation limits is screened using a fully automated laboratory robot for the optimization of solid–liquid extraction when leaching polyphenols from red vine leaves. Gallic acid was considered to be the representative pseudo-solute. The results generated by the laboratory robot show that varying the acidity of extracting agent does not influence the polyphenols yield and extraction kinetics. However, an increasing temperature markedly enhances the extraction yield and saturation concentration, but does not significantly improve extraction kinetics. An upper limit is given as polyphenols are thermally sensitive and the extraction efficiency is reduced at temperatures higher than 60 °C. When investigating different amounts of methanol as a modifier at an extraction temperature of 56 °C, a mixture of methanol:water 50:50 (v/v) independent of the pH value gives fast kinetics and the highest yield. However, methanol/water solutions give nearly results as acidified methanol/water solutions, and best results were when using only acidified water. In conclusion, the laboratory robot allows systematic and highly reproducible screenings of process conditions. Furthermore, the use of the laboratory robot allows massive time savings during screening with parallel and unattended overnight work.
With nonconventional processing techniques, like microwave, ultrasonic, and pulsed electric field, smaller particle size positively influences the extraction process due to a shorter diffusion path and higher surface area per volume. As a result, an appropriate sample preparation and combination is recommended with respect to industrial application with either filtering limits after maceration or a limiting pressure loss with percolation.
Generally, the microwave-assisted extraction process followed by the ultrasonic-assisted extraction process gives the highest yield of polyphenols at approximately 50 °C. PEF are less effective than MW or US assisted extraction in comparison to conventional batch extraction. Interestingly, US when combined with undried plant material presents a promising technique for benign extraction of thermal sensitive solutes. Finally, the best industrial extraction procedure for leaching polyphenols from red vine leaves uses a batch reactor with implemented magnetrons to generate microwaves and quickly heat suspended plant material.
Author Contributions
S.B. conceived and designed the experiments; S.B. performed the experiments and analyzed the data; H.-J.B. contributed reagents, materials and analysis tools; S.B. and H.-J.B. wrote the paper.
Funding
This research received no external funding.
Acknowledgments
We wish to thank Boehringer Ingelheim Pharma GmbH & Co.KG (H.J. Hagels) for helping with analytics and supplying HPLC standards.
Conflicts of Interest
The authors declare no conflict of interest.
Nomenclature
| Surface area of red vine leaves () | |
| Polyphenol concentration in the bulk (g/L) | |
| Polyphenol concentration considering the to ratio | |
| Polyphenol concentration at pseudo-equilibrium (g/L) | |
| Effective diffusion coefficient | |
| Electric field strength | |
| Current | |
| Diffusive mass flux | |
| Weight of the bulk | |
| Weight of the red vine leaves | |
| Weight of the methanol bulk | |
| Weight of the water bulk | |
| Power | |
| Electric power () | |
| Resistance | |
| Particle radius | |
| Bulk density | |
| Density of water | |
| Density of methanol | |
| Conductivity | |
| Release time | |
| Pseudo-equilibrium time | |
| Extraction temperature | |
| Voltage | |
| Bulk volume | |
| Volume of the red vine leaves | |
| Energy () | |
| Mass fraction of water | |
| Mass fraction of methanol |
References
- Schneider, E. Rotes Weinlaub—Geschichte der Verwendung in der Medizin. Schweiz. Z. GanzheitsMed. 2009, 8, 333–339. [Google Scholar] [CrossRef]
- Esperester, A.; Frey, H.W.; Vix, J.-M. Method for Treatment of Chronic Venous Insufficiencies Using an Extract of Red Vine Leaves. U.S. Patent US6485727B1, 26 November 2002. [Google Scholar]
- Schneider, E. Rotes Weinlaub—Eine venenwirksame Arzneidroge. Dtsch. Apoth. Ztg. 2007, 147, 40–47. [Google Scholar]
- Chethan, S.; Malleshi, N.G. Finger millet polyphenols: Optimization of extraction and the effect of pH on their stability. Food Chem. 2007, 105, 862–870. [Google Scholar] [CrossRef]
- Schneider, F.H. Extraktive Trennung Fest/Flüssig: Untersuchungen Über die Feinstruktur Vegetabiler Feststoffe und Ihren Einfluß auf das Extraktionsverhalten; Forschungsberichte des Landes Nordrhein-Westfalen; Springer: Essen, Germany, 1980. [Google Scholar]
- Cheynier, V. Polyphenols in foods are more complex than often thought. Am. J. Clin. Nutr. 2005, 81, 223S–229S. [Google Scholar] [CrossRef]
- Esclapez, M.D.; García-Pérez, J.V.; Mulet, A.; Cárcel, J.A. Ultrasound-Assisted Extraction of Natural Products. Food Eng. Rev. 2011, 3, 108–120. [Google Scholar] [CrossRef] [Green Version]
- Luque-García, J.L.; de Castro, M.D.L. Ultrasound: A powerful tool for leaching. Trends Anal. Chem. 2003, 22, 41–47. [Google Scholar] [CrossRef]
- Shirsath, S.R.; Sonawane, S.H.; Gogate, P.R. Intensification of extraction of natural products using ultrasonic irradiations—A review of current status. Chem. Eng. Process. 2012, 53, 10–23. [Google Scholar] [CrossRef]
- Chan, C.-H.; Yusoff, R.; Ngoh, G.-C.; Kung, F.W.-L. Microwave-assisted extractions of active ingredients from plants. J. Chromatogr. A 2011, 1218, 6213–6225. [Google Scholar] [CrossRef]
- Filly, A.; Fernandez, X.; Minuti, M.; Visinoni, F.; Cravotto, G.; Chemat, F. Solvent-free microwave extraction of essential oil from aromatic herbs: From laboratory to pilot and industrial scale. Food Chem. 2014, 150, 193–198. [Google Scholar] [CrossRef] [Green Version]
- Zhang, H.-F.; Yang, X.-H.; Wang, Y. Microwave assisted extraction of secondary metabolites from plants: Current status and future directions. Trends Food Sci. Technol. 2011, 22, 672–688. [Google Scholar] [CrossRef]
- Brodelius, P.E.; Funk, C.; Shillito, R.D. Permeabilization of cultivated plant cells by electroporation for release of intracellularly stored secondary products. Plant Cell Rep. 1988, 7, 186–188. [Google Scholar] [CrossRef]
- Bouzrara, H.; Vorobiev, E. Solid–liquid expression of cellular materials enhanced by pulsed electric field. Chem. Eng. Process. 2003, 42, 249–257. [Google Scholar] [CrossRef]
- Corrales, M.; Toepfl, S.; Butz, P.; Knorr, D.; Tauscher, B. Extraction of anthocyanins from grape by-products assisted by ultrasonics, high hydrostatic pressure or pulsed electric fields: A comparison. Innov. Food Sci. Emerg. Technol. 2008, 9, 85–91. [Google Scholar] [CrossRef]
- Loginova, K.V.; Lebovka, N.I.; Vorobiev, E. Pulsed electric field assisted aqueous extraction of colorants from red beet. J. Food Eng. 2011, 106, 127–133. [Google Scholar] [CrossRef]
- de Oliveira, C.F.; Giordani, D.; Gurak, P.D.; Cladera-Olivera, F.; Marczak, L.D.F. Extraction of pectin from passion fruit peel using moderate electric field and conventional heating extraction methods. Innov. Food Sci. Emerg. Technol. 2015, 29, 201–208. [Google Scholar] [CrossRef]
- Chemat, F.; Rombaut, N.; Sicaire, A.-G.; Meullemiestre, A.; Fabiano-Tixier, A.-S.; Abert-Vian, M. Ultrasound assisted extraction of food and natural products. Mechanisms, techniques, combinations, protocols and applications. A review. Ultrason. Sonochem. 2017, 34, 540–560. [Google Scholar] [CrossRef]
- Belova, V.; Gorin, D.A.; Shchukin, D.G.; Möhwald, H. Selektive Ultraschall-Kavitation an strukturierten hydrophoben Oberflächen. Angew. Chem. 2010, 122, 7285–7289. [Google Scholar] [CrossRef]
- Toma, M.; Vinatoru, M.; Paniwnyk, L.; Mason, T.J. Investigation of the effects of ultrasound on vegetal tissues during solvent extraction. Ultrason. Sonochem. 2001, 8, 137–142. [Google Scholar] [CrossRef]
- da Porto, C.; Porretto, E.; Decorti, D. Comparison of ultrasound-assisted extraction with conventional extraction methods of oil and polyphenols from grape (Vitis vinifera L.) seeds. Ultrason. Sonochem. 2013, 20, 1076–1080. [Google Scholar] [CrossRef]
- Khan, M.K.; Abert-Vian, M.; Fabiano-Tixier, A.-S.; Dangles, O.; Chemat, F. Ultrasound-assisted extraction of polyphenols (flavanone glycosides) from orange (Citrus sinensis L.) peel. Food Chem. 2010, 119, 851–858. [Google Scholar] [CrossRef]
- Pingret, D.; Fabiano-Tixier, A.-S.; le Bourvellec, C.; Renard, C.M.G.C.; Chemat, F. Lab and pilot-scale ultrasound-assisted water extraction of polyphenols from apple pomace. J. Food Eng. 2012, 111, 73–81. [Google Scholar] [CrossRef]
- Pan, X.; Niu, G.; Liu, H. Microwave-assisted extraction of tea polyphenols and tea caffeine from green tea leaves. Chem. Eng. Process. 2003, 42, 129–133. [Google Scholar] [CrossRef]
- Hao, J.-Y.; Han, W.; Huang, S.-D.; Xue, B.-Y.; Deng, X. Microwave-assisted extraction of artemisinin from Artemisia annua L. Sep. Purif. Technol. 2002, 28, 191–196. [Google Scholar] [CrossRef]
- Proestos, C.; Komaitis, M. Application of microwave-assisted extraction to the fast extraction of plant phenolic compounds. LWT Food Sci. Technol. 2008, 41, 652–659. [Google Scholar] [CrossRef]
- Destandau, E.; Michel, T.; Elfakir, C. Microwave-assisted Extraction. In Natural Product Extraction: Principles and Applications; Rostagno, M.A., Ed.; Royal Soc. of Chemistry: Cambridge, UK, 2013; pp. 113–156. [Google Scholar]
- Alfaro, M.J.; Bélanger, J.M.R.; Padilla, F.C.; Paré, J.R.J. Influence of solvent, matrix dielectric properties, and applied power on the liquid-phase microwave-assisted processes (MAPTM) extraction of ginger (Zingiber officinale). Food Res. Int. 2003, 36, 499–504. [Google Scholar] [CrossRef]
- Routray, W.; Orsat, V. Microwave-Assisted Extraction of Flavonoids: A Review. Food Bioprocess Technol. 2012, 5, 409–424. [Google Scholar] [CrossRef]
- Both, S.; Strube, J.; Cravatto, G. Mass Transfer Enhancement for Solid-Liquid Extractions. In Green Extraction of Natural Products: Theory and Practice; Chémat, F., Strube, J., Eds.; Wiley VCH: Weinheim, Germany, 2015; pp. 101–144. [Google Scholar]
- Barba, F.J.; Galanakis, C.M.; Esteve, M.J.; Frigola, A.; Vorobiev, E. Potential use of pulsed electric technologies and ultrasounds to improve the recovery of high-added value compounds from blackberries. J. Food Eng. 2015, 167, 38–44. [Google Scholar] [CrossRef]
- Weaver, J.C.; Chizmadzhev, Y.A. Theory of electroporation: A review. Bioelectrochem. Bioenerg. 1996, 41, 135–160. [Google Scholar] [CrossRef]
- Vorobiev, E.; Lebovka, N. Pulsed-Electric-Fields-Induced Effects in Plant Tissues: Fundamental Aspects and Perspectives of Applications. In Electrotechnologies for Extraction from Plant Foods and Biomaterials; Vorobiev, E., Lebovka, N., Eds.; Springer: New York, NY, USA; London, UK, 2008; pp. 39–82. [Google Scholar]
- Weaver, J.C. Electroporation of cells and tissues. IEEE Trans. Plasma Sci. 2000, 28, 24–33. [Google Scholar] [CrossRef]
- Barnett, A.; Weaver, J.C. Electroporation: A unified, quantitative theory of reversible electrical breakdown and mechanical rupture in artificial planar bilayer membranes. Bioelectrochem. Bioenerg. 1991, 25, 163–182. [Google Scholar] [CrossRef]
- Zimmermann, U.; Pilwat, G.; Beckers, F.; Riemann, F. Effects of External Electrical Fields on Cell Membranes. Bioelectrochem. Bioenerg. 1976, 3, 58–83. [Google Scholar] [CrossRef]
- Morales-Cid, G.; Cárdenas, S.; Simonet, B.M.; Valcárcel, M. Sample treatments improved by electric fields. Trends Anal. Chem. 2010, 29, 158–165. [Google Scholar] [CrossRef]
- Heinz, V.; Alvarez, I.; Angersbach, A.; Knorr, D. Preservation of liquid foods by high intensity pulsed electric fields—Basic concepts for process design. Trends Food Sci. Technol. 2001, 12, 103–111. [Google Scholar] [CrossRef]
- Kassing, M.; Jenelten, U.; Schenk, J.; Strube, J. A New Approach for Process Development of Plant-Based Extraction Processes. Chem. Eng. Technol. 2010, 33, 377–387. [Google Scholar] [CrossRef] [Green Version]
- Bart, H.-J.; Pilz, S. Industrial Scale Natural Products Extraction; Wiley-VCH: Weinheim, Germany, 2011. [Google Scholar]
- Both, S.; Eggersglüß, J.; Lehnberger, A.; Schulz, T.; Schulze, T.; Strube, J. Optimizing Established Processes like Sugar Extraction from Sugar Beets—Design of Experiments versus Physicochemical Modeling. Chem. Eng. Technol. 2013, 36, 2125–2136. [Google Scholar] [CrossRef]
- Bachtler, S.; Bart, H.-J. Extraction of Anthocyanins Using a Laboratory Robot and Innovative Extraction Technologies. Chem. Eng. Technol. 2016, 39, 1875–1883. [Google Scholar] [CrossRef]
- Werner, A.; Blaschke, T.; von Harbou, E.; Hasse, H. Fully Automated Weighing of Liquid Substances with a Laboratory Robot. Chem. Eng. Technol. 2014, 37, 168–172. [Google Scholar] [CrossRef]
- Both, S. Systematische Verfahrensentwicklung für Pflanzlich Basierte Produkte im Regulatorischen Umfeld; Shaker: Aachen, Germany, 2014. [Google Scholar]
- Wang, L.; Weller, C.L. Recent advances in extraction of nutraceuticals from plants. Trends Food Sci. Technol. 2006, 17, 300–312. [Google Scholar] [CrossRef]
- Bergs, D.; Merz, J.; Delp, A.; Joehnck, M.; Martin, G.; Schembecker, G. A Standard Procedure for the Selection of Solvents for Natural Plant Extraction in the Early Stages of Process Development. Chem. Eng. Technol. 2013, 36, 1739–1748. [Google Scholar] [CrossRef]
- Chapman, T. A structured approach. Nature 2003, 421, 661–666. [Google Scholar] [CrossRef]
- Chan, C.-H.; Yusoff, R.; Ngoh, G.-C. Modeling and kinetics study of conventional and assisted batch solvent extraction. Chem. Eng. Res. Des. 2014, 92, 1169–1186. [Google Scholar] [CrossRef]
- Boussetta, N.; Vorobiev, E. Application of electrical treatments in alcoholic solvent for polyphenols extraction from grape seeds. LWT Food Sci. Technol. 2012, 46, 127–134. [Google Scholar] [CrossRef]
- Herodez, S.S.; Hadolin, M.; Skerget, M.; Knez, Z. Solvent extraction study of antioxidants from Balm (Melissa officinalis L.) leaves. Food Chem. 2003, 80, 275–282. [Google Scholar] [CrossRef]
- Hojnik, M.; Škerget, M.; Knez, Ž. Extraction of lutein from Marigold flower petals—Experimental kinetics and modelling. LWT Food Sci. Technol. 2008, 41, 2008–2016. [Google Scholar] [CrossRef]
- Perez, E.E.; Carelli, A.A.; Crapiste, G.H. Temperature-dependent diffusion coefficient of oil from different sunflower seeds during extraction with hexane. J. Food Eng. 2011, 105, 180–185. [Google Scholar] [CrossRef]
- Qu, W.; Pan, Z.; Ma, H. Extraction modeling and activities of antioxidants from pomegranate marc. J. Food Eng. 2010, 99, 16–23. [Google Scholar] [CrossRef]
- Pan, G.; Yu, G.; Zhu, C.; Qiao, J. Optimization of ultrasound-assisted extraction (UAE) of flavonoids compounds (FC) from hawthorn seed (HS). Ultrason. Sonochem. 2012, 19, 486–490. [Google Scholar] [CrossRef]
- Rakotondramasy-Rabesiaka, L.; Havet, J.-L.; Porte, C.; Fauduet, H. Solid–liquid extraction of protopine from Fumaria officinalis L.—Kinetic modelling of influential parameters. Ind. Crops Prod. 2009, 29, 516–523. [Google Scholar] [CrossRef]
- Peleg, M. An Empirical Model for the Description of Moisture Sorption Curves. J. Food Sci. 1988, 53, 1216–1219. [Google Scholar] [CrossRef]
- Velicković, D.T.; Milenović, D.M.; Ristić, M.S.; Veljković, V.B. Kinetics of ultrasonic extraction of extractive substances from garden (Salvia officinalis L.) and glutinous (Salvia glutinosa L.) sage. Ultrason. Sonochem. 2006, 13, 150–156. [Google Scholar] [CrossRef]
- Ainsworth, E.A.; Gillespie, K.M. Estimation of total phenolic content and other oxidation substrates in plant tissues using Folin–Ciocalteu reagent. Nat. Protoc. 2007, 2, 875–877. [Google Scholar] [CrossRef]
- Guerrero, M.S.; Torres, J.S.; Nuñez, M.J. Extraction of polyphenols from white distilled grape pomace: Optimization and modelling. Bioresour. Technol. 2008, 99, 1311–1318. [Google Scholar] [CrossRef]
- Rakotondramasy-Rabesiaka, L.; Havet, J.-L.; Porte, C.; Fauduet, H. Estimation of effective diffusion and transfer rate during the protopine extraction process from Fumaria officinalis L. Sep. Purif. Technol. 2010, 76, 126–131. [Google Scholar] [CrossRef]
- Spiro, M.; Selwood, R.M. The kinetics and mechanism of caffeine infusion from coffee: The effect of particle size. J. Sci. Food Agric. 1984, 35, 915–924. [Google Scholar] [CrossRef]
- VDI-Gesellschaft Verfahrenstechnik und Chemieingenieurwesen (GVC). VDI-Wärmeatlas, 11th ed.; Springer: Berlin/Heidelberg, Germany, 2013. [Google Scholar]
- Fossen, T.; Cabrita, L.; Andersen, O.M. Colour and stability of pure anthocyanins influenced by pH including the alkaline region. Food Chem. 1998, 63, 435–440. [Google Scholar] [CrossRef] [Green Version]
- Türker, N.; Erdogdu, F. Effects of pH and temperature of extraction medium on effective diffusion coefficient of anthocynanin pigments of black carrot (Daucus carota var. L.). J. Food Eng. 2006, 76, 579–583. [Google Scholar] [CrossRef]
- Franco, D.; Sineiro, J.; Rubilar, M.; Sánchez, M.; Jerez, M.; Pinelo, M.; Costoya, N.; Nunez, M.J. Polyphenols from plant materials: Extraction and antioxidant power. Electron. J. Environ. Agric. Food Chem. 2008, 7, 3210–3216. [Google Scholar]
- Rødtjer, A.; Skibsted, L.H.; Andersen, M.L. Antioxidative and prooxidative effects of extracts made from cherry liqueur pomace. Food Chem. 2006, 99, 6–14. [Google Scholar] [CrossRef]
- Kallithraka, S.; Garcia-Viguera, C.; Bridle, P.; Bakker, J. Survey of solvents for the extraction of grape seed phenolics. Phytochem. Anal. 1995, 6, 265–267. [Google Scholar] [CrossRef]
- Lapornik, B.; Prošek, M.; Wondra, A.G. Comparison of extracts prepared from plant by-products using different solvents and extraction time. J. Food Eng. 2005, 71, 214–222. [Google Scholar] [CrossRef]
- Revilla, E.; Ryan, J.-M.; Martín-Ortega, G. Comparison of Several Procedures Used for the Extraction of Anthocyanins from Red Grapes. J. Agric. Food Chem. 1998, 46, 4592–4597. [Google Scholar] [CrossRef]
- Kähkönen, M.P.; Hopia, A.I.; Heinonen, M. Berry Phenolics and Their Antioxidant Activity. J. Agric. Food Chem. 2001, 49, 4076–4082. [Google Scholar] [CrossRef]
- Ju, Z.Y.; Howard, L.R. Effects of solvent and temperature on pressurized liquid extraction of anthocyanins and total phenolics from dried red grape skin. J. Agric. Food Chem. 2003, 51, 5207–5213. [Google Scholar] [CrossRef]
- Jäger, H. Process Performance Analysis of Pulsed Electric Field (PEF) Food Applications. Ph.D. Thesis, Technische Universität, Berlin, Germany, 2012. [Google Scholar]
- Fang, X.; Wang, J.; Yu, X.; Zhang, G.; Zhao, J. Optimization of microwave-assisted extraction followed by RP-HPLC for the simultaneous determination of oleanolic acid and ursolic acid in the fruits of Chaenomeles sinensis. J. Sep. Sci. 2010, 33, 1147–1155. [Google Scholar] [CrossRef]
Figure 1.
Particle size distribution of dried red vine leaves.

Figure 2.
Extraction kinetics using laboratory robot by variation of pH value (a), temperature (b), and solvent (c) with size small (SS) plant material.
Figure 2.
Extraction kinetics using laboratory robot by variation of pH value (a), temperature (b), and solvent (c) with size small (SS) plant material.


Figure 3.
Extraction kinetics (left axis) and measured temperature curves (right axis) using microwaves (MW).
Figure 3.
Extraction kinetics (left axis) and measured temperature curves (right axis) using microwaves (MW).

Figure 4.
Extraction kinetics (left axis) and measured temperature curves (right axis) using ultrasonics (US).
Figure 4.
Extraction kinetics (left axis) and measured temperature curves (right axis) using ultrasonics (US).

Figure 5.
Extraction kinetics (left axis) and measured temperature curves (right axis) using pulsed electric field (PEF).
Figure 5.
Extraction kinetics (left axis) and measured temperature curves (right axis) using pulsed electric field (PEF).

Figure 6.
Extraction kinetics using alternative processing techniques and large sample size (SL).


Table 1.
Red vine leaves properties and extraction conditions.
| Particle Size | r | ρs | ms | As | Vl | T | ρl,water | ml,water | ρl,methanol | Mixing Ratio a | ml | |
|---|---|---|---|---|---|---|---|---|---|---|---|---|
| (µm) | (µm) | (g/mL) | (g) | (dm2) | (mL) | (°C) | (kg/m3) | (g) | (kg/m3) | (% v/v) | (g) | |
| 51.0 | 987.58 | 2.47 | ||||||||||
| 56.0 | 985.21 | 2.46 | ||||||||||
| 60.5 | 982.95 | 2.46 | ||||||||||
| 56.0 | 985.21 | 752.16 | 20:80 | 2.35 | ||||||||
| 50:50 | 2.18 | |||||||||||
| 80:20 | 2.00 | |||||||||||
| MW | 450–2000 | 612.5 | 0.19 | 1.09 | 2.82 | 25.0 | 50 | 988.05 | 24.7 | |||
| 2000–4000 | 1500 | 0.12 | 1.04 | 1.74 | 25.0 | 24.7 | ||||||
| US | 450–2000 | 612.5 | 0.19 | 3.96 | 10.20 | 100 | 50 | 988.05 | 98.8 | |||
| 2000–4000 | 1500 | 0.12 | 4.03 | 6.71 | 100 | 98.8 | ||||||
| PEF | 450–2000 | 612.5 | 0.19 | 0.80 | 2.07 | 20.0 | 35 | 994.04 | 19.9 | |||
| 2000–4000 | 1500 | 0.12 | 0.80 | 1.34 | 20.0 | 19.9 | ||||||
| undried | 1500 | 0.37 | 2.95 | 1.57 | 20.0 | 35 | 994.04 | 19.9 | ||||
| batch | 450–2000 | 612.5 | 0.19 | 10.0 | 25.79 | 250 | 25 | 997.69 | 249.4 | |||
| 2000–4000 | 1500 | 0.12 | 10.0 | 16.68 | 250 | 249.4 |
a mixing ratio water to methanol.
Table 2.
Release data at different pH values.
| pH | T | Extractant | c | t | Deff | cs | |
|---|---|---|---|---|---|---|---|
| (°C) | (g/L) | (min) | (g/L) | (10−12 m2/s) | (% w/w) | ||
| 1.21 | 23.0 | acidified water (HCl) | 1.12 | 90 | 1.12 | 0.73 | 12.7 |
| 1.53 | 1.25 | 120 | 1.25 | 0.68 | 14.2 | ||
| 2.00 | 1.35 | 90 | 1.32 | 1.06 | 15.0 | ||
| 2.50 | 1.37 | 90 | 1.36 | 0.88 | 15.4 | ||
| 3.00 | 1.34 | 60 | 1.13 | 1.39 | 12.8 |
Table 3.
Release data at different temperatures.
| pH | T | Extractant | c | t | Deff | cs | |
|---|---|---|---|---|---|---|---|
| (°C) | (g/L) | (min) | (g/L) | (10−12 m2/s) | (% w/w) | ||
| 2.50 | 23.0 | acidified water (HCl) | 1.37 | 90 | 1.36 | 0.88 | 15.4 |
| 34.0 | 1.56 | 120 | 1.56 | 0.51 | 17.6 | ||
| 43.0 | 1.96 | 120 | 1.96 | 0.95 | 22.1 | ||
| 51.0 | 2.01 | 90 | 1.97 | 0.57 | 22.1 | ||
| 56.0 | 2.82 | 60 | 2.71 | 0.90 | 30.3 | ||
| 60.5 | 1.93 | 60 | 1.91 | 0.69 | 21.3 |
Table 4.
Release data using different solvents.
| pH | T | Extractant | Mixing Ratio | c | t | Deff | cs | |
|---|---|---|---|---|---|---|---|---|
| (°C) | (% v/v/v) | (g/L) | (min) | (g/L) | (10−12 m2/s) | (% w/w) | ||
| 2.59 | 56.0 | meOH:acidified water | 20:80 | 2.21 | 240 | 2.21 | 0.97 | 23.6 |
| 2.80 | 50:50 | 2.39 | 180 | 2.38 | 0.85 | 23.5 | ||
| 3.16 | 80:20 | 2.09 | 240 | 2.09 | 1.21 | 19.0 | ||
| 6.37 | meOH:water | 20:80 | 2.32 | 180 | 2.24 | 0.75 | 23.9 | |
| 6.50 | 50:50 | 2.33 | 180 | 2.33 | 1.19 | 23.1 | ||
| ~7.0 | 80:20 | 1.76 | 240 | 1.76 | 1.39 | 16.0 | ||
| 1.38 | meOH:water:HCl | 50:49:1 | 2.38 | 240 | 2.38 | 0.98 | 23.5 |
Table 5.
Comparison of techniques.
| Particle Size | Deff | cs | ||
|---|---|---|---|---|
| (µm) | (g/L) | (10−12 m2/s) | (% w/w) | |
| microwave | 2000–4000 | 2.20 | 55.1 | 43.3 |
| ultrasonic probe | 2.05 | 50.7 | 41.9 | |
| pulsed electric field | dried | 0.64 | 43.1 | 13.2 |
| pulsed electric field | undried | 1.44 | 121 | 2.6 |
| 250 mL batch | 1.82 | 26.6 | 37.9 |
© 2018 by the authors. Licensee MDPI, Basel, Switzerland. This article is an open access article distributed under the terms and conditions of the Creative Commons Attribution (CC BY) license (http://creativecommons.org/licenses/by/4.0/).
Share and Cite
MDPI and ACS Style
Bachtler, S.; Bart, H.-J. Polyphenols from Red Vine Leaves Using Alternative Processing Techniques. Processes 2018, 6, 262. https://doi.org/10.3390/pr6120262
AMA Style
Bachtler S, Bart H-J. Polyphenols from Red Vine Leaves Using Alternative Processing Techniques. Processes. 2018; 6(12):262. https://doi.org/10.3390/pr6120262
Chicago/Turabian StyleBachtler, Simone, and Hans-Jörg Bart. 2018. "Polyphenols from Red Vine Leaves Using Alternative Processing Techniques" Processes 6, no. 12: 262. https://doi.org/10.3390/pr6120262
Note that from the first issue of 2016, this journal uses article numbers instead of page numbers. See further details here.