
Heat Generation in Irradiated Gold Nanoparticle Solutions for Hyperthermia Applications


1
School of Mechanical and Manufacturing Engineering, The University of New South Wales, Sydney, NSW 2052, Australia
2
Department of Aeronautics and Astronautics, Fudan University, Shanghai 200433, China
3
Australian Nuclear Science and Technology Organization (ANSTO), Kirrawee, NSW 2232, Australia
*
Author to whom correspondence should be addressed.
Processes 2021, 9(2), 368; https://doi.org/10.3390/pr9020368
Submission received: 29 December 2020
/
Revised: 15 February 2021
/
Accepted: 15 February 2021
/
Published: 17 February 2021
(This article belongs to the Special Issue Heat Transfer in Biomedical Applications)
Abstract
:Gold nanoparticles (GNP) aided hyperthermia has demonstrated promising results in the treatment of cancer. However, most existing investigations focus only on the extinction spectra of GNP solutions, few reported the actual heat generation capability of these solutions to estimate their real potential in in-situ hyperthermia treatment. In this study, the impact of GNP clustering on the optical properties and heating capability of GNP aggregates in acidic solutions have been investigated. It was found that localized heat generation could be significantly enhanced (to up to 60.0 °C) when acidic solutions were illuminated by a near infrared light source at 1.7 W/cm2. In addition, infrared thermography imaging can only detect the surface temperature during thermal treatment, leaving the localized temperature distribution inside the tissues unknown. To overcome this limitation, in this study, the absorbed energy during NIR irradiation in GNP solutions was obtained computationally by coupling the P1 approximation with the DDA calculation to predict the localized temperature change in the solutions. It was demonstrated that due to the accumulation and dissipation of heat, some local areas showed higher temperature increase with the hot spots being connected and merged over time.
1. Introduction
The usage of heat as a method of treating diseases has been known in different cultures since ancient times. Nowadays, thermotherapy is a potential treatment for destroying radio-resistant cancer cells. By using mild hyperthermia therapy, tissues are heated to a temperature within the range 39–45 °C [1]. At this temperature, properties of specific tumor tissues can be gradually altered because they have a lower heat tolerance than normal cells [2]. The normal cells, with a rather high heat tolerance, can survive under this temperature range.
While thermotherapy has shown promising clinical results, it is often difficult to control the heat generation and temperature distribution in tumors and not to overheat surrounding healthy tissues. Gold nanoparticles (GNPs) have shown unique promise in hyperthermia treatments because of their biocompatibility and strong optical resonant absorption of near infrared (NIR) light in the so-called optical therapeutic window [2,3,4]. This therapeutic window stems from the fact that the human skin tissues only weakly absorb light with wavelengths between 650 and 900 nm (optical window). Therefore, NIR light can optically penetrate biological tissues and excite the GNPs embedded inside superficial tumors to generate localized heating.
The advantage of this approach is that particles can be conjugated to specific antibodies or targeting ligands which, in turn, penetrate leaky tumor blood vessels to selectively target cancerous cells [5]. It was shown in [6] that aggregation of the gold NPs has a beneficial effect in killing protozoan parasite cells because it red-shifts their peak optical extinction towards wavelengths at which human tissue is more transparent and increases the absorption of light. The benefit of such an aggregation-induced red-shift of plasmonic resonance for selective heating was also observed in [7] where it was shown that 15 nm diameter gold NPs coated with lipoic acid had a tendency to aggregate at low pH, such as within tumors whilst in surrounding normal tissue and blood they were not aggregated and therefore do not produce significant heating because of poor light absorption. Peng et al. [8] produced GNP aggregations by controlling the pH value of the solutions. GNP aggregates were found when the base fluid of the solution had a pH value of 6.5. Based on Peng et al.’s experiment [8], Li et al. [9] predicted the distribution profile of GNPs in a 1.5 × 1.5 µm observation window in the acidic solution and validated their prediction by comparing the calculated optical properties of GNPs in the region with the measured optical properties obtained by Peng et al. [8]. Since the clustering of the GNPs can shift the wavelength of GNP’s surface plasmon resonance (SPR) significantly [10], the heating efficiency of GNPs, which highly depends on the optical properties, can also be impacted by the configurations of GNP aggregates and self-assemblies [11,12]. It is thus important to study both the optical properties of nonuniformly dispersed GNP solutions along with their resulting temperature increase. However, there have been limited previous studies investigating the heating efficiency of GNPs in hyperthermia with the consideration of the optical properties of GNP aggregates. Although several previous studies [13,14] investigated the optical properties of GNP aggregates, only simple and limited GNP configurations were studied.
The impact of GNP clustering on the optical properties of GNP aggregates is thus researched in the present study to provide an insightful understanding on the heating efficiency of complex GNP configurations predicted by Li et al. [9] and localized heat generation around the irradiated GNPs in solutions of various conditions.
2. Materials and Methods
2.1. Materials
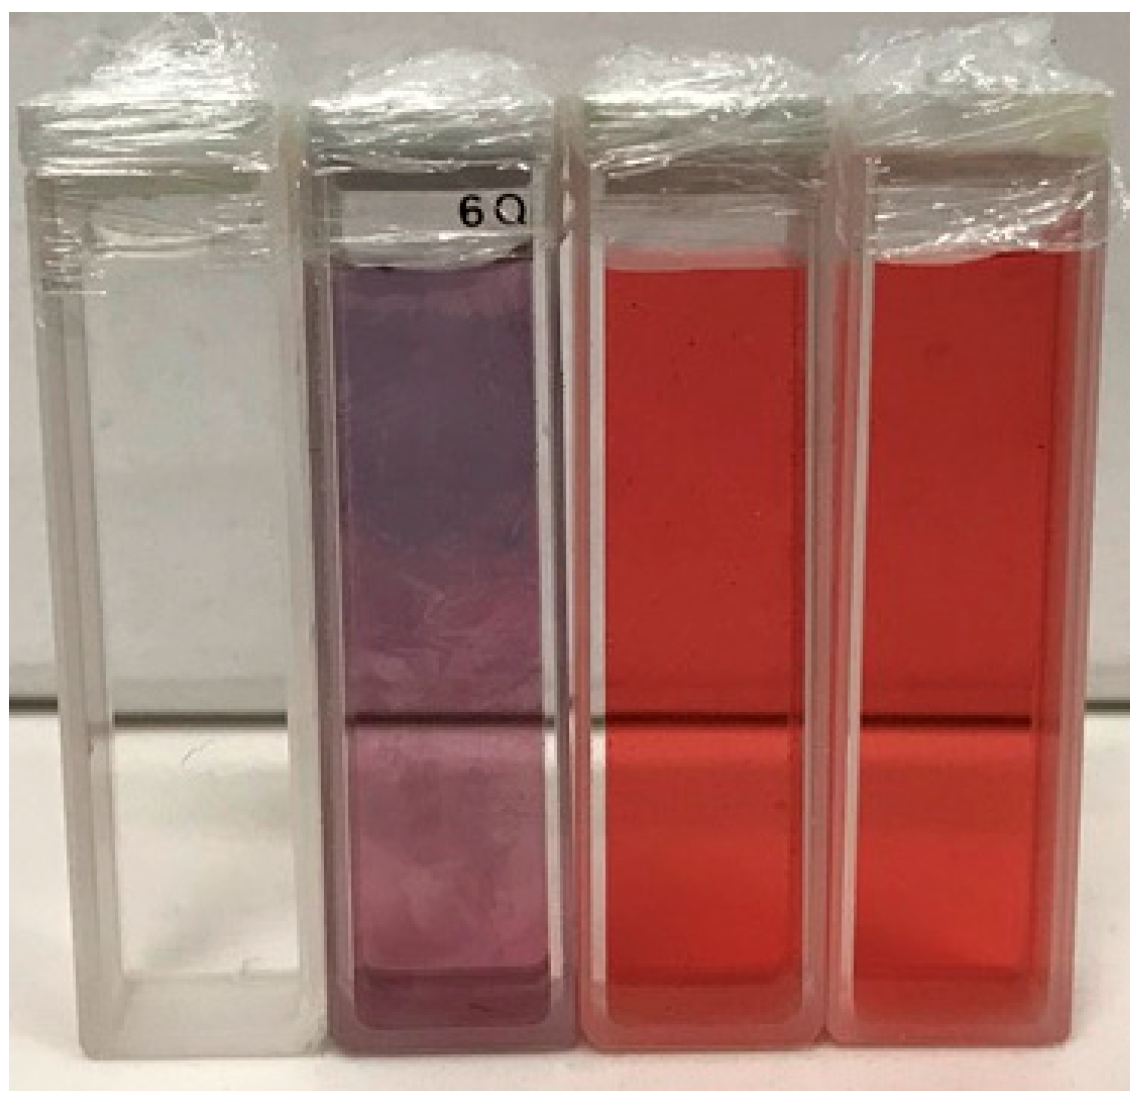
The nanoparticle solutions used in this study were purchased from Sigma-Aldrich®. The diameter of the GNPs is 20 nm, which is within the range of suitability for accumulation in tumor tissues without toxicity [15]. The density concentration of the purchased solution is 6.54 × 10¹¹ mL−1 and the surface plasmon resonance (SPR) of the solution is suggested to be around 520 nm by the manufacturer. The solutions were stored at 8 °C when not in use. To adjust the pH of these nanoparticle solutions, 1 mol/L citric acid and 0.1 mol/L NaOH solutions were prepared and gradually added to the solutions using pipettes. The resulting pH value of the nanoparticle solution was then measured by a pH meter. GNP solutions of three different pH values were prepared in this study, namely pH = 3.5, 6.0, and 7.3. As shown in Figure 1, the resultant color of the samples with pH = 6.0 and 7.3 remained dark orange to red, whereas the color of GNP solution with pH = 3.5 turned blue. The observed color of the sample is the color of the light transmitted through the GNP solution, which is the complementary color to the color of the light absorbed by the solution. Therefore, it can be predicted from the color observation that there is a significant red shift of the plasmonic absorption resonance of the GNP solution with pH = 3.5.
2.2. Optical Predictions
The discrete dipole approximation (DDA) approach in calculating the optical properties of particles with arbitrary geometries introduced by DeVoe [16] is considered one of the most flexible and reliable methods. In this approach, the target is replaced by an array of point dipoles, known as polarizable points. The electromagnetic scattering problem for an incident periodic wave interacting with this array of point dipoles is then precisely solved. In the present study, a DDA code named Discrete Dipole Scattering (DDSCAT) 7.3 [17] was applied to calculate the absorption and scattering efficiency of GNPs. Draine and Flatau [17] developed and validated the DDSCAT code based on Mie theory. This code has been adopted and validated in previous studies of GNPs and assemblies [18,19].
To calculate the heat generation due to absorbed radiation power when nanoparticle solutions are exposed to NIR light, the radiation transfer must be solved first. According to Dombrovsky [20], the absorption and scattering coefficient of the solution containing nanoparticles can be calculated using Equation (1):
where and are the absorption coefficient of the solutions and base fluid, respectively. σs and σs,o are the scattering coefficient of the solutions and base fluid, respectively. is the volume fraction of the GNPs in the solution.
The amount of absorption and scattering of the radiation energy is usually identified by the absorption and scattering coefficients Aabs and Asca. The total amount of absorption and scattering energy is called the extinction, which is expressed in the term of the extinction cross section Aext. The dimensionless efficiency factors of these optical properties ηabs, ηsca and ηext are commonly used as:
where r is the radius of a particle.
The size of the target is characterized by the effective radius reff to calculate the arbitrary geometry.
It is important to note that the scattering problem is characterized by the so-called diffraction or size parameter:
where λ is the wavelength of the incident light.
In DDSCAT, the arbitrary target consists of N dipoles with lattice spacing d. V is the volume of the arbitrary geometry.
Since the solutions used in this study are aqueous, the refractive index of water, 1.33, is applied as the refractive index of the ambient at all wavelengths.
2.3. Experimental Measurement of Heat Generation
A Hydrosun® 750 lamp with a water filter was used to irradiate the samples near their Longitudinal Surface Plasmon Resonance (LSPR). Additional bandpass filters were selected based on the spectra measured using a Perkin Elmer® Lambda 1050 UV/Vis Spectrophotometer (Perkin Elmer, Waltham, MA, USA) to further limit the radiation from the lamp to that of the optical window of biological tissues. The specific light intensity of the Hydrosun® 750 lamp (Hydrosun Medizintechnik GmbH, Müllheim, Germany) was previously analyzed by Dombrovsky et al. [21]. It should be noted that the Hydrosun® 750 lamp was adopted in this experiment because it is widely used in clinical treatments as means to deliver a mild hyperthermia to the cancerous tissues, such as recurrent breast cancer [22].
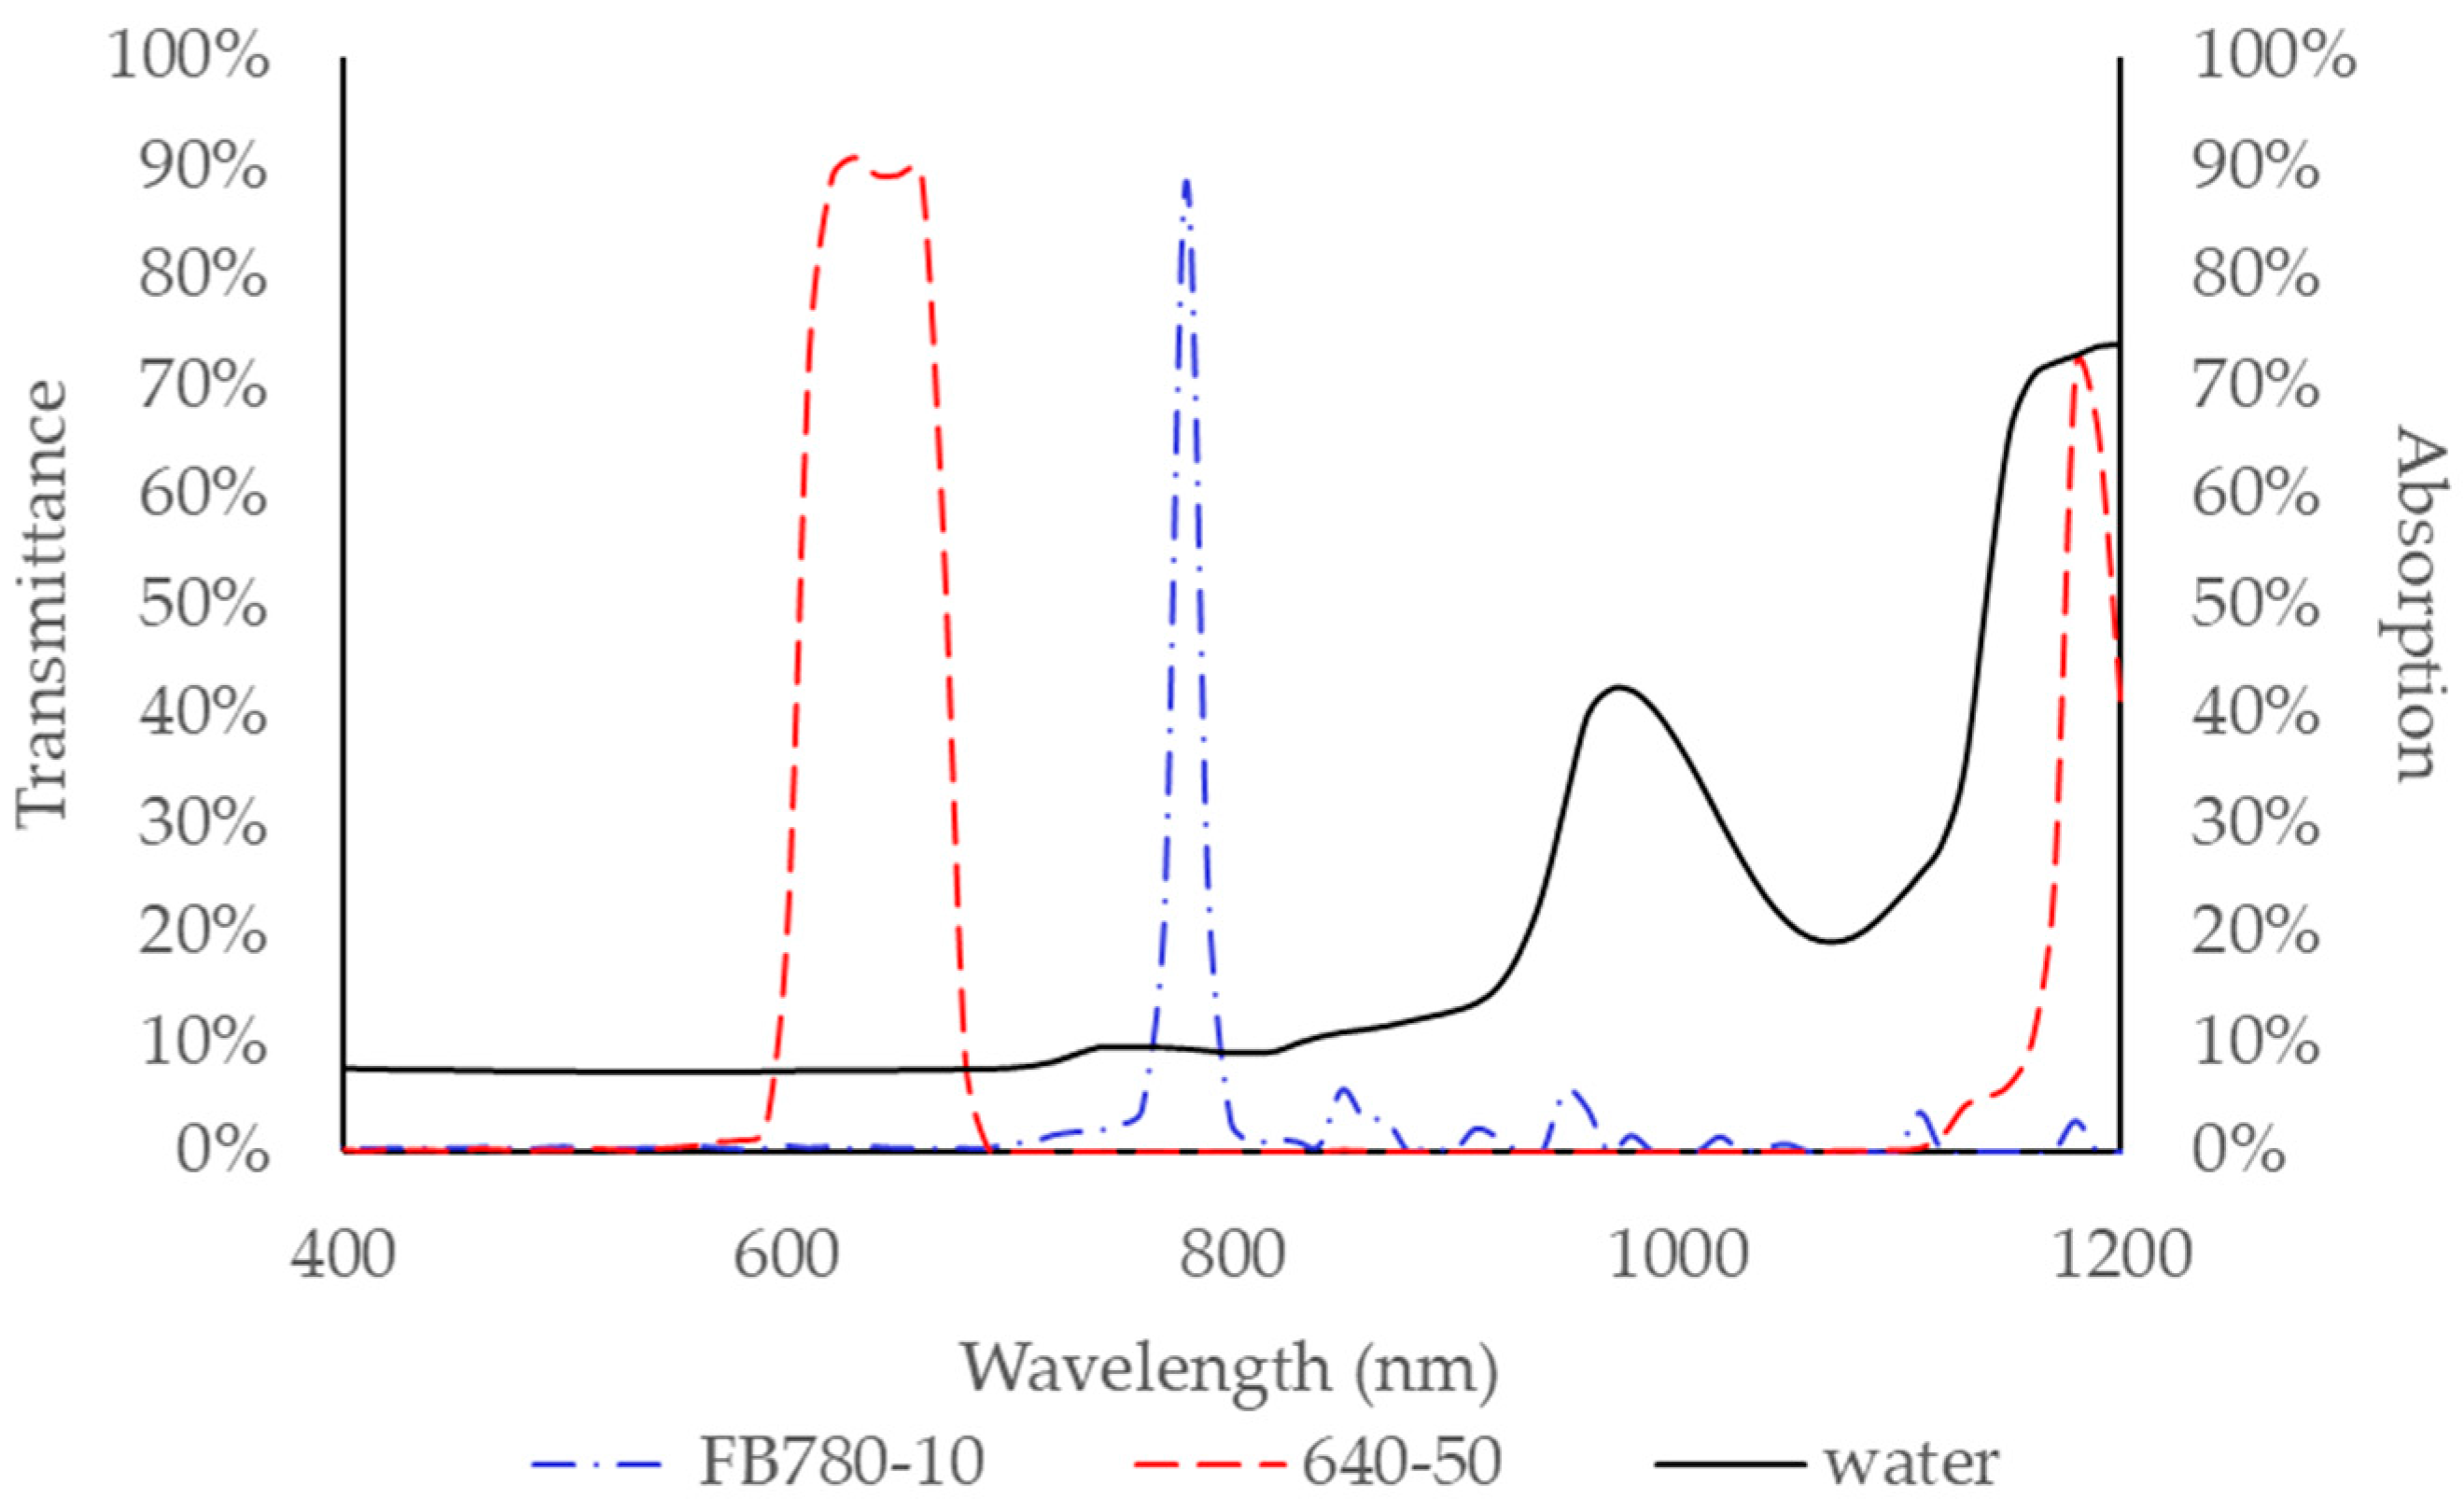
The transmittance spectra of the FB780-10 filter and the 640-50 filter are shown in Figure 2. The optical transmittance of NIR light through water and a FB780-10 filter at 780 nm wavelength is over 55%. The diameter of the filters is 1 inch (25.4 mm), which is slightly larger than the width of the sample containers (25 mm).
The intensity of the radiation is calculated using the following equations:
where is the spectral irradiance of the Hydrosun® 750 lamp at wavelength [21], is the transmittance of the filters (refer to Figure 2). The range limits and are also determined by the transmittance spectrum, while represents the overall intensity transmitted through the filter from to wavelength.
The intensity of the lamp was measured in present study using the Thorlabs® S305C thermal power sensor (Thorlabs Inc., Newton, NJ, USA). The intensity of the lamp measured at the wavelength of NIR light was around 1.58 kW/m2, which is in good agreement with the intensity values measured by Dombrovsky et al. [21].
The concentrated intensity of the lamp passing through a lens, measured at the same wavelength, was around 19.0 kW/m2. The concentrated light source was applied in some of the thermal experiments to increase the intensity of the NIR light to ensure a more distinct, hence, temperature difference can be more accurately measured. The light intensity applied in each experiment will be specified.
To minimize experimental error, the thermocouples were calibrated at 0 and 100 °C by placing the thermocouples in an ice/water mixture and in boiling water, respectively.
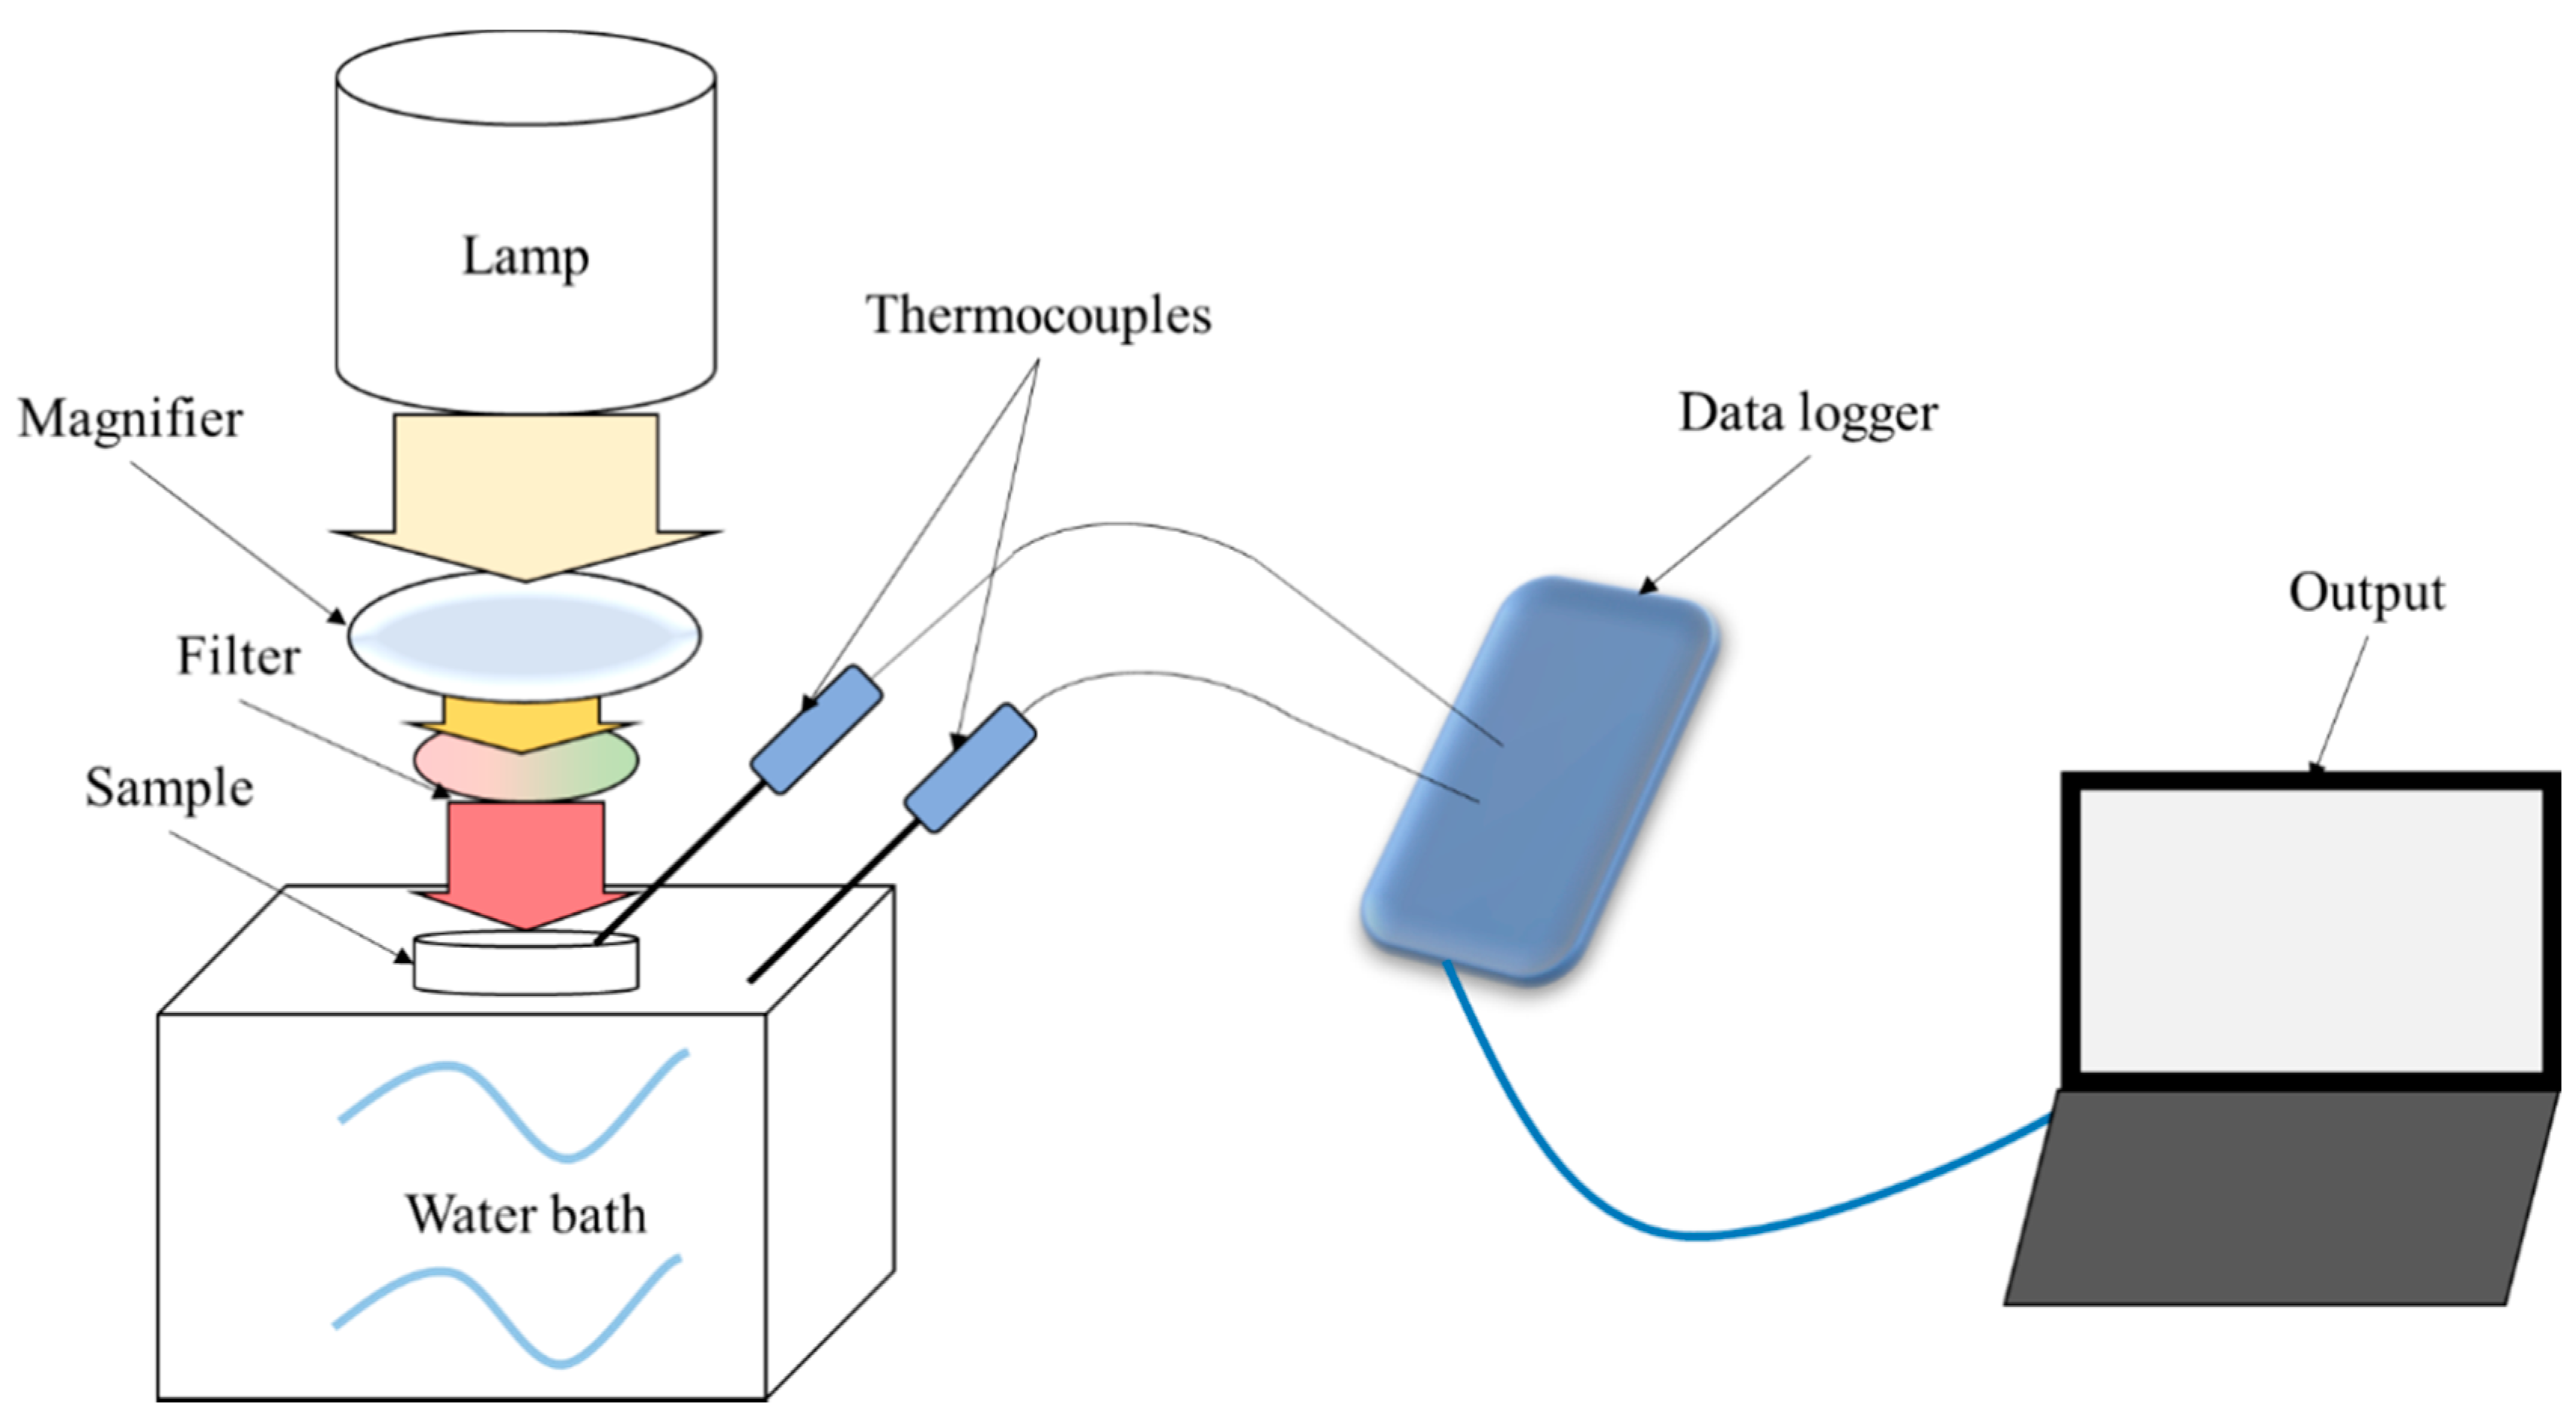
Figure 3 shows the schematic of the thermal experiment setup. During the experiment, the sample was placed in a water bath to limit heat loss. The temperature in the water bath was maintained at 37 °C to mimic human body temperature. The top of the sample was covered by clear wrap to reduce convection heat loss. As mentioned above, an optical bandpass filter was placed above the sample. Thermocouples were used to continuously measure the local temperature inside the sample and the water bath. The experimental data was captured by PicoLog® data logger.
At the start of thermal experiment, the water bath was turned on to heat up the water to 37 °C. The sample to be measured was then placed in the water bath. The thermocouples, data logger and computer were connected and positioned as shown in Figure 3, and the recording interval and output format was programmed using the PicoLog® 6 software. After both thermocouples reached an equilibrium temperature of 37 °C, the temperature recording system and the lamp were turned on. The exposure time was programmed using the timer on the lamp. After 600 s, the lamp was turned off and the temperature was recorded for another 200 s.
2.4. Numerical Prediction of Heat Generation
In order to numerically compute the localized heat generation around illuminated GNPs, the following energy equation was solved in the present study:
where and are the specific heat capacity and thermal conductivity, T is the temperature, and represents the volumetric source due to absorbed radiation calculated as shown below in Equation (14).
The radiative transfer equation (RTE) for an absorbing, emitting and scattering medium at the position in the direction is:
where I is the radiation intensity. is the scattering direction vector, n is the refractive index, is the Stefan–Boltzmann constant, and is the solid angle. The absorption coefficient α and scattering coefficient σs were calculated from Equation (1), is the phase function.
where C is the linear-anisotropic phase function coefficient, which is a property of the fluid. For most of biological tissues, this coefficient is around 0.9, which indicates that more radiant energy is scattered forward than backward.
P1 radiation is based on the expansion of the radiation intensity into an orthogonal series of spherical harmonics. When modeling the radiation problem using P1 approximation in ANSYS Fluent [23], the radiation flux is expressed as:
where G is the incident radiation.
The volumetric source term due to absorbed radiation in P1 approximation is:
Since the thermocouples used can only measure the temperature at one point within the solution, detailed temperature distribution within the GNP solutions resulted from the GNP aggregates remained unknown. The aggregation structures of GNPs shown in Li et al. [9] are considered, in order to calculate the localized heat generation around irradiated GNPs in the acidic solution at the presented 1.5 × 1.5 µm observation window.
As demonstrated in Li et al. [9], large size GNP aggregates are formed in acidic solutions. The heating efficiency of GNPs, which highly depends on their optical properties, can be significantly impacted by the configurations of GNP aggregates and self-assemblies [11,12]. The heating efficiency of various complex GNP configurations in solutions was thus studied in the present work to gain an insight to the localized heat generation around the irradiated GNPs in solutions.
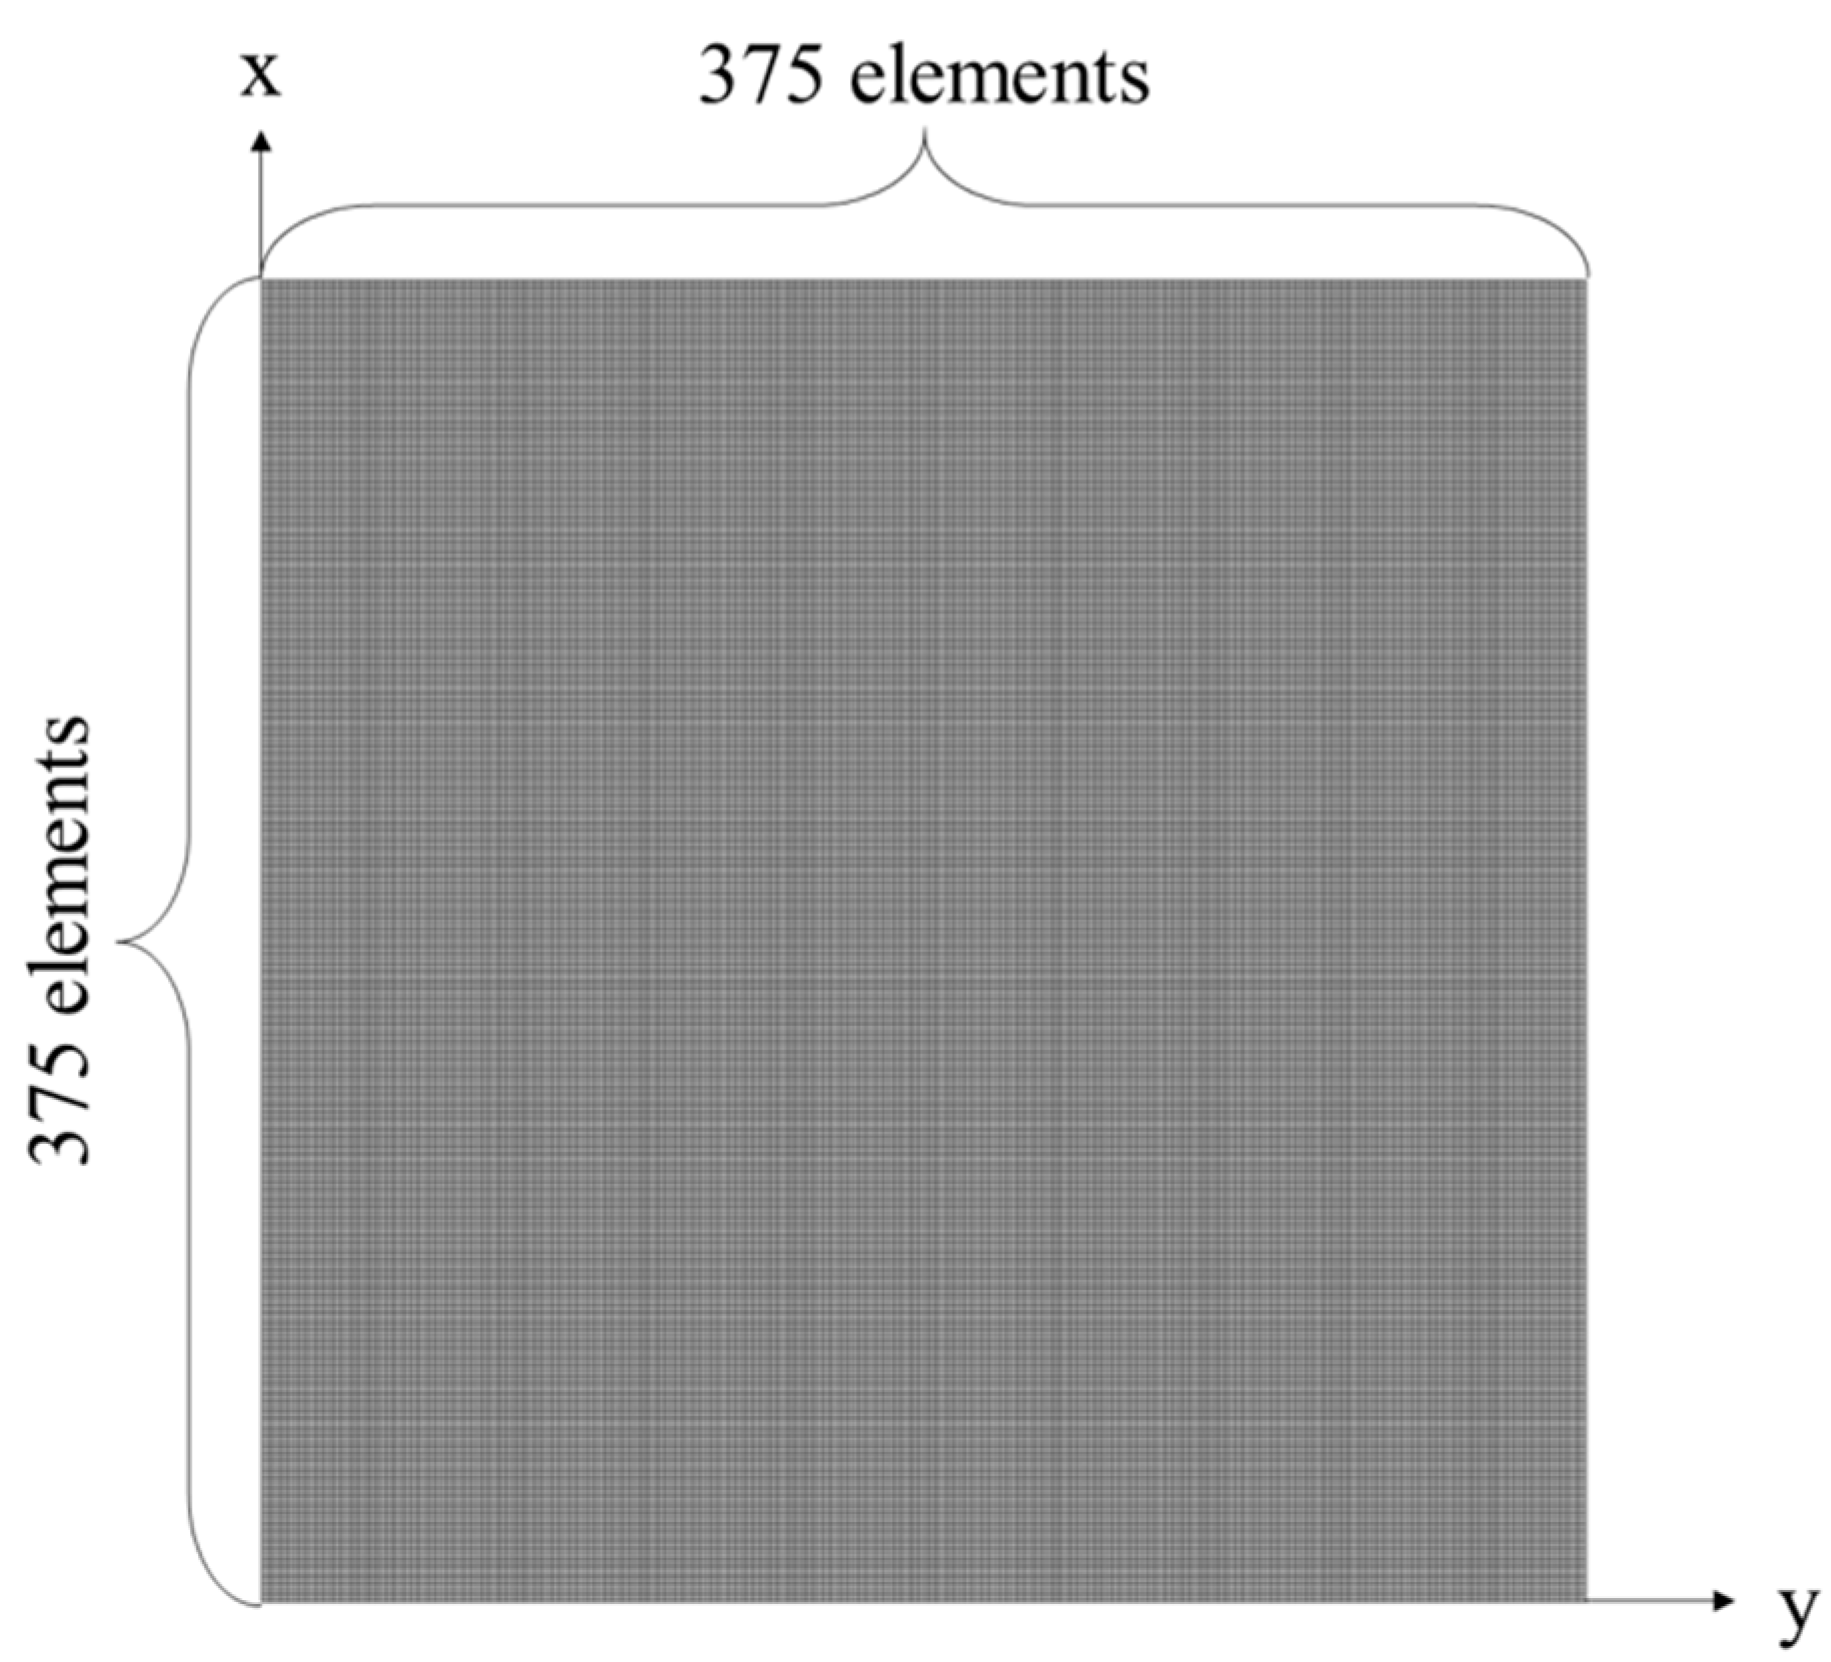
In the current study, a 1.5 × 1.5 µm computational domain, with the same dimension of the observation window in Li et al. [9], was discretized into 375 × 375 × 1 cells as presented in Figure 4. A coarser and a finer meshing models with 200 × 200 × 1 and 500 × 500 × 1 cells were also examined to verify the mesh dependency of the calculation. Mesh convergence was achieved for the verification purpose.
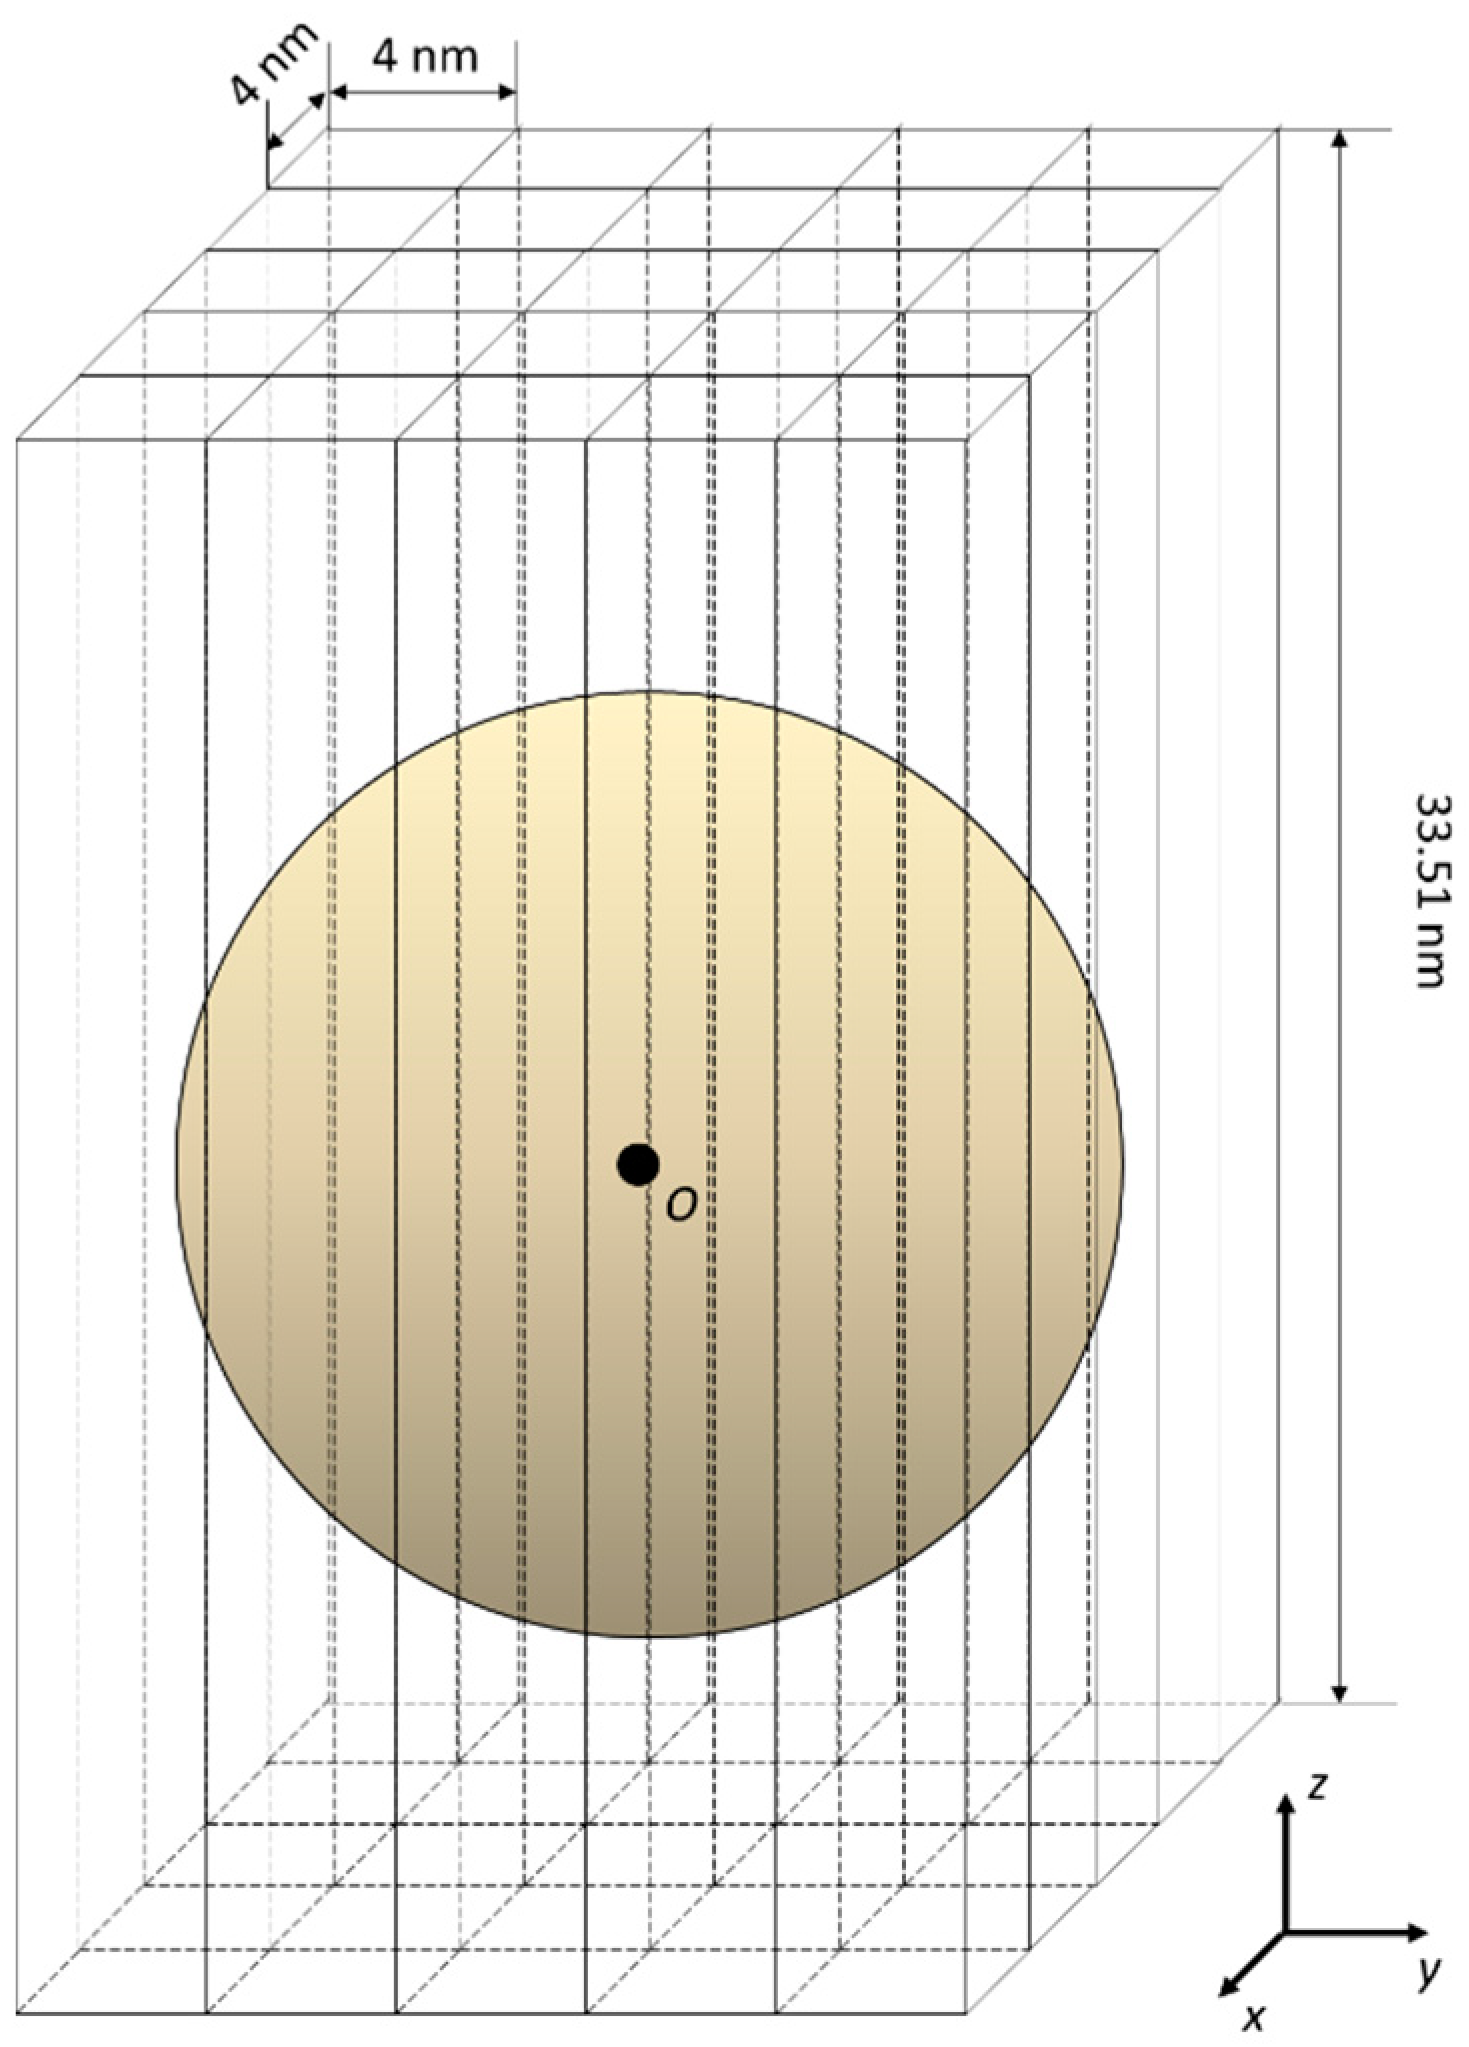
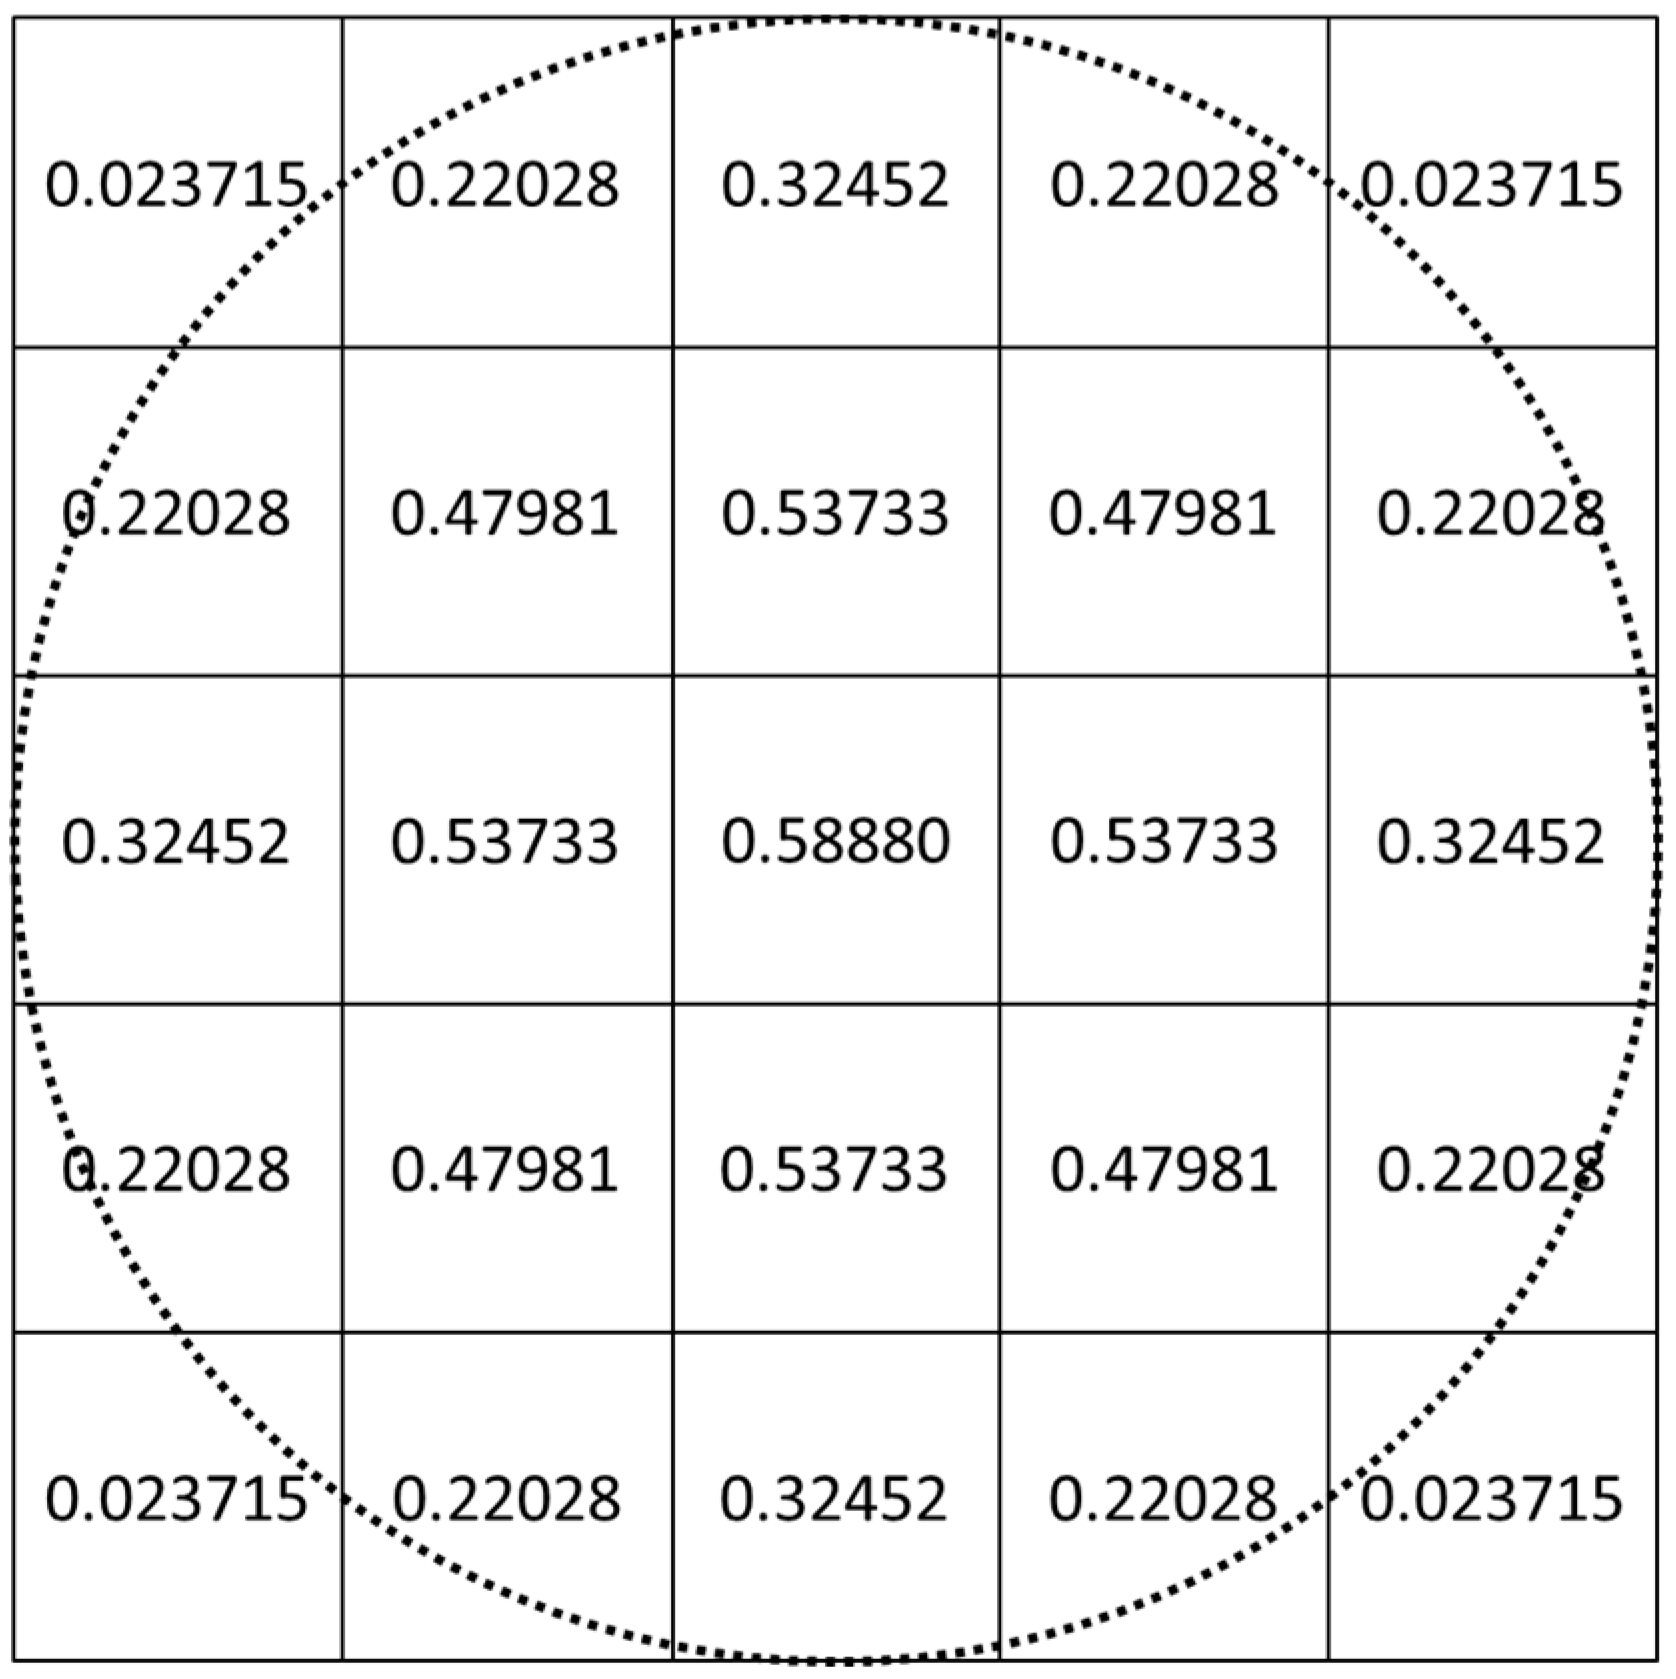
The dimension of each cell in the present model is 4 × 4 × 33.51 nm, and the height of the cell is 33.51 nm. Thus, the volume fraction of GNPs is the same as the case calculated by Li et al. [9]. A GNP and the cells containing the GNP are demonstrated in Figure 5. The coordinates of GNP centroids in the observation window were obtained from Li et al. [9]. The centroids of the GNPs are always aligned with element centers, so the volume fraction of a GNP in each relevant cell can be calculated as shown in Figure 6.
The volumetric properties of each cell can be calculated using the volume fraction values presented in Figure 6.
where , and represent the volumetric material properties of cell and properties of water and gold, respectively. and can be replaced by the corresponding volumetric material properties of cell, such as density and thermal conductivity.
To predict the localized heat generation around irradiated GNP aggregation structures, both the absorption and scattering efficiencies need to be considered to calculate the volumetric optical properties of the cells in the computational domain. The absorption and scattering coefficients of GNP solutions can be calculated as [20]:
where is the projected area of the GNP structures on the x-y plane of the computational domain in each cell. is the volume of the cells. For each GNP structure configuration, the corresponding DDA calculated and were used to calculate the optical properties of the cell containing this particular GNP aggregate structure. Thus, the localized volumetric radiation source term in the energy Equation (10) can be calculated by P1 approximation with volumetric material properties and the localized optical properties of cells. The P1 model has been proved valid for arbitrary optical thickness in a recent paper [24] with the assumption of linear dependence of the radiation intensity on the directional cosine. The angle is measured from the local direction of radiative flux [21].
The volumetric radiation source term was calculated and evaluated in each cell of the computational domain via a user-defined function in ANSYS Fluent®. The coupling of the P1 approximation model with the DDA calculation to predict the localized heat generation of irradiated GNP configurations in the surrounding regions is considered a very novel approach.
In the present numerical study, insulation boundary condition was applied to all surfaces of the computational domain and the initial temperature was set to 37 °C. The timestep of the transient model was 1 ns with 20 iterations and the results were saved every 10 timesteps. The computational model ran for 5 µs in total.
3. Results
3.1. Size Distributions
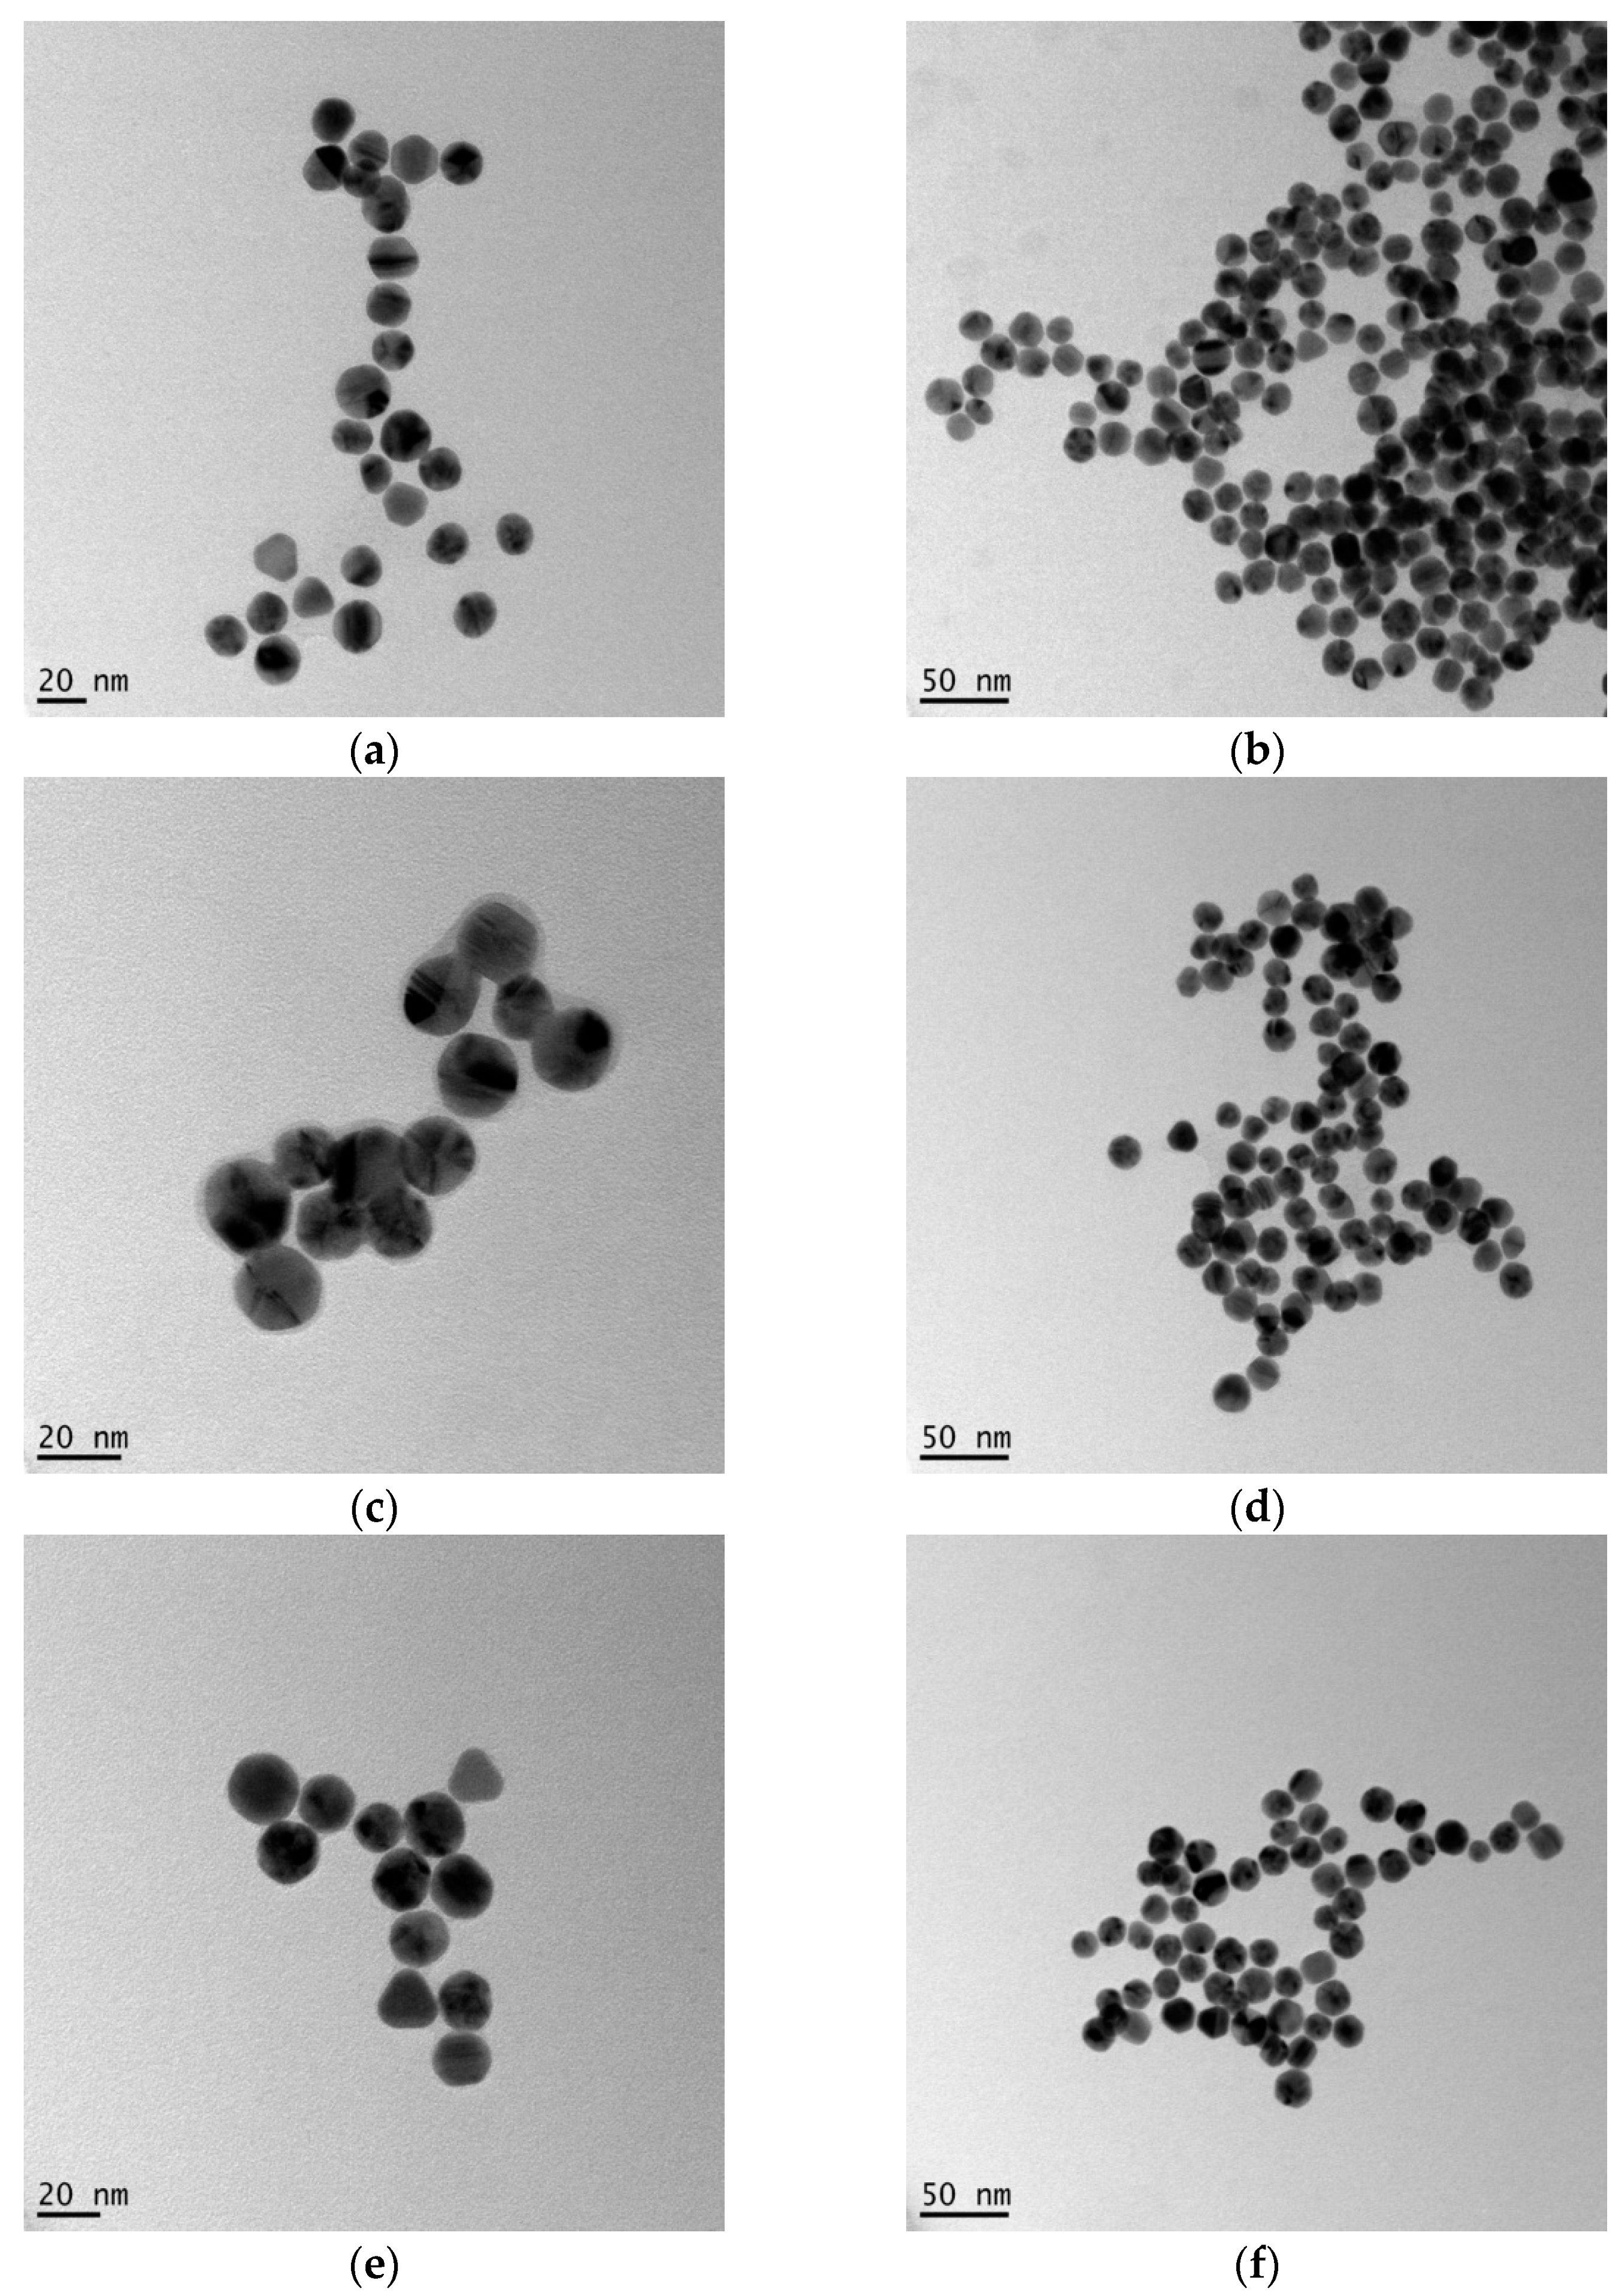
TEM images were obtained to visualize and study the GNP clustering behavior in suspensions, as shown in Figure 7. Suspended GNP in solutions of each pH level with reference scale of 20 and 50 nm were demonstrated.
More complex agglomerations of GNP formed when the base solutions were acidic. This observation shows good agreement with the results calculated by Li et al. [9]. With the three base fluid pH levels investigated, gold nanoparticle aggregates are more compact with larger fractal dimensions and higher mean coordination numbers at pH = 3.5, whereas a more ‘loose’ structure formed at pH = 6.7 and 9.4 due to larger electrostatic repulsive forces as a result of changes in the zeta potential and Debye length of the gold nanoparticles [9]. Apart from the overall trend, the configuration of GNP cluster in Figure 7a is very similar to the structure Octamer 8-1 predicted by Li et al.’s simulation [9] in a solution of pH = 3.5. Therefore, a few typical structures of GNP aggregates were chosen from Li et al.’s predictions [9] to calculate the optical properties of suspended GNP in acidic solution for further investigations.
3.2. Optical Properties
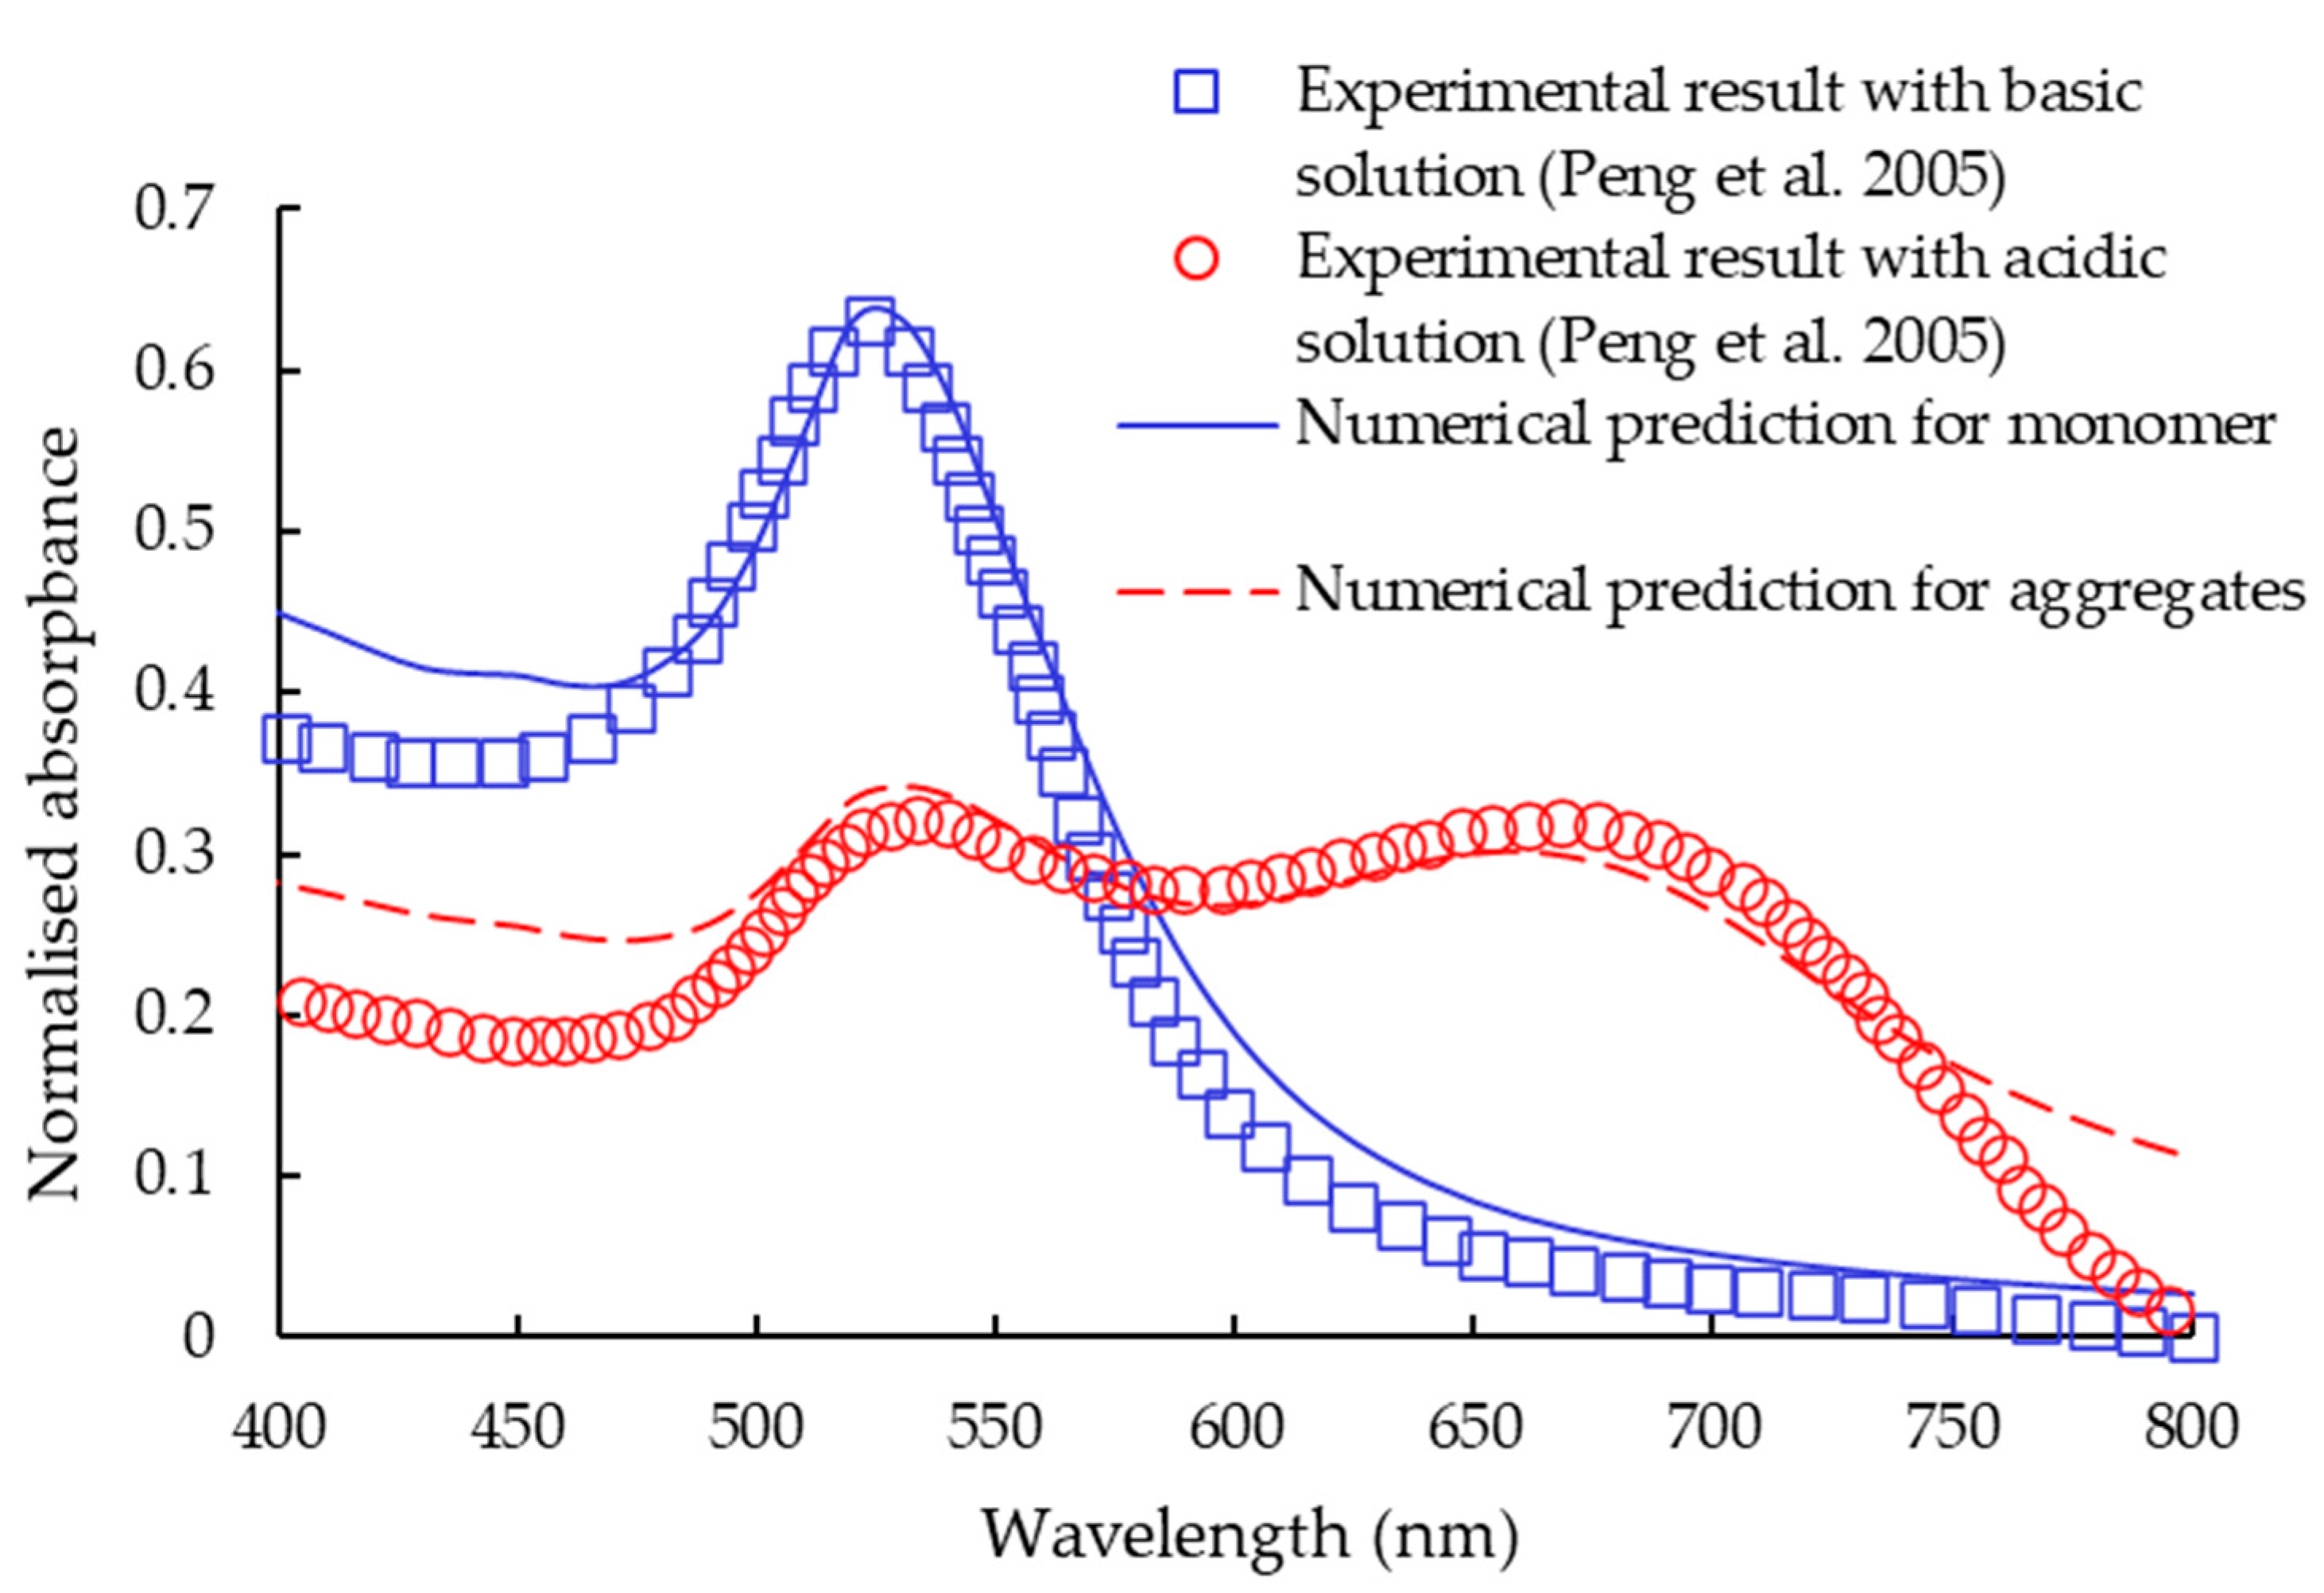
Based on the results of Li et al. [9] on the structures of particle aggregates present in acidic solutions (Table 1) the weight averaged absorbance was calculated and compared with the experimental results obtained by Peng et al. [8] for water-based basic (pH = 9.4) and acidic solutions (pH = 6.5). The comparison of the results for both basic solutions with monomer and also for the aggregates in acidic solutions with particle volume fraction 0.05 showed very close agreement, which confirmed the predictions of the structures. The dash line in Figure 8 is the weighted average of the absorbance of the structures shown in Table 1 (Monomer (29.7%), Dimer (43.9%), Trimer 3-0 (3.7%), Trimer 3-1 (13.6%), Tetramer 4-0 (0.5%), Tetramer 4-1 (3.6%), and Tetramer 4-2 (5.0%)) cases, as predicted by the discrete phase simulations with slightly acidic base fluid [9]. The predicted plasmonic resonance can be seen to be in good agreement with the experimental results.
The absorption and scattering efficiencies in Table 1 were applied to calculate the volumetric optical properties in each cell in the computational domain. As can be seen from the table, the configurations of Tetramer 4-2 showed the highest absorption efficiency at the wavelength of 640 nm.
3.3. Measured Temperature Change
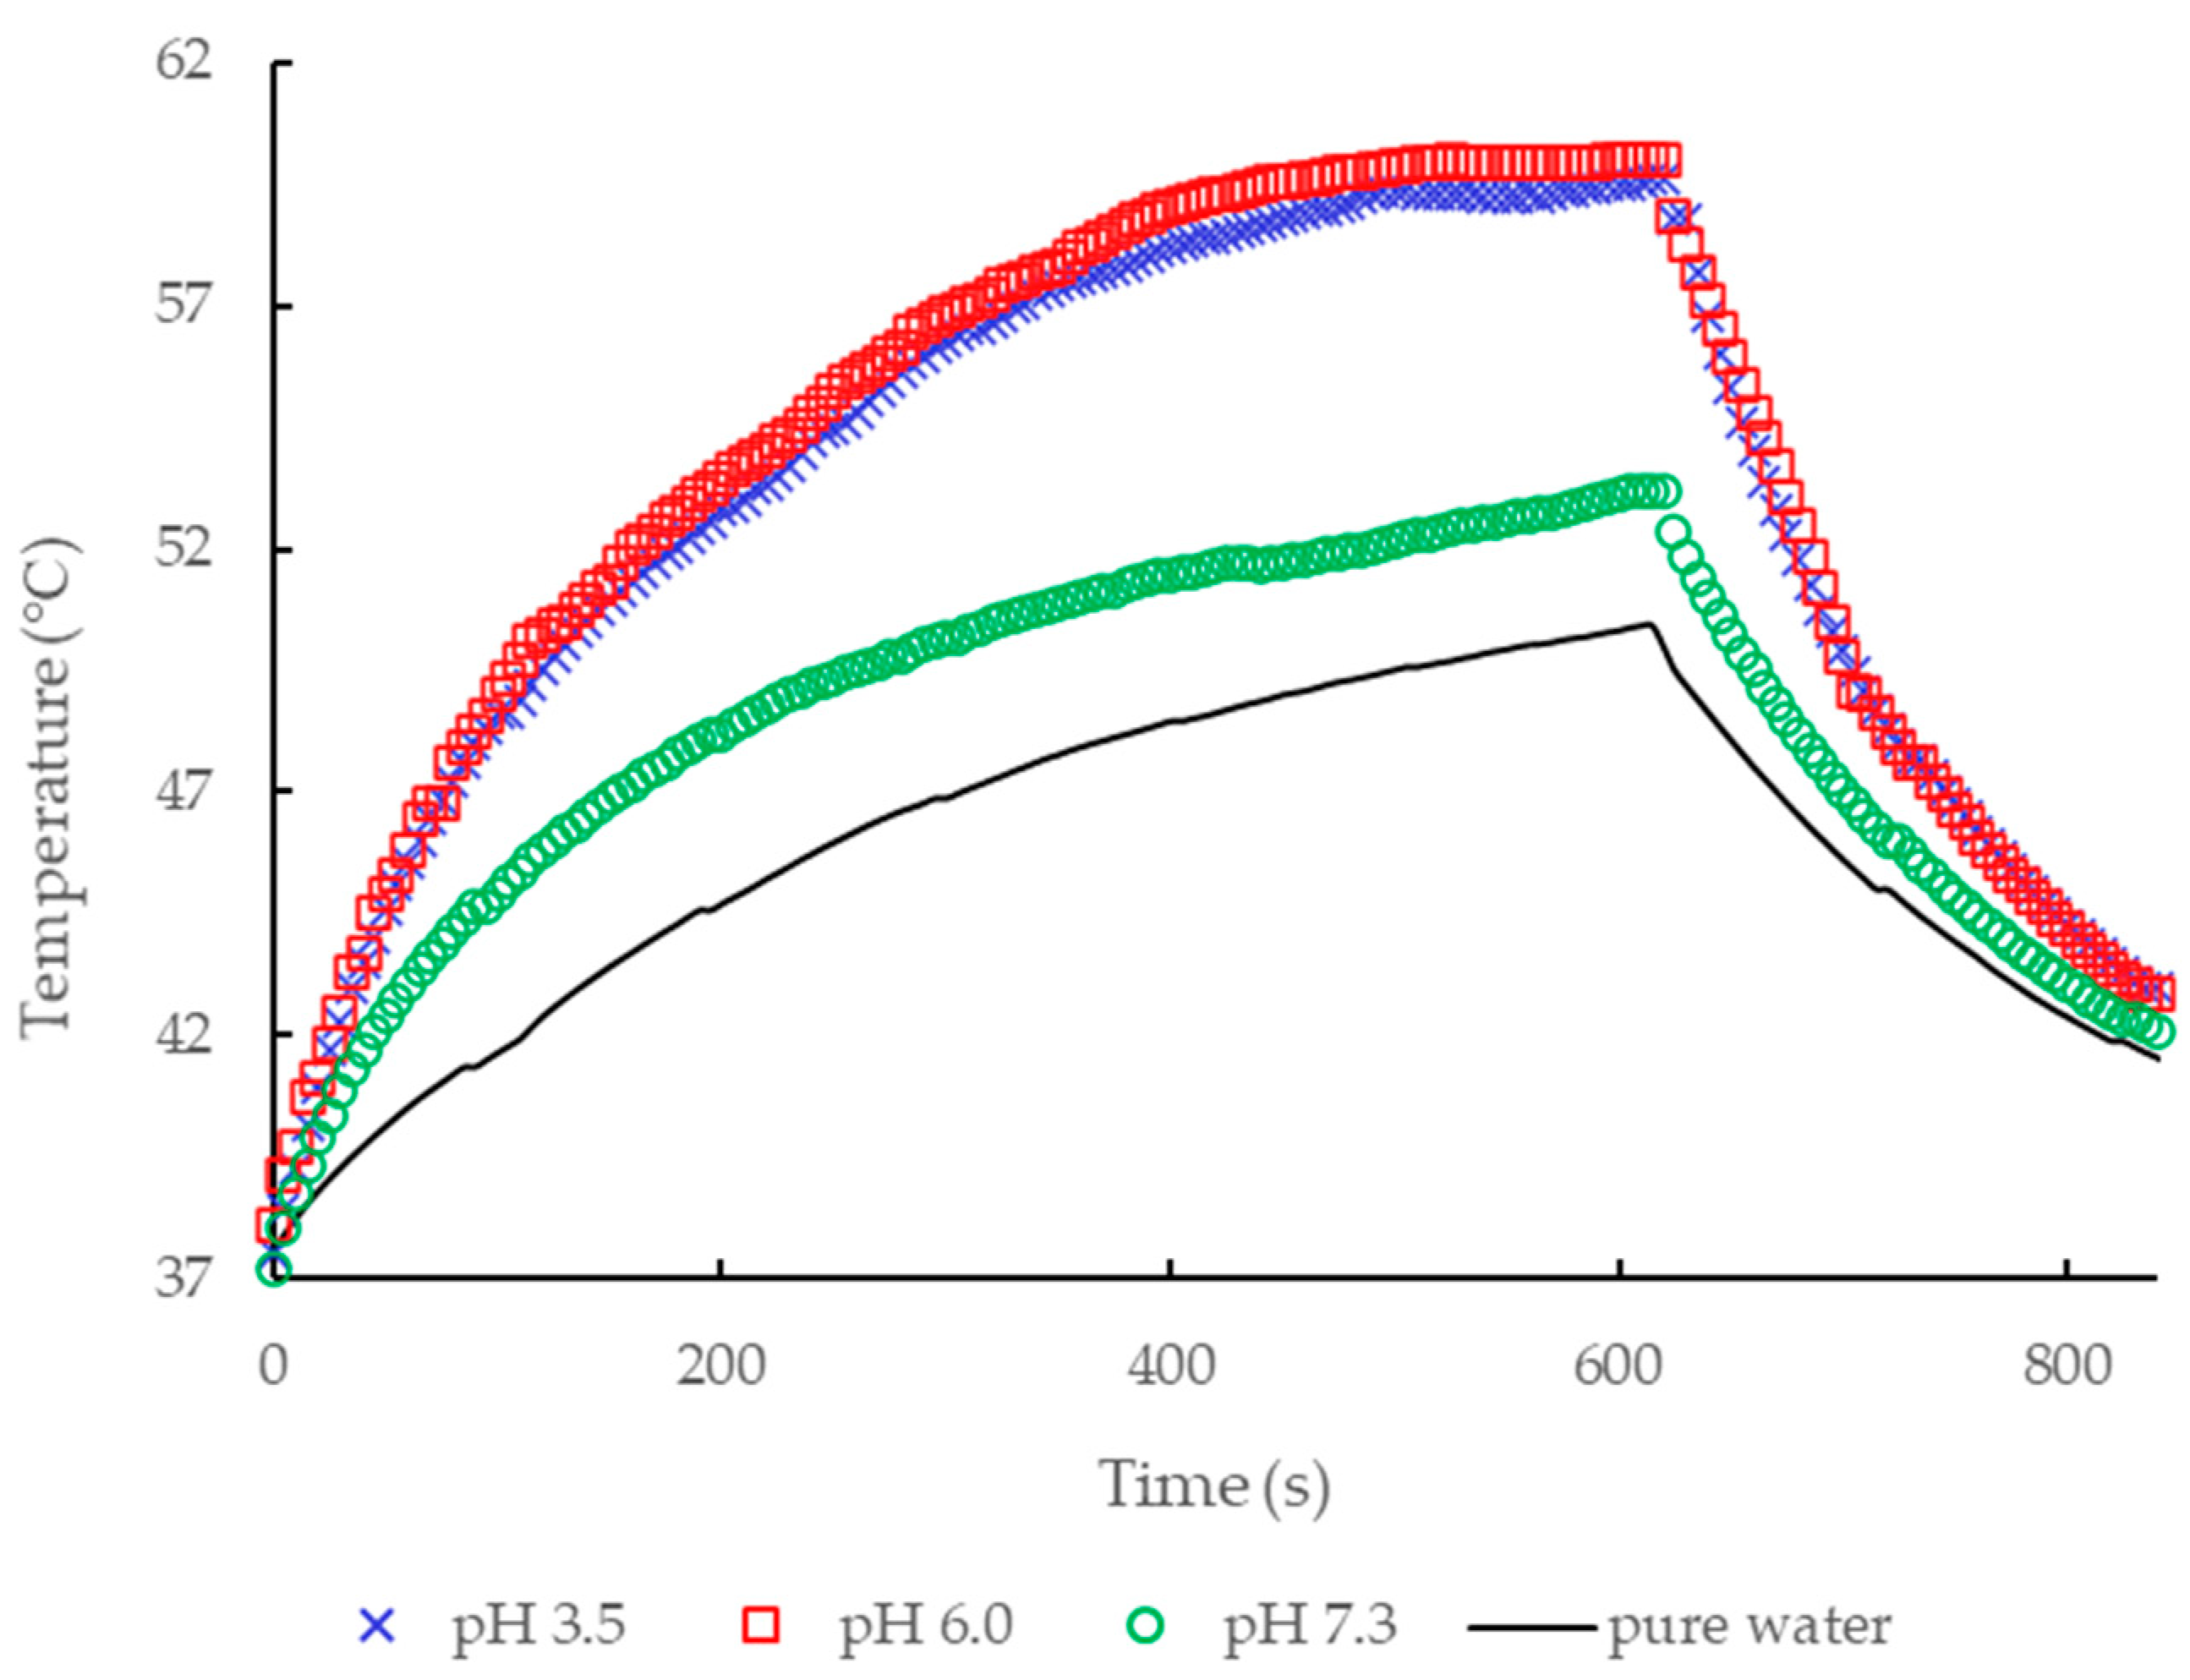
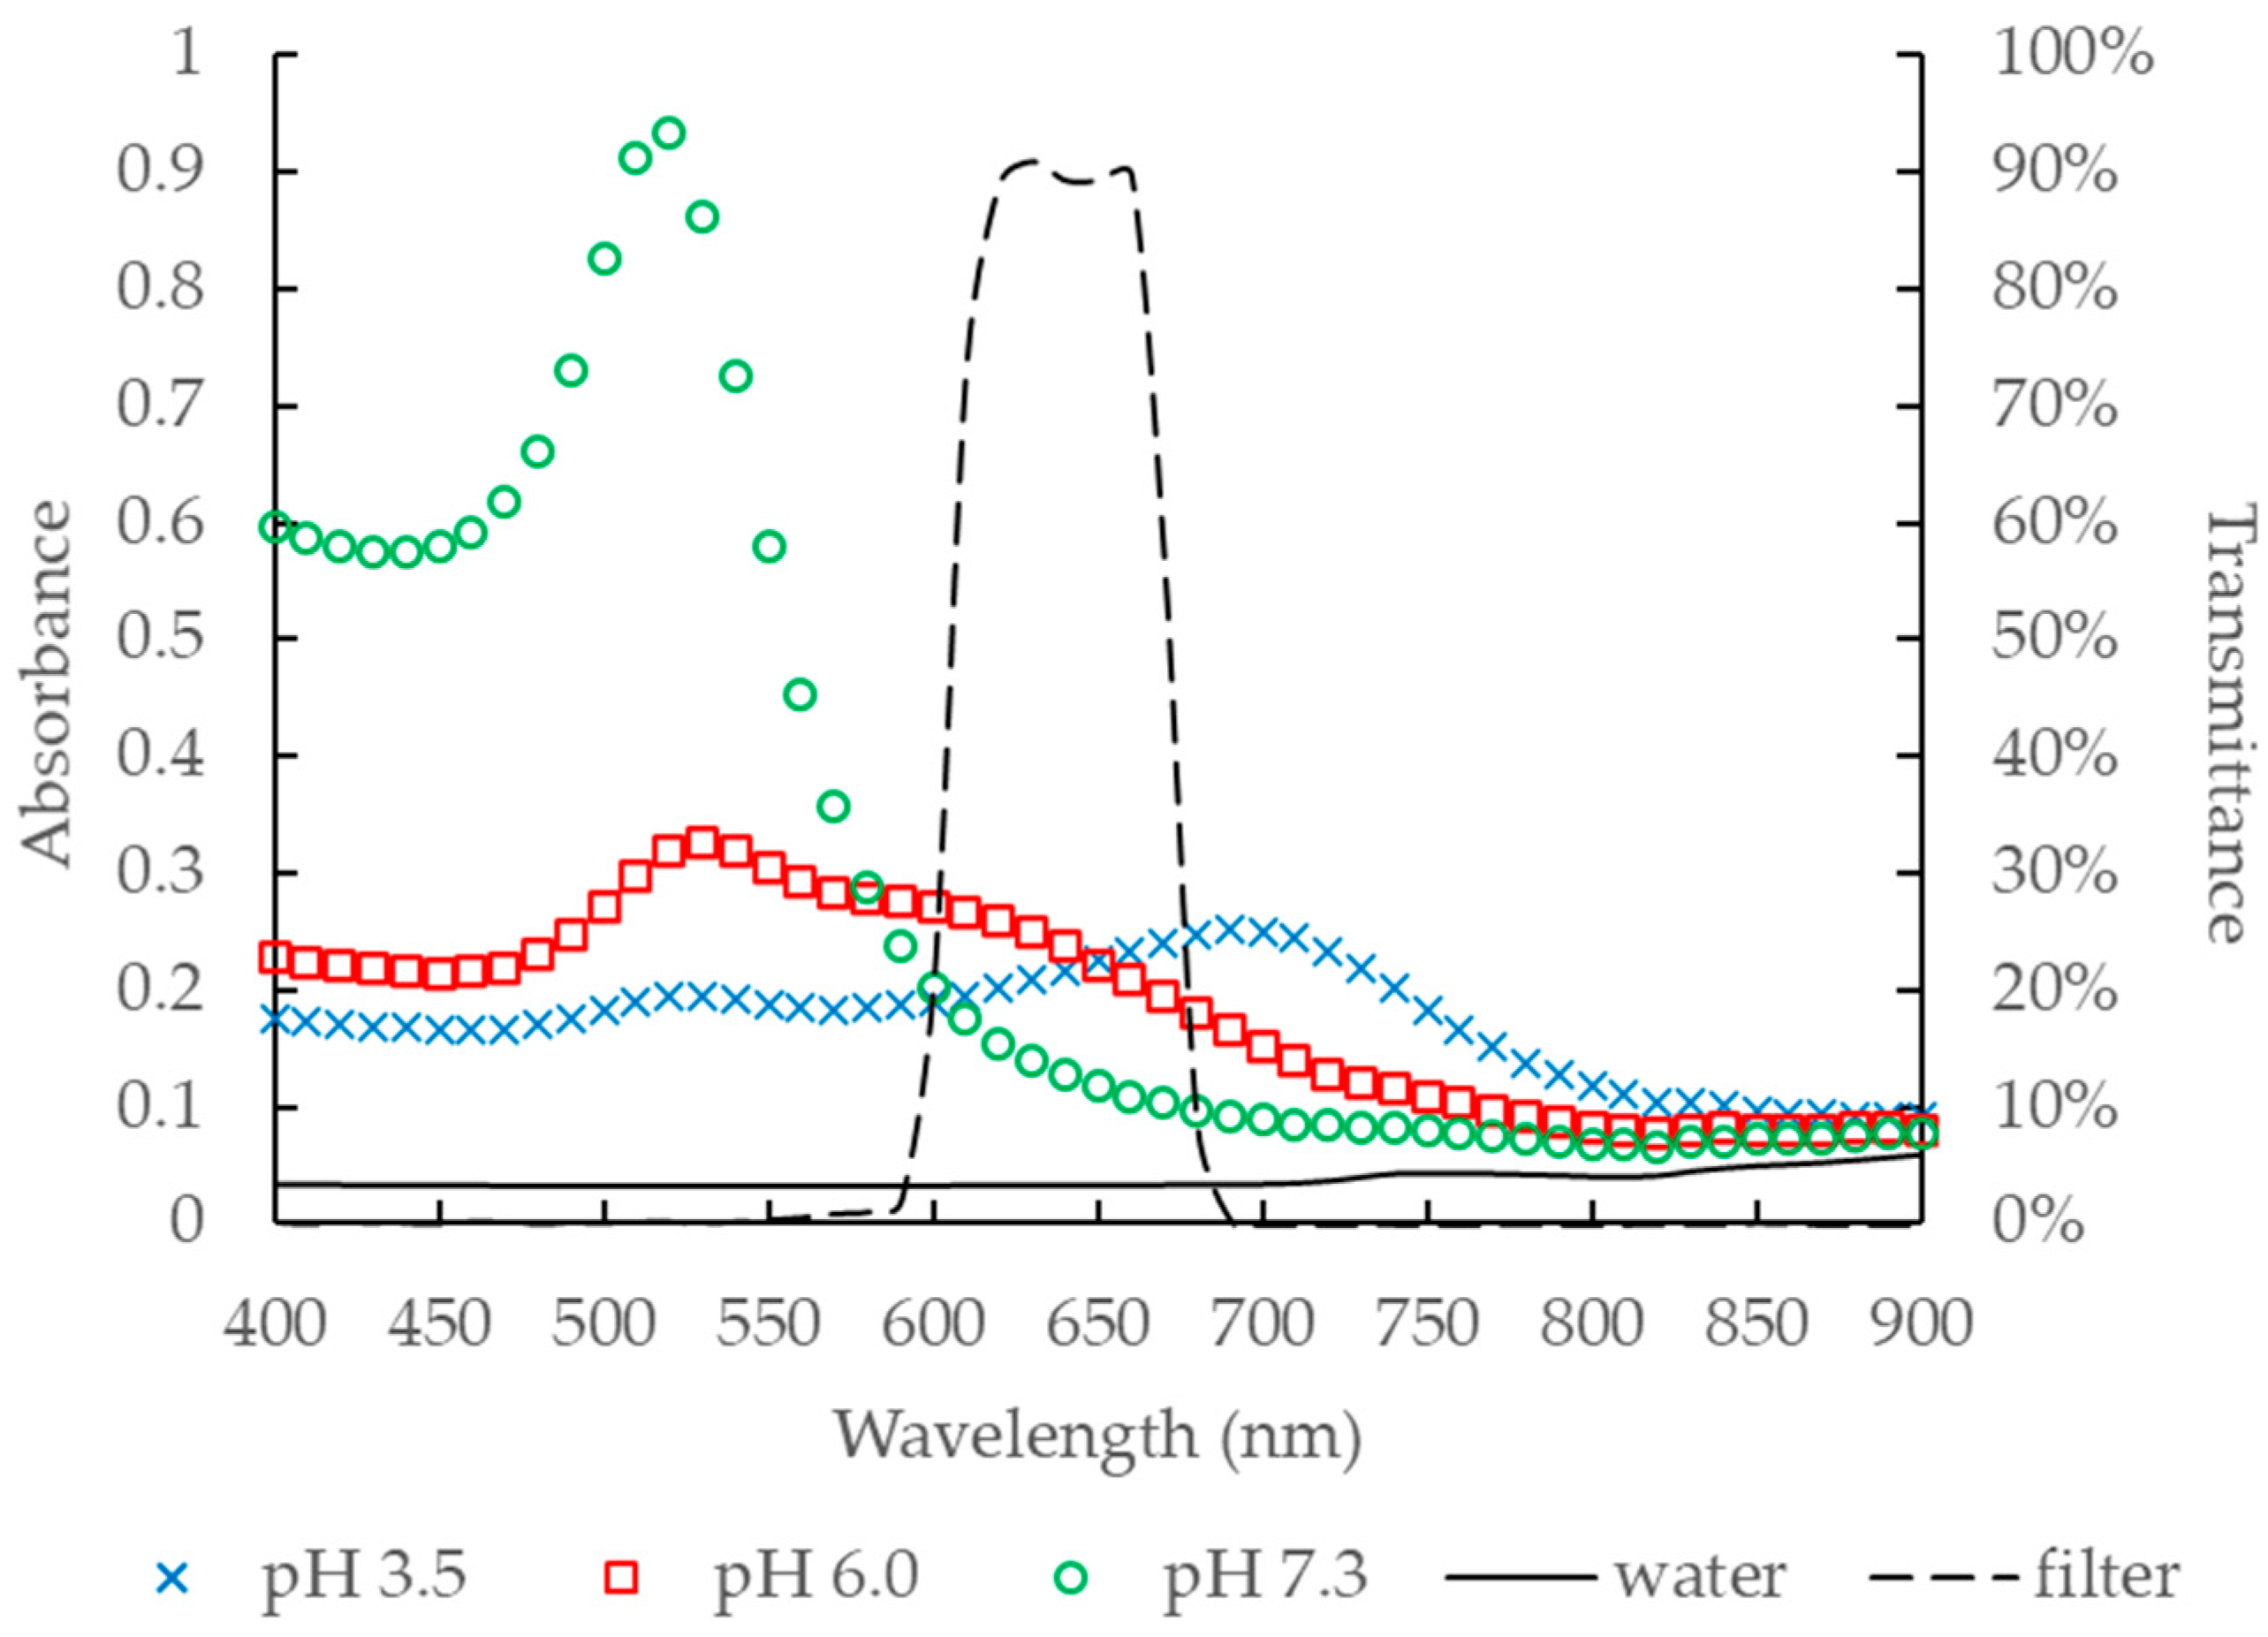
As explained in the previous section, the measured optical properties of GNP solutions with pH 3.5 and pH 6.0 showed a high absorption efficiency at the wavelength from 610 to 670 nm. Therefore, these two GNP solutions were adopted in the thermal experiment to investigate the temperature change when these samples are irradiated by a lamp with the 640-50 Filter. A magnifier was also applied to concentrate the light and thus boost the intensity of the radiation for more precise measurements. Pure water and the GNP solution at a pH level of 7.3 were also measured in this experiment to further investigate the effect of pH, on GNP aggregates and heat generation in irradiated GNP solutions.
The measured temperature changes in GNP solutions with different levels of pH values are presented in Figure 9. During the experiment, the samples were submerged in a water bath with a constant temperature of 37 °C, to imitate an environment in human body. Each sample was measured for three times and the experimental data shown in Figure 9 presents the averaged result of the three measurements. The temperature in all samples showed a significant and rapid increase from 0 to 400 s, but the rate of temperature decreased significantly afterwards. The temperature in pure water raised to the maximum of around 50 °C after a 600 s exposure to the light due to the high intensity of the concentrated light. In addition, water has a high absorption at 1200 nm wavelength, which aligns with a high transmittance peak of the 640-50 Filter (refer to Figure 2). With a pH value of 7.3, the maximum temperature increase in the sample was only 2–3 °C higher than in pure water, because this solution demonstrated relatively low absorbance at 640 nm wavelength, as shown in Figure 10. The temperature changes in the GNP solutions with a base fluid pH = 3.5 and pH = 6.0 were similar, since the absorption efficiency of these two samples were similar at the wavelength from 610 to 670 nm as presented in Figure 10. The maximum temperature in the sample with a pH level of 6.0 was around 60 °C and reached a steady statue after 500 s exposure to the incident light. The sample with pH 6.0 would be the most appropriate and promising solution for the further investigation of GNP-aided hyperthermia treatment, since the pH value 6.0 is close to the pH level of cancerous tissues [25,26,27].
Table 2 compares the optical properties and heating efficiency of pure water and GNP solutions with base fluids of different pH levels. It is shown that the maximum temperature increase has a positive correlation to the light absorbance efficiency at wavelength of 640 nm.
It should be noted that the maximum temperature in the GNP solutions was much higher than the required temperature for mild hyperthermia (around 42 °C) as a result of the concentrated incident light. Although less realistic for medical applications, the high intensity NIR light helps to make the temperature increase in the samples more distinctive for the characterization of the effect of GNP aggregates on the heating efficiency of the tested samples. NIR light sources with lower intensity and narrower wavelength range should be adopted in future in vivo investigations or clinical applications to minimize the heat generation in the healthy tissues without GNPs.
The temperature increase can also be controlled by adjusting the exposure time to the incident light as shown in Figure 9. The temperature in GNP solutions with pH 3.5 and 6.0 reached around 42 °C in only 30 s after light exposure with concentrated light intensity. Temperature equilibrium was not reached until 500 s into the radiation and the maximum temperature was higher than required. It can be expected that the steady state temperature of GNP solutions will be lower if lower light intensity is adopted. Therefore, it is beneficial to design an appropriate NIR light source particularly for GNP enhanced hyperthermia treatment in clinical settings. The wavelength and the intensity of the NIR light source should be adjustable for various cases of GNP-aided hyperthermia to ensure the efficacy and safety of the treatment.
3.4. Heat Generation in an Observation Window of the Sample
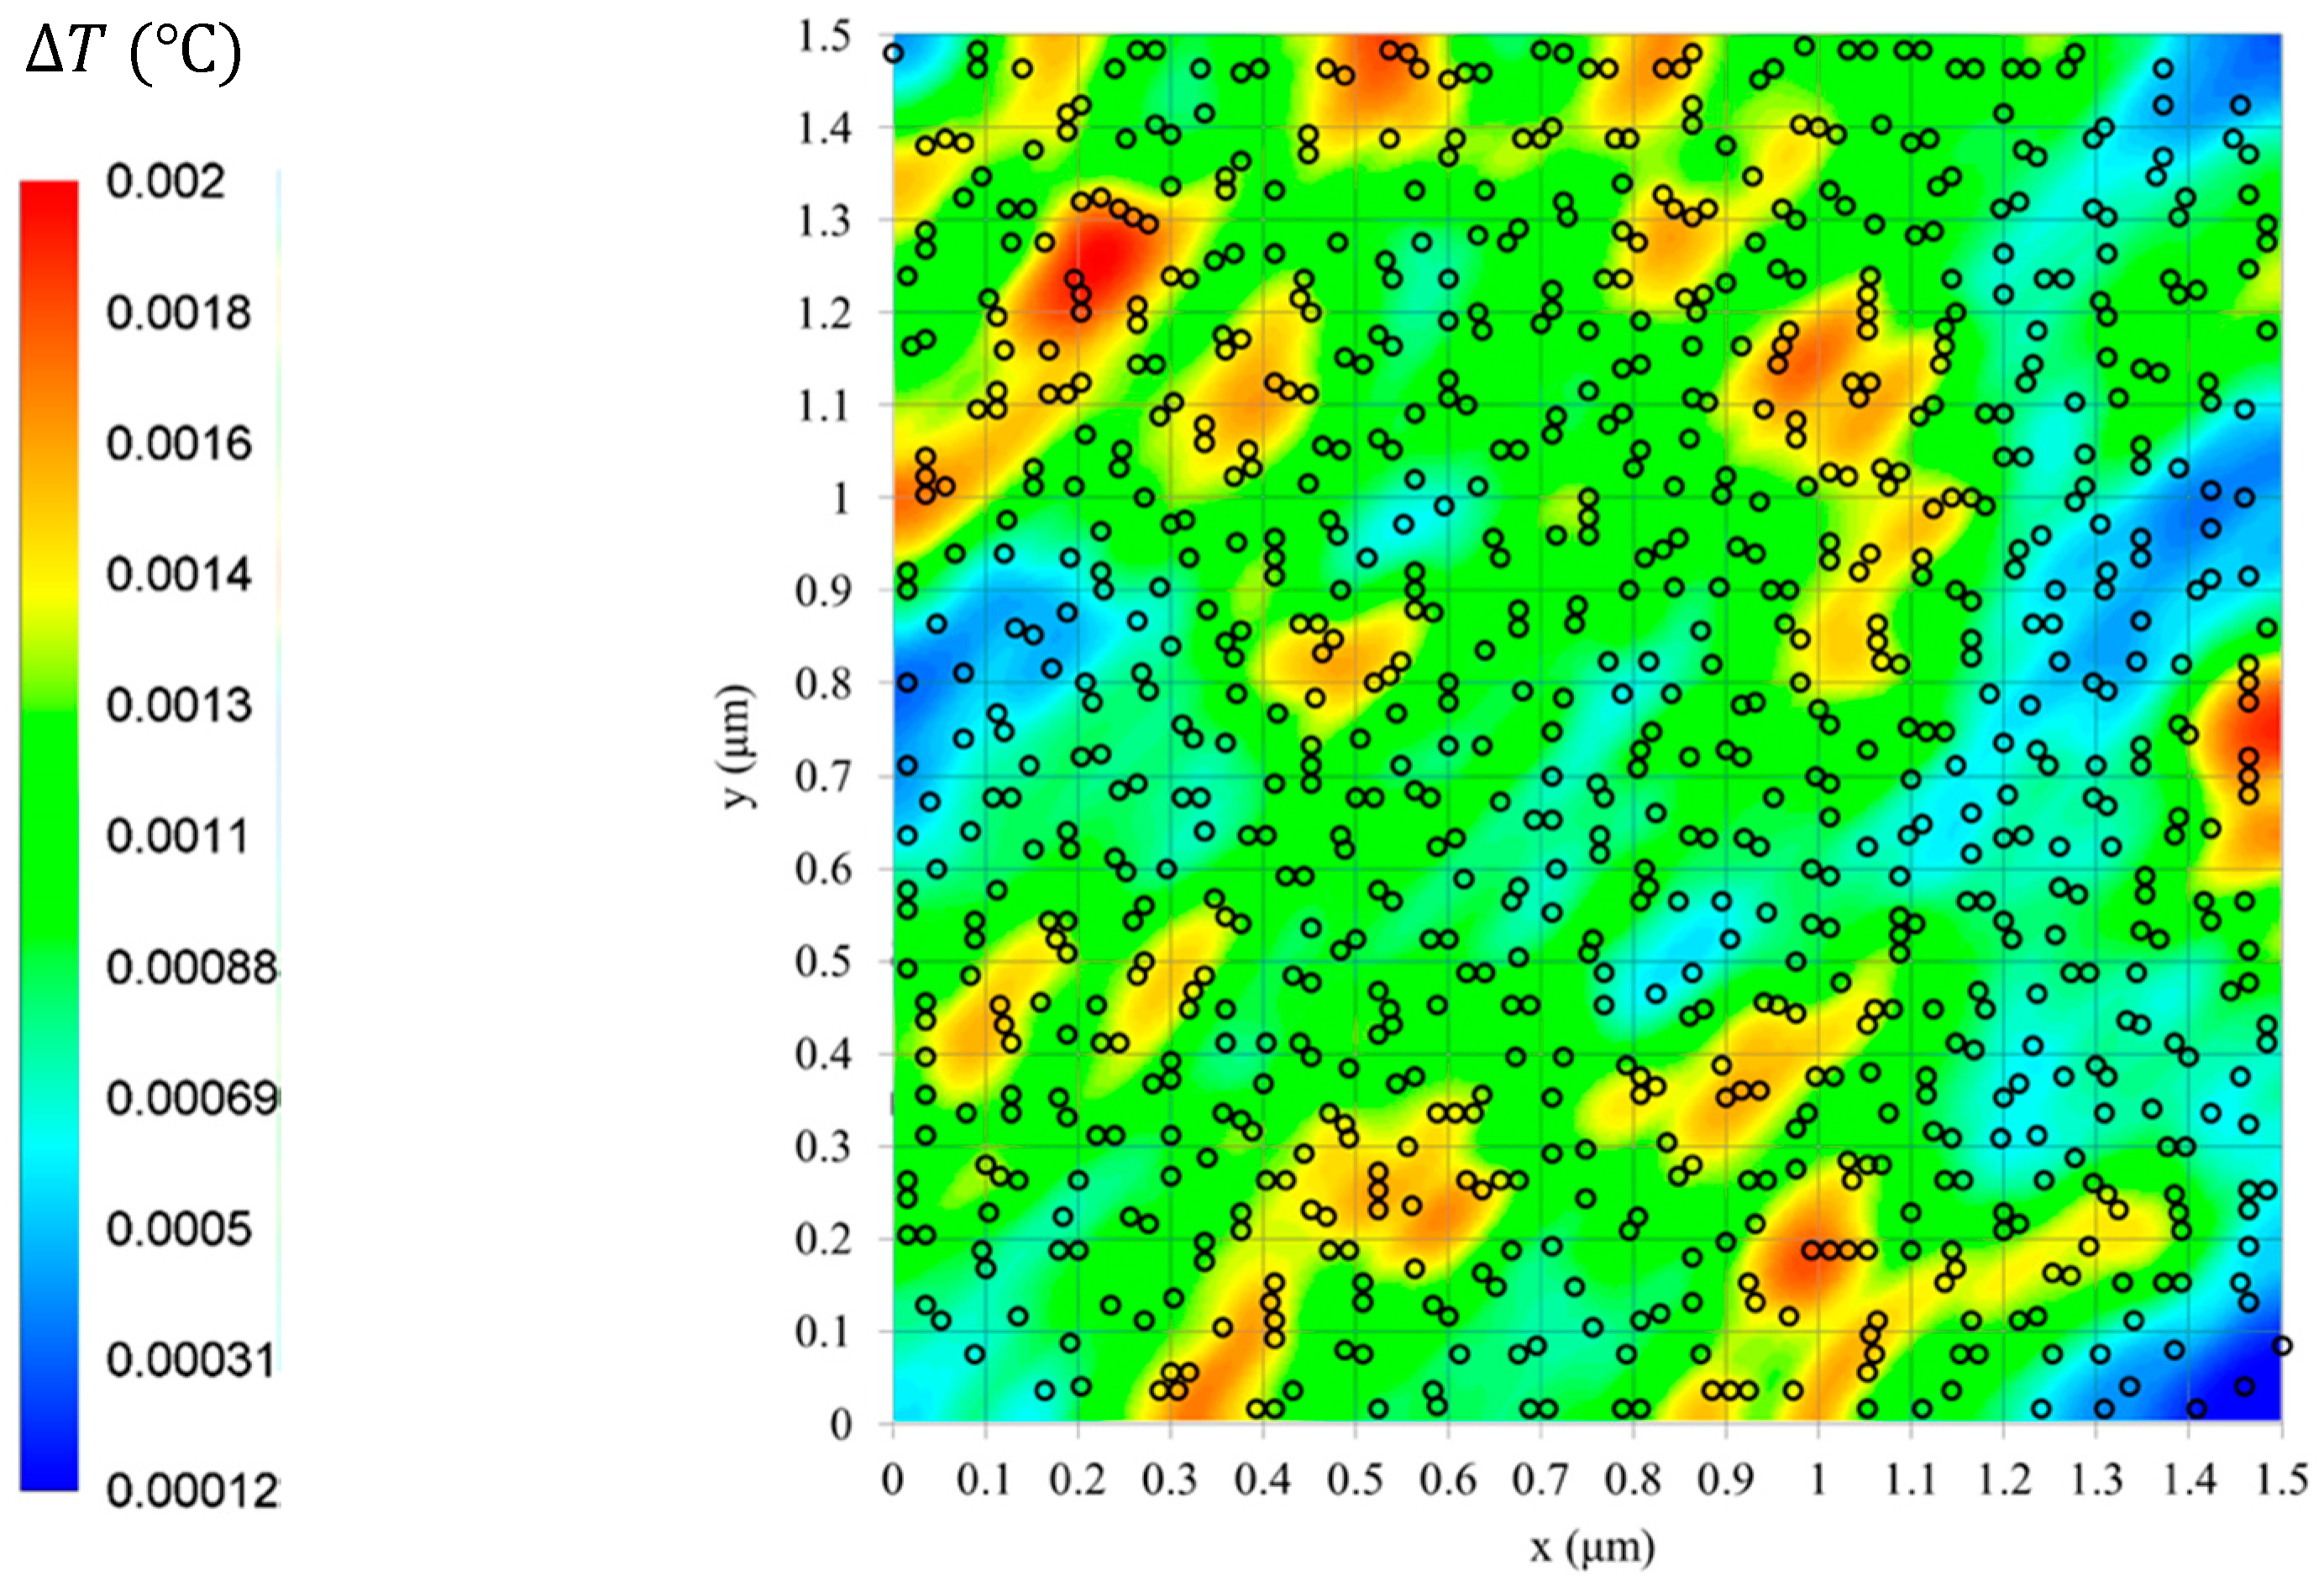
Figure 11 shows the localized temperature increase in the observation window at 20 ns. The positions of GNPs shown in the observation window were obtained from Li et al. [9]. In Figure 11, the predicted temperature increase showed that the shape and size of GNP aggregates in the acidic GNP solution had a significant impact on the heating efficiency in the adjacent areas when the solution was irradiated by NIR light. The temperature hardly increased in the regions containing few particles or smaller configurations. For example, almost no heat was generated during the 20 ns at the area around bottom right corner of the computational domain ((x, y) coordinate: (1.45, 0)), because there were only several GNP monomers in the surrounding region. This also applied in the area around (0, 0.8). In most areas, where only GNP monomers and dimers presented, the temperature increased by around 0.001 °C. The temperature increased by 0.002 degrees during the first 20 ns of the simulation around (0.25, 1.25), due to the high absorption efficiency of the pentamer and trimer GNP configurations (refer to Table 1). Another location where an obvious temperature increase occurred was the region around (1.45, 0.75), since there were two Trimer 3-1 configurations closely placed. Therefore, it can be concluded that heat generation in areas where two or more GNP configurations with high absorption efficiencies closely placed, are about twice as much as in regions containing only small GNP aggregates with lower absorption efficiency. This finding highlighted the importance of the consideration of optical properties of involved GNP aggregates when analyzing the heat generation in irradiated GNP solution for hyperthermia treatments. It was demonstrated that the particle aggregation behavior can be controlled by altering the pH values of the base fluid. Tetramer 4-1 contributed the highest absorption efficiency in the range of the optimal optical window of biological tissue. It can be inferred that the Tetramer 4-1 structure would have a better performance than the other spherical GNP aggregations in various photothermal applications, such as hyperthermia cancer therapies.
Figure 12 and Figure 13 present the localized temperature increase over time in the NIR light irradiated acidic GNP solution with pH = 6.7. Figure 12 shows the temperature change at 20, 50, 100, and 200 ns. As can be seen from Figure 12a, at 20 ns, the temperature increases within the computational domain ranged between 1.2 × 10⁻⁴ and 0.002 °C. The maximum and minimum temperature change shown in Figure 12d at 200 ns was 0.014 and 0.0063 °C.
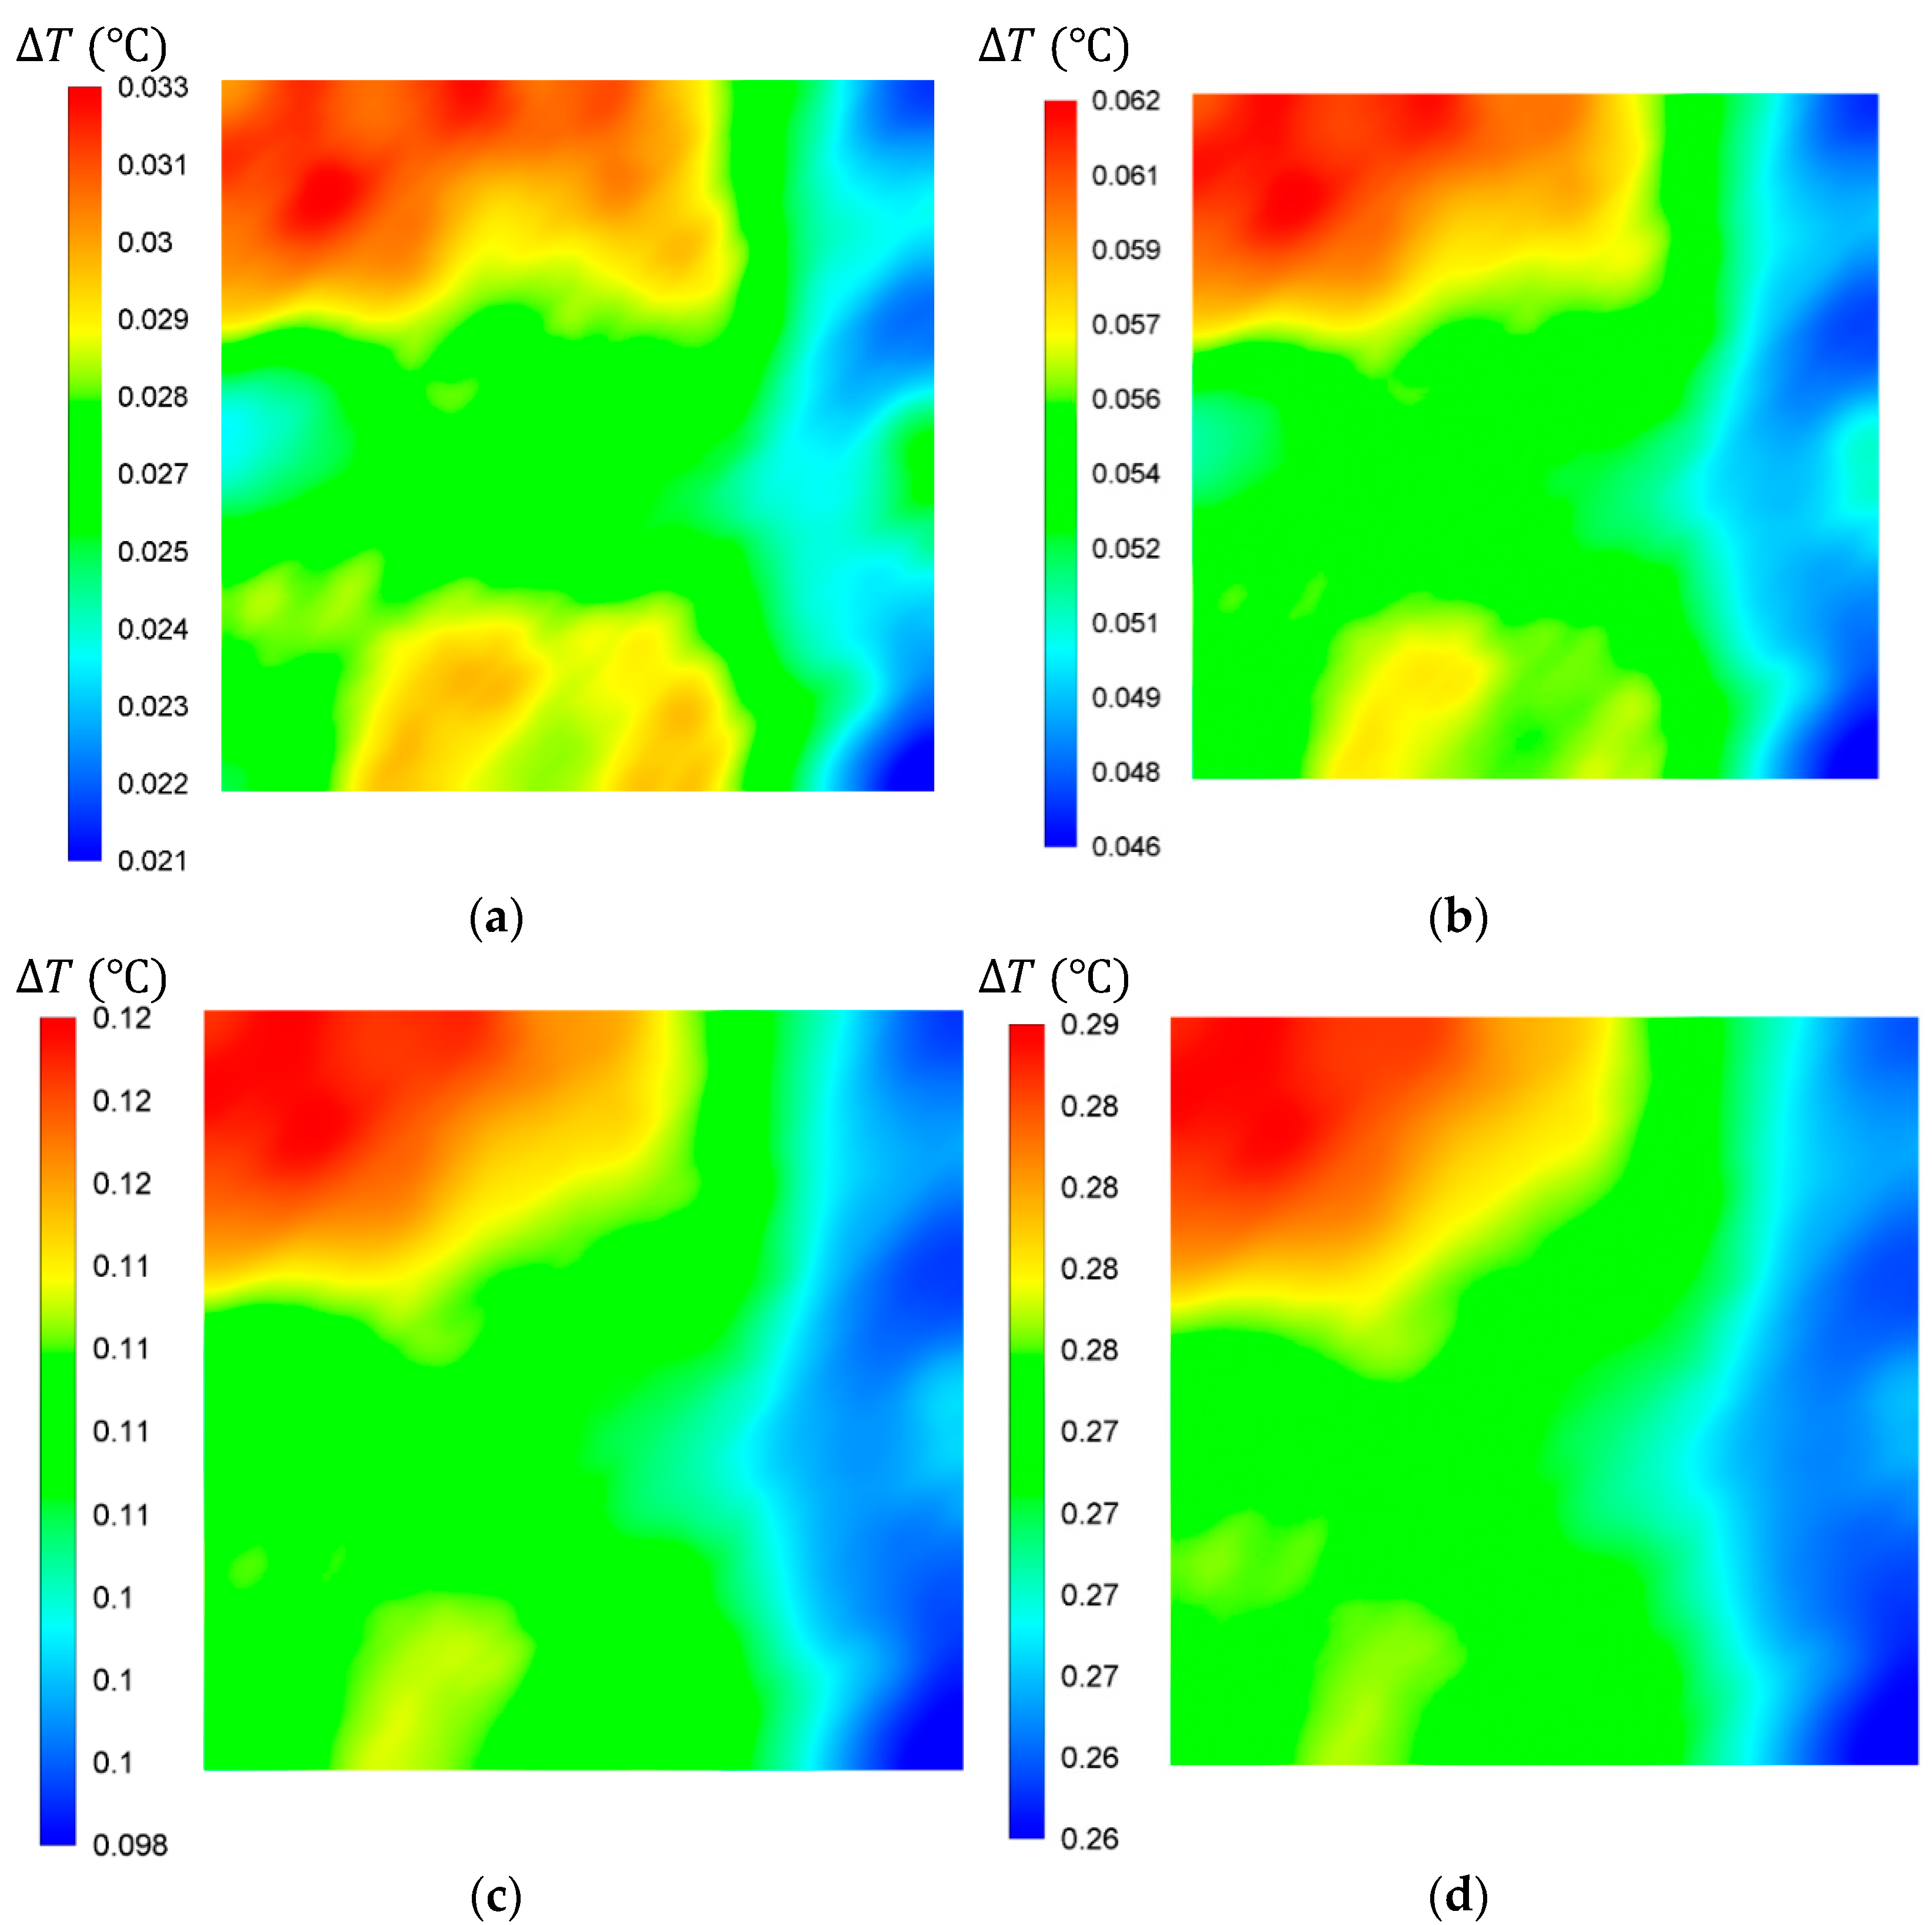
Figure 13 shows the localized temperature increase results at 0.5, 1, 2, and 5 µs. As shown in Figure 13a, at 0.5 µs, the temperature increased 0.033 °C by maximum and 0.021 °C by minimum. The maximum and minimum temperature increase shown in Figure 13d at 5 µs was 0.29 and 0.26 °C, respectively. The contour of the temperature increase displayed in Figure 13d at 5 µs can be divided into three sections. More specifically, the temperature at the top left corner showed the highest increase and the temperature increase near the right edge of the computational domain was lower than average. This finding can be explained by the distribution of the GNP aggregates shown in Figure 11 and the optical properties of GNP configurations listed in Table 1. Due to the accumulation and dissipation of heat, the areas showed high temperature increase connected and merged over time, as can be seen from Figure 12 and Figure 13. Thus, the heat generation in those areas distributed more evenly after 5 µs radiation, comparing Figure 12a and Figure 13d.
4. Discussion and Conclusions
Since the heating efficiencies of GNP aggregation structures depend on their sizes and the internal particle configuration, the optical properties of the GNP aggregate structures involved were considered when calculating the heat generation in an observation window of acidic GNP solutions. Based on the structures of particle aggregates present in acidic solutions predicted by Li et al. [9], the weight averaged absorbance was calculated. A good agreement was established between the numerical predictions and Peng’s experimental results [8].
The temperature increases of GNP solutions at different pH levels was experimentally investigated using light irradiation. A clear positive correlation between the maximum temperature increase and the predicted absorbance of the GNP solution is observed. The present approach was capable of characterizing the impact of GNP aggregation behaviors on the optical absorption and heating efficiency of GNP solutions irradiated by NIR light. The results of the current investigation are helpful for medical practitioners to better understand the effect of particle aggregation on the performance in treatment procedures using GNP solutions, and how to control the particle aggregation by adjusting base fluid pH levels. By comparing GNS solutions with various acidities, the sample of pH 6.0 was taken to be the most appropriate one for hyperthermia because the pH level 6.0 is close to the acidity of cancerous tissues. Another advantage of this sample was that it can absorb sufficient light at the wavelength from 600 to 660 nm.
An innovative approach was also used in the present study to predict the localized heat generation of irradiated GNP solutions in the regions surrounding nanoparticles, where the P1 approximation approach is coupled with the DDA calculations. The predicted results indicated that the heat generation in the computational domain, where two or more GNP configurations with high absorption efficiency closely placed, was much higher than in areas with only individual GNPs or small aggregates with low absorption efficiency. This result provides an insight to the temperature distribution in the surrounding regions of GNPs in hyperthermia applications and allows the precise control of targeted heating in these thermotherapies. The current study predicted the difference between the maximum and minimum temperature increase, which may lead to an overheating or underheating in hyperthermia applications. The numerical model developed in this study can be utilized to both accurately predict the localized heating performance during the planning of thermal treatments, as well as to analyze the post-treatment results.
One limitation of the present study is that water is considered as the base fluid instead of physiological media. The molecules in physiological media may affect the aggregation behavior of GNPs. This will be investigated further in future studies.
Author Contributions
Conceptualization, V.T. and G.H.Y.; methodology, X.G., V.T., D.D.L. and G.H.Y.; software, X.G. and D.D.L.; validation, X.G. and V.T.; formal analysis, X.G. and D.D.L.; investigation, X.G.; resources, V.T., G.H.Y. and R.A.T.; data curation, X.G. and D.D.L.; writing—original draft preparation, X.G.; writing—review and editing, V.T. and D.D.L.; visualization, X.G. and D.D.L.; supervision, V.T., G.H.Y. and R.A.T.; project administration, V.T.; funding acquisition, V.T. and G.H.Y. All authors have read and agreed to the published version of the manuscript.
Funding
This research is supported by the Australian Research Council, ARC Project ID DP150101065 and DP160100021.
Institutional Review Board Statement
Not applicable.
Informed Consent Statement
Not applicable.
Data Availability Statement
The data presented in this study are available on request from the corresponding author. The data are not publicly available due to privacy reasons.
Acknowledgments
The authors acknowledge the support of NVIDIA Corporation with the donation of the Titan Xp and Quadro GPUs used to perform the computations in this study.
Conflicts of Interest
The authors declare no conflict of interest. The funders had no role in the design of the study; in the collection, analyses, or interpretation of data; in the writing of the manuscript, or in the decision to publish the results.
Nomenclature
| Symbol | Meaning | Unit |
| absorption cross-sectional area | m2 | |
| extinction cross-sectional area | m2 | |
| projected area | m2 | |
| scattering cross-sectional area | m2 | |
| volumetric material properties of the cell | depends on the represented properties | |
| volumetric material properties of gold | ||
| volumetric material properties of water | ||
| volumetric radiation source term | W/m3 | |
| volume of the cell | m3 | |
| radiative flux | W/m2 | |
| spectral irradiance | W m−2 nm−1 | |
| effective particle radius | m | |
| scattering direction vector | / | |
| absorption efficiency | / | |
| extinction efficiency | / | |
| scattering efficiency | / | |
| scattering coefficient | m−1 | |
| particle volume fraction | / | |
| linear-anisotropic phase function coefficient | / | |
| incident radiation | W/m | |
| radiation intensity | W/m2 | |
| number of dipoles | / | |
| temperature | K | |
| transmittance | / | |
| volume | m3 | |
| specific heat capacity | J/(kg K) | |
| lattice spacing | m3 | |
| thermal conductivity | W/(m K) | |
| refractive index | / | |
| particle radius | m | |
| time | s | |
| diffraction or size parameter | / | |
| solid angle | / | |
| linear absorption coefficient | m−1 | |
| wavelength | nm | |
| density | kg/m3 | |
| Stefan–Boltzmann constant | W/(m2∙K4) | |
| phase function | / |
References
- Svaasand, L.O.; Gomer, C.J.; Morinelli, E. On the Physical Rationale of Laser Induced Hyperthermia. Lasers Med Sci. 1990, 5, 121–128. [Google Scholar] [CrossRef]
- Huang, X.; El-Sayed, M.A. Plasmonic Photo-Thermal Therapy (PPTT). Alex. J. Med. 2011, 47, 1–9. [Google Scholar] [CrossRef] [Green Version]
- Alves, A.F.; Mendo, S.G.; Ferreira, L.P.; Mendonça, M.H.; Ferreira, P.; Godinho, M.; Cruz, M.M.; Carvalho, M.D. Gela-Tine-Assisted Synthesis of Magnetite Nanoparticles for Magnetic Hyperthermia. J. Nanopart. Res. 2016, 18, 1–13. [Google Scholar] [CrossRef]
- Taylor, R.A.; Coulombe, S.; Otanicar, T.; Phelan, P.; Gunawan, A.; Lv, W.; Rosengarten, G.; Prasher, R.; Tyagi, H. Small Particles, Big Impacts: A Review of the Diverse Applications of Nanofluids. J. Appl. Phys. 2013, 113, 1–19. [Google Scholar] [CrossRef]
- Thovhogi, N.; Sibuyi, N.; Meyer, M.; Onani, M.; Madiehe, A. Targeted Delivery Using Peptide-Functionalised Gold Nano-Particles to White Adipose Tissues of Obese Rats. J. Nanopart. Res. 2015, 17, 112–120. [Google Scholar] [CrossRef]
- Pissuwan, D.; Valenzuela, S.M.; Miller, C.M.; Killingsworth, M.C.; Cortie, M.B. Destruction and Control OfToxoplasmagondiiTachyzoites Using Gold Nanosphere/Antibody Conjugates. Small 2009, 5, 1030–1034. [Google Scholar] [CrossRef] [Green Version]
- Hainfeld, J.F.; Lin, L.; Slatkin, D.N.; Dilmanian, F.A.; Vadas, T.M.; Smilowitz, H.M. Gold Nanoparticle Hyperthermia Re-Duces Radiotherapy Dose. Nanomed. Nanotechnol. Biol. Med. 2014, 10, 1609–1617. [Google Scholar] [CrossRef] [PubMed] [Green Version]
- Peng, Z.; Walther, T.; Kleinermanns, K. Influence of Intense Pulsed Laser Irradiation on Optical and Morphological Prop-Erties of Gold Nanoparticle Aggregates Produced by Surface acid− Base Reactions. Langmuir 2005, 21, 4249–4253. [Google Scholar] [CrossRef] [PubMed]
- Li, D.D.; Gu, X.; Timchenko, V.; Chan, Q.N.; Yuen, A.C.Y.; Yeoh, G.-H. Study of Morphology and Optical Properties of Gold Nanoparticle Aggregates under Different PH Conditions. Langmuir 2018, 34, 10340–10352. [Google Scholar] [CrossRef] [PubMed]
- Gu, X.; Timchenko, V.; Yeoh, G.H.; Dombrovsky, L.A.; Taylor, R.A. Heat Generation in Gold Nanorods Solutions Due to Absorption of Near-Infrared Radiation. In Proceedings of the CHT-17 ICHMT International Symposium on Advances in Computational Heat Transfer, Napoli, Italy, 28 May–1 June 2017. [Google Scholar] [CrossRef] [Green Version]
- Chen, Z.; Wang, Z.; Chen, X.; Xu, H.; Liu, J. Chitosan-Capped Gold Nanoparticles for Selective and Colorimetric Sensing of Heparin. J. Nanoparticle Res. 2013, 15, 1–9. [Google Scholar] [CrossRef] [Green Version]
- Pamies, R.; Cifre, J.G.H.; Espín, V.F.; Collado-González, M.; Baños, F.G.D.; De La Torre, J.G. Aggregation Behaviour of Gold Nanoparticles in Saline Aqueous Media. J. Nanoparticle Res. 2014, 16, 1–11. [Google Scholar] [CrossRef]
- Jain, P.K.; El-Sayed, M.A. Surface Plasmon Coupling and Its Universal Size Scaling in Metal Nanostructures of Complex Geometry: Elongated Particle Pairs and Nanosphere Trimers. J. Phys. Chem. C 2008, 112, 4954–4960. [Google Scholar] [CrossRef]
- Gu, X.; Timchenko, V.; Yeoh, G.H.; Dombrovsky, L.; Taylor, R. The Effect of Gold Nanorods Clustering on Near-Infrared Radiation Absorption. Appl. Sci. 2018, 8, 1132. [Google Scholar] [CrossRef] [Green Version]
- Kattumuri, V.; Katti, K.; Bhaskaran, S.; Boote, E.J.; Casteel, S.W.; Fent, G.M.; Robertson, D.J.; Chandrasekhar, M.; Kannan, R.; Katti, K.V. Gum Arabic As a Phytochemical Construct for the Stabilization of Gold Nanoparticles: In Vivo Pharmacokinetics and X-Ray-Contrast-Imaging Studies. Small 2007, 3, 333–341. [Google Scholar] [CrossRef] [PubMed]
- DeVoe, H. Optical Properties of Molecular Aggregates. I. Classical Model of Electronic Absorption and Refraction. J. Chem. Phys. 1964, 41, 393–400. [Google Scholar] [CrossRef]
- Draine, B.T.; Flatau, P.J. User Guide for the Discrete Dipole Approximation Code DDSCAT 7.3. arXiv 2013, arXiv:1305.6497. [Google Scholar]
- Jain, P.K.; Eustis, S.; El-Sayed, M.A. Plasmon Coupling in Nanorod Assemblies: Optical Absorption, Discrete Dipole Approximation Simulation, and Exciton-Coupling Model. J. Phys. Chem. B 2006, 110, 18243–18253. [Google Scholar] [CrossRef]
- Lee, K.-S.; El-Sayed, M.A. Dependence of the Enhanced Optical Scattering Efficiency Relative to That of Absorption for Gold Metal Nanorods on Aspect Ratio, Size, End-Cap Shape, and Medium Refractive Index. J. Phys. Chem. B 2005, 109, 20331–20338. [Google Scholar] [CrossRef] [PubMed]
- Dombrovsky, L.A. Radiation Heat Transfer in Disperse Systems; Begell House: New York, NY, USA, 1996. [Google Scholar]
- Dombrovsky, L.A.; Timchenko, V.; Pathak, C.; Piazena, H.; Müller, W.; Jackson, M. Radiative Heating of Superficial Human Tissues with the Use of Water-Filtered Infrared-A Radiation: A Computational Modeling. Int. J. Heat Mass Transf. 2015, 85, 311–320. [Google Scholar] [CrossRef]
- Zhang, M.; Kim, H.S.; Jin, T.; Moon, W.K. Near-Infrared Photothermal Therapy Using EGFR-Targeted Gold Nanoparticles in-Creases Autophagic Cell Death in Breast Cancer. J. Photochem. Photobiol. B Biol. 2017, 170, 58–64. [Google Scholar] [CrossRef] [PubMed]
- ANSYS Inc. ANSYS Fluent Theory Guide v17.0; ANSYS Inc.: Park City, UT, USA, 2006. [Google Scholar]
- Dombrovsky, L.A.; Dembele, S.; Wen, J.X.; Sikic, I. Two-Step Method for Radiative Transfer Calculations in a Developing Pool Fire at the Initial Stage of Its Suppression by a Water Spray. Int. J. Heat Mass Transf. 2018, 127, 717–726. [Google Scholar] [CrossRef]
- Meyer, K.R.; Hopwood, L.E.; Gillette, E.L. The Thermal Response of Mouse Adenocarcinoma Cells at Low PH. Eur. J. Cancer 1979, 15, 1219–1222. [Google Scholar] [CrossRef]
- Pampus, F. Die Wasserstoffionenkonzentration Des Hirngewebes Bei Raumfordernden Intracraniellen Prozessen. Acta Neurochir. 1963, 11, 305–318. [Google Scholar] [CrossRef] [PubMed]
- Wike-Hooley, J.; Haveman, J.; Reinhold, H. The Relevance of Tumour PH to the Treatment of Malignant Disease. Radiother. Oncol. 1984, 2, 343–366. [Google Scholar] [CrossRef]
Figure 1.
The colors of samples prepared in this study. From left to right: pure water, gold nanoparticle (GNP) solutions with pH = 3.5, pH = 6.0, and pH = 7.3.
Figure 1.
The colors of samples prepared in this study. From left to right: pure water, gold nanoparticle (GNP) solutions with pH = 3.5, pH = 6.0, and pH = 7.3.

Figure 2.
Transmission of the FB780-10 and 640-50 bandpass filters and the absorption of water.

Figure 3.
Schematic view of the thermal experiment.

Figure 4.
Discretization of the computational domain.

Figure 5.
Illustration of a GNP in discretized computational domain.

Figure 6.
Volume fraction of a GNP in participating cells.

Figure 7.
TEM images of the GNS solutions with different pH conditions. (a,b) pH = 3.5, (c,d) pH = 6.7, (e,f) pH = 9.4.
Figure 7.
TEM images of the GNS solutions with different pH conditions. (a,b) pH = 3.5, (c,d) pH = 6.7, (e,f) pH = 9.4.

Figure 8.
Normalized absorbance of GNP monomer and aggregations compared with experimental data [8] measured from nanoparticle solutions.
Figure 8.
Normalized absorbance of GNP monomer and aggregations compared with experimental data [8] measured from nanoparticle solutions.

Figure 9.
Measured temperature changes in GNP solutions with various levels of pH, during and after irradiation using the Hydrosun® 750 lamp with the 640-50 Filter.
Figure 9.
Measured temperature changes in GNP solutions with various levels of pH, during and after irradiation using the Hydrosun® 750 lamp with the 640-50 Filter.

Figure 10.
Absorbance of GNP solutions with various pH values.

Figure 11.
Effect of GNP aggregation on localized heat distribution in irradiated acidic solution pH = 6.7 at t = 20 ns.
Figure 11.
Effect of GNP aggregation on localized heat distribution in irradiated acidic solution pH = 6.7 at t = 20 ns.

Figure 12.
Localized temperature increases in irradiated acidic GNP solution pH = 6.7 at (a) 20 ns, (b) 50 nm, (c) 100 ns, and (d) 200 ns.
Figure 12.
Localized temperature increases in irradiated acidic GNP solution pH = 6.7 at (a) 20 ns, (b) 50 nm, (c) 100 ns, and (d) 200 ns.

Figure 13.
Localized temperature increases in irradiated acidic GNP solution at (a) 0.5 µs, (b) 1 µs, (c) 2 µs, and (d) 5 µs.
Figure 13.
Localized temperature increases in irradiated acidic GNP solution at (a) 0.5 µs, (b) 1 µs, (c) 2 µs, and (d) 5 µs.


Table 1.
Absorption and scattering efficiencies of GNP configurations characterized by Li et al. [9] at 640 nm wavelength.
Table 1.
Absorption and scattering efficiencies of GNP configurations characterized by Li et al. [9] at 640 nm wavelength.
| Particle Cluster Identifier | Particle Structure | ηabs | ηsca |
|---|---|---|---|
| Monomer |  | 0.18 | 2.14 × 10⁻³ |
| Dimer |  | 0.91 | 1.22 × 10⁻² |
| Trimer 3-0 |  | 1.05 | 1.63 × 10⁻² |
| Trimer 3-1 |  | 1.45 | 2.64 × 10⁻² |
| Tetramer 4-1 |  | 1.57 | 3.67 × 10⁻² |
| Tetramer 4-2 |  | 1.60 | 3.15 × 10⁻² |
| Tetramer 4-3 |  | 1.29 | 2.20 × 10⁻² |
| Tetramer 4-4 |  | 1.48 | 2.64 × 10⁻² |
Table 2.
Results from optical and thermal experiments obtained at around 640 nm wavelength.
| Sample | pH | Absorbance at λ = 640 nm | Maximum Temperature Increase (°C) | Error of Temperature Measurement (°C) |
|---|---|---|---|---|
| Water | N/A | 0.03 | 13.41 | +0.013 |
| GNP solutions | 3.5 | 0.22 | 23.58 | −0.010 |
| 6.0 | 0.24 | 23.96 | +0.008 | |
| 7.3 | 0.13 | 16.22 | +0.021 |
Publisher’s Note: MDPI stays neutral with regard to jurisdictional claims in published maps and institutional affiliations. |
© 2021 by the authors. Licensee MDPI, Basel, Switzerland. This article is an open access article distributed under the terms and conditions of the Creative Commons Attribution (CC BY) license (http://creativecommons.org/licenses/by/4.0/).
Share and Cite
MDPI and ACS Style
Gu, X.; Li, D.D.; Yeoh, G.H.; Taylor, R.A.; Timchenko, V. Heat Generation in Irradiated Gold Nanoparticle Solutions for Hyperthermia Applications. Processes 2021, 9, 368. https://doi.org/10.3390/pr9020368
AMA Style
Gu X, Li DD, Yeoh GH, Taylor RA, Timchenko V. Heat Generation in Irradiated Gold Nanoparticle Solutions for Hyperthermia Applications. Processes. 2021; 9(2):368. https://doi.org/10.3390/pr9020368
Chicago/Turabian StyleGu, Xi, Darson D. Li, Guan H. Yeoh, Robert A. Taylor, and Victoria Timchenko. 2021. "Heat Generation in Irradiated Gold Nanoparticle Solutions for Hyperthermia Applications" Processes 9, no. 2: 368. https://doi.org/10.3390/pr9020368
Note that from the first issue of 2016, this journal uses article numbers instead of page numbers. See further details here.