Article

Deforestation and Forest Degradation Due to Gold Mining in the Peruvian Amazon: A 34-Year Perspective

by
Jorge Caballero Espejo
1,
Max Messinger
2,*,
Francisco Román-Dañobeytia
1,2,
Cesar Ascorra
1,
Luis E. Fernandez
1,2 and
Miles Silman
2
1
Centro de Innovación Científica Amazónica (CINCIA), Jr Cajamarca Cdra 1, Puerto Maldonado 17001, Madre de Dios, Peru
2
Center for Energy, Environment, and Sustainability, Wake Forest University, 1834 Wake Forest Rd, Winston-Salem, NC 27109, USA
*
Author to whom correspondence should be addressed.
Remote Sens. 2018, 10(12), 1903; https://doi.org/10.3390/rs10121903
Submission received: 2 November 2018 / Revised: 21 November 2018 / Accepted: 27 November 2018 / Published: 29 November 2018
(This article belongs to the Section Forest Remote Sensing)

Abstract

:
While deforestation rates decline globally they are rising in the Western Amazon. Artisanal-scale gold mining (ASGM) is a large cause of this deforestation and brings with it extensive environmental, social, governance, and public health impacts, including large carbon emissions and mercury pollution. Underlying ASGM is a broad network of factors that influence its growth, distribution, and practices such as poverty, flows of legal and illegal capital, conflicting governance, and global economic trends. Despite its central role in land use and land cover change in the Western Amazon and the severity of its social and environmental impacts, it is relatively poorly studied. While ASGM in Southeastern Peru has been quantified previously, doing so is difficult due to the heterogeneous nature of the resulting landscape. Using a novel approach to classify mining that relies on a fusion of CLASlite and the Global Forest Change dataset, two Landsat-based deforestation detection tools, we sought to quantify ASGM-caused deforestation in the period 1984–2017 in the southern Peruvian Amazon and examine trends in the geography, methods, and impacts of ASGM across that time. We identify nearly 100,000 ha of deforestation due to ASGM in the 34-year study period, an increase of 21% compared to previous estimates. Further, we find that 10% of that deforestation occurred in 2017, the highest annual amount of deforestation in the study period, with 53% occurring since 2011. Finally, we demonstrate that not all mining is created equal by examining key patterns and changes in ASGM activity and techniques through time and space. We discuss their connections with, and impacts on, socio-economic factors, such as land tenure, infrastructure, international markets, governance efforts, and social and environmental impacts.

Graphical Abstract

1. Introduction

Deforestation currently accounts for approximately 6–17% of global carbon emissions [1,2] and, while forest cover has increased globally in the past 35 years, forest loss is ongoing in the tropics [3,4]. While much of this land is cleared for agriculture, silviculture, and cattle ranching, small and often difficult-to-detect activities, such as selective logging, coca farming, and artisanal scale gold mining (ASGM) are responsible for a large fraction of forest loss and disturbance in the Western Amazon [5]. ASGM is unique among these drivers of deforestation in its severity of impacts, leaving a highly altered landscape. It has the lowest residual forest carbon of any land use in the region, and leads to loss of ecosystem services, removal of fine sediments, defaunation, severely impaired water quality, and mercury contamination of soil, water, and air [6,7,8]. Indeed, ASGM is the largest single contributor of global mercury pollution, accounting for over 37% of all emissions globally [9]. The difficulties inherent in managing for such a disruptive land use is further complicated by a web of socioeconomic factors, such as poverty, gold prices, infrastructure, and the flow of illegal capital [10,11,12].
Data about the size, geographic distribution, and impacts of land cover and land use change (LCLUC) is critical to minimize the ongoing contribution of forest loss to climate change, to preserve biodiversity and other natural and cultural resources, and to create governance regimes for the responsible expansion of private-sector activities [13,14,15]. Satellites, such as those of the Landsat series, are typically used to generate these data. Sub-pixel analysis methods have made it possible to detect deforestation events as small as 0.1 ha, providing a powerful tool for LCLUC detection [15]. One such sub-pixel analysis methodology is contained within CLASlite, a toolset that conducts reflectance retrieval, spectral unmixing, and image classification and change detection using resultant endmember fractional cover [16]. Pixel-based deforestation detection has also been successful, with the most prominent example being the Global Forest Change (GFC) dataset [17]. GFC is a Landsat data product that reliably detects deforestation but cannot be used alone, as it provides no indication of the cause of deforestation [17]. While these spectral analysis techniques work well for detecting most deforestation [16], identifying the cause of deforestation is more difficult. This is especially true of land cover change resulting from mining due to the heterogeneityof the resulting transformed landscape. Asner et al. [18,19], Finer and Novoa [5], and others have previously used CLASlite to quantify deforestation due to ASGM in the southern Peruvian Amazon and characterize spatiotemporal patterns in mining activity, but without extensive visual analysis and manual classification of the CLASlite output this approach significantly underestimates the land area converted [20]. Other methods of ASGM detection, such as unsupervised classification [10] and manual identification [21] have also been used with varying degrees of success. Due to this, LCLUC analysis for ASGM, known to be one of the largest sources of deforestation in the Western Amazon, remains difficult to perform at regional or broader scales. The absence of these data frustrates governance, policy, and management of this globally important issue.
Here we seek to establish a chronology of mining disturbances in southeastern Peru using a simple methodological advance based on fusion of CLASlite and the GFC dataset that greatly increases the ability to automatically detect land conversion due to ASGM. We examine the annual extent and distribution of ASGM-caused deforestation over 34 years in the study area, look at economic and policy factors and their effects on historical and current deforestation rates, and discuss future trajectories of mining effects on the system. Further, we hypothesize that all mining is not created equal given the differences between ASGM methods and their resulting degrees of disturbance and long-term impacts, and we suggest that they require distinct governance and management regimes.

2. Materials and Methods
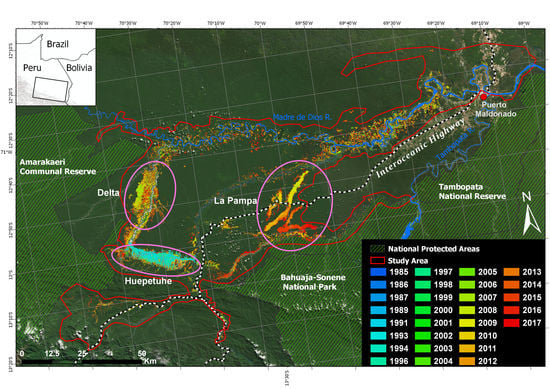
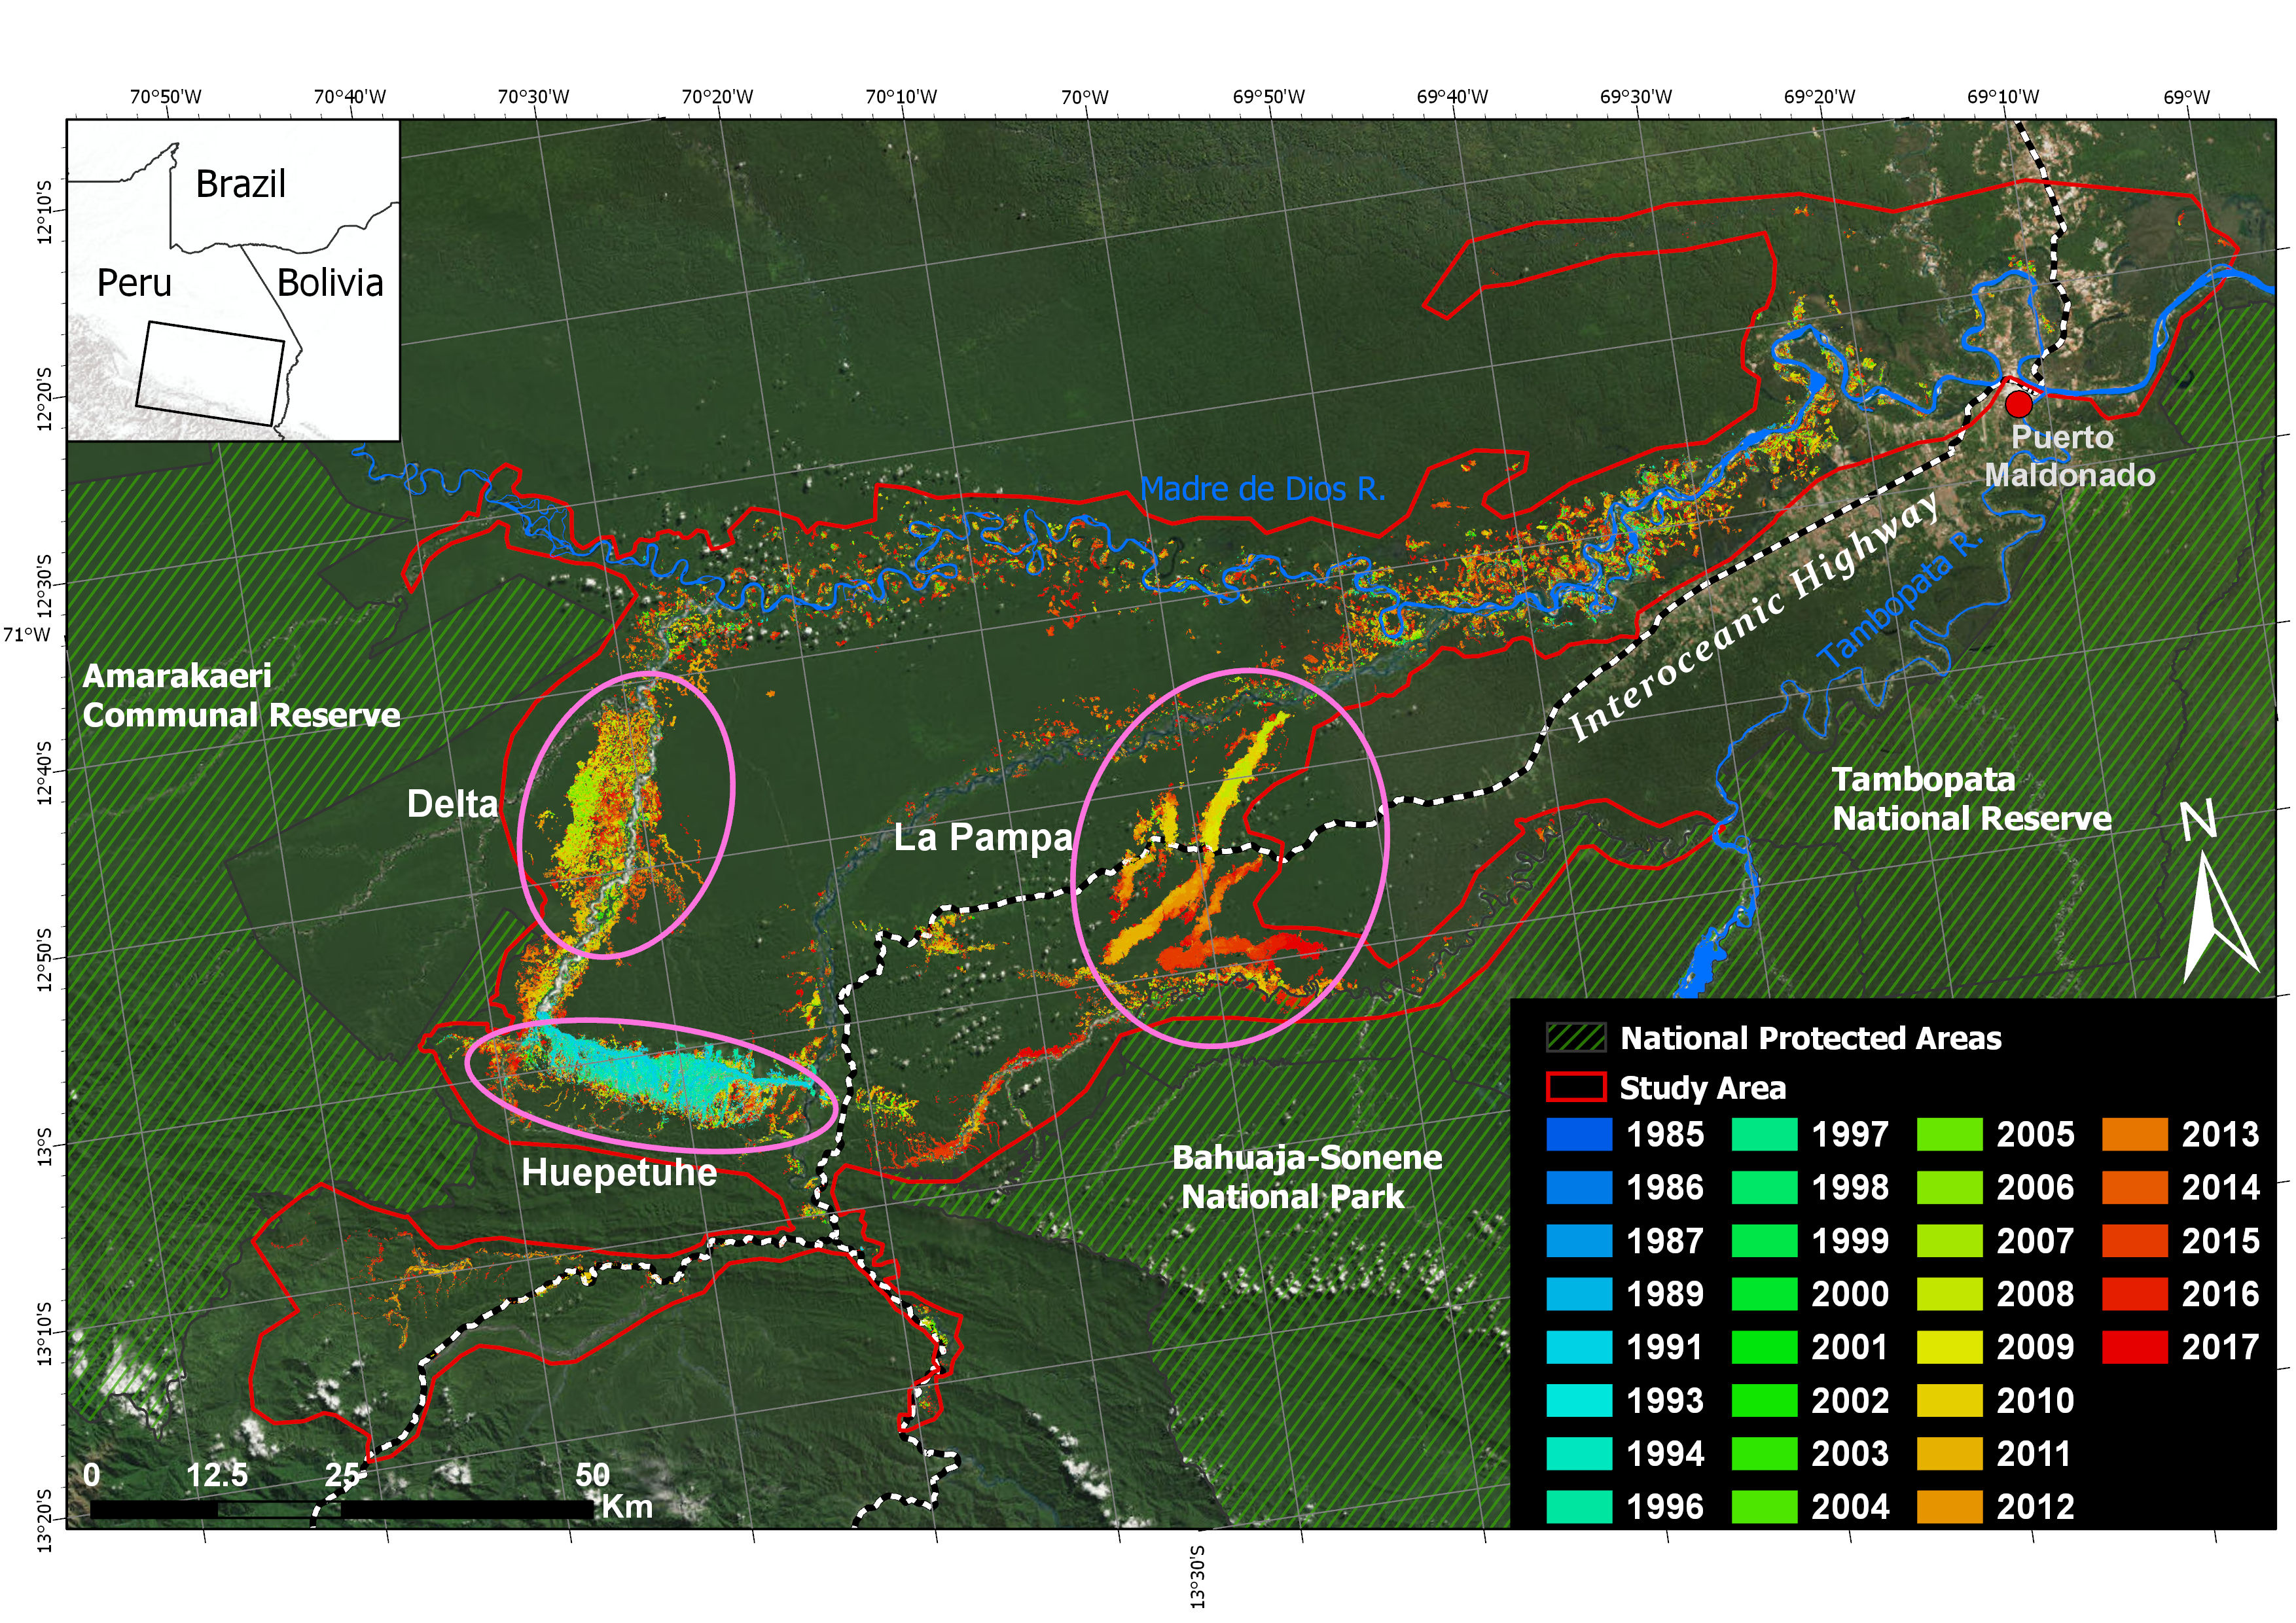
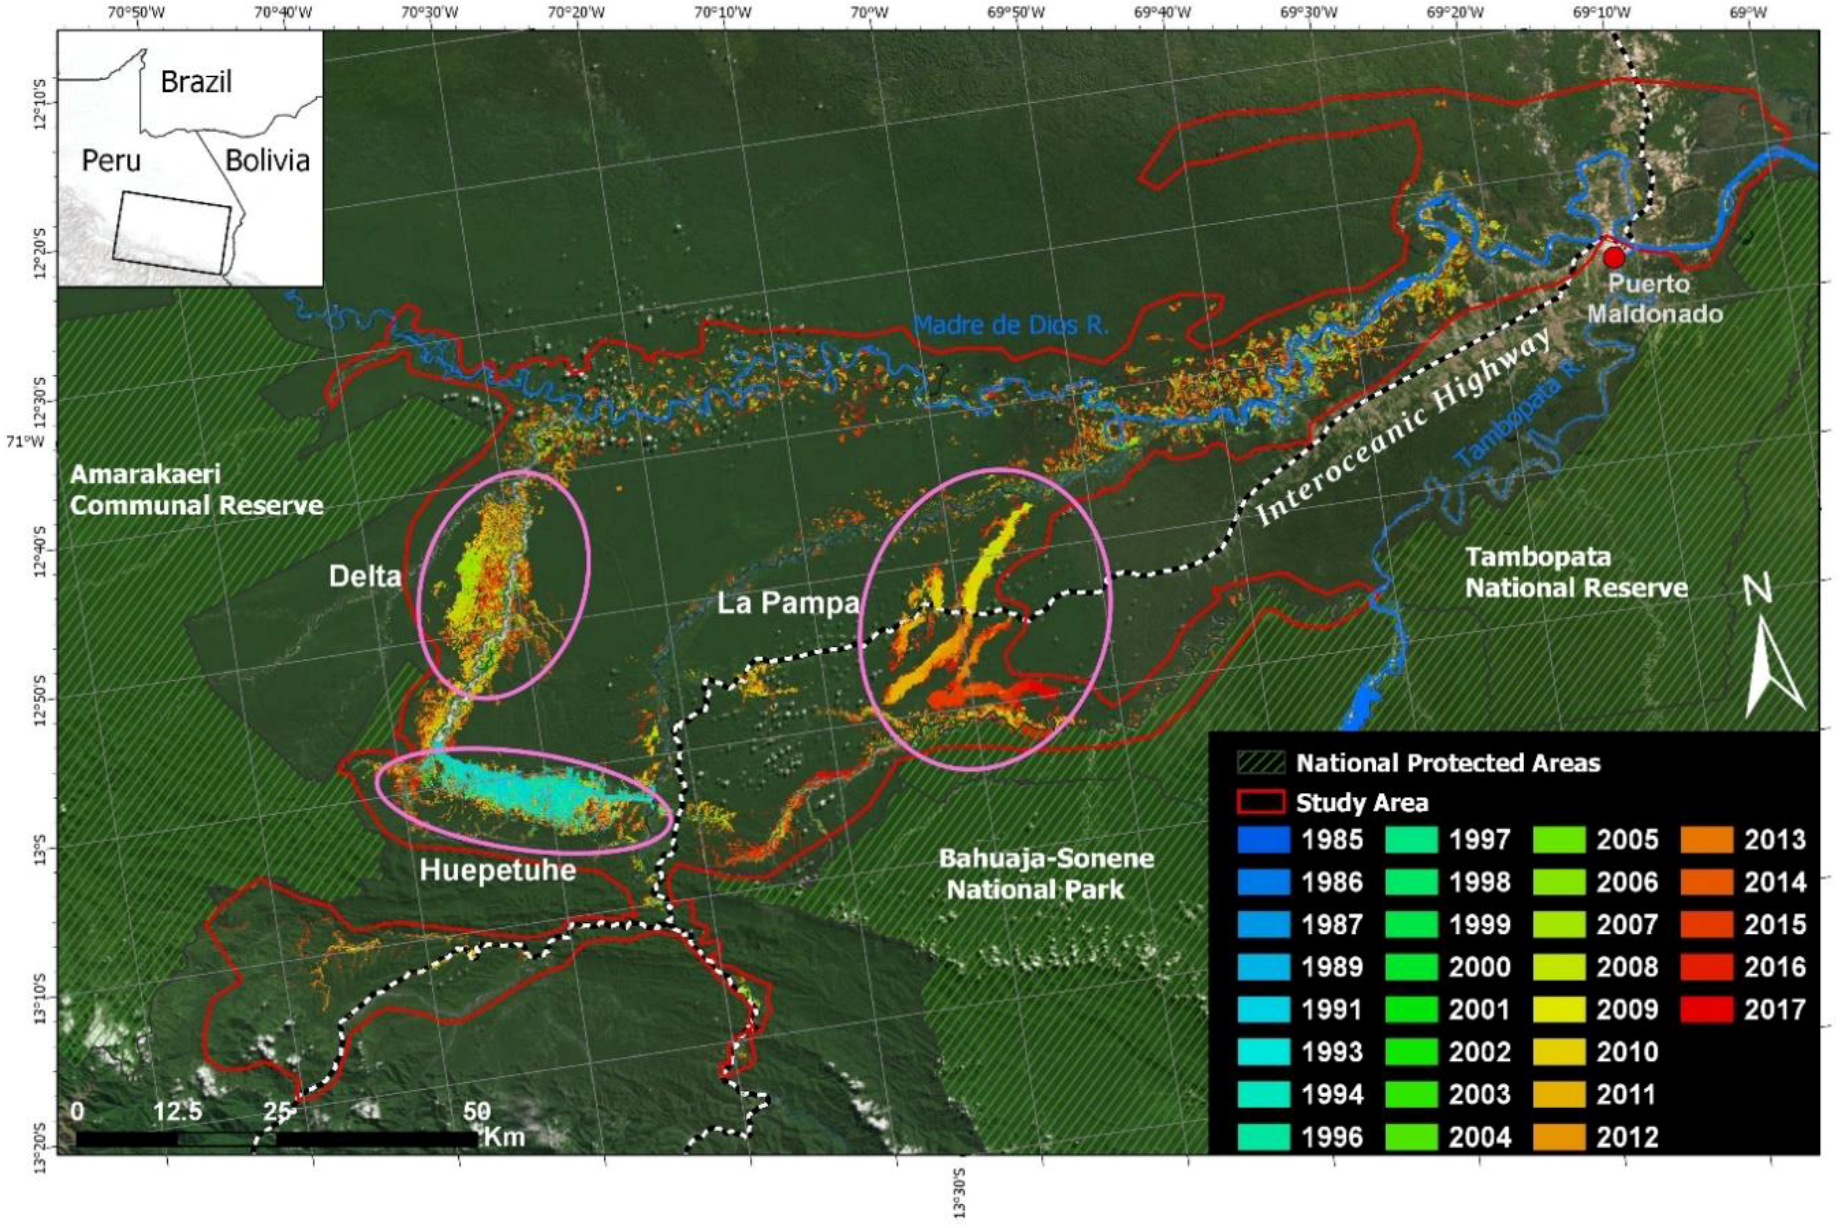
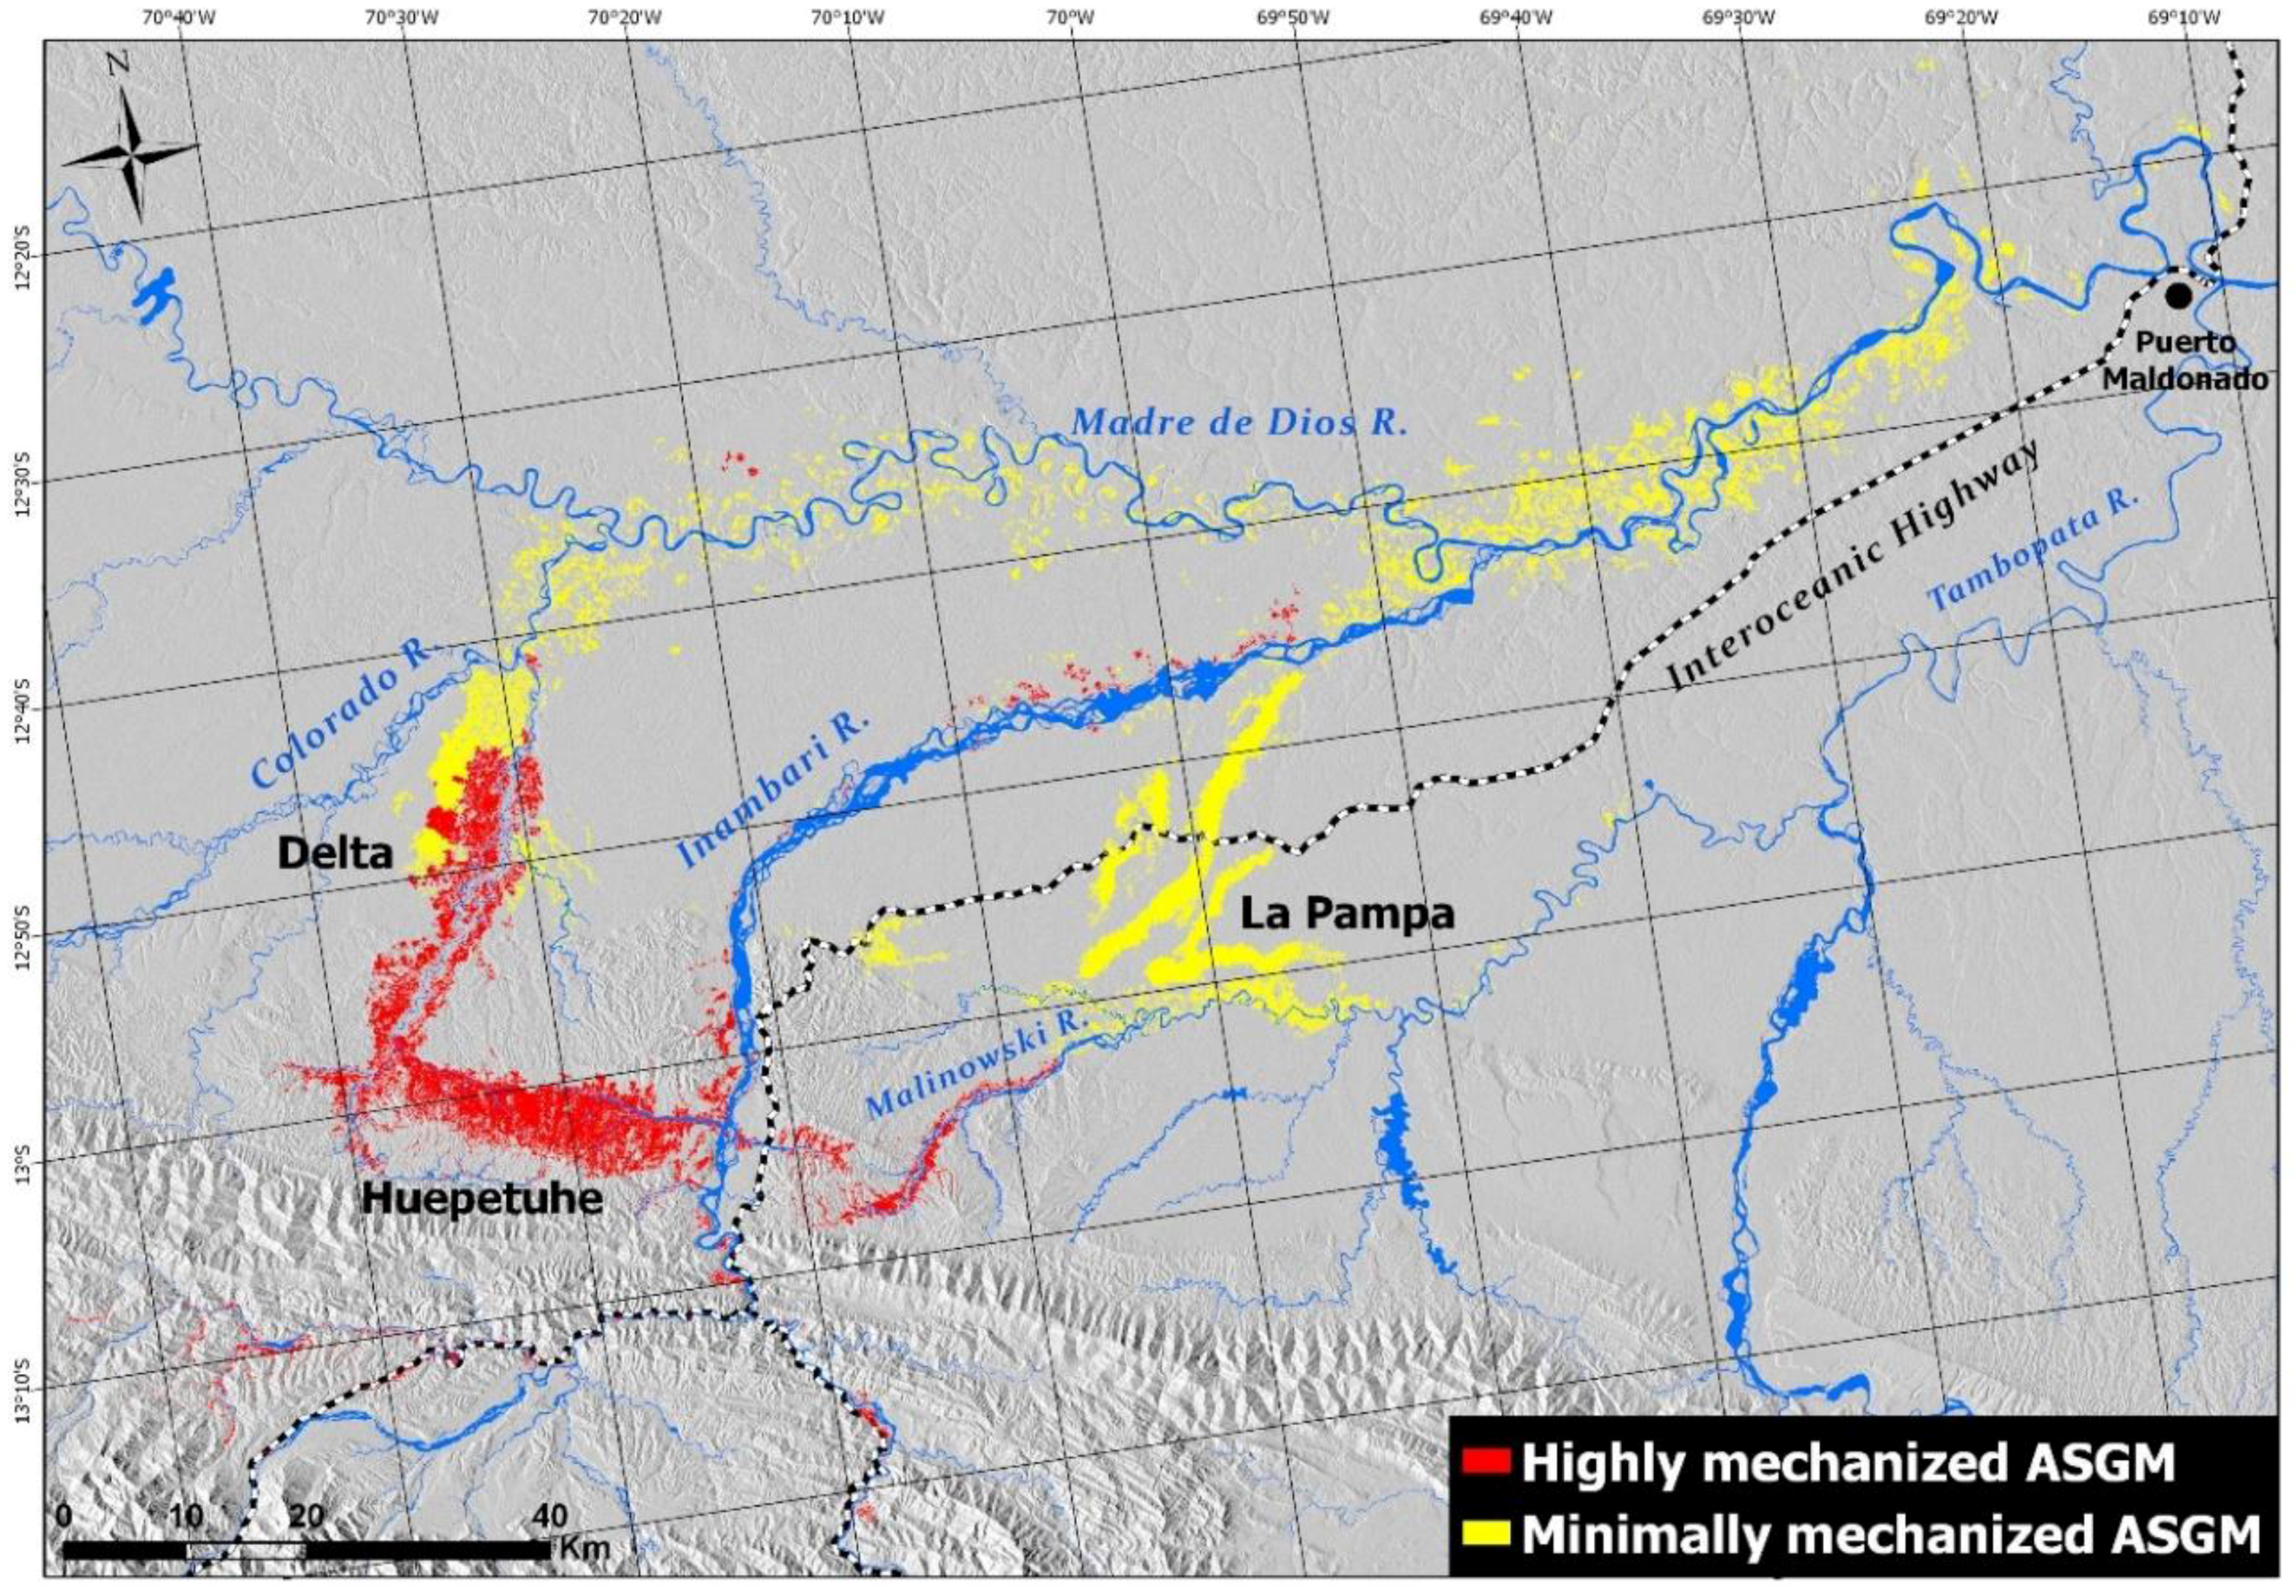
2.1. Study Area

The study area is centered on a large and ongoing gold rush located in the department of Madre de Dios (MDD) and the lowland (<500 m) portions of the departments of Cusco and Puno in southeastern Peru, an area covering approximately 7300 km2 (Figure 1). This area is transected by the southern route of the Interoceanic Highway (IOH), a Peruvian segment of the controversial Initiative for the Integration of the Regional Infrastructure of South America (IIRSA) road infrastructure program that connects the Pacific and Atlantic coasts through Brazil and Peru [11]. The IOH connects the capital of Madre de Dios, Puerto Maldonado, to the Peruvian highlands to the west and to the Brazilian state of Acre to the east. The region is also connected by navigable rivers and an expanding network of secondary roads. The study area is of global conservation importance and lies within the Vilcabamba-Amboro Conservation Corridor, including portions of three Peruvian federally protected areas: the Tambopata National Reserve (2747 km2), the Bahuaja-Sonene National Park (10,914 km2), and the Amarakaeri Communal Reserve (4024 km2). While these areas differ in their objectives in terms of conservation and protection of indigenous peoples, mining is strictly prohibited in all three.
Gold extraction from alluvial sediments has been occurring in the area since the time of the Inca, with the first concentrated extraction occurring in the southwest of the region in a large deposit near the towns of Choque and Huepetuhe. The region has been historically inaccessible, which has left large areas of primary forest intact. The population of Puerto Maldonado was 5300 in 1972 [22], with the only access to the region being by air or river. It has since grown to over 78,000 [23]. The first roads in the region were installed in the 1940s and were expanded to include the mining town at the mouth of the Colorado River in 1998, though commerce and transportation in the area was still conducted primarily by river. From 2006 through 2011, the often impassible two-track dirt road that linked Puerto Maldonado to the Peruvian highlands, and the similarly seasonal road that linked the left bank of the Madre de Dios River with the Brazilian town of Assis, were improved and paved, significantly increasing regional mobility. In 2012, these two road segments were connected with a suspension bridge spanning the Madre de Dios River, marking the completion of the Interoceanic Highway, the first road to link the Atlantic and Pacific in South America [11].

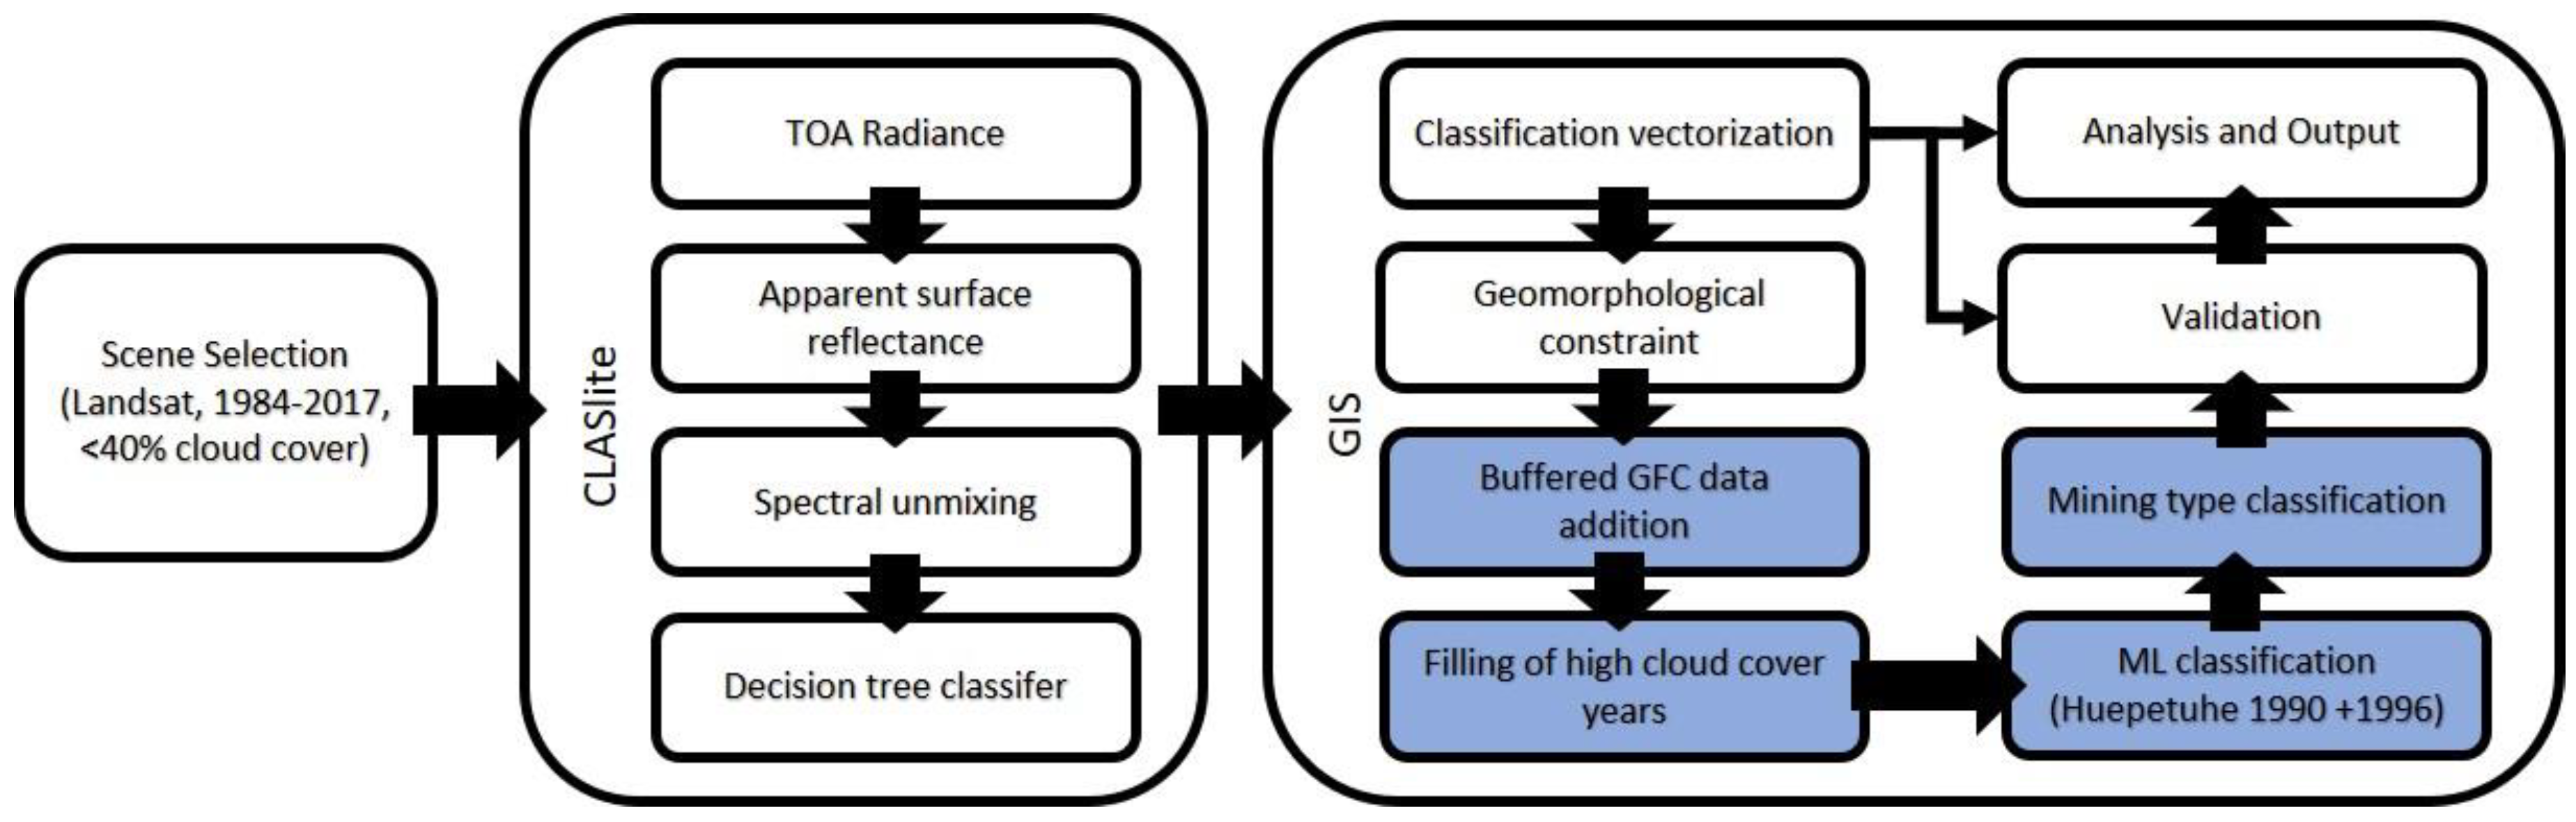
2.2. Satellite Image Processing and Mining Detection

The study area lies within two Landsat scenes (path-rows 02-69 and 3-69). We collected all Landsat Thematic Mapper (TM)/Enhanced Thematic Mapper Plus (ETM+)/Operational Land Imager (OLI) images with less than 40% cloud cover from archives of the United States Geological Survey (USGS). This threshold was chosen to minimize the likelihood of including imagery with large portions of the study area covered by clouds as clouds in the scenes used tend to aggregate to the west of the study area in montane areas. This resulted in a collection of 68 Landsat images spanning 34 years from 1985 to 2017. The following imagery pre-processing steps were then carried out in CLASlite: masking clouds, surface water, and SLC-off error areas, conversion to top-of-atmosphere radiance, and conversion to apparent surface reflectance. A probabilistic spectral unmixing model was then applied to the reflectance data, yielding a subpixel fractional cover of photosynthetic vegetation (PV), non-photosynthetic vegetation (NPV), and bare soil (S) [16]. We followed a modified version of the methodology of Asner et al. [19] for detection of gold mining operations, setting our forest change detection decision tree to detect the presence of at least 25% bare soil per pixel. We found that the water mask generated by CLASlite had difficulty identifying turbid water in mining areas resulting in highly variable detection of mining ponds, with many of them instead being classified as soil (Figure S1). As such, we did not use the water mask for mining classification, as the mask would have to be edited manually for all water bodies, and because areas of water missed in this labor-intensive step are later added with the GFC fusion. The resulting raw mining classification raster was then converted to a vector format using a geographic information system [24].
Following the use of CLASlite for initial mining detection, we used a series of data fusion steps to expand and refine the classification to add undetected mining and remove false positives. First, we used geomorphology data published by the Peruvian government [25] to differentiate mining from other deforestation by constraining possible mines to areas with access to surface water. The geomorphology map includes 32 classes at a 1:1,000,000 scale, and this was used to limit mining areas to those near streams, larger river floodplains, and wetlands. Second, we used mining detected by CLASlite from 2000 to 2017 as a source layer to select pixels deforested in the same year from the Global Forest Change (GFC) dataset [17] that fell within 200 m of mining detected by CLASlite. This served to expand mining polygons to include adjacent mining areas that were not classified as such by CLASlite. The GFC dataset was chosen because, while it does not identify the cause of deforestation, it is highly reliable in detecting the presence or absence of deforestation. We chose a 200 m buffer surrounding CLASlite-detected mining based on our observations that mining tends to be spatially aggregated and that CLASlite, while identifying mining areas well in general, failed to accurately identify its full extent. Finally, CLASlite performed poorly in the classification of mining inside the Huepetuhe mining area—the largest mining area in the study region—possibly due to high levels of cloud cover. In order to improve the CLASlite output in this sub-region, a maximum likelihood classification of mining and non-mining areas was performed in ArcGIS Pro [24] using Landsat TM images taken in 1990 and 1996. The mining areas classified during this step were added to the previously identified mining for those years. Due to high levels of cloud cover in 1988, 1990, 1992, and 1995, we evenly split the amount of deforestation for each two-year period surrounding these years to obtain an average annual rate. We summarize the data processing and analysis workflow in Figure 2.
In order to estimate the amount of mining occurring on river bank beaches, we estimated the amount of beach land in the mining region by manually delineating approximately 50 beaches on the Madre de Dios and Tambopata rivers through visual interpretation of WorldView imagery [26], generating an average number of beach hectares per river-mile, and multiplying this by the number of river-miles in the region. We then used the assumption that all beaches are mined, which appears to be accurate based on the extensive firsthand experience of the authors in the region. While this results in a very rough estimate, we do not include it in our 34-year analysis of ASGM. It stands apart from remotely-sensed ASGM and is used only in our discussion of dark mining, one source of error in our method and others, and to highlight the need for additional study.

2.3. Gold Mining Type Classification

We used high-resolution satellite imagery from Planet and the Digital Globe WorldView series [26,27] to visually classify the methods used by mining in the study area. Mining deforestation was grouped into two types, shown in Figure 3, based on whether the land cover change was caused by ASGM that was done through excavation (highly mechanized mining using heavy machinery such as excavators, front loaders, and dump trucks for sediment transportation) or suction (minimally mechanized placer mining operations using high pressure water cannons to liquefy stream-side sediments which are transported to sluice boxes via diesel-powered water/sediment pumps). Mining types are generally divided geographically, as seen in Figure 4, and temporally, which allowed easy demarcation of the distinct mining zones. Both types of mining operations result in unique patterns of disturbance to the landscape and ongoing research suggests that they have different post-mining successional trajectories and potential for recovery and restoration [28].

2.4. Analysis of Economic Drivers

We investigated the effects of gold prices [29], road infrastructure [11], and interdictions on deforestation rates. Interdictions as used here include police or military actions in the region in which mining equipment was destroyed and/or arrests were made for mining activities, the former being the most common mode of action. Land-based interdictions are led by the Peruvian National Police while interdictions in the river and on beaches are made by the Peruvian Navy. Data for interdictions were compiled from numerous local media reports and unpublished information from the Peruvian Presidency of the Council of Ministers. Data on road construction and improvement comes from Moore [30], a visual assessment based on historical Landsat imagery, and information provided by long-term residents. Statistical analyses were performed in JMP 13.0 [31]. Total annual deforestation for the region due to all drivers is provided by GFC [17].

2.5. Validation

To assess the classification accuracy of CLASlite alone and of our data fusion method, we generated 1000 random control points within the study area that included all detected mining as well as a 700 m buffer surrounding it. We assayed each point for the presence of mining and the mining type through visual interpretation of high-resolution Planet imagery (4 m2). In order to avoid error due to georeferencing error of Landsat and/or Planet imagery, only points with a single land cover type within a 45 m radius were used. In total, 325 points were rejected due to occurrence along a land cover class edge or due to an inability to accurately classify them using high resolution satellite imagery.
We quantified error using an error matrix as described in Lillesand et al. [32], calculating producer’s accuracy (proportion of reference sites in class X correctly classified as X), user’s accuracy (number of reference sites correctly classified as X divided by all sites classified as X), overall accuracy (proportion of reference sites correctly classified), and the kappa statistic (a measure of classification accuracy as compared to random classification).

3. Results

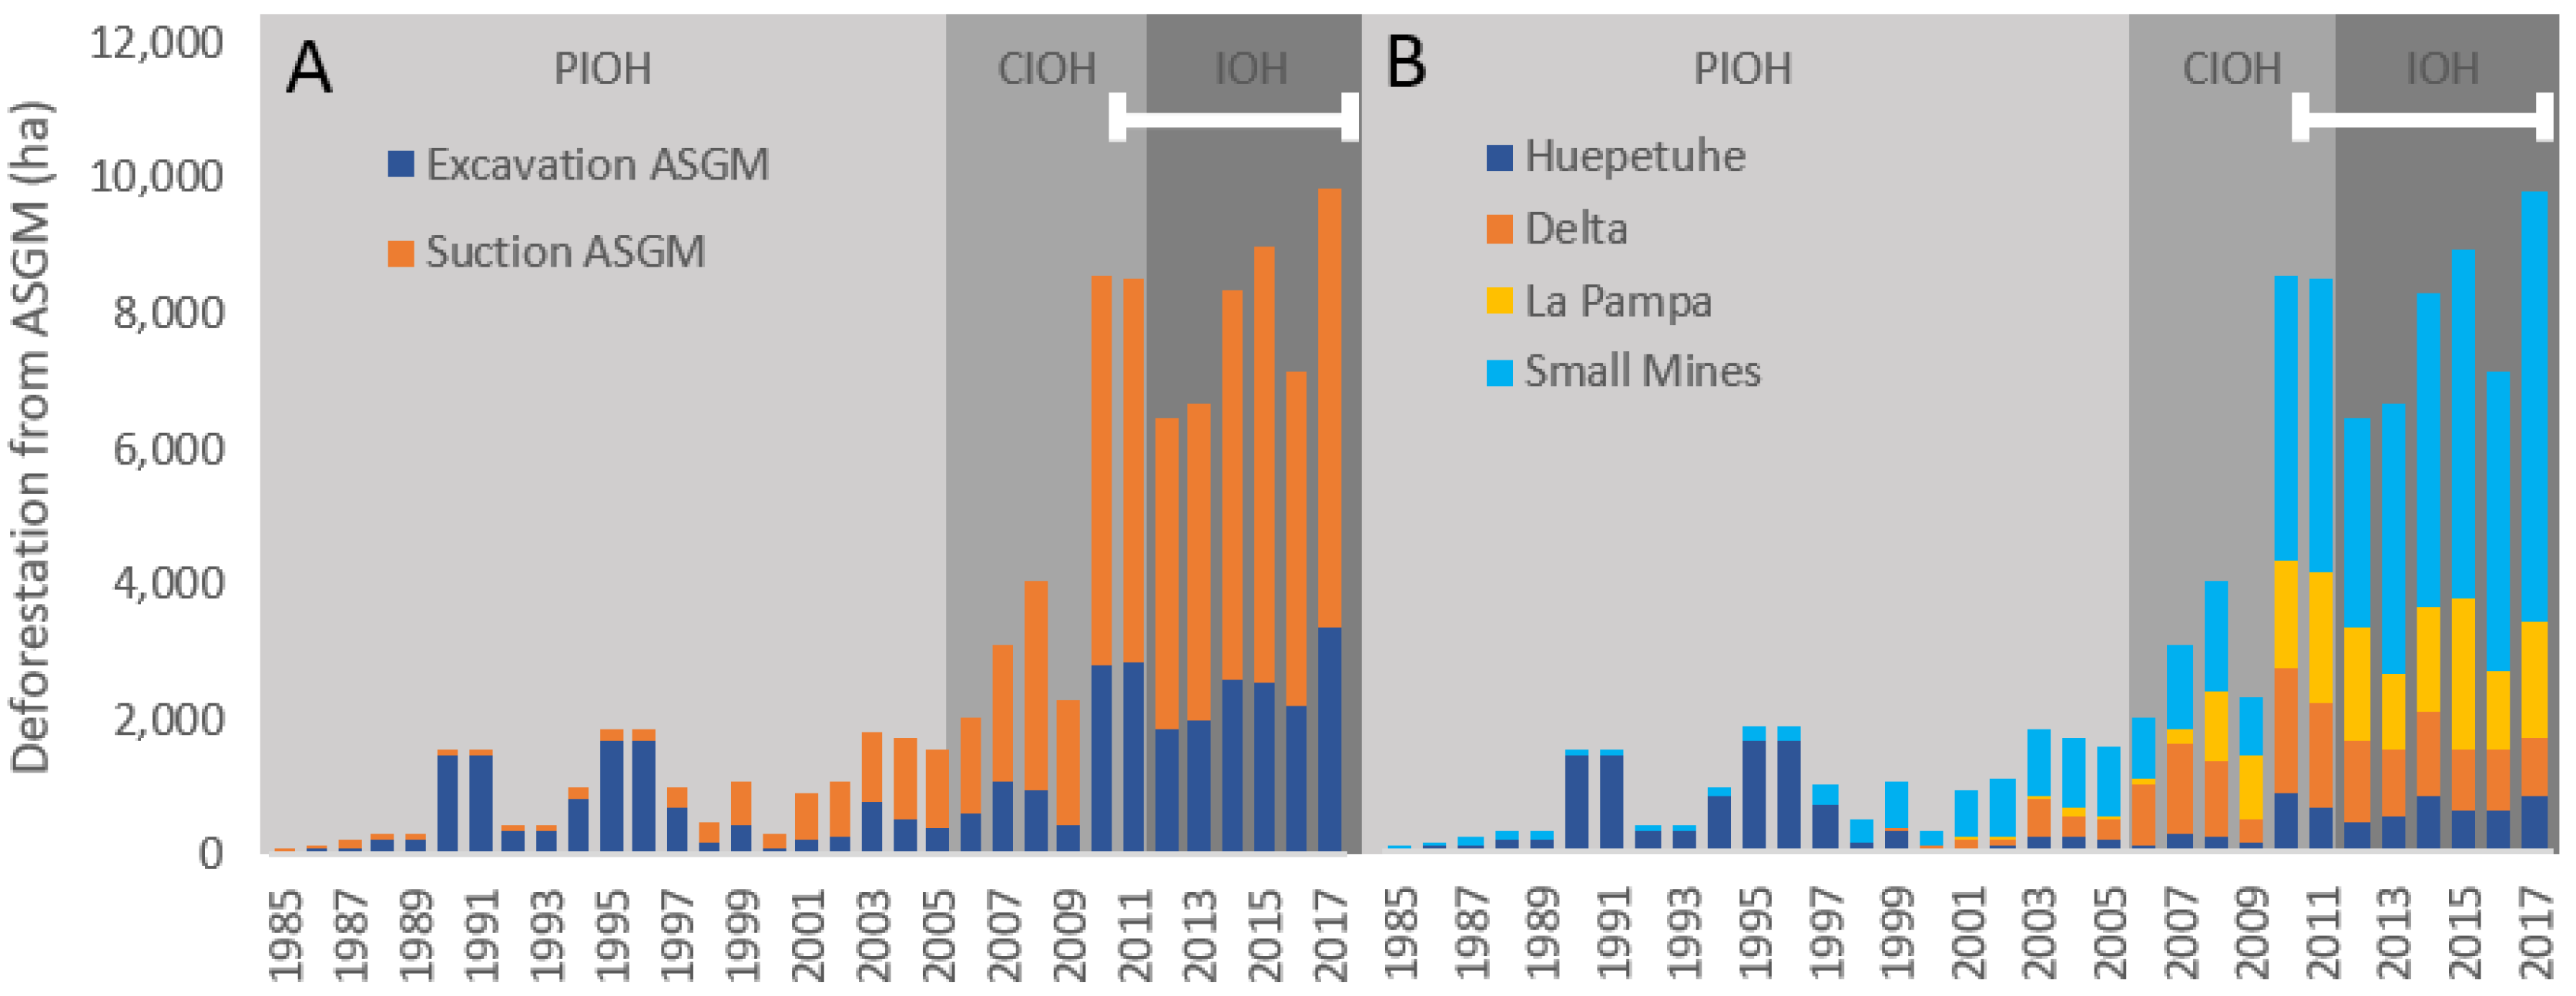
3.1. Historical Deforestation from Gold Mining

From 1985 to 2017, 95,751 ha of forest were lost due to gold mining activities in the Southeastern Peruvian Amazon. In the seven years from 2010–2017, 64,586 ha were lost to gold mining, more than double the total area lost in the preceding 26-year period (1985–2009, 31,165 ha). Deforestation in three of the largest mining areas accounted for 49% of all cleared land and had distinct periods of intensification; Huepetuhe (1990–1995), Delta (1997–2010), and La Pampa (2004–2009). These three mining sites combined totaled 47,113 ha of cumulative deforestation as of 2017. Mines outside of these three zones are classified as small mines based on their spatial extent and contagion, as defined in previous studies [5,18,19]. It is important to note that in the aggregate small individual mines cause a vast amount of deforestation and forest fragmentation; small mines accounted for 51% of all ASGM-caused deforestation and rapidly expanded throughout the region from 2001 to 2010. Since then, small mines have generally continued to expand and, as of 2017, comprised 65% of all new mining.
Annual deforestation rates were low but generally increasing from the period 1984–1985 through 2000, with deforestation rates well below 1000 ha yr−1 save for small mining booms in 1990–1991, 1994–1997, and 1999 (Figure 5). The booms correspond to expansion of mining in the Huepethue region, save for 1999, when small mining accounted for more than 50% of all mining, as miners dispersed through the region and opened up the large Delta and La Pampa zones. After 2000, annual deforestation rates exceeded 1000 ha yr−1 in all years with the major patterns being a sharp decrease in deforestation in 2009, followed by a major (3.7×) increase in area mined in 2010, staying high ever since. The pattern of annual deforestation rates to mining type, policy, and drivers are presented in Section 3.2, Section 3.3, Section 3.4, Section 3.5 and Section 3.6.

3.2. Underestimation of Mining Extent Using CLASlite

Using CLASlite alone, without automated addition of misclassified areas or the manual correction of classification error that has been used in previous studies, produced an estimate of deforestation of only 66,034 ha during the period between 1985 and 2017, underestimating the total mining area by 30%. We find a 55% user’s accuracy in mining classification using CLASlite alone, a value lower than the 78% producer’s accuracy achieved with our method integrating the GFC dataset (Table S1). Producer’s accuracy and overall accuracy values were similar between the methods (80% and 81% producer’s accuracy, 91% and 87% overall accuracy for CLASlite/GFC Fusion vs. CLASlite, respectively), while kappa was significantly higher for our method (0.73 vs. 0.58 for CLASlite/GFC Fusion vs. CLASlite, respectively, Table S1).

3.3. Deforestation, Gold Price, and the Interoceanic Highway

The largest increase in deforestation occurred during the period of construction of the Interoceanic Highway (2006–2012) and after the global economic recession in 2008–2009. During the IOH construction period, 35,000 ha of forest were lost, with another 41,000 ha lost after it was completely paved (2013–2017). The increase in deforestation rate during 2005–2012 corresponds with a similarly large increase of gold price. However, despite gold prices decreasing 26% from 2012 to 2017, deforestation from gold mining increased 53% in the same period.

3.4. A Turn toward Small Mines

Through the first 14 years of the study, mining was mostly limited to the excavation operations in the Huepetuhe sector, deforesting more than 9000 ha from 1984 to 1998 and accounting for 82% of all mining in the study region (Figure 6B). Beginning in 1998, small mines began to form a large proportion of total gold mining, with 70% of new mines being outside of the established Huepetuhe mining zone. Since 1998, small mines have continued to comprise a large portion of mining, with 65% of mines opened in 2017 being outside the large mining zones. Cumulative deforestation by small mines from 1984 to 2017 has now exceeded that in the three major mining zones (48,636 vs. 47,112 ha, respectively).

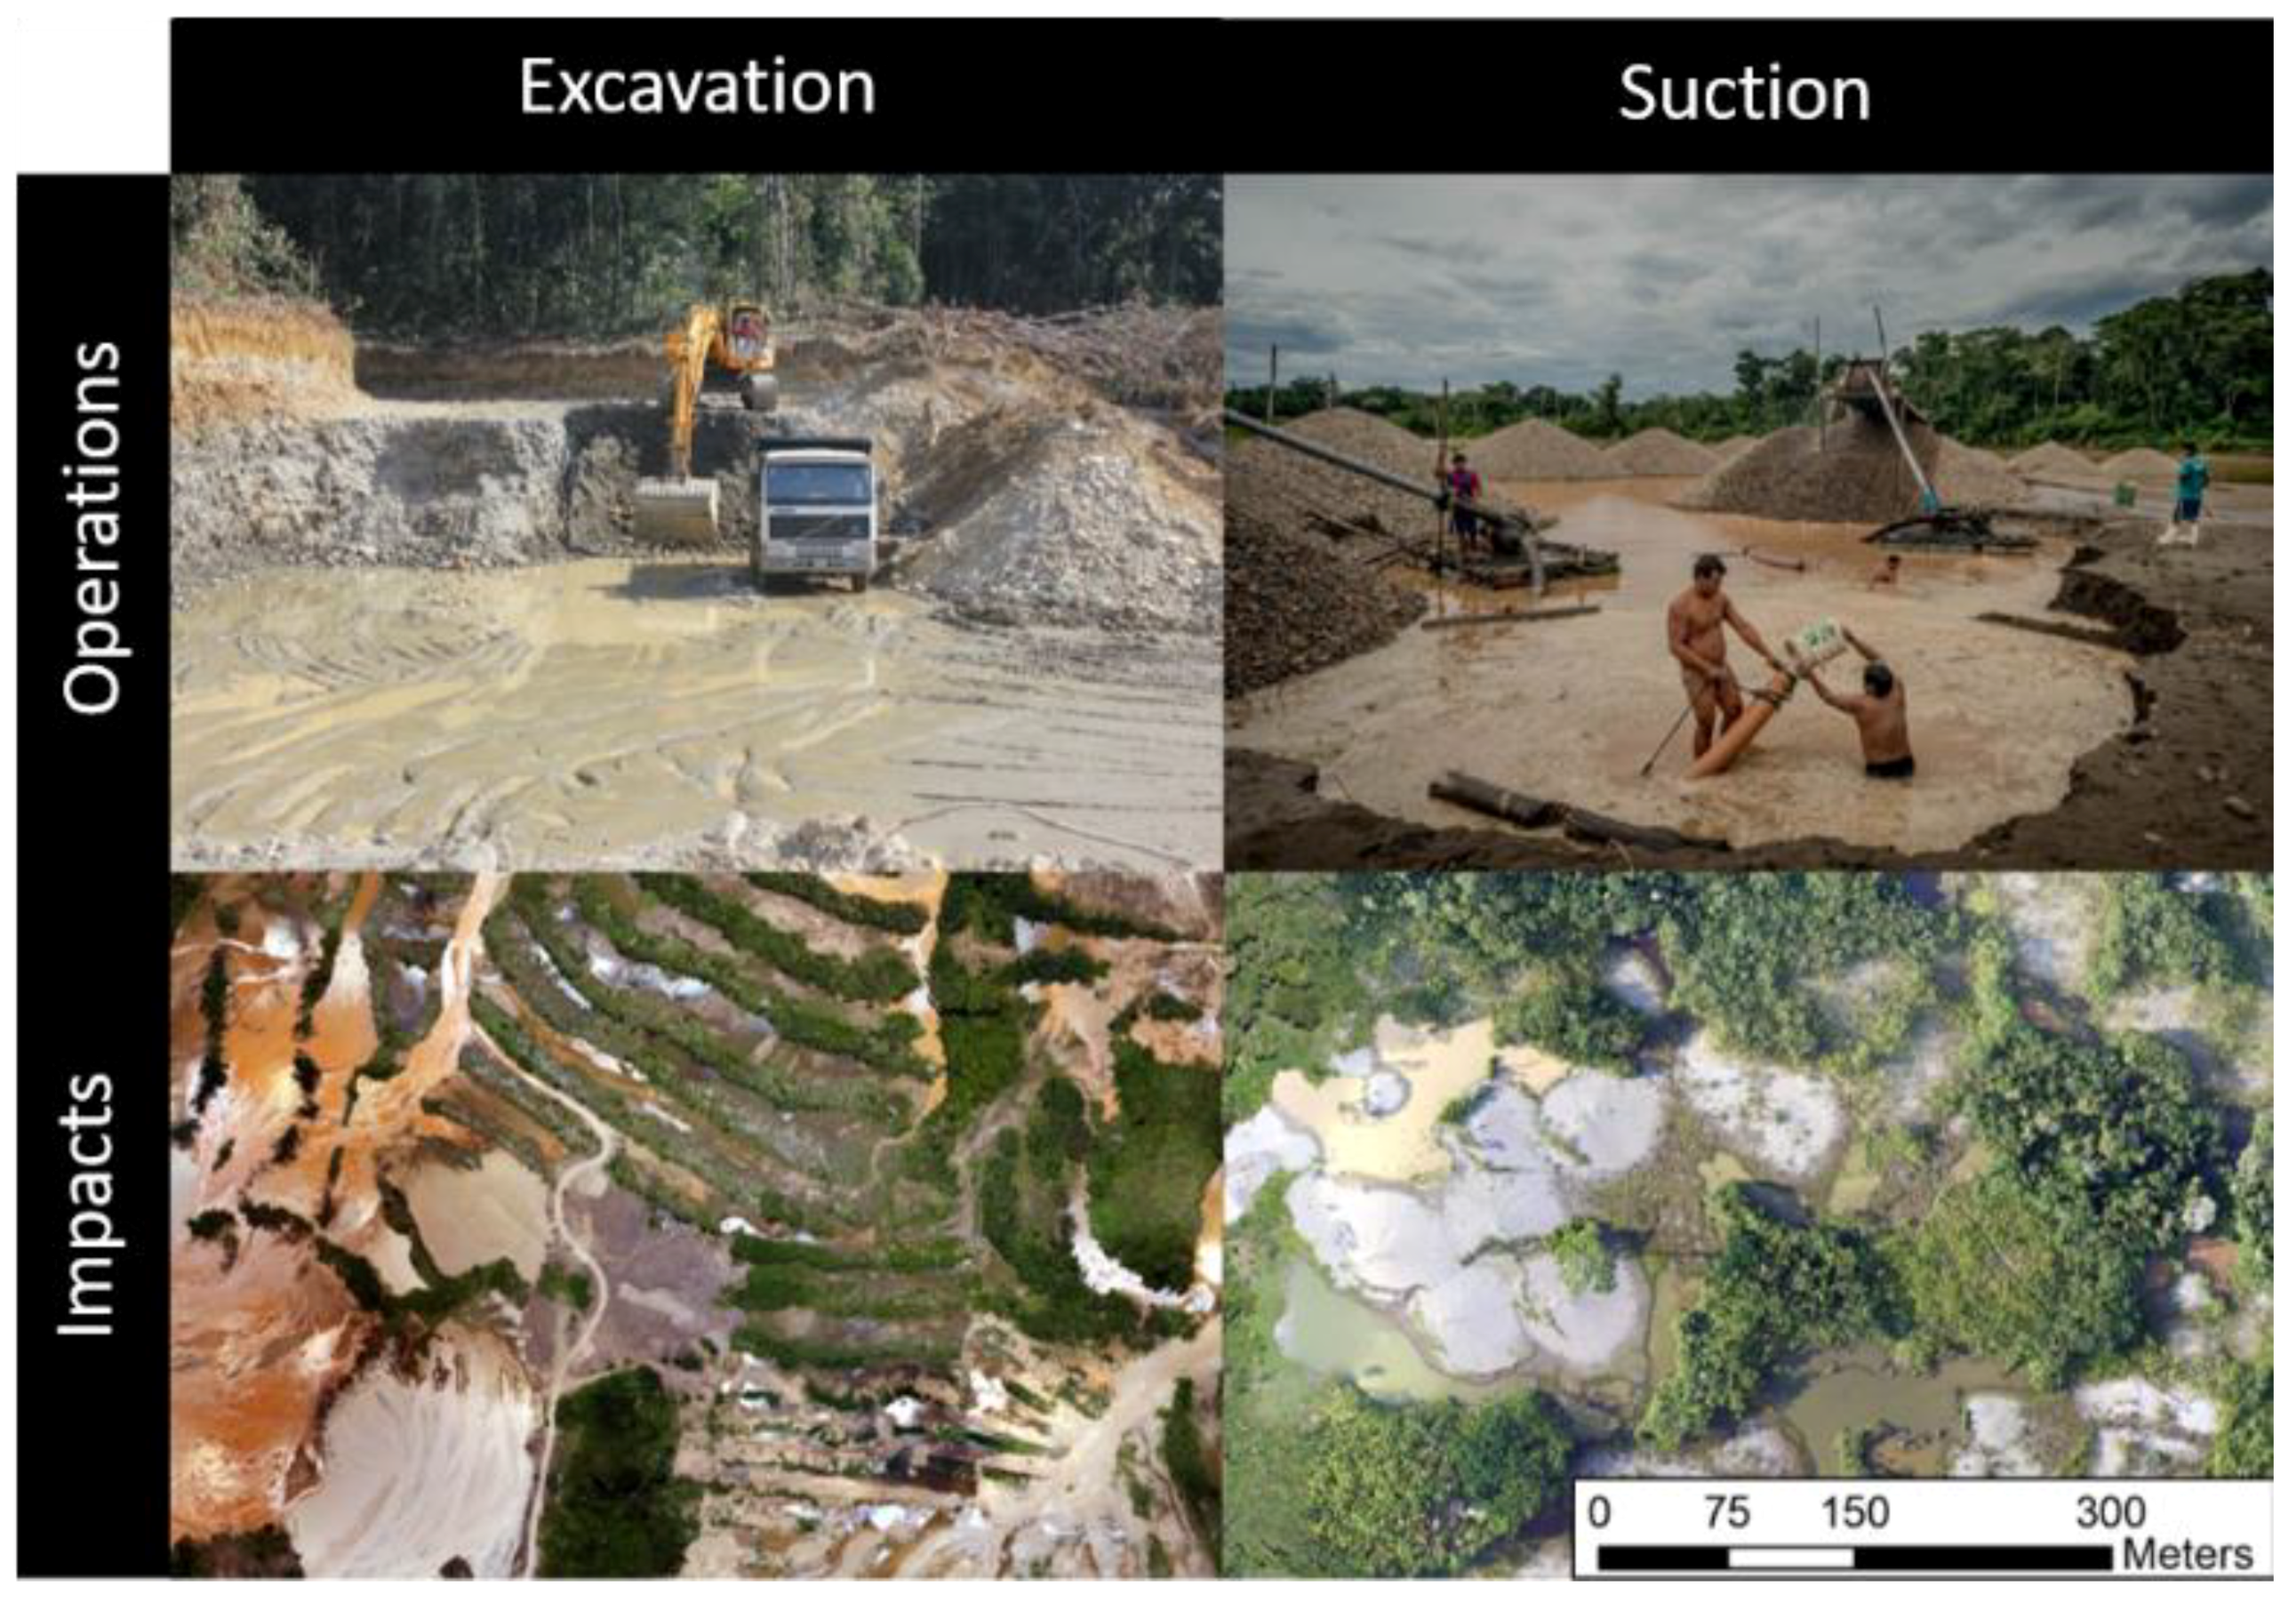
3.5. Significant Differences in ASGM Techniques

From 1985 to 1997, the majority of mining (84%) in the study area occurred in the large mining zone of Huepetuhe (Figure 6A). Most of this mining was conducted using excavation techniques. Beginning in 1998, a paradigm shift occurred in the mining practices used in the region as mining using suction methods began to comprise a larger portion of the mining activity in the region. Expansion of suction mining operations occurred initially in sections of the Delta mining zone, and subsequently in the La Pampa mining zone. Accuracy assessment revealed a user’s accuracy of 74 and 77% and a producer’s accuracy of 68 and 79% for highly and suction mining, respectively. Overall classification accuracy is 90% (k = 0.72). Further analysis of the accuracy of our classification of mining method is shown in Table S2.

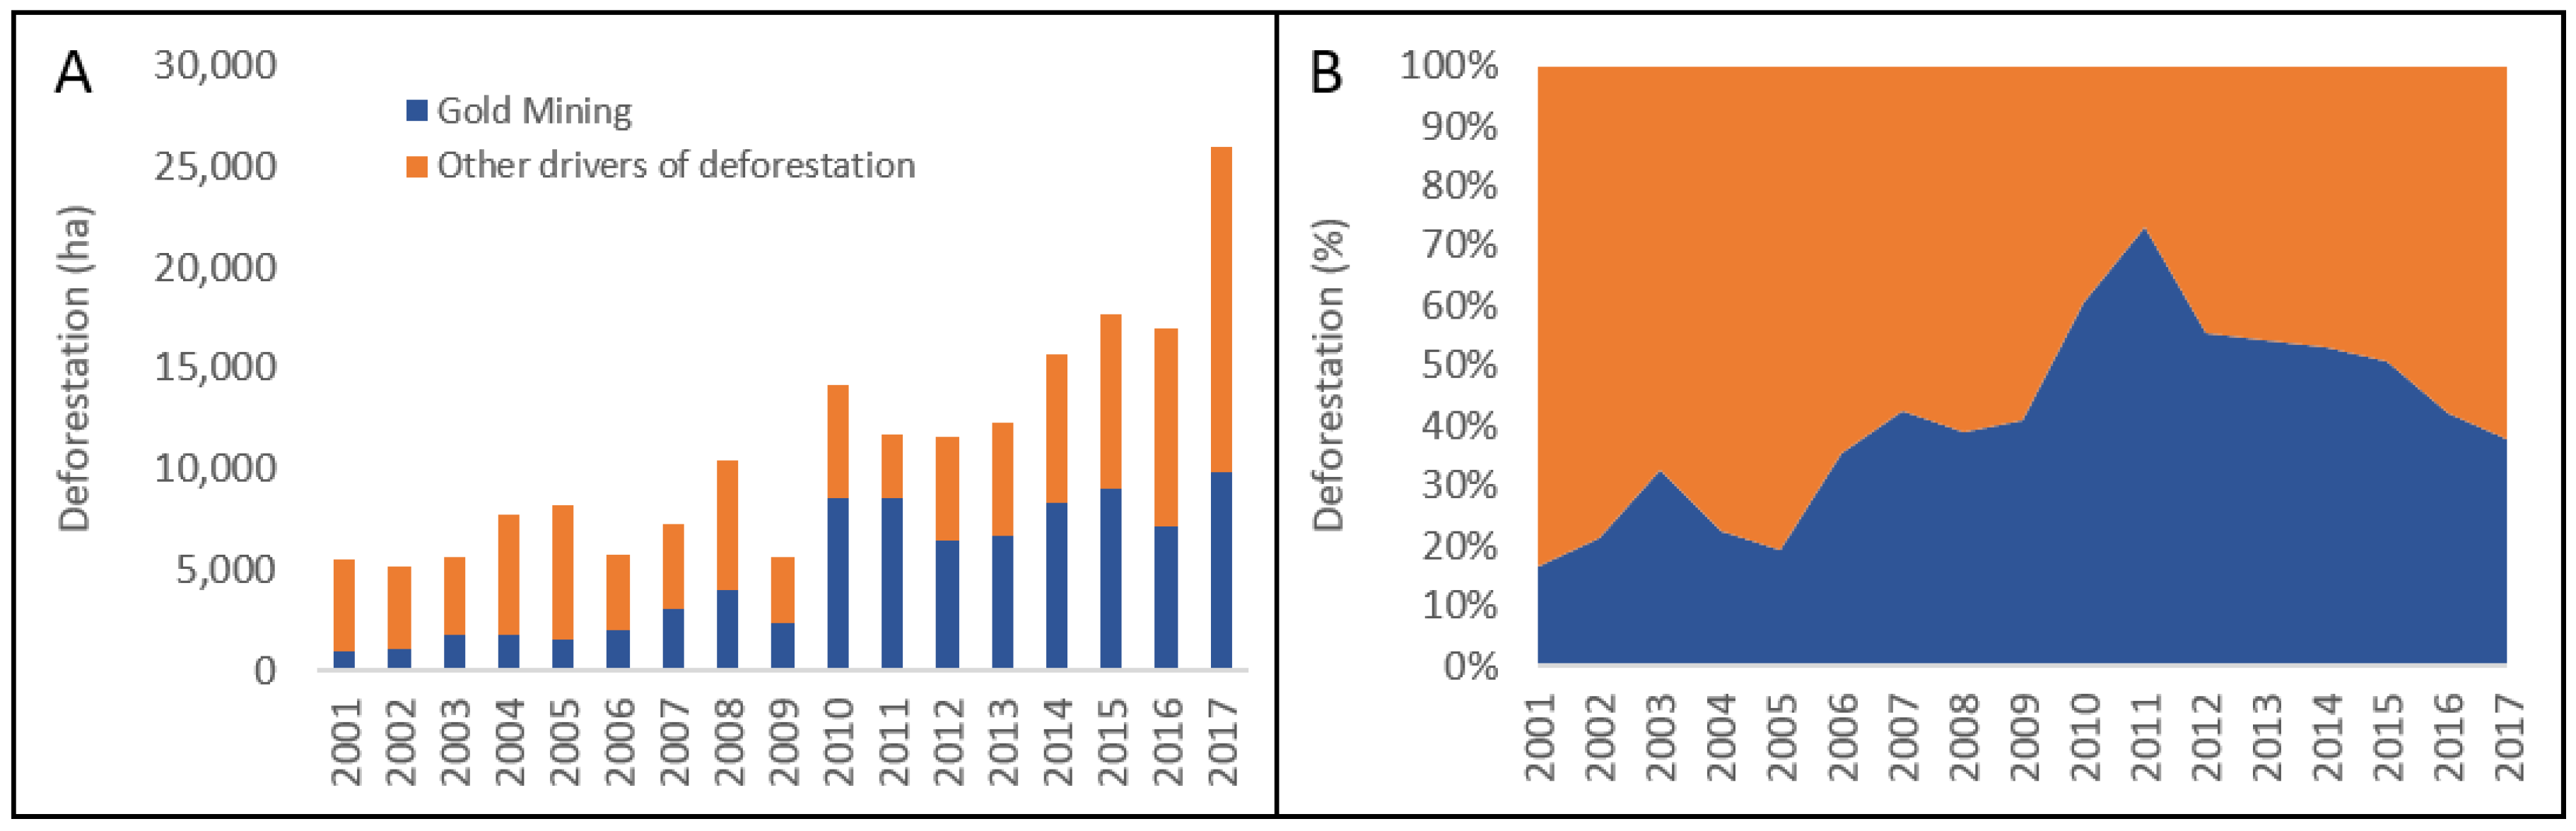
3.6. Mining and Total Deforestation

Through 2009, ASGM made up less than half of the total annual deforestation in Madre de Dios (mean = 30% from 2001–2009). In 2010, mining for the first time led all other drivers of deforestation combined in terms of annual deforestation (8572 ha of 14,180 ha, 60%). Mining was the leading cause of deforestation in the region from 2010–2015 (Figure 7). In the past 2 years, however, other drivers of deforestation have increased substantially, even though mining deforestation rates are at their highest levels ever, reducing the relative contribution of mining to 42 and 38% of total deforestation in 2016 and 2017, respectively.

4. Discussion

The results from this study provide a geography of land conversion due to mining in southeastern Peru over the last 34 years and they reveal several trends important for understanding and managing ASGM effects on landscapes. We show that there has been nearly 100,000 ha of deforestation resulting from ASGM in the period 1984–2017, and the figure will likely exceed that amount by the date this paper is published. Additionally, our results reveal mining missed by previous assessments and methodologies, giving an increase of 21%–30% over other estimates for the region [18]. To put it another way, the difference between the method presented in this paper and others used to date is the equivalent of having missed the last ~2.5 to 3.5 years of ASGM deforestation. Current rates of land conversion due to mining are the highest ever recorded and are historically unprecedented: we find that half of all ASGM-caused deforestation (47,476 ha) has occurred in the last 6 years. An alarming break in the trend of annual mining rate occurred in 2010, with rates in that year jumping to approximately 3× the level of the average of the previous five years, with annual ASGM deforestation rates remaining consistently high since then. Furthermore, since 2010 mining has spread out of the three relatively contained, concentrated mining areas (Huepetuhe, Delta, and La Pampa) to checker the landscape, with small, dispersed mines accounting for 12,172 ha of deforestation before 2010, and now covering 48,636 ha. This shows that pressures causing land conversion due to ASGM, the economies that have developed around it, and likely the types of policy interventions and recovery and restoration efforts needed to manage it, may be qualitatively different from those needed when the mining boom first captured public attention in 2009.
Our 34-year overview of the geography of mining in southeastern Peru provides a unique opportunity to assess hypothesized drivers of ASGM-caused deforestation, namely gold price signals, infrastructure changes, protected area status of the landscape, and mining techniques, as well as the effectiveness of policy responses to address it, particularly efforts at interdiction and mining regulations. In Section 4.1, Section 4.2, Section 4.3 and Section 4.4 below we discuss these topics in depth. We then turn to the significant difficulties inherent in identification and quantification of ASGM in Section 4.5, Section 4.6 and Section 4.7. We find that accurate ASGM detection is a significant hurdle to quantifying its impacts and providing the information necessary to make management and policy decisions. Effective policy and management, as well as the determination of ASGM effects on public health, biodiversity, and ecosystem function, all require accurate estimates of the extent and intensity of disturbance. A major result of this study is the large increase of mining area detected, and the novel methodology that allows it to be detected automatically.

4.1. Interdiction

Although interdiction efforts by national government agencies to control illegal mining have been widely publicized as being effective [33,34,35], they appear to have had no effect on reducing the net deforestation rate due to gold mining. Based on firsthand discussions and experiences with miners in the region, we find that many miners have changed their behavior to minimize the effects of enforcement. Miners state that they have switched to smaller equipment that is more easily hidden in the forest to avoid detection, or more inexpensively replaced in case it is destroyed. Discussions with miners have also revealed that they often pool money to pay bribes to receive information regarding the timing and location of interdictions to further minimize risk and losses. The sporadic and non-sustained pattern of interdiction efforts are also likely to have reduced their effect.
These factors combined have likely contributed to an overall ineffectiveness of interdiction activities for reducing illegal mining and related forest loss. This is not to say that interdiction cannot limit illegal mining activity but, rather, that it would need to be sustained at a level that would cause widespread risk to illegal operations and inflict capital costs of sufficient magnitude to make illegal activity unprofitable. We contrast these broader interdiction efforts with those in core protected areas, discussed below, as evidence of the strong effect of interdiction frequency and intensity. Combined with policy that affords a feasible pathway to legal mining, interdiction could have positive effects on formalizing ASGM in the region.

4.2. Economic Drivers of Mining Expansion

Land conversion due to mining has generally increased with increasing gold prices but is only loosely tied to them, which is at odds with previous results hypothesizing a more direct link between gold prices and area mined (partial correlation of area and year = 0.34, partialed with respect to year) [10]. Before 2000, there are two major booms in gold mining, with increases in 1990–1991, and 1994–1997. Both of these are marked by increases in area deforested by 100–400% per year, but are related only weakly, or even negatively with gold prices. From 2002–2012 gold prices increase steadily with a corresponding increase in land area dedicated to mining, though there is a marked decrease in mining in 2009, even though gold prices continue large gains through the time period. From 2012–2017, gold prices are high relative to long-term averages, but decrease during the period by 25% with no corresponding decrease in mining. Indeed, 2017 has the highest rate of deforestation recorded in the 34-year study period, and deforestation rates due to mining are high and decoupled from gold prices in the period 2012–2017.
The major feature of the cumulative trend in deforestation due to mining is a low but steady mean rate of deforestation of 1202 ha yr−1 from 1985 to 2009, and a jump to a mean rate of 7432 ha yr–1 since. Gold prices alone do not explain the overall pattern or details of annual changes. The increasing area of mining, accompanied by increasing non-ASGM deforestation, the majority of which appears to be due to agriculture, also corresponds to major improvements of infrastructure in the area, namely the construction of the interoceanic highway, started in 2006 and completed in 2012. This provided, for the first time, ready road access into the region, with travel times to the lowland region from highland population centers decreased from days to hours. High gold prices provided an attractive return on investment, but at least equally important, if not more important, was the easy of migration afforded by the improved road network, and the ready access to food, fuel, parts, and machinery required for mining.
A higher-level driver of land conversion in the region that underpins both mining and infrastructure is the flow of international capital, both legal [36] and illegal [12,36], and the associated threats to governance associated with the latter [37]. While individual mining operations are small in scope and managed by individuals, they are interconnected by capital sources and can be viewed as working on behalf of larger enterprises. Given these connections to large sources of legal and illegal capital, we call into the question the appropriateness of use of the term “artisanal” in describing mining in Southeastern Peru. More accurate terms may be network or syndicate mining. The economics of how this capital affects mining and its relation to not only the overall magnitude of deforestation, but also its spatial extent and spread, is unstudied, and presents an important opportunity for research that is crucial for understanding the spatial distribution and spread of mining, as well as implementation of effective policy to constrain the patterns of its growth.

4.3. Protected Areas and the Mining Corridor

A confusion exists in the popular press regarding the effects of mining on lands with protected status [38,39,40]. In agreement with [41,42], we find that protected areas (not including buffer zones and other non-core designations) are generally effective in preventing deforestation. Although mining-related deforestation within the Tambopata National Reserve spiked to nearly 400 ha yr−1 in 2016 and 2017, this still represents a small fraction (~4%) of total deforestation from mining and does not represent a significant portion of the core protected area. Further, most of the deforestation in the core protected area that occurred in 2016 and early 2017 was quickly brought under control through effective interdictions by the Peruvian National Park Service (SERNANP), which have continued enforcement activities on a regular basis since these initial incursions [43]. Meanwhile, the Amarakaeri Communal Reserve, located adjacent to the Delta mining zone, has seen very low levels of deforestation, (~10 ha yr−1) (Figure S2), though enforcement efforts and interdiction in the region is negligible.
The suppressive effect exerted over mining and other extractive activities seen within the core of the protected area, however, is not seen to extend to the buffer zones of protected areas in the region (Figure S2). Both the Tambopata National Reserve and Amarakaeri Communal Reserve have large buffer zones surrounding them which are designed to provide partial control over high impact activities near the park to minimize indirect impacts on the core zones of protected areas. Mining is ostensibly prohibited within these buffer zones but has been allowed to continue unchecked. Deforestation has occurred at an average rate 3157 ha yr−1 in the buffer zones of the Tambopata National Reserve, Bahuaja-Sonene National Park, and Amarakaeri Communal Reserve after 2010, with a total of 31,148 ha deforested.
Current efforts to reduce mining in protected area buffer zones are directly at odds with existing government policy on mining, however, as a total 72,446 ha of mining concessions exist within the buffer zones of the protected areas mentioned above. This has resulted in nearly a third of all mining occurring on lands with some protected status and highlights the need to resolve conflicting land tenure designations.
The near absence of mining in core protected areas may be due to effective interdictions, a perception that enforcement is stronger inside core area boundaries, and, potentially, a widely-shared national pride in these protected areas. Whatever the cause, the major pressure from mining interests on the periphery of the protected areas suggests disruption of the current détente could lead to rapid and massive land conversion to the core areas of globally important parks and reserves.

4.4. The Significance of Mining Methods

Though ASGM is generally referred to as a homogenous activity, there are substantial differences in impacts between the two major mining methods used in Madre de Dios [44]. Lands worked with suction mining, using water cannons and suction pumps to move sediment, appear to have significantly poorer regeneration potential than those worked with excavation mining [28], with substantial differences in the amount, spatial scale, and spatial location of water and barren terrain left on the landscape. Excavation mining also has the advantage of having the ability to replace soil after mining, while suction mining increases soil loss as sediment is lost to river transport or to surrounding water bodies. This sediment loss is important when considering subsequent land uses, mercury transport, and changes in biogeochemical cycling in mined areas. While soil replacement is not currently performed with excavation mining, formalization policy has the potential to direct operations toward this practice.
Due to soil loss and large-scale topographic change caused by mining, much of the mined area has a reduced probability of returning to forest and is more likely to remain as highly degraded permanent wetlands (excavation mining) or wetlands that will undergo hydrosere succession/slow infilling due to sedimentation, though on a very shallow topographical gradient (suction mining). Economic activities seen on these transformed lands include fish farming and paddy rice cultivation, though many may be better suited for reforestation with the edible wetland palm Mauritia flexuosa (aguaje), which would also replace a habitat (Mauritia flexuosa swamps) targeted by ASGM that is under threat in the region [45].
A wide range of forest recovery rates that appear to be correlated well with distance to forest edge have also been noted in research into natural regeneration in mines [28]. Likely driven by seed dispersal limitations, the regeneration rates of large mining areas such as Huepetuhe and La Pampa may be very low. Any perceived benefit of small area mines should, however, be balanced against the severe forest fragmentation and increased edge effects that are likely to occur with a high-density of small mines. Further, as over 90% of trees in surrounding forests are dispersed by animals, the effects of mining type on hunting and defaunation will play a central role in the potential for forest recovery and subsequent composition in the region [46,47]. Mining methods also likely have significant impacts on the amount of mercury pollution and how it behaves in the environment. Biogeochemical cycling, particularly the conversion between elemental and methylmercury, depends on transport, biotic communities, and anoxic conditions, and these in turn are all affected by mining type [48], though these dynamics are poorly understood.

4.5. Dark Mining

One aspect of mining not detectable using our methodology, or others applied to date, is a feature that we call Dark Mining. Dark Mining is mining that occurs in areas that were already deforested or areas that were never forested. This includes areas that are re-worked, either to access gold in deeper sediments or gold that remains due to the inefficiency of mercury-based extraction, as well as all mining that occurs on river beaches and in the river beds, which is a substantial target for placer-deposit mining. We estimate beach mining to be between 3000–4000 ha in total, or 3–4% of all mining, based on the amount of beach area in the region and the assumption that all beaches in the mining zone have been mined. While seemingly small, it is nearly all the beach habitat in the region, potentially creating acute habitat shortages for beach nesting birds and turtles. Its effects on fish reproduction, many of which spawn in or have larval stages that use riverbeds and seasonally submerged beaches, remains unknown, even though these fish represent an important source of protein for residents in the region, particularly indigenous peoples, and harbor high biodiversity. There are no current estimates of the amount of mining that is done by reworking land, even though this will be the primary factor determining regeneration on mined lands.
Additionally, the geographic positioning of mining can have disproportionate effects on mercury biogeochemical cycling and transport. Mining occurring along rivers adds elemental mercury directly to the mainstem of rivers, allowing its export with the high sediment loads moving in the river and subsequent conversion to methylmercury. A series of planned dams downstream of the Madre de Dios River in the Madeira River watershed in Bolivia and Brazil raises the specter of these dams becoming mercury traps, retaining mercury from basin-wide ASGM with concentrated production of methylmercury in their reservoirs.

4.6. Difficulty in Accurately Classifying ASGM

While easily identifiable by visual inspection in both Landsat-based and high-resolution satellite data, landscape disturbances caused by ASGM are difficult to accurately classify using current methodologies on medium scale multispectral satellite data. This is due to the heterogeneous nature of the post-mining landscape, in which large areas of bare ground, water, and remnant or new vegetation are mixed in the same Landsat pixel. During our work estimating deforestation due to mining, we found large differences between the results of our methodology and the use of CLASlite alone. One likely cause is that Asner et al. [18,19] relied on additional manual editing to fill in areas within mining zones that were classified as a different habitat [20], particularly as related to water bodies generated by ASGM. While manual post-classification editing may be able to provide an accurate estimate of ASGM, it is too labor-intensive to be feasible for regularly generating updated maps and estimates of ASGM over large spatial areas.
We developed a data-fusion method that significantly improved and completely automated classification of ASGM-caused landcover change. The method leveraged the strength of CLASlite in identifying kernels of mining activity with the GFC dataset, which uses a different methodology to accurately discriminate forested vs. non-forested areas. Since mining disturbance is heterogeneous in its spectral signature, but spatially contagious, CLASlite can be used to identify mining disturbances, creating a spatial prior that can then be updated by spatially restricted fusion with deforestation identified using GFC data. While all deforestation detected by GFC within 200 m of a CLASlite ASGM pixel is classified as mining, which could lead to misclassification of non-mining areas as mining, we find the error of commission is 20%, only one point higher than CLASlite alone at 19%, while more than halving omission error (from 45% to 20%). In addition to the objective of the current study to detect ASGM-caused deforestation, data fusion using GFC data may be appropriate in other instances where an image classifier reliably detects a deforestation event but performs poorly in delineating the precise extent of the forest loss. Beyond pixel-based spectral analysis techniques, object-based recognition (both deep-learning [49] and shallow-learning [50,51] based) holds great promise in accurately detecting ASGM-caused land conversion, particularly as high-resolution satellite and drone-based imagery becomes increasingly available. The fusion of pixel-based classification with these emerging methods is a particularly promising avenue to improve classification.

4.7. Classification Error

Practitioners and policy makers should be disturbed but not surprised by the large change in the absolute amount of ASGM-based land conversion identified in this study solely due to methodology. The result should not be attributed to the general discussion in science regarding irreproducibility, but rather to methodological advances that allow better detection of mining-based disturbances. This will continue to occur with the shift towards high-resolution remote sensing data sources and the application of artificial intelligence to image classification. The result is generalizable to all remotely-sensed change detection, and points to the importance of quantifying errors, explaining methodological weaknesses, and predicting how methodologies fail.
In the current study, though reduced compared to other methodologies, the largest error was of omission, with mining sites being misclassified as non-mining habitat types. We expect the application of high-resolution imagery and artificial-intelligence based methodologies to further reduce misclassifications. More generally, the remote sensing community should focus on communicating the possible errors in classification and establishing metrics that are useful to subsequent consumers and uses (e.g., governance, policy, restoration, ecosystem services, biogeochemical cycling).

5. Conclusions

Detecting ASGM and quantifying its impacts on a regional scale still poses a significant challenge, despite expanding access to high resolution satellite imagery and improving imagery classification techniques. We demonstrate the fusion of multiple satellite imagery analysis techniques and deforestation data products to generate a comprehensive chronology of ASGM in Southeastern Peru. Further, we do so in a highly automated fashion, allowing for easy replication of our methods in the future. This provides the unique opportunity to establish a 34-yr chronology of mining and to analyze the drivers of ASGM in Southeastern Peru. While not a comprehensive study of the socioeconomic and policy factors affecting mining, we propose the starting points for an ongoing discussion regarding the complex issues surrounding mining in the region. We do so in the context of an improved understanding of the spatiotemporal patterns of mining, while addressing the shortcomings and potential points of failure of our analysis, which serves to move the discussion forward and to improve economic and environmental outcomes in the region.

Supplementary Materials

The following are available online at https://www.mdpi.com/2072-4292/10/12/1903/s1, Figure S1. Misclassification of water as soil by CLASlite. Figure S2. Mining and federally protected areas, Table S1. Error matrix for mining identification, Table S2. Error matrix for mining type classification.

Author Contributions

Conceptualization: J.C.E., M.M., and M.S.; methodology: J.C.E., M.M., and M.S.; validation: J.C.E. and M.M.; formal analysis: J.C.E., M.M., and M.S.; investigation: J.C.E., M.M., and M.S.; resources: J.C.E.; data curation: J.C.E. and M.M.; writing—original draft preparation: J.C.E., M.M., and M.S.; writing—review and editing: J.C.E., M.M., F.R.-D., L.E.F., and M.S.; visualization: J.C.E. and M.M.; supervision: M.S.; project administration: M.M.; funding acquisition: L.E.F., C.A., and M.S.

Funding

This study is made possible by the generous support of the American people through the United States Agency for International Development (USAID) under the terms of USAID/WFU Cooperative Agreement No. AID-527-A-16-00001. The contents do not necessarily reflect the views of USAID or the United States Government. Additional funding was generously provided by WWF-Peru and the Wake Forest Center for Energy, Environment, and Sustainability.

Acknowledgments

The authors acknowledge Dominique Tucker for his dedication to helping validate data in a timely manner and the entire CINCIA team for their support in all forms throughout the project. We thank the University of Madre de Dios (UNAMAD), The Peruvian Amazonian Research Institute (IIAP) for their logistical support. We also recognize ESRI for their generous in-kind support through donation of software, training, and other materials.

Conflicts of Interest

The authors declare no conflict of interest.

References

  1. Van der Werf, G.R.; Morton, D.C.; DeFries, R.S.; Olivier, J.G.; Kasibhatla, P.S.; Jackson, R.B.; Collatz, G.J.; Randerson, J.T. Werf CO2 emissions from forest loss. Nat. Geosci. 2009, 2, 737–738. [Google Scholar] [CrossRef]
  2. Achard, F.; Beuchle, R.; Mayaux, P.; Stibig, H.-J.; Bodart, C.; Brink, A.; Carboni, S.; Desclée, B.; Donnay, F.; Eva, H.D.; et al. Determination of tropical deforestation rates and related carbon losses from 1990 to 2010. Glob. Chang. Biol. 2014, 20, 2540–2554. [Google Scholar] [CrossRef] [PubMed]
  3. Potapov, P.; Hansen, M.C.; Laestadius, L.; Turubanova, S.; Yaroshenko, A.; Thies, C.; Smith, W.; Zhuravleva, I.; Komarova, A.; Minnemeyer, S.; et al. The last frontiers of wilderness: Tracking loss of intact forest landscapes from 2000 to 2013. Sci. Adv. 2017, 3, e1600821. [Google Scholar] [CrossRef] [PubMed]
  4. Song, X.-P.; Hansen, M.C.; Stehman, S.V.; Potapov, P.V.; Tyukavina, A.; Vermote, E.F.; Townshend, J.R. Global land change from 1982 to 2016. Nature 2018, 560, 639–643. [Google Scholar] [CrossRef] [PubMed]
  5. Finer, M.; Novoa, S. MAAP Synthesis # 1: Patterns and Drivers of Deforestation in the Peruvian Amazon; ACCA: Lima, Peru, 2015. [Google Scholar]
  6. Román-Dañobeytia, F.; Huayllani, M.; Michi, A.; Ibarra, F.; Loayza-Muro, R.; Vázquez, T.; Rodríguez, L.; García, M. Reforestation with four native tree species after abandoned gold mining in the Peruvian Amazon. Ecol. Eng. 2015, 85, 39–46. [Google Scholar] [CrossRef]
  7. Peres, C.A. Synergistic effects of subsistence hunting and habitat fragmentation on amazonian forest vertebrates. Conserv. Biol. 2001, 15, 1490–1505. [Google Scholar] [CrossRef]
  8. Ashe, K. Elevated mercury concentrations in humans of Madre de Dios, Peru. PLoS ONE 2012, 7, e33305. [Google Scholar] [CrossRef] [PubMed]
  9. Seccatore, J.; Veiga, M.; Origliasso, C.; Marin, T.; De Tomi, G. An estimation of the artisanal small-scale production of gold in the world. Sci. Total Environ. 2014, 496, 662–667. [Google Scholar] [CrossRef] [PubMed]
  10. Swenson, J.J.; Carter, C.E.; Domec, J.-C.; Delgado, C.I. Gold mining in the Peruvian Amazon: Global prices, deforestation, and mercury imports. PLoS ONE 2011, 6, e18875. [Google Scholar] [CrossRef] [PubMed]
  11. Van Dijck, P.; Van Barneveld, B. The Impact of the IIRSA Road Infrastructure Programme on Amazonia; Routledge: Abingdon, UK, 2013; ISBN 9780415531085. [Google Scholar]
  12. McSweeney, K.; Richani, N.; Pearson, Z.; Devine, J.; Wrathall, D.J. Why Do Narcos Invest in Rural Land? J. Lat. Am. Geogr. 2017, 16, 3–29. [Google Scholar] [CrossRef]
  13. Baccini, A.; Goetz, S.; Walker, W. Estimated carbon dioxide emissions from tropical deforestation improved by carbon-density maps. Nat. Clim. Chang. 2012, 2, 182–185. [Google Scholar] [CrossRef]
  14. Asner, G.P.; Knapp, D.E.; Martin, R.E.; Tupayachi, R.; Anderson, C.B.; Mascaro, J.; Sinca, F.; Chadwick, K.D.; Higgins, M.; Farfan, W.; et al. Targeted carbon conservation at national scales with high-resolution monitoring. Proc. Natl. Acad. Sci. USA 2014, 111, E5016–E5022. [Google Scholar] [CrossRef] [PubMed]
  15. Asner, G.P. Tropical forest carbon assessment: Integrating satellite and airborne mapping approaches. Environ. Res. Lett. 2009, 4, 034009. [Google Scholar] [CrossRef]
  16. Asner, G.P. Automated mapping of tropical deforestation and forest degradation: CLASlite. J. Appl. Remote Sens. 2009, 3, 033543. [Google Scholar] [CrossRef]
  17. Hansen, M.C.; Potapov, P.V.; Moore, R.; Hancher, M.; Turubanova, S.A.; Tyukavina, A.; Thau, D.; Stehman, S.V.; Goetz, S.J.; Loveland, T.R.; et al. High-resolution global maps of 21st-century forest cover change. Science 2013, 342, 850–853. [Google Scholar] [CrossRef] [PubMed]
  18. Asner, G.P.; Tupayachi, R. Accelerated losses of protected forests from gold mining in the Peruvian Amazon. Environ. Res. Lett. 2017, 12, 094004. [Google Scholar] [CrossRef]
  19. Asner, G.P.; Llactayo, W.; Tupayachi, R.; Luna, E.R. Elevated rates of gold mining in the Amazon revealed through high-resolution monitoring. Proc. Natl. Acad. Sci. USA 2013, 110, 18454–18459. [Google Scholar] [CrossRef] [PubMed]
  20. Asner, G.P. Carnegie Institution for Science. Personal communication, 2018. [Google Scholar]
  21. Lobo, F.D.L.; Costa, M.; Novo, E.M.L.D.M.; Telmer, K. Distribution of Artisanal and Small-Scale Gold Mining in the Tapajós River Basin (Brazilian Amazon) over the Past 40 Years and Relationship with Water Siltation. Remote Sens. 2016, 8, 579. [Google Scholar] [CrossRef]
  22. INEI—3.4.2 La Migración en las Ciudades de la Región Sur. Available online: https://www.inei.gob.pe/media/MenuRecursivo/publicaciones_digitales/Est/Lib0018/cap34002.htm (accessed on 28 August 2018).
  23. Población 2000 al 2015. Available online: https://proyectos.inei.gob.pe/web/poblacion/ (accessed on 28 August 2018).
  24. ESRI. ArcGIS Pro, (version 2.2) Windows; ESRI: Redlands, CA, USA, 2018. [Google Scholar]
  25. INGEMET. Mapa Geomorphologico del Perú; INGEMET: Lima, Peru, 2000.
  26. Digital Globe. Imagery. 2018. Available online: https://evwhs.digitalglobe.com (accessed on 17 September 2018).
  27. Planet Team. Planet Application Program Interface: In Space for Life on Earth; Windows; Planet Team: Lilongwe, Malawi, 2018. [Google Scholar]
  28. Román-Dañobeytia, F. Centro de Innovación Científica de la Amazónica. Personal communication, 2018. [Google Scholar]
  29. The Authority on Gold | World Gold Council. Available online: https://www.gold.org/ (accessed on 11 January 2018).
  30. Moore, T. La deforestación en Madre de Dios y sus implicancias para los pueblos originarios. In Deforestación en Tiempos de Cambio Climático; Chirif, A., Ed.; IWGIA: Lima, Peru, 2018; pp. 195–222. ISBN 978-87-92786-84-5. [Google Scholar]
  31. SAS Institute Inc. JMP, (version 13) Windows; SAS Institute Inc.: Cary, NC, USA, 2016. [Google Scholar]
  32. Lillesand, T.S.; Kiefer, R.W.; Chipman, J.W. Remote Sensing and Image Interpretation, 7th ed.; John Wiley & Sons: Hoboken, NJ, USA, 2008; ISBN 1088765432. [Google Scholar]
  33. Flores, M.C. Realizan Interdicción de Minería Ilegal en río Malinowski | El Comercio | Perú | Madre De Dios | El Comercio Perú. Available online: https://elcomercio.pe/peru/madre-de-dios/realizan-interdiccion-mineria-ilegal-rio-malinowski-noticia-469525 (accessed on 28 August 2018).
  34. Calvo, L.F. Minería Ilegal: 62 Megaoperaciones de Interdicción en el 2015 | El Comercio | Perú | El Comercio Perú. Available online: https://elcomercio.pe/peru/mineria-ilegal-62-megaoperaciones-interdiccion-2015-165913 (accessed on 28 August 2018).
  35. Marina de Guerra del Perú | Interdicciones Contra la Minería Ilegal en el río Malinowski | Noticias Navales. Available online: https://www.marina.mil.pe/es/noticia/interdicciones-contra-la-mineria-ilegal-en-el-rio-malinowski-1/ (accessed on 28 August 2018).
  36. Galaz, V.; Gars, J.; Moberg, F.; Nykvist, B.; Repinski, C. Why Ecologists Should Care about Financial Markets. Trends Ecol. Evol. 2015, 30, 571–580. [Google Scholar] [CrossRef] [PubMed]
  37. Reitano, T. Organized Crime as a Threat to Sustainable Development: Understanding the Evidence. In Organized Crime and Illicit Trade; Springer International Publishing: Cham, Switzerland, 2018; pp. 23–35. [Google Scholar]
  38. Daley, S. Peru Scrambles to Drive Out Illegal Gold Mining and Save Precious Land—The New York Times. Available online: https://www.nytimes.com/2016/07/26/world/americas/peru-illegal-gold-mining-latin-america.html?_r=0&ref=nyt-es&mcid=nyt-es&subid=article (accessed on 28 August 2018).
  39. Reserva Nacional de Tambopata es Gravemente Afectada por la Minería Ilegal—America Noticias. Available online: https://www.americatv.com.pe/noticias/actualidad/reserva-nacional-tambopata-gravemente-afectada-mineria-ilegal-n262381 (accessed on 28 August 2018).
  40. Pighi-Bel, P. Tambopata: La Reserva Natural de Perú que Empieza a Convertirse en un Desierto—BBC News Mundo. Available online: https://www.bbc.com/mundo/noticias-america-latina-37562790 (accessed on 28 August 2018).
  41. Vuohelainen, A.J.; Coad, L.; Marthews, T.R.; Malhi, Y.; Killeen, T.J. The effectiveness of contrasting protected areas in preventing deforestation in Madre de Dios, Peru. Environ. Manag. 2012, 50, 645–663. [Google Scholar] [CrossRef] [PubMed]
  42. Nolte, C.; Agrawal, A.; Silvius, K.M.; Soares-Filho, B.S. Governance regime and location influence avoided deforestation success of protected areas in the Brazilian Amazon. Proc. Natl. Acad. Sci. USA 2013, 110, 4956–4961. [Google Scholar] [CrossRef] [PubMed]
  43. Finer, M.; Novoa, S.; Olexy, T. MAAP #61: Illegal Gold Mining Decreases in Tambopata National Reserve | MAAP. Available online: http://maaproject.org/2017/tambopata_decrease/ (accessed on 31 July 2018).
  44. Cabanillas Vásquez, F. Manual de Buenas Prácticas en Minería Aurífera Aluvial Para Facilitar una Adecuada Recuperación de Áreas; Ministerio del Ambiente: Lima, Peru, 2016. [Google Scholar]
  45. Janovec, J.P. Evaluación de los Actuales Impactos y Amenazas Inminentes en Aguajales y Cochas de Madre de Dios; World Wildlife Fund Inc.: Lima, Peru, 2013. [Google Scholar]
  46. Wyatt, J.L.; Silman, M.R. Distance-dependence in two Amazonian palms: Effects of spatial and temporal variation in seed predator communities. Oecologia 2004, 140, 26–35. [Google Scholar] [CrossRef] [PubMed]
  47. Terborgh, J.; Nuñez-Iturri, G.; Pitman, N.C.A.; Valverde, F.H.C.; Alvarez, P.; Swamy, V.; Pringle, E.G.; Paine, C.E.T. Tree recruitment in an empty forest. Ecology 2008, 89, 1757–1768. [Google Scholar] [CrossRef] [PubMed]
  48. Martinez, G.; McCord, S.; Driscoll, C.; Todorova, S.; Wu, S.; Araújo, J.; Vega, C.; Fernandez, L. Mercury Contamination in Riverine Sediments and Fish Associated with Artisanal and Small-Scale Gold Mining in Madre de Dios, Peru. Int. J. Environ. Res. Public Health 2018, 15, 1584. [Google Scholar] [CrossRef] [PubMed]
  49. Zhang, L.; Zhang, L.; Du, B. Deep Learning for Remote Sensing Data: A Technical Tutorial on the State of the Art. IEEE Geosci. Remote Sens. Mag. 2016, 4, 22–40. [Google Scholar] [CrossRef]
  50. Blaschke, T. Object based image analysis for remote sensing. 5ISPRS6 J. Photogramm. Remote Sens. 2010, 65, 2–16. [Google Scholar] [CrossRef]
  51. Blaschke, T.; Hay, G.J.; Kelly, M.; Lang, S.; Hofmann, P.; Addink, E.; Queiroz Feitosa, R.; van der Meer, F.; van der Werff, H.; van Coillie, F.; et al. Geographic Object-Based Image Analysis—Towards a new paradigm. ISPRS J. Photogramm. Remote Sens. 2014, 87, 180–191. [Google Scholar] [CrossRef] [PubMed]
Figure 1. Geography of artisanal scale gold mining (ASGM) and annual deforestation caused by ASGM in SE Peru. The mining zone considered in this study is outlined in red, with areas of intensive mining circled in blue. Dashed line is the Interoceanic Highway, and hatched areas denote lands with national protected status. Colored areas indicate deforestation due to mining, with the year that land was first deforested displayed on a color ramp going from blue (1984–1985) to red (2016–2017). Basemap imagery from ESRI.
Remotesensing 10 01903 g001
Figure 2. Workflow for fusion of CLASlite/GFC data and classification of ASGM. Cells highlighted in blue represent methodological advances.
Remotesensing 10 01903 g002
Figure 3. Operations and impacts (rows) according to the type of gold mining in Madre de Dios. Operations can be classified broadly by whether sediment is moved by excavation using heavy machinery (left) or through liquefaction with water cannons and suction pumping (right). Impacts on landscape from the two types of ASGM-caused land conversion are distinct and are shown in the bottom row. Aerial imagery taken by unmanned aircraft on 8 October 2017 and 6 October 2017 for excavation and suction mining, respectively.
Remotesensing 10 01903 g003
Figure 4. Distribution of deforestation caused by different types of gold mining operations in the Southeastern Peruvian Amazon. Highly mechanized mining (red) uses excavators, front loaders, and trucks to move sediments for processing. Minimally mechanized (yellow) uses water cannons and suction pumps; see Figure 3 for visual depictions of types.
Remotesensing 10 01903 g004
Figure 5. Annual rate of deforestation over 34 years due to ASGM in the Southeastern Peruvian Amazon. Particularly notable is the sharp increase in mining in 2010, which correlates well with gold price, followed by consistently high levels of mining in the years since, even while gold prices fluctuate. Shading refers to stage of infrastructure construction: Pre-Interoceanic Highway (PIOH), Construction phase of the interoceanic highway (CIOH), and operational phase (IOH). The white horizontal line from 2011 through the present indicates the phase of interdictions against illegal mining by the Peruvian National Police and military.
Remotesensing 10 01903 g005
Figure 6. Annual deforestation in relation to socioeconomic predictors. Shading refers to stage of infrastructure construction: Pre-Interoceanic Highway (PIOH), Construction phase of the interoceanic highway (CIOH), and operational phase (IOH). White line and arrows indicate phase of interdictions against illegal mining by the Peruvian National Police and military. (A) Area deforested by mining type, either excavation (dark blue) or suction (orange). (B) Geography of deforestation and whether mining was contained in one of the three major mining districts or spread through small mines across the landscape.
Remotesensing 10 01903 g006
Figure 7. Deforestation due to mining compared to all other sources from 2001 through 2017. (A) Annual deforestation in hectares. (B) Deforestation by type as a percent of all deforestation with colors as in (A).
Remotesensing 10 01903 g007

