Article

Fast and Accurate Plane Segmentation of Airborne LiDAR Point Cloud Using Cross-Line Elements

1
School of Remote Sensing and Information Engineering, 129 Luoyu Road, Wuhan University, Wuhan 430079, China
2
Collaborative Innovation Center of Geospatial Technology, Wuhan University, Wuhan 430079, China
*
Author to whom correspondence should be addressed.
Remote Sens. 2016, 8(5), 383; https://doi.org/10.3390/rs8050383
Submission received: 25 February 2016 / Revised: 10 April 2016 / Accepted: 27 April 2016 / Published: 5 May 2016
(This article belongs to the Special Issue Airborne Laser Scanning)

Abstract

:
Plane segmentation is an important step in feature extraction and 3D modeling from light detection and ranging (LiDAR) point cloud. The accuracy and speed of plane segmentation are two issues difficult to balance, particularly when dealing with a massive point cloud with millions of points. A fast and easy-to-implement algorithm of plane segmentation based on cross-line element growth (CLEG) is proposed in this study. The point cloud is converted into grid data. The points are segmented into line segments with the Douglas-Peucker algorithm. Each point is then assigned to a cross-line element (CLE) obtained by segmenting the points in the cross-directions. A CLE determines one plane, and this is the rationale of the algorithm. CLE growth and point growth are combined after selecting the seed CLE to obtain the segmented facets. The CLEG algorithm is validated by comparing it with popular methods, such as RANSAC, 3D Hough transformation, principal component analysis (PCA), iterative PCA, and a state-of-the-art global optimization-based algorithm. Experiments indicate that the CLEG algorithm runs much faster than the other algorithms. The method can produce accurate segmentation at a speed of 6 s per 3 million points. The proposed method also exhibits good accuracy.

Graphical Abstract

1. Introduction

To segment a light detection and ranging (LiDAR) point cloud is to partition the points into different groups with homogeneous properties, such as height, density, and normality. Using plane segmentation to extract facets from a point cloud is important in object classification, building extraction, and roof reconstruction. The main methods of plane segmentation are generally categorized as edge detection, profile line analysis, point clustering, model fitting, region growth and optimization.
Edge detection methods [1,2] convert a point cloud into a digital surface model (DSM). Edge detection of the raster DSM is then implemented for segmentation, the quality of which depends on the edge detection operator.
Methods based on profile line analysis employ scan line analysis to identify planes [3]. Proper selection of the scan line direction is essential in these methods [4]. The profiles in one or more directions are utilized to segment the data in order to detect man-made structures (i.e., bridges and buildings) from the LiDAR point cloud [5,6,7]. These methods are usually effective and fast. However, using profile information for accurate plane segmentation remains insufficiently explored. The algorithm design, quality and performance assessment compared with existing methods need to be comprehensively investigated.
Methods based on point clustering, including octree-based clustering [8,9], K-means clustering [10,11,12], fuzzy clustering [13,14] and mean shift [15,16,17], cluster the point cloud into point groups by using similarity measurements, such as distance between points and point density. These methods can produce stable results but may lead to over-segmentation or under-segmentation because of the improper clustering algorithm setup (e.g., parameters of the kernel width and the minimum point number of a valid region in mean shift segmentation) [18].
Methods based on model fitting attempt to solve the plane equation by fitting local points with the presupposed model. Random sample consensus (RANSAC) [19], Hough transform [20], and tensor voting [21] are popular algorithms in this category. RANSAC can outperform methods based on normal vector consistency and outline segmentation [22]. Normal driven RANSAC is an accelerated version of the original RANSAC [23]. The limitation of RANSAC is that the neighborhood of points located on the same plane is not fully considered. The algorithm selects planes with the maximum number of support points in each iteration, which may not be correct. Several improved algorithms have been developed for these problems [24,25]. 3D Hough transform is a voting-based algorithm of plane extraction in 3D Hough space (θ, ϕ, ρ). The disadvantage of this method is that the voting operation in the 3D Hough space is usually slow; the same problem is encountered in selecting support points [26]. Many methods (e.g., random Hough transformation) have been proposed to speed up Hough transformation [27]. Tensor voting obtains 3D normal vector field based on discrete points, by which the maximum tendency is utilized to extract characteristic regions [28,29]. The drawback of the tensor voting method is the dependency on selecting the parameter of the range of influence [28].
Methods based on region growth select seed points or regions as the original patches and cluster the points subordinated to the same patch [30,31,32,33,34]. These methods can also be integrated with model fitting methods. These methods ensure that the points on the same plane are in the neighborhood; they are faster than model fitting methods when the point number is large [35]. The normal vectors of points in the region of growth can be computed through principal component analysis (PCA). The region of growth similar to the image region of growth is then utilized to extract planes [36]. An iterative PCA is developed to estimate local planarity [37]. Region growth methods usually rely on the choice of seed points. The computation of the normal vectors becomes unstable when noise points exist or the supporting points are not properly selected. In addition, these methods may lead to over-segmentation or under-segmentation in the surface intersection region and noisy areas [38].
Optimization-based methods are inspired by image segmentation that uses a graph to represent data elements (e.g., pixels or super pixels) with connected nodes. The segmentation can be modeled as an optimization problem to determine the best graph cut [39,40,41]. The frequently used graph cut algorithms are minimum spanning tree [42], normalized cut [43,44] and Graphcuts [38]. Other optimization methods, such as level set, are also utilized to segment planes [45]. A recent study has shown that using Graphcuts to optimize the initial segmentation [38] significantly improves the initial over-segmentation and eliminates the cross-planes. The limitation of this method is that the result relies on the initial segmentation, and the speed is low because of its iterative optimization operation [46].
Developing a fast, accurate, and easy-to-implement segmentation algorithm is still necessary to address the various scenarios involving massive point numbers, noisy and complex object contexts.
This paper presents a new segmentation method based on cross-line elements growth (CLEG). This method combines profile analysis, model fitting and region growth. The point cloud is converted into a grid index data structure. The Douglas-Peucker algorithm [47] is subsequently utilized in four directions to extract the cross-line elements (CLEs). CLE can determine a plane, and this is the rationale of the proposed method. The final facets can be obtained after selecting the seed CLEs and combining CLE growth and point growth. Comparison of CLEG with other popular methods, such as RANSAC [19], 3D Hough transformation [27], PCA [36], iterative PCA [37] and a state-of-the-art global optimization-based algorithm [38], shows that the proposed algorithm runs much faster than them and produces stable and accurate results. The remainder of the paper is structured as follows. Section 2 formulates the proposed segmentation method. Section 3 describes the test data and presents the experimental analysis. Section 4 provides the conclusion.

2. Plane Segmentation Using Cross-Line Elements

In general, a good plane segmentation algorithm has to address some key issues: (1) how to accurately measure local planarity with proper selection of support points for these measurements; (2) how to properly group all spatially adjacent points belonging to one facet; (3) how to efficiently deal with large-scale data. The existing methods, such as model fitting, clustering, region growth and global optimization, have more or less room to improve in these aspects, as presented in the introduction. In this study, aiming at solving these problems, a cross-line element growth (CLEG) method is proposed to segment point cloud accurately and efficiently.
The workflow of the CLEG algorithm is shown in Figure 1; the red lines in the segmentation result are the seed CLEs, and the white points are the gross noise points.
The pseudo-code is listed to describe the principle of the algorithm:
CLEG(points, label)
Grids=StoringPointsInGrid(points);
directions = horizon, vertical, upper right, lower right;
for each direction
    LineSegmentation=DouglasPeucker(Grids);
end for
for each grid
  if CLE crossing the grid is stable
   Add grid to seeds;
  end if
end for
Sort(seeds);
for each seed
  if not labeled
   GetPlanFunction(CLE);
   CLEbasedgrowth(label);
   Pointbasedgrowth(label);
  end if
end for
End
A CLE is defined as two cross-lines at a cross-point in two directions. In one direction, the cross-line is determined by two planes, i.e., the candidate plane and one special plane (e.g., ZOY plane, plane 1, plane 2, and ZOX plane in Figure 1). The directions of the cross-lines are relative to the equation of the candidate plane. The cross-line is determined by the candidate plane and ZOY plane, for example; Equation (1) is the function of the candidate plane, and Equation (2) is the function of ZOY plane.
a x + b y + c z + d = 0
y = e
The direction vector of the cross-line is then (c, 0, −a). Similarly, the direction vector of the cross-line determined by the candidate plane and the plane 1 is (−c, c, ba); the direction vector of the cross-line determined by the candidate plane and the plane 2 is (c, c, −ab); and the direction vector of the cross-line determined by the candidate plane and ZOX plane is (0, c, −b). Therefore, a CLE can determine the plane model.
In 3D space, two intersected straight lines passing the cross-point determine the plane model. In other words, a point and the normal vector formed by the intersected lines are the basic elements in plane detection, which is the rationale of CLEG-based plane segmentation. The CLEG algorithm has the following advantages: (1) the CLEs can be easily and quickly extracted in the profile space; (2) a CLE contains rich information, such as rough plane model and facet size; which can further help in finding better seeds and measurements for the growth of CLEs and points; (3) pre-segmenting the point cloud into CLEs eliminates the problem of selecting support points in clustering and model fitting methods [25], which leads to a more accurate and stable segmentation; and (4) the CLE extraction and growth operation are efficient in terms of computational cost, thereby making it suitable for use when dealing with a massive number of points.

2.1. Line Segmentation

The seed CLE is derived by first converting the point cloud into a grid index data structure based on ground sample distance (GSD), which can be obtained from the average point density. The grid index data structure is utilized to improve the efficiency of data inquiry. More than one point may exist in each grid. Some grids may also be null, as shown in Figure 1 (i.e., 2D Grid Index).
An extended line segmentation of scanning line segmentation [7] is employed to segment the profiles in four directions (i.e., vertical, horizontal, upper right, and lower right). The angle between the split line segment and the horizon direction is calculated by using the Douglas-Peucker algorithm (Figure 1) [47]. The tolerance is ε. The difference between the original Douglas-Peucker algorithm and the proposed method is that the angles between the line segments and the horizontal plane are calculated simultaneously (denoted by α in Figure 1). The angles are important in the subsequent steps in seed selection and growth. The length and angle of each grid in each direction is then obtained, as shown in Figure 2. The black points are the uncolored points because more than one point may exist in one grid, and only the highest point is colored. Each grid is crossed by line segments and defined as a cross-point after using the Douglas-Peucker algorithm in four directions.
The length of a line segment becomes relevant to the surface roughness of the region after line segmentation. The lines are much longer on large planes (e.g., ground and roof) and shorter in regions with a significant height difference (e.g., tree area). A valid CLE is defined as the cross-line whose length is longer than threshold l at a cross-point in two directions. All the lines crossing the cross-point may be longer than the threshold. The two longer lines indicate the principal directions. The facets are obtained by using the CLEs to select the seed and region growth.

2.2. Selection of Seed CLEs for Growth

A coarse-to-fine strategy is employed to extract prior large planes and guarantee the segmentation quality and stability. The seed CLE is selected based on estimations of the plane property. The seed CLE should satisfy the following conditions.
  • Each line of the seed CLE is longer than the minimum length threshold l.
  • The cross-point of the seed CLE should not be the end points of the line segments to ensure the stability of the seed CLE. A false seed CLE is shown in Figure 1. The red cross denotes the false selection of the seed cross-line element.
  • The variance between the angle (i.e., α in Figure 1) of the cross-point and those of the neighbor points should be small. Figure 3 shows red lines, which denote the seed CLE and the red point, which represents the cross-point. The ZOY plane is the segmentation direction and nb1 nb2 … nb8 are the neighbors of the cross-point. The α0, α1α9 variance should be smaller than the threshold and should extend to the four directions to ensure the stability of the seed CLE. Several false seed CLEs could be found in the tree areas if the condition is not applied. The variance in the rough areas can be large because the angles can vary significantly even if the lines of CLE are longer than l.
The cross-points that meet the aforementioned conditions are sorted by using the length of the CLE. The seed cross-points of the CLE are then processed in order.
The points on the CLE may not be on the same plane when the seed CLE is selected. Figure 4 shows the CLE, which is represented by red lines. The CLE should be checked as valid.
The characteristic of the line intersect with the plane indicates that the angles between the parallel lines and the plane are equal. Accordingly, α1, α2, α3, β1, β2, β3 represent the angles of the line segments (Figure 5). The condition that α1 = α2 = α3 and β1 = β2 = β3 should be satisfied when the plane is perfect. The valid seed CLE should also satisfy the condition that the difference between the angles of the point on CLE and that of the cross-point is sufficiently small. A threshold of Δα is utilized in this study. Figure 4 shows that the points on the blue plane do not satisfy the condition. Δα can be obtained adaptively.
Δ α = arctan ( d l )
In Equation (3), d is the threshold of point to plane distance. l is the minimum line length threshold.
The region growth is the employed to obtain the points of the entire plane after the seed CLEs are extracted.

2.3. Region Growth

Region growth includes CLE growth and point element growth. Using CLE growth can improve the stability of region growth and accelerate the process.
The disadvantage of the conventional region growth method is the process of obtaining seed points and the reliable similarity measurement of region growth. Researches sometimes use the minimum number of points as the indicator of a valid plane. However, this method may not be stable because of the complex point distribution at tree and noisy areas.
Similar to PCA, the angle limitation is added in the region growth. Subsequently, the angles are more stable than those in the PCA because calculating the angles does not depend on the neighboring relationship. The angles can also be correctly calculated at the edge of the plane, as shown in Figure 1 (i.e., Douglas-Peucker). The angle limitation is that the angles on the horizontal plane of the two principal directions of each candidate point are nearly equal to those of the seed cross-point. The red point in Figure 6 denotes the cross-point. α0 and β0 are the angles of CLE in the two principal directions. The angles of the lines crossing the candidate point in the two principal directions should be nearly equal to the cross-point seed when dealing with region growth.
Combining CLE growth and point growth can ensure the stability of the region growth. The sequence of adding points in the model fitting procedure influences the results of the region growth. The points on CLE are more stable and have more information than those on the short lines. Therefore, the points on CLE are processed first to ensure the stability of the region growth. The next seed is then processed if no line is added in the CLE growth. The valid seed CLEs are used to calculate the plane function after the stable CLE is obtained.

2.3.1. CLE Growth

After obtaining the seed CLEs, CLE growth is utilized to calculate the principal direction lines which are not the cross-lines of the seed CLE at each seed point and to check whether the candidate CLE is on the plane. This seed CLE is omitted if no CLE is added because the seed CLE is unstable. In Figure 7, the red lines are the seed CLE. The blue and yellow lines are to be grown in step one of CLE growth. The blue lines on the plane are to be added. The yellow lines are not on the plane. A more stable plane function is obtained thereafter.
All the directions of CLE growth are subsequently employed. The CLE growth principle is similar to that of point growth. The only difference is that the elements are crossing lines. Only the end points of the crossing lines are used in the measurement procedure to analyze whether the crossing lines are on the plane or not.

2.3.2. Point Growth

After CLE growth, some points may be ignored because of noises. The distance of the point to the plane is measured in processing of the point growth. The angles of the lines crossing the candidate points on the two principal directions should be nearly equal to those of the seed cross-point. As shown in Figure 6, α0 and β0 of the candidate points should be nearly equal to those of the seed cross-point; otherwise, the length of the line segment is small.

3. Experimental Analysis

3.1. Test Data

The LiDAR point clouds of three different regions are utilized to validate the proposed method. The regions are the Vaihingen area in Germany [48], Wuhan and Guangzhou in China. The description of the datasets is listed in Table 1.
The comparison test consists of roof and area segmentation.

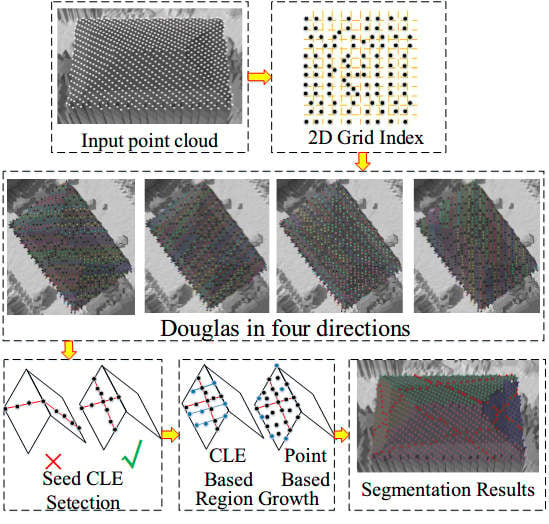
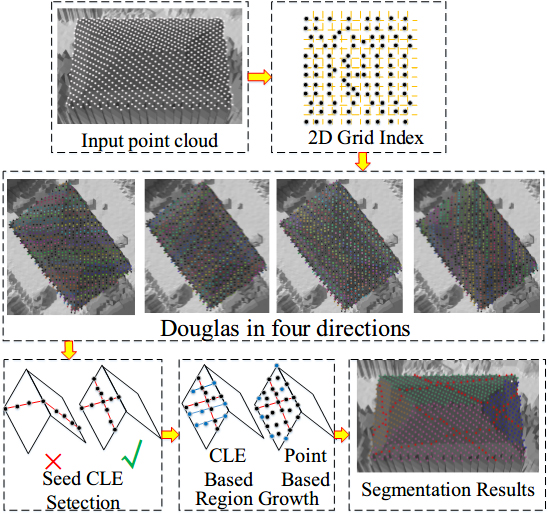
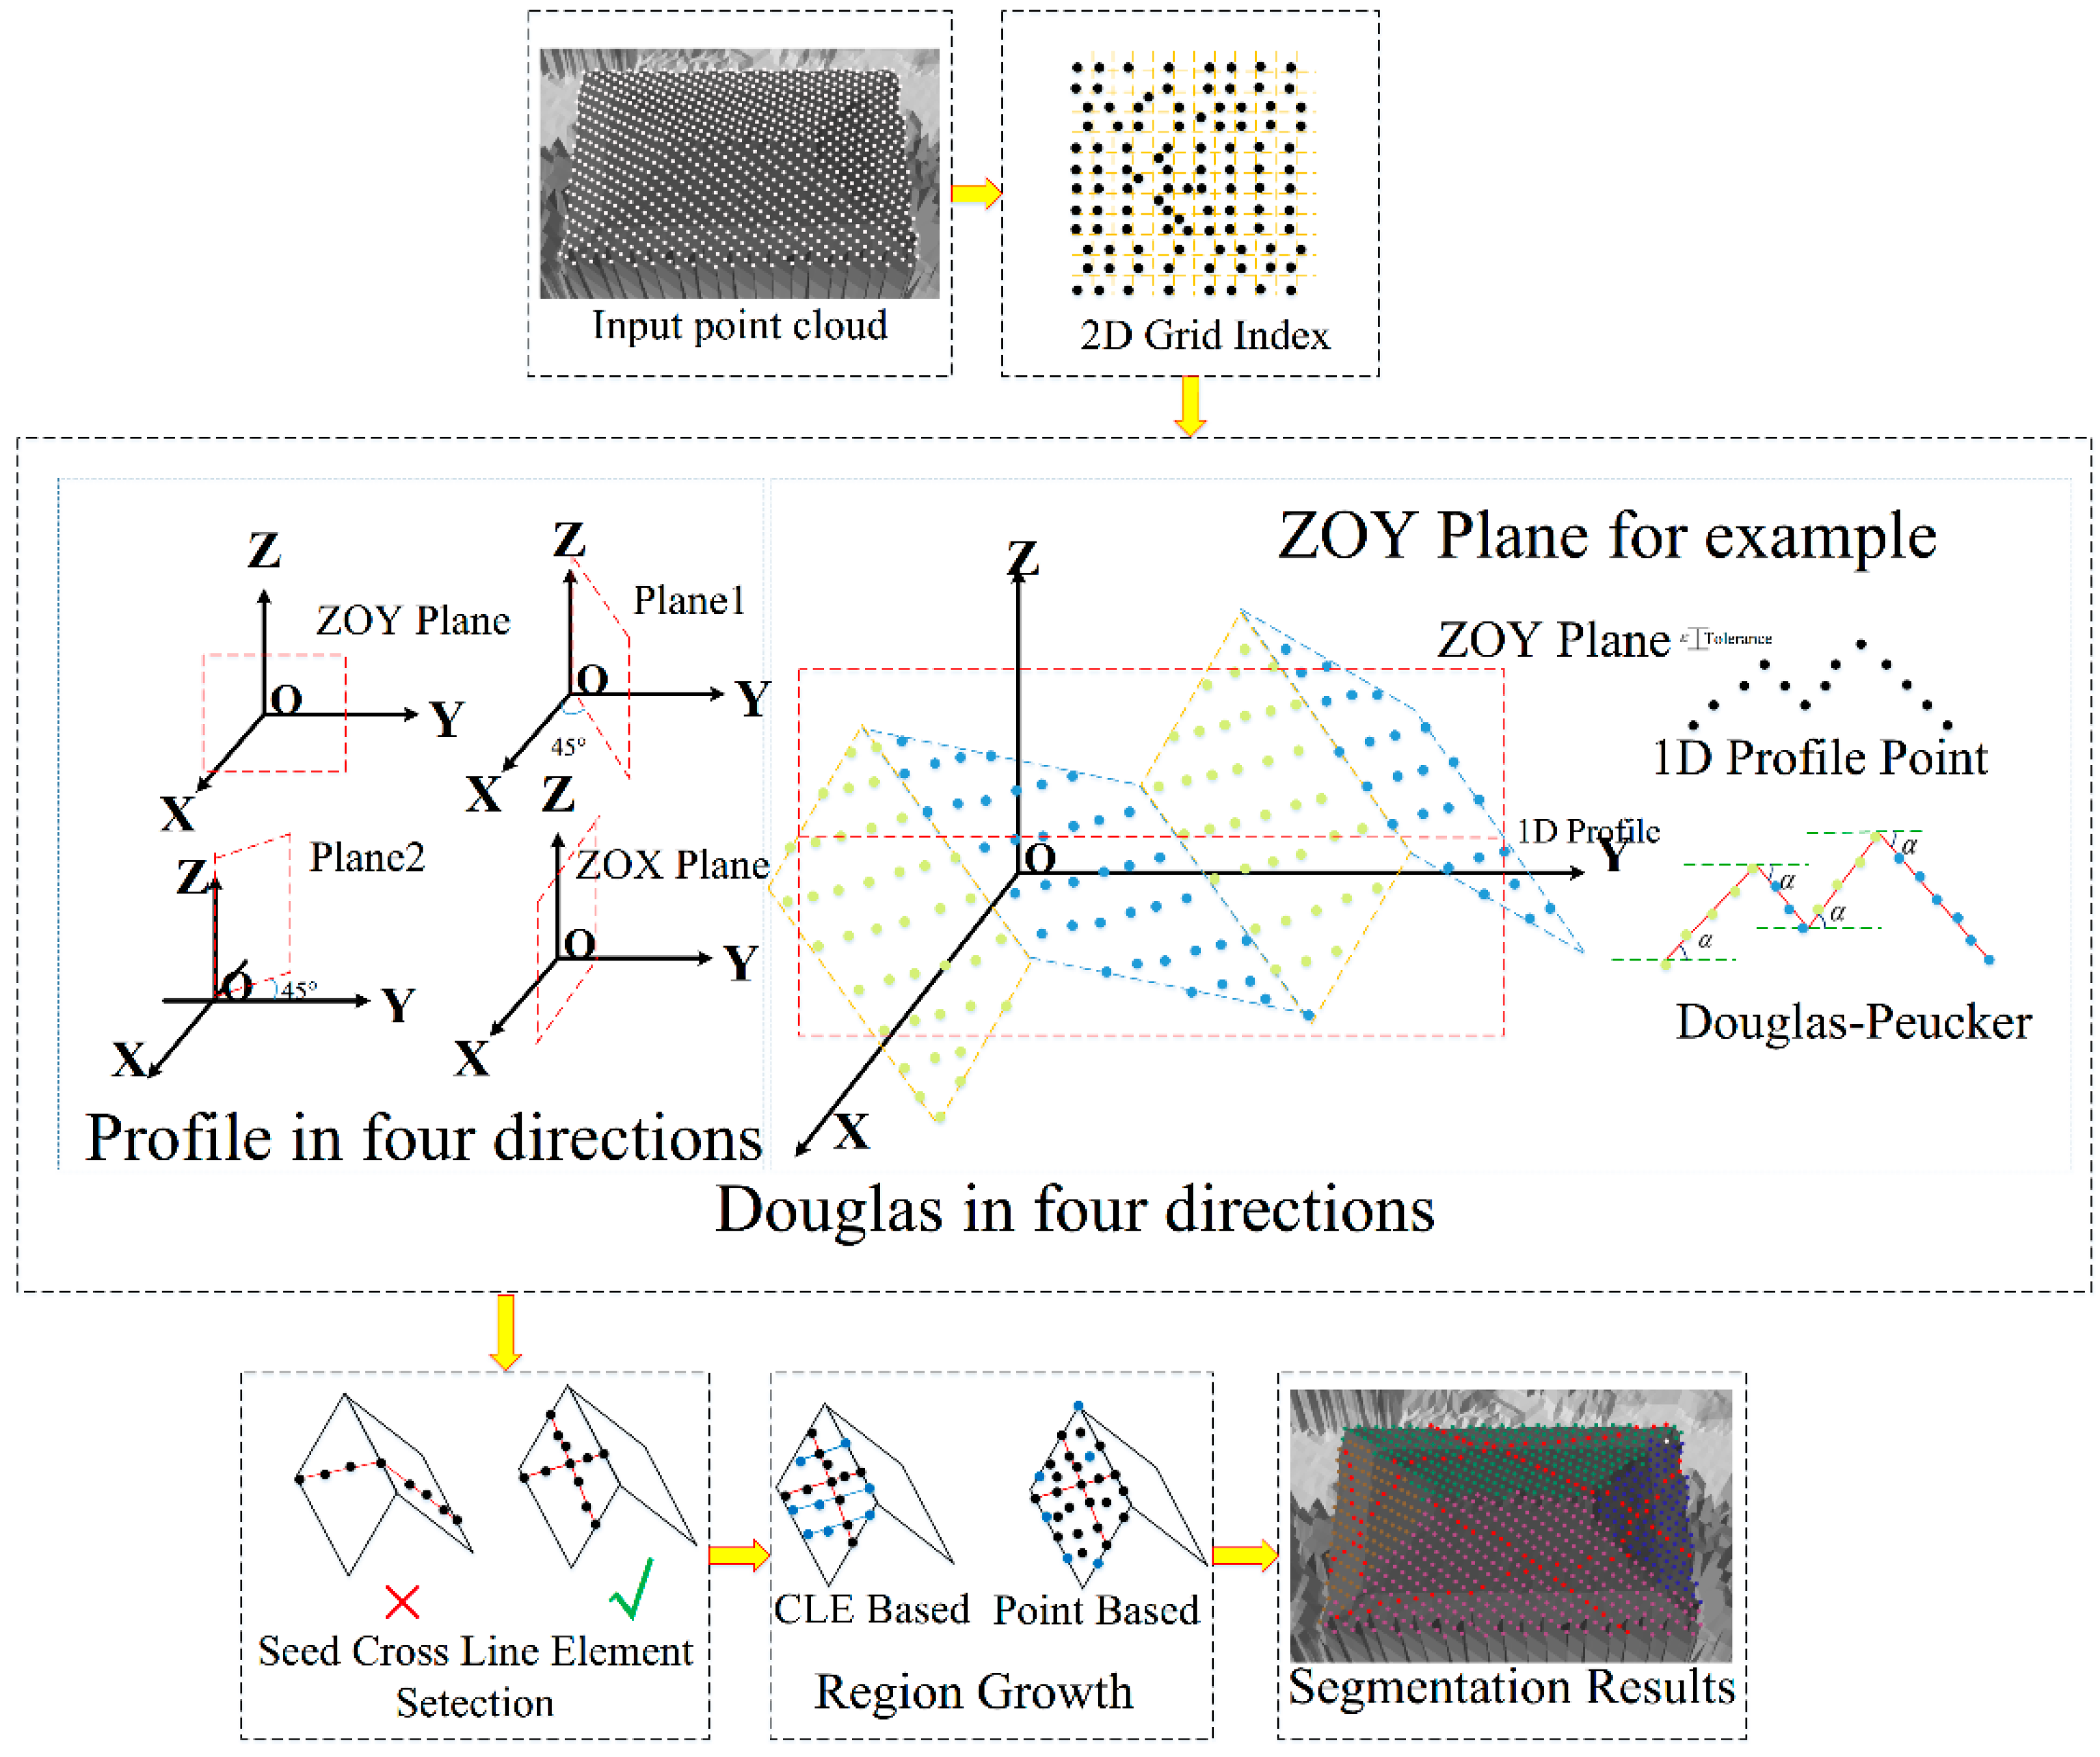
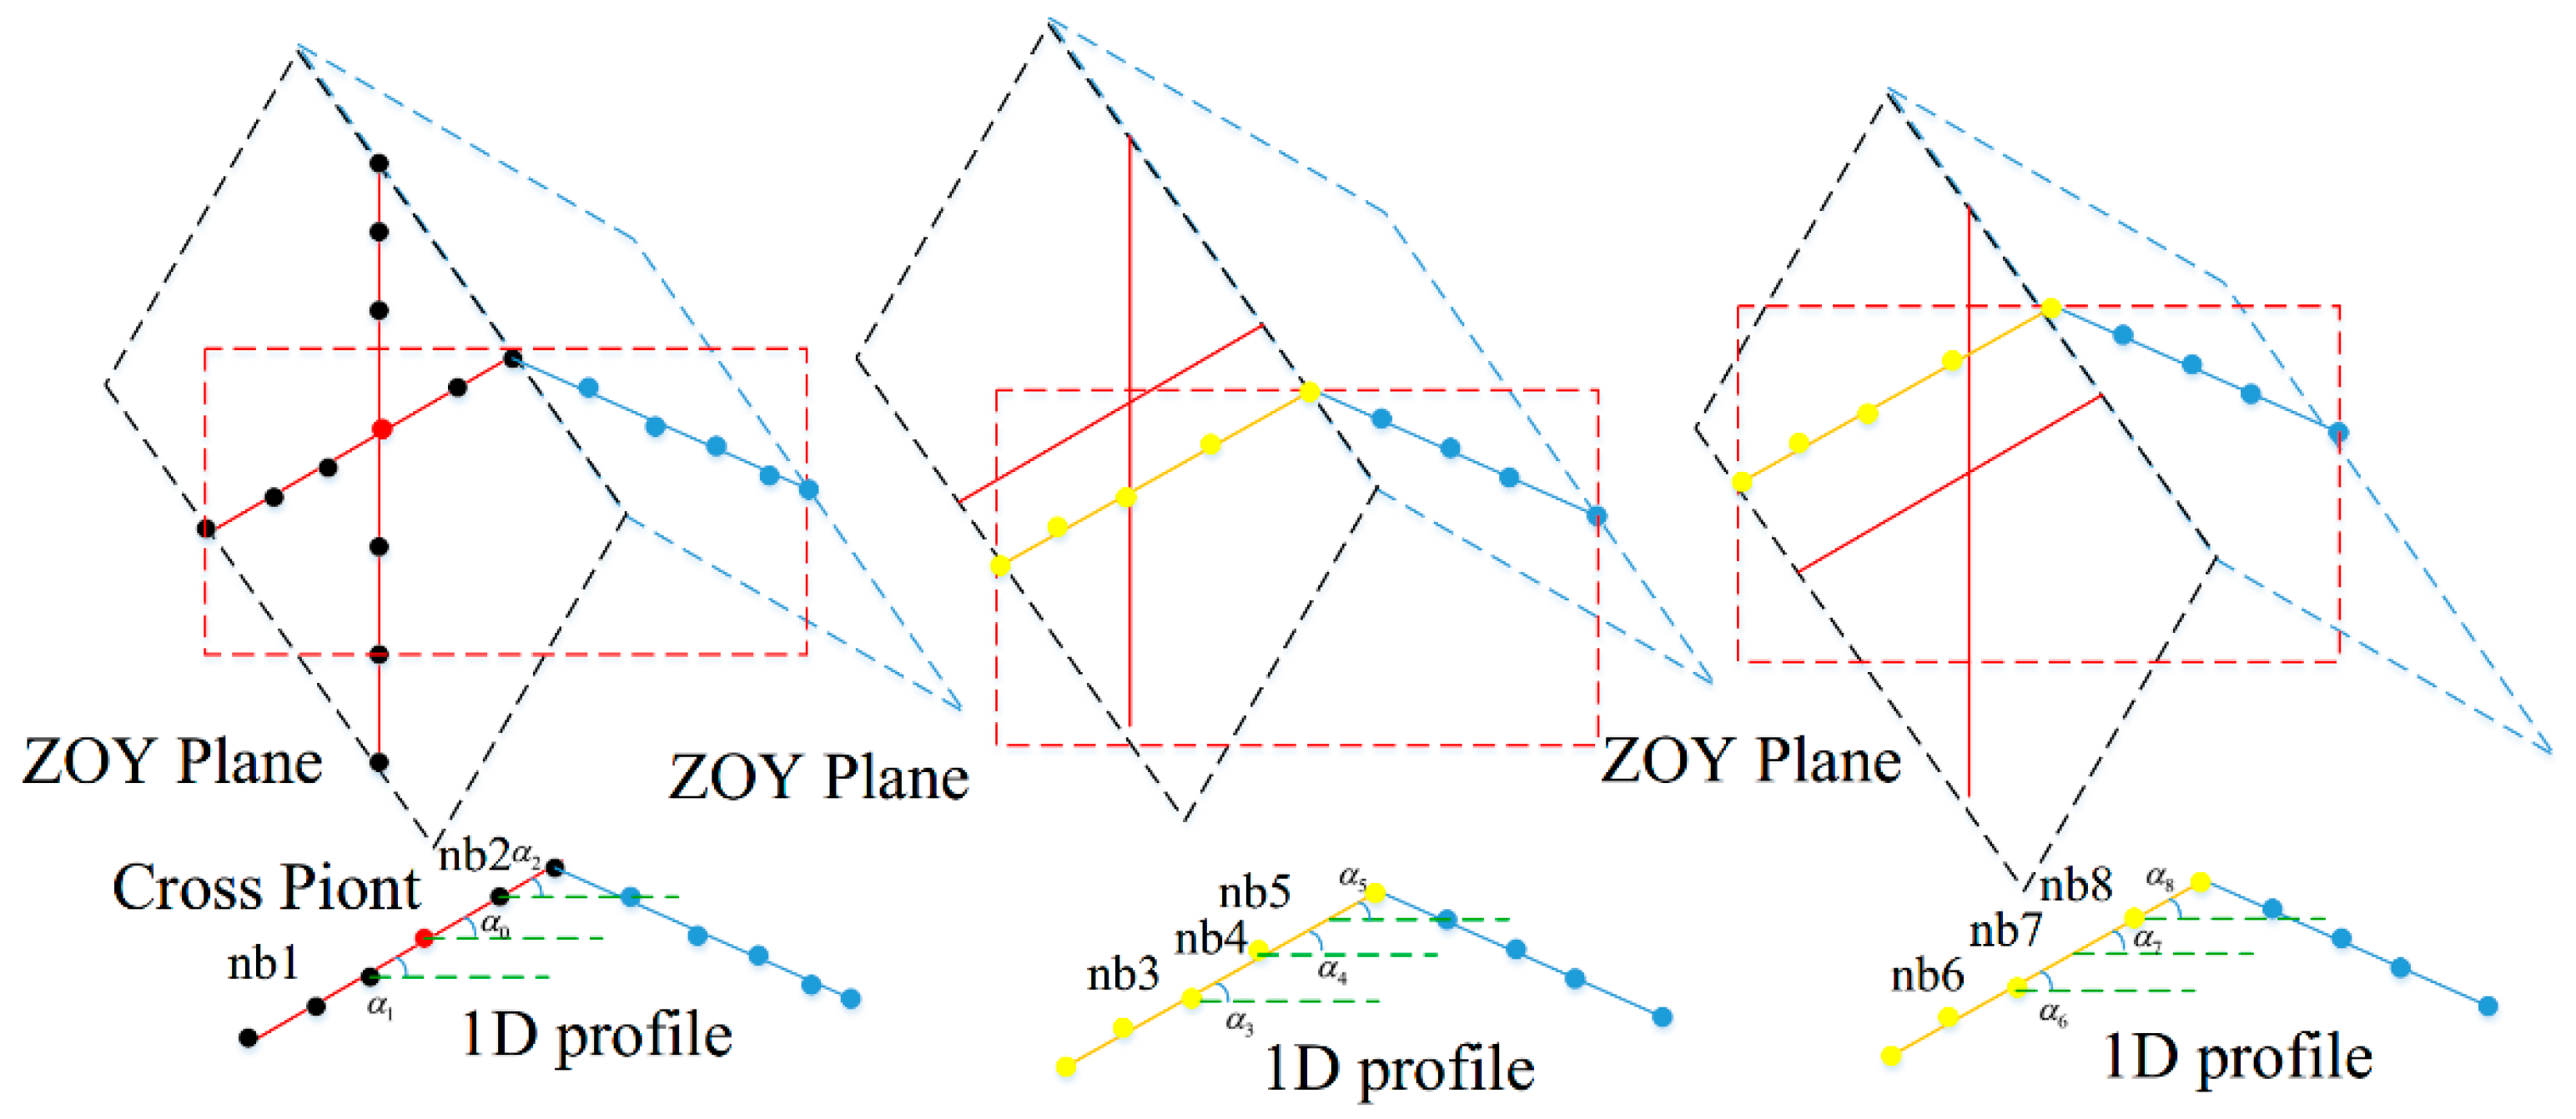
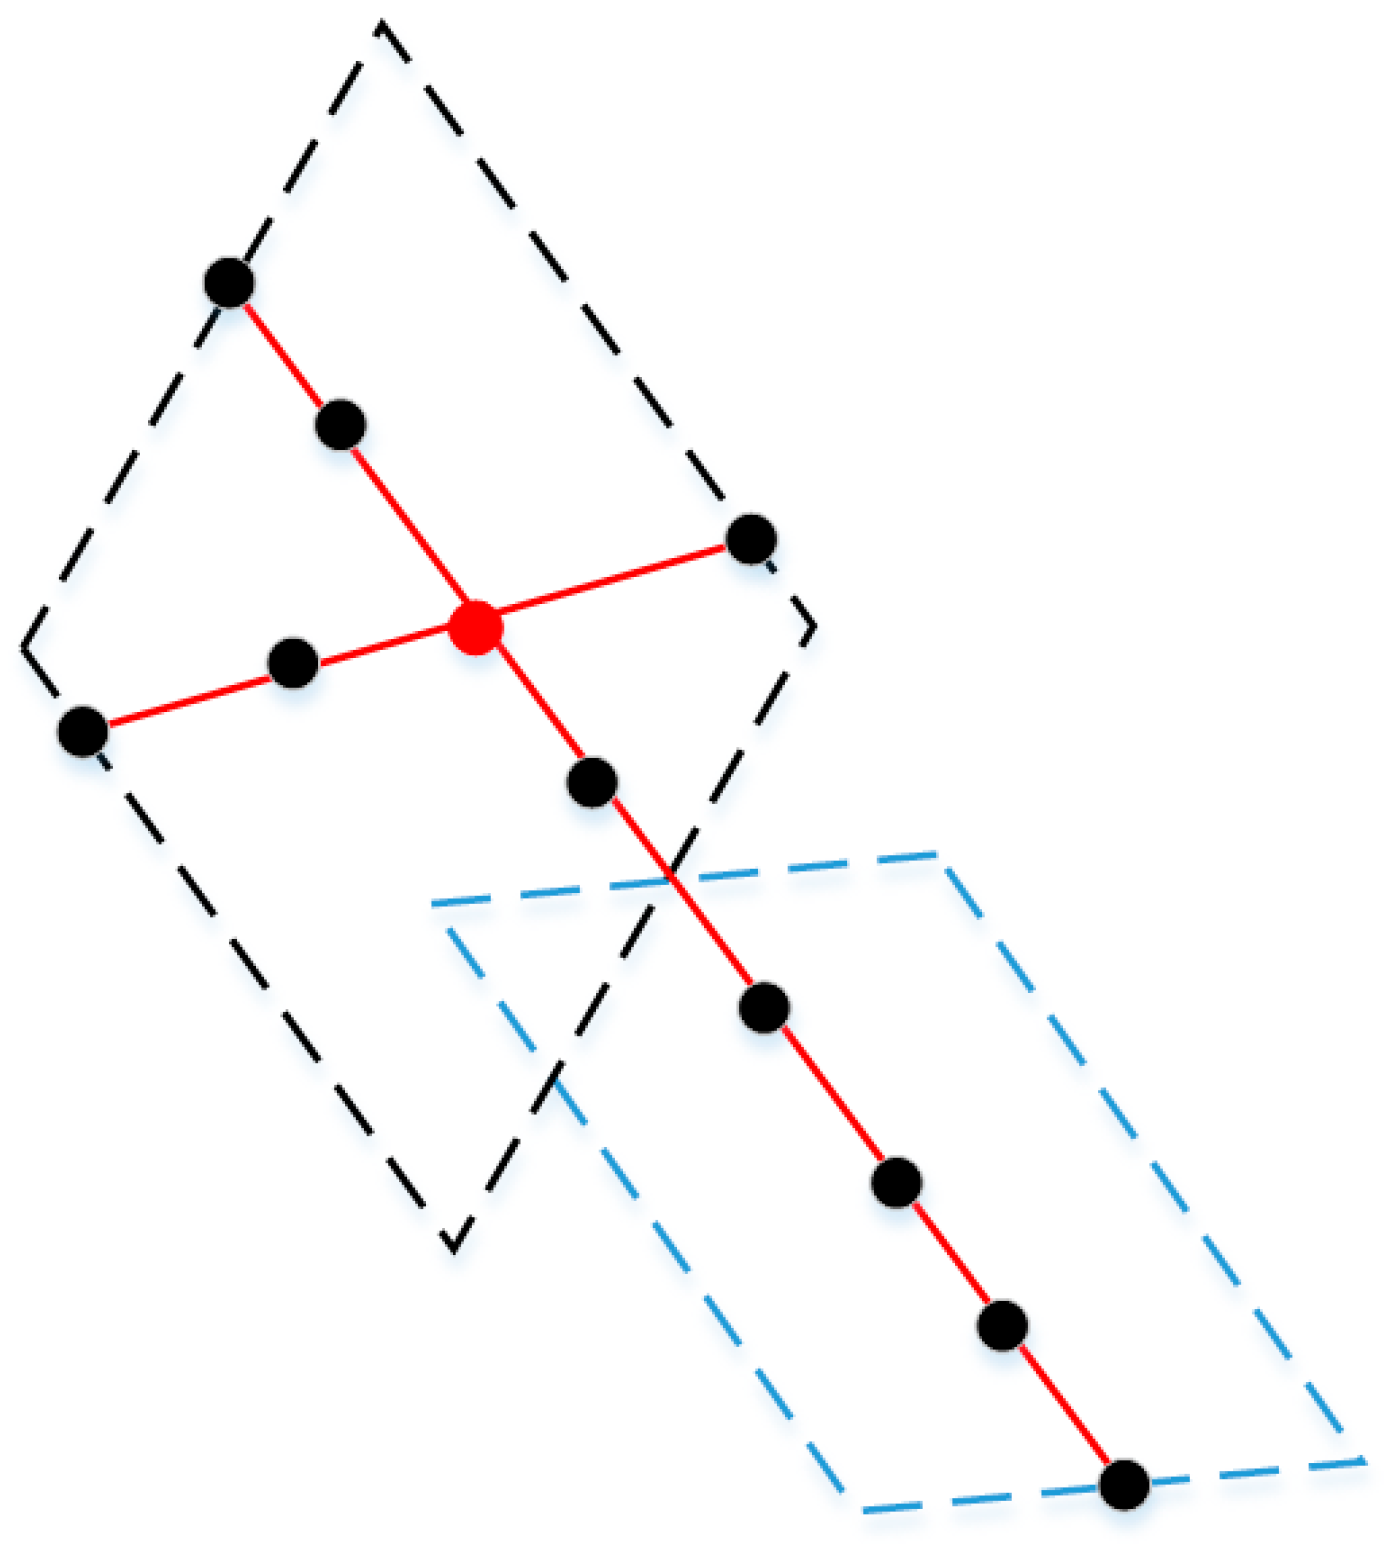
3.2. Roof Segmentation

Several of the typical segmentation methods for roof segmentation used in the comparison test are RANSAC [19], 3D Hough transformation [27], PCA + region growth (RG_PCA) [36], iterative PCA + region growth (RG_IPCA) [37], and the global optimization-based algorithm Graphcuts (Global energy) [38]. The algorithms are all implemented with Microsoft Visual C++ under the Microsoft Windows 7 operating system. A personal computer with Intel Core i5, 2.5 GHz CPU, 4GB memory is used for the testing. The ground truth of roof segmentation for quality evaluation is obtained through manual editing.
The seven metrics utilized to evaluate CLEG and the compared algorithms are computation time (time), completeness (comp), correctness (corr) [49], reference cross-lap (RCL), detection cross-lap (DCL) [50,51], boundary precision (BP), and boundary recall (BR) [52].
Completeness is defined as the percentage of reference planes that are correctly segmented. This metric is related to the number of misdetected planes.
c o m p = T P T P + F N
Correctness denotes the percentage of correctly segmented planes in the segmentation results. It indicates the stability of the methods.
c o r r = T P T P + F P
TP in Equations (4) and (5) denotes the number of planes found in both the reference and segmentation results. Only the planes with a minimum overlap of 50% with the reference are true positives. FN denotes the number of reference planes not found in the segmentation results (i.e., false negatives). FP is the number of detected planes not found in the reference (i.e., false positives).
Reference cross-lap rate is defined as the percentage of reference planes that overlap multiple detected planes. This metric shows the over-segmentation of the methods.
R C L = N r N r
Nr in Equation (6), denotes the number of reference planes, and N r is the number of reference roof planes that overlap more than one detected plane.
Detection cross-lap rate denotes the percentage of detected planes that overlap multiple reference roof planes. This metric shows the under-segmentation of the methods.
D C L = N d N d
Nd in Equation (7) denotes the number of detected planes, and N d is the number of detected planes that overlap more than one reference roof plane.
Boundary precision measures the percentage of correct boundary points in the detected boundary points.
B P = | B d B r B d |
Boundary recall measures the percentage of correct boundary points in the reference boundary points.
B P = | B d B r B r |
Br in Equations (8) and (9) denotes the boundary point set in reference, Bd denotes the boundary point set in the segmentation results, and ││ denotes the number of points in a dataset. Over-segmentation may result in a high boundary recall ratio, whereas under-segmentation may lead to high boundary precision. Only when boundary precision and boundary recall are both high can the precision of the method be determined.
The same parameters are utilized in the comparison test to ensure the comparability of the results as shown in Table 2.
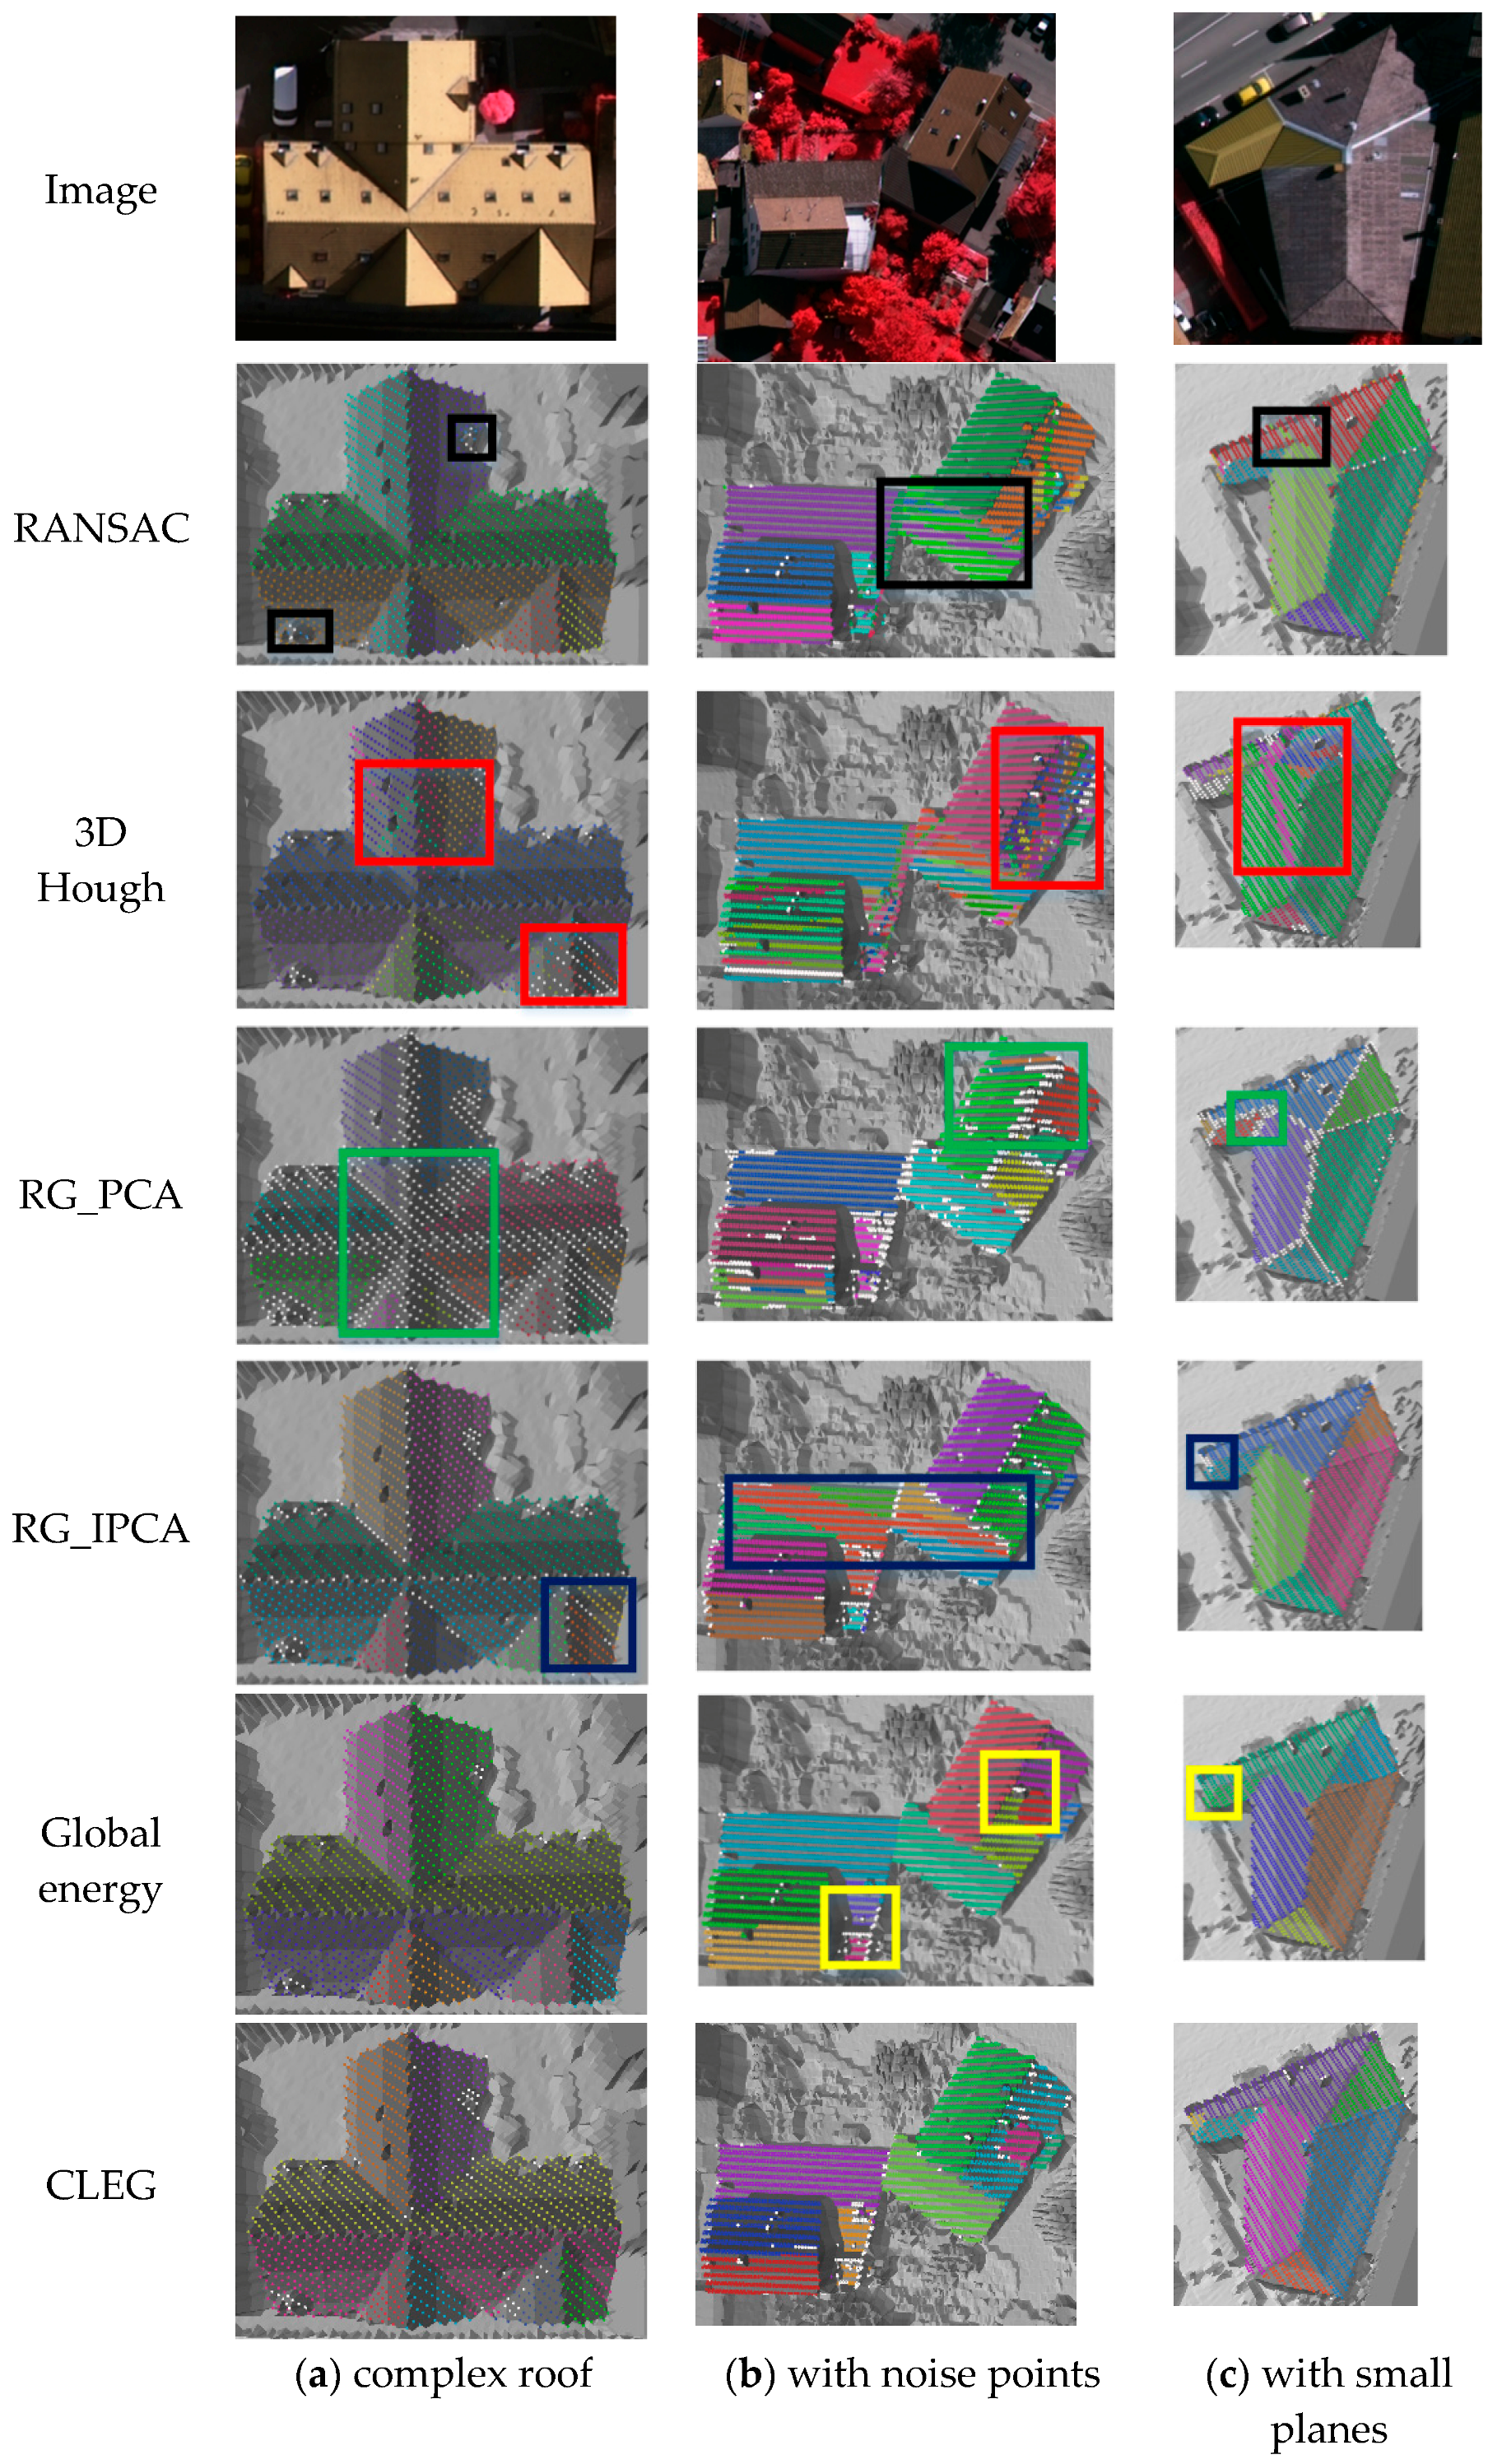
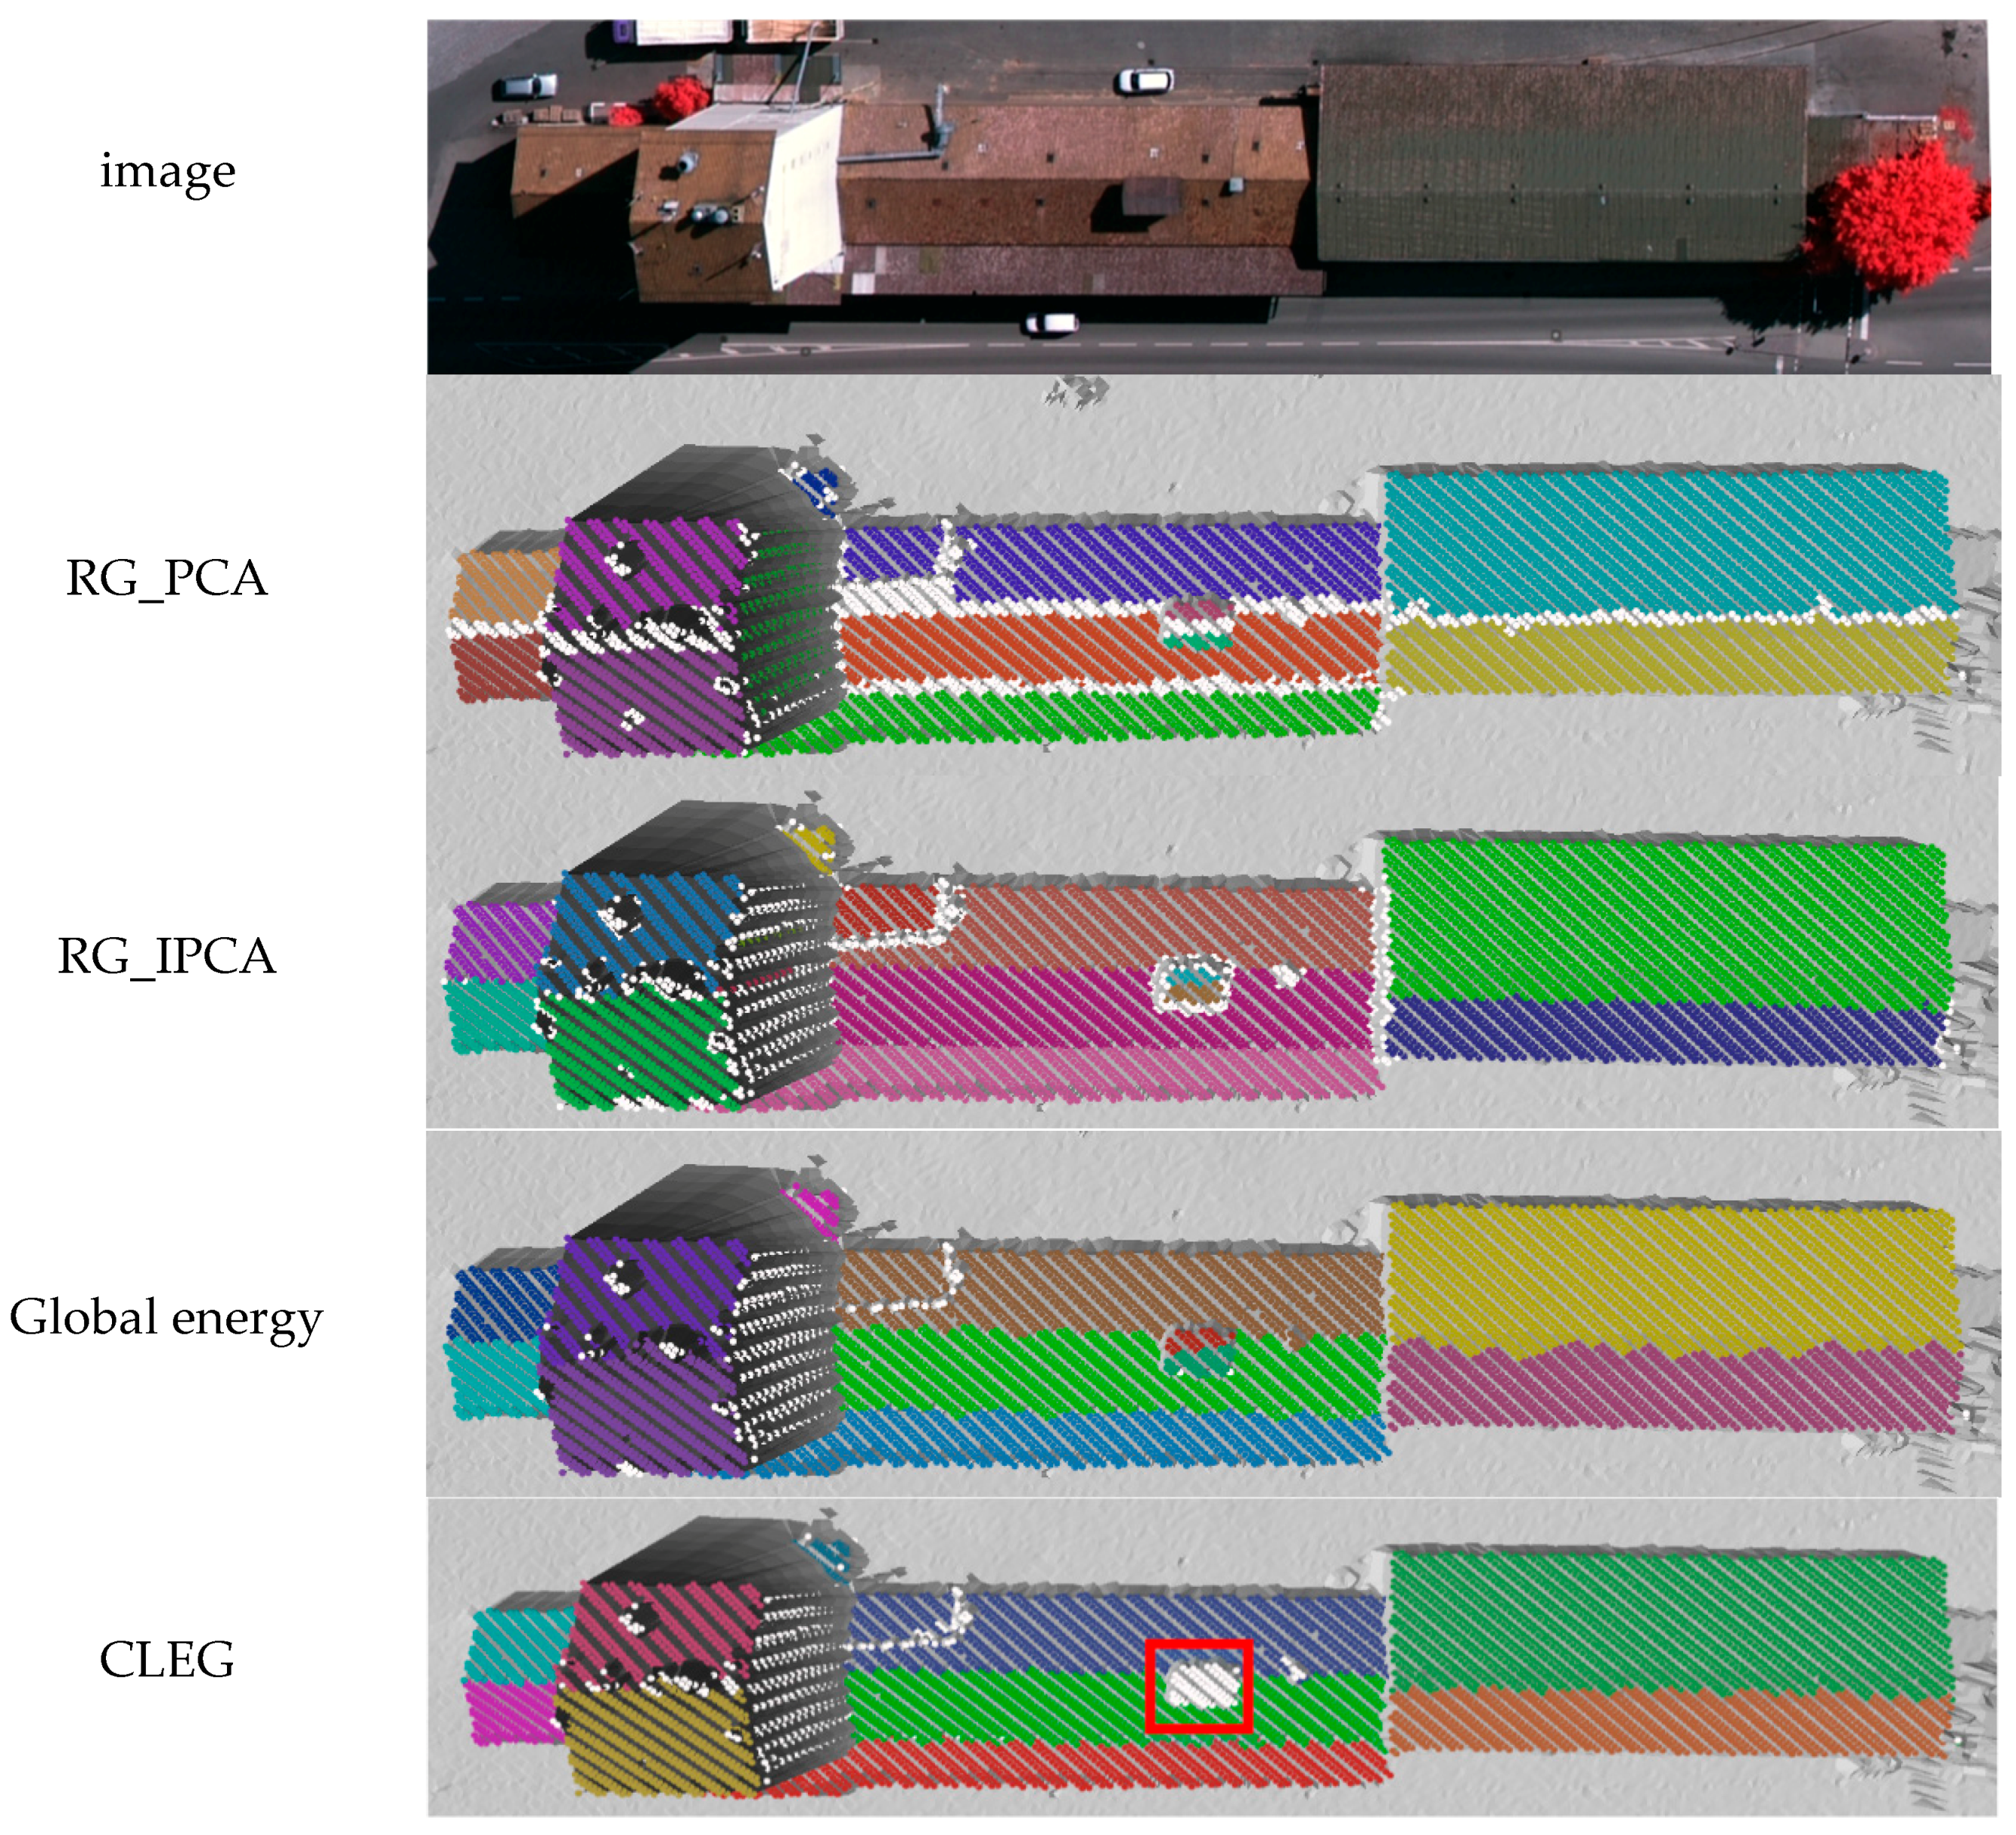
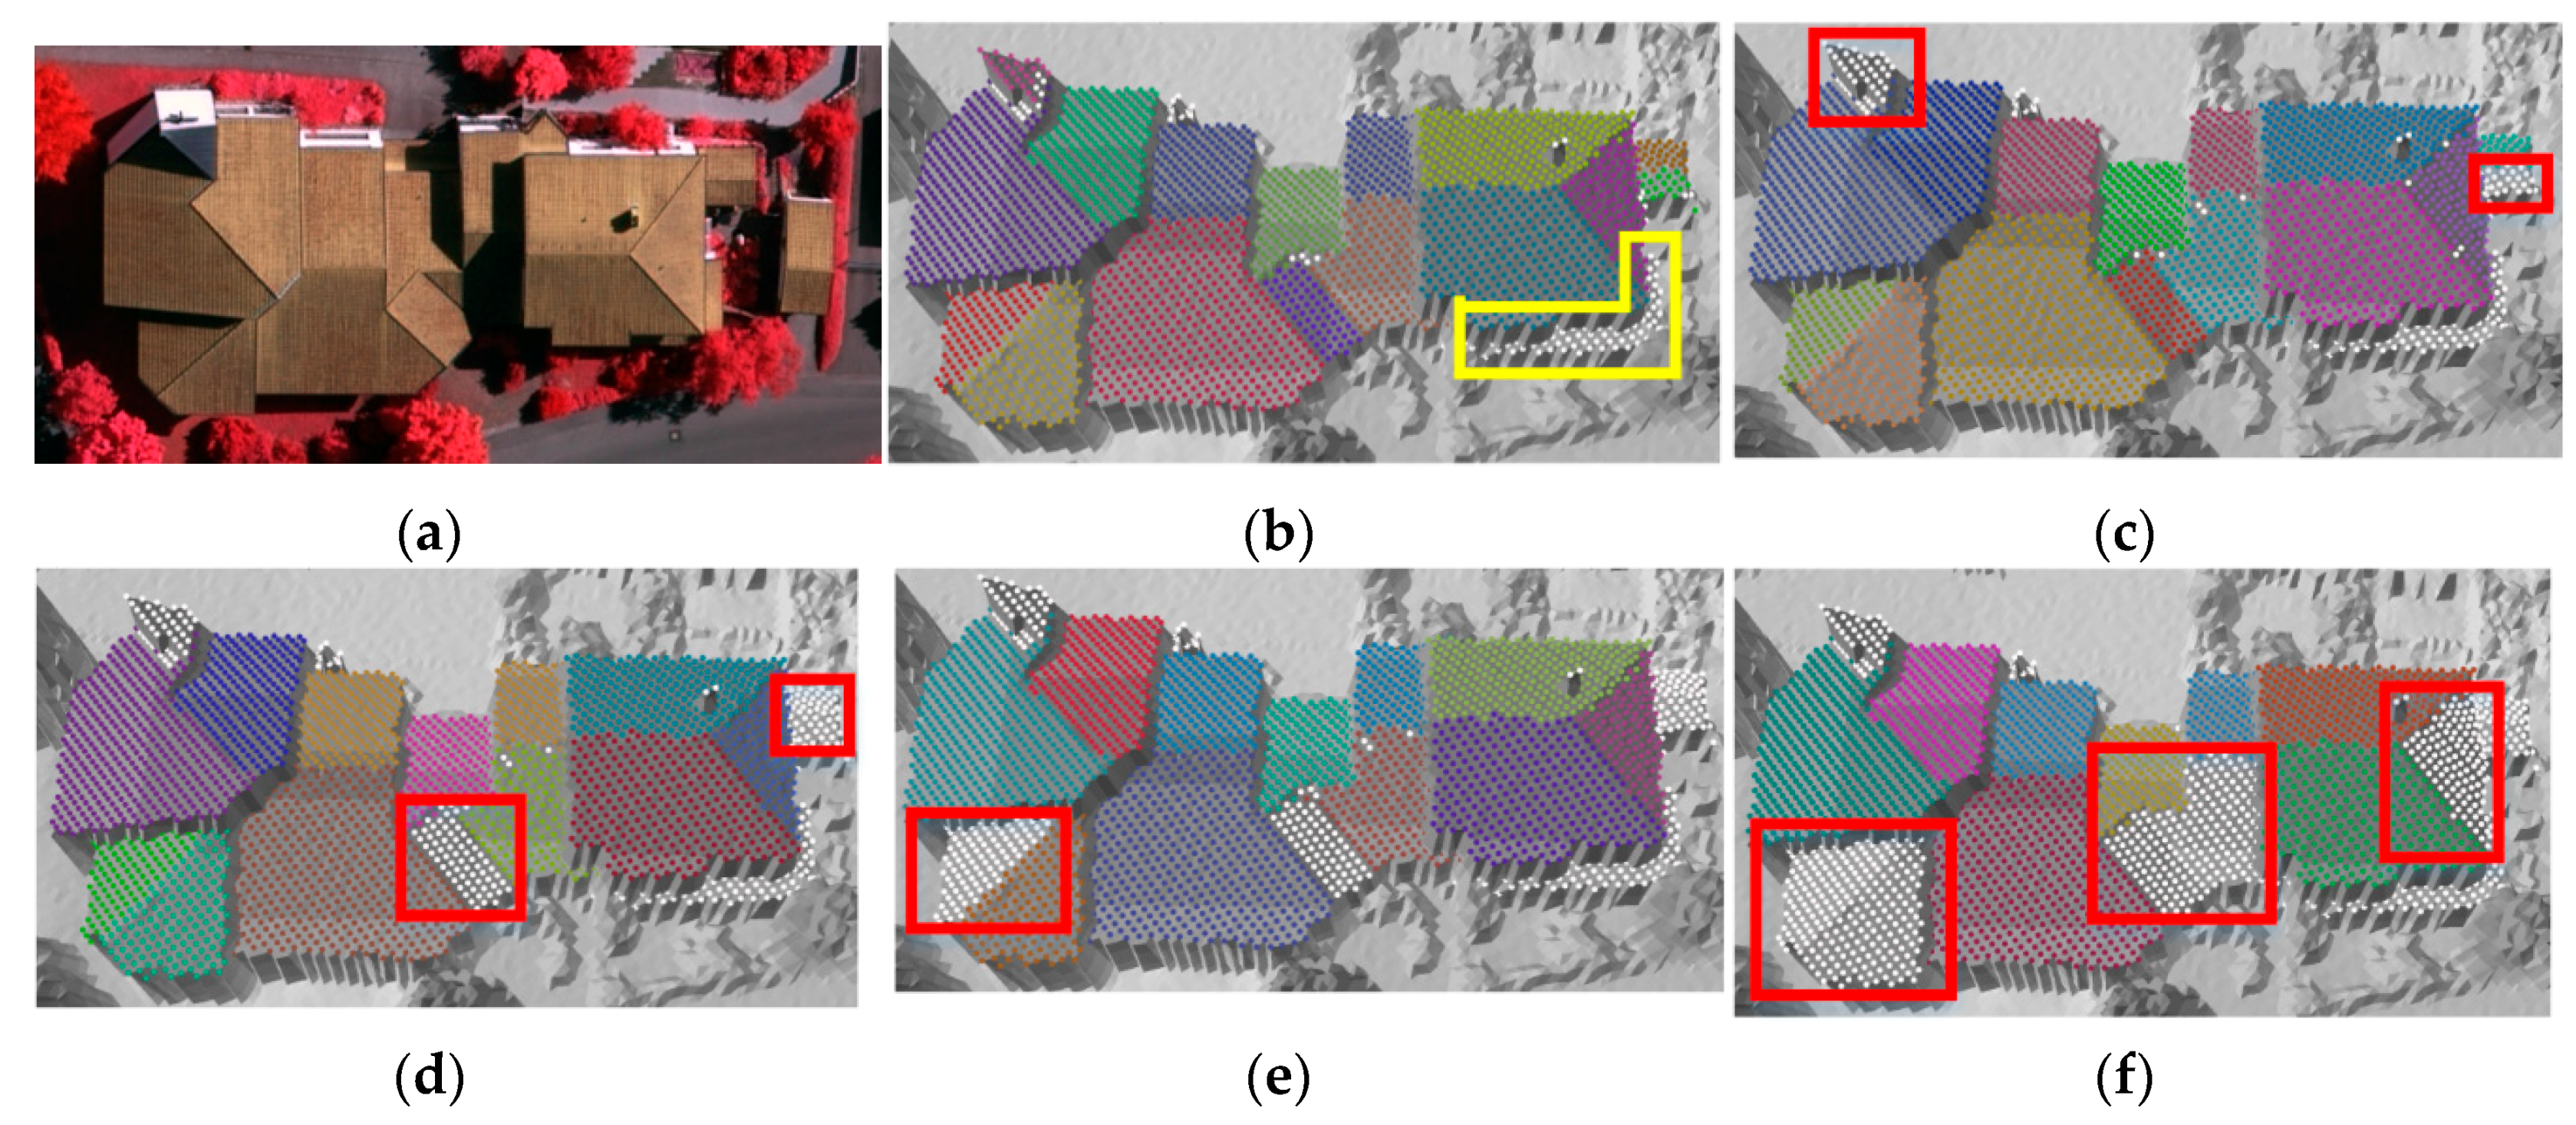
Many gable roofs with large slopes are found in Vaihingen. The roof structure is also complex, as shown in Figure 8a. Some noise points also exist (Figure 8b). A complex roof structure with planes that have a small slope difference with its neighbor planes, and also with small structures, is shown in 
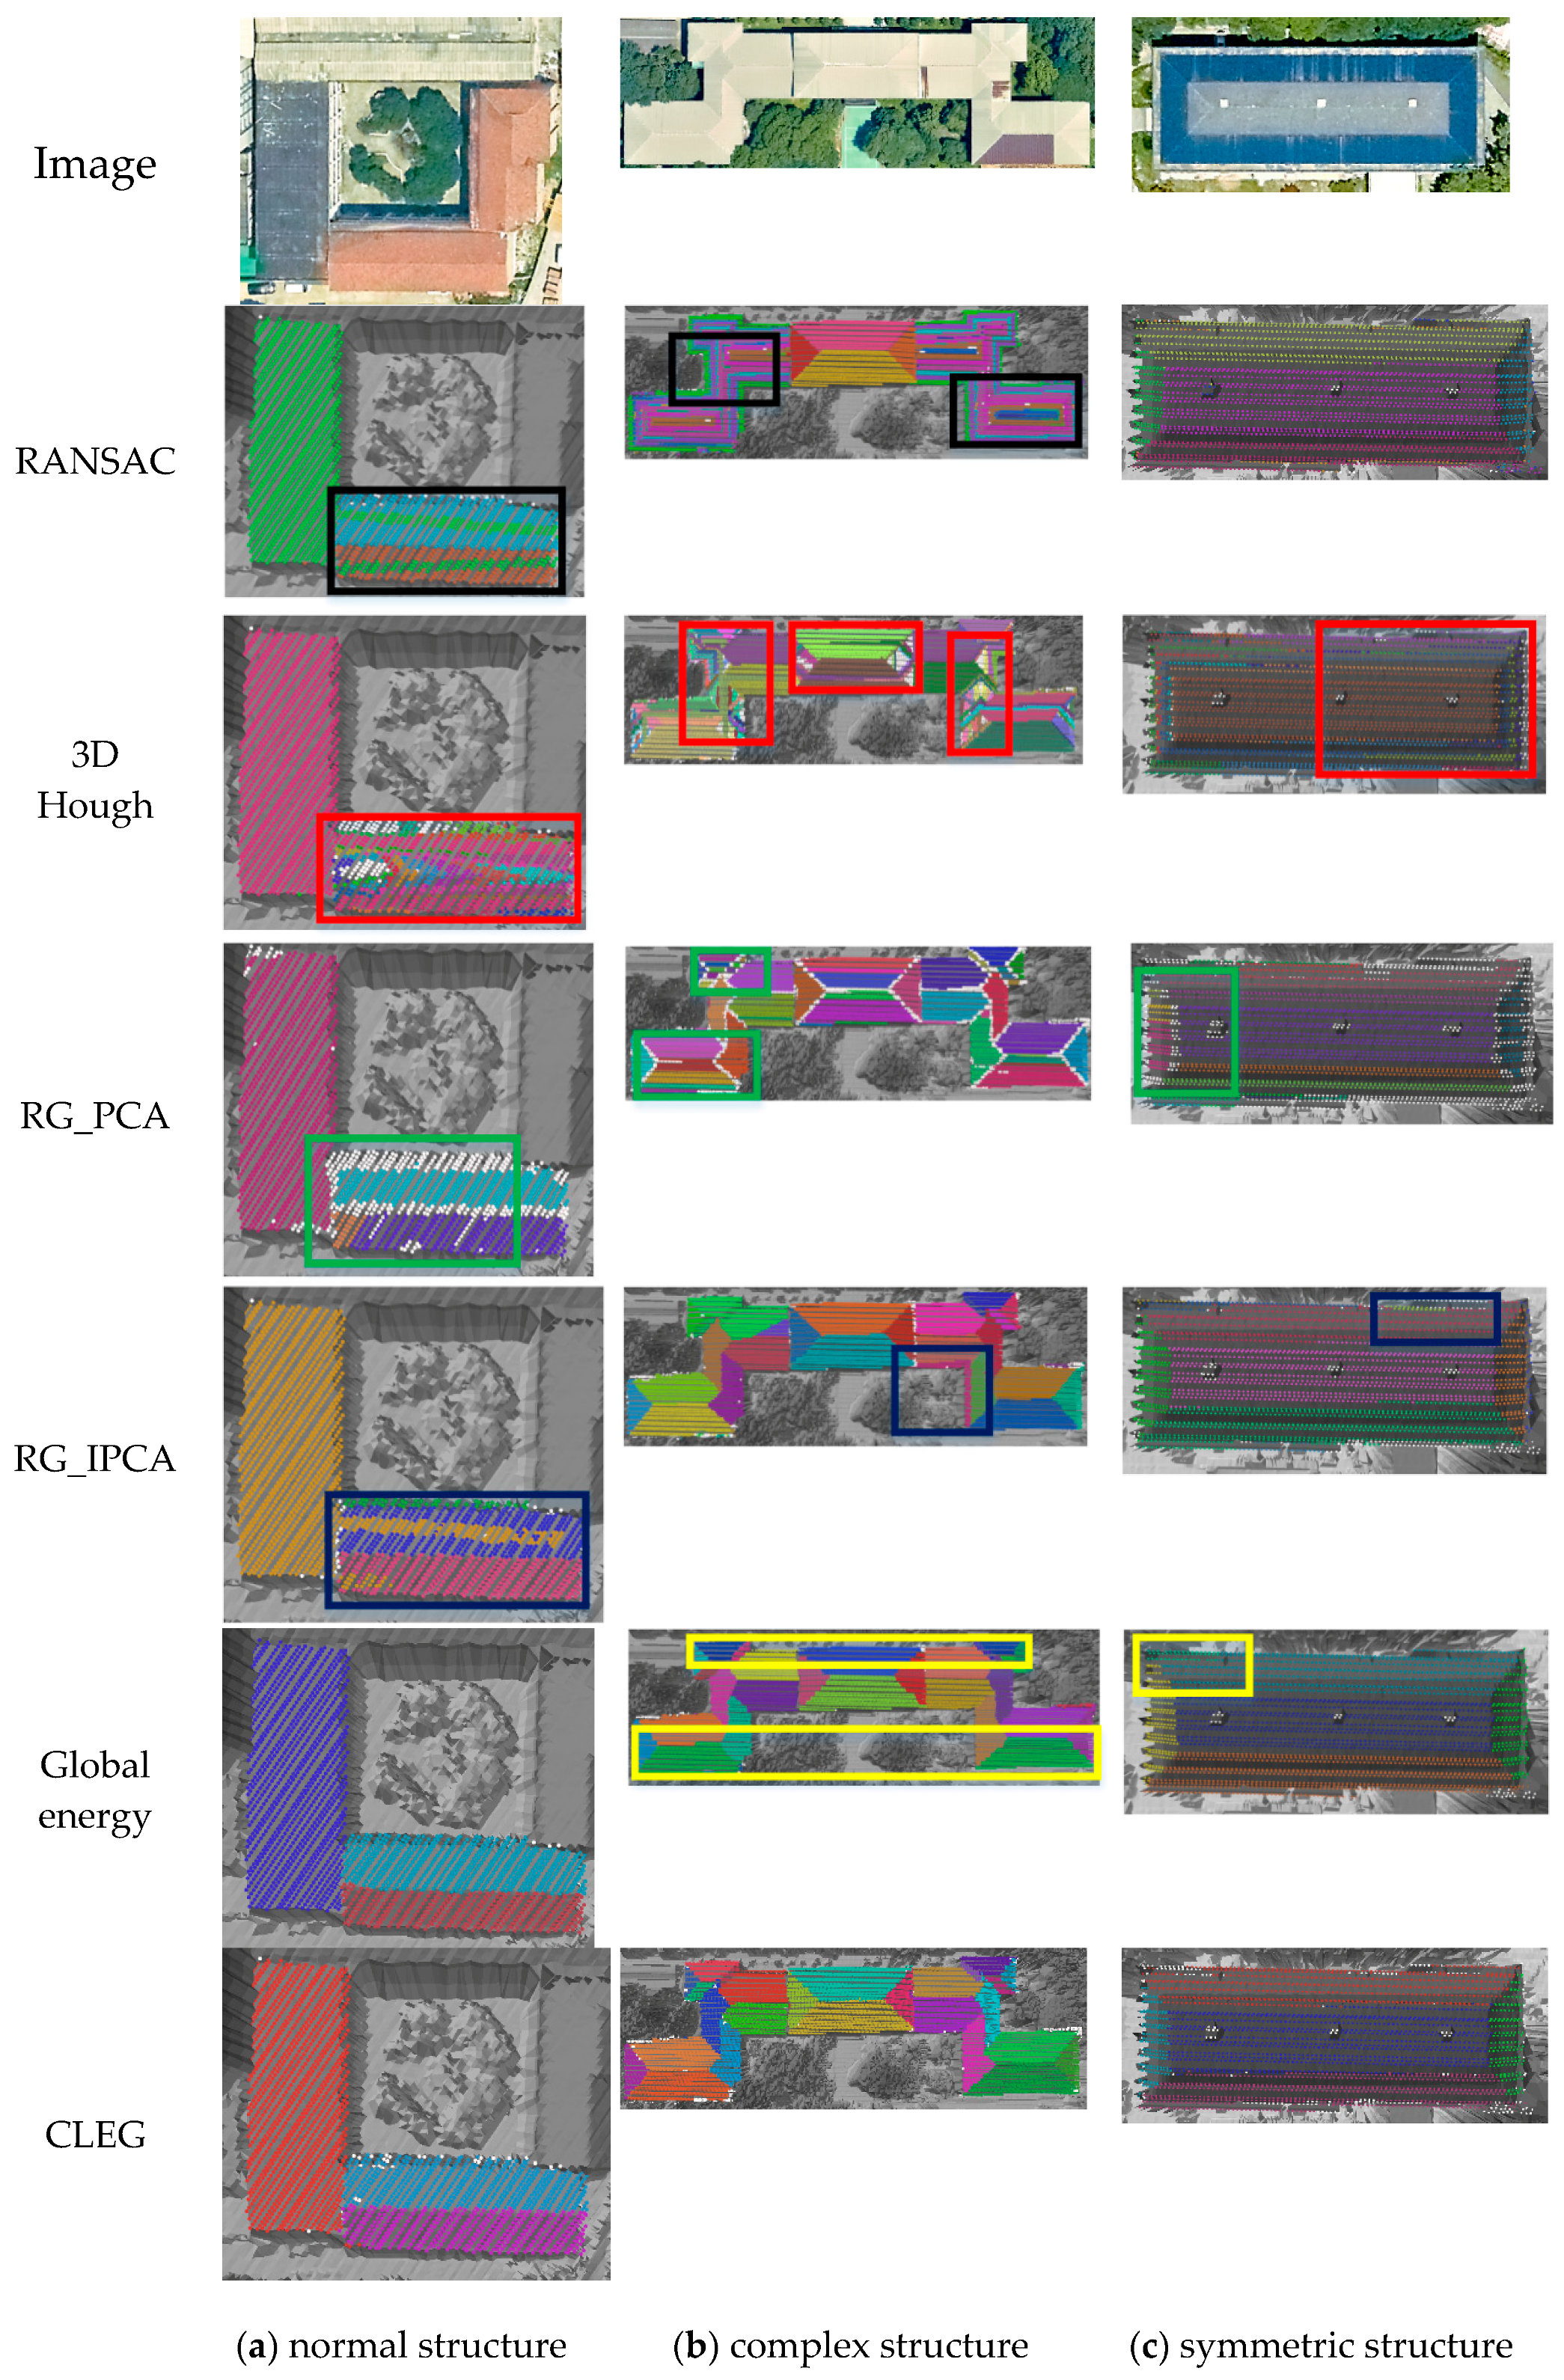
Figure 8c. Many flat and gable roofs are found in Wuhan. The slope of gable roofs is not large. A flat roof is close to the gable roofs, as shown in Figure 9a. A complex symmetric roof structure is shown in Figure 9b. A symmetric trapezoid roof is shown in Figure 9c. Many gable roofs with small slopes are found in Guangzhou. The nearly arc-shaped roofs results in weak edges of the planes, as shown in Figure 10a. Figure 10b,c show several complex structures and roofs close to one another.
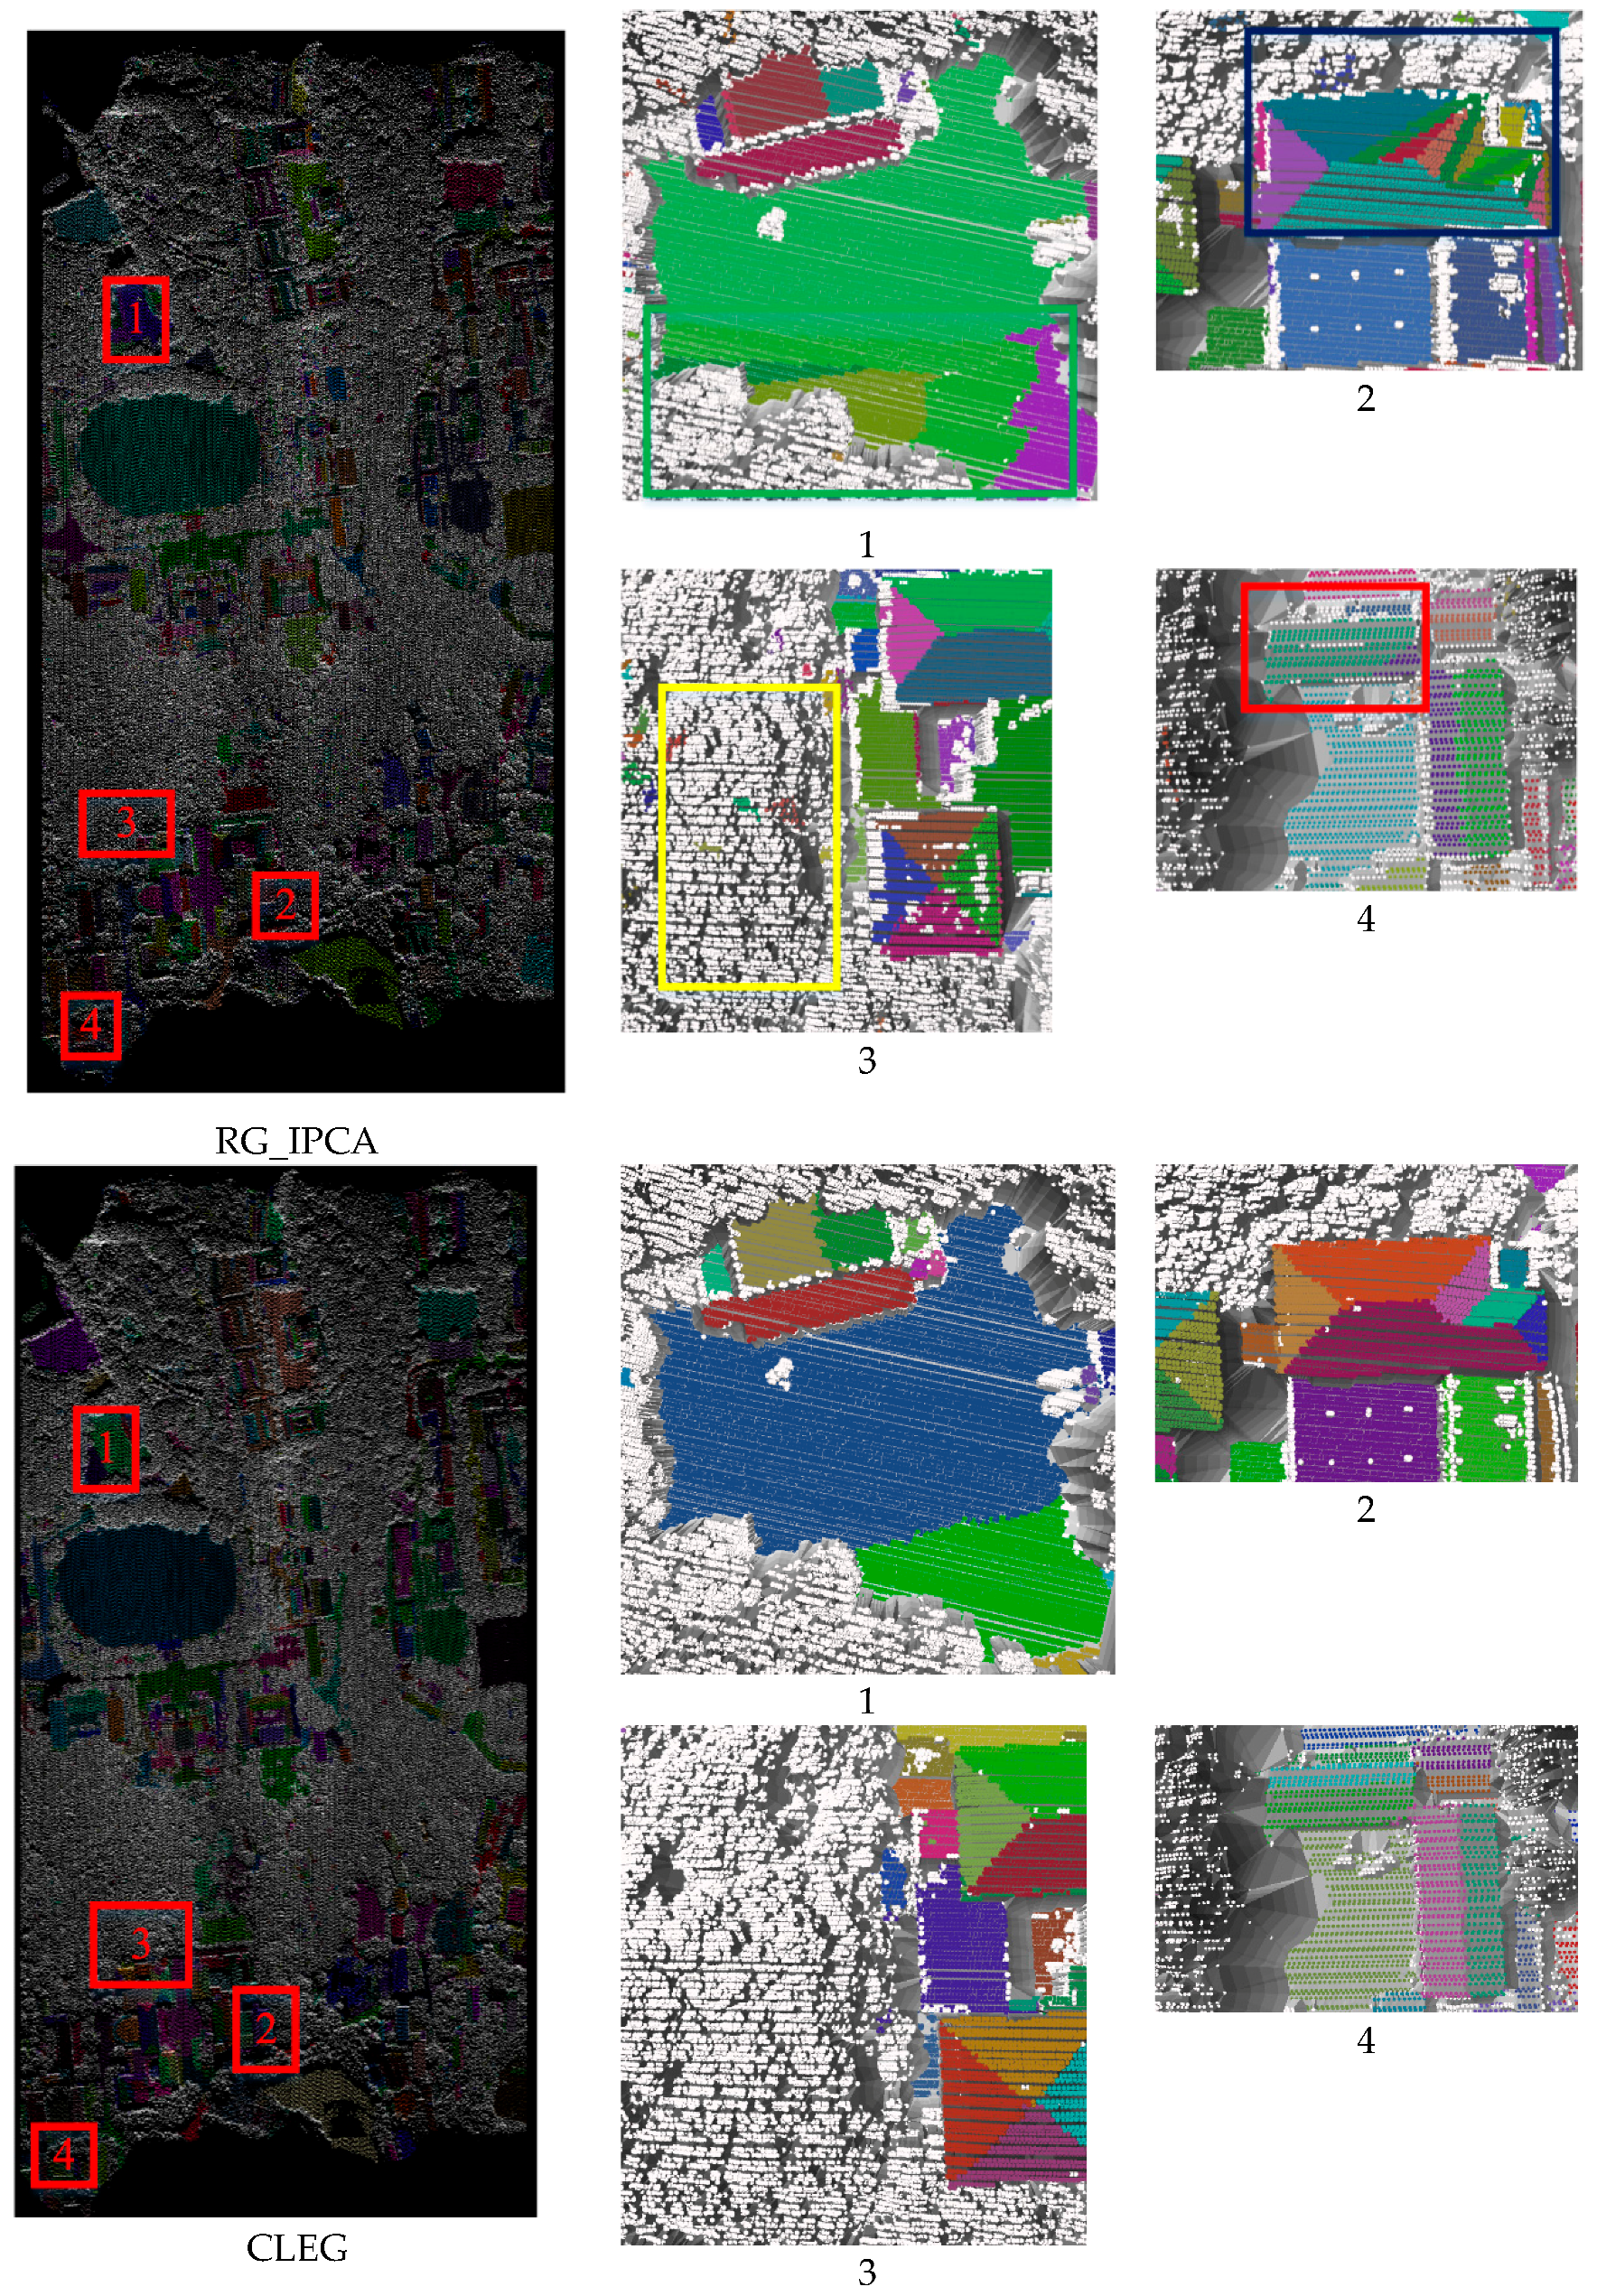
Segmentation results of roof points in the Vaihingen area are shown in Figure 8, and the evaluation of precision is listed in Table 3.
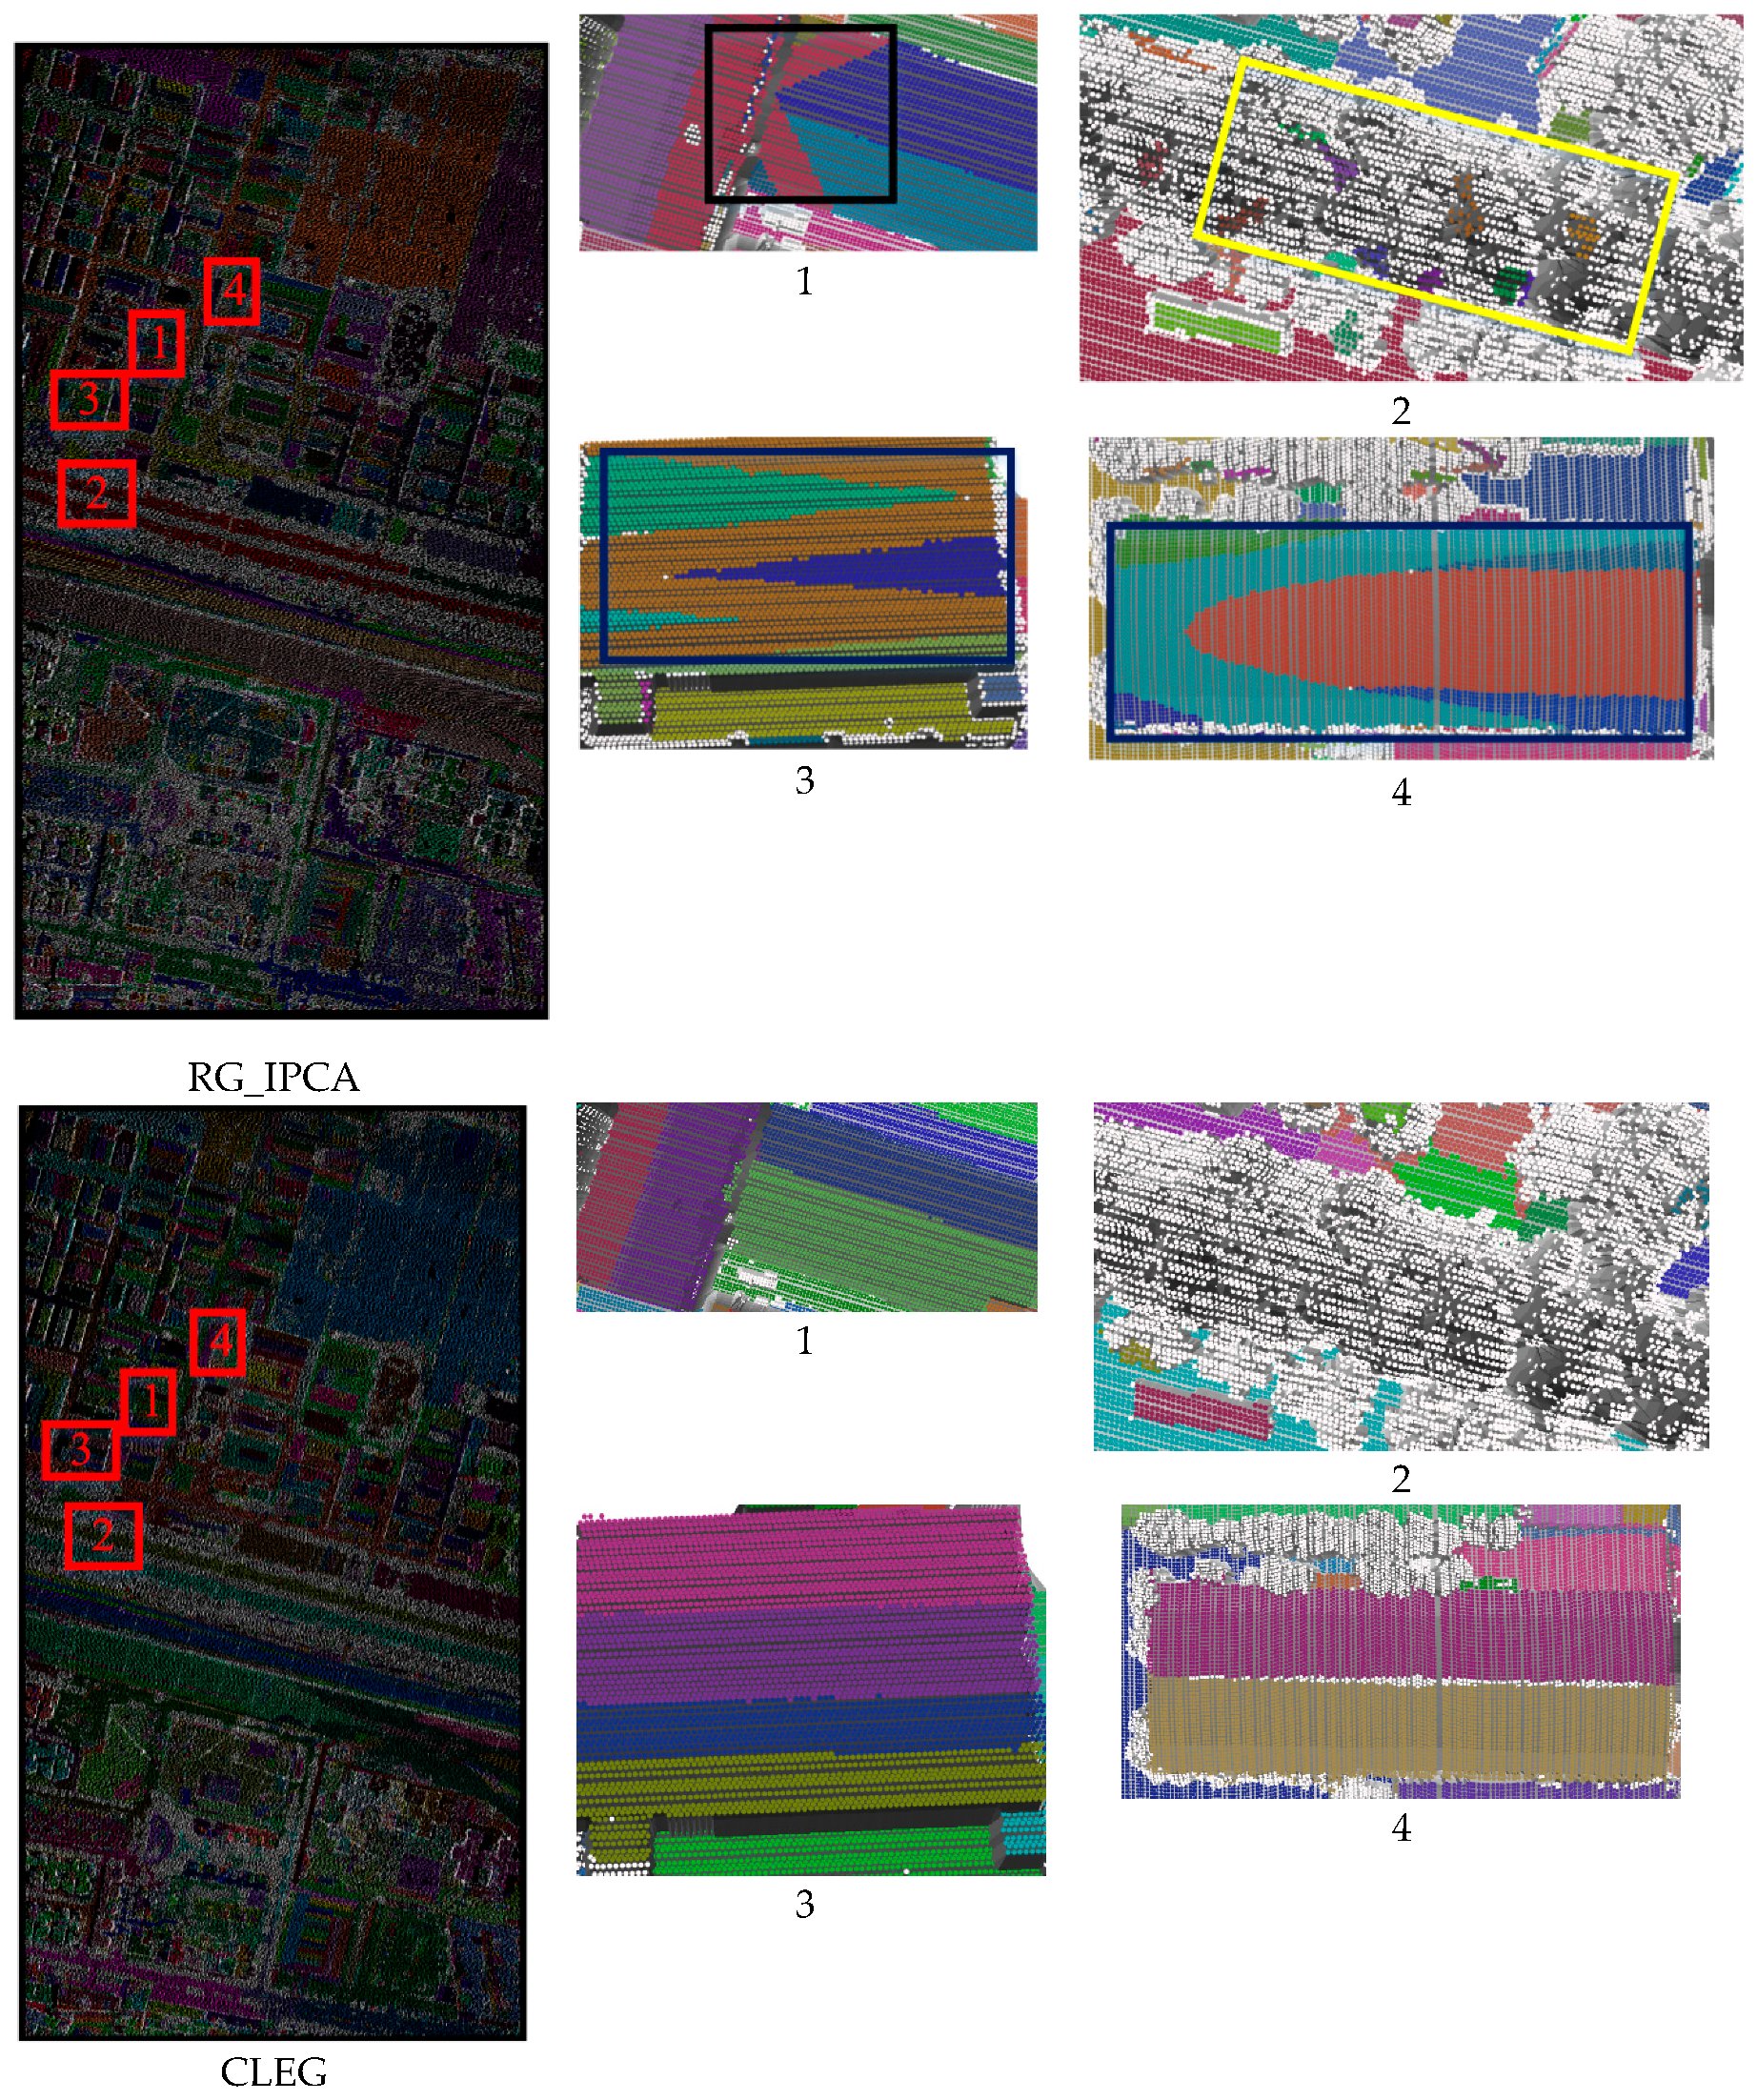
Segmentation results of roof points in the Wuhan area are shown in Figure 9, and the evaluation of precision is listed in Table 4.
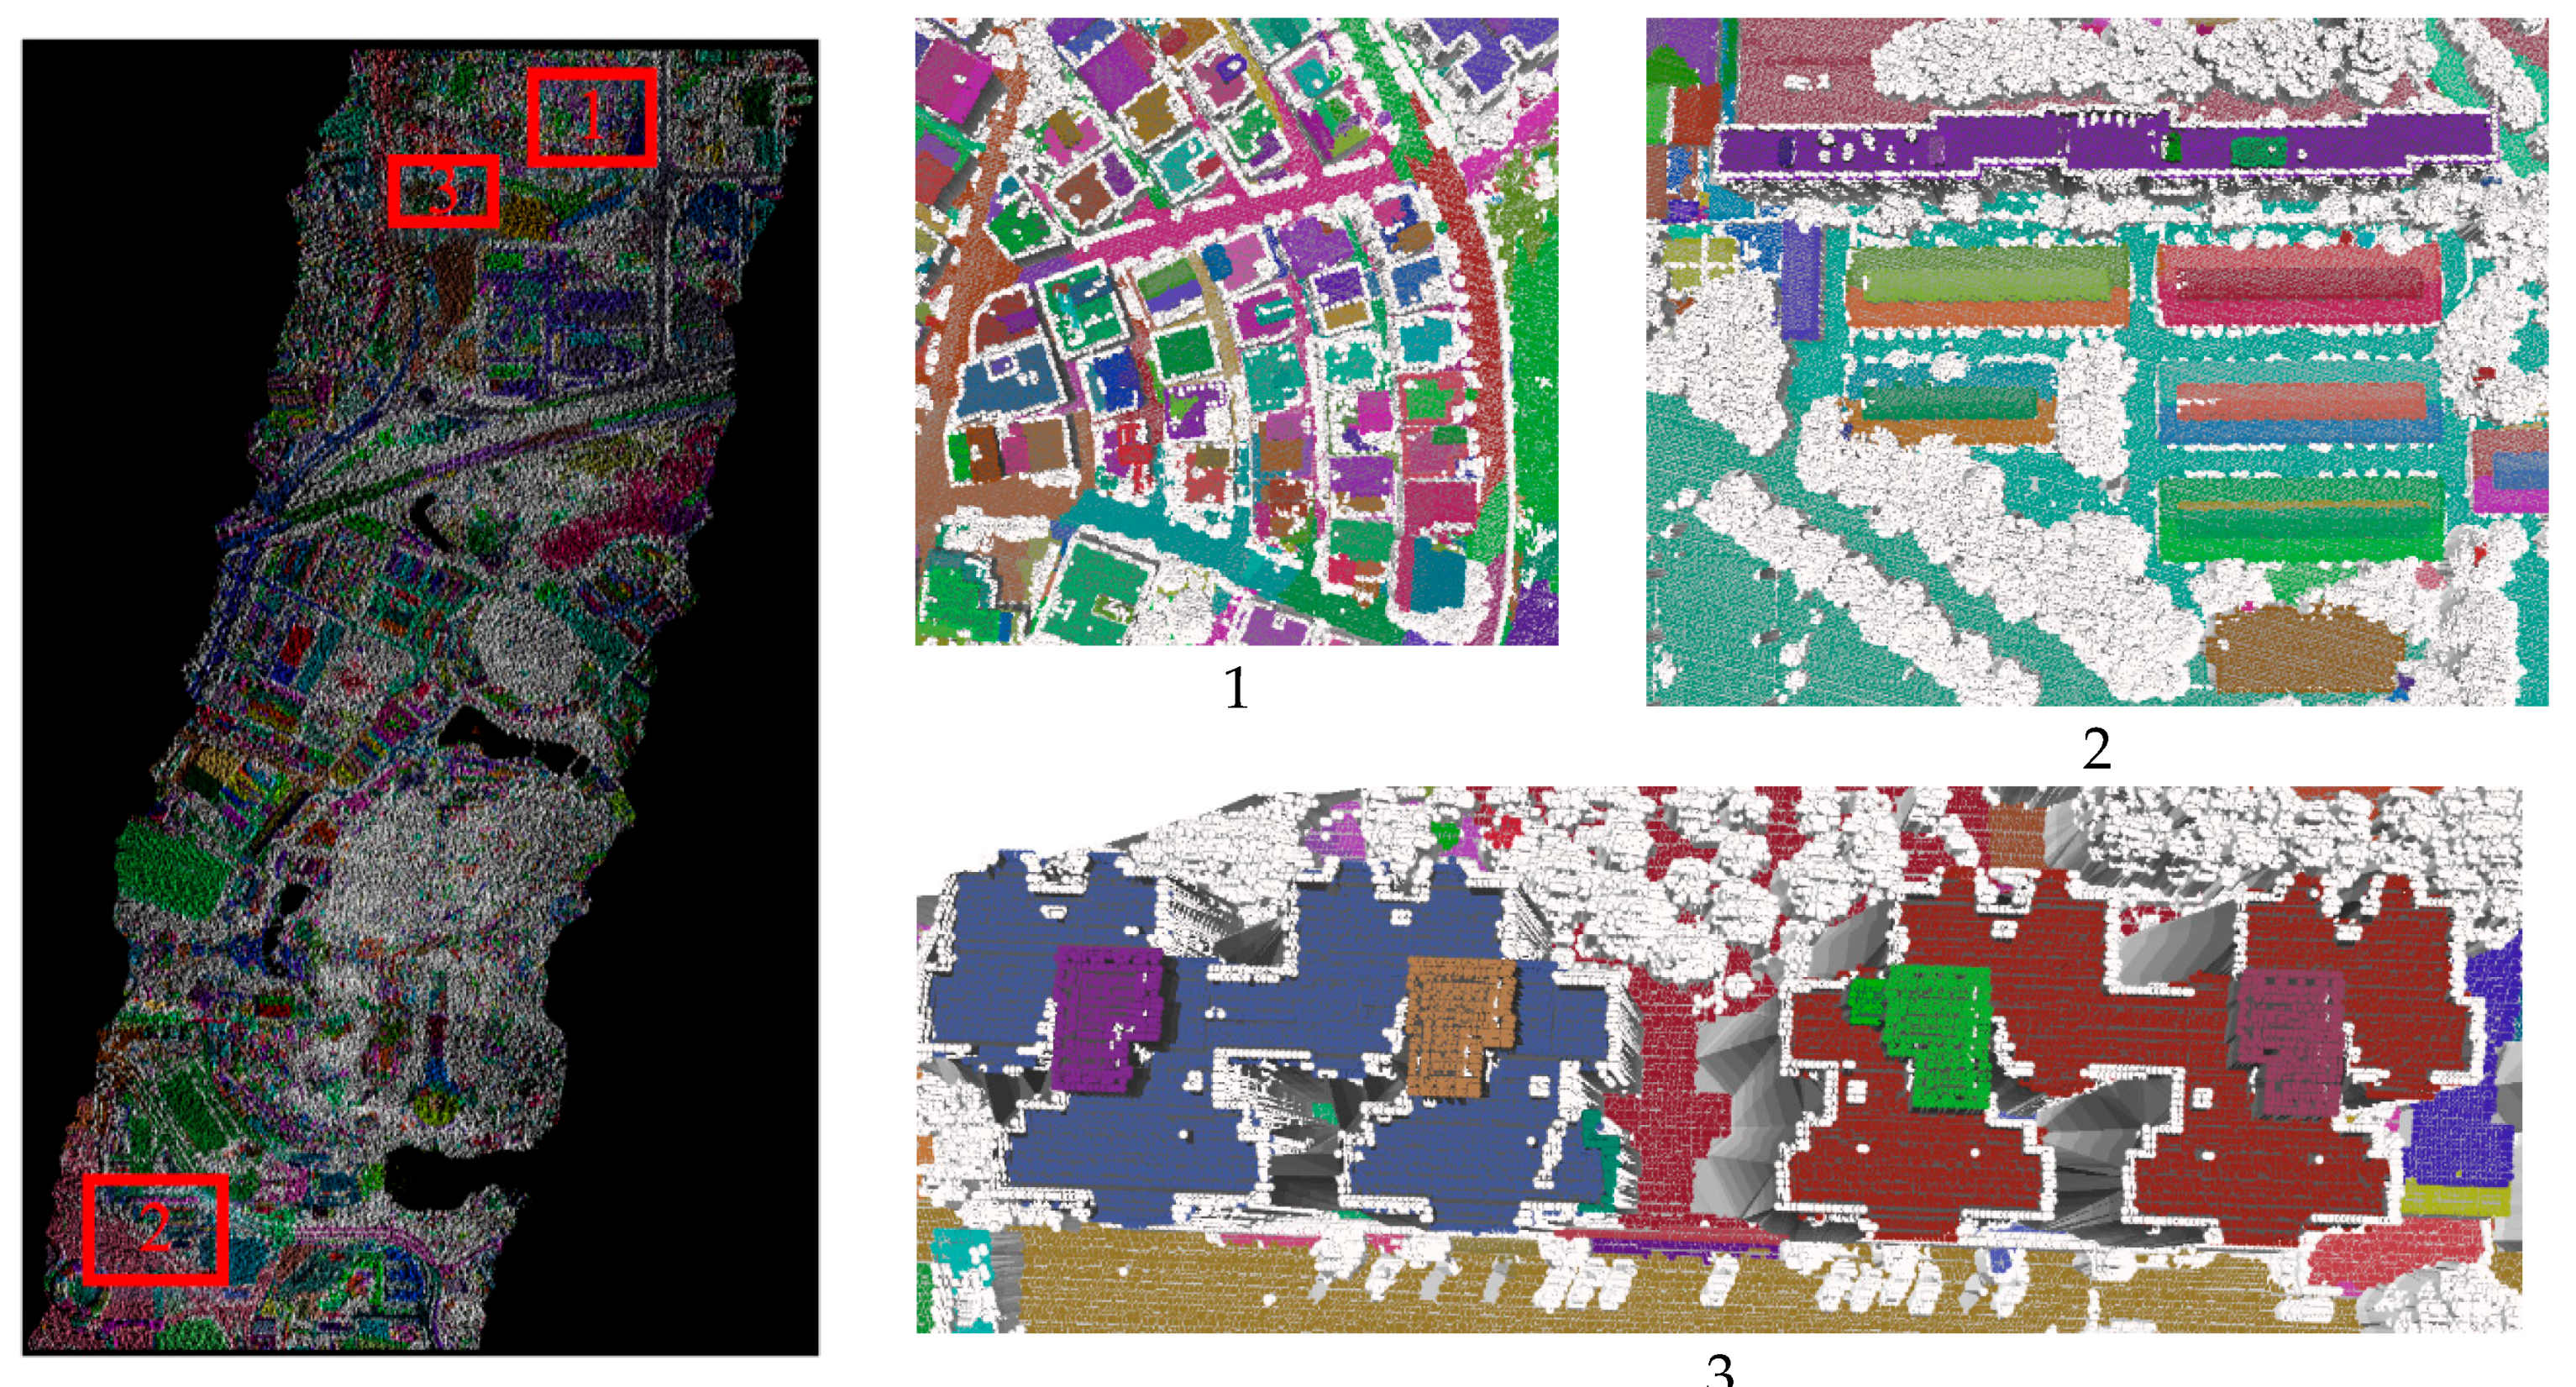
Segmentation results of roof points in the Guangzhou area are shown in Figure 10, and the evaluation of precision is listed in Table 5.
RANSAC runs fast when the point number is small (Table 4). The time of dataset (a) is less than 1 ms. However, the algorithm runs slow when the point number is large. The voting procedure with all the left points is undertaken afresh when a plane is found. When the roof structure is complex, many errors occur because the spatial relationship of the neighbors is not considered. The results are shown in the black rectangles in Figure 8a–c, Figure 9a–c and Figure 10a–c.
The voting space in 3D Hough transformation is first computed. The votes are then sorted, and the planes are detected in order. The region growth is finally used to obtain an entire plane in the supported points. The results of 3D Hough transformation are sometimes worse than those of RANSAC because one point may support many planes, and the remaining planes may not be the most supported ones. Many false planes are detected, as shown by the red rectangles in Figure 8a–c and Figure 9a–c. 3D Hough transformation has the same disadvantage as RANSAC and causes cross-planes without the use of normal vectors. The terminal condition is difficult to decide, and it uses the ratio of the smallest plane to the largest plane and the ratio of number of remaining points to total points may also lead to missing small planes, as shown by the center red rectangles in Figure 10a–c.
RG_PCA employs the K-nearest neighbors (KNN) to obtain the neighbor relationship and compute the normal vectors using PCA. The regions are then grown using the normal vectors. PCA may produce unstable results in estimating the normal vector at the edge regions. Therefore, the methods do not perform well in segmenting the points close to the facet boundary, as shown by the green rectangles in Figure 8a–c, Figure 9a and Figure 10c. KNN may produce an unstable neighbor relationship in areas with a largely uneven point density and results in over-segmentation, as shown by the green rectangles in Figure 9b,c. The difference of the normal vectors at the edge areas is small when the slope is small. This causes under-segmentation, as shown by the green rectangles in Figure 10a,b.
RG_IPCA utilized a triangulated irregular network (TIN) to obtain the neighbor relationship, compute the initial normal vectors using PCA, and grow to regions. This method can properly estimate the normal vectors at several boundary regions but may also lead to errors in several areas, as shown by the blue rectangles in Figure 8b,c, Figure 9a,b and Figure 10c. RG_IPCA has the same disadvantage as RG_PCA when the slope is small. The method results is under-segmentation, as shown by the blue rectangles in Figure 10a,b. Over-segmentation also exists in RG_IPCA, as denoted by the blue rectangles in Figure 8a and Figure 9c.
The global energy method utilizes Graphcuts to obtain the minimum energy. This method yields quiet accurate results but depends on a good initial input. Consequently, missed planes will also be missed in the optimization results, as shown by the yellow rectangles in Figure 8c and Figure 10a. The method also causes over-segmentation in noisy areas, as shown by the yellow rectangles in Figure 8b and Figure 9c. The improper neighbor relationship causes under-segmentation, as denoted by the yellow rectangle in Figure 9b. The separated planes are combined because TIN may connect faraway points. The two facets are on the same plane because of symmetry. In other conditions, global energy can perform quite well and obtain complete results with the fewest points left. CLEG can properly handle these complex structures with very few missing points.
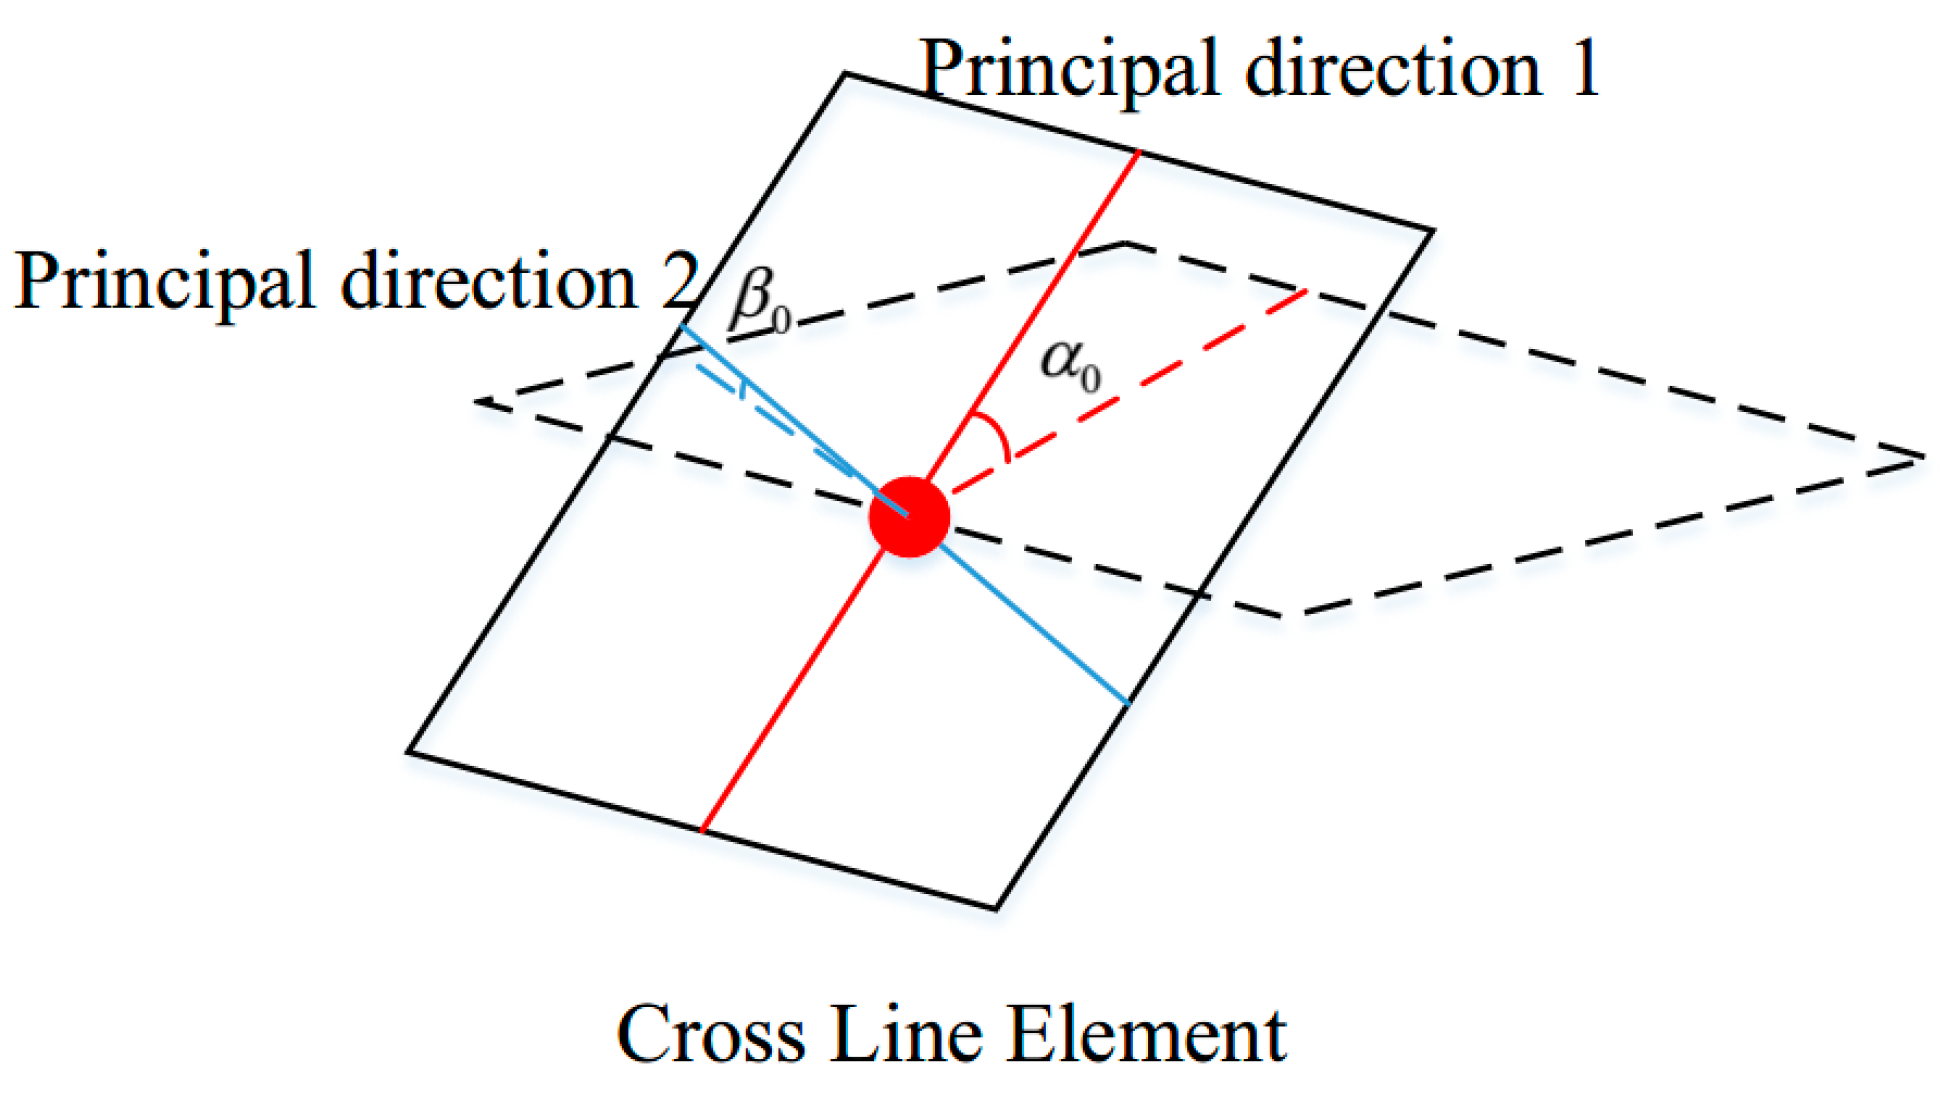
The proposed CLEG algorithm also has several disadvantages caused by the strict conditions of seed CLE selection. A seed CLE is not detected when the plane is small. Therefore, the plane may be missed, as shown by the red rectangle in Figure 11.

3.3. Region Segmentation

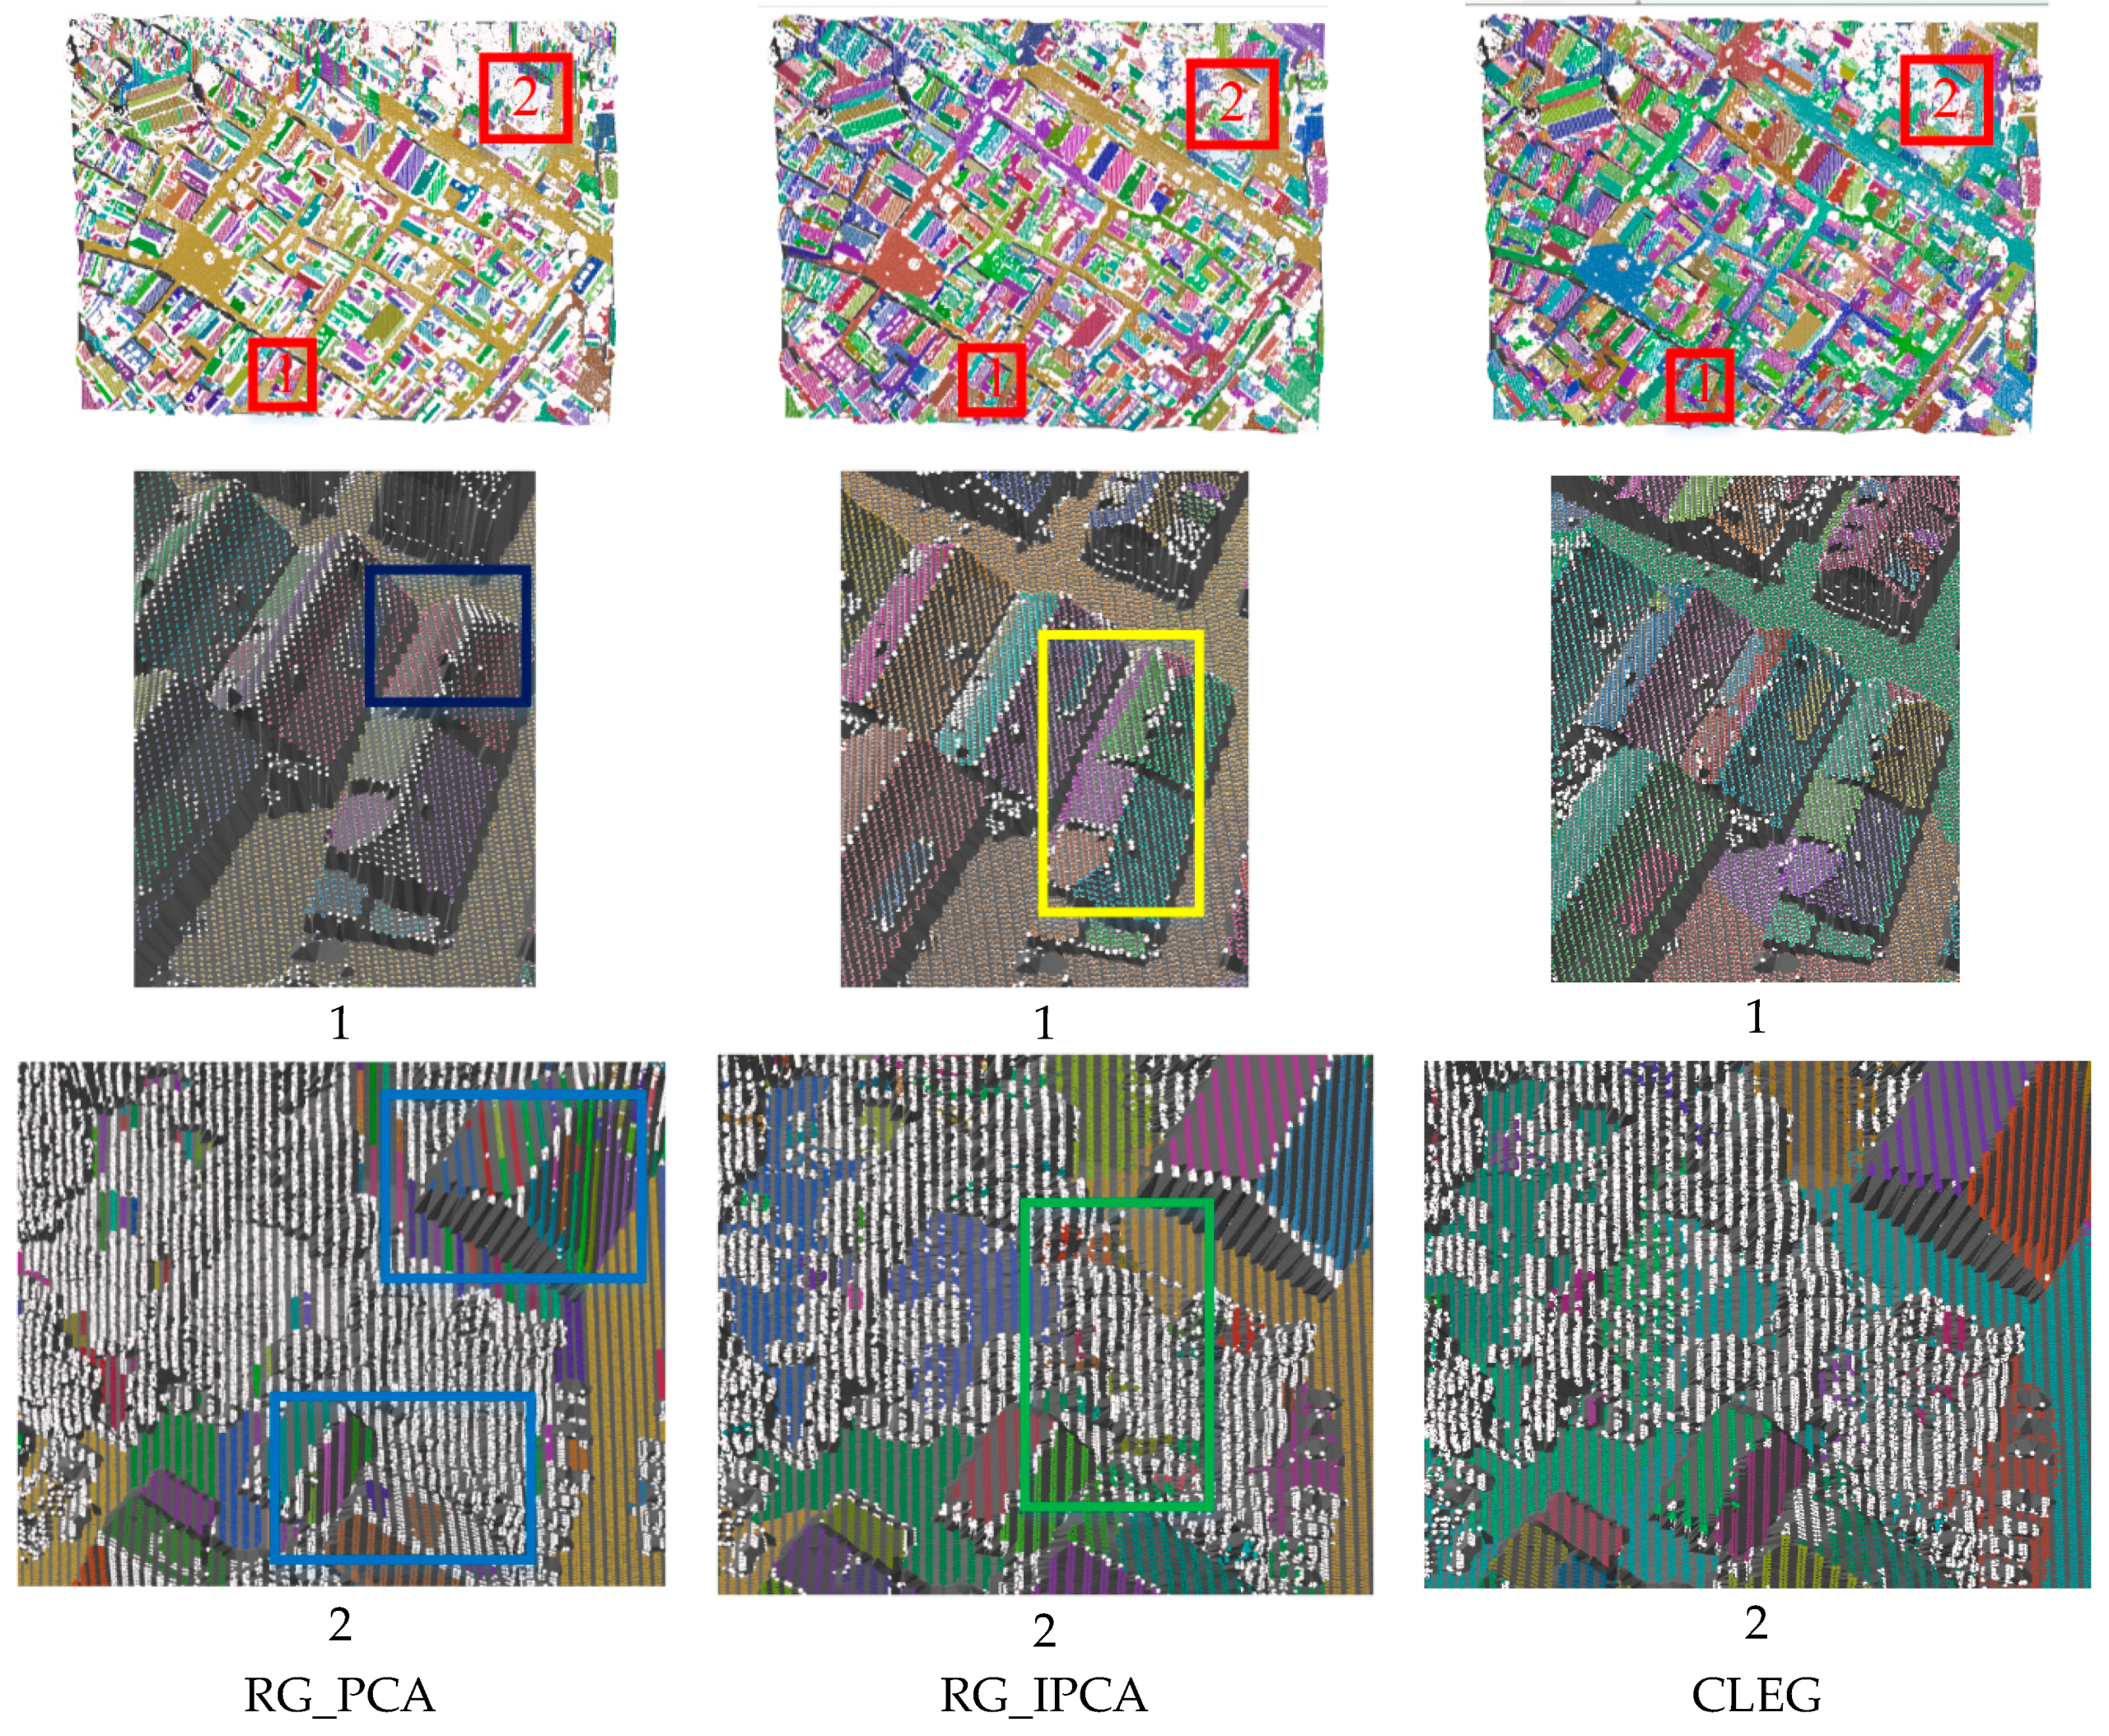
The CLEG algorithm can also process the point cloud containing terrains, buildings, trees, etc. The proposed method is similar to region growth methods. The comparison methods only include RG_PCA and RG_IPCA. The parameters used are shown in Table 6. The difference is that the minimum number of points required for a valid plane is larger than that in roof segmentation, because if the number is small, there may be many false planes detected in tree areas.
Seven datasets are utilized to prove the effectiveness and speed of the proposed method. The description is listed in Table 7.
Building the neighbor relationship possesses the highest computation cost in RG_PCA and RG_IPCA during the comparison test. The methods are different in the two algorithms. KNN is used in RG_PCA, and TIN is used in RG_IPCA. RG_PCA employs PCA to estimate the normal vectors of each point. The results may be unstable at boundary points, which often results in over-segmentation, as denoted by the blue rectangles in Figure 12 and Figure 13. RG_IPCA sometime estimates the false normal vectors and results in some false segmentation, as shown by the yellow rectangles in Figure 12 and Figure 14. Over-segmentation is also found in noisy areas, as shown by the blue rectangle in Figure 13. Although the minimum point of a valid plane is 20, some planes are found in the tree areas, as shown by the green rectangles in Figure 12 and Figure 13. CLEG can handle these cases well with faster speed (Table 7).
Segmentation results of the point cloud Vaighingen using a small dataset.
Segmentation results of the point cloud in the Wuhan area using a small dataset.
Segmentation results of the point cloud in the Guangzhou area using a small dataset.
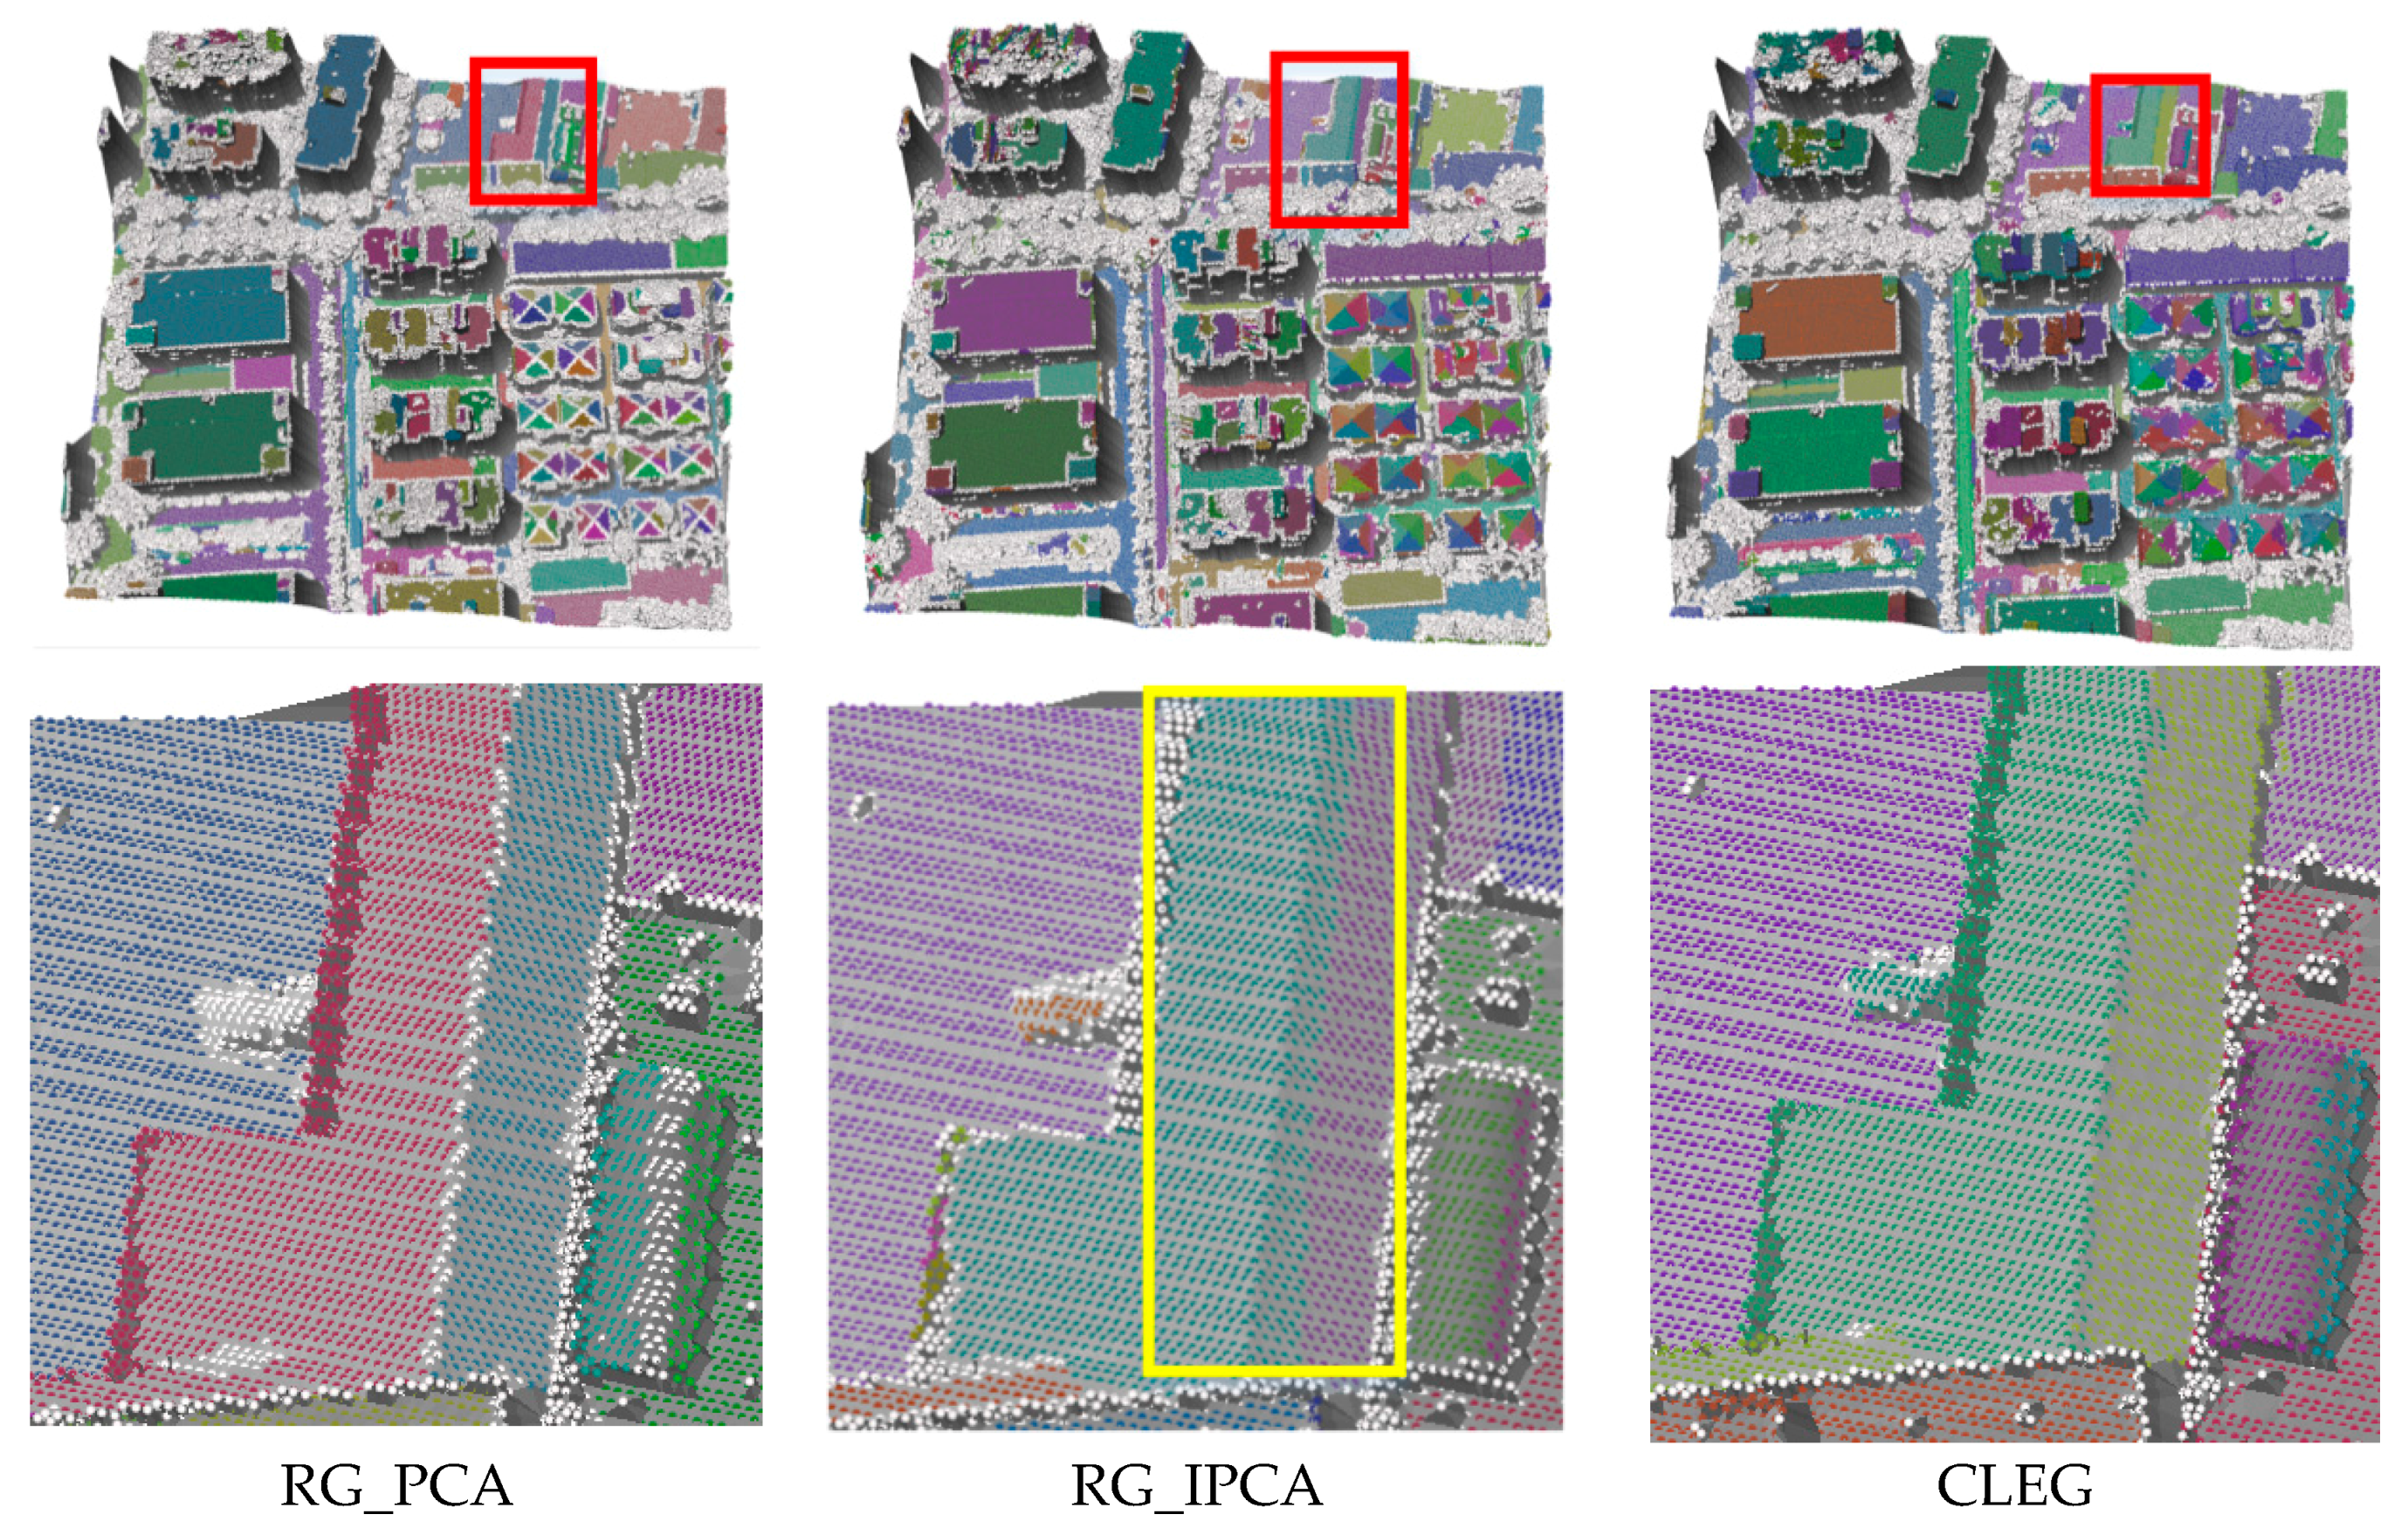
KNN is very slow when large datasets are used for segmentation. Therefore, only RG_IPCA is used for comparison. RG_IPCA may result in false segmentation at the roof areas, as shown by the blue rectangles in Figure 15, Figure 16 and Figure 17. False segmentation is also observed at ground area, as shown by the green rectangle in Figure 16. Under-segmentation is found when the slope is small. This result is denoted by the red rectangles in Figure 15 and Figure 16. A cross-plane is denoted by the black rectangle in Figure 17. Furthermore, many planes are found in the tree areas, as shown by the yellow rectangles in Figure 15, Figure 16 and Figure 17. CLEG can still handle these areas well with less processing time.
Segmentation results of point cloud in the Vaighingen area using a large dataset.
Segmentation results of the point cloud in the Wuhan area using a large dataset.
Segmentation results of the point cloud in the Guangzhou area using a large dataset.
Building TIN in RG_IPCA during the test causes shortage in memory when a large point cloud with 12 million points is used. The CLEG algorithm can handle this large dataset, and completes the segmentation within 1 min (
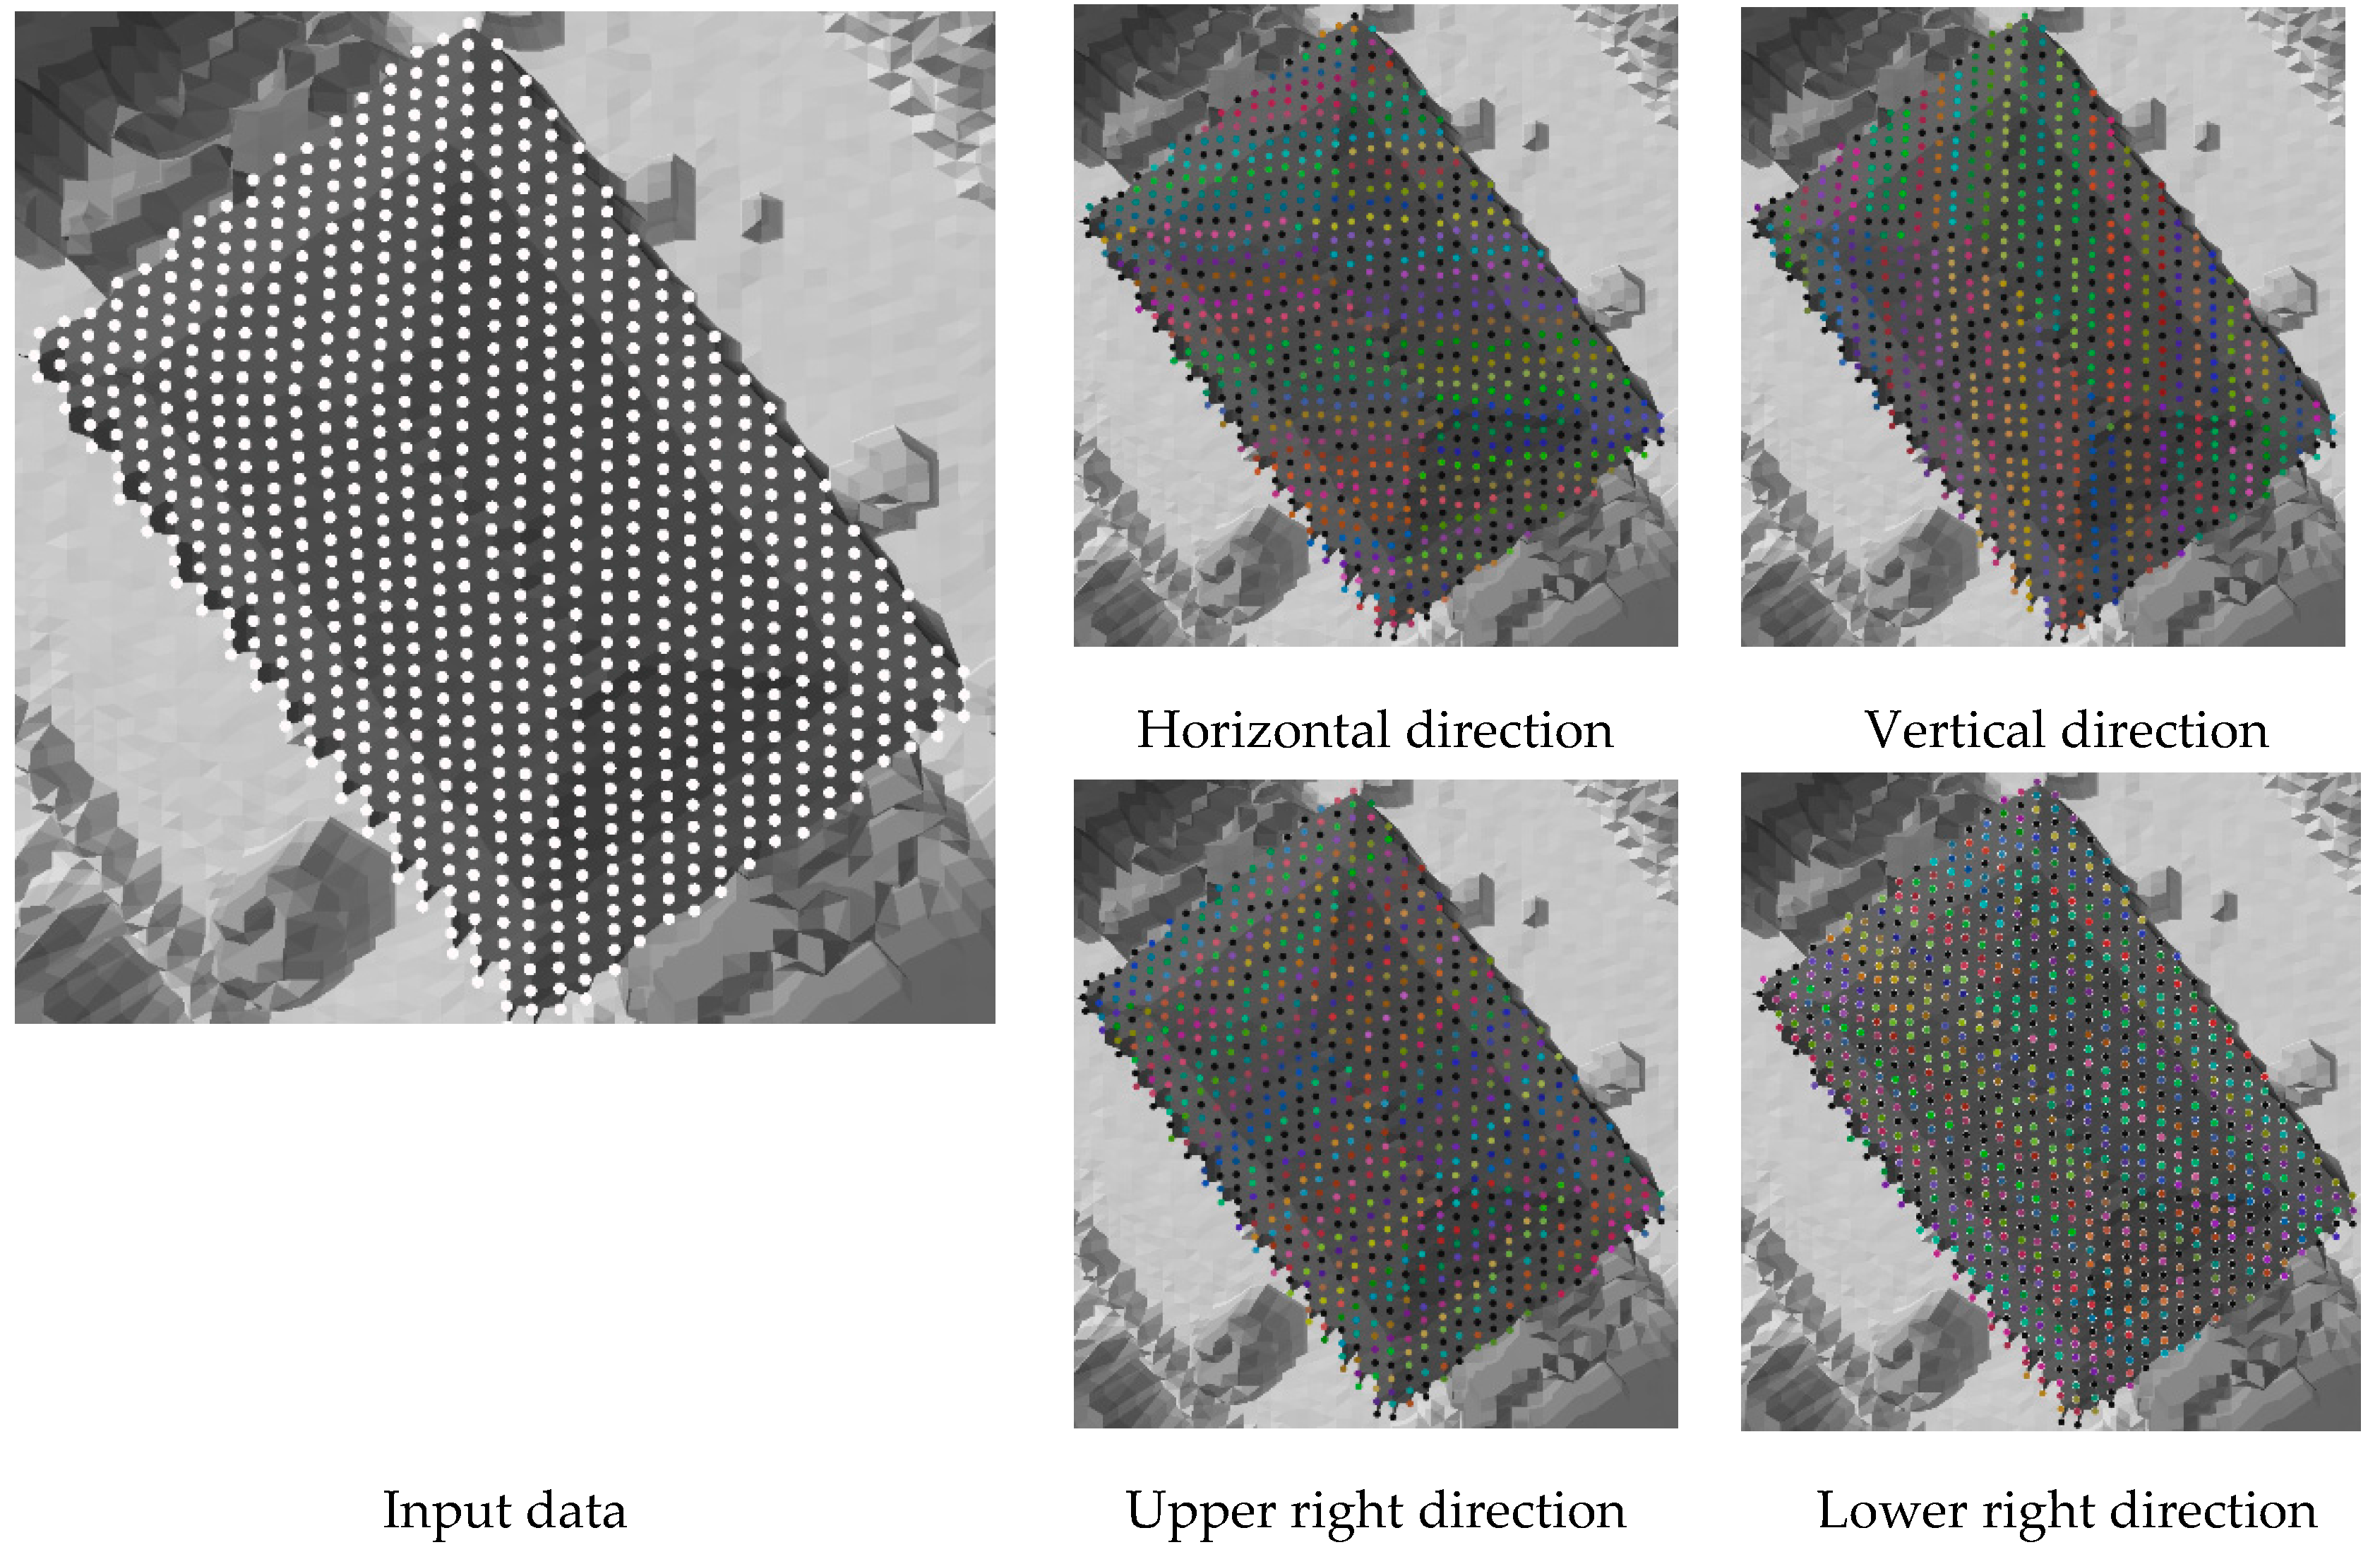
Figure 18). The proposed algorithm uses grid indexing instead of point-based neighbor relationship and CLE growth to overcome the shortage of uneven point cloud density. The process that consumes the most computation time in CLEG is the sorting of the seed points, which can be improved in the future by parallel computing.

3.4. Parameters Setting

The important parameters in CLEG algorithm are grid size and min line length. The grid size can be determined by the average point density.
The threshold of min line length is selected empirically in our experiment. This has an impact on the plane extraction results. The areas with line segments shorter than the threshold are missed. An example is shown in Figure 19.
As shown in Figure 19b, a narrow but long-shaped plane object is missed marked in the yellow box. From Figure 19c–f, with the increase of min line length threshold, more and more planes are omitted as marked in the red boxes. The threshold can be determined by the minimum size of the planes according to the level of detail.

4. Conclusions

Using profiles or scan lines of LiDAR data to segment a surface and classify objects is not new [3,4,5,6,7]. This study focuses on using cross-line elements for plane segmentation. Proper and quality seed selection and region growth based on information derived from CLE are considered for the accurate and stable detection of planes. The pre-segmentation of the point cloud into CLEs eliminates the problem of selecting support points in clustering and model fitting methods, which is the key for the proposed method. With the use of the angle information derived from the CLE, the stages of seed selection and growth become more reliable. Furthermore, the CLEG algorithm is computationally efficient due to simple operations in seed generation and growth. The tests using various datasets show that the proposed algorithm runs much faster than popular methods while producing stable and accurate segmentation results. CLEG has great potential in feature extraction, object classification and 3D modeling of buildings.
However, the CLEG algorithm may still result in missing small facets because of the missing seed CLEs. Furthermore, the parameter of minimum line length has an impact on the plane extraction results; some narrow but long-shaped plane objects are missing. An additional retrieval step may be necessary to find these missing small and narrow planes. Two parallel lines can also determine a plane. In the next study, this could be combined with CLE to detect the missed narrow but long planes. Meanwhile, the CLE-derived features may be utilized in object classification and building detection from point cloud data, which is an important future task in extending the usage of CLEs.

Acknowledgments

This study was partially supported by the National Key Basic Research and Development Program (Project No. 2012CB719904) of China and the research funding by Guangdong province (2013B090400008) of China. The authors thank Guangzhou Jiantong Surveying, Mapping and Geographic Information Technology Ltd. for providing the data used in this research project. The Vaihingen data was provided by the German Society for Photogrammetry, Remote Sensing and Geoinformation (DGPF [Cramer, 2010]: http://www.ifp.uni-stuttgart.de/dgpf/DKEP-Allg.html (In German). The Wuhan data was provided by the National Key Basic Research and Development Program (Project No. 2012CB719904) of China. Thanks to Jixing Yan for providing the source code of RG_IPCA and global energy-based segmentation.

Author Contributions

Teng Wu designed the algorithm in detail, including seed selection and growth, etc., and performed the experimental analysis. He also wrote the paper. Xiangyun Hu originally proposed using cross-lines for segmentation, advised the algorithm design and revised the paper. Lizhi Ye conducted the related initial study on profile-based feature extraction from LiDAR data.

Conflicts of Interest

The authors declare no conflict of interest.

Abbreviations

The following abbreviations are used in this manuscript:
LiDARlight detection and ranging
DSMdigital surface model
CLEcross-line element
CLEGcross-line element growth
RANSACrandom sample census
PCAprinciple component analysis
IPCAiterative PCA
GSDground sample distance
RGregion growth
KNNK-nearest neighbors
TINtriangulated irregular network
RCLreference cross-lap
DCLdetection cross-lap
BPboundary precision
BRboundary recall

References

  1. Jiang, X.; Bunke, H. Edge detection in range images based on scan line approximation. Comput. Vis. Image Underst. 1999, 73, 183–199. [Google Scholar] [CrossRef]
  2. Sappa, A.D.; Devy, M. Fast Range Image Segmentation by an Edge Detection Strategy. In Proceedings of the Third International Conference on the 3-D Digital Imaging and Modeling, Quebec City, QC, Canada, 28 May–1 June 2001; pp. 292–299.
  3. Jiang, X.; Bunke, H. Fast segmentation of range images into planar regions by scan line grouping. Mach. Vis. Appl. 1994, 7, 115–122. [Google Scholar] [CrossRef]
  4. Wang, J.; Shan, J. Segmentation of lidar point clouds for building extraction. In Proceedings of the American Society for Photogramm Remote Sens Annual Conference, Baltimore, MD, USA, 9–13 March 2009; pp. 9–13.
  5. Sithole, G.; Vosselman, G. Automatic structure detection in a point-cloud of an urban landscape. In Proceedings of the 2nd GRSS/ISPRS Joint Workshop on Remote Sensing and Data Fusion over Urban Areas, Berlin, Germany, 22–23 May 2003; pp. 67–71.
  6. Sithole, G.; Vosselman, G. Bridge detection in airborne laser scanner data. ISPRS J. Photogramm. Remote Sens. 2006, 61, 33–46. [Google Scholar] [CrossRef]
  7. Hu, X.; Ye, L. A fast and simple method of building detection from lidar data based on scan line analysis. ISPRS Ann. Photogramm. Remote Sens. Spat. Inf. Sci. 2013, 1, 7–13. [Google Scholar] [CrossRef]
  8. Wang, M.; Tseng, Y.-H. Automatic segmentation of lidar data into coplanar point clusters using an octree-based split-and-merge algorithm. Photogramm. Eng. Remote Sens. 2010, 76, 407–420. [Google Scholar] [CrossRef]
  9. Wang, M.; Tseng, Y.H. Incremental segmentation of lidar point clouds with an octree—Structured voxel space. Photogramm. Rec. 2011, 26, 32–57. [Google Scholar] [CrossRef]
  10. Chehata, N.; David, N.; Bretar, F. Lidar data classification using hierarchical k-means clustering. In Proceedings of the ISPRS Congress, Beijing, China, 3–11 July 2008; pp. 325–330.
  11. Morsdorf, F.; Meier, E.; Kötz, B.; Itten, K.I.; Dobbertin, M.; Allgöwer, B. Lidar-based geometric reconstruction of boreal type forest stands at single tree level for forest and wildland fire management. Remote Sens. Environ. 2004, 92, 353–362. [Google Scholar] [CrossRef]
  12. Sampath, A.; Shan, J. Clustering based planar roof extraction from lidar data. In Proceedings of the American Society for Photogrammetry and Remote Sensing Annual Conference, Reno, NV, USA, 1–5 May, 2006; pp. 1–6.
  13. Biosca, J.M.; Lerma, J.L. Unsupervised robust planar segmentation of terrestrial laser scanner point clouds based on fuzzy clustering methods. ISPRS J. Photogramm. Remote Sens. 2008, 63, 84–98. [Google Scholar] [CrossRef]
  14. Sampath, A.; Shan, J. Segmentation and reconstruction of polyhedral building roofs from aerial lidar point clouds. IEEE Trans. Geosci. Remote Sens. 2010, 48, 1554–1567. [Google Scholar] [CrossRef]
  15. Melzer, T. Non-parametric segmentation of ALS point clouds using mean shift. J. Appl. Geod. 2007, 1, 159–170. [Google Scholar] [CrossRef]
  16. Comaniciu, D.; Meer, P. Mean shift: A robust approach toward feature space analysis. IEEE Trans. Pattern Anal. Mach. Intell. 2002, 24, 603–619. [Google Scholar] [CrossRef]
  17. Ferraz, A.; Bretar, F.; Jacquemoud, S.; Gonçalves, G.; Pereira, L. 3d segmentation of forest structure using a mean-shift based algorithm. In Proceedings of the 2010 IEEE International Conference on Image Processing, Hong Kong, China, 26–29 September 2010; pp. 1413–1416.
  18. Yao, W.; Hinz, S.; Stilla, U. Object extraction based on 3D-segmentation of lidar data by combining mean shift with normalized cuts: Two examples from urban areas. In Proceedings of the 2009 Joint Urban Remote Sensing Event, Shanghai, China, 20–22 May 2009; pp. 1–6.
  19. Fischler, M.A.; Bolles, R.C. Random sample consensus: A paradigm for model fitting with applications to image analysis and automated cartography. Commun. ACM 1981, 24, 381–395. [Google Scholar] [CrossRef]
  20. Duda, R.O.; Hart, P.E. Use of the Hough transformation to detect lines and curves in pictures. Commun. ACM 1972, 15, 11–15. [Google Scholar] [CrossRef]
  21. Medioni, G.; Tang, C.-K.; Lee, M.-S. Tensor Voting: Theory and Applications. Available online: http://159.226.251.229/videoplayer/Medioni_tensor_voting.pdf?ich_u_r_i=32752eaf85f6419f90c3d08468c5e75c&ich_s_t_a_r_t=0&ich_e_n_d=0&ich_k_e_y=1645048929750163052450&ich_t_y_p_e=1&ich_d_i_s_k_i_d=10&ich_u_n_i_t=1 (accessed on 25 February 2016).
  22. Brenner, C. Towards fully automatic generation of city models. Int. Arch. Photogramm. Remote Sens. 2000, 33, 84–92. [Google Scholar]
  23. Bretar, F.; Roux, M. Extraction of 3D planar primitives from raw airborne laser data: A normal driven ransac approach. In Proceedings of the IAPR Conference on Machine Vision Applications, Tsukuba, Japan, 16–18 May 2005.
  24. Tarsha-Kurdi, F.; Landes, T.; Grussenmeyer, P. Extended ransac algorithm for automatic detection of building roof planes from lidar data. Photogramm. J. Finl. 2008, 21, 97–109. [Google Scholar]
  25. Yan, J.; Jiang, W.; Shan, J. Quality analysis on ransac-based roof facets extraction from airborne lidar data. ISPRS Int. Arch. Photogramm. Remote Sens. Spat. Inf. Sci. 2012, 1, 367–372. [Google Scholar] [CrossRef]
  26. Vosselman, G.; Dijkman, S. 3D building model reconstruction from point clouds and ground plans. Int. Arch. Photogramm. Remote Sens. Spat. Inf. Sci. 2001, 34, 37–44. [Google Scholar]
  27. Borrmann, D.; Elseberg, J.; Lingemann, K.; Nüchter, A. The 3D Hough transform for plane detection in point clouds: A review and a new accumulator design. 3D Res. 2011, 2, 1–13. [Google Scholar] [CrossRef]
  28. Schuster, H.-F. Segmentation of lidar data using the tensor voting framework. Int. Arch. Photogramm. Remote Sens. Spat. Inf. Sci. 2004, 35, 1073–1078. [Google Scholar]
  29. Kim, E.; Medioni, G. Urban scene understanding from aerial and ground lidar data. Mach. Vis. Appl. 2011, 22, 691–703. [Google Scholar] [CrossRef]
  30. Gorte, B. Segmentation of tin-structured surface models. Int. Arch. Photogramm. Remote Sens. Spat. Inf. Sci. 2002, 34, 465–469. [Google Scholar]
  31. Lee, I.; Schenk, T. Perceptual organization of 3D surface points. Int. Arch. Photogramm. Remote Sens. Spat. Inf. Sci. 2002, 34, 193–198. [Google Scholar]
  32. Rottensteiner, F. Automatic generation of high-quality building models from lidar data. IEEE Comput. Graph. Appl. 2003, 23, 42–50. [Google Scholar] [CrossRef]
  33. Pu, S.; Vosselman, G. Automatic extraction of building features from terrestrial laser scanning. Int. Arch. Photogramm. Remote Sens. Spat. Inf. Sci. 2006, 36, 25–27. [Google Scholar]
  34. Vosselman, G.; Gorte, B.G.; Sithole, G.; Rabbani, T. Recognising structure in laser scanner point clouds. Int. Arch. Photogramm. Remote Sens. Spat. Inf. Sci. 2004, 46, 33–38. [Google Scholar]
  35. Forlani, G.; Nardinocchi, C.; Scaioni, M.; Zingaretti, P. Complete classification of raw lidar data and 3D reconstruction of buildings. Pattern Anal. Appl. 2006, 8, 357–374. [Google Scholar] [CrossRef]
  36. Rabbani, T.; van den Heuvel, F.; Vosselmann, G. Segmentation of point clouds using smoothness constraint. Int. Arch. Photogramm. Remote Sens. Spat. Inf. Sci. 2006, 36, 248–253. [Google Scholar]
  37. Chauve, A.-L.; Labatut, P.; Pons, J.-P. Robust piecewise-planar 3D reconstruction and completion from large-scale unstructured point data. In Proceedings of the 2010 IEEE Conference on Computer Vision and Pattern Recognition (CVPR), San Francisco, CA, USA, 13–18 June 2010; pp. 1261–1268.
  38. Yan, J.; Shan, J.; Jiang, W. A global optimization approach to roof segmentation from airborne lidar point clouds. ISPRS J. Photogramm. Remote Sens. 2014, 94, 183–193. [Google Scholar] [CrossRef]
  39. Kim, T.; Muller, J.-P. Development of a graph-based approach for building detection. Image Vis. Comput. 1999, 17, 3–14. [Google Scholar] [CrossRef]
  40. Wang, L.; Chu, H. Graph theoretic segmentation of airborne lidar data. Proc. SPIE 2008. [CrossRef]
  41. Strom, J.; Richardson, A.; Olson, E. Graph-based segmentation for colored 3D laser point clouds. In Proceedings of the 2010 IEEE/RSJ International Conference on Intelligent Robots and Systems (IROS), Taipei, Taiwan, 18–22 October 2010; pp. 2131–2136.
  42. Pauling, F.; Bosse, M.; Zlot, R. Automatic segmentation of 3D laser point clouds by ellipsoidal region growing. In Proceedings of the Australasian Conference on Robotics and Automation (ACRA 09), Sydney, New South Wales, Australia, 2–4 December 2009.
  43. Golovinskiy, A.; Funkhouser, T. Min-cut based segmentation of point clouds. In Proceedings of the IEEE 12th International Conference on Computer Vision Workshops (ICCV Workshops), Kyoto, Japan, 27 September–4 October 2009; pp. 39–46.
  44. Ural, S.; Shan, J. Min-cut based segmentation of airborne lidar point clouds. ISPRS Int. Arch. Photogramm. Remote Sens. Spat. Inf. Sci. 2012, 1, 167–172. [Google Scholar] [CrossRef]
  45. Kim, K.; Shan, J. Building roof modeling from airborne laser scanning data based on level set approach. ISPRS J. Photogramm. Remote Sens. 2011, 66, 484–497. [Google Scholar] [CrossRef]
  46. Delong, A.; Osokin, A.; Isack, H.N.; Boykov, Y. Fast approximate energy minimization with label costs. Int. J. Comput. Vis. 2012, 96, 1–27. [Google Scholar] [CrossRef]
  47. Wu, S.-T.; Marquez, M.R.G. A non-self-intersection douglas-peucker algorithm. In Proceedings of the SIBGRAPI 2003 XVI Brazilian Symposium on Computer Graphics and Image, Brazil, 12–15 October 2003; pp. 60–66.
  48. Cramer, M. The dgpf-test on digital airborne camera evaluation–Overview and test design. Photogramm. Fernerkund. Geoinf. 2010, 2010, 73–82. [Google Scholar] [CrossRef] [PubMed]
  49. Rutzinger, M.; Rottensteiner, F.; Pfeifer, N. A comparison of evaluation techniques for building extraction from airborne laser scanning. IEEE J. Sel. Top. Appl. Earth Obs. Remote Sens. 2009, 2, 11–20. [Google Scholar] [CrossRef]
  50. Shan, J.; Lee, S.D. Quality of building extraction from ikonos imagery. J. Surv. Eng. 2005, 131, 27–32. [Google Scholar] [CrossRef]
  51. Awrangjeb, M.; Ravanbakhsh, M.; Fraser, C.S. Automatic detection of residential buildings using lidar data and multispectral imagery. ISPRS J. Photogramm. Remote Sens. 2010, 65, 457–467. [Google Scholar] [CrossRef]
  52. Estrada, F.J.; Jepson, A.D. Benchmarking image segmentation algorithms. Int. J. Comput. Vis. 2009, 85, 167–181. [Google Scholar] [CrossRef]
Figure 1. Workflow of plane segmentation using cross-line elements.
Remotesensing 08 00383 g001
Figure 2. Line segmentation in four directions.
Remotesensing 08 00383 g002
Figure 3. Seed CLE and neighbors of the cross-point.
Remotesensing 08 00383 g003
Figure 4. Points on CLE may not be on a plane.
Remotesensing 08 00383 g004
Figure 5. Cross-line element and its characteristic.
Remotesensing 08 00383 g005
Figure 6. Cross-point of CLE.
Remotesensing 08 00383 g006
Figure 7. Step one of CLE growth.
Remotesensing 08 00383 g007
Figure 8. Segmentation of roof points in Vaihingen. (a) complex roof; (b) with noise points; (c) with small planes.
Remotesensing 08 00383 g008
Figure 9. Segmentation of roof points in the Wuhan area. (a) normal structure; (b) complex structure; (c) symmetric structure.
Remotesensing 08 00383 g009
Figure 10. Segmentation of roof points in the Guangzhou area. (a) weak edge; (b) symmetric structure; (c) complex structure.
Remotesensing 08 00383 g010
Figure 11. Disadvantage of the proposed method.
Remotesensing 08 00383 g011
Figure 12. Segmentation results in the Vaighingen area using dataset (a).
Remotesensing 08 00383 g012
Figure 13. Segmentation results in the Wuhan area using dataset (b).
Remotesensing 08 00383 g013
Figure 14. Segmentation results in the Guangzhou area using dataset (c).
Remotesensing 08 00383 g014
Figure 15. Segmentation results in Vaighingen using dataset (d).
Remotesensing 08 00383 g015
Figure 16. Segmentation results in the Wuhan area using dataset (e).
Remotesensing 08 00383 g016
Figure 17. Segmentation results in the Guangzhou area using dataset (f).
Remotesensing 08 00383 g017
Figure 18. Segmentation results in the Guangzhou area using dataset (g).
Remotesensing 08 00383 g018
Figure 19. The influence of min line length. (a) Corresponding image; (b) l = 1.8 m, a narrow plane is missed; (c) l = 3.0 m, small planes are missed; (d) l = 4.2 m, more small planes are missed; (e) l = 6 m, a large plane is missed; (f) l = 7.2 m, more large planes are missed.
Remotesensing 08 00383 g019
Table 1. Descriptions of test data.
SiteVaihingenWuhanGuangzhou
Total area size2,320,000 m2127,636,898 m260,115,494 m2
Point density4 points/m28 points/m26 points/m2
Roof typeMostly gable roof with a large slopeFlat roof and gable roofFlat and gable roofs with a small slope
Scene typeUrban area with little treesUrban area with many treesUrban area with many trees
FeatureThe roofs are simpleThe roofs are complexThe slope of the roof is small
Used points3,911,9552,374,01815,597,504
Table 2. Parameters used in the comparison test.
ParameterValueMethods
Point to plane distance threshold d0.3 mRANSAC, Hough, RG_PAC, Global energy, and CLEG
Curvature threshold0.01RG_PCA and RG_IPCA
Minimum number of points required for a valid plane10RANSAC, Hough, RG_PCA, RG_IPCA, and Global energy
Line segmentation threshold ε0.25 mCLEG
Grid size0.6 mCLEG
Min line length l1.8 mCLEG
Table 3. Quality of the segmentation results in the Vaihingen area.
Time% Comp% Corr% RCL% DCL% BP% BR
(a)RANSAC0.016 s10085.7028.672.178.7
3D Hough59.795 s7537.575029.844.2
RG_PCA0.016 s10072.72501005.8
RG_IPCA0.015 s10088.912.5094.255.1
Global energy0.062 s10088.912.5084.981.6
CLEG<1 ms1001000097.793.7
(b)RANSAC0.046 s77.87008040.188.1
3D Hough244.329 s44.47.866.72.117.455.9
RG_PCA0.046 s10042.944.4041.138.4
RG_IPCA0.015 s10062.322.27.148.253.6
Global energy0.328 s10081.822.2083.484.0
CLEG<1 ms1001000087.583.4
(c)RANSAC0.016 s10087.514.312.560.487.1
3D Hough84.038 s71.427.857.15.620.548.9
RG_PCA0.031 s1001000084.88
RG_IPCA0.015 s85.7100016.750.951.4
Global energy0.078 s85.7100016.771.560.3
CLEG<1 ms1001000084.386
Table 4. Quality of segmentation results in the Wuhan area.
Time% Comp% Corr% RCL% DCL% BP% BR
(a)RANSAC<1 ms100100033.319.363.4
3D Hough136.376 s33.39.166.741.73.710.1
RG_PCA0.031 s1007533.304065.6
RG_IPCA0.015 s1007533.333.326.668.3
Global energy0.047 s1001000077.575.4
CLEG<1 ms1001000087.184.7
(b)RANSAC0.827 s15.426.7073.317.760.2
3D Hough1434.733 s46.213.45014.116.754.9
RG_PCA0.063 s1005234.6028.323.2
RG_IPCA0.201 s10086.73.83.364.161.9
Global energy2.325 s10088.907.473.370.6
CLEG0.015 s1001000092.791.3
(c)RANSAC0.016 s10071.4028.534.066.1
3D Hough161.929 s6011.18044.418.361.1
RG_PCA0.031 s10035.760029.252.9
RG_IPCA0.016 s10055.660046.571.3
Global energy0.109 s10083.320065.671.7
CLEG<1 ms1001000088.887.8
Table 5. Quality of segmentation results in the Guangzhou area.
Time% Comp% Corr% RCL% DCL% BP% BR
(a)RANSAC0.047 s23.137.515.45020.062.6
3D Hough556.970 s61.514.376.912.517.554.5
RG_PCA0.110 s84.691.78.7075.421.4
RG_IPCA0.031 s84.668.88.7069.359.0
Global energy0.842 s84.678.68.7078.072.0
CLEG0.016 s1001000086.080.9
(b)RANSAC0.016 s5051.4028.662.877.8
3D Hough610.557 s5044.42522.218.99.2
RG_PCA0.078 s10038.137.5066.258.8
RG_IPCA0.047 s754012.56.783.157.0
Global energy0.374 s1001000086.077.8
CLEG<1 ms1001000095.596.9
(c)RANSAC0.047 s9.114.3010017.157.8
3D Hough866.773 s18.23.645.516.415.350.5
RG_PCA0.078 s63.653.818.216.474.129.8
RG_IPCA0.046 s10084.69.115.440.638.9
Global energy0.374 s1001000074.573.6
CLEG0.015 s1001000085.687.0
Table 6. Parameters used in the comparison test.
ParameterValueMethods
Point to plane distance threshold d0.3 mRG_IPCA, CLEG
Curvature threshold0.01RG_PCA, RG_IPCA
Minimum number of points required for a valid plane20RG_PCA, RG_IPCA
Line segmentation threshold ε0.25 mCLEG
Grid size0.6 mCLEG
Min line length l1.8 mCLEG
Table 7. Computation time in the comparison test.
DatasetAreaNumber of PointsRG_PCARG_IPCACLEG
(a)Vaihingen321,95670.054 s1.482 s0.468 s
(b)Wuhan298,666255.170 s2.356 s0.499 s
(c)Guangzhou174,83015.616 s0.780 s0.187 s
(d)Vaihingen3,582,656-17.691 s6.272 s
(e)Wuhan2,058,844-10.203 s2.948 s
(f)Guangzhou3,091,547-15.116 s8.580 s
(g)Guangzhou12,305,250--58.126 s

