Article

Impact of Land Cover Changes on the Availability of Water Resources in the Regional Natural Park Serranía de Las Quinchas

by
Yuddy Alejandra Castro Ortegón
1,2,*,
Julio César Acosta-Prado
3 and
Pedro Mauricio Acosta Castellanos
4
1
School of Accounting, Economic and Business Sciences, Universidad de Manizales, Manizales 170001, Colombia
2
Environmental Engineering Faculty, Universidad Santo Tomás, Tunja 150003, Colombia
3
School of Business Science, Universidad del Pacífico, Lima 15072, Peru
4
Civil Engineering Faculty, Universidad Santo Tomás, Tunja 150001, Colombia
*
Author to whom correspondence should be addressed.
Sustainability 2022, 14(6), 3237; https://doi.org/10.3390/su14063237
Submission received: 22 November 2021 / Revised: 12 January 2022 / Accepted: 19 January 2022 / Published: 10 March 2022
(This article belongs to the Special Issue Multi-Temporal Analysis of Landscapes and Urban Areas)

Abstract

:
Protected areas offer environmental goods and services to local communities, who have based their aptitude on the availability of water resources with practices associated with the legacy of their ancestors. The purpose of this paper is to evaluate the impact of changes in land cover on the availability of water resources in the Serrania de Las Quinchas Regional Natural Park (PNRSQ), located in the department of Boyacá, Colombia. The SWAT tool and the Corine Land Cover methodology were used between 2008 and 2017. In addition, data of hydrometeorological tests were used to determine the water behavior of the basin together with the Digital Elevation Model (DEM). The results show that after the declaration of the area as a protection zone in 2008, there have been changes in the land cover producing a greater availability of water resources and the partial restoration of the study area. Additionally, hydrological modeling allowed knows the behavior of the basin under different conditions. The resulting information allows decision-makers to evaluate the best options to guarantee water resources and generate strategies that allow communities to reinvent their way of production and adapt to ecosystem conditions without affecting their ecological functioning.

1. Introduction

Protected areas allow the conservation of the unique biodiversity of the environment, allowing ecological interaction between flora and fauna, constituting an environmental heritage, which is understood as a collective heritage that allows, through a symbolic character, to represent the identity and generate a social construction [1,2]. These protection zones allow the structuring of environmental heritage and the unification of social and environmental aspects, promoting the socio-environmental heritage, which is a strategic factor to balance the conservation and use of natural resources and respect for the cultural dynamics of the environment [3,4].
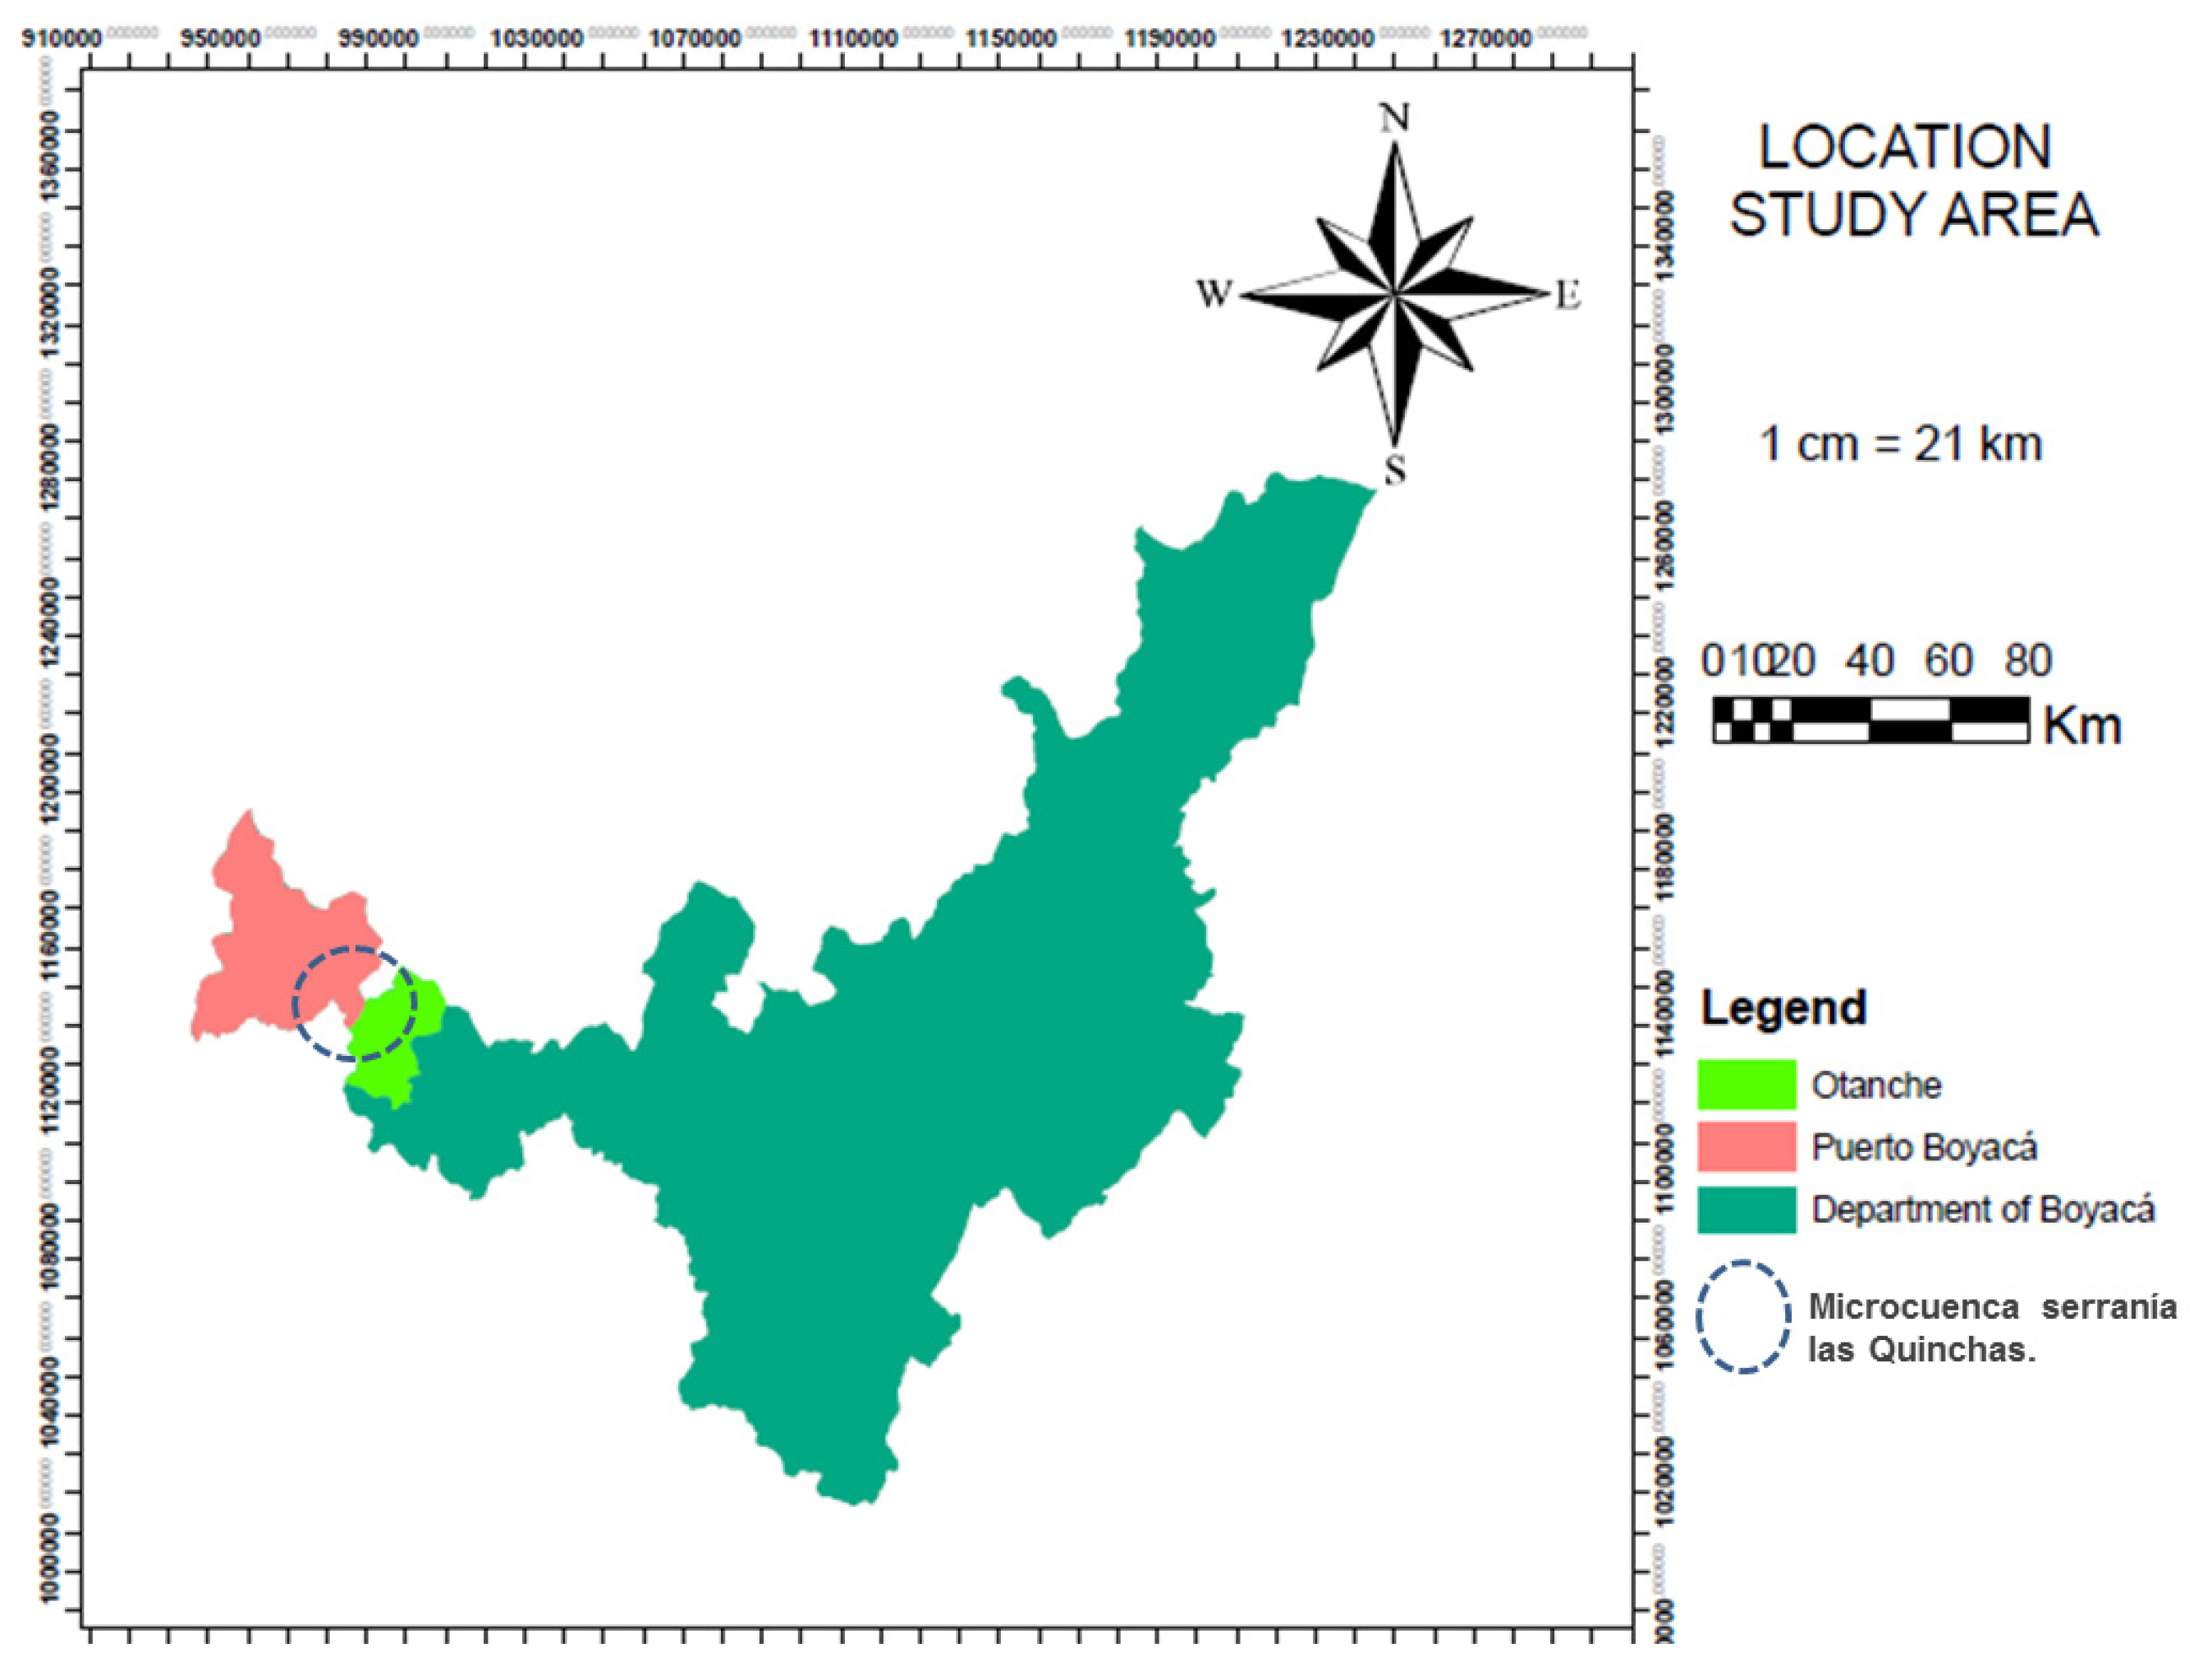
Among the protected areas in Colombia is the Serra-nía de Las Quinchas Regional Natural Park (PNRSQ), which was declared in 2008 by the Autonomous Corporation of Boyacá (CORPOBOYACÁ) through agreement No. 0028, as a reserved area, to protect its environmental wealth in perpetuity [5]. This protected area is strategic because it allows the maintenance of environmental goods and services and the conservation of the biodiversity of Magdalena Medio, the only remnant of humid tropical forest in the Department of Boyacá [6]. However, many rural sectors present limitations in developing economic activities at the national level due to the lack of strategies and territorial planning generation. Such is the case of the areas located around protected areas such as the PNRSQ, where there is a marked limitation in implementing traditional economic activities [7].
In this context, it is determined that protected areas offer environmental goods and services to local communities, which have based their aptitude for use on practices that are not allowed, since, throughout the conformation of their social structures, these practices have been the legacy of their ancestors [7,8]—directly affecting natural resources within protected areas and disrupting their ecological functioning within the system.
In addition, hydrological modeling allows knowing the behavior of the basin under different conditions. The resulting information allows decision-makers to evaluate the best options to guarantee water resources and generate strategies that allow communities to reinvent their way of production and adapt to ecosystem conditions without affecting their ecological functioning.
In order to identify how conservation strategies affect the availability of water resources to reduce the effects, it is proposed to reinvent the form of production in these protected areas. Promoting the term of local economic dynamization that seeks to restructure the way of production to adapt communities to a new way of acquiring their economic income in a sustainable way, the purpose of which is to reduce rural poverty and increase the wealth of the territory without negatively affecting the environment [9,10].
Based on the previous, the objective of this research is to evaluate the impact of changes in land cover on the availability of water resources in the buffer zone of the PNRSQ, using the ArcSWAT Ver. 2012.10.3.19 (Soil and Water Assessment Tool) model as a methodology. It was chosen within different Softwares for its efficiency since it is in charge of predicting the impact of soil management practices on water resources and sediments, facilitating the analysis of the soil-water relationship, allowing the behavior to be analyzed. Watershed was after the declaration established by Corpoboyacá in 2008.

2. Literature Review

Watersheds are essential means of agricultural production [11,12]. Unfortunately, most of them in Latin America do not have territorial organization actions, directly affecting the availability and distribution of natural resources, particularly water resources [13]. Land-use change models are tools for analyzing the causes and effects of land-use dynamics [14,15].
Tools (hydrological models) help decision-making territory within a basin [16]. For hydrological modeling, different software allows evaluating the hydric behavior. For example, this HEC HMS tool simulates dendritic hydrographic basin systems [17]. There is also the program TETIS, which is responsible for hydrological simulation in natural basins, taking into account the different physical processes involved and using conceptual distributed modeling [18]. Another software is the HECRAS modeling tool in hydraulic engineering; the use is aimed at the one-dimensional and two-dimensional hydraulic modeling of free sheet flow in natural and artificial channels [19].
In the same way, the IBER 2.4 software is a two-dimensional mathematical model responsible for the simulation of free flow and transport processes in rivers and estuaries [20]. Another software is iRIC, which allows it to measure the flow simulation in rivers and analyze the river bed variation [20]. Finally, the MODFLOW tool is also a three-dimensional model of groundwater by finite differences developed by the United States Geological Survey (USGS), capable of simulating groundwater flow in two or three dimensions and simulating the main physical processes related to the groundwater [21].
The Free Software in Water Resources Management is SWMM, an EPA stormwater management model (SWMM) used worldwide for planning, analysis, and design related to stormwater runoff, combined and sanitary sewers, and other drainage systems in urban areas. Finally, the SWAT software tool allows evaluating the soil and water at the basin level; this software emphasizes the modeling of precipitation-runoff and the transport of water and solutes through the surface, in charge of predicting the impact of soil management practices on water resources and sediments.
This latest SWAT software allows evaluating the relationship of changes in land cover with the availability of water resources, which allows the study of changes in land cover to give indications of the phenomena that give rise to climate change and the availability of water resources [22,23]. Recently, national and international research has been carried out on the possible relationships between changes in land cover, land use, and climatic variations about the availability of water resources [24,25]. According to the literature review, the main antecedents are highlighted to understand better the impact of land cover changes on the availability of water resources and show what methodologies are implemented for said analysis [26,27].
There are different studies, such as that of Cabascango [28], which through research analysis, constructed a trend and restrictive scenario of changes in land use for the Santa Inés micro-basin, Honduras. In addition, it carried out a water modeling to determine the configuration end of the land use categories of both scenarios for the period 2015–2035, using the CLUE methodology, analyzing the gains, losses, net, and total changes for each scenario using a cross-tabulation matrix. The results for the projection to 2035 under the trend scenario indicate that coffee and pastures were the categories that reported the highest gains; the restrictive scenario in this study allowed prioritizing actions for the conservation of water resources [28].
Other studies, such as that of Peter Riad et al. [29], allow us to analyze the fields and applications of land use analysis. This study investigated changes in land use from the 1970s to 2018 in cities Luxor and Cairo in Egypt and Aqaba and Amman in Jordan using different Landsat datasets. Land cover classifications were performed using a maximum likelihood algorithm and spectral angle mapping. In all four cities, peri-urban green areas were reduced or changed due to further expansion of built-up areas. The most significant reductions in peri-urban green areas were observed in Amman and Luxor, which decreased by 122.4 km2 and 17.2 km2, respectively, during the study period.
The research carried out by Aumassanne [30] was also found, which evaluates the relationship to the change in soil cover and the availability of water resources in the Colorado river basin in Argentina between 2000 and 2015. The results showed that snow cover has decreased towards the end of the period studied and has less permanence in the months of autumn, winter, spring; it was also determined that the runoff of the Colorado River has decreased. Its electrical conductivity has increased in recent years. The water balances for alfalfa and corn crops, at the plot scale, showed a high demand for water by the crops, associated with high atmospheric demand and low soil retention [30].
On the other hand, there is the research carried out by Jiménez [31], in which the use of geographic information systems (GIS) was implemented in order to analyze the changes in land cover that the Rabanal Río Bogotá páramo has had and its condition in the face of climate change scenarios using GIS. This was carried out in 2017 through three (3) phases, in the first one the predominant land cover was identified in three time periods: 2000 to 2002, 2005 to 2009 and 2010 to 2012, in the second the changes in soil cover were analyzed in two periods 2000 to 2005 and 2005 to 2010, showing that the coverage of Dense Dry Herbazal of the páramo ecosystem itself has increased in the Páramo Ra- banal-Río Bogotá, in the third phase, the condition of the páramo was analyzed against the climate change scenarios, specifically against the variables of temperature and precipitation in the period from 2011 to 2040. The results show an increase of 20% of the current precipitation values in the area of the source of the Bogotá River and an increase in temperature throughout the study area [31].
Other authors, such as Pulido-Quintero, and Ivanova [32], focused their research on the Chinchina River in the Caldas-Manizales department. Using the ArcGIS maximum likelihood algorithm, they implemented geospatial information as satellite images. They determined the land covers present in the study area; land cover dynamics directly affect the basin’s water regulation capacity results in a decrease in water regulation due to the expansion of herbaceous and pasture covers. The growth of forest cover does not compensate for the expansion of the first two coverages [32].
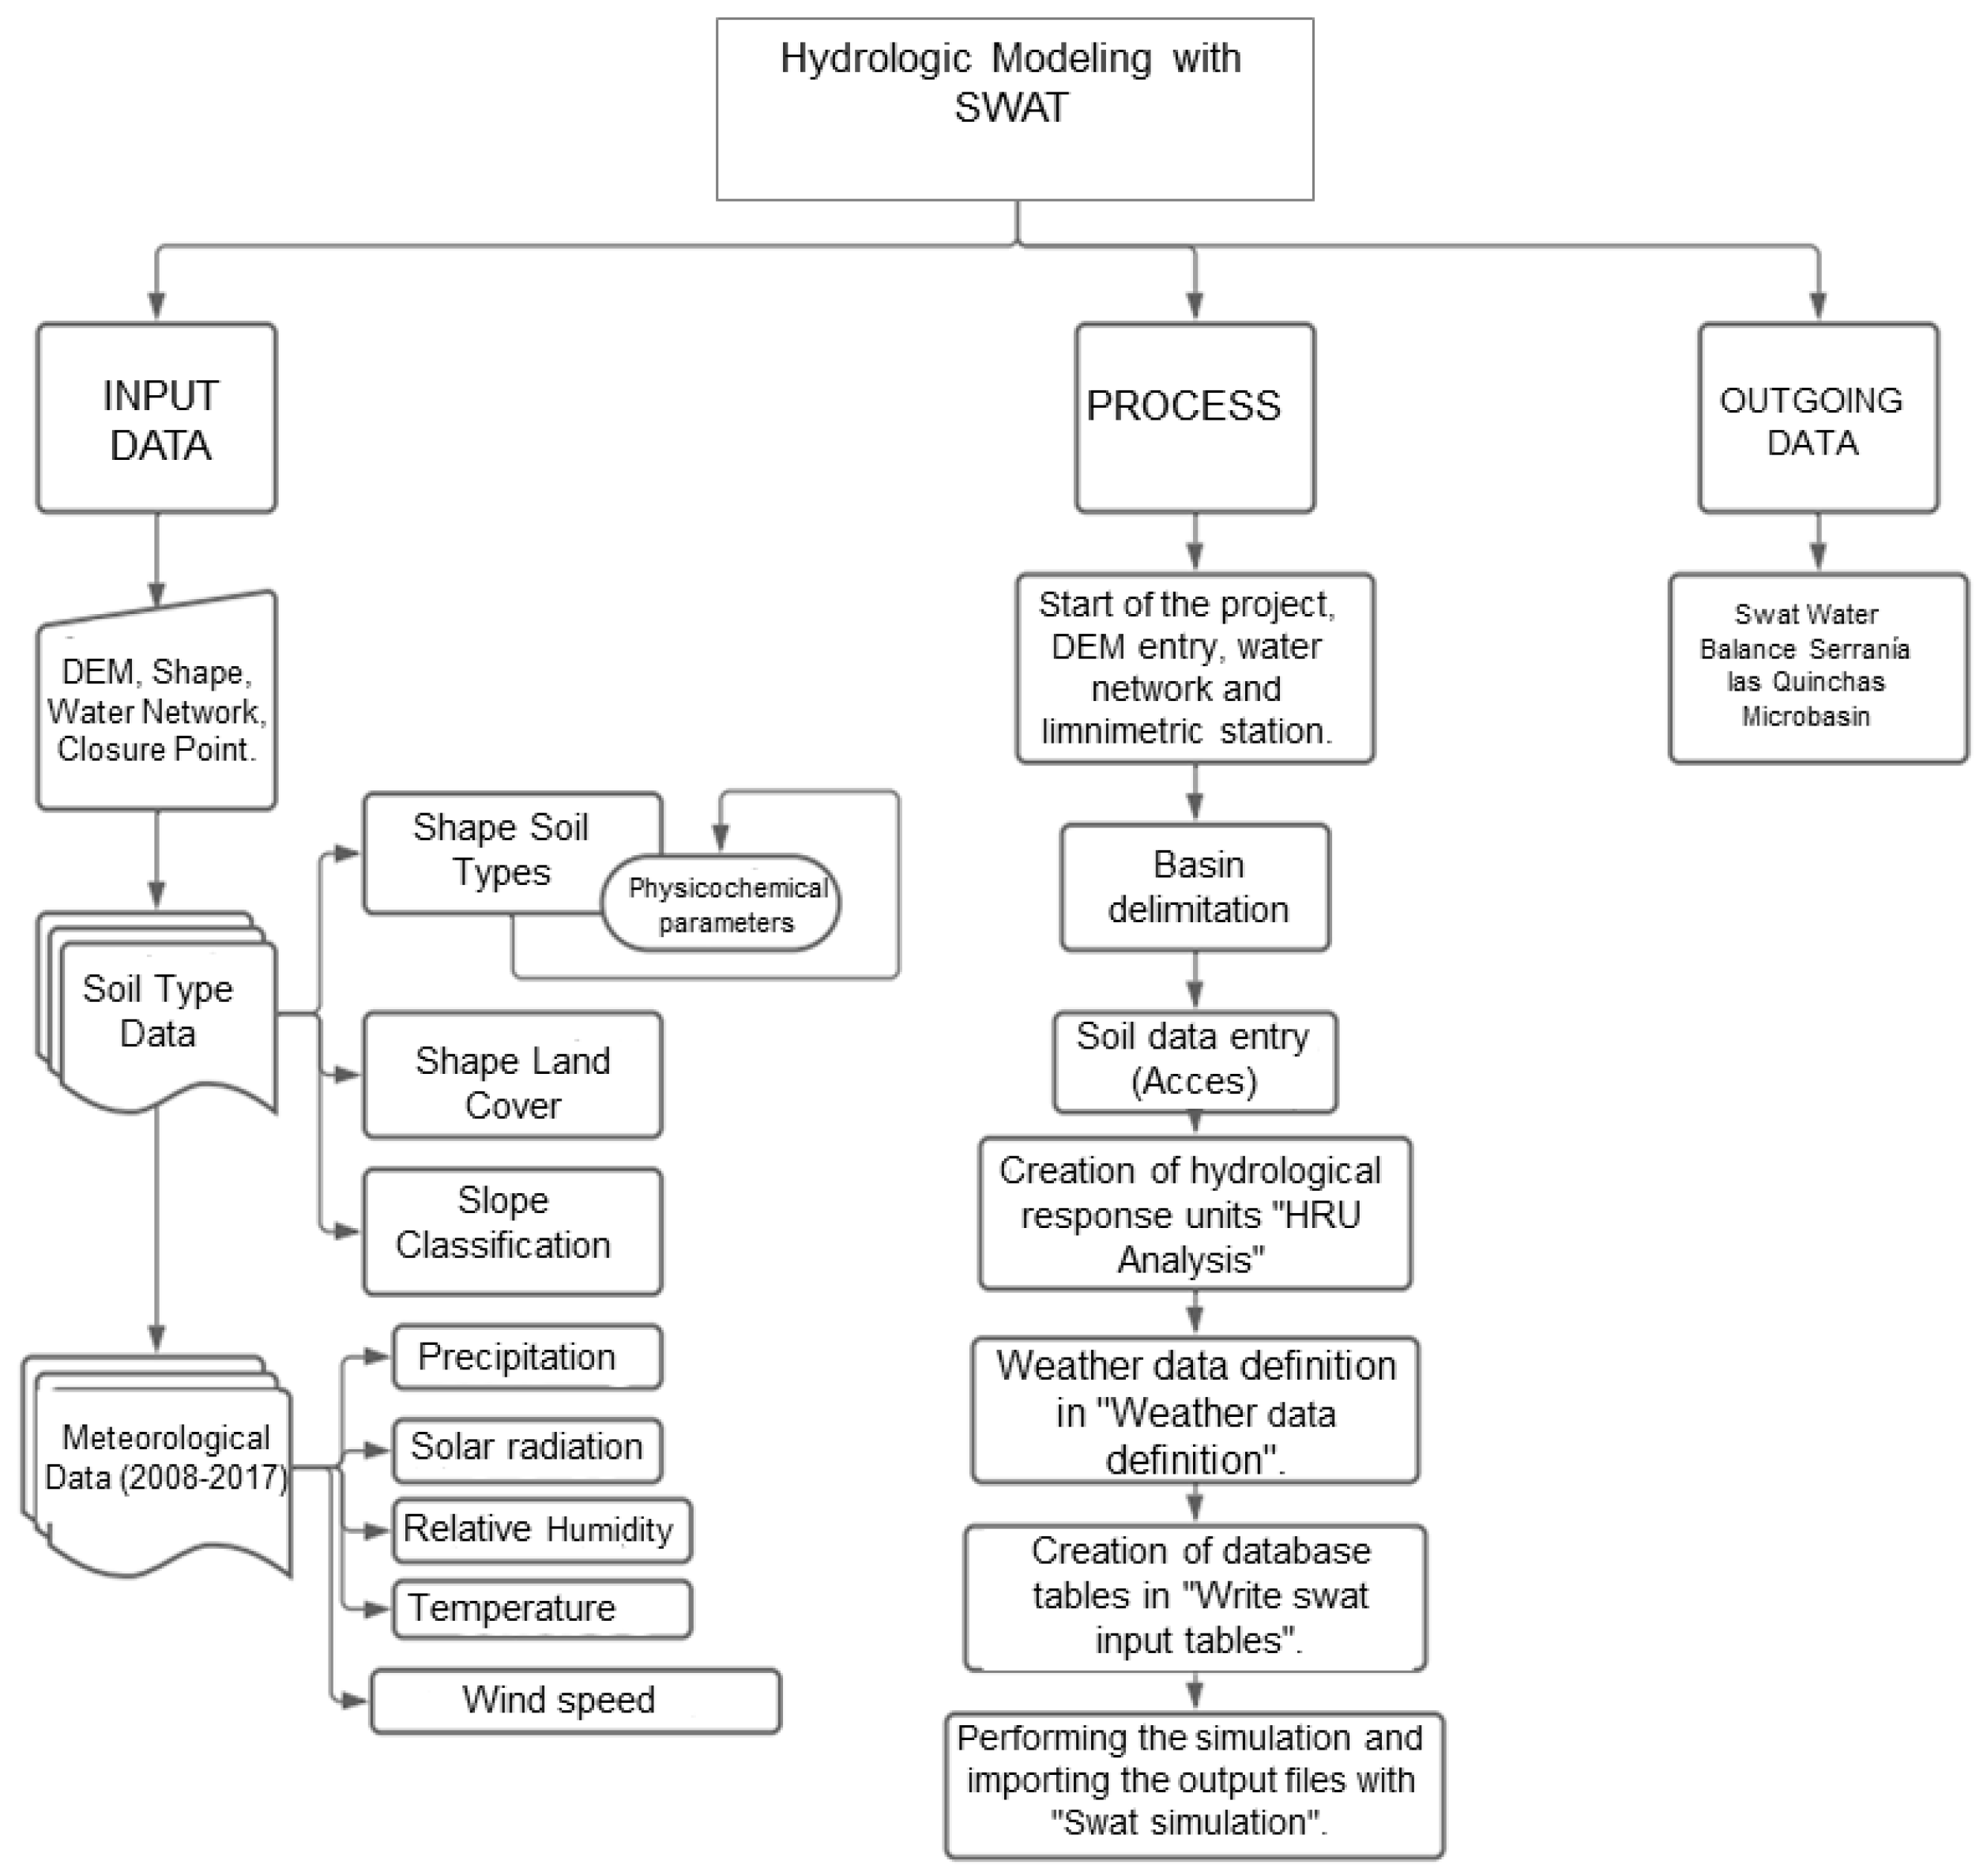
The information analyzed and the types of hydrological models can be implemented since the research focused on analyzing the impact of changes in coverage of the water resource after the declaration generated by Corpoboyacá in 2008. The SWAT (Soil and Water Assessment Tool) software was chosen since it is a hydrological model with wide global applications and complex basins. It is free software that models the hydrological cycle taking into account multiple variables of the territory such as: (Precipitation, temperature, relative humidity, solar radiation, and wind speed). It is a support tool for the comprehensive planning of basins, guaranteeing the sustainable development of communities, and this software allows evaluating the soil-water resource relationship.
Some benefits of its application are: (1) It provides vital and reliable information to guide conservation and reforestation initiatives such as water factories; (2) It allows evaluating the impacts of land-use change on flows and sediments; (3) It makes it possible to identify sub-basins and micro-basins with greater sensitivity to various scenarios (conservation, degradation, climate change scenarios, among others); (4) It allows entering information such as (slope, relief, soil, coverage, and current land use, to be entered into a georeferenced database, including multiple environmental information to model it; (5) It models the hydrological behavior along time (it works better with the analysis of several years); (6) It is an efficient model since it has a complete database that allows some variables to be missing when performing the hydrological modeling, which is replaced by the base of data that SWAT has according to the type of soil being analyzed.
This study also aims to promote protected areas in Colombia, especially in Boyacá. It shows the benefits of the biotic aspect, which are generally the most notorious and studied, and the abiotic factors that are not common in research in these areas. This specific case was researched, such as changes in land cover due to its protection through declarations of natural parks affecting the availability of water resources. This in turn generates a positive impact on other ecosystem factors, helping their preservation and efficient loan of services to the human communities found in these areas.

3. Overview

3.1. SWAT Model

Soil and Water Assessment Tool—SWAT is a tool for assessing soil and water in a watershed as a whole. Dr. Jeff Arnold developed it at the United States Department of Agriculture with the University of Texas in the 1990s [33]. This tool predicts the impact of land management on water, sediment, and chemical response. In addition, it models physical processes related to water movement, sediment movement, crop development, nutrient cycling, among others. According to Urrutia [34], among the benefits of the model is that ungauged watersheds can be simulated, and the impact of management practices, climate, and vegetation can also be quantified.
The simulation can be performed without investing much time and allows the study of long-term impacts. The model requires specific information about climate, soils, topography, vegetation, planning practices in the watershed [35]. It has the function of enhancing the water balance that is the driving force behind everything within the watershed. The model divides the watershed into sub-basins. Each is divided into hydrographic response units with homogeneous land use/land cover and slope properties [36]. SWAT has been used in approximately 100 countries and has helped understand the ecosystem complex regarding water availability and quality, climate change, and agricultural production problems worldwide [37].

3.2. Study Area

The micro-basin is located within the PNRSQ, located in Otanche and Puerto Boyacá, in Boyacá, Colombia as shows in Figure 1. This micro-basin is located both in the buffer and protection zone of the reserve. Therefore, it is a strategic place to evaluate the hydrological response of the reserve. In addition, it will consider some parameters of neighboring stations to be analyzed and modeled by the SWAT tool from ArcGis.

4. Materials and Methods

As a methodology, the SWAT model was implemented. The data collection began to obtain the data of the variables to be evaluated in this case (daily precipitation, maximum temperature, minimum temperature, relative humidity, wind, and solar radiation). All data were taken in daily values, and a database was made for each variable in “txt” format. The delimitation of the study area was carried out by closing the basin; the Limnimetric station adjacent carried this out to the study area to make the soil analysis. The map of the existing types of soils in the study area was carried out, as were the calculated physicochemical parameters. Then, the analysis of the coverage of the study area was carried out through the corine land cover methodology, Figure 2; each of the processes carried out in detail is described below.

4.1. Primary Data Review

To start with the information collection, we began with a detailed review of the existing daily historical data from the Institute of Hydrology, Meteorology and Environmental Studies (IDEAM). Data was collected on flow, precipitation, relative humidity, temperature, solar brightness, and wind speed from the PNRSQ micro-basin stations. The 2017 Digital Elevation Model (DEM) was downloaded through the ASF Data Search platform, a supply that allowed delimiting the basin and analyzing sub-basins. There, essential bibliography was implemented, such as the Boyacá soil zoning study, Shapes of the Agustín Codazzi IGAC geographic institute (Shape Soil types of Boyacá), to verify the existing information on land-use conflicts and affectations on the water resource in the micro-basin.

4.2. Delimitation of the Study Area

After selecting the DEM of the year 2017, at a spatial resolution of 12.5 m, Figure 3, with the Puerto Romero limnometric station, taking it as the closure point and the water network in shape format. It was entered into the ArcGIS program to perform a re-projection of coordinates to the Colombia Bogotá Zone Reference System and the SWAT hydrological tool. The closure of the micro-basin was performed Figure 3, obtaining the area of the micro-basin, the direction and accumulation of flows, sections of the main river, and the geomorphological parameters.

4.3. Preparation of SWAT Model Input Data

4.3.1. Hydrometeorological Data Processing

With the daily hydrometeorological data collected from the stations shown in Table 1 collected by the IDEAM platform, the information on flows, precipitation, relative humidity, temperature, solar radiation, and wind speed was organized, taken from 2008 for each station up to 2017. In this sense, the quantity and quality of the information for each year were verified, managing a total of 3303 input data for each parameter (solar radiation, precipitation, maximum and minimum temperature, wind speed). Furthermore, since the precipitation data were mainly found, the rational method was implemented to validate the information, using three base stations: Puerto Niño, Trinque El, and Puerto Libre, where the stations were implemented (Table 1).

4.3.2. Land Processing

For the collection of soil information, the soil map of the Department of Boyaca was implemented at a scale of 1:100,000 in Shapefile (SHP) format, containing information on the landscape, climate, relief type, lithology, soil characteristics, taken from the IGAC Geoportal and processed in ArcGIS software as shown in Figure 4.
Regarding the physicochemical parameters of the soil types determined for the basin, the following were considered: the profile, soil type, maximum rooting depth, porosity fraction, soil profile volume, profile texture, depth, bulk density, and percentage of rock, percentage of sand, percentages of clay and silt. This information was collected from the 2005 general soil and land zoning study of the Department of Boyacá [38]. The hydrological group of each profile by soil type was determined using the NumCur program MP4; 9 MB; year 2012.
Other variables that were also considered were: available water in the soil (Available Water), saturated hydraulic conductivity (Sat. Hydraulic Cond), and bulk density of the soil (Matric Bulk Density), which was determined from the percentage of sand (Sand), percentage of clay (clay) and percentage of organic matter, with the program Soil Water Characteristics version 6.02.74. Additionally, it was determined with the percentage of sand and clay of each type of soil found in the basin.
To determine soil albedo, we used Equation (1) proposed by Baumer in 1990 [39] as a function of organic matter Equation (2). The percentage of organic matter is related to organic carbon and the Van Bemmelen factor of 1.724.
A = 0.6 / ( e x p ( 0.4 × O M ) )
A: Soil albedo.
Organic Mater (OM) (%): Soil organic matter.
O r g a n i c   M a t t e r   ( % ) = % C .   o r g × 1.724  
%C.org: Percentage of organic carbon.
The soil erodibility factor K was calculated using the equation proposed by Williams in 1995 (Equation (3)).
K U S L E = f c s a n d × f c l s i × f o r g c × f h i s a d
fcsand: Factor that gives low soil erodibility for soils with high coarse sand content and high erodibility values for soils with little sand (Equation (4)).
fcl-si: Factor giving low soil erodibility values for soils with high clay or silt content (Equation (5)).
forgc: Factor that reduces soil erodibility for soils with high organic carbon content (Equation (6)).
fhisad: Factor that reduces soil erodibility for extremely high sand content (Equation (7)).
f c s a n d = ( 0.2 + 0.3 e x p   e x p   [ 0.256 × m s × ( 1 m s l i t / 100 ) ] )
ms: Percentage of sand.
msilt: Percentage of silt.
f c l s i = ( m s i l t × m c + m s i l t ) ^ 0.3
mc: Percentage of clay.
msilt: Percentage of silt.
f o r g c = ( 1 ( 0.0256 × o r g C ) / ( o r g C + e x p   e x p   [ 3.72 2.95 × o r g C ] ) )
orgC: Percentage of organic carbon.
f h i s a d = ( 1 ( 0.7 × ( 1 m s / 100 ) ) / ( ( 1   m s / 100 + e x p [ 5.51 + 22.9 × ( 1   ms / 100 ) ) )
ms: Percentage of sand.
As for the parameter’s porosity fraction and maximum volume of rupture of the soil profile, a value of 0.5 established by SWAT was adapted since we did not have its values. After defining the soils (Table 2), their required physicochemical parameters (Table 3), and processing the shape in ArcGIS, a value was assigned to each soil type in the attribute table to identify them later. Likewise, the soil types of the map were correlated with the SWAT database from a * txt with the “value” and the “name” of the soil and a modification to the access in the “usersoil” category of the “SWAT2012” file, to configure in the study area since SWAT only includes data of soils from the United States.

4.3.3. Hedge Processing

For the determination of coverages of the micro-basin of the mountain ranges, they were determined from the Corine Land Cover methodology where the IDEAM coverages manual [40] was considered, and the corresponding area was determined for each coverage Figure 5 and Table 4.
After classifying the types of cover in the area, the classification was carried out according to the codes used by SWAT (Table 5), using the manual and Annex 1 of the Soil and Water Assessment Tool (SWAT) program as a guide.
Using the ArcGIS a Value was assigned in the table of attributes by coverage by passing it to * txt format to relate the land uses of the map with the SWAT database considering the “value” and the land use “LandUse” according to the order of the table of attributes to be subsequently entered into the model. On the other hand, to define the slopes of the micro-basin, the slope classification adapted by the IGAC was used according to the slope range, establishing five classes as shown in Table 6.

4.3.4. SWAT Model Application

Subsequently, the methodological diagram describes data preparation and information modeling for 2008 to 2017 with the Corine Land Cover and SWAT methodology (Figure 6).

5. Results

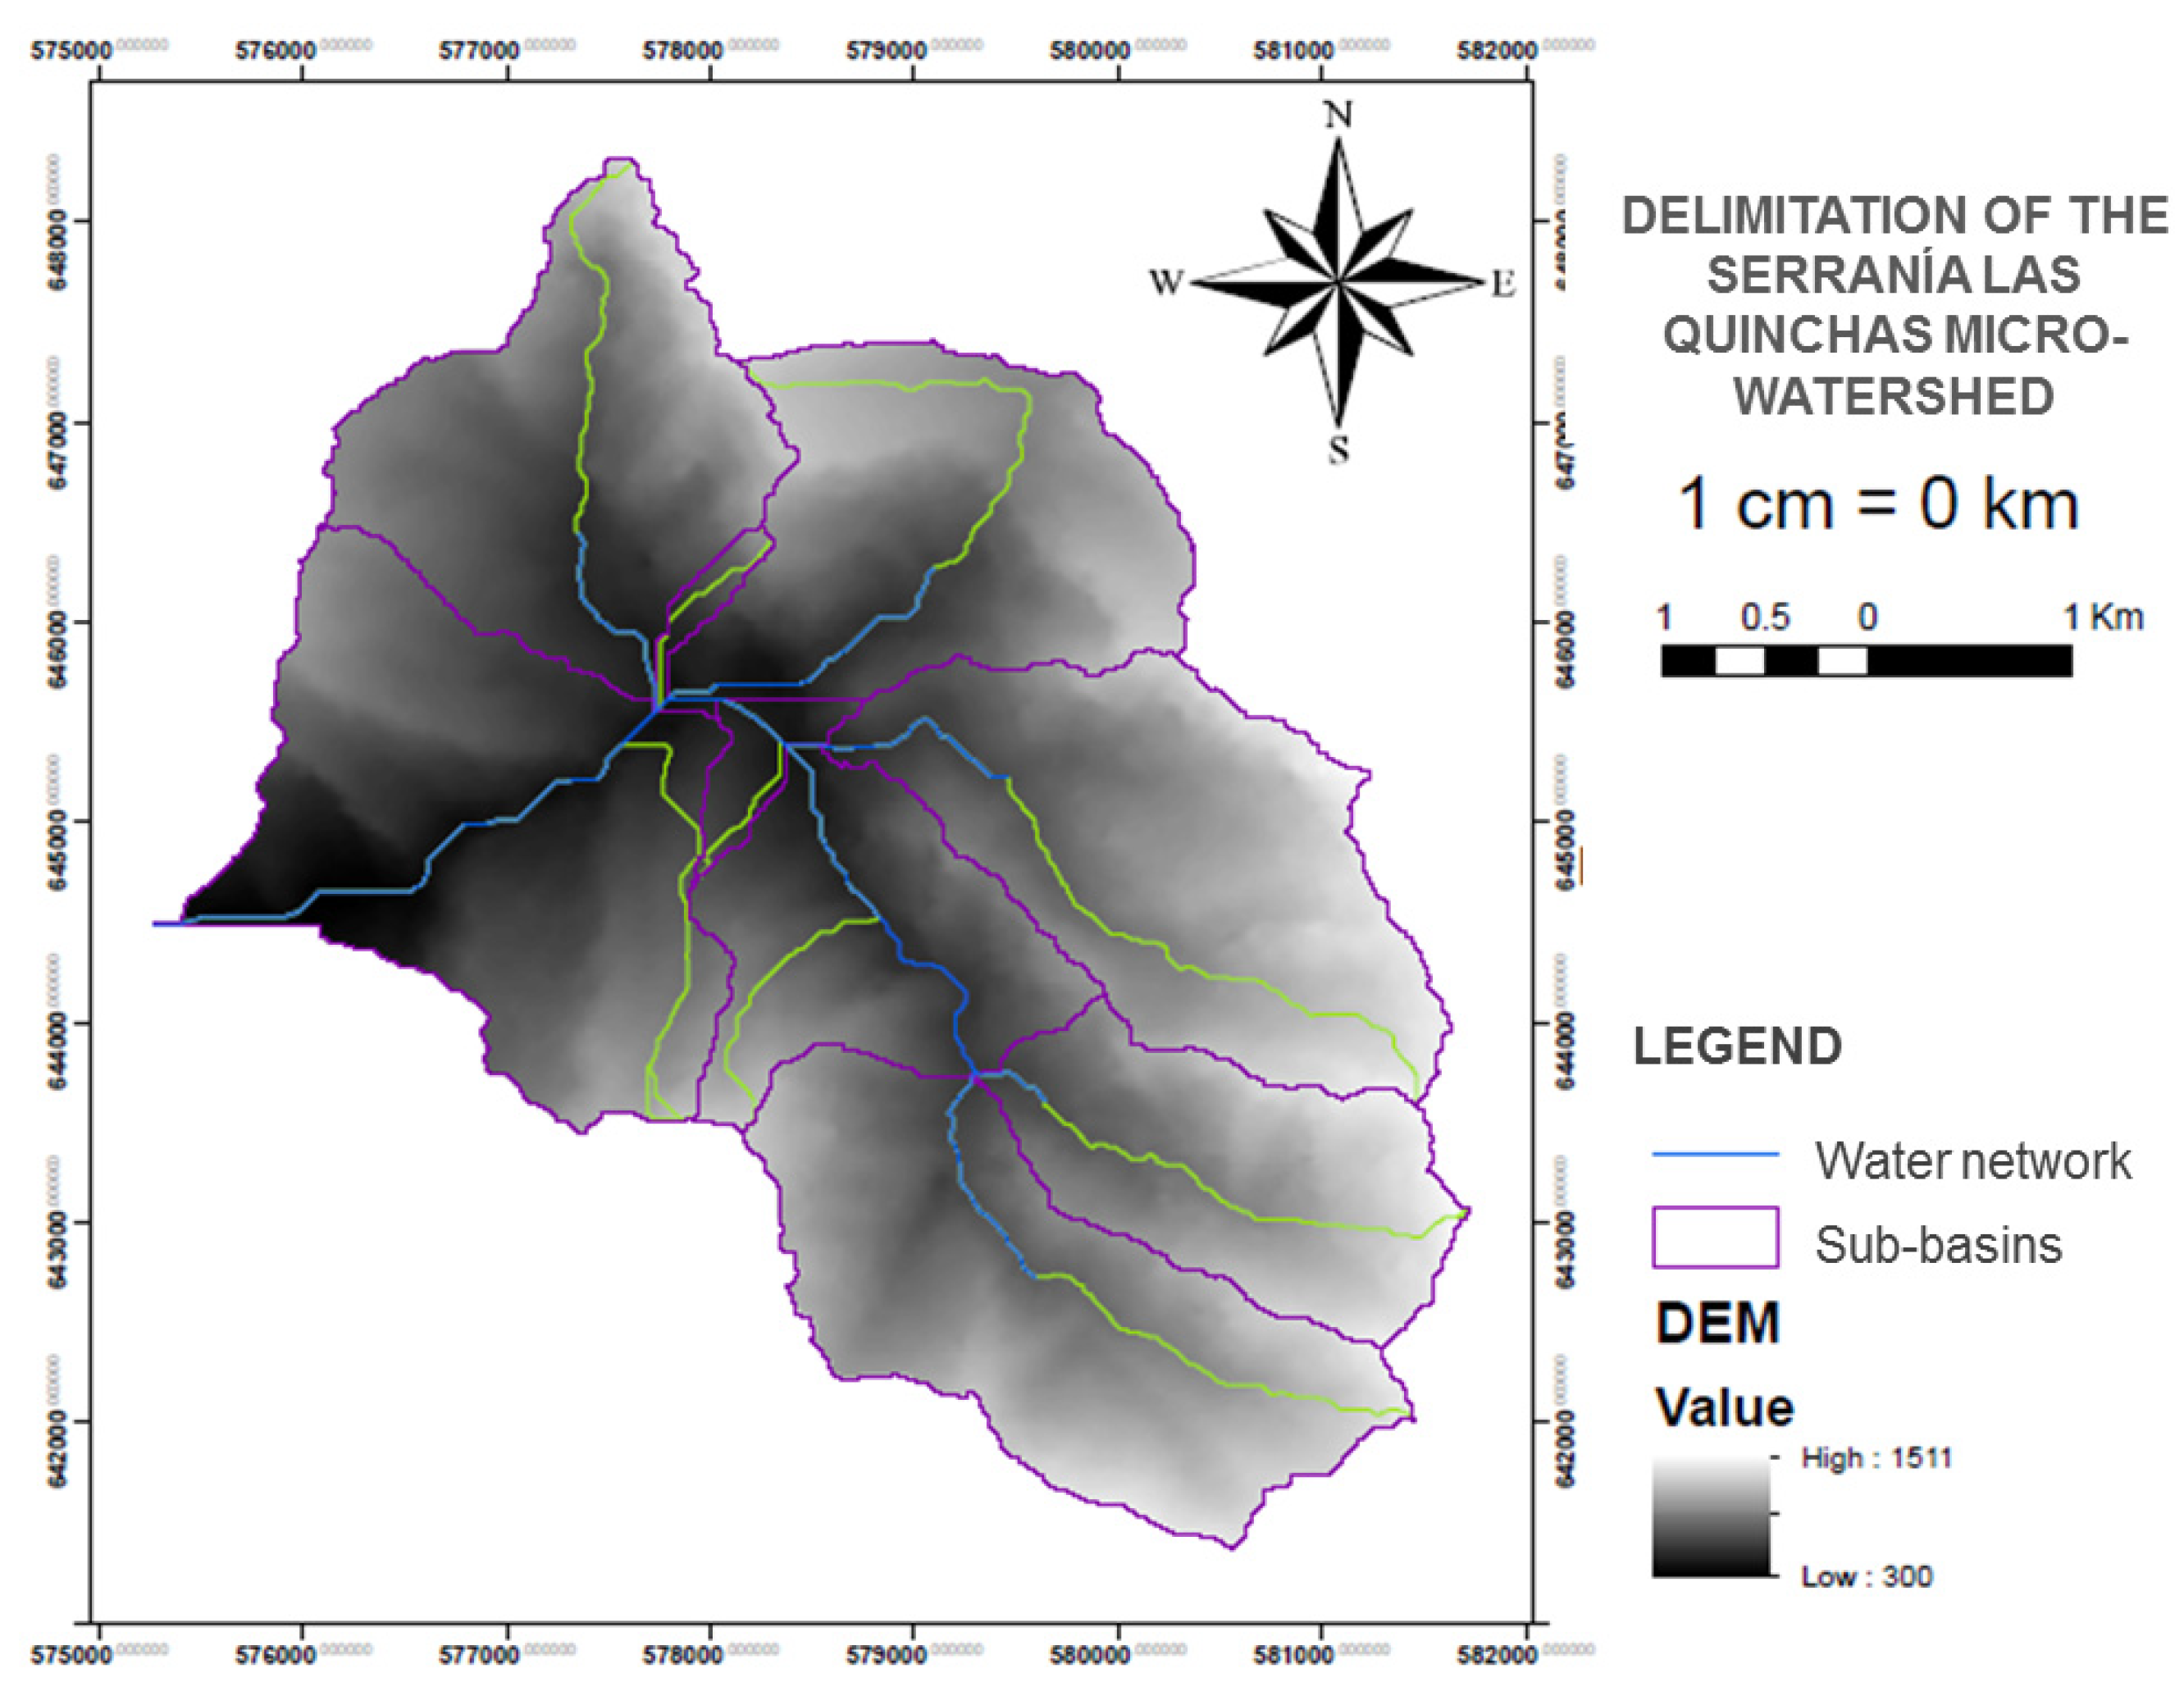
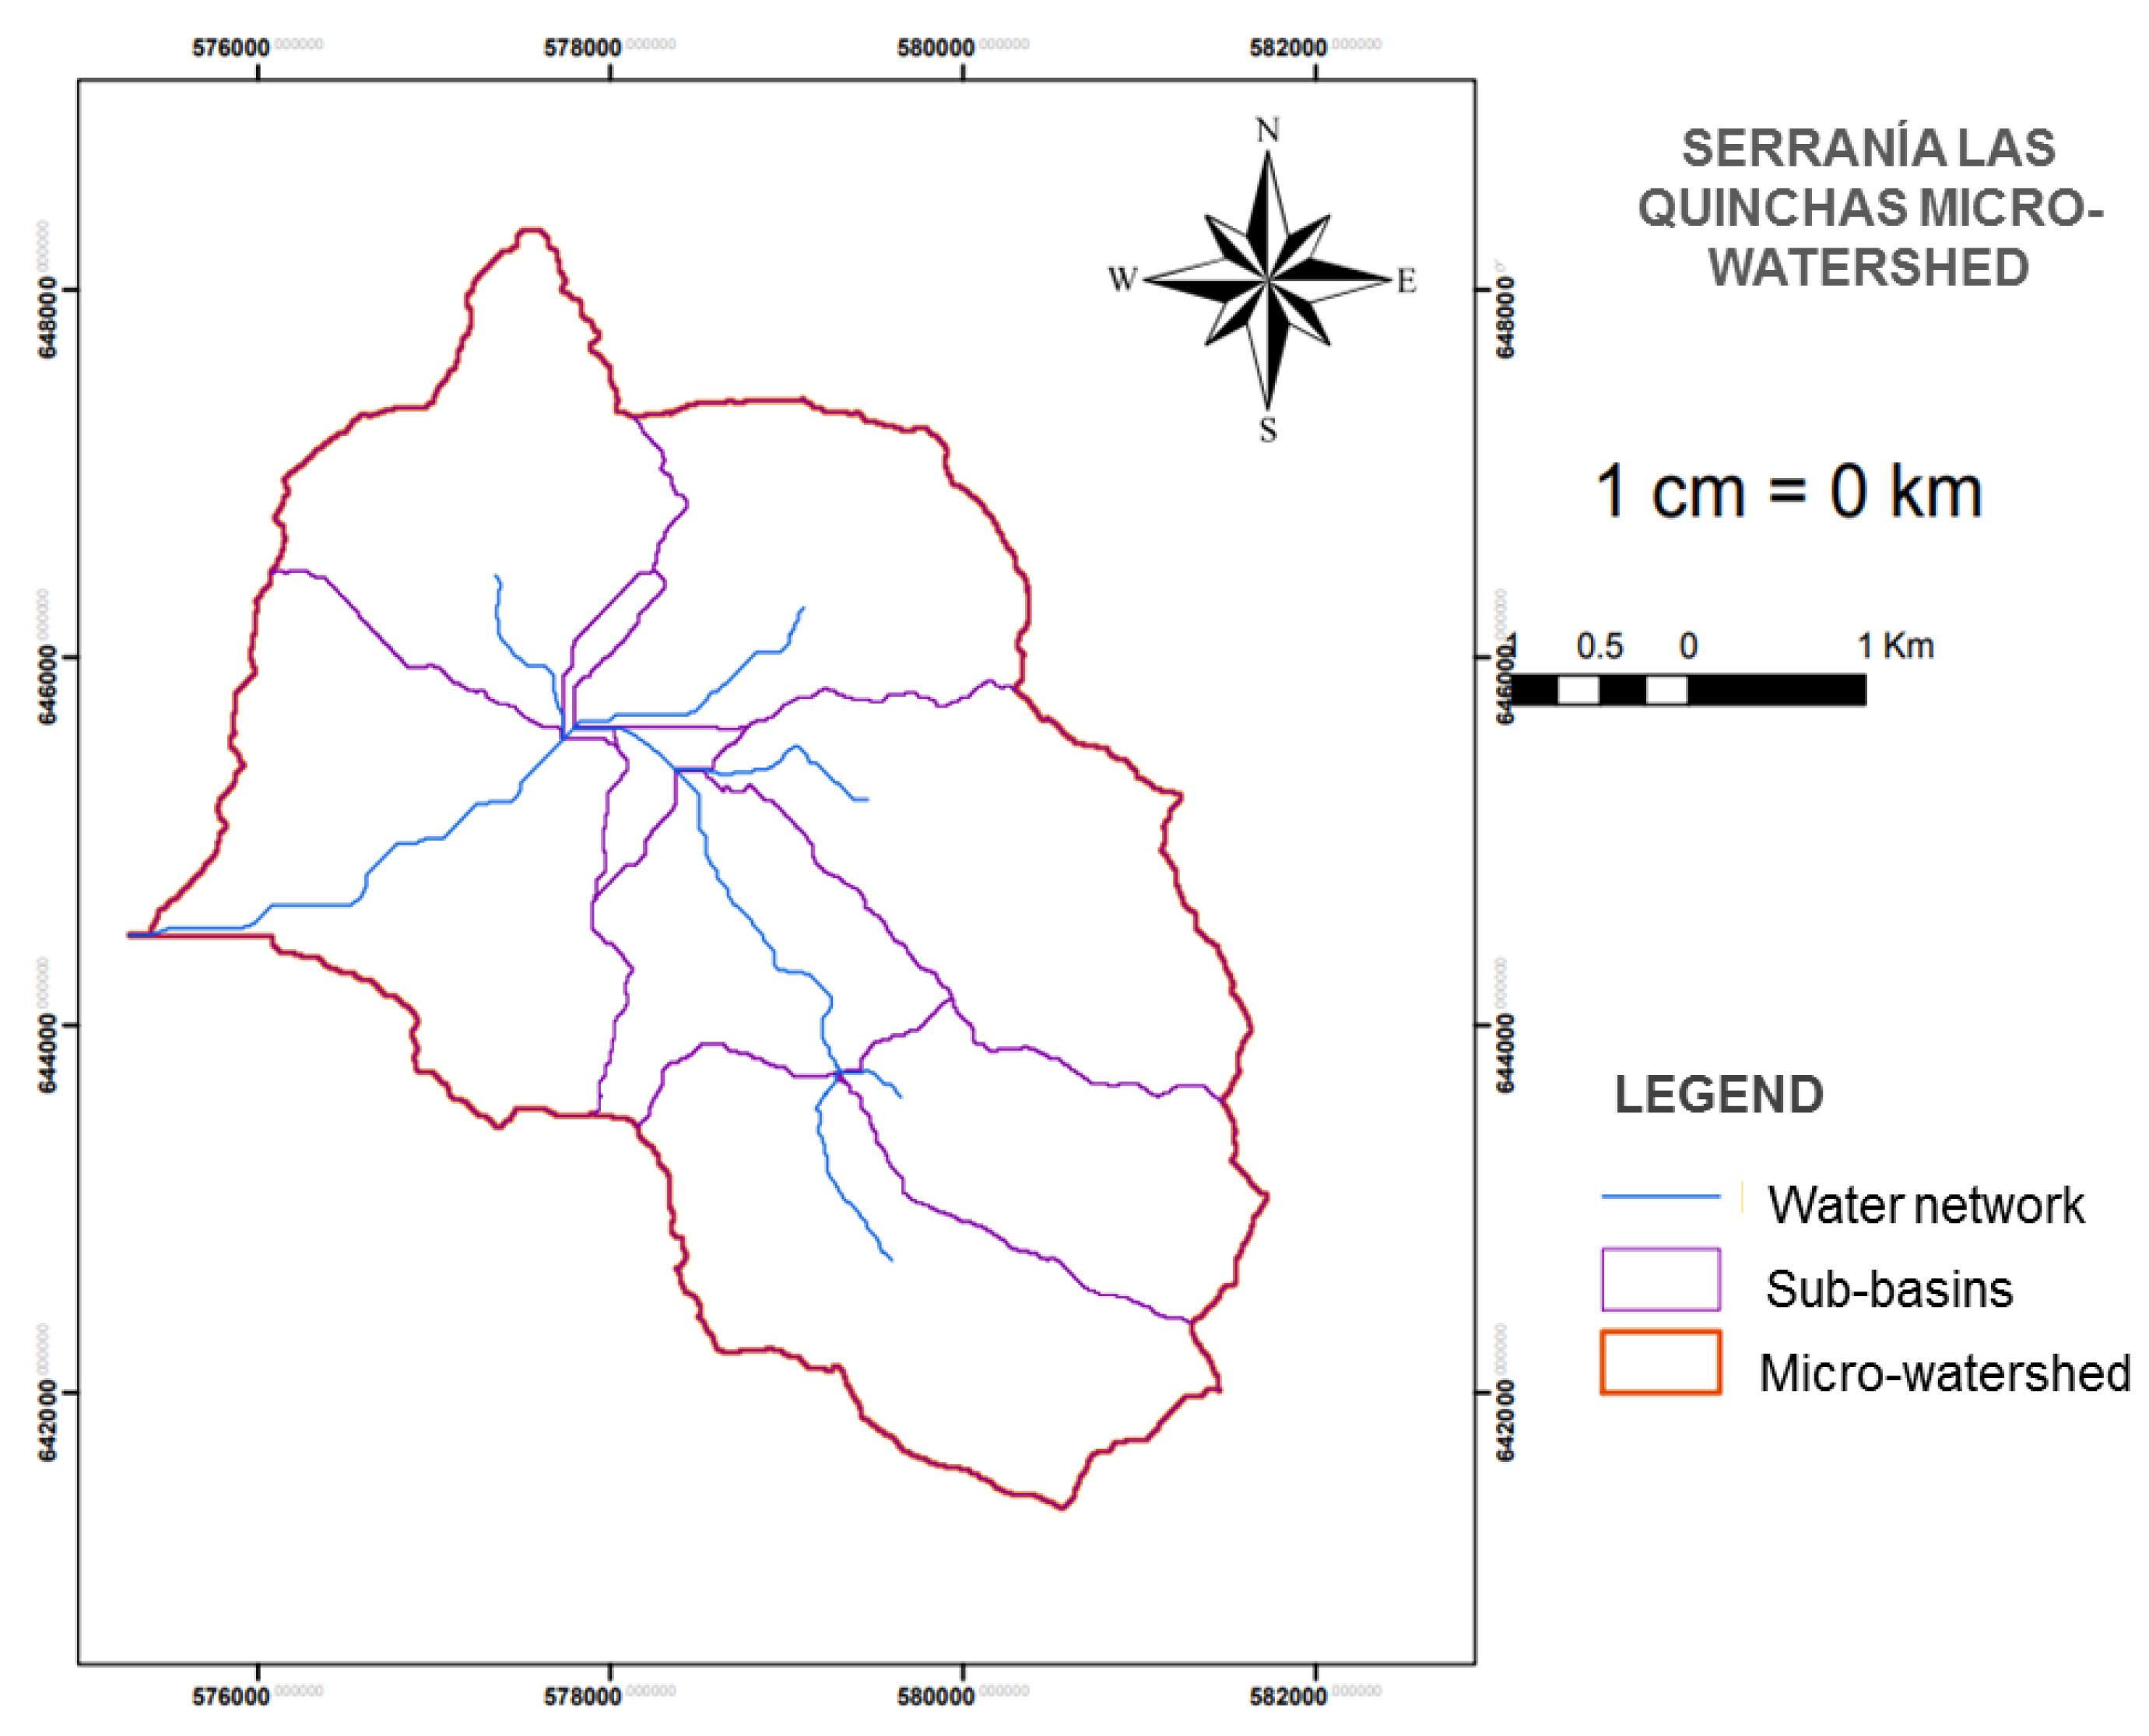
For simulation purposes, the basin was divided into some sub-basins or sub-watersheds. The use of sub-basins is beneficial when several areas in the same basin are affected by land use or unequal soils, which significantly impacts the hydrology of the sector. Therefore, according to the information analyzed using the SWAT Tool, the basin was delimited and modeled the hydrological factors. Figure 7 was performed, taking into account the water network and the sub-basins. The results obtained from the model were stored in the database called “SWATOutput”; this information was analyzed for the years from 2010 to 2017. It was analyzing 8 years of 10, since two of them (2008 and 2009) were left for the “warming up” of the program.
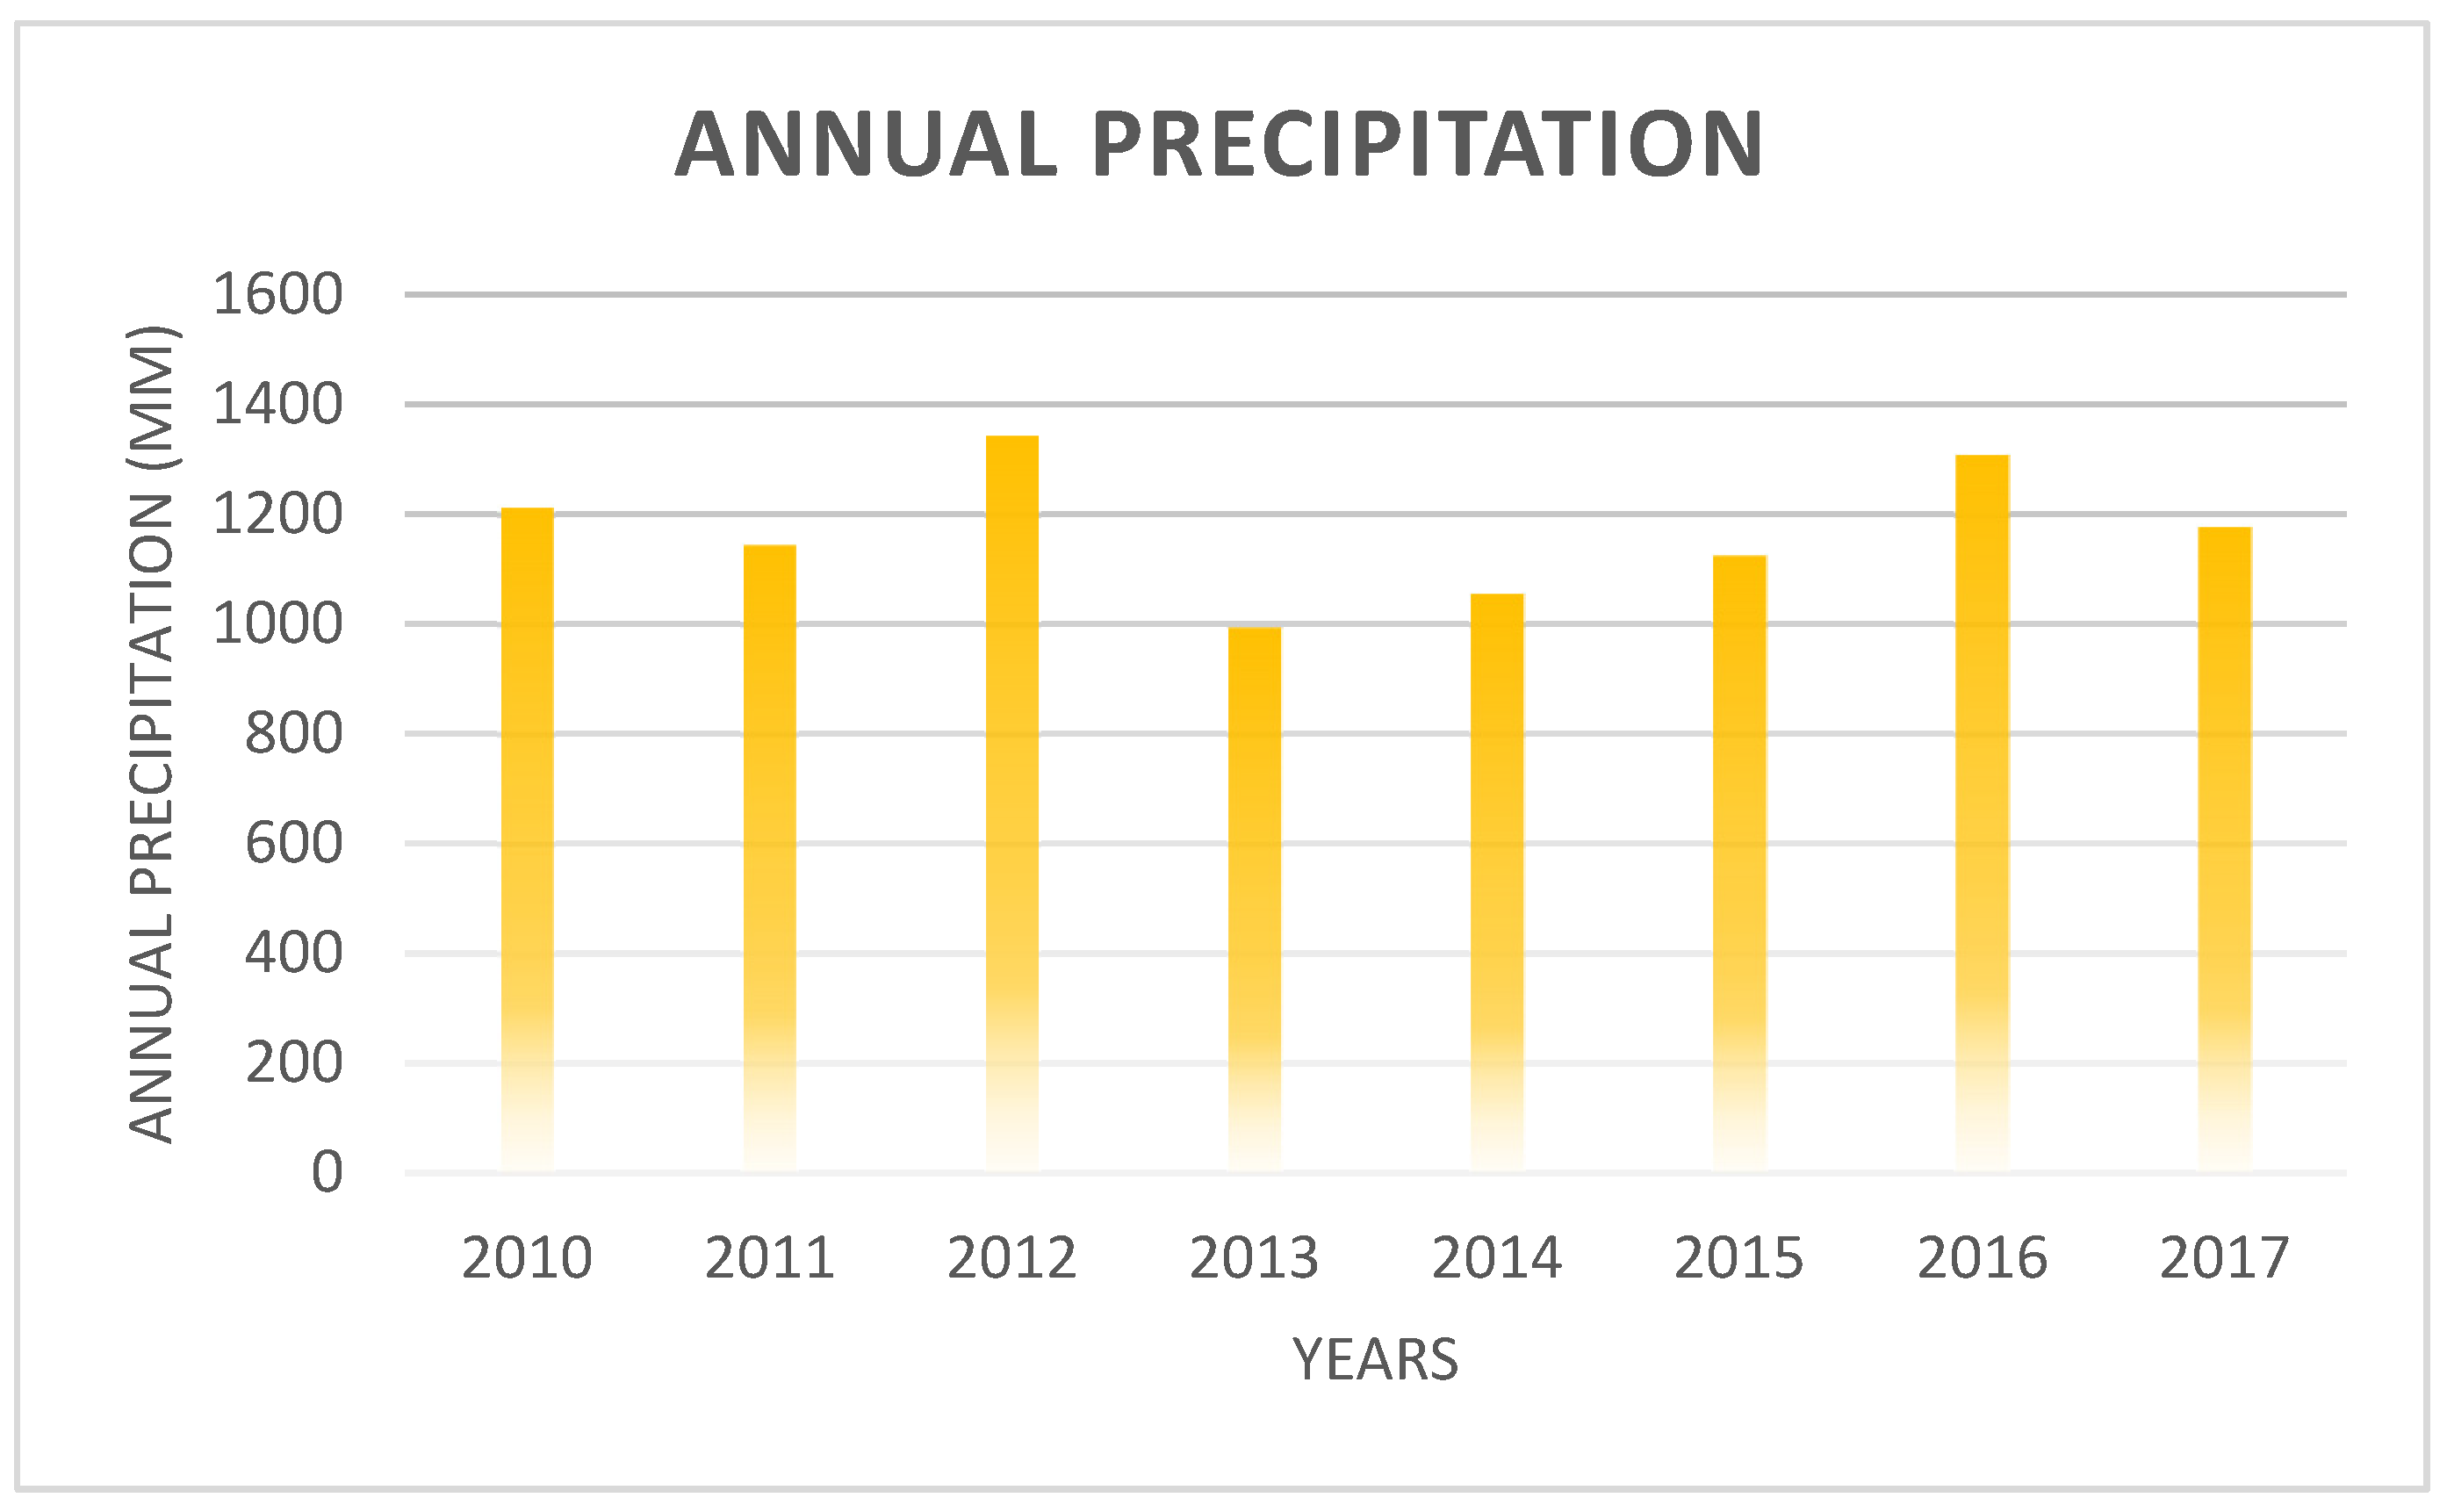
The precipitation for 2010 to 2017 was determined from the historical information from IDEAM and the SWAT tool. That was between 1000 mm/year and 1400 mm, where the highest precipitation peaks occurred for the years 2012 and 2014, having a wet day classification, since the amount of precipitation is generated from a skewed distribution or a modified exponential distribution, classifying these years as wet (Figure 8).
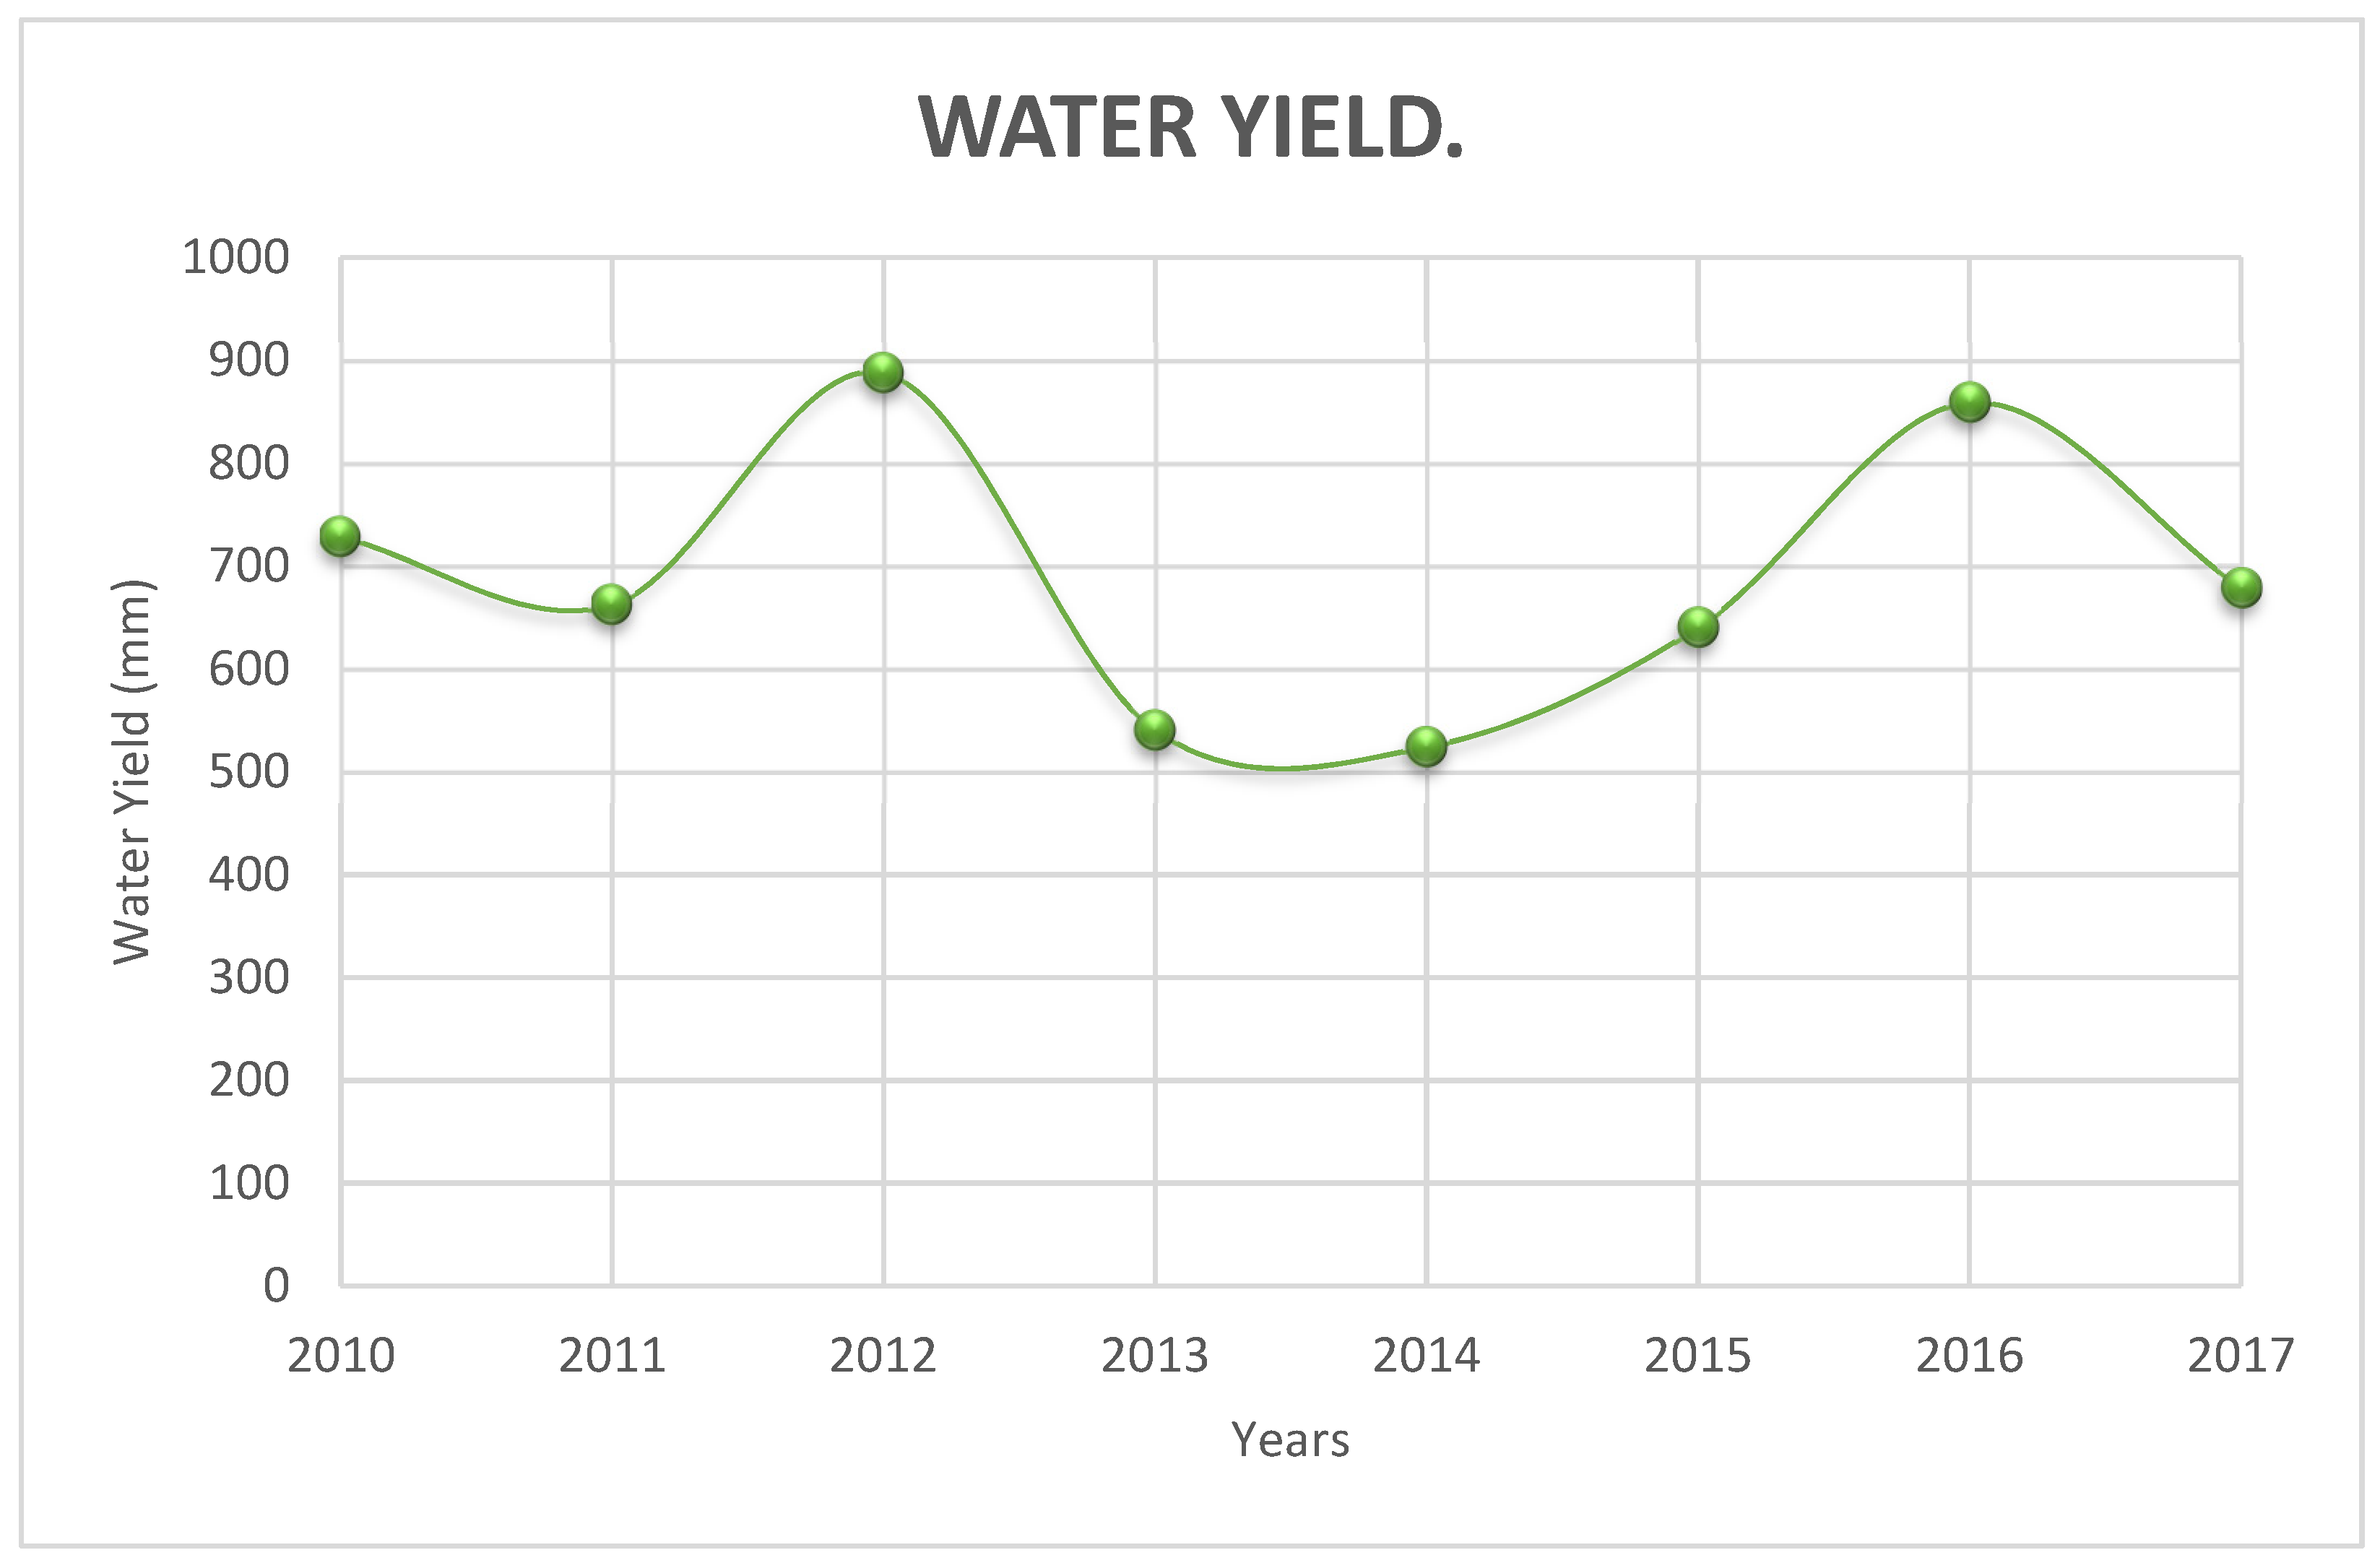
The behavior of the water yield is shown in Figure 9. The water yield or specific flow is defined as the amount of surface water per unit area of a basin in a given time interval. This concept makes it possible to express runoff per unit area to quantify surface water supply, estimate values in non-instrumented hydrographic units, and establish comparisons in different units of analysis. The highest levels of water yield were found in 2010, 2012, and 2017. Moreover, there were lower water yield values in 2010, 2011, 2013, 2014, 2015, and 2017, where it is evident that the greater the restoration of vegetation cover, the lower the water yield, or the lower the amount of surface water, which allows the recharge of shallow aquifers in the micro-watershed to be more significant.
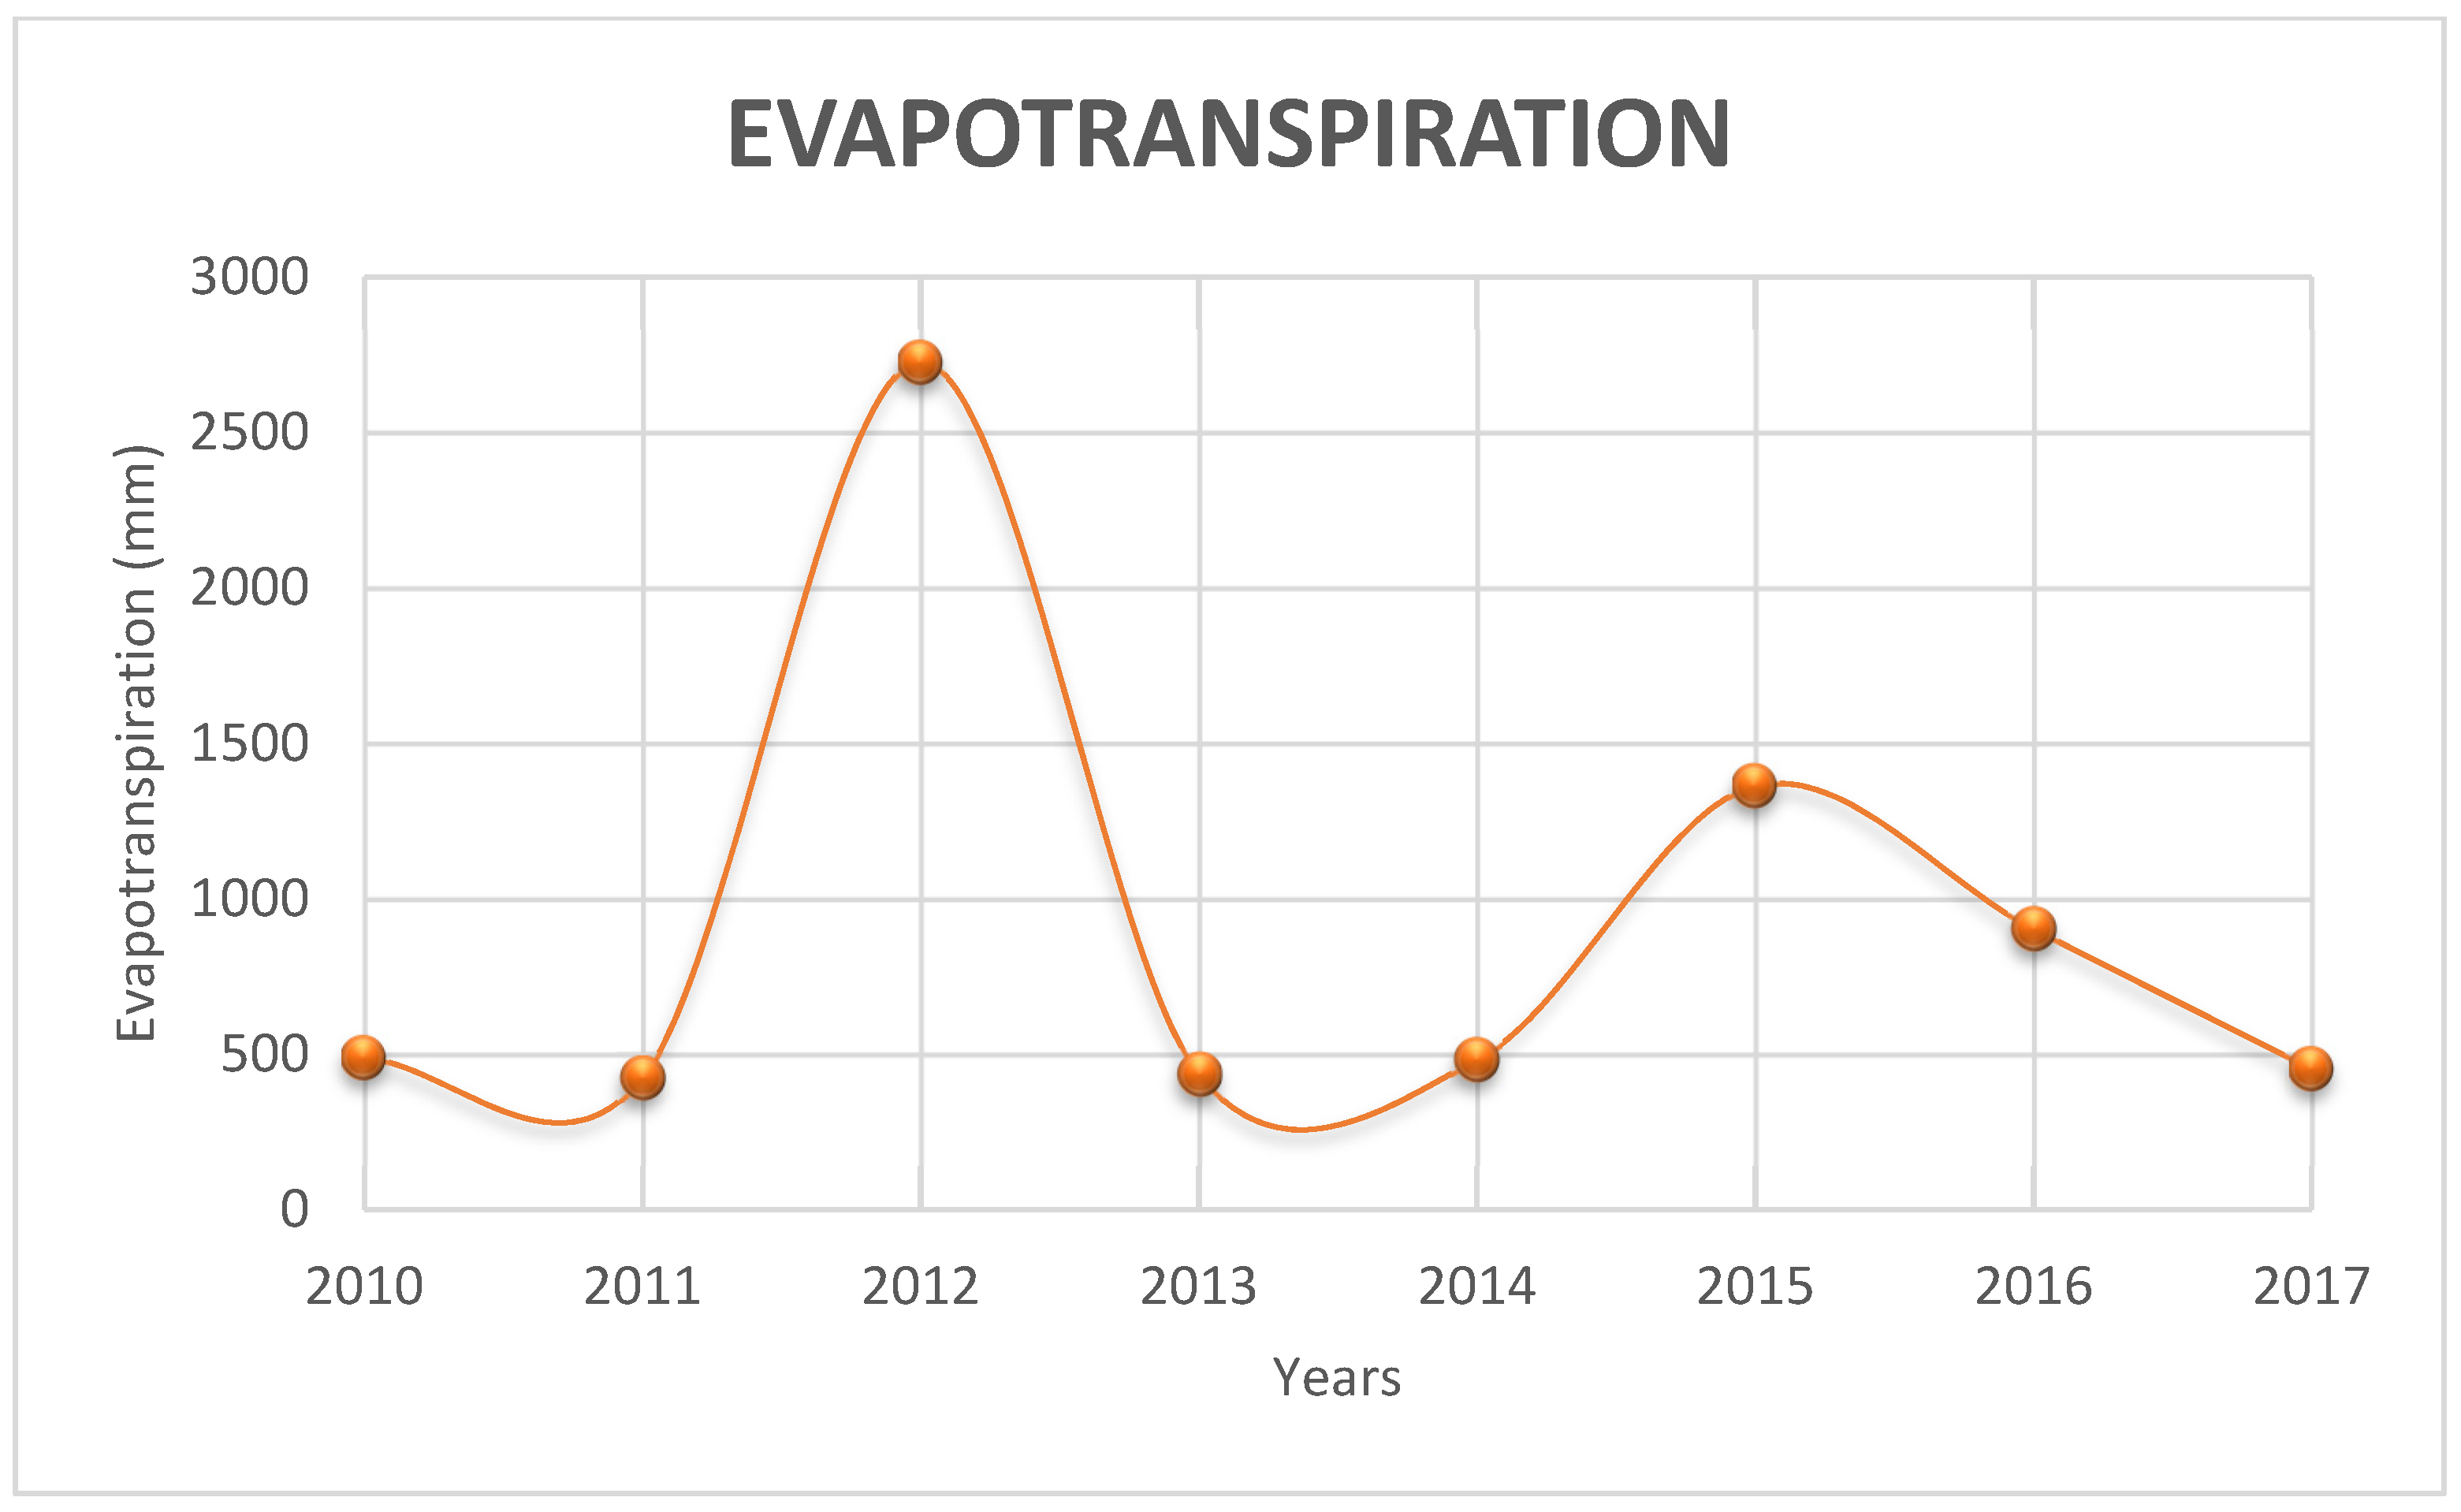
According to Figure 10, it is evident that for the years 2012, 2015, 2016, and 2017 there was greater evapotranspiration, indicating more excellent moisture retention in the vegetation cover of the study area for these years. This takes into account that the evapotranspiration depends on two variable factors: the moisture content of the soil and the plant development. It can be affirmed that for these years, the watershed, thanks to its restoration in terms of vegetation cover, has higher levels of evapotranspiration, achieving healthy plants and a higher water percentage in the basin.
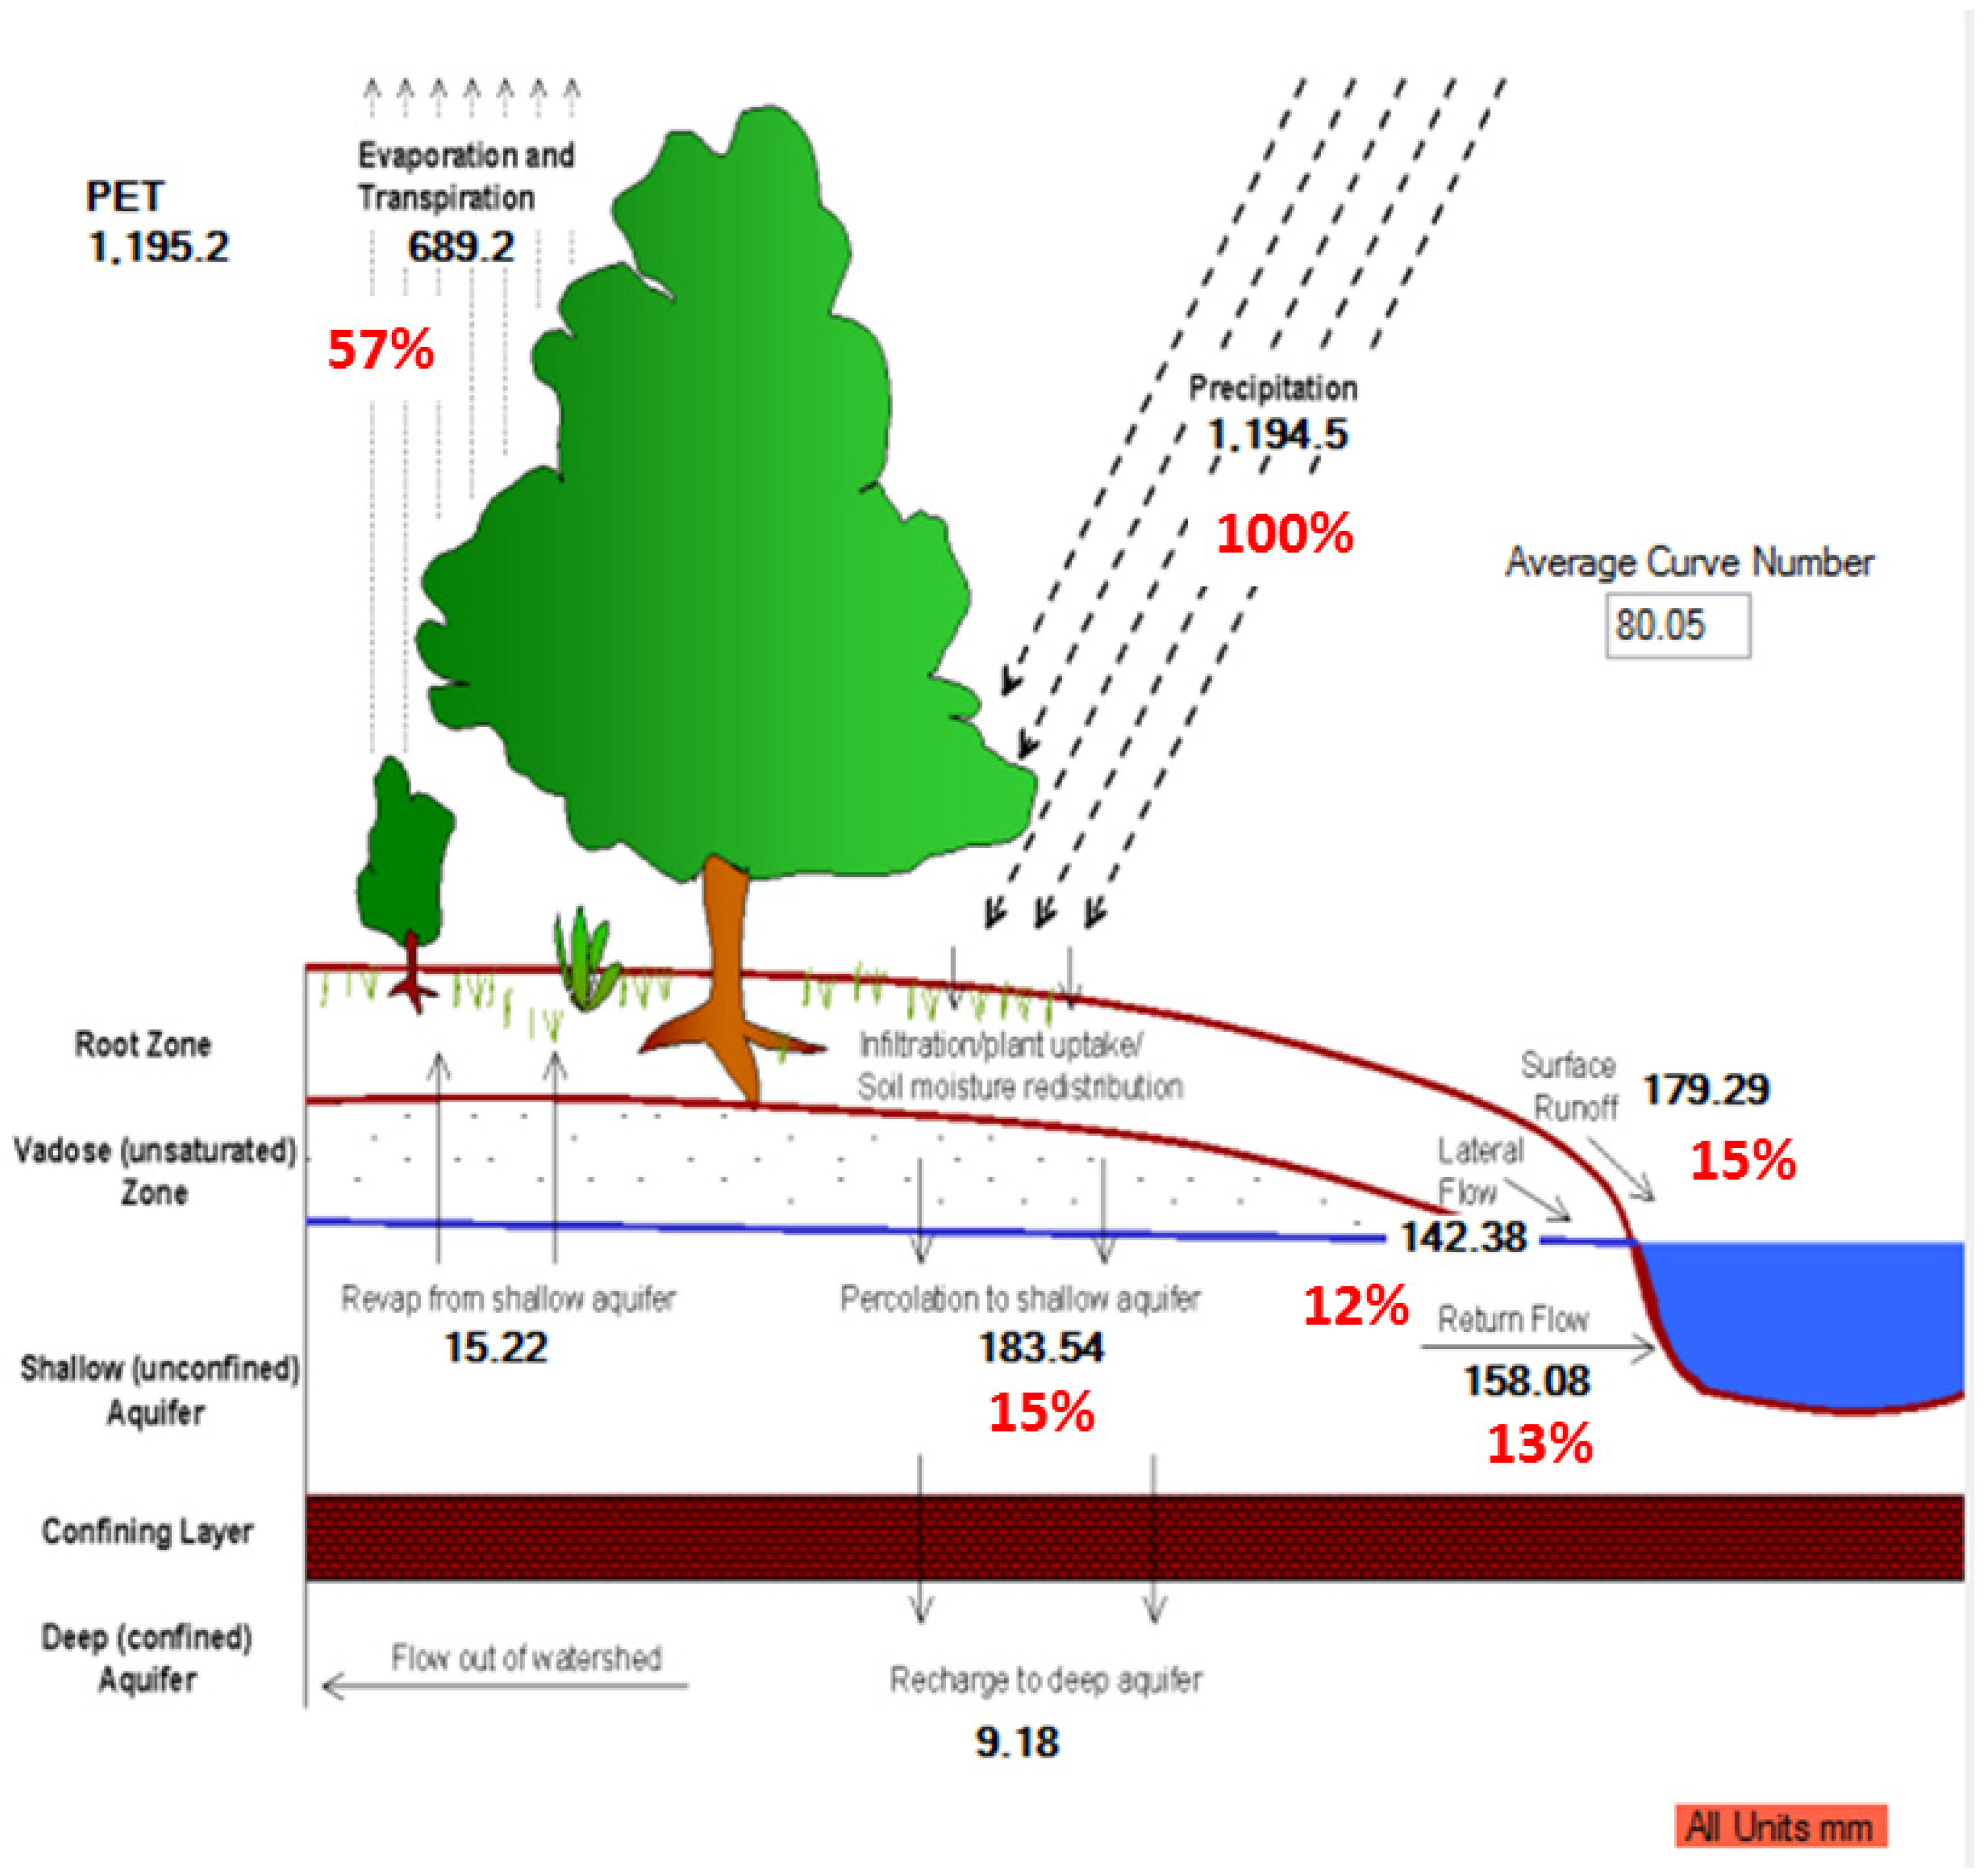
When precipitation falls, it can be intercepted and contained in the vegetation canopy or fall to the soil surface. Water on the soil surface will infiltrate into the soil profile or flow over the ground as runoff. Runoff moves relatively quickly into a stream channel and contributes in a short time in the stream. Infiltrated water may be contained in the soil and subsequently evapotranspiration, or may slowly advance into the water-surface system through subsurface passages, the potential conduits for water movement simulated by SWAT in HRUs. As a final analysis, the SWAT model, using the hydrology tool, determined the water behavior of the basin (Figure 11), where it was found that the highest water percentages were for evapotranspiration with 57%, percolation to shallow aquifers with 15%, and surface runoff with 15%. The PNRSQ has been established as an area of special protection given its strategic environmental position, the only relict of tropical rainforest in the central Colombian zone, where its ecological component makes it the most crucial aquifer recharge zone in the region.
Sediment transport into the channel is controlled by the simultaneous operation of two processes, deposition and degradation. Bagnold [42] defines stream strength as the product of the proportionate water density of the flow and slope of the water surface. Considering the above, William [43] developed a method to determine channel slope and velocity degradation. This analysis determined that there was a high surface runoff for the 2010–2017 analysis period since, as shown in Figure 12, it presented 179.29 mm/year, allowing for representative values in lateral flow or surface flow since the substrate is saturated with water.

6. Discussion and Conclusions

In order to evaluate the impact of land cover changes on the availability of water resources, within the Serranía las quinchas regional natural park, a hydrological modeling was carried out using the SWAT tool, which allowed the analysis of various physical processes to be simulated. For this case the micro-basin called “serranía las quinchas” was taken as the study area, where it was evidenced that after the declaration generated through agreement No. 028 in 2008 by Corpoboyacá, there was an increase in the availability of the water resource having higher values throughout the years analyzed. There the evaporation value was 689.2 mm, there was a surface runoff of 179.29 mm and a percolation value to the shallow aquifer of 183.54 mm, with respect to to the water response. In this context one of the phenomena that these results argue is that having restoration of plant cover increases the storage capacity of the plant canopy, including the forest area, since it allows water to be captured in the form of precipitation intercepted by the vegetative surfaces, accumulating water in their structures and allowing a higher percentage of evapotranspiration as seen in Figure 11 [44].
The research results also present a high value in surface runoff since it presents 179.29 mm, equivalent to 15% of the water behavior, this is given since the surface runoff, or land flow occurs along an inclined surface [44]. This phenomenon is given taking into account that the study area has geomorphological landscapes that in general are made up with slopes between 15–25% and 25–35% of steep to strongly broken relief, where it also has sharp and rounded peaks, rocky outcrops, and areas where calcareous sandstones reach the surface. Thanks to the analysis carried out, it was also determined that the lower water yield of the basin was presented for the years 2010, 2011, 2013, 2014, 2015, and 2017. The water yield of the basin was defined as “the fraction of the precipitation that leaves the micro-basin in liquid form according to [45]”. That indicates that throughout the study for these years, there was a slight loss of water due to runoff, allowing the recharge of shallow aquifers to be greater than the water represented in surface runoff. Hence, having 183.54 mm for shallow aquifers recharge and 179.29 mm for surface runoff, their inclination and the type of soil directly influence this phenomenon [46].
As mentioned above, it was determined that for the analysis period 2010–2017, a low value of surface runoff concerning the recharge value of shallow aquifers, since as shown in Figure 11, it was 179.29 mm/year. That is related to vegetal covers since these allow the retention of humidity and allow the substrate to permeate shallow aquifers; the 15% represents the surface flow due to soil saturation [47].
Regarding the transport of sediments to the channel, it was determined that this process is controlled by the simultaneous operation of two processes, deposition and degradation. For this study it was obtained that the sediment value is lower in the stream than in the highlands of the micro-basin, since the mean sediment yield in the highlands was 110.74 (MG/ha) and the sediment change in the stream was −109.9 Mg/ha. This indicates according to the study carried out by Gramajo, JM [48] that these results are positive, it means that the soil presents little degradation by the abiotic factors of the environment, for example this author considers that unlike what happens with the production of grains or potatoes, i.e., to have a high harvest is good, in a river, a high production of sediments is very bad, because it means that soil is being exported from the basin. In this context it can be said that the rivers are in a certain balance since they present minor activity and export solid materials. This event can be compared with the results obtained by Ramírez Contreras, A [46], where it is mentioned that the vegetation cover reduces the impact of raindrops, which reduces contact with the ground, avoiding the effect of “splash”, allowing little erosion and sedimentation to be generated within the basin.
One of the efforts at the international level is the care and sustainable use of the environment; in this research, the SWAT tool is implemented as a methodology to analyze how the in situ conservation in the PNRSQ has allowed the ecological succession of the reserve area and how the conservation strategy generates changes in the availability of water resources. In addition, some studies, such as Navajas Gleidis [49], highlight how the international community has approached environmental issues as a global problem over the years. An example is the 1972 Stockholm Conference, where Colombia actively participated, and in 1973, the executive branch of this Country was empowered to promulgate the first Code of Natural Resources and the creation of strategies such as the national system of protected areas [50]. Other studies, such as that of Cayón and Turbay [49] mention how the association between indigenous peoples and nature has resulted in a recent valuation of biological and cultural biodiversity in many countries. This is a product of the influence of global environmentalist discourses about the planet’s ecological crisis, highlighting the sustainability of local populations’ ecological knowledge and practices, predominantly indigenous peoples.
The Convention on Biological Diversity (CBD) is a legally binding international treaty with three main objectives: the conservation of biological diversity, the sustainable use of its components, and the fair sharing of the benefits derived from using the genetic resources. Its overall objective is to promote measures leading to a sustainable future [50]. Colombia has made different efforts to safeguard environmental remnants at the national level. Thus, in 1991, through the Political Constitution, through 30 articles, it sought their protection and management through the state, assigning them to express functions with the care of the environment, natural resources, or related issues [51]. The political constitution establishes the National Environmental System (SINA), the National System of Protected Areas (SINAP), Law 99 of 1993 known as the Great Environmental Law, Decree 2811 of 1974. The human component and the rights of people who have previously inhabited a protected area are absent [52].
It is considering the importance and relevance of the study area for the offer of ecosystem services that generate well-being and the need to identify strategies that guarantee the sustainability of strategic areas without leaving aside the population that is part of these areas. The hydrological analysis of the region was developed through SWAT hydrological modeling to determine if these statements contribute to conservation. Likewise, for future research the social strategies should be determined that can be applied within protected areas to safeguard environmental resources and generate sustainable development alternatives for the community. The constant evolution between the relationship between the environment and the human being encourages the creation of tools for communities to recognize their heritage and identify the importance of their ecosystem services, likewise, the central role to guarantee the permanence in time of the natural resources that together will allow the development of the social and economic activities of the territory.
Studying protected areas makes it possible to determine the existing environmental heritage to plan their use and the possible risks found in the area. The PRNSQ is an area of environmental importance not only for its water availability but also for its biological diversity, which allows it to be recognized as an area of importance in terms of aquifer recharge at the national level. Therefore, the development of this type of research and implementing methodologies such as the SWAT tool allow one to analyze the study area’s water behavior. That, together with other analyses involving the characterization of the area at a social and economic level, allows knowing the environmental heritage to create strategies that promote sustainability from planning designed to offer ecosystem services and the generation of well-being from economic alternatives that strengthen the local economic revitalization.
It can be affirmed that hydrological modeling can become a planning and management tool for hydrographic basins since the behavior of the basin can be observed and analyzed under different conditions [53]. The resulting information allows decision-makers to evaluate the best options to guarantee water resources and generate strategies that allow communities to reinvent their way of production and adapt to ecosystem conditions without affecting their ecological functioning.
Finally, it is concluded that after the declaration generated by CORPOBOYACA, the components of the plant covers increased, allowing not only to restore the covers but also the ecological functioning of the study area. This study corroborates that the Serranía las Quinchas Regional Natural Park can be called an essential aquifer recharge zone in the region [54].

Author Contributions

Conceptualization, Y.A.C.O., J.C.A.-P. and P.M.A.C.; methodology, Y.A.C.O., J.C.A.-P. and P.M.A.C.; Software, Y.A.C.O., J.C.A.-P. and P.M.A.C.; formal analysis, Y.A.C.O., J.C.A.-P. and P.M.A.C.; investigation, Y.A.C.O., J.C.A.-P. and P.M.A.C.; resources, Y.A.C.O., J.C.A.-P. and P.M.A.C.; writing—original draft preparation, Y.A.C.O., J.C.A.-P. and P.M.A.C.; writing—review and editing, Y.A.C.O., J.C.A.-P. and P.M.A.C.; visualization, Y.A.C.O., J.C.A.-P. and P.M.A.C.; project administration, Y.A.C.O., J.C.A.-P. and P.M.A.C. All authors have read and agreed to the published version of the manuscript.

Funding

This research received no external funding.

Institutional Review Board Statement

Not applicable.

Informed Consent Statement

Informed consent was obtained from all the subjects involved in the study, since it is a work that has been carried out for several years in which we have worked with the community and supported them in the development of the objectives of this research.

Data Availability Statement

Not applicable.

Conflicts of Interest

The authors declare no conflict of interest.

References

  1. Leemhuis, C.; Thonfeld, F.; Näschen, K.; Steinbach, S.; Muro, J.; Strauch, A.; López, A.; Daconto, G.; Games, I.; Diekkrüger, B. Sustainability in the food-water-ecosystem nexus: The role of land use and land cover change for water resources and ecosystems in the Kilombero Wetland, Tanzania. Sustainability 2017, 9, 1513. [Google Scholar] [CrossRef] [Green Version]
  2. Delgado, J.; Llorens, P.; Nord, G.; Calder, I.R.; Gallart, F. Modelling the hydrological response of a Mediterranean medium-sized headwater basin subject to land cover change: The Cardener River basin (NE Spain). J. Hydrol. 2010, 383, 125–134. [Google Scholar] [CrossRef]
  3. Hyandye, C.B.; Worqul, A.; Martz, L.W.; Muzuka, A.N.N. The impact of future climate and land use/cover change on water resources in the Ndembera watershed and their mitigation and adaptation strategies. Environ. Syst. Res. 2018, 7, 7. [Google Scholar] [CrossRef] [Green Version]
  4. Dwarakish, G.S.; Ganasri, B.P. Impact of land use change on hydrological systems: A review of current modeling approaches. Cogent Geosci. 2015, 1, 1115691. [Google Scholar] [CrossRef]
  5. Corpoboyaca. Acuerdo 028 de 2008. Por el cual se Declara y alindera el Parque Natural Regional Serranía de Las Quinchas, en los Municipios de Otanche y Puerto Boyacá en el Departamento de Boyacá; Corpoboyaca: Tunja, Colombia, 2008. [Google Scholar]
  6. Sistema Regional de Áreas Protegidas PNR Las Quinchas. Available online: https://www.corpoboyaca.gov.co/sirap/areas-protegidas/regionales/las-quinchas/ (accessed on 9 November 2021).
  7. Pérez, M.; Fernández, L.; Alegre, F. Planificación en territorios rurales. Proyección 2009, 1, 1–21. [Google Scholar]
  8. Parajka, J.; Naeimi, V.; Blöschl, G.; Wagner, W.; Merz, R.; Scipal, K. Assimilating scatterometer soil moisture data into conceptual hydrologic models at the regional scale. Hydrol. Earth Syst. Sci. 2006, 10, 353–368. [Google Scholar] [CrossRef] [Green Version]
  9. Páez, J.C. Una agenda común sobre desarrollo sostenible en América Latina. InterNaciones 2019, 7, 121–143. [Google Scholar] [CrossRef] [Green Version]
  10. Gallart, F.; Llorens, P. Catchment management under environmental change: Impact of land cover change on water resources. Water Int. 2003, 28, 334–340. [Google Scholar] [CrossRef]
  11. Li, Z.; Liu, W.; Zhang, X.; Zheng, F. Impacts of land use change and climate variability on hydrology in an agricultural catchment on the Loess Plateau of China. J. Hydrol. 2009, 377, 35–42. [Google Scholar] [CrossRef]
  12. Calijuri, M.L.; de Siqueira Castro, J.; Costa, L.S.; Assemany, P.P.; Alves, J.E.M. Impact of land use/land cover changes on water quality and hydrological behavior of an agricultural subwatershed. Environ. Earth Sci. 2015, 74, 5373–5382. [Google Scholar] [CrossRef]
  13. Fuentes, I.; Fuster, R.; Avilés, D.; Vervoort, W. Water scarcity in central Chile: The effect of climate and land cover changes on hydrologic resources. Hydrol. Sci. J. 2021, 66, 1028–1044. [Google Scholar] [CrossRef]
  14. Heo, J.; Yu, J.; Giardino, J.R.; Cho, H. Impacts of climate and land-cover changes on water resources in a humid subtropical watershed: A case study from East Texas, USA. Water Environ. J. 2015, 29, 51–60. [Google Scholar] [CrossRef]
  15. Aghsaei, H.; Mobarghaee, N.; Moridi, A.; Asadolahi, Z.; Delavar, M.; Fohrer, N.; Wagner, P.D. Effects of dynamic land use/land cover change on water resources and sediment yield in the Anzali wetland catchment, Gilan, Iran. Sci. Total Environ. 2020, 712, 136449. [Google Scholar] [CrossRef] [PubMed]
  16. Galván, L.; Olías, M.; Villaran, R.; SANTOS, J. Aplicación del modelo hidrológico SWAT a la cuenca del rio Meca (Huelva, España). Geogaceta 2007, 42, 63–66. [Google Scholar]
  17. Martínez Ortega, E.F. Modelación Hidrológica de la Cuenca alta del rio Atrato Mediante HEC-HMS, para la Determinación de Caudales Máximos. 2014. Available online: https://repository.usta.edu.co/handle/11634/371 (accessed on 10 August 2021).
  18. Martínez, C.M.; López, E.J.; Chamorro, F.R. Estado del Arte de Modelos Hidrológicos. Boletín Inf. CEI 2018, 5, 116–117. Available online: http://editorial.umariana.edu.co/revistas/index.php/BoletinInformativoCEI/article/view/1667 (accessed on 10 August 2021).
  19. Quintero, T.; Naranjo, E.G. Aplicación del Modelo de Simulación Hidráulica Hec-Ras para la Emisión de Pronósticos Hidrológicos de Inundaciones en Tiempo real, en la Cuenca Media del río Bogotá-Sector Alicachin; Universidad Libre: Bogota, Colombia, 2009. [Google Scholar]
  20. Cordova, Y.E.; Software Libre un Instrumento en la Ingeniería de los Recursos Hídricos. Yoel Esleiter Cordova Elera, 12 Diciembre 2016. Available online: https://www.iagua.es/blogs/yoel-esleiter-cordova-elera/software-libre-instrumento-ingenieria-recursos-hidricos (accessed on 10 December 2021).
  21. Bailey, R.T. Tutorial SWAT-MODFLOW. In Documentación para la Preparación del Acoplamiento SWAT-MODFLOW; Colorado State University: Fort Collins, CO, USA, 2015; p. 11. [Google Scholar]
  22. Yira, Y.; Diekkrüger, B.; Steup, G.; Bossa, A.Y. Modeling land use change impacts on water resources in a tropical West African catchment (Dano, Burkina Faso). J. Hydrol. 2016, 537, 187–199. [Google Scholar] [CrossRef]
  23. Cao, W.; Bowden, W.B.; Davie, T.; Fenemor, A. Modelling impacts of land cover change on critical water resources in the Motueka River Catchment, New Zealand. Water Resour. Manag. 2009, 23, 137–151. [Google Scholar] [CrossRef]
  24. Matlhodi, B.; Kenabatho, P.K.; Parida, B.P.; Maphanyane, J.G. Analysis of the future land use land cover changes in the gaborone dam catchment using ca-markov model: Implications on water resources. Remote Sens. 2021, 13, 2427. [Google Scholar] [CrossRef]
  25. Näschen, K.; Diekkrüger, B.; Evers, M.; Höllermann, B.; Steinbach, S.; Thonfeld, F. The impact of land use/land cover change (LULCC) on water resources in a tropical catchment in Tanzania under different climate change scenarios. Sustainability 2019, 11, 7083. [Google Scholar] [CrossRef] [Green Version]
  26. Sharma, R.; Rimal, B.; Baral, H.; Nehren, U.; Paudyal, K.; Sharma, S.; Rijal, S.; Ranpal, S.; Acharya, R.P.; Alenazy, A.A.; et al. Impact of land cover change on ecosystem services in a tropical forested landscape. Resources 2019, 8, 18. [Google Scholar] [CrossRef] [Green Version]
  27. Martin, N. Risk assessment of future climate and land use/land cover change impacts on water resources. Hydrology 2021, 8, 38. [Google Scholar] [CrossRef]
  28. Cabascango, W.M. Modelación de Cambios de Usos y Coberturas de la Tierra Bajo un Escenario Tendencial y Restrictivo en la Microcuenca Santa Inés; Escuela Agrícola Panamericana: Zamorano, Honduras, 2015. [Google Scholar]
  29. Riad, P.; Graefe, S.; Hussein, H.; Buerkert, A. Procesos de Transformación del Paisaje en dos Ciudades Grandes y dos Pequeñas en Egipto y Jordania Durante las Últimas Cinco Décadas Utilizando Datos de Teledetección; Paisaje y Urbanismo: Habana, Cuba, 2020; Volume 3, pp. 28–31. [Google Scholar]
  30. Aumassanne, C. Impacto de los Cambios en el uso y la Cobertura de la Tierra y de la Variación del Clima, Sobre los Principales Componentes del Balance de Agua en la Cuenca del río Colorado, Argentina; Universidad de La Plata: La Plata, Argentina, 2019. [Google Scholar]
  31. Jimenez, L.M. Análisis Multitemporal de la Cobertura de la Tierra del Páramo Rabanal-río Bogotá y su Condición Frente a los Escenarios de Cambio Climático, Utilizando Sistemas de Información Geográfica; Universidad Libre: Bogota, Colombia, 2018. [Google Scholar]
  32. Álvarez, A.J.; Yustres, L.F.; Ivanova, Y. Estimación del cambio de la capacidad de regulación hídrica como respuesta a los cambios de coberturas de la tierra (Caso de estudio: Cuenca alta del río Chinchiná, Caldas, Colombia). Rev. EIA 2021, 18, 35004. [Google Scholar] [CrossRef]
  33. Neitsch, S.L.; Arnold, J.G.; Kiniry, J.R.; Williams, J.R. Soil and Water Asessment Tool: Theroretical Documentation; Version 2009; Texas Water Resources Institute: College Station, TX, USA, 2011. [Google Scholar]
  34. Urrutia, M.A. Aplicación del Modelo SWAT para la Simulación del ciclo Hidrológico de la Cuenca Alta del río San Juan Bajo la Influencia de la Actividad Minera; Escuela Colombiana de Ingeniería Julio Garavito: Bogota, Colombia, 2016. [Google Scholar]
  35. Gómez, Á.J. Herramientas de Modelación y Monitoreo para la Hidrología de Alta Montaña Colombiana-Cuenca de la Quebrada Calostros-PNN Chingaza; Universidad Nacional de Colombia: Bogota, Colombia, 2016. [Google Scholar]
  36. Barquero, A. Modelación Hidrológica en las Cuencas San Jerónimo-Piedras, Río Blanco y Tenorio Usando SWAT; Universidad de Costa Rica: San Jose, Costa Rica, 2015. [Google Scholar]
  37. Valverde, E.D. Modelación Hidrológica para Cuantificar la Producción de Agua y Sedimento Actual y Futuro a Partir de Cambios de Cobertura Forestal, Sector Prusia, Parque Nacional Volacán Irazú; Instituto Tecnológico de Costa Rica: Cartago, Costa Rica, 2018. [Google Scholar]
  38. Instituto Geográfico Agustín Codazzi. Estudio General de Suelos y Zonificación de Tierras del Departamento de Boyacá; Instituto Geográfico Agustín Codazzi: Bogota, Colombia, 2005. [Google Scholar]
  39. Argota, T. Simulación Hidrológica de la Cuenca del Rio Amajac, Estado de Hidalgo Aplicando el Modelo SWAT; Instituto Politécnico Nacional: Ciudad de Mexico, Mexico, 2011. [Google Scholar]
  40. Instituto de Hidrogología Meteorología y Estudios Ambientales Metodología CORINE Land Cover. Available online: http://www.ideam.gov.co/web/ecosistemas/metodologia-corine-land-cover (accessed on 9 November 2021).
  41. Instituto de Hidrogología Meteorología y Estudios Ambientales. Catálogo de Patrones de Coberturas de la Tierra Colombia; IDEAM: Bogota, Colombia, 2012. [Google Scholar]
  42. Bagnold, R.A. Bed load transport by natural rivers. Water Resour. Res. 1977, 13, 303–312. [Google Scholar] [CrossRef]
  43. Williams, J.R. The EPIC model. In Computer Models of Watershed Hydrology; Singh, V.P., Ed.; Water Resources Publication: Highlands Ranch, CO, USA, 1995; pp. 909–1000. [Google Scholar]
  44. CIAT. Centro Internacinal de Agricultura Tropical, SWAT (Soil and Water Assessment Tool). 20 April 2010. Available online: https://swat.tamu.edu/media/46967/swat2005-tutorial-spanish.pdf (accessed on 15 December 2021).
  45. Jobbágy, E.G.; Acosta, A.M.; Nosetto, M.D. Rendimiento hídrico en cuencas primarias bajo pastizales y plantaciones de pino de las sierras de Córdoba (Argentina). Ecol. Austral 2013, 23, 87–96. [Google Scholar] [CrossRef]
  46. Ramírez Contreras, A.O. Modelación Hidrológica y de Cambio Climático para Simular la Producción de Agua, los Niveles de Erosión y Producción de Sedimentos, con Diferentes Coberturas de Suelo en la Subcuenca Aguná, Escuintla, Guatemala; Soluciones para el desarrollo sostenible: Turrialba, Costa Rica, 2020. [Google Scholar]
  47. Delgado-Gómez, M.D. Evaluación de la Generación de Sedimentos en el Distrito de Drenaje del Valle de Sibundoy, Departamento del Putumayo (Colombia); Ambiente y Desarrollo: Nariño, Colombia, 2019; p. 23. [Google Scholar]
  48. Gramajo, J.M. Análisis de los Sedimentos, la Otra Forma de Conocer los Ríos. Universidad Nacional del Nordeste-Facultad de Ciencias Exactas y Naturales y Agrimensura, 01 Agosto 2016. Available online: https://argentinainvestiga.edu.ar/noticia.php?titulo=analisis_de_los_sedimentos_la_otra_forma_de_conocer_los_rios&id=2741 (accessed on 5 June 2021).
  49. Navajas Jaraba, G. Impactos Sociales y Jurídicos de la Declaración de Parque Natural Regional-Serranía de las Quinchas en el Municipio de Puerto Boyacá. 2016. Available online: https://ridum.umanizales.edu.co/xmlui/handle/20.500.12746/3158 (accessed on 20 September 2021).
  50. Prada, V.R.R.V. La Conferencia de Estocolmo Sobre el Medio Ambiente; Revista de Administración Pública: Buenos Aires, Argentina, 1972; pp. 381–404. [Google Scholar]
  51. Cayón, L.; Turbay Ceballos, S.M. Discurso Chamánico, Ordenamiento Territorial y Áreas Protegidas en la Amazonía Colombiana. 2005. Available online: https://bibliotecadigital.udea.edu.co/handle/10495/13445 (accessed on 20 September 2021).
  52. López, J.O. Constitución Política de Colombia. Plaza y Janes Editores Colombia sa. 2004. Available online: https://books.google.es/books?hl=es&lr=&id=GPn7MQcHLYkC&oi=fnd&pg=PA5&dq=52.%09L%C3%B3pez,+J.O.+Constituci%C3%B3n+Pol%C3%ADtica+de+Colombia.+Plaza+y+Janes+Editores+Colombia+sa.+2004&ots=bheB4tYeen&sig=vn3eEktKGqaRc6yqe8QN9smnE6w#v=onepage&q&f=false (accessed on 12 September 2021).
  53. Acosta Castellanos, P.M.; Ortegon, A.C.; Guerrero Sierra, H.F. Evaluation of simple space interpolation methods for the depth of precipitation: Application for Boyacá, Colombia. Adv. Sci. Technol. Eng. Syst. 2020, 5, 1322–1327. [Google Scholar] [CrossRef]
  54. Corpoboyacá. Acuerdo 028, del 2008. Available online: http://www.corpoboyaca.gov.co/sirap/areas-protegidas/regionales/las-quinchas/ (accessed on 15 April 2019).
Figure 1. The geographical location of the study area PNRSQ micro-basin.
Sustainability 14 03237 g001
Figure 2. Research methodology.
Sustainability 14 03237 g002
Figure 3. Delimitation of the micro-basin PNRSQ.
Sustainability 14 03237 g003
Figure 4. Land types PNRSQ micro-basin.
Sustainability 14 03237 g004
Figure 5. Coverage PNRSQ micro-basin.
Sustainability 14 03237 g005
Figure 6. Methodological diagram implemented.
Sustainability 14 03237 g006
Figure 7. Closure of the PNRSQ micro-basin.
Sustainability 14 03237 g007
Figure 8. Precipitation (mm) PNRSQ micro-basin.
Sustainability 14 03237 g008
Figure 9. Water yield in the PNRSQ micro-basin.
Sustainability 14 03237 g009
Figure 10. Evapotranspiration of the PNRSQ micro-basin.
Sustainability 14 03237 g010
Figure 11. SWAT hydrological balance of the PNRSQ micro-basin.
Sustainability 14 03237 g011
Figure 12. Sediment behavior.
Sustainability 14 03237 g012
Table 1. Stations implemented for hydrometeorological data collection.
CodeStation NameCategoryParameterLocationLatitudeLengthAltitude (masl)
23110030Puerto NiñoPluviometricDaily precipitationPuerto Boyacá−74.425.9415,000
23110040Trique ElPluviometricDaily precipitationPuerto Boyacá−74.575.8817,900
23060150Puerto LibrePluviometricDaily precipitationPuerto Salgar−74.635.76183,600
23115010Puerto BoyacáClimatic OrdinaryDaily maximum and minimum temperaturePuerto Boyacá−74.575.9835,000
23117050Puerto RomeroLimnigraphyAverage monthly flow ratesBoyacá−74.325.8330,500
23125080OtancheClimatic OrdinaryRelative humidityBoyacá−74.185.66110,000
23175020Aeropuerto OTUSecondary SynopticWind speedAntioquia−74.727.0164,300
23125160San Pablo de Borbur—AUTMain climaticSolar radiationSan Pablo de Borbur−74.075.6574,200
Table 2. Physical characteristics of the soils of the micro-basin.
UCSUCS_FSoil Type (Component)LandscapeRelief TypeLithologyCharacteristicsProfilePercentagesWeather
MVAMVAfpLithic DystrudeptsErosional structural mountainsHomoclinal beams and ridgesClayey silt clastic sedimentary rocksModerate to strongly broken relief, with slopes between 12 and 50%, affected by diffuse runoff to a slight degree and stoniness; deep, imperfect to well-drained soils, with clayey textures, light, and highly acidic saturated reaction.PJ-4; PJ-5; PJ-9735, 30, 25Warm, humid
MPAMPAf1Humic DystrudeptsErosional structural mountainsHomoclinal beams and ridgesClassical mixed sedimentary rocksModerately steep relief, with slopes of 50–75%, affected by mass movements (solifluction), landslides, reptation and diffuse runoff to a slight degree and stoniness; superficial soils, limited by aluminum saturation.PB-27A; PJ-100; PJ-1840, 30, 30Medium, very humid
MVAMVAf1Typic DystrudeptsErosional structural mountainsHomoclinal beams and crestsClayey silt clastic sedimentary rocksModerate to strongly broken relief, with slopes between 12 and 50%, affected by light diffuse runoff and stoniness; deep soils, imperfect to well-drained, with clayey textures, light and extremely acid reaction, saturated.PJ-4; PJ-5; PJ-9735, 30, 25Warm, humid
Table 3. Calculation of physicochemical parameters of the PNRSQ micro-basin.
ProfileSNAM (Soil Name)NLAYERSHYDGRP (Hydrological Group)SOL_ZMX (Maximum Rooting Depth mm)ANION_EXCL (FRACTION of Porosity Where Anions Are Excluded)SOL_CRK (Maximum Volume of Soil Profile Rupture m3/m3)TEXTURE (Texture of the Soil Layer)SOL_Z (Depth mm)SOL_BD (Apparent Density g/cm3)SOL_AWC (Soil Water Availability mm/mm)SOL_K (Hydraulic Conductivity mm/h)SOL_CBN (Organic Carbon %)Organic Matter (%)CLAY (% Clay)SILT (% Silt)SAND (% Sand)ROCK (% Rock)SOL_ALB (Soil Albedo)USÑE_K (Soil Aerodynamics K-Factor)
PJ-5Lithic Dystrudepts1C150.50.5Fr.A1501.480.142.310.210.3634392700.5200.167
PJ-83Humic Dystrudepts2C270.50.5Fr9201.200.1719.093.15.3226462800.0710.169
C0.50.5Fr.a9201.360.154.301.42.4736402400.2230.176
B-14Typic Dystrudepts2C300.50.5Fr.a.A4001.100.1619.644.57.7933422500.0270.168
C0.50.5Fr.a11001.360.154.301.42.4736402400.2230.168
Table 4. Occupation in hectares by coverage type.
IDCoverage TypeCode (SWAT)Area (Ha)Percentage (%)
0Forest-mixedFOREST1385.258.5
1Mosaic of pastures with natural spacesFRSD349.414.8
2Pasture and crop mosaicRYEG130.65.5
3RiversWATR14.60.6
4GrasslandBROM77.93.3
5Secondary vegetationRNGE407.917.2
Table 5. Classification of land covers according to SWAT coding.
Type of Coverage Corine Land Cover ClassificationDescriptionSWAT Code
Forest-mixedCover consisting of a vegetation community dominated by typical, regularly distributed arboreal elements, which form a discontinuous canopy layer, with a canopy height greater than 5 m and whose tree cover area represents between 30% and 70% of the total area of the unit. These vegetation formations have not been intervened, or their selective intervention has not altered their original structure and functional characteristics. Therefore, fragmented forests are excluded from this unit and are classified in the respective unit [41].FOREST
Mosaic of pastures with natural spacesIt comprises areas with pastures in combination with natural spaces; the pastures have an area of less than 25 ha, being 30 to 70% of the total area. The natural spaces are made up of natural forest, shrublands, gallery or riparian forest, swamps, and other areas that have not been intervened or little transformed [41].FRSD
Pasture and crop mosaicThese are lands with pastures and crops, with a plot size of less than 25 ha; the distribution is very dispersed, so they cannot be represented individually [41].RYEG
RiversRefers to rivers with a channel width greater than or equal to 50 m [41].WATR
GrasslandIt is made up of herbaceous vegetation zones, developed naturally, forming a dense cover (>70% occupancy) or open (30 to 70% occupancy). These are vegetation formations without intervention [41].BROM
Secondary vegetationThey are mainly shrub and herbaceous vegetation with an irregular canopy, sometimes with trees and creepers, the initial vegetation succession after deforestation or afforestation of pastures [41].RNGE
Table 6. Pending ranges.
Slope Range Used for the ModelIGAC Slope Range (%)Relief
Class I (0–7%)0–3%Flat, flat-concave topography.
3–7%Slightly sloping and slightly undulating topography.
Class II (7–25%)7–12%Moderately sloping, slightly broken, and moderately undulating topography.
12–25%Steeply sloping, moderately broken, and strongly undulating topography.
Class III (25–50%)25–50%Topography slightly steep, strongly broken, and slightly steep.
Class IV (50–75%)50–75%Moderately steep and moderately rugged topography.
Class V (75–99%)>75%Very steep and rugged topography.
Publisher’s Note: MDPI stays neutral with regard to jurisdictional claims in published maps and institutional affiliations.

