Article

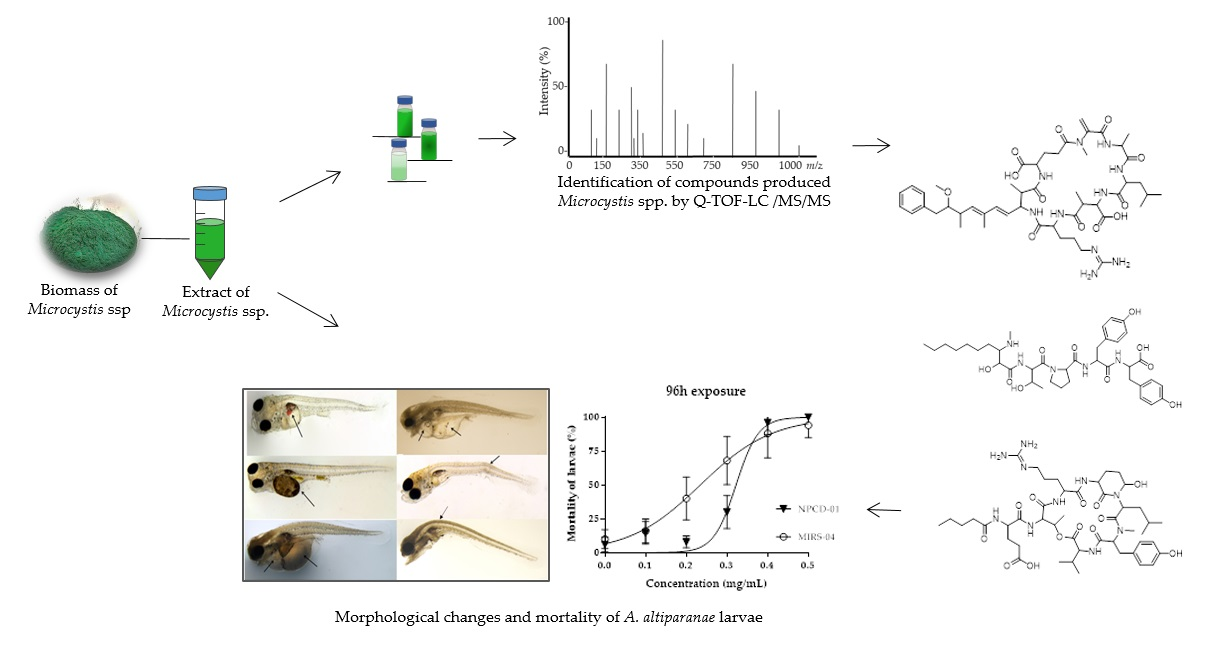
Toxicity of Cyanopeptides from Two Microcystis Strains on Larval Development of Astyanax altiparanae

1
Natural Resources Institute, Federal University of Itajubá, 1303 BPS Avenue, Itajubá, MG 37500-903, Brazil
2
School of Pharmaceutical Sciences, University of Sao Paulo, 580 Professor Lineu Prestes Avenue, São Paulo, SP 05508-000, Brazil
3
Federal Institute of Education Science and Technology of Rio de Janeiro, Washington Luis Highway, Niteroi, RJ 24310-000, Brazil
4
National Center for Research and Conservation of Continentals’ Fish—CEPTA, SP-201 (Pref. Euberto Nemésio Pereira de Godoy—Motorway), Km 6.5, Pirassununga, SP 13630-970, Brazil
5
Faculty of Technology, State University of Campinas, 1888 Paschoal Marmo Street, Limeira, SP 13484-332, Brazil
6
Bruker Daltonics Corporation, Condomínio BBP—Barão de Mauá, Atibaia, SP 12954-260, Brazil
7
Institute of Life and Earth Sciences (ILES), Center for Marine Biodiversity & Biotechnology (CMBB), The School of Energy, Geoscience, Infrastructure and Society (EGIS), Heriot-Watt University, Edinburgh EH14 4AS, UK
*
Author to whom correspondence should be addressed.
Toxins 2019, 11(4), 220; https://doi.org/10.3390/toxins11040220
Submission received: 20 March 2019 / Revised: 31 March 2019 / Accepted: 4 April 2019 / Published: 13 April 2019
(This article belongs to the Collection Toxicological Challenges of Aquatic Toxins)

Abstract

:
Absorption and accumulation of bioavailable cyanobacterial metabolites (including cyanotoxins) are likely in fish after senescence and the rupturing of cells during bloom episodes. We determined the toxicity of cyanopeptides identified from two strains of Microcystis (M. panniformis MIRS-04 and M. aeruginosa NPDC-01) in a freshwater tropical fish, Astyanax altiparanae (yellowtail tetra, lambari). Aqueous extracts of both Microcystis strains were prepared in order to simulate realistic fish exposure to these substances in a freshwater environment. Both strains were selected because previous assays evidenced the presence of microcystins (MCs) in MIRS-04 and lack of cyanotoxins in NPDC-01. Identification of cyanobacterial secondary metabolites was performed by LC-HR-QTOF-MS and quantification of the MC-LR was carried out by LC-QqQ-MS/MS. MIRS-04 produces the MCs MC-LR, MC-LY and MC-HilR as well as micropeptins B, 973, 959 and k139. NPCD-01 biosynthetizes microginins FR1, FR2/FR4 and SD-755, but does not produce MCs. Larval fish survival and changes in morphology were assessed for 96 h exposure to aqueous extracts of both strains at environmentally relevant concentrations from 0.1 to 0.5 mg (dry weight)/mL, corresponding to 0.15 to 0.74 μg/mL of MC-LR (considering dried amounts of MIRS-04 for comparison). Fish mortality increased with concentration and time of exposure for both strains of Microcystis. The frequencies of morphological abnormalities increased with concentration in both strains, and included abdominal and pericardial oedema, and spinal curvature. Results demonstrate that toxicity was not solely caused by MCs, other classes of cyanobacterial secondary metabolites contributed to the observed toxicity.
Key Contribution: The effects of aqueous extracts of two Microcystis species (producer and non-producer of microcystins) on survival and early development in Astyanax altiparanae, a Neotropical region fish, demonstrated that toxicity is not solely due to microcystins, other cyanobacterial secondary metabolites contribute to toxic effects.

Graphical Abstract

1. Introduction

The occurrence of cyanobacterial blooms and the presence of some water soluble-cyanotoxins are well documented in several inland water bodies worldwide [1]. Cyanotoxins such as cyclic peptide microcystins and nodularins, lipopolysaccharides and some alkaloids (i.e., anatoxins, saxitoxins, cylindrospermopsins and lyngbyatoxins) are well known and produced by common freshwater cyanobacterial species (i.e., Microcystis, Cylindrospermosis and Anabaena genera) [2]. Almost all classes of cyanotoxins have been studied including their main mechanisms of action, and environmental risk assessments are typically focused on these known cyanotoxins [3].
Although cyanotoxins are important, cyanobacteria also produce a wide range of biologically active secondary metabolites for which only some classes have been fully characterized and assessed for toxicity [4]. Extracts and natural products isolated from freshwater phytoplankton species, including eukaryotes and cyanobacteria, have been screened in vitro for specific biological action, including UV protection and inhibition of particular classes of proteases [5,6,7]. There are relatively few in vivo studies on the effects of secondary metabolites of cyanobacteria, but those that have been conducted indicate these substances can be important, including for the detection of allelopathy in some cyanometabolites with other competitive species in the environment, antifeeding and antibiotic effects [8,9], and developmental toxicity in fish exposed during early life history stages [10,11]. Co-occurrence of toxins and secondary metabolites from cyanobacteria is the environmentally relevant exposure scenario, and research is needed to resolve synergism/antagonism and attribute biological activity to specific substances produced by cyanobacteria. A focus only on cyanotoxins for risk assessment and management of bloom episodes will hinder detection of negative effects on the ecosystem caused by secondary metabolites produced by cyanobacteria.
Therefore, the aims of this study were the following: (i) characterize by LC-HR-QTOF-MS the most common secondary metabolites produced by these two species of cyanobacteria; (ii) quantify microcystin variants by LC-QqQ-MS/MS; and, (iii) determine whether the larvae of the freshwater tropical fish Astyanax altiparanae are affected by water-soluble compounds produced by two strains of Microcystis (M. panniformis MIRS-04—a microcystin producer, and M. aeruginosa NPDC-01—a microcystin non-producer.
The two culture collection species of freshwater cyanobacteria had completely distinct metabolite profiles evaluated by comparison of chromatograms, mass spectrometry spectra, as well as by applying the Global Natural Product Social Molecular Networking (GNPS) tools. The results involving the effects of water-soluble extracts from both cyanobacteria on the larval stage of a representative species of neotropical fish A. altiparanae provide information relevant to cyanobacterial blooms, the toxicity of other cyanopeptides and their potential for environment impact.

2. Results

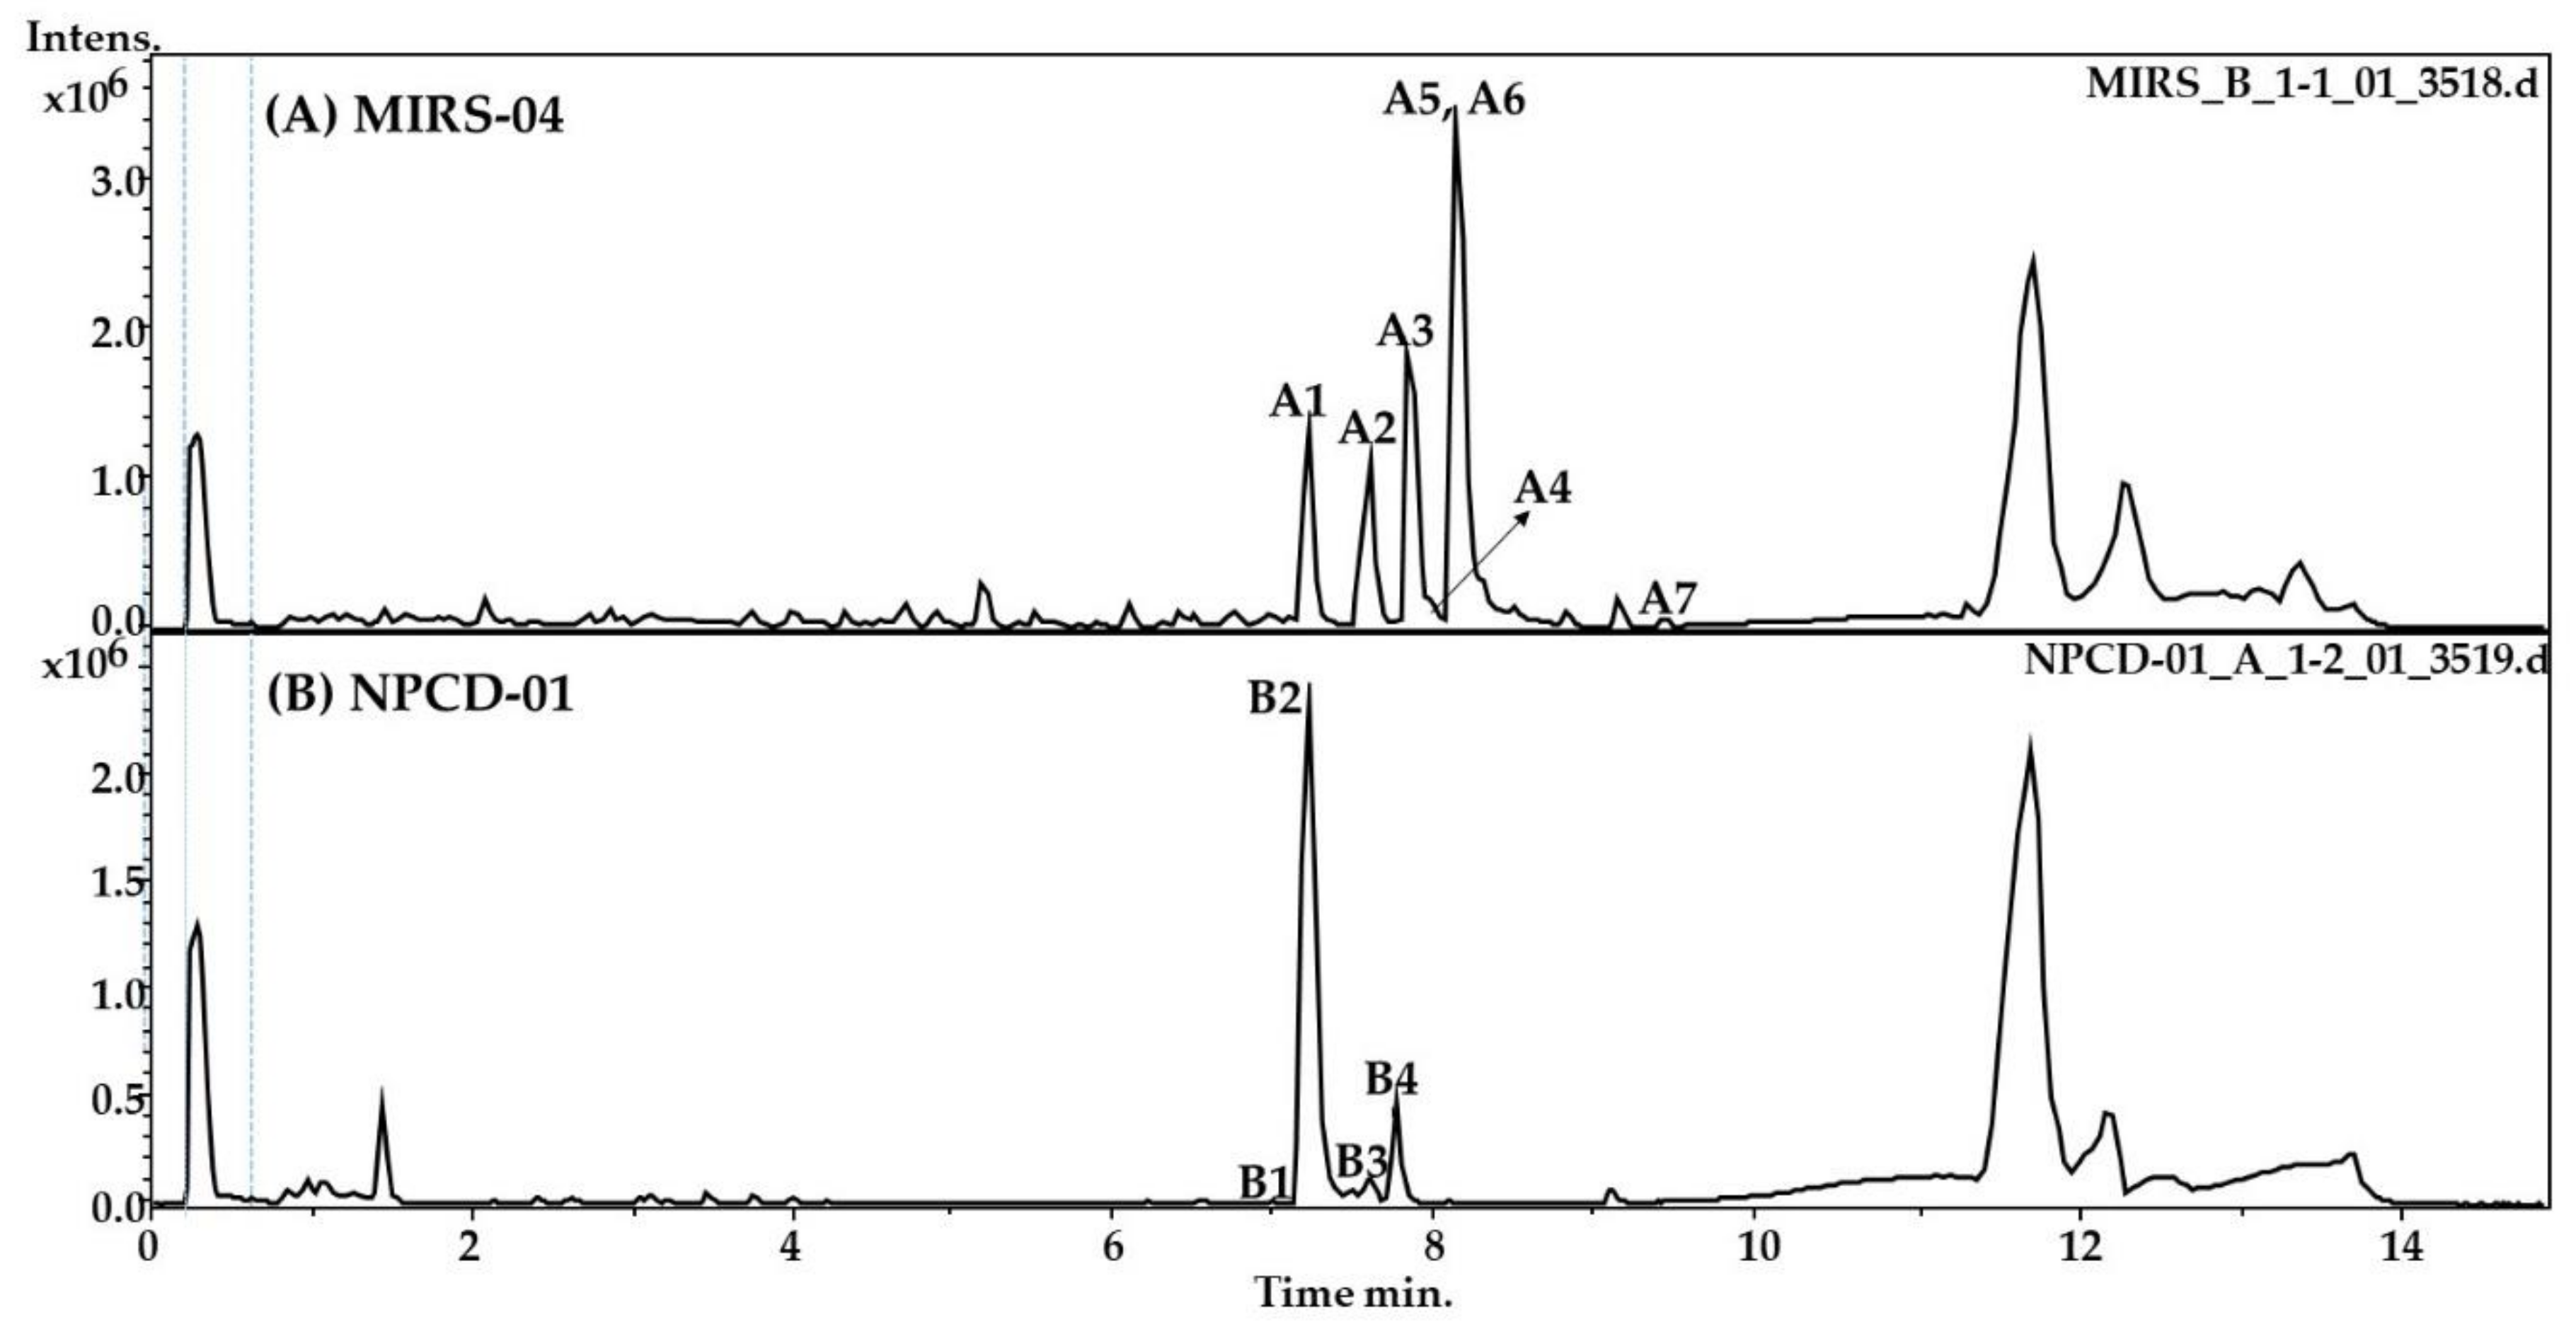
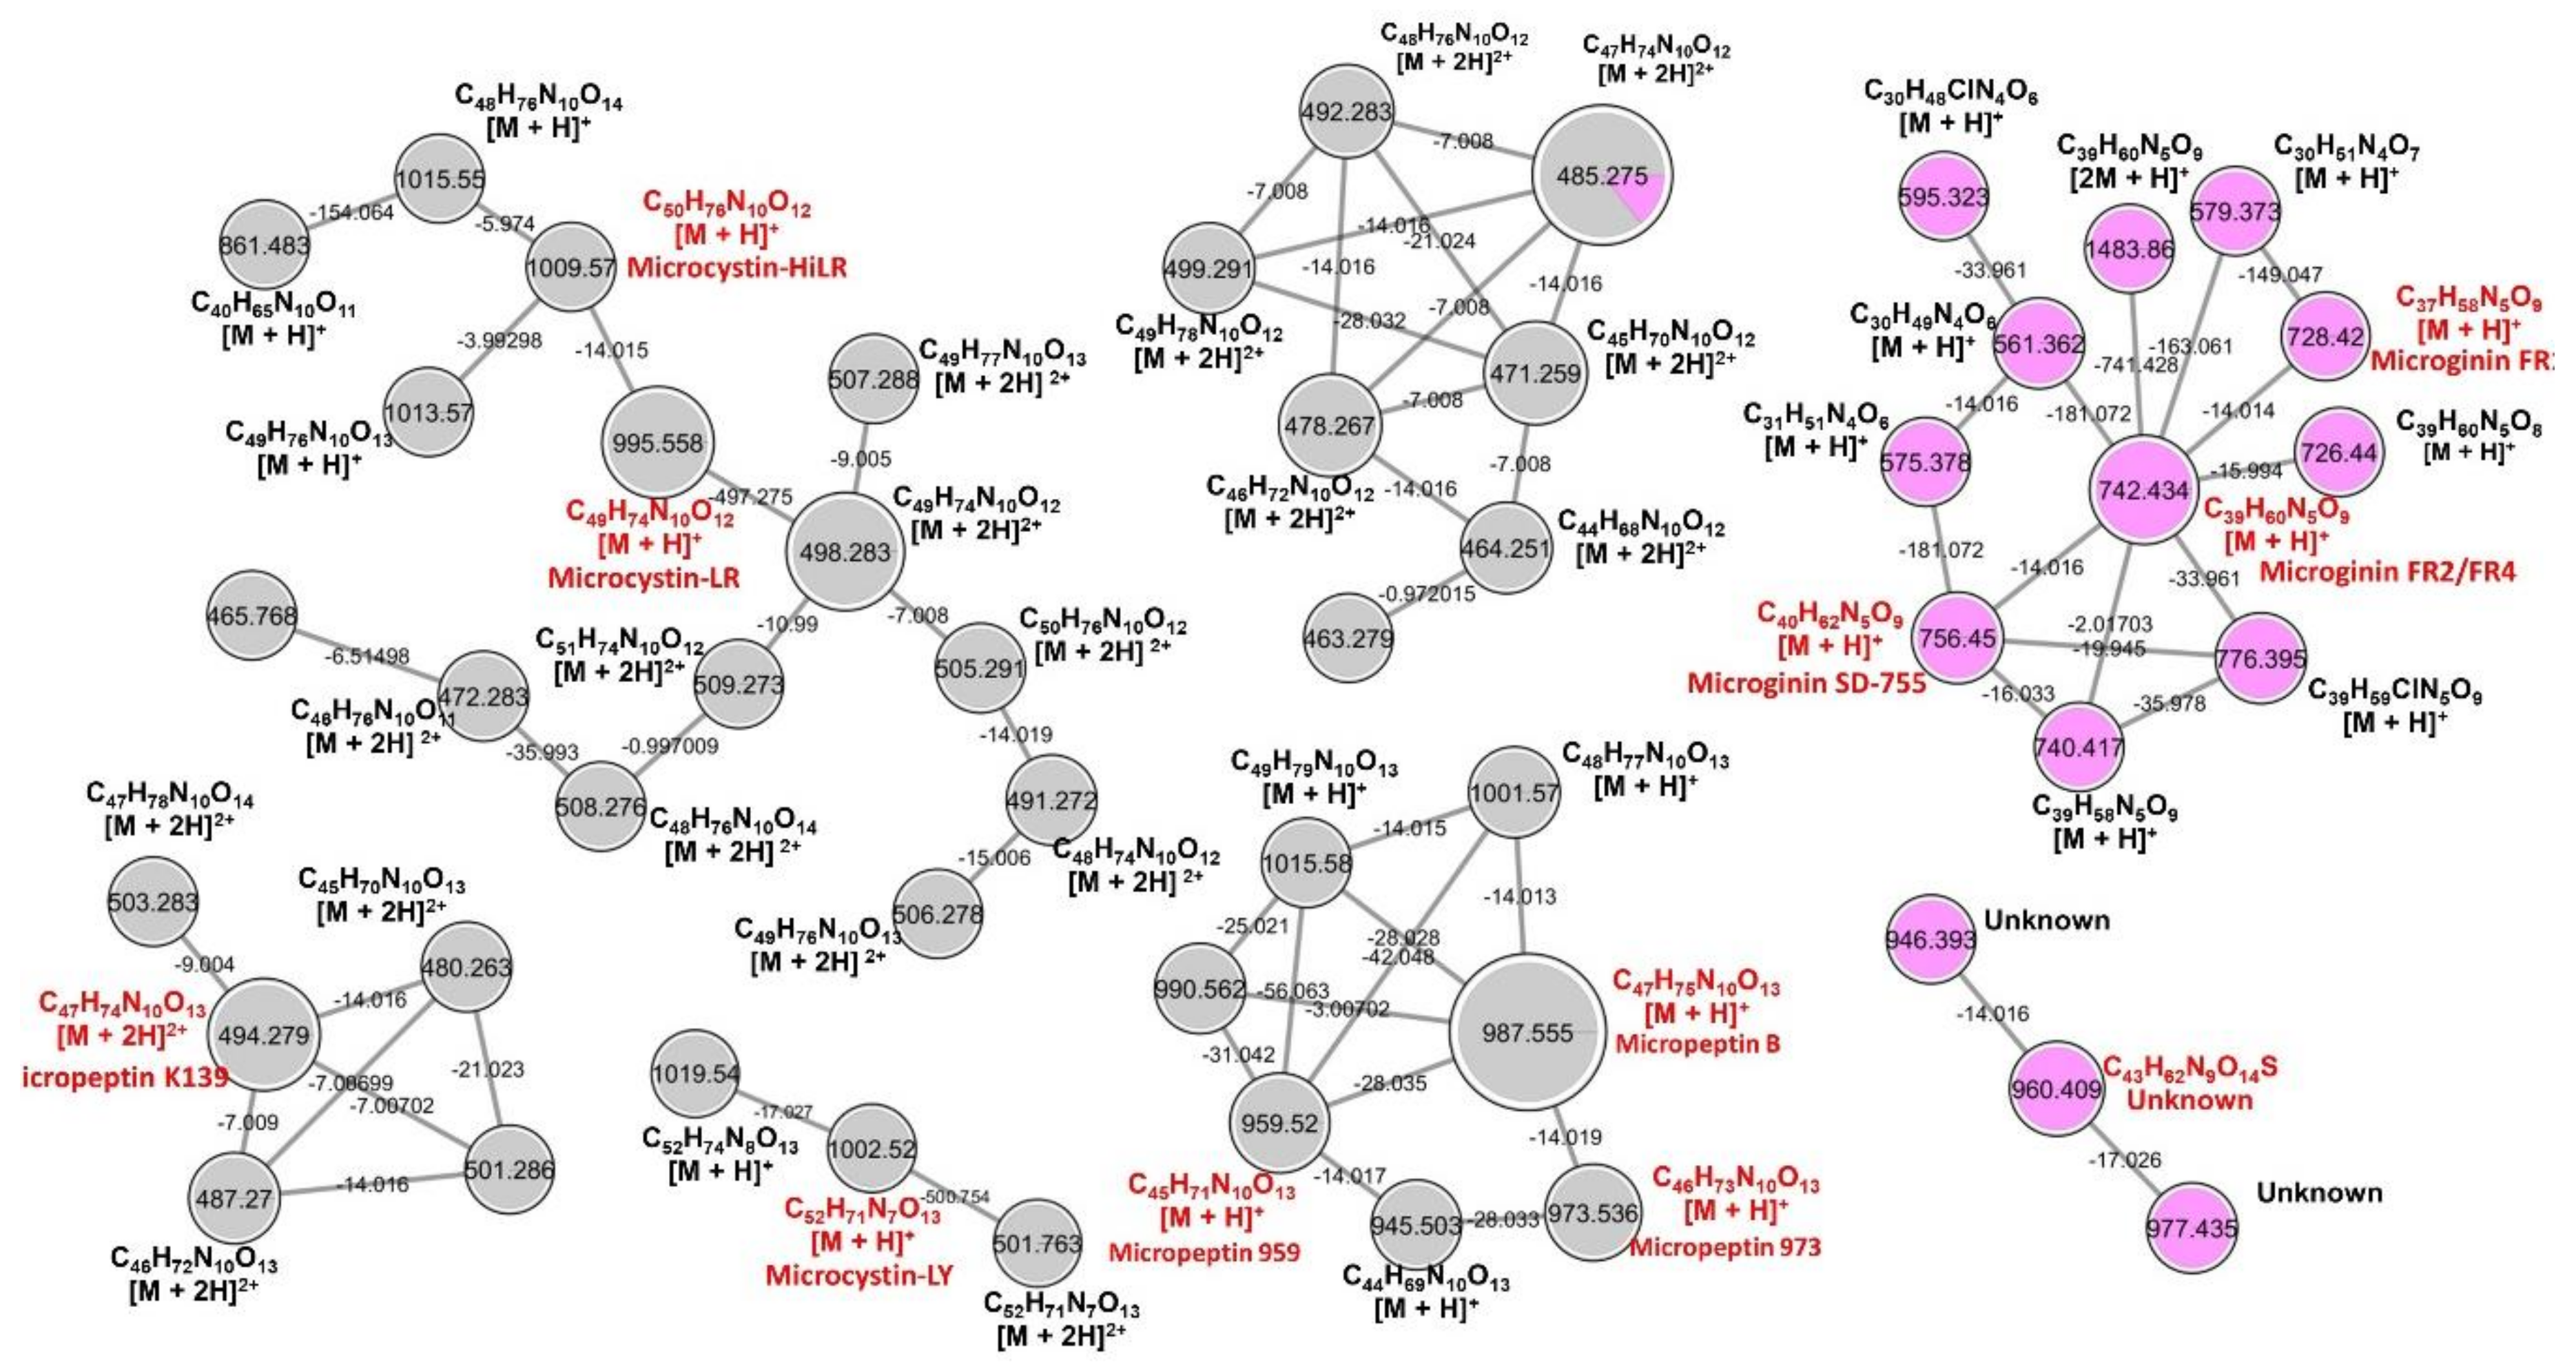
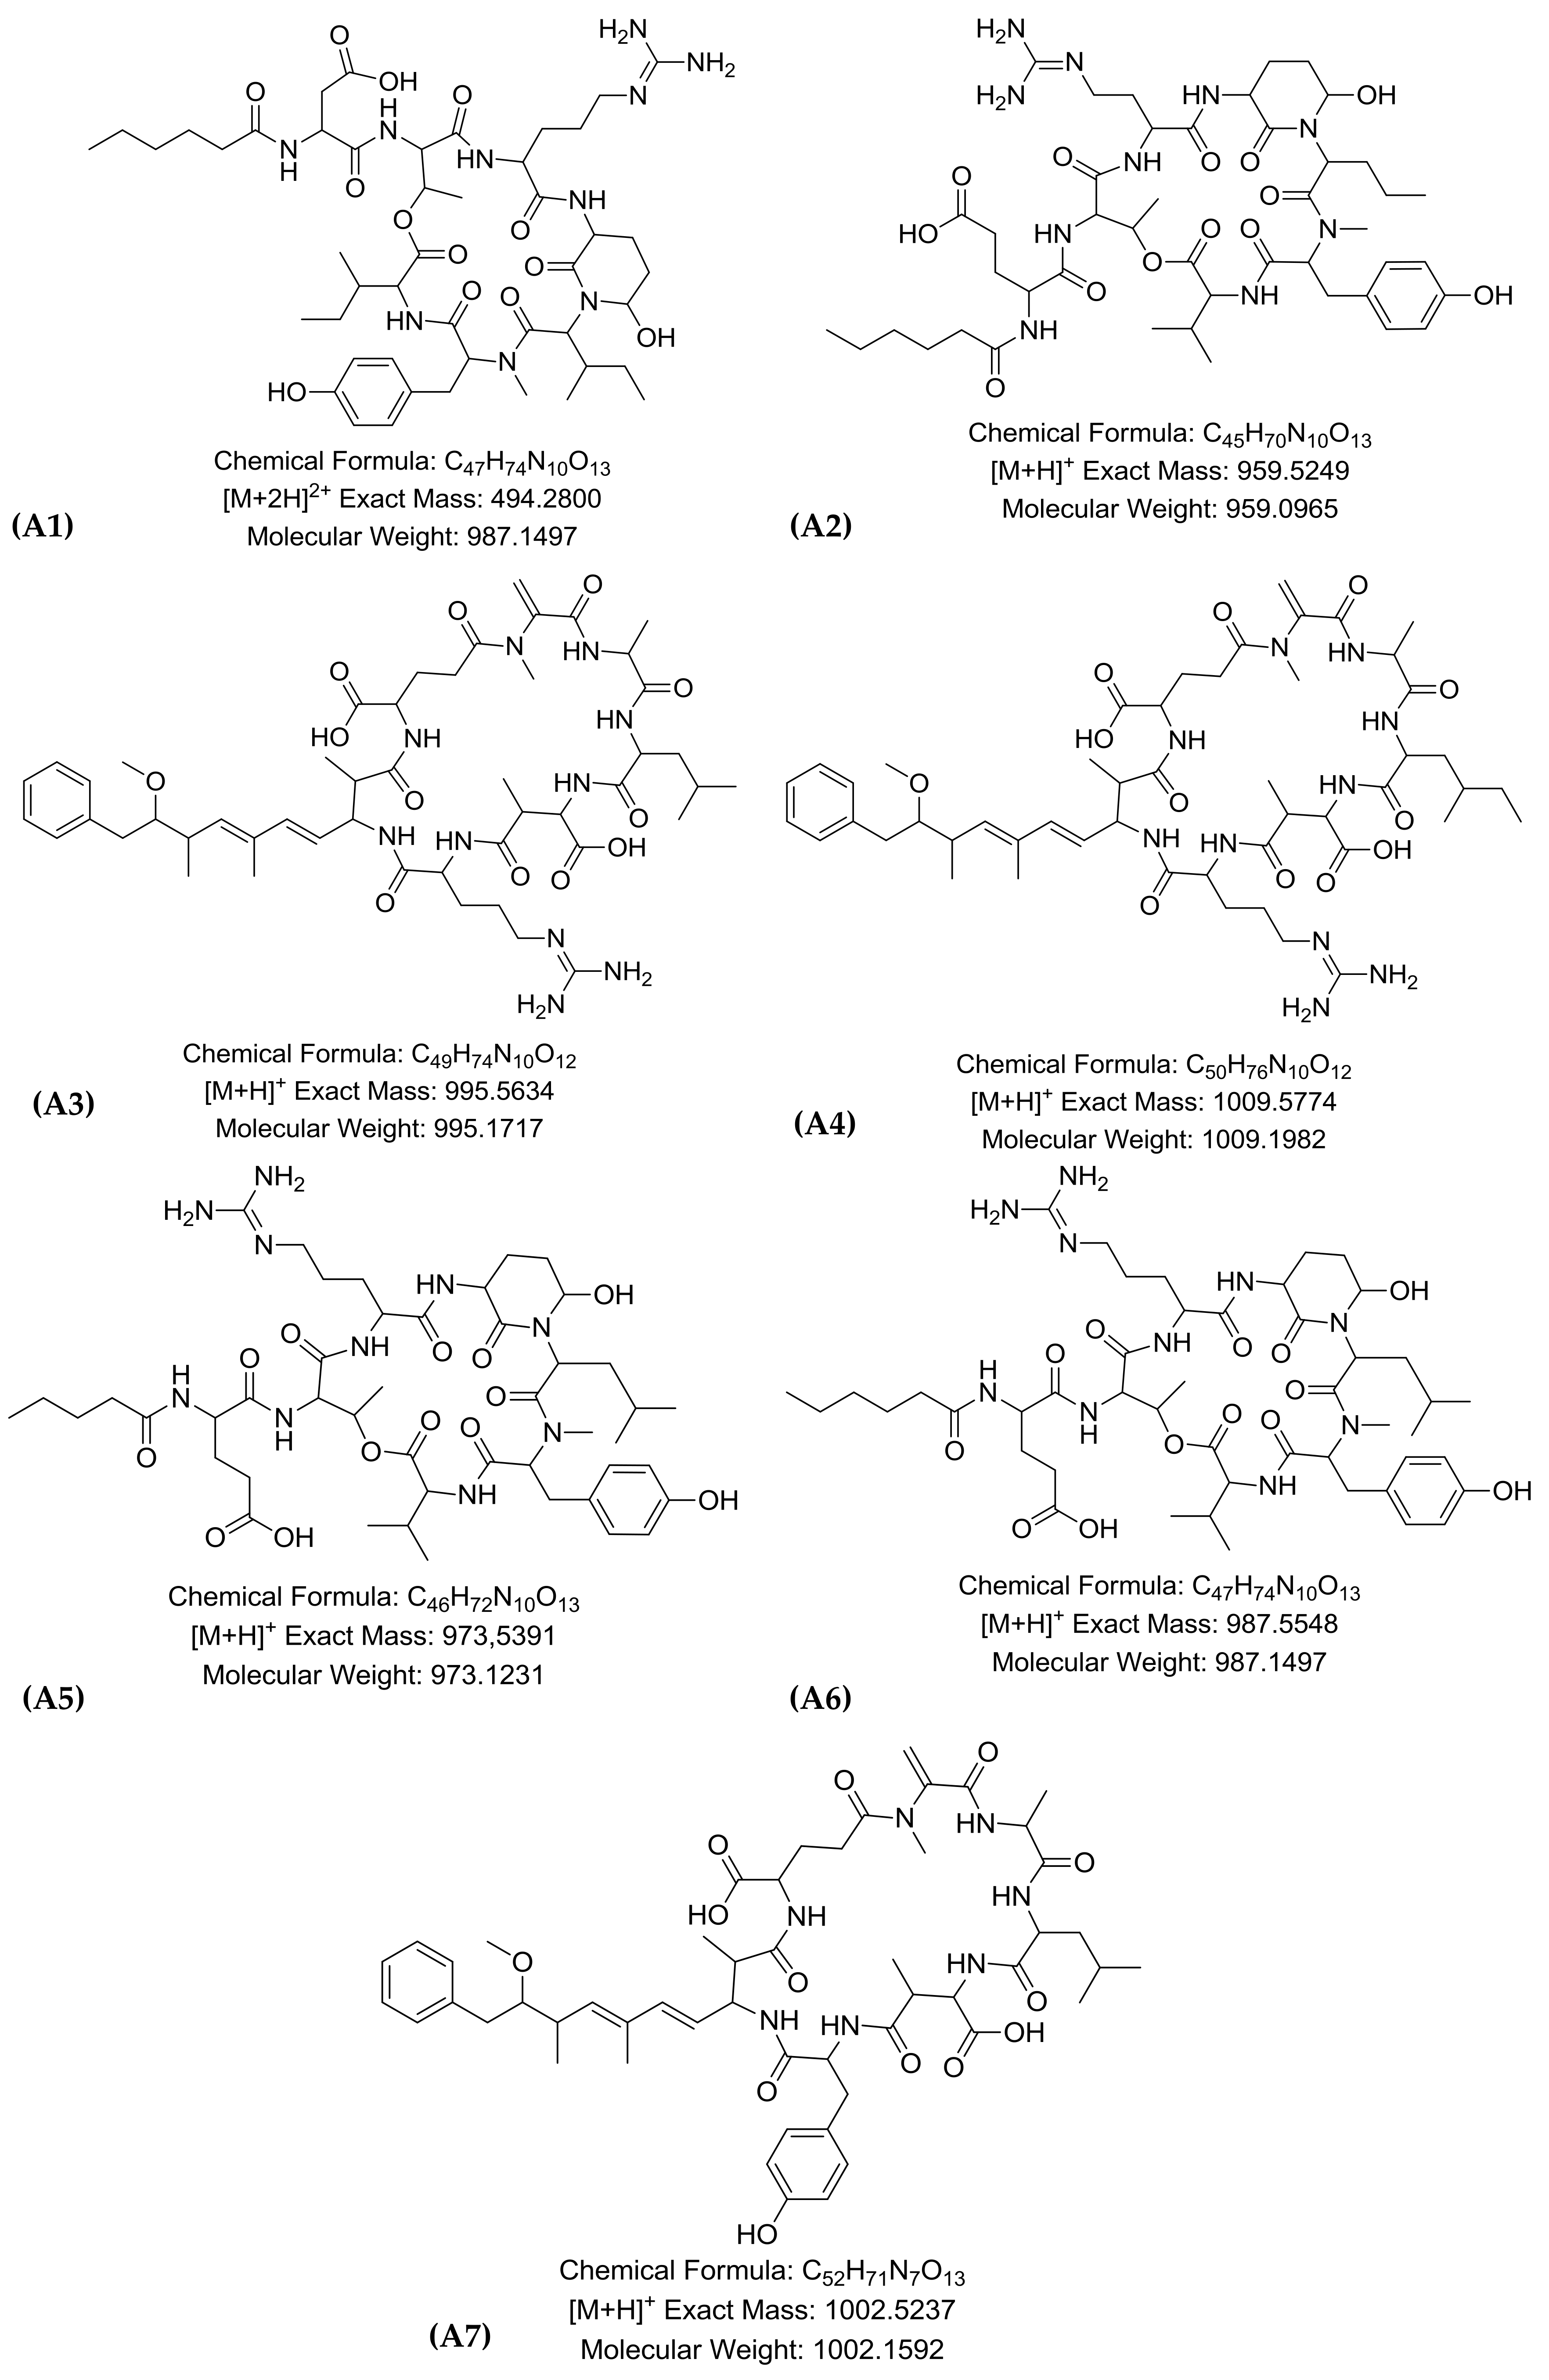
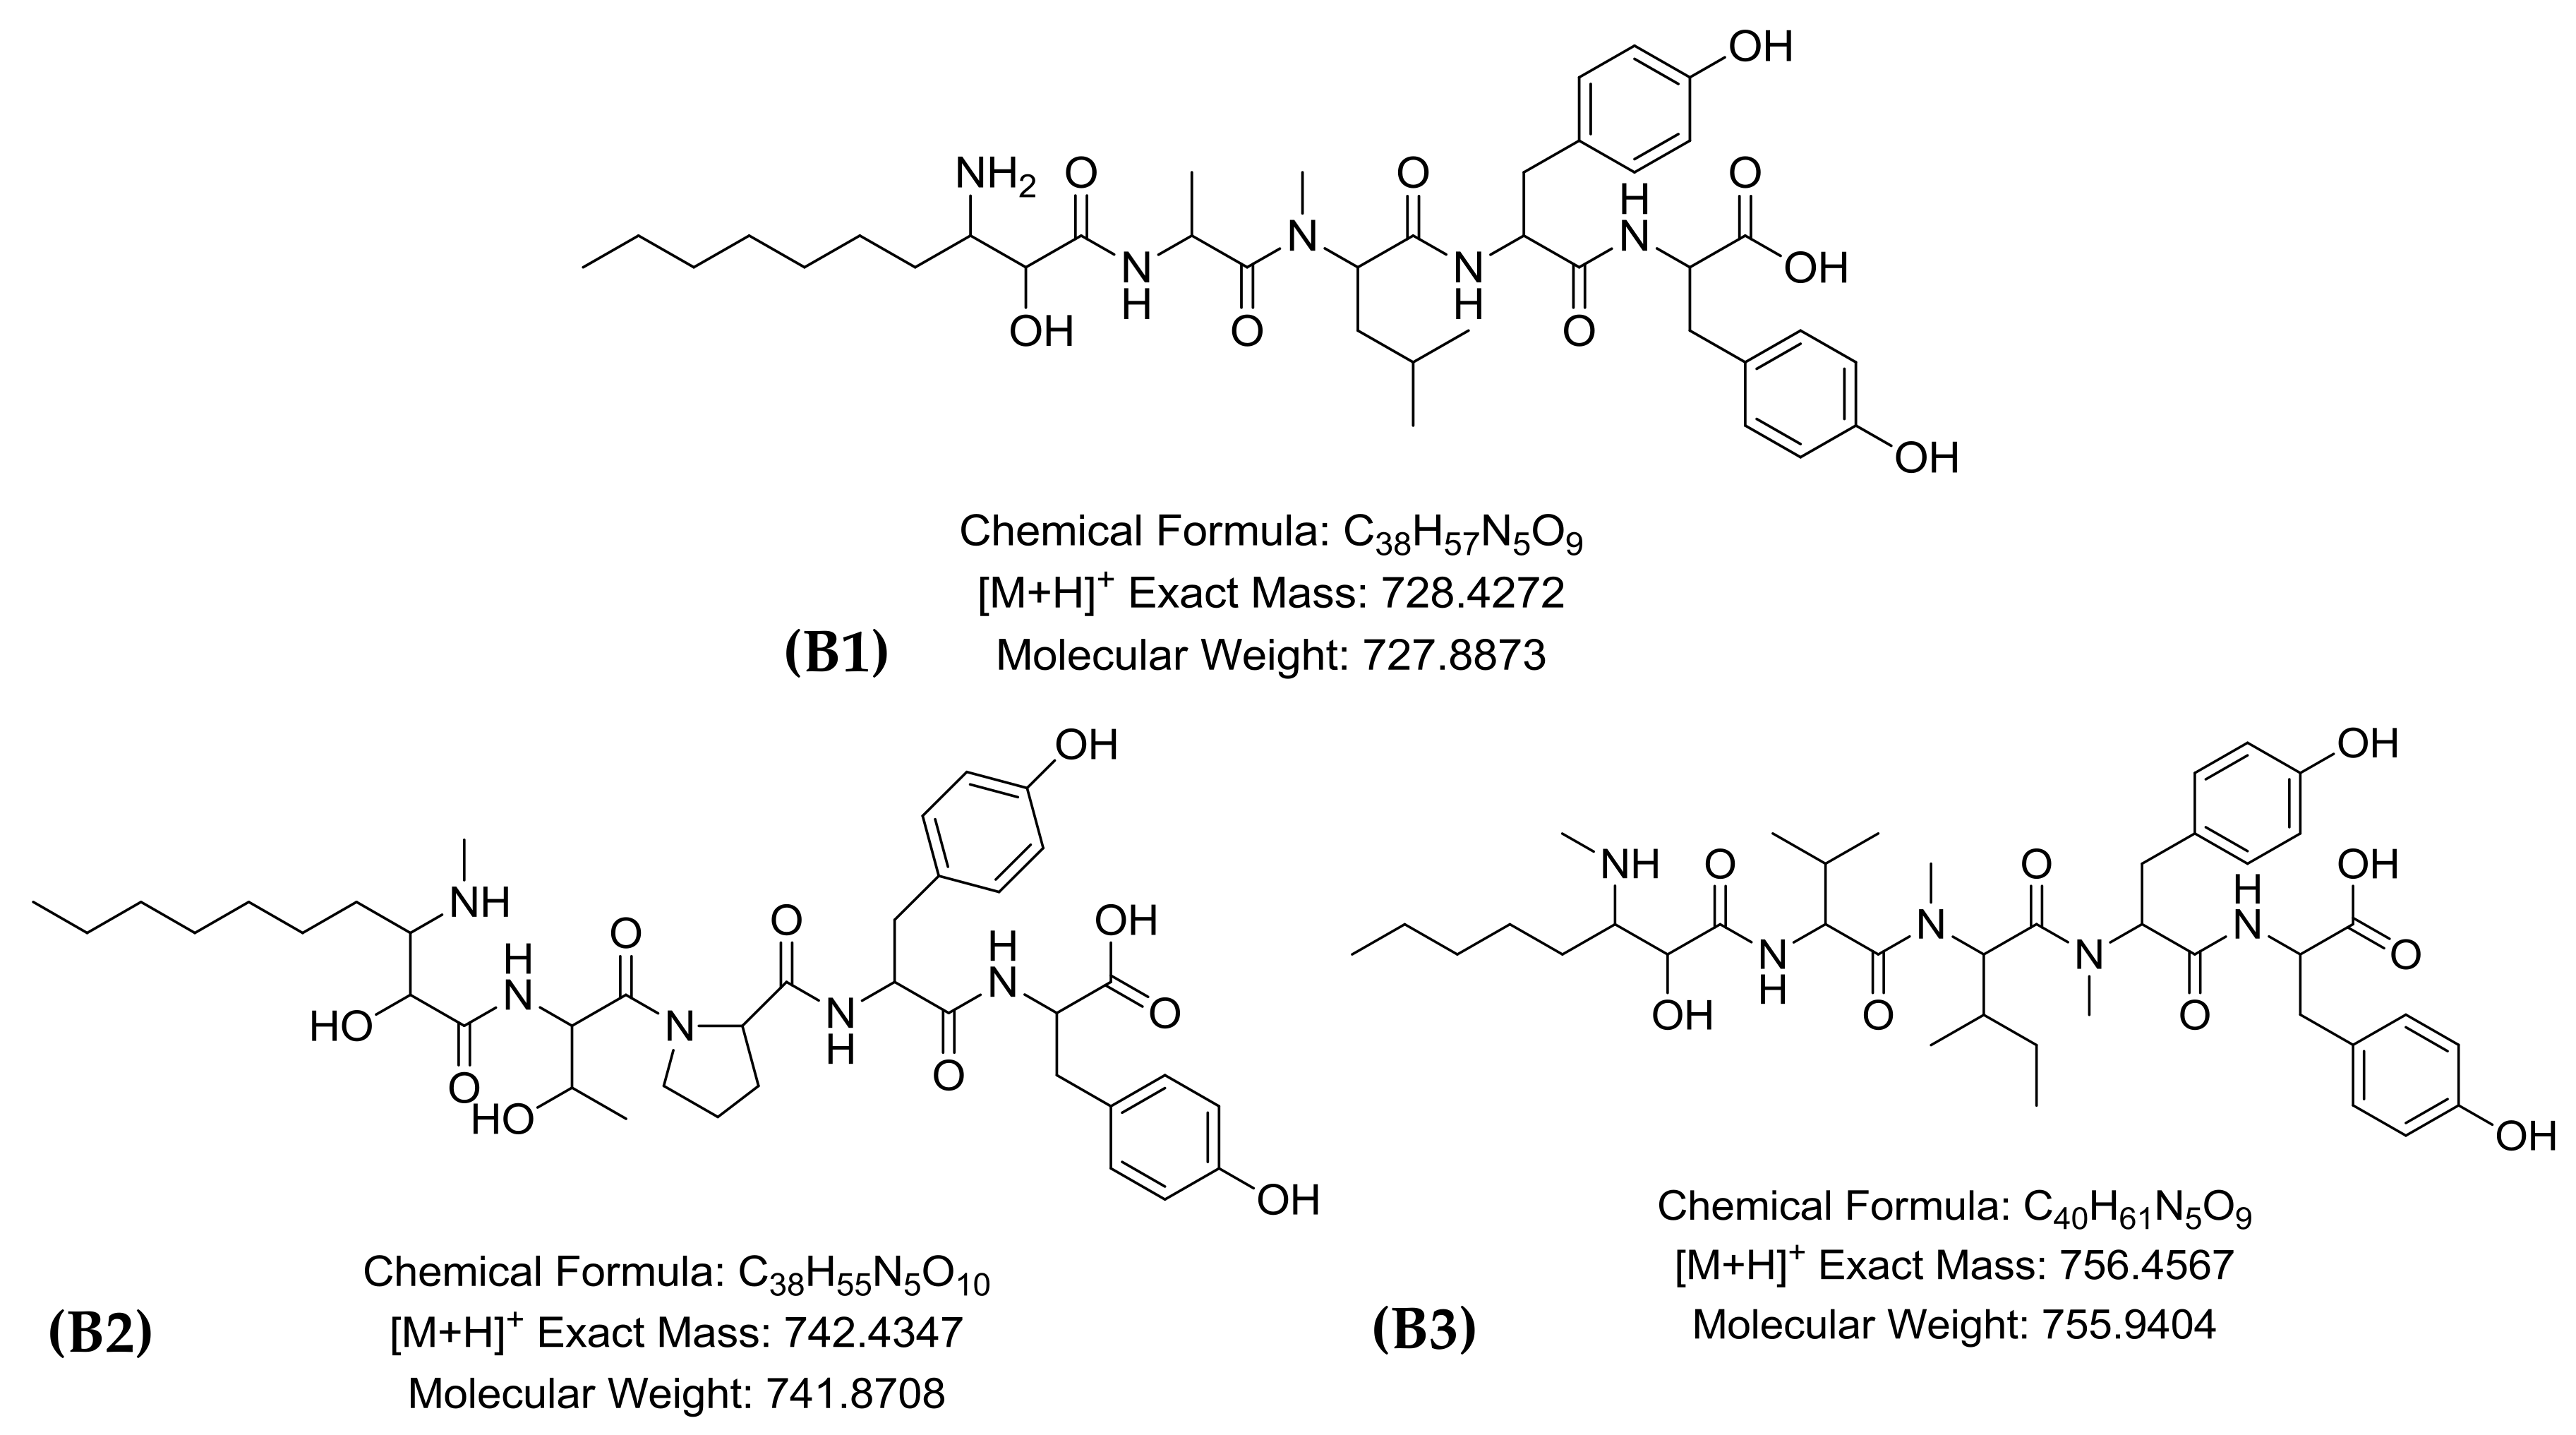
2.1. LC-HR-QTOF-MS Analyses

Figure 1 shows the base peak chromatogram of the most ionizable compounds identified from extracts of strains of M. panniformis MIRS-04 (A) and M. aeruginosa NPCD-01 (B) in the positive ion mode (ESI+). In both extracts, the main abundant compounds eluted between 6 to 10 min; the peaks that appear before and after refer to the conditioning and cleaning of the column (Figure 1). The compounds identified in the extracts were the following: (i) MIRS-04 strain: MC-LR, MC-LY, MC-HilR, micropeptin K139, micropeptin B, micropeptin 959 and micropeptin 973; and (ii) NPCD-01 strain: microginins predominated, microginin FR1, microginin FR2/FR4, microginin SD-755, and a possible variant of cyanopeptolin were found (Table 1).
Cyanopeptides were identified according to their deconvoluted mass spectra, m/z, molecular formula, exact mass, MS2 spectra and also using the GNPS database. Cytoscape was applied for analyzing molecules clustering with a similar fragmentation profile. Cytoscape software integrated main molecules (Table 1) with other peaks and spectra present in the samples, creating groups of compounds with similar characteristics and fragmentation profiles (Figure 2).
MS2 spectra of all peaks were further investigated to tentatively characterize the cyanopeptides present in each strain. The MS2 spectra of [M + 2H]2+ 494.2797 (micropeptin k139), [M + H]+ m/z 959.5249 (micropeptin 959), m/z 973.5391 (micropeptin 973) and m/z 987.5548 (micropeptin B) (Figure S1, Supplementary Material) have similar fragmentation patterns as described by Harada et al. [12] for micropeptins, cyclic structures composed of 3-amino-6-hydroxy-2-piperidone (Ahp), and six amino acid residues: L-arg, L-Ahp, LN-MeTyr, L-Asp [13] (Figure 3).
Microcystins are cyclic peptides that present a general structure containing seven amino acid residues including the unusual Adda (2S,3S,4E,6E,8S,9S)-3-amino-9-methoxy-2,6,8-trimethyl-10-phenyldeca-4,6-dienoic acid) [14] (Figure 3). The MS2 spectra of the microcystins [M + H]+ m/z 995.5634 (MC-LR), m/z 1009.5774 (MC-HilR), m/z 1002.5237 (MC-LY) showed a profile of characteristic fragment ions at m/z 135 corresponding to the [phenyl-CH2CH(OCH3)]+ from Adda and Glu-Mdha + H (m/z 213), which are commonly found in microcystins’ MS2 spectra [14,15,16] (Figure S1, Supplementary Material).
The MS2 spectra of microginins [M+H]+ m/z 728.4272 (microginin FR1); m/z 742.4347 (microginin FR2/FR4), m/z 756.4667 (microginin SD-755) showed an Ahda (3-amino-2-hydroxydecanoic acid) fragment with m/z 128 and MeAhda (N-methyl-3-amino-2-hydroxydecanoic acid) fragment (m/z 142) (Figure S2, Supplementary Material), diagnostic ions from the cleavage of Adha either demethylated or the N-methylated variant, respectively [17,18,19] (Figure 4). Peak 4 (Figure 1), ion m/z 960.4188, was not completely identified. The ion assignations for the MS2 spectrum for m/z = 404 [Ahp-Phe-MePhe -H2O]+, m/z = 292 [Phe-MePhe -H2O]+, m/z = 243 [Ahp-Phe -H2O]+, m/z = 215 [Ahp-Phe -H2O -CO]+, m/z = 135 [MePhe]+, m/z = 120 (immonium ion typical for Phe) and m/z = 86 (immonium ion typical for Leu/ILe) (Figure S2, Supplementary Material), followed the classification suggested by Welker et al. [20], therefore, we suggested this compound to be variant of cyanopeptolin.

2.2. MC-LR Quantification by LC-QqQ-MS/MS

The commercially available analytical standards of MC-LR, MC-RR, MC-LA and MC-YR were considered for this study and their detection and quantification were carried out in aqueous extracts of both strains. Only MC-LR was detected and quantified in the M. panniformis. The concentrations of MC-LR were 0.15, 0.30, 0.44, 0.59 and 0.74 μg/mL, equivalent to 0.1, 0.2, 0.3, 0.4 and 0.5 mg (dry weight)/mL of MIRS-04 aqueous extract. Microcystins LR, RR, LA and YR were not detected in the strain NPCD-01, including the analyses by LC-HR-QTOF-MS as described above and also by searching the precursor ions corresponding to the losses of m/z 135 from Adda and m/z 265 for ADMAdda containing compounds (Figure S3, Supplementary Material). Therefore, strain NPCD-01 was defined as a MC non-producer.

2.3. Acute Toxicity

Exposure conditions (dissolved oxygen 8.0 to 8.6 mg/L) and experiment endpoints (mortality and morphological changes <10% in unexposed controls) were acceptable for interpretation of treatment effects. Larval fish mortality increased with concentration and duration of exposure in fish exposed to both MIRS-04 and NPCD-01 strains. At the 0.4 and 0.5 mg/mL concentrations tested, mortality was greater than 50% within 24 h and above 90% after in 96-h exposure, p < 0.05 (Figure 5). LC50 values of the MIRS-04 strain (MC producer) were 0.40 (0.36–0.44) mg/mL in 24 h and 0.24 (0.21–0.26) mg/mL in 96 h of exposure time and to NPCD-01 (MC non-producer) strain were 0.42 (0.39–0.44) mg/mL in 24 h and 0.32 (0.28–0.35) mg/mL in 96 h (Figure 5).

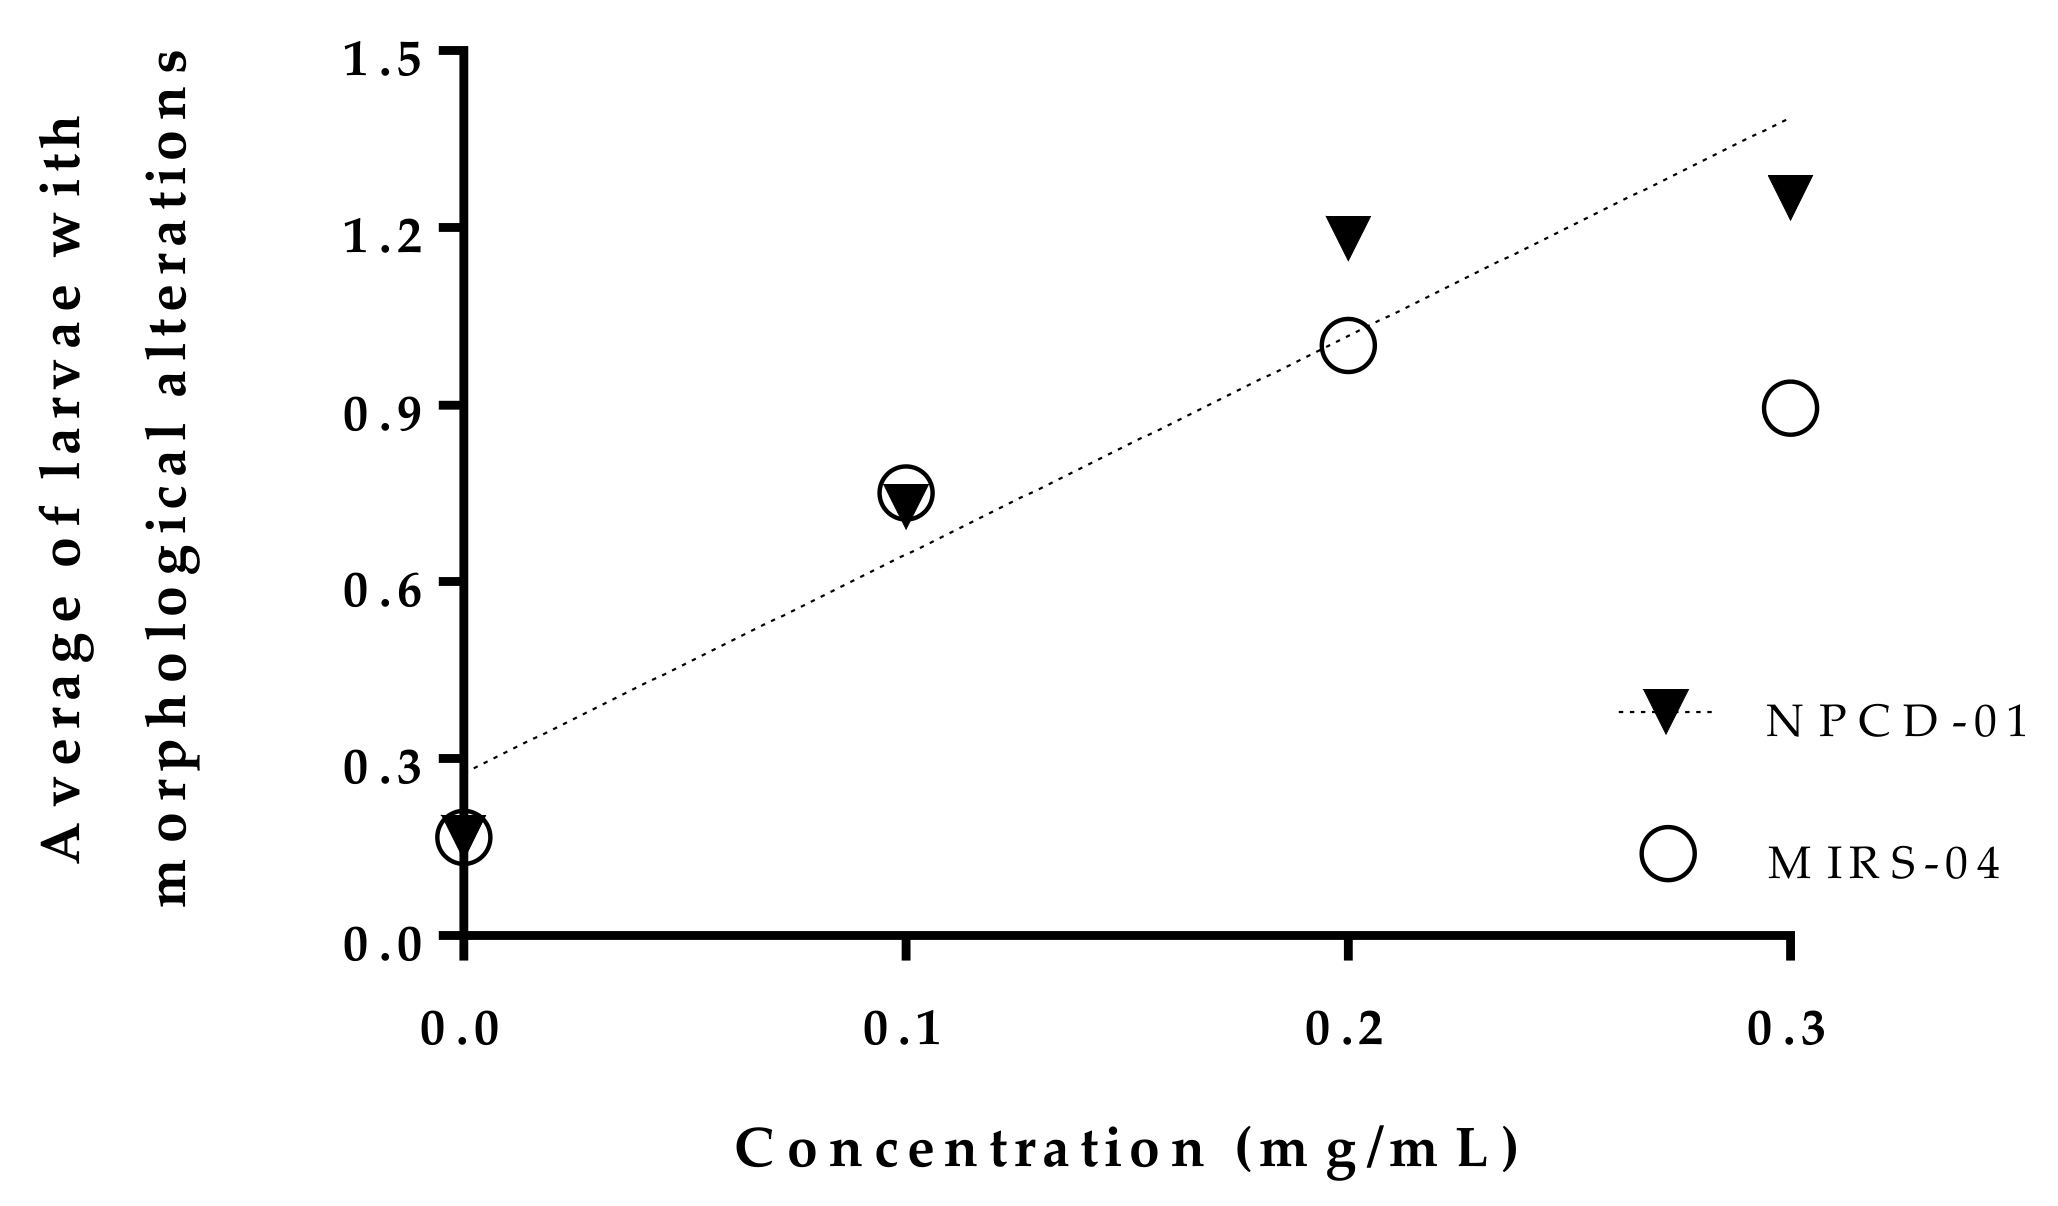
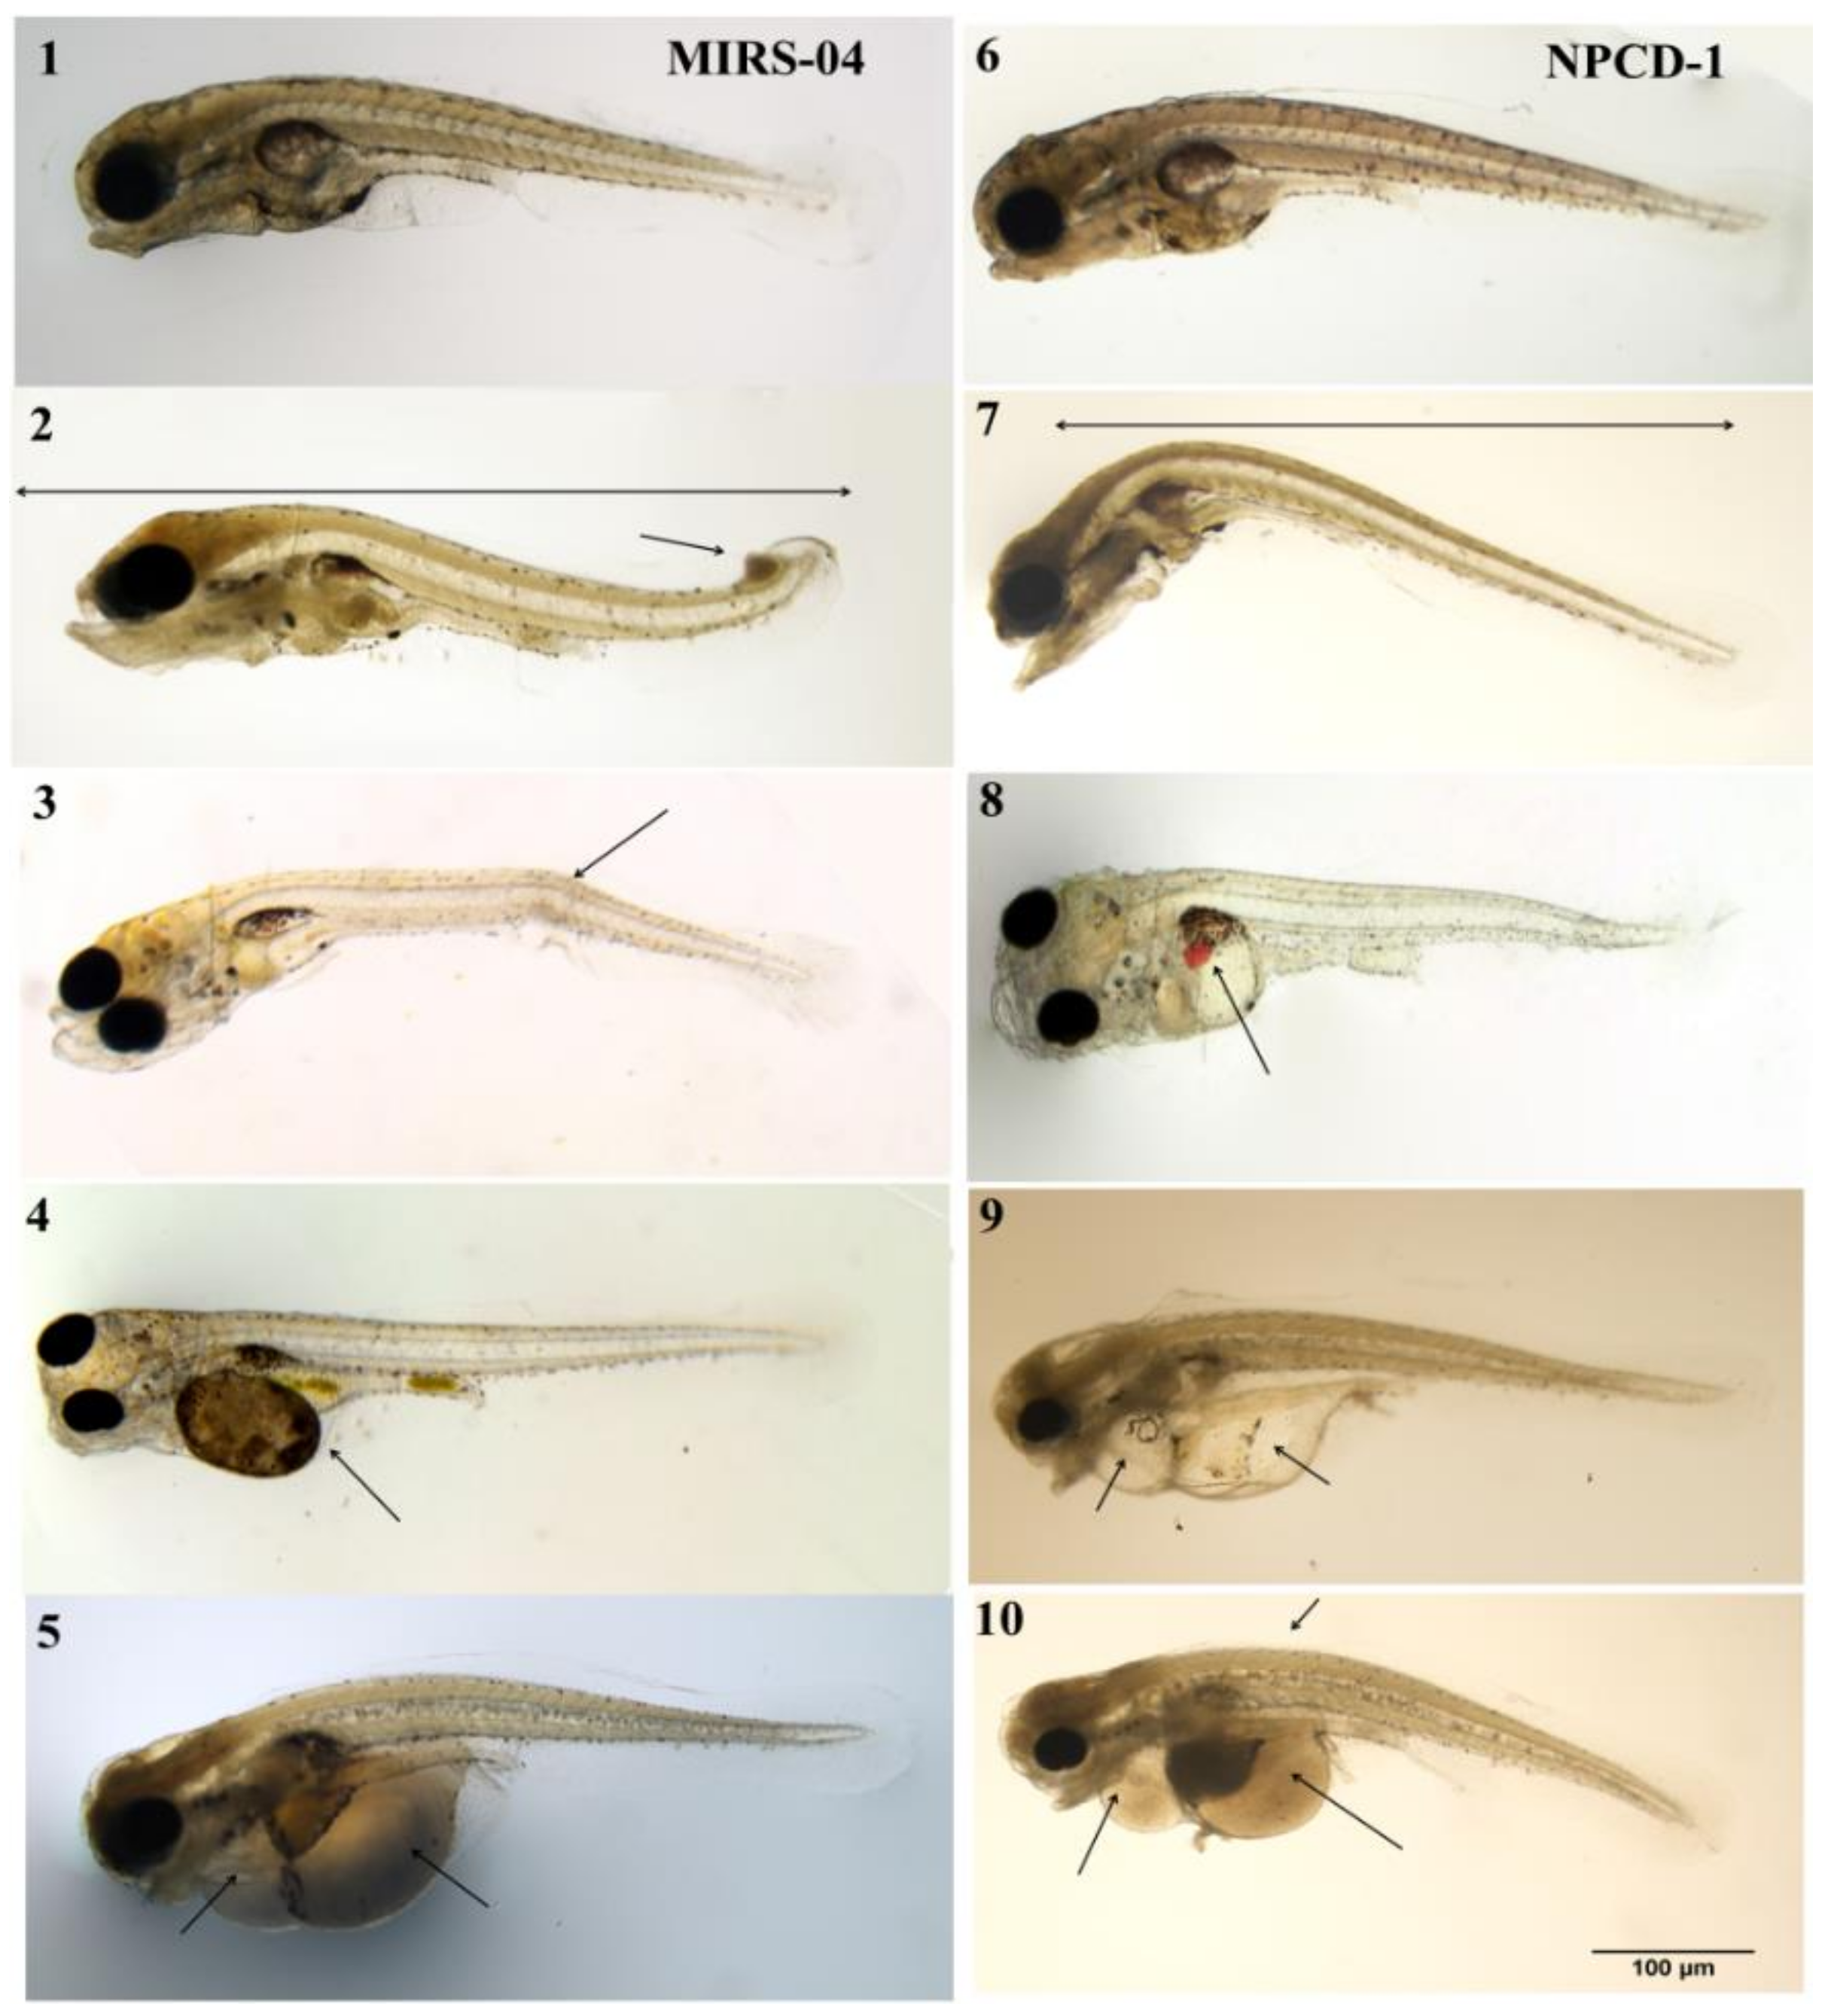
2.4. Morphological Changes

The morphological abnormalities observed in the larvae of A. altiparanae exposed to Microcystis ssp. extracts were observed in a significantly higher proportion of fish compared to the control (Table 2). The morphological abnormalities observed were oedema in the pericardium, oedema in the region of the digestive system, curvature of the tail and lordosis, and occurred after exposure to both strains MIRS-04 and NPCD-01 (Table 2). Oedema in the pericardial region (OPC) and oedema in the digestive system (ODS) were observed in the three concentrations of strain MIRS-04 and NPCD-01 (Table 3). The tail curvature was observed at 0.2 mg/mL and 0.3 mg/mL NPCD-01. Oedema in the digestive system was observed at higher frequency than pericardial oedema (p < 0.05).
From the total of observed larvae, >50% presented oedema in the digestive system (ODS) at an exposure concentration of 0.3 mg/mL of the strains MIRS-04 and NPCD-01 p < 0.05 (Table 3). The larvae exposed at the concentration of 0.3 mg/mL of MIRS-04 and NPCD-01 presented up to three different types of morphological alterations in the larvae (Figure 6). The results of the morphological alterations also showed that the number of abnormalities in the larvae increased with the concentration of the extracts, p < 0.05 (Figure 6 and Figure 7).

3. Discussion

Our results document the presence of distinct peptide profiles produced by M. panniformis (MIRS-04) and M. aeruginosa (NPCD-01). The linear peptides named as microginins were the most abundant compounds found in NPCD-01, while the MIRS-04 strain presented mainly cyclic variants such as microcystins and micropeptins (Table 1). M. panniformis and M. aeruginosa are cosmopolitan phytoplanktonic species commonly found in cyanobacterial bloom episodes in South America [24] and are also able to produce microcystins [25,26]. In fact, secondary metabolites from freshwater cyanophytes have been reported in the literature as potent bioactive compounds, including toxic compounds and molecules presenting other mechanisms of action [27].
In order to tentatively identify the most abundant peptides in Microcystis species, we used our in-house tandem mass spectral library search to annotate MS/MS spectra from screening cyanometabolites. MS/MS-based annotation of chemical structures acquired with high resolution (i.e., QTOF and Orbitrap) has been increasing in the environmental field [28] and public libraries for natural products can be more easily found nowadays, such as in the GNPS [29]. Cytoscape allowed us to generate molecular network profiles that were exclusive for both strains and illustrated clearly that they are distinct (Figure 2). Although freshwater cyanobacterial metabolites are poorly covered in GNPS, some marine related compounds in environmental marine cyanobacteria were identified using a similar approach [30].
NPCD-01 was already analysed by a direct competitive ELISA based on polyclonal antibodies (Beacon Analytical Systems Inc., Saco, ME, USA) and microcystins were not detected in this strain of Microcystis aeruginosa [31]. We also quantified MC-LR in MIRS-04 and water-soluble extracts were prepared based on its concentration by dried weight, varying from 0.15 to 0.74 µg/mL of MC-LR, as well as for NPCD-01 (non-MC-producer) equivalent in mg/mL of dried cells. MS/MS-based annotation revealed in the MIRS-04 extract two other types of microcystins, MC-HilR and MC-LY, both of which were not quantified because there are no commercial analytical standards available. Other peptides such as micropeptins (micropeptin K139, micropeptin B, micropeptin 959 and micropeptin 973) were also identified in extracts of strain MIRS-04. In the analysis of NPCD-01 extract, we identified three microginins (microginin FR1, microginin FR2/FR4 and microginin SS-755) and a possible cyanopeptolin variant (not characterized). We also investigated in the QTOF ESI+ extracted ion chromatograms, the presence of ADMAdda + H - CH3COOH - NH3 (m/z = 265) and PhCH2CH(OMe)+ (m/z = 135) (from Adda), diagnostic ions for microcystins. We did not find any peak corresponding to these ions (Figure S3, Supplementary Material).
The concentration and distribution of MCs in freshwater lentic systems were quite variable due to the methodologies applied to their detection and quantification [32]. However, high levels of MCs (including intracellular and extracellular) have been reported in different continents during cyanobacterial bloom events and these concentrations range from 0 to 36.5 mg/L [32,33,34].
Cyanobacterial blooms and the presence of several polar metabolites are relatively common and well described worldwide [5,35,36,37]. Usually, cyanotoxins have been carefully investigated in aquatic environments and their toxicity, dynamics, environmental fate, bioavailability, accumulation and magnification are documented [38,39]. Therefore, water-soluble extracts derived from cyanobacteria are a realistic option for studying synergy and toxicological effects of cyanopeptides in aquatic organisms [40].
The synergetic effects among polar secondary metabolites excreted by cyanobacteria during their life stages and senescence, especially the co-existence of toxins and other bioactive peptides in the same environment and similar availability, are only now being investigated in aquatic ecosystems [40]. Most studies reported allelopathy and quorum-sensing proprieties for cyanobacterial metabolite [41,42] interaction with other organisms in water [43,44]. Dynamics of cyanopeptides in the aquatic food web are available in the literature; however, only a few ecotoxicological studies with peptides other than toxins have been published so far [45]. Generally, the toxicity of these compounds seems to be low and in inhibition activity assays, however, some linear and cyclic peptides show extremely low IC50 for several key enzymes in the metabolism [27,46,47].
Considering these aspects, we evaluated the possible synergy and potential toxicity of different polar metabolites produced by two species of cyanobacteria that were previously classified as microcystin-producer and non-producer on the larva development of A. altiparanae, one of the most common fish species in tropical Brazilian water bodies [48,49] Astyanax altiparanae is a non-migratory omnivorous fish native from Brazil and the Astyanax genus has an abundance of species distributed throughout the Neotropical region [49,50]. This species is an excellent candidate to be used as model for ecotoxicological studies [49,50,51,52,53]. Thus, we chose this species to verify its sensitivity to cyanotoxins, secondary and primary metabolites.
We investigated water-soluble extracts of both Microcystis and they showed very similar results for mortality and morphological changes in larvae of A. altiparanae. In addition to MCs, especially MC-LR, other substances such as microginins, micropeptins and a possible cyanopeptin might also be toxic in the life cycle of freshwater fish. LC50 values for the extracts of MIRS-04 and NPCD-01 were equivalent, and results did not differ statistically between the two species of Microcystis. However, the effect of strain MIRS-04 was more pronounced than that of strain NPCD-01, indicating the presence of MCs toxin may increase the toxic effects observed in A. altiparanae larvae. Most of the studies relate the concentration of MCs present in crude cyanobacteria extracts to the observed effect. Concentrations range from 0.05 μg/mL to 460 μg/mL and fish species commonly used are Danio rerio, Oncorhynchus mykiss, Oryzias latipes, Misguruns mizolepis and Cyprinus carpio [54,55,56,57,58]. The relationship between embryo-laval or adult fish exposure to total cyanobacterial metabolites is usually accompanied by lethality, teratogenic effects, developmental retardation, morphological and histopathological changes, as well as behavioral changes in diet or swimming movements [38,59,60,61,62,63]. Consequently, the results can vary significantly, according to the profile of primary and mainly secondary metabolites as well as the fish species (native or exotic) and time of exposure.
Omnivorous fish are most susceptible to the accumulation and transfer of cyanotoxins and other potentially toxic metabolites through food webs [64,65]. However, other substances of cyanobacteria might be equally toxic, as shown in our study. The metabolites produced by the NPCD-01 strain, especially microginins, could cause similar toxicity compared to the MIRS-04 strain, which is able to produce microcystins.
The effect of microginins on aquatic organisms is still poorly studied. Microginins as well as micropeptins and cyanopeptolins are described as bioactive compounds involved in the inhibition of mammalian proteases such as the Angiotensin Converting Enzyme (ACE), resulting in decreased blood pressure [19,23,27]. The biological activity of the Microcystis spp biomass containing FR1 microginins was evaluated by Neumann et al. [17] and Forchert et al. [66], showing inhibition of proteases and cytotoxic action in the embryonic development of Danio rerio. Considering the morphological changes during exposure, we observed equivalent results for the larvae of A. altiparanae. These alterations may have been caused by exposure to microginins. Other effects were reported on Allium plant cells also using the biomass of strain NPCD-01, the same used in the present study. The results showed that the compounds present in NPCD-01 extract, including the microginin variant m/z 742, caused genotoxic effects, inhibition of root growth and root abnormalities on Allium cells [31].
The changes we describe herein include oedema in the abdominal region, mainly in the heart and digestive system. Similar results were also reported in other studies [54,55,58,67,68]. Tissue haemorrhage was noticed in some samples and was probably caused by the presence of MC-LR, LY and HilR variants produced by MIRS 04 strain (Figure 7). Irregular swimming movements triggered by extract exposure may have caused the alterations in the tail and spine curvature of A. altiparanae larvae. This behavior was compared to control treatment larvae, which showed normal straight and regular swimming movements (Figure 7). Under stressful conditions, metabolic changes are expected in response to different environmental variations and the development of tissue oedema, size and shape modification are effects previously reported for several aquatic organisms [56]. In the initial stage of fish development, these effects may compromise survival since larvae are more sensitive to toxic compounds in freshwater ecosystems [68,69,70,71,72,73].

4. Conclusions

Our study demonstrates that exposure to water-soluble metabolites of cyanobacteria can cause toxicity in developing fish larvae and that effects are not solely caused by exposure to cyanotoxins. Exposure to these secondary metabolites resulted in concentration-related increase in fish mortality and abnormal morphology/development. Characterization of the secondary metabolites produced by cyanobacteria and investigation of their toxicity individually and in combination are essential for understanding the substances responsible for negative effects. Finally, the present study is further confirmation that negative effects of blooms of cyanobacteria are not limited to the toxins they produce, and management of these bloom episodes must consider more than just the concentration of cyanotoxins present in surface waters.

5. Materials and Methods

5.1. Cultivation of Microcystis Strains

The experiments were conducted using two cyanobacteria strains: Microcystis panniformis (MIRS-04) isolated from the Samuel Reservoir in Rondônia, Brazil, and Microcystis aeruginosa (NPDC-01) isolated from a Jacarepaguá lagoon in Rio de Janeiro, Brazil. All strains were obtained from the culture collection of the Laboratory of Ecophysiology and Toxicology of Cyanobacteria (LECT), at the Federal University of Rio de Janeiro (UFRJ -Brazil).
The strains MIRS-04 and NPCD-01 were grown in ASM-1 medium, pH adjusted to 7.5, for 20 days [74]. The culture flasks were maintained under a light intensity of 40 μmol photons m−2 s−1, photoperiod of 12 h, continuous aeration and temperature of 24.0 ± 1.0 °C. After 20 days of growth, the cultures were interrupted and centrifuged (Eppendorf 5804R, BR) at 10,000 RPM for 10 min at 4 °C. The resulting biomass was stored at −20 °C and then lyophilized. Lyophilized cells were used in the analyses of the secondary metabolites by LC-HR-QTOF-MS, quantification of MC-LR by LC-QqQ-MS/MS and for acute toxicity tests with A. altiparanae larvae.

5.2. Extraction Procedure

The extraction of microcystins and cyanopeptides from the strains of Microcystis ssp. followed the freeze-thaw protocol with some adaptations of methods described in the literature that are usually used to extract water-soluble cyanotoxins and other substances from cyanobacteria [38]. Stock solutions were prepared from 100 mg of MIRS-04 and NPCD-01 dry cells diluted in 20 mL of Milli-Q water with the addition of 12 mM NaCl, 1 mM KCl, 1.5 mM CaCl2, and 1.5 mM MgCl2 (reconstituted water used for the development of A. altiparanae). The extracts were frozen at −20 °C and thawed at 23 °C, freeze-thaw cycles were performed for 6 consecutive times with 3 h intervals. The broken cells were stored at −20 °C until analysis for secondary metabolite identification, quantification of MCs and the acute toxicity tests with A. altiparanae.

5.3. LC-HR-QTOF-MS—Analyses

The samples used in this analysis were prepared from stock solutions of the MIRS-04 and NPCD-01 strains and dilutions of the samples were performed with reconstituted water. Solutions with 5 mg/mL were used for both strains. The extracts were centrifuged at 11.000 RPM, 4 °C for 10 min and the supernatants collected and filtered on 0.22 μm PVDF membranes (Millipore, Bedford, MA, USA) [36]. The M. panniformis (MIRS-04) and M. aeruginosa extracts (NPCD-01) were analyzed using an ultra-high performance liquid chromatograph (Shimadzu, Kyoto, Japan) coupled to a hybrid quadrupole time-of-flight high resolution mass spectrometer (LC-HR-QTOF-MS) (Compact II, Bruker Daltonics Corporation, Germany) equipped with an electrospray ionization (ESI) source in positive mode. Chromatographic separation was performed with a Trio Column C18 packed with 2.0 μm particle size, 2 × 100 mm column (YMC Technology, Allentown, PA, USA) at a flow rate of 0.4 mL/min.
The gradient mixture of solvents A (H2O with 0.1% formic acid; v/v) and B (acetonitrile: H2O [90:10] with 0.1% formic acid; v/v) (Sigma-Aldrich, Darmstadt, Germany), was the following: from 5% to 95% B in 10 min, maintained at 95% B 10–12 min, 5% B 12–12.5 min, and maintained at 5% B 12.5–15 min at 40 °C. The capillary voltage was operated in the positive and negative ionization modes, set at 4500 and 3000 V, respectively; with an end plate offset potential of −500 V. The dry gas parameters were set to 9 L min/−1 at 200 °C with a nebulization gas pressure of 5 bar.
Data were collected from m/z 60 to 2000 with an acquisition rate of 5 Hz, and the variable number of ions was selected by auto MS/MS scan fragmentation with a cycle time of 2.5 seconds. The MS/MS data were analyzed using Bruker Compass Data Analysis 4.3 software, and it was possible to calculate the experimental mass of each compound [M + H]+ and [M + 2H]2+, the molecular formula, the error in ppm <5 and millisigma values (mSigma) < 20.

5.4. Molecular Networking

The Molecular Network (MN) approach required the conversion of mass spectrometry raw data into mzXML file format followed by upload to the Global Natural Products Social Molecular Networking site (GNPS—https://gnps.ucsd.edu) [29]. The MN was generated so that edges had a cosine score above 0.65 and six matched peaks. Edges between two nodes were kept in the MN if each of the nodes appeared in each other’s respective top 10 most similar nodes and then clustering with MS-Cluster with parent mass and MS/MS fragment ion tolerances of 0.02 Da. Consensus spectra that contained less than two spectra were discarded. The spectra in the MN were then searched against GNPS spectral libraries. The library spectra were filtered in the same manner as the input data. All matches between network spectra and library spectra were required to have a score above 0.65 and at least six matched peaks. The MN data was downloaded and visualized in Cytoscape [75].

5.5. Liquid Chromatography–Tandem Mass Spectrometry LC-QqQ-MS/MS Analyses

The quantification of MCs in aqueous extracts of the MIRS-04 and NPCD-01 strains was performed by LC-QqQ-MS/MS using a method previously validated by our group [76]. The extracts used in this analysis were also prepared from stock solutions of the MIRS-04 and NPCD-01 strains at a concentration of 5 mg/mL. The major microcystin variants MC-LR, MC-RR, MC-LA and MC-YR (Abraxis, Warminster, PA, USA) were used to determine the concentration of MCs in the extracts. Analytical standards were prepared in MilliQ water at concentrations of 0.1 µg/ml to 5 µg/mL. Identification and quantification of MC in the MIRS-04 strain extract were determined by tandem MS/MS analysis performed in multi-Reaction Monitoring Mode (MRM), monitoring the ionic products of m/z 135 and 213 common to the variants of microcystins that are most commonly found in the environment.
A calibration curve was constructed with MC solutions ranging from 0.1, 0.5, 2.0, 3.0, 5.0, µg/mL of mixed MCs. MC-LR was identified by comparing the sample retention time of the extracts with the retention time of the analytical standard. The concentration of MC-LR in the MIRS-04 strain was determined from the linear relationship between the areas of the precursor ion [M + H]+ of m/z 995.5 corresponding to the protonated molecule, which also produces m/z [M + H]+ 135 and 213.
The samples were analyzed and quantified in an Agilent 1260 Infinity chromatographic system coupled to a triple quadrupole mass spectrometer (6460 Triple Quadruplo LC-MS, Agilent Technologies, Santa Clara, CA, USA), with ionization by electrospray (ESI), in positive mode at 3500V. Nitrogen was used as the gas nebulizer (45 psi) and drying gas (5 mL/min at 300 ° C). Separation of the compounds was performed on a Synergi Fusion-RP, 4 μm, 80 Å, 150 × 2.0 mm column (Phenomenex, Torrance, CA, USA) under linear gradient. The gradient mixture of solvents A (H2O with 0.1% formic acid; v/v) and B (acetonitrile:H2O [90:10], with 0.1% formic acid; v/v) (Sigma-Aldrich, Darmstadt, Germany), both containing 2mM of ammonium formate at a flow rate of 0.25 mL min, was as follos: from 35% to B in 10 min, maintained at 50% B 10–12 min, 100% B 12–13 min, and maintained at 35% B 14–20 min at 40 °C. The volume of injection used for the analyses with analytical standards of microcystins and extracts of strain MIRS-04 were 5 μL, at the different concentrations.

5.6. Samples Preparation for the Toxicity Tests

The concentrations used in the assays were prepared from the dry weight of strain MIRS-04 and NPCD-01, diluted in reconstituted aqueous medium (12 mM NaCl, 1 mM KCl, 1.5 mM CaCl2, 1.5 mM MgCl2) as described in item 5.2 Extraction procedure. The extract concentrations of the MIRS-04 and NPCD-01 strains were established from initial tests on logarithmic scales. After this procedure, the find concentrations 0.1, 0.2, 0.3, 0.4 and 0.5 mg/mL were used for both assays with the Microcystis strains.

5.7. Astyanax Altiparanae Larvae Acquisition

The experiments were conducted at the National Center for Research and Conservation of Continental Fish (CEPTA) of the Chico Mendes Institute of Conservation and Biodiversity (ICMBio) Pirassununga, São Paulo State, Brazil, between October and February (2015/2016). This study was approved on 12th of June of 2015 by the ethics committee of CEPTA for the use of specimens of A. altiparanae according to the Normative Resolutions of the National Council for the Control of Animal Experimentation (CONCEA) protocol number 007/2015. Adult specimens of A. altiparanae were collected in the Mogi Guaçu River (21°58′S, 47°26′W), in Pirassununga, São Paulo, Brazil.
The broodstock were kept in tanks (11.25 m3) with constant water flow and fed twice a day with commercial pellets. After a few weeks, the fish were selected for reproduction based on external morphology (females presenting increased volume of the peritoneal cavity and males present tiny hooks in the anal fin). Different pairs of fish were used to ensure the genetic variability of the group of A. altiparanae larvae evaluated in the acute toxicity tests. After approximately 10 h, the fish were anesthetized in 100 mg/L of menthol (Exodus Sciencia, São Paulo, Brazil). In the females, injections were applied intraperitoneally under the caudal fin at the dose of 3 mg/kg of hormone (OVOPEL® [(D-Ala6,Pro9-Net)-mGnRH+metaclopramide]) [77,78,79].
After the hormonal inductions, brood stock were returned to the aquarium for breeding. After 6 h of breeding, all eggs were collected from the aquarium and divided into glass Petri dishes (100 mm diameter) coated with bovine serum albumin 0.1% (Sigma-Aldrich, Darmstadt, Germany) with reconstituted water medium. During embryonic development, water was renewed at every two hours and the dead embryos were removed immediately to avoid ammonia contamination. Incubation took place in Petri dishes, which were placed in a biochemical oxygen demand (BOD) incubator with temperature set at 26 °C until toxicity trials.

5.8. Acute Effect in Larvae of Astyanax Altiparanae

The experiments were performed with larvae 2 h post hatching, with normal morphological characteristics, such as uniform body, motility, constant heart beat frequency and yolk sac under normal conditions. The assays consisted of five different concentration treatments (dried weight) with extracts from strain MIRS-04 and NPCD-01 and control (only reconstituted water). The larvae were exposed in test tubes with a capacity of 10 mL, in the proportion of one larva/mL. Five replicates were performed, each replicate with 10 larvae per treatment (50 larvae per concentration). All treatments were maintained under the same conditions in a BOD incubator, with temperature set at 26 °C and 12 h of light. An aliquot of the samples used in the two assays was separated to measure the initial and final dissolved oxygen concentration with the aid of a model 5100 YSI oxygen meter (YSI, Yellow Springs, OH, USA).
Observations were made every 24 h from 24 to 96 h determine mortality and to evaluate morphological alterations. Morphology and early development were observed with a Nikon SMZ 1500 stereomicroscope (Nikon, Tokyo, Japan), and digital images obtained with a Ds-F1 CCD camera (Nikon, Tokyo, Japan) with the Nis-Ar Elements software (Nikon, Tokyo, Japan). At each observation, the dead larvae were counted and removed from the dishes in order to maintain the water quality. During these observations, the apparent abnormalities in the surviving larvae of all treatments were also registered for further morphological analysis, such as pericardial oedema, oedema in the digestive system region, curvature of the tail and spine, and changes in body size.

5.9. Statistical Analyses

Nonlinear regression analysis was used to estimate the lethal concentration of 50% the of total population (LC50) of the extracts of M. aeruginosa (NPCD-01) and M. panniformis (MIRS-04) on the larvae of A. altiparanae using GraphPad Prism Version 7.0 software. The other statistical analyses were performed with the statistical software R version 3.1.2 [80]. To evaluate the difference in mortality of A. altiparanae larvae between the different concentrations of MIRS-04 and NPCD-01 strains, analysis of variance analysis (ANOVA) was performed, followed post hoc by Tukey’s test. The morphological alteration data were analysed by the chi-square test (χ2) to verify which of the morphological alteration variables were more representative among the treatments with the extracts of Microcystis ssp. Next, generalized linear regression with a Poisson distribution was performed to test the hypothesis that higher concentrations of the extracts influence the number of morphological changes per larva. The graph of these data was plotted with GraphPad software.

Supplementary Materials

The following are available online at https://www.mdpi.com/2072-6651/11/4/220/s1, Figure S1: MS2 spectra ions products of the compounds identified in strain MIRS-04 extract. Figure S2: MS2 spectra ions products of the compounds identified for the extract of strain NPCD-01 and Figure S3. QTOF ESI+ Extracted ion chromatograms (EIC) to confirming the absence of MCs in the water-soluble extract of NPCD-01 strain.

Author Contributions

Conceptualization, K.F. and A.F.; Methodology: design experimental, K.F., L.C. and E.P.—cultivation of cyanobacteria species, A.F., A.G. and K.F.—mass spectrometry analyses, E.P., D.A. and K.F.—software, D.A.—fish reproduction, K.F., L.C. and G.Y.—statistical analysis K.F. and T.H., Resources, G.Y., A.F. and E.P.; Curation, K.F.; Writing—Original Draft Preparation, K.F., Writing—Review & Editing: K.F., A.F., A.G., L.C., D.A., T.H., G.Y. and E.P.; Preview: A.F. and E.P.; Supervision; A.F. and A.G.; Project Management, A.F., L.C. and E.P.; Acquisition of financing: G.Y., A.F. and E.P.

Funding

This work was supported by the São Paulo State Research Foundation (FAPESP) through a grant from FAPESP (2014/50420-9), University of São Paulo Foundation (FUSP) (Project #1979), the Coordination for the Improvement of Higher Education Personnel (CAPES) (Project # 23038.001401/2018-92) and CNPq (400362/2014-7 PVE, 311048/2016-1 and 439065/2018-6).

Acknowledgments

We acknowledge the whole team of professionals at the National Center for Research and Conservation of Continental Fishes (CEPTA), José Augusto Senhorini and Julio Cesar Cenci de Aguiar (CEPTA) for the space granted to carry out the experiments with specimens of Astyanax altiparanae, Dra Gisela Umbuzeiro (University State of Campinas) and Bruno Fiorelini Pereira (Federal University of the West of Bahia) for suggestions and Kazumi Kinoshita (University of São Paulo) for helping with the quantification of microcystins.

Conflicts of Interest

The authors declare no conflict of interest.

References

  1. Anderson, D.M.; Glibert, P.M.; Burkholder, J.M. Harmful algal blooms and eutrophication: Nutrient sources, composition, and consequences. Estuaries 2002, 25, 704–726. [Google Scholar] [CrossRef]
  2. Pearson, L.; Mihali, T.; Moffitt, M.; Kellmann, R.; Neilan, B. On the Chemistry, Toxicology and Genetics of the Cyanobacterial Toxins, Microcystin, Nodularin, Saxitoxin and Cylindrospermopsin. Mar. Drugs 2010, 8, 1650–1680. [Google Scholar] [CrossRef] [Green Version]
  3. Jaiswal, P.; Singh, P.K.; Prasanna, R. Cyanobacterial bioactive molecules—An overview of their toxic properties. Can. J. Microbiol. 2008, 54, 701–717. [Google Scholar] [CrossRef] [PubMed]
  4. Leflaive, J.; Ten-Hage, L. Algal and cyanobacterial secondary metabolites in freshwaters: A comparison of allelopathic compounds and toxins. Freshw. Biol. 2007, 52, 199–214. [Google Scholar] [CrossRef]
  5. Lifshits, M.; Carmeli, S. Metabolites of Microcystis aeruginosa Bloom Material from Lake Kinneret, Israel. J. Nat. Prod. 2012, 75, 209–219. [Google Scholar] [CrossRef]
  6. Oren, A.; Gunde-Cimerman, N. Mycosporines and mycosporine-like amino acids: UV protectants or multipurpose secondary metabolites? FEMS Microbiol. Lett. 2007, 269, 1–10. [Google Scholar] [CrossRef] [Green Version]
  7. Gademann, K.; Portmann, C. Secondary metabolites from cyanobacteria: Complex structures and powerful bioactivities. Curr. Org. Chem. 2008, 12, 326–341. [Google Scholar] [CrossRef]
  8. Volk, R.-B.; Furkert, F.H. Antialgal, antibacterial and antifungal activity of two metabolites produced and excreted by cyanobacteria during growth. Microbiol. Res. 2006, 161, 180–186. [Google Scholar] [CrossRef] [PubMed]
  9. Legrand, C.; Rengefors, K.; Fistarol, G.O.; Graneli, E. Allelopathy in phytoplankton-biochemical, ecological and evolutionary aspects. Phycologia 2003, 42, 406–419. [Google Scholar] [CrossRef]
  10. Jaja-Chimedza, A.; Saez, C.; Sanchez, K.; Gantar, M.; Berry, J.P. Identification of teratogenic polymethoxy-1-alkenes from Cylindrospermopsis raciborskii, and taxonomically diverse freshwater cyanobacteria and green algae. Harmful Algae 2015, 49, 156–161. [Google Scholar] [CrossRef]
  11. Fischer, W.J.; Hitzfeld, B.C.; Tencalla, F.; Eriksson, J.E.; Mikhailov, A.; Dietrich, D.R. Microcystin-LR toxicodynamics, induced pathology, and immunohistochemical localization in livers of blue-green algae exposed rainbow trout (Oncorhynchus mykiss). Toxicol. Sci. 2000, 54, 365–373. [Google Scholar] [CrossRef]
  12. Harada, K.-I. Production of secondary metabolites by freshwater cyanobacteria. Chem. Pharm. Bull. 2004, 52, 889–899. [Google Scholar] [CrossRef]
  13. Harada, K.I.; Nakano, T.; Fujii, K.; Shirai, M. Comprehensive analysis system using liquid chromatography-mass spectrometry for the biosynthetic study of peptides produced by cyanobacteria. J. Chromatogr. A 2004, 1033, 107–113. [Google Scholar] [CrossRef] [PubMed]
  14. Namikoshi, M.; Sun, F.; Choi, B.W.; Rinehart, K.L.; Carmichael, W.W.; Evans, W.R.; Beasley, V.R. Seven More Microcystins from Homer Lake Cells: Application of the General Method for Structure Assignment of Peptides Containing α,β-Dehydroamino Acid Unit(s). J. Org. Chem. 1995, 60, 3671–3679. [Google Scholar] [CrossRef]
  15. Lombardo, M.; Cristina, R.; Pinto, F.; Maria, S.; Vieira, J.; Yukio Honda, R.; Pimenta, A.; Bemquerer, M.; Carvalho, L.; Kiyota, S. Isolation and structural characterization of microcystin-LR and three minor oligopeptides simultaneously produced by Radiocystis feernandoi (Chroococcales, Cyanobacteriae): A Brazilian toxic cyanobacterium. Toxicon 2006, 47, 560–566. [Google Scholar] [CrossRef] [PubMed]
  16. Krishnamurthy, T.; Szafraniec, L.; Hunt, D.F.; Shabanowitz, J.; Yates, J.R.; Hauer, C.R.; Carmichael, W.W.; Skulberg, O.; Codd, G.A.; Missler, S. Structural characterization of toxic cyclic peptides from blue-green algae by tandem mass spectrometry. Proc. Natl. Acad. Sci. USA 1989, 86, 770–774. [Google Scholar] [CrossRef] [PubMed]
  17. Neumann, U.; Forchert, A.; Flury, T.; Weckesser, J. Microginin FR1, a linear peptide from a water bloom of Microcystis species. FEMS Microbiol. Lett. 1997, 153, 475–478. [Google Scholar] [CrossRef]
  18. Carneiro, R.L.; Dörr, F.F.A.; Dörr, F.F.A.; Bortoli, S.; Delherbe, N.; Vásquez, M.; Pinto, E. Co-occurrence of microcystin and microginin congeners in Brazilian strains of Microcystis sp. FEMS Microbiol. Ecol. 2012, 82, 692–702. [Google Scholar] [CrossRef] [PubMed]
  19. Okino, T.; Matsuda, H.; Murakami, M.; Yamaguchi, K. Microginin, an angiotensin-converting enzyme inhibitor from the blue-green alga Microcystis aeruginosa. Tetrahedron Lett. 1993, 34, 501–504. [Google Scholar] [CrossRef]
  20. Welker, M.; Maršálek, B.; Šejnohová, L.; von Döhren, H. Detection and identification of oligopeptides in Microcystis (cyanobacteria) colonies: Toward an understanding of metabolic diversity. Peptides 2006, 27, 2090–2103. [Google Scholar] [CrossRef]
  21. Silva-Stenico, M.E.; Silva, C.S.P.; Lorenzi, A.S.; Shishido, T.K.; Etchegaray, A.; Lira, S.P.; Moraes, L.A.B.; Fiore, M.F. Non-ribosomal peptides produced by Brazilian cyanobacterial isolates with antimicrobial activity. Microbiol. Res. 2011, 166, 161–175. [Google Scholar] [CrossRef] [PubMed]
  22. Miles, C.O.; Sandvik, M.; Nonga, H.E.; Rundberget, T.; Wilkins, A.L.; Rise, F.; Ballot, A. Identification of microcystins in a Lake Victoria cyanobacterial bloom using LC–MS with thiol derivatization. Toxicon 2013, 70, 21–31. [Google Scholar] [CrossRef]
  23. Reshef, V.; Carmeli, S. Protease inhibitors from a water bloom of the cyanobacterium Microcystis aeruginosa. Tetrahedron 2001, 57, 2885–2894. [Google Scholar] [CrossRef]
  24. Dörr, F.A.; Pinto, E.; Soares, R.M.; de Oliveira e Azevedo, S.M.F. Microcystins in South American aquatic ecosystems: Occurrence, toxicity and toxicological assays. Toxicon 2010, 56, 1247–1256. [Google Scholar] [CrossRef]
  25. Bittencourt-Oliveira, M.C.; Oliveira, M.C.; Pinto, E. Diversity of microcystin-producing genotypes in Brazilian strains of Microcystis (Cyanobacteria). Braz. J. Biol. 2011, 71, 209–216. [Google Scholar] [CrossRef]
  26. Dos Anjos, F.M.; do Carmo Bittencourt-Oliveira, M.; Zajac, M.P.; Hiller, S.; Christian, B.; Erler, K.; Luckas, B.; Pinto, E. Detection of harmful cyanobacteria and their toxins by both PCR amplification and LC-MS during a bloom event. Toxicon 2006, 48, 239–245. [Google Scholar] [CrossRef]
  27. Paiva, F.C.R.; Ferreira, G.M.; Trossini, G.H.G.; Pinto, E. Identification, In Vitro Testing and Molecular Docking Studies of Microginins’ Mechanism of Angiotensin-Converting Enzyme Inhibition. Molecules 2017, 22, 1884. [Google Scholar] [CrossRef]
  28. Kind, T.; Tsugawa, H.; Cajka, T.; Ma, Y.; Lai, Z.; Mehta, S.S.; Wohlgemuth, G.; Barupal, D.K.; Showalter, M.R.; Arita, M.; et al. Identification of small molecules using accurate mass MS/MS search. Mass Spectrom. Rev. 2018, 37, 513–532. [Google Scholar] [CrossRef]
  29. Wang, M.; Carver, J.J.; Phelan, V.V.; Sanchez, L.M.; Garg, N.; Peng, Y.; Nguyen, D.-T.D.D.; Watrous, J.; Kapono, C.A.; Luzzatto-Knaan, T.; et al. Sharing and community curation of mass spectrometry data with Global Natural Products Social Molecular Networking. Nat. Biotechnol. 2016, 34, 828. [Google Scholar] [CrossRef]
  30. Ding, C.; Pang, L.; Liang, Z.-X.; Goh, K.; Glukhov, E.; Gerwick, W.; Tan, L. MS/MS-Based Molecular Networking Approach for the Detection of Aplysiatoxin-Related Compounds in Environmental Marine Cyanobacteria. Mar. Drugs 2018, 16, 505. [Google Scholar] [CrossRef] [PubMed]
  31. Laughinghouse, H.D.; Prá, D.; Silva-Stenico, M.E.; Rieger, A.; Frescura, V.D.S.; Fiore, M.F.; Tedesco, S.B. Biomonitoring genotoxicity and cytotoxicity of Microcystis aeruginosa (Chroococcales, Cyanobacteria) using the Allium cepa test. Sci. Total Environ. 2012, 432, 180–188. [Google Scholar] [CrossRef] [PubMed]
  32. Pham, T.-L.; Utsumi, M. An overview of the accumulation of microcystins in aquatic ecosystems. J. Environ. Manag. 2018, 213, 520–529. [Google Scholar] [CrossRef] [PubMed]
  33. Turner, A.D.; Dhanji-Rapkova, M.; O’Neill, A.; Coates, L.; Lewis, A.; Lewis, K. Analysis of Microcystins in Cyanobacterial Blooms from Freshwater Bodies in England. Toxins 2018, 10, 39. [Google Scholar] [CrossRef]
  34. Preece, E.P.; Hardy, F.J.; Moore, B.C.; Bryan, M. A review of microcystin detections in Estuarine and Marine waters: Environmental implications and human health risk. Harmful Algae 2017, 61, 31–45. [Google Scholar] [CrossRef] [Green Version]
  35. Zafrir, E.; Carmeli, S. Eight novel serine protease inhibitors from a water bloom of the cyanobacterium Microcystis sp. Tetrahedron 2010, 66, 9194–9202. [Google Scholar] [CrossRef]
  36. Sanz, M.; Andreote, A.P.D.; Fiore, M.F.; Dörr, F.A.; Pinto, E. Structural characterization of new peptide variants produced by cyanobacteria from the Brazilian Atlantic coastal Forest using liquid chromatography coupled to quadrupole time-of-flight tandem mass spectrometry. Mar. Drugs 2015, 13, 3892–3919. [Google Scholar] [CrossRef] [PubMed]
  37. O’Neil, J.M.; Davis, T.W.; Burford, M.A.; Gobler, C.J. The rise of harmful cyanobacteria blooms: The potential roles of eutrophication and climate change. Harmful Algae 2012, 14, 313–334. [Google Scholar] [CrossRef]
  38. Pietsch, C.; Wiegand, C.; Amé, M.V.; Nicklisch, A.; Wunderlin, D.; Pflugmacher, S. The effects of a cyanobacterial crude extract on different aquatic organisms: Evidence for cyanobacterial toxin modulating factors. Environ. Toxicol. 2001, 16, 535–542. [Google Scholar] [CrossRef]
  39. Davis, T.; Berry, D.; Boyer, G.; Gobler, C. The Effects of Temperature and Nutrients on the Growth and Dynamics of Toxic and Non-Toxic Strains of Microcystis during Cyanobacteria Blooms. Harmful Algae 2009, 8, 715–725. [Google Scholar] [CrossRef]
  40. Janssen, E.M.-L. Cyanobacterial peptides beyond microcystins—A review on co-occurrence, toxicity, and challenges for risk assessment. Water Res. 2019, 151, 488–499. [Google Scholar] [CrossRef]
  41. Pancrace, C.; Ishida, K.; Briand, E.; Pichi, D.G.; Weiz, A.R.; Guljamow, A.; Scalvenzi, T.; Sassoon, N.; Hertweck, C.; Dittmann, E.; et al. Unique Biosynthetic Pathway in Bloom-Forming Cyanobacterial Genus Microcystis Jointly Assembles Cytotoxic Aeruginoguanidines and Microguanidines. ACS Chem. Biol. 2019, 14, 67–75. [Google Scholar] [CrossRef] [PubMed]
  42. Sharif, D.I.; Gallon, J.; Smith, C.J.; Dudley, E. Quorum sensing in Cyanobacteria: N-octanoyl-homoserine lactone release and response, by the epilithic colonial cyanobacterium Gloeothece PCC6909. ISME J. 2008, 2, 1171. [Google Scholar] [CrossRef]
  43. Gross, E.M. Allelopathy of Aquatic Autotrophs. CRC Crit. Rev. Plant Sci. 2003, 22, 313–339. [Google Scholar] [CrossRef] [Green Version]
  44. Leão, P.N.; Pereira, A.R.; Liu, W.-T.; Ng, J.; Pevzner, P.A.; Dorrestein, P.C.; König, G.M.; Vasconcelos, V.M.; Gerwick, W.H. Synergistic allelochemicals from a freshwater cyanobacterium. Proc. Natl. Acad. Sci. USA 2010, 107, 11183–11188. [Google Scholar] [CrossRef] [PubMed] [Green Version]
  45. Rounge, T.B.; Rohrlack, T.; Nederbragt, A.J.; Kristensen, T.; Jakobsen, K.S. A genome-wide analysis of nonribosomal peptide synthetase gene clusters and their peptides in a Planktothrix rubescens strain. BMC Genom. 2009, 10, 396. [Google Scholar] [CrossRef]
  46. Sanz, M.; Salinas, R.K.; Pinto, E. Namalides B and C and Spumigins K-N from the Cultured Freshwater Cyanobacterium Sphaerospermopsis torques-reginae. J. Nat. Prod. 2017, 80, 2492–2501. [Google Scholar] [CrossRef]
  47. Welker, M.; von Döhren, H. Cyanobacterial peptides—Nature’s own combinatorial biosynthesis. FEMS Microbiol. Rev. 2006, 30. [Google Scholar] [CrossRef]
  48. Fernandes, C.A.; Martins-Santos, I.C. Mapping of the 18S and 5S ribosomal RNA genes in Astyanax altiparanae Garutti & Britski, 2000 (Teleostei, Characidae) from the upper Paraná river basin, Brazil. Genet. Mol. Biol. 2006, 29, 464–468. [Google Scholar] [CrossRef]
  49. Maroneze, D.M.; Tupinambás, T.H.; Alves, C.B.M.; Vieira, F.; Pompeu, P.S.; Callisto, M. Fish as ecological tools to complement biodiversity inventories of benthic macroinvertebrates. Hydrobiologia 2011, 673, 29–40. [Google Scholar] [CrossRef]
  50. Orsi, M.; Daniel Carvalho, E.; Foresti, F. Population biology of Astyanax altiparanae Garutti & Britski, 2000 (teleostei, characidae) of the medium river Paranapanema. Rev. Bras. Zool. 2004, 21, 207–218. [Google Scholar] [CrossRef]
  51. Schulz, U.H.; Martins-Junior, H. Astyanax fasciatus as bioindicator of water pollution of Rio dos Sinos, RS, Brazil. Braz. J. Biol. 2001, 61, 615–622. [Google Scholar] [CrossRef]
  52. Vieira, C.E.D.; Almeida, M.D.S.; Galindo, B.A.; Pereira, L.; Martinez, C.B.D.R. Integrated biomarker response index using a Neotropical fish to assess the water quality in agricultural areas. Neotrop. Ichthyol. 2014, 12, 153–164. [Google Scholar] [CrossRef] [Green Version]
  53. Vilella, F.S.; Becker, F.G.; Hartz, S.M. Diet of Astyanax species (Teleostei, Characidae) in an Atlantic Forest River in Southern Brazil. Braz. Arch. Biol. Technol. 2002, 45, 223–232. [Google Scholar] [CrossRef]
  54. Oberemm, A.; Becker, J.; Codd, G.A.; Steinberg, C. Effects of cyanobacterial toxins and aqueous crude extracts of cyanobacteria on the development of fish and amphibians. Environ. Toxicol. 1999, 14, 77–88. [Google Scholar] [CrossRef]
  55. Oberemm, A.; Fastner, J.; Steinberg, C.E.W. Effects of microcystin-LR and cyanobacterial crude extracts on embryo-larval development of zebrafish (Danio rerio). Water Res. 1997, 31, 2918–2921. [Google Scholar] [CrossRef]
  56. Liu, Y.; Song, L.; Li, X.; Liu, T. The toxic effects of microcystin-LR on embryo-larval and juvenile development of loach, Misguruns mizolepis Gunthe. Toxicon 2002, 40, 395–399. [Google Scholar] [CrossRef]
  57. Palíková, M.; Navrátil, S.; Maršálek, B.; Bláha, L. Toxicity of Crude Extracts of Cyanobacteria for Embryos and Larvae of Carp (Cyprinus carpio L.). Acta Vet. Brno 2003, 72, 437–443. [Google Scholar] [CrossRef]
  58. Lecoz, N.; Malécot, M.; Quiblier, C.; Puiseux-Dao, S.; Bernard, C.; Crespeau, F.; Edery, M. Effects of cyanobacterial crude extracts from Planktothrix agardhii on embryo-larval development of medaka fish, Oryzias latipes. Toxicon 2008, 51, 262–269. [Google Scholar] [CrossRef] [PubMed]
  59. Cazenave, J.; De Los Ángeles Bistoni, M.; Zwirnmann, E.; Wunderlin, D.A.; Wiegand, C. Attenuating effects of natural organic matter on microcystin toxicity in zebra fish (Danio rerio) embryos—Benefits and costs of microcystin detoxication. Environ. Toxicol. 2006, 21, 22–32. [Google Scholar] [CrossRef] [PubMed]
  60. Jacquet, C.; Thermes, V.; De Luze, A.; Puiseux-Dao, S.; Bernard, C.; Joly, J.S.; Bourrat, F.; Edery, M. Effects of microcystin-LR on development of medaka fish embryos (Oryzias latipes). Toxicon 2004, 43, 141–147. [Google Scholar] [CrossRef] [PubMed]
  61. Hou, J.; Li, L.; Xue, T.; Long, M.; Su, Y.; Wu, N. Damage and recovery of the ovary in female zebrafish i.p.-injected with MC-LR. Aquat. Toxicol. 2014, 155, 110–118. [Google Scholar] [CrossRef]
  62. Malbrouck, C.; Kestemont, P. Effects of microcystins on fish. Environ. Toxicol. Chem. 2006, 25, 72–86. [Google Scholar] [CrossRef]
  63. Baganz, D.; Staaks, G.; Steinberg, C. Impact of the cyanobacteria toxin, microcystin-LR on behaviour of zebrafish, Danio rerio. Water Res. 1998, 32, 948–952. [Google Scholar] [CrossRef]
  64. Lee, J.; Lee, S.; Jiang, X. Cyanobacterial toxins in freshwater and food: Important sources of exposure to humans. Annu. Rev. Food Sci. Technol. 2017, 8, 281–304. [Google Scholar] [CrossRef] [PubMed]
  65. Flores, N.M.; Miller, T.R.; Stockwell, J.D. A Global Analysis of the Relationship between Concentrations of Microcystins in Water and Fish. Front. Mar. Sci. 2018, 5, 30. [Google Scholar] [CrossRef]
  66. Forchert, A.; Neumann, U.; Papendorf, O. New Cyanobacterial Substances with Bioactive Properties. In Cyanotoxins—Occurence, Causes, Consequences; Springer Science & Business Media: New York, NY, USA, 2001; pp. 295–315. [Google Scholar]
  67. El Ghazali, I.; Saqrane, S.; Carvalho, A.P.; Ouahid, Y.; Oudra, B.; Del Campo, F.F.; Vasconcelos, V. Compensatory growth induced in zebrafish larvae after pre-exposure to a Microcystis aeruginosa natural bloom extract containing Microcystins. Int. J. Mol. Sci. 2009, 10, 133–146. [Google Scholar] [CrossRef]
  68. Saraf, S.R.; Frenkel, A.; Harke, M.J.; Jankowiak, J.G.; Gobler, C.J.; McElroy, A.E. Effects of Microcystis on development of early life stage Japanese medaka (Oryzias latipes): Comparative toxicity of natural blooms, cultured Microcystis and microcystin-LR. Aquat. Toxicol. 2018, 194, 18–26. [Google Scholar] [CrossRef] [PubMed]
  69. Zeng, C.; Sun, H.; Xie, P.; Wang, J.; Zhang, G.; Chen, N.; Yan, W.; Li, G. The role of apoptosis in MCLR-induced developmental toxicity in zebrafish embryos. Aquat. Toxicol. 2014, 149, 25–32. [Google Scholar] [CrossRef] [Green Version]
  70. Zi, J.; Pan, X.; MacIsaac, H.J.; Yang, J.; Xu, R.; Chen, S.; Chang, X. Cyanobacteria blooms induce embryonic heart failure in an endangered fish species. Aquat. Toxicol. 2018, 194, 78–85. [Google Scholar] [CrossRef]
  71. Wiegand, C.; Pflugmacher, S.; Beattie, K.A.; Steinberg, C.; Pflugmacher, S.; Oberemm, A.; Meems, N.; Beattie, K.A. Uptake and Effects of Microcystin-LR on Detoxication Enzymes of Early Life Stages of the Zebra Fish (Danio rerio) Uptake and Effects of Microcystin-LR on Detoxication Enzymes of Early Life Stages of the Zebra Fish (Danio rerio). Environ. Toxicol. 1999, 14, 89–95. [Google Scholar] [CrossRef]
  72. Morse, A.N.C.; Froyd, C.A.; Morse, D.E. Molecules from cyanobacteria and red algae that induce larval settlement and metamorphosis in the mollusc Haliotis rufescens. Mar. Biol. 1984, 81, 293–298. [Google Scholar] [CrossRef]
  73. Rogers, E.D.; Henry, T.B.; Twiner, M.J.; Gouffon, J.S.; McPherson, J.T.; Boyer, G.L.; Sayler, G.S.; Wilhelm, S.W. Global Gene Expression Profiling in Larval Zebrafish Exposed to Microcystin-LR and Microcystis Reveals Endocrine Disrupting Effects of Cyanobacteria. Environ. Sci. Technol. 2011, 45, 1962–1969. [Google Scholar] [CrossRef]
  74. Gorham, P.R.; McLachlan, J.; Hammer, U.T.; Kim, W. Isolation and culture of toxic strains of Anabaena flos-aquae (Lyngb.) Breb. Verh. Int. Ver. Theor. Angew. Limnol. 1964, 15, 1964. [Google Scholar] [CrossRef]
  75. Shannon, P.; Markiel, A.; Ozier, O.; Baliga, N.S.; Wang, J.T.; Ramage, D.; Amin, N.; Schwikowski, B.; Ideker, T. Cytoscape: A software environment for integrated models of biomolecular interaction networks. Genome Res. 2003, 13, 2498–2504. [Google Scholar] [CrossRef] [PubMed]
  76. Bortoli, S.; Oliveira-Silva, D.; Krüger, T.; Dörr, F.A.; Colepicolo, P.; Volmer, D.A.; Pinto, E. Growth and microcystin production of a Brazilian Microcystis aeruginosa strain (LTPNA 02) under different nutrient conditions. Rev. Bras. Farmacogn. 2014, 24, 389–398. [Google Scholar] [CrossRef]
  77. Woynarovich, E.; Horváth, L. Propagaçao artificial de peixes de águas tropicais manual: De extensao. In Propagaçao Artificial de Peixes de Águas Tropicais Manual: De Extensao; FAO/CODEVASF/CNPq: Brasilia, Brazil, 1983. [Google Scholar]
  78. Dos Santos, M.P.; Yasui, G.S.; Xavier, P.L.P.; de Macedo Adamov, N.S.; do Nascimento, N.F.; Fujimoto, T.; Senhorini, J.A.; Nakaghi, L.S.O. Morphology of gametes, post-fertilization events and the effect of temperature on the embryonic development of Astyanax altiparanae (Teleostei, Characidae). Zygote 2016, 24, 795–807. [Google Scholar] [CrossRef] [PubMed]
  79. Yasui, G.S.; Senhorini, J.A.; Shimoda, E.; Pereira-Santos, M.; Nakaghi, L.S.O.; Fujimoto, T.; Arias-Rodriguez, L.; Silva, L.A. Improvement of gamete quality and its short-term storage: An approach for biotechnology in laboratory fish. Animal 2015, 9, 464–470. [Google Scholar] [CrossRef]
  80. Core Team R. R: A Language and Environment for Statistical Computing; R Foundation for Statistical Computing: Vienna, Austria, 2017; ISBN 3-900051-07-0. [Google Scholar]
Figure 1. Representative base peak chromatograms detected in positive mode electrospray ionization (ESI), acquired in a LC-HR-QTOF-MS (60-2000 m/z). Microcystis panniformis (MIRS-04): (A1) micropeptin K139, (A2) micropeptin 959, (A3) microcystin-LR, (A4) microcystin HiLR, (A5) micropeptin 973, (A6) micropeptin and (A7) microcistin-LY.and Microcystis aeruginisa (NPCD-01): (B1) microginin FR1, (B2) microginin FR2/FR4, and (B3) microginin SD-755 and (B4) unknown.
Toxins 11 00220 g001
Figure 2. Molecular network generated from the MS/MS spectra of Microcystis panniformis (MIRS-04) and Microcystis aeruginisa (NPCD-01) strains using GNPS and Cytoscape tools. Clusters of the analytes detected in M. panniformis and M. aeruginosa are indicated in gray and pink, respectively. Each cluster allows a visualization of related molecules where one node represents one consensus MS/MS spectrum and is labeled with the precursor mass. Circle diameter of each node is proportional to intensity of the ions in the LC-MS analysis. An edge represents relatedness (cosine similarity score cutoff of 0.65) where numbers indicate the mass difference. For each node, calculated molecular formula and ions charges states are informed. Identified compounds are labeled in red while nonidentified nodes indicate new potential analogues. Node 485.275 [M + 2H]2+ was detected in both species and ion intensity in each specie is represented as a pizza plot.
Toxins 11 00220 g002
Figure 3. Cyclic peptide structures produced by M. panniformis strain MIRS-04: (A1) micropeptin K139, (A2) micropeptin 959, (A3) microcystin-LR, (A4) microcystin HiLR, (A5) micropeptin 973, (A6) micropeptin B and (A7) microcistin-LY.
Toxins 11 00220 g003
Figure 4. Microginins produced by M. aeruginosa strain NPCD-01: (B1) microginin FR1, (B2) microginin FR2/FR4 and (B3) microginin SD-755.
Toxins 11 00220 g004
Figure 5. Mortality of Astyanax altiparanae larvae (%) vs. concentration (mg/mL) of extracts of strain MIRS-04 and NPCD-01. Data are expressed as dose-response curves as ± SD of five replicates of the assays (MIRS-04 and NPCD-01) and the LC50 values are represented for exposure times of 24 and 96 h. (Statistically significant values are at the p < 0.05 level).
Toxins 11 00220 g005
Figure 6. Average of the number of morphological alterations in larvae of Astyanax altiparanae exposed to MIRS-04 (Microcystis panniformis) and NPDC-01 (Microcystis aeruginosa).
Toxins 11 00220 g006
Figure 7. Morphological changes in Astyanax altiparanae larvae caused by exposure to extracts of the MIRS-04 and NPCD-01 strains at concentrations of 0.1, 0.2 and 0.3 mg/mL (dried weight). MIRS-04: 1—normal larvae (control), 2—alteration in the tail, column and body length, 3—spinal curvature, 4—digestive system oedema, and 5—oedema in the pericardium and digestive system oedema. NPCD-01: 6—normal (control) larvae, 7—curvature of the spine (cervical lordosis), 8—oedema with haemorrhage, 9—oedema in the pericardium and digestive system oedema, 10—oedema in the pericardium, digestive system oedema and curvature in the cervical spine.
Toxins 11 00220 g007
Table 1. Cyanobacteria peptides from the strains MIRS-04 and NPCD-01 obtained from the LC-HR-QTOF-MS analyses.
PeakRT *Theoretical m/zExperimental m/zIon FormulaError [ppm]mSigmaCompound NameReference
A17.2494.2800494.2797C47H76N10O13−0.62.3Micropeptin K139 *[12]
A27.6959.5249959.5197C45H71N10O13−2.010.0Micropeptin 959[21]
A37.9995.5634995.5560C49H75N10O12−0.316.5Microcystin–LR[16]
A481009.57741009.5717C50H77N10O12−0.720Microcystin HilR[14]
A58.0973.5391973.5353C46H73N10O134.18.6Micropeptin 973[13]
A68.2987.5548987.5510C47H75N10O13−0.811.4Micropeptin B[12]
A79.51002.52371002.5183C52H72N7O132.15.8Microcystin-LY[22]
B17.0728.4272728.4229C38H58N5O95.214Microginin FR1[17]
B27.2742.4347742.4379C39H60N5O90.71.9Microginin FR2/FR4[20]
B37.6756.4567756.4542C40H62N5O9−3.25.3Microginin SD-755[23]
B47.8960.4188960.4131C43H62N9O14S3.52.0Unknown[20]
* Detected as [M + 2H]2+. All other compounds were detected as [M + H]+. RT: Retention Time.
Table 2. Frequency of occurrence of morphological changes observed in the larvae of Astyanax altiparanae in 96 h of exposure to cyanobacteria extracts of MIRS-04 Microcystis panniformis and NPCD-01 Microcystis aeruginosa.
TreatmentsN Total of LarvaeN Total of Larvae M.A (+) *Types of Morphological Alterations * Observed
ODS %ODS%OPC%OPC%CP%CP%CT%CT%
Control243312.514.20000
0.1 mg/mL-mirs-0428161242.9414.3621.400
0.2 mg/mL-mirs-041914736.8421.1526.315.3
0.3 mg/mL-mirs-041110981.8218.2218.200
0.1 mg/mL-npcd-0114111178.600214.300
0.2 mg/mL-npcd-0122131045.5313.629.100
0.3 mg/mL-npcd-0124222291.7312.5416.714.2
Total142897452.117122114.821.4
* M.A (+): Morphological alteration, ODS: oedema in the region of the digestive system, OPC: oedema of the pericardial region, CP: Curvature of the Spine, CT: Curvature of the Tail.
Table 3. Chi-square test of the morphological alterations oedema in the digestive system according to presence and absence in the larvae of Astyanax altiparanae.
TreatmentsODS (+) *ODS (−) *N Total of LarvaeFrequency of Occurrence (%)
Control3212412.5 a
0.1 mg/mL-MIRS-0412162842.9 b, f, g
0.2 mg/mL-MIRS-047121936.8 c, d, e, g
0.3 mg/mL-MIRS-04921181.8 c, d
0.1 mg/mL-NPCD-011131478.6 c, d, e
0.2 mg/mL-NPCD-0110122245.5 f, g
0.3 mg/mL-NPCD-012222491.7 b, c, f, g
* ODS (+): Presence of oedema in the region of the digestive system, ODS (−) absence of oedema in the region of the digestive system. The values with equal letters did not present significant differences p < 0.05.

