Evaluating Factors for Controlling Sediment Connectivity of Landslide Materials: A Flume Experiment
by
 and
and
Hefryan Sukma Kharismalatri
1,*, 
Yoshiharu Ishikawa
2,
Takashi Gomi
1,3,
Roy C. Sidle
1,4,5 and
Katsushige Shiraki
3 1
Institute of Global Innovation Research, Tokyo University of Agriculture and Technology, Fuchu, Tokyo 183-8538, Japan
2
Toa Grout Kogyo Co. Ltd., Yotsuya, Shinjuku-ku, Tokyo 160-0004, Japan
3
Graduate School of Agriculture, Tokyo University of Agriculture and Technology, Fuchu, Tokyo 183-8509, Japan
4
Sustainability Research Centre, University of the Sunshine Coast, Sippy Downs, QLD 4556, Australia
5
Mountain Societies Research Institute, University of Central Asia, Bishkek 720001, Kyrgyzstan
*
Author to whom correspondence should be addressed.
Water 2019, 11(1), 17; https://doi.org/10.3390/w11010017
Submission received: 6 November 2018
/
Revised: 17 December 2018
/
Accepted: 19 December 2018
/
Published: 21 December 2018
(This article belongs to the Special Issue Landslide Hydrology)
Abstract
:Connectivity of landslide sediment to and within fluvial systems is a key factor affecting the extent of mobilization of hillslope material. In particular, the formation of landslide dams and the transformation into landslide-induced debris flows represent “end members” of landslide sediment mobility. To quantify sediment connectivity, we developed a two-segment flume representing tributary inflow and the main channel. Mobility of sediment was examined by combinations of various topographic factors, such as tributary inflow angle (0 to 90° in 30° increments) and main channel gradient (10° and 15°), as well as water content of sediment (0 to 100% in 20% increments). We also examined differences of mobility among sediments derived from various lithologies (sand and shale, pyroclastic sediment, weathered granite, and weathered sedimentary rock). Mobility of sediment differed, depending on the water content of sediment, particularly less than saturation or greater than saturation. When all types of unsaturated landslide sediments entered the channel at inflow angles of 60° and 90°, substantial deposition occurred, suggesting the formation of landslide dams. At low inflow angles (0° and 30°) in a steep channel (15°), >50% of landslide sediment was transported downstream, indicating the occurrence of a debris flow. The amount of sediment deposited at the junction angle was greater for pyroclastic sediment followed by weathered granite, weathered sedimentary rock, and finally, sand and shale. Our connectivity index suggests that a threshold exists between landslide dam formation and debris flow occurrence associated with topographic conditions, water content, and types of sediment.
1. Introduction
Sediment connectivity is defined as the linkage and transfer of sediment from sources to deposits within a catchment system, via sediment detachment and transport [1]. Sediment connectivity implies how sediment can mobilize from one zone to another [2,3,4], which depends on the morphological characteristics of the system and the hydrological process [5]. The concept of connectivity has been applied to catchment hydrology, sediment transport, and soil erosion by water to understand the spatial and temporal variability of sediment dynamics [6,7]. For instance, Gomi et al. [8] showed that sediment from hillslopes was directly transported to channels as bedload and suspended sediment due to its high mobility in headwater catchments affected by recent landslides. In contrast, Hiraoka et al. [9] observed a disconnection of sediment in the continuum from hillslopes to the catchment outlet due to temporary deposition within the channel bed. In general, when sediment remains near its source, there is a disconnection between sources and downstream reaches, while high connectivity between sources and downstream reaches occurs when sediment is highly mobilized.
Mobility of landslide sediments varies, depending on topography, availability of water, and other factors, such as engineering properties and material weathering [10]. When the landslide sediments are less mobilized and poorly connected to downstream, most of the sediments remain at the foot of hillslopes or within the channel bed [11]. In this case, landslide dams are often formed when transported sediments are sufficient to block the channel, resulting in the inundation of the dam reservoir [12]. When landslide sediments closely connect to downstream, they often transform into debris flows that impact downstream environments due to the highly liquefied nature of these sediments [13]. Nevertheless, both landslide dams and landslide-induced debris flows are considered to be major sediment disasters around the world [14].
Various factors affect the mobility of debris flows and landslide dams, which alters the sediment connectivity of landslide sediments. In general, topographic factors such as volume of collapsed material, valley topography, inflow tributary junction angle, and channel gradient affect the mobility [10,15]. For instance, a study of 55 landslides in China showed that the mobility of landslide sediments increased with increases in landslide volume [16]. Landslide sediments tend to be less mobilized in narrow and V-shaped valleys in the Kansai, Kanto, Chubu, and Tohoku regions of Japan [17]. Benda and Cundy [15] revealed that the mobility of sediment increased when the inflow angle between landslides and receiving channels was <70° in a 52 km2 watershed of the Oregon Coast Range, USA. Based on field investigations, Ishikawa [18] suggested that the mobility of landslide sediment changes with channel gradients >9°. Furthermore, sediment porosity, permeability, and grain size distribution control the mobility of landslide sediments based on investigations in Oregon and Colorado, USA [19].
Despite previous evidence of the differential mobility of landslide sediments, most of these studies only examined individual factors related to hydrogeomorphic conditions. To better understand sediment connectivity related to the mobility of landslide sediments, interactions among multiple factors need to be considered. For instance, a GIS investigation of deep-seated landslides in Kii Peninsula in 2011 revealed that the formation of landslide dams and occurrence of debris flows could be classified based on two criteria: a 60° inflow angle and 10° channel gradient [20]. Similarly, an investigation of 62 landslides in British Columbia, Canada, found that landslides with inflow angles <40° and channel gradients >27° resulted in debris flows; additional factors influencing debris flow occurrence were initial failure volume and sediment stored within the channel prior to the occurrence of landslides [21]. Hence, quantitatively evaluating multiple factors and their possible combinations on landslide dam formation and debris flow occurrence is typically difficult in field-based investigations.
Flume experiments can be effective to consider ranges in various factors influencing the movement of landslide sediments in simplified configurations [22]. Indeed, previous studies mentioned the effectiveness of flume experiments for sediment movement because they demonstrate the fluidization process of debris flows [23,24] and indicate blockage patterns [25]. Therefore, the objective of this study is to identify the key factors that control the mobility of sediment and the resultant sediment connectivity, such as landslide dam formation and the occurrence of debris flows, by a flume experiment. Findings of this study can be applied to assess the on-site and off-site risk of sediment disasters by landslides, landslide dam formation, and debris flows.
2. Methodology
2.1. Flume Experiment
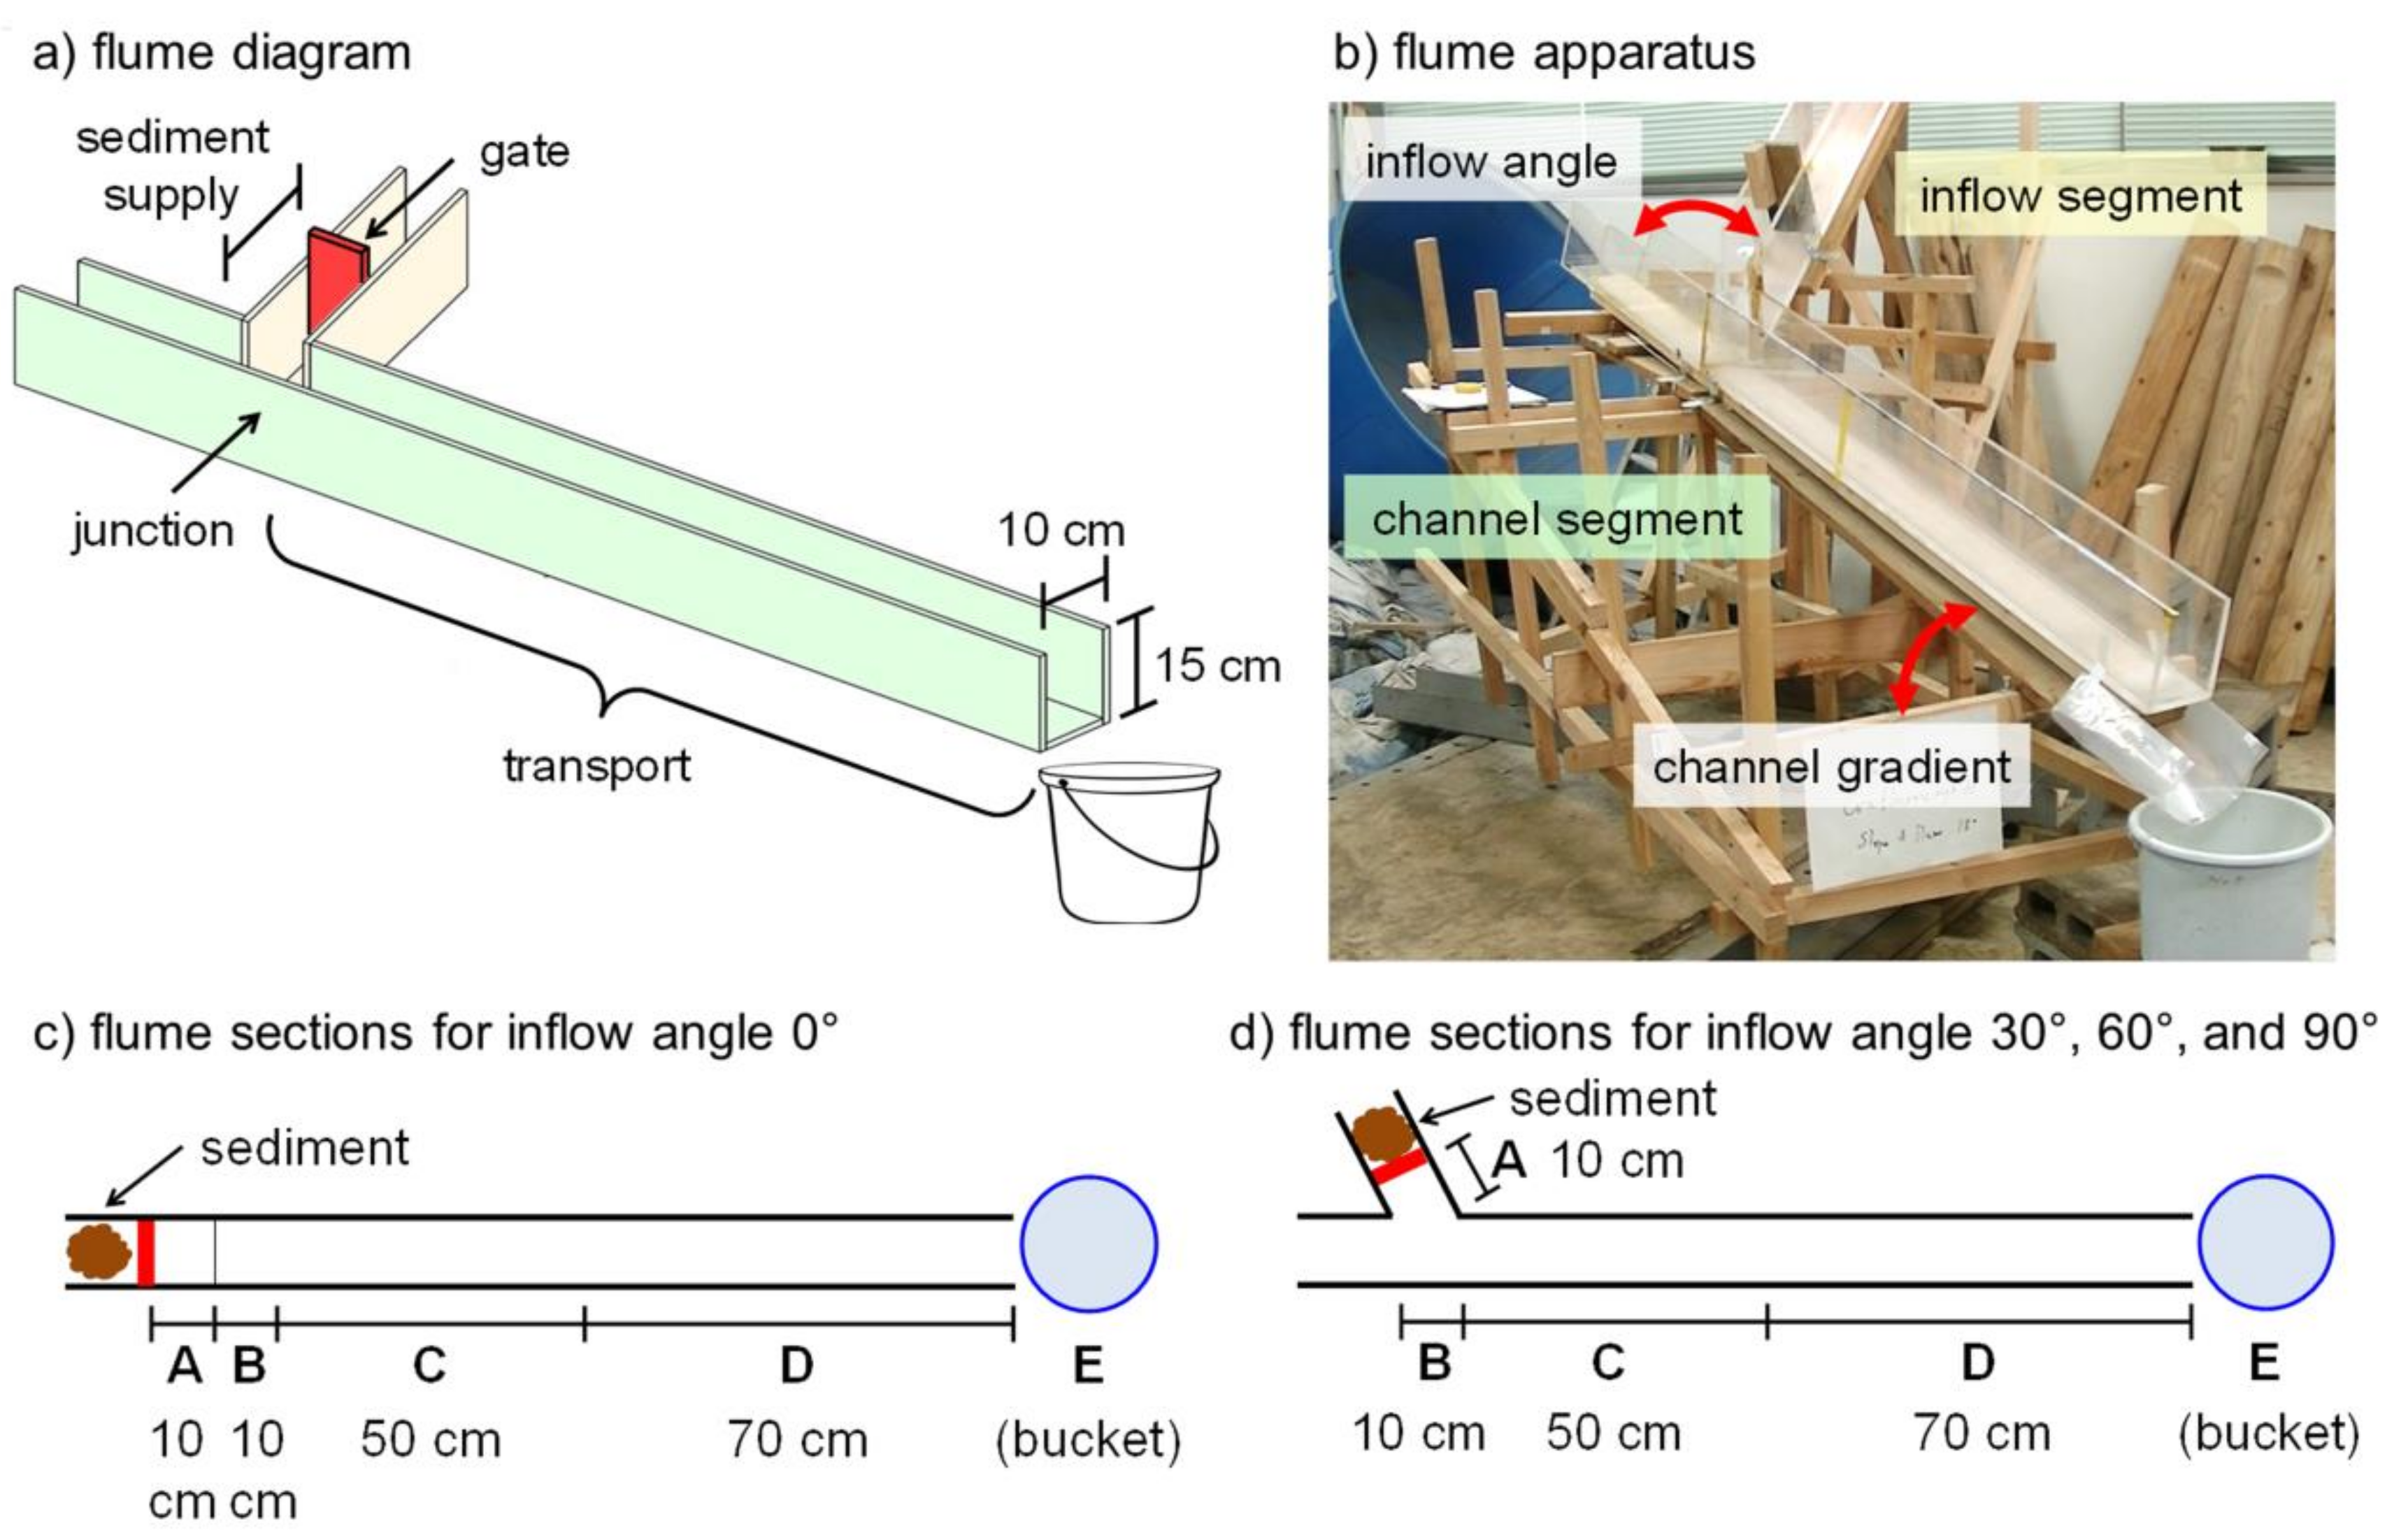
We constructed a flume (10 cm wide and 15 cm high) using 1-cm thick acrylic material, consisting of an inflow segment and main channel segment (Figure 1). The inflow segment represents the hillslope where the landslide occurs, while the main channel segment represents the channel in which the mobilized landslide sediment is conveyed (Figure 1a,b). The inflow segment was 50 cm long with a 45° gradient; on a 45° hillslope gradient, the resisting and driving forces of the weight of the sediment-water complex are equal. The main channel segment was 150 cm in length. A bucket was placed at the outlet of the main channel to capture transported sediment. We applied various channel gradients and inflow angles. Best [26,27] showed that inflow angles of 15-105° reflect the most common landslide entry conditions into channels; thus, we examined the mobility of sediment of four categories of inflow angles (0°, 30°, 60°, and 90°) to encompass a wide range of potential inflow angles. For the gradient of the main channel, we used 10° and 15° to examine the 10° channel gradient threshold between landslide dam formation and debris flow initiation based on a previous study of deep-seated landslides [20].
In addition to the topographic factors, we mixed different amounts of water with input sediments since hydrologic factors alter their mobility [28]. Gravimetric water contents from 0% to 100% in 20% increments were applied to the dry sediment mass (Figure 2). Zero percentages of water content imply that no additional water was added to the dry sediment sample. When water content is less than saturation (<wsat), we assumed that the hillslope materials could be mobilized as landslides up to full saturation. Alternatively, when water was applied in excess of saturation (>wsat), we assumed that the additional water was provided to the landslides mass via the mixture with channel water. In the field, landslide materials enter flowing water in the main channel. However, controlling water flow in the main channel of the flume introduces complexity related to testing the mobility of the materials. Similar experimental methods were used by other studies to examine the mobility of landslide material [29,30].
A total of 400 cm3 of sediment and six gravimetric water contents were applied in all experiments. The total weight of sediment plus water became 440 to 1360 g, differing based on water content and sediment density. Volume of sediment samples (400 cm3) within the 10 cm width of the flume was determined by scaling down the actual volume of sediment moved by deep-seated landslides and the respective river channel width ([20]; 3.3 × 10⁶ m3 for a mean channel width of 199 m). Therefore, we assumed that our flume experiment was approximately 1/2000 of an actual deep-seated landslide scenario. Dry sediment and water were mixed and placed at the end of section A, which was blocked by a plastic gate. Then, the gate was opened manually to allow sediment and water to flow downstream via the junction. Because our primary objective was to examine the formation of landslide dams and the mobility of debris flows, we released the sediment by opening the gate abruptly to minimize the variability of initial mobility. Such abrupt gate opening was also used in large-scale debris flow experiments [31]. After all transported sediment stopped, sediment deposited within the five sections (A to E, Figure 1c,d) was collected. All collected sediment was oven-dried for 24 h at 105° C and weighed. Percentage of deposits in each section was calculated using the sediment within a given section divided by the initial sediment mass.
2.2. Sediment Mobility
Sediment collected from the five sections (A to E) represents the topographic continuity from the hillslope to channel. For instance, section A represents the hillslope, while section B is the junction between the hillslope and the main channel. Further downstream, sections C (50 cm downstream from the junction), D (70 cm downstream from section C), and E (below the outlet) represent in-channel transport zones.
The thickness of sediment deposited in each channel section is an important parameter for examining mobility and the potential for the formation of landslide dams. Therefore, we estimated the thickness of material (hn) in the nth section by using the following equation:
where Wn is weight of sediment deposition in nth section, ρd is the sediment bulk density, and An is the area of nth section. For this estimation, we excluded section E, because this was outside of the flume channel (Figure 1). We assumed that the thickness in section B becomes the depth of the landslide dam.
To evaluate the mobility of sediment, we developed a sediment connectivity index (SCI). The sediment connectivity index (SCI) was initially proposed by Borselli et al. [32], which was defined as the potential connection between up to downstream parts of a catchment. Bracken et al. [1] also defined sediment connectivity between hillslopes and deposition areas for various landscape units including channels, lakes, and flat terrain. Because our study focused on the formation of landslide dams and landslide-induced debris flows, our SCI is expressed based on the amount of sediment in sections B and E using the following equation:
where WB and WE are the dry weights of sediment in sections B and E, respectively. Negative values of SCI indicate that the sediment source is poorly connected with downstream reaches, i.e., landslide material formed landslide dams, while positive SCI values are associated with landslide material transformation into debris flows because sediment sources and downstream reaches are closely connected. We assumed the sediment deposition at the junction (section B) and the outlet (section E) for differentiating between landslide dam formation and transformation into debris flows. Landslide dams form when landslide sediments move downslope, collide with the opposite valley wall, and then accumulate within the channel near the junction [33]. In contrast, sediment movement associated with debris flows initiates on steep slopes, transports sediment downstream in steep channels, and finally deposits in gentle and wide channels or valleys [34]. We adapted the SCI concept of Borselli et al. [1], which calculates a sediment delivery ratio by comparing the upstream and downstream components of sediment movements. Nevertheless, our SCI is a representative value for combined factors of topography, soil types, and water availability.
2.3. Characteristics of Sediment Movement
We used four types of sediment originating from different geology. Sediment derived from sand and shale (SS) was obtained from Nigoridani, Nara Prefecture (34°7′35″ N, 135°46′30″ E), where a deep-seated landslide occurred in September 2011 due to Typhoon Talas [20]. This sample was collected from a 3.3 × 10⁶ m3 landslide deposit [20] consisting of a highly fractured muddy alternation of sand and shale of the Cretaceous Miyama Formation [35]. The pyroclastic sediment (PS) was collected in the area affected by the 2013 debris flow in Motomachi District, Izu Oshima Island, Tokyo Prefecture (34°44′50″ N, 139°22′5″ E). The weathered granite (WG) and weathered sedimentary rock (WS) sediments were collected in areas affected by 2014 landslides and debris flows in Asaminami Wards, Hiroshima City (34°28′55″ N, 132°29′15″ E). The geology of this area is dominated by late Cretaceous granite (weathered granite) on the east side and a mélange matrix of a middle to late Jurassic accretionary complex (weathered sedimentary rock) on the west side [36].
For all types of sediment, samples were collected using a 400 cm3 metal cylinder (diameter 11.3 cm, height 4.0 cm). Samples were oven-dried for 24 h at 105° C and dry weight was then measured. Sediment bulk density (ρd) was calculated based on dry weight divided by the volume. The void ratio (e) was then estimated using bulk density, particle density (ρp = 2.65 g/cm3), and water density (ρw = 1.0 g/cm3) [37]. Porosity (n) was derived from the void ratio [38]. Saturated water content (wsat) is defined as the maximum water content that fundamentally equals sediment porosity [39]. Particle size distribution was also analyzed based on the standard method of the American Society for Testing and Materials (ASTM) C136-01 [40,41]; sieve sizes: 45 mm, 19 mm, 9.5 mm, 4.75 mm, 2 mm, 850 μm, 425 μm, 250 μm, 106 μm, and 75 μm. Dry sediment samples were placed into sieves and then shaken using a mechanical sieve shaker (FRITSCH vibratory sieve shakers) for 10 min. The amount of sediment retained on each sieve was weighed. Sediment classification was analyzed based on ASTM D2487-06 [42,43]. Based on the cumulative percentages of particle size distribution, median particle size (D50), coefficient of curvature (Cc), and coefficient of uniformity (Cu) were estimated. The coefficient of curvature was estimated as:
where D10, D30, and D60 represent the diameter of particles finer than 10%, 30%, and 60% of the total mass, respectively [38]. The coefficient of uniformity was estimated as:
Coefficients of curvature and uniformity are both indicators of particle size distribution.
Because the ratio of saturated water content of sediment to its liquid limit (Approximate Mobility Index, AMI) is an important parameter for determining the potential for the transformation landslides into debris flows [44], we also conducted liquid limit tests based on ASTM D4318-05 for the fraction of sediment samples <425 μm [45,46]. The liquid limit is known as the water content needed for landslide material to flow under its own weight [44].
3. Results
3.1. Characteristics of Four Sediment Types
Characteristics of the four sediment types varied by density, porosity, and saturated water content (Table 1). Sediment derived from sand and shale (SS) had the highest density (1.7 g/cm3), followed by weathered granite (WG, 1.4 g/cm3). The void ratio was in the opposite order to the density. Weathered sedimentary rock (WS) had the highest porosity (59.6%), followed by pyroclastic sediment (PS, 53.6%) (Table 1). Similar to the void ratio, saturated water content was the highest in WS (55.7%) and the lowest in SS (20.3%). The liquid limit of all sediment samples ranged from 29.6% to 19.5%, with the highest value in PS and the lowest value in SS (Table 1). For the Approximate Mobility Index (AMI), all sediment samples had saturated water contents higher than their liquid limit (AMI >1), which suggests that sediments had high potential for fluidization. This indicates that the fluidization process is affected by saturated water content rather than by liquid limit for sediments with low clay contents [47].
Sediment particle size was highly variable among sediment types. The median diameter of the particle size distribution (D50) ranged from 0.2 to 7.5 mm, with the lowest in PS and highest for SS. Since more than 50% of sediment was retained on the 75 μm sieve, sediments were classified as coarse-grained based on the ASTM D2487-06 [42]. All sediment types were categorized as sands, while SS was categorized as gravels because more than 50% of the sediment was retained on the 4.75 mm sieve. All sediment types except PS were well-graded with a wide range of sizes; Cc ranged from 1.2 to 2.3 and Cu ranged from 6.1 to 42.2. PS was classified as poorly-graded, with Cc <1.0 and Cu <6.
3.2. Characteristics of Mobility Among Different Topographic Conditions
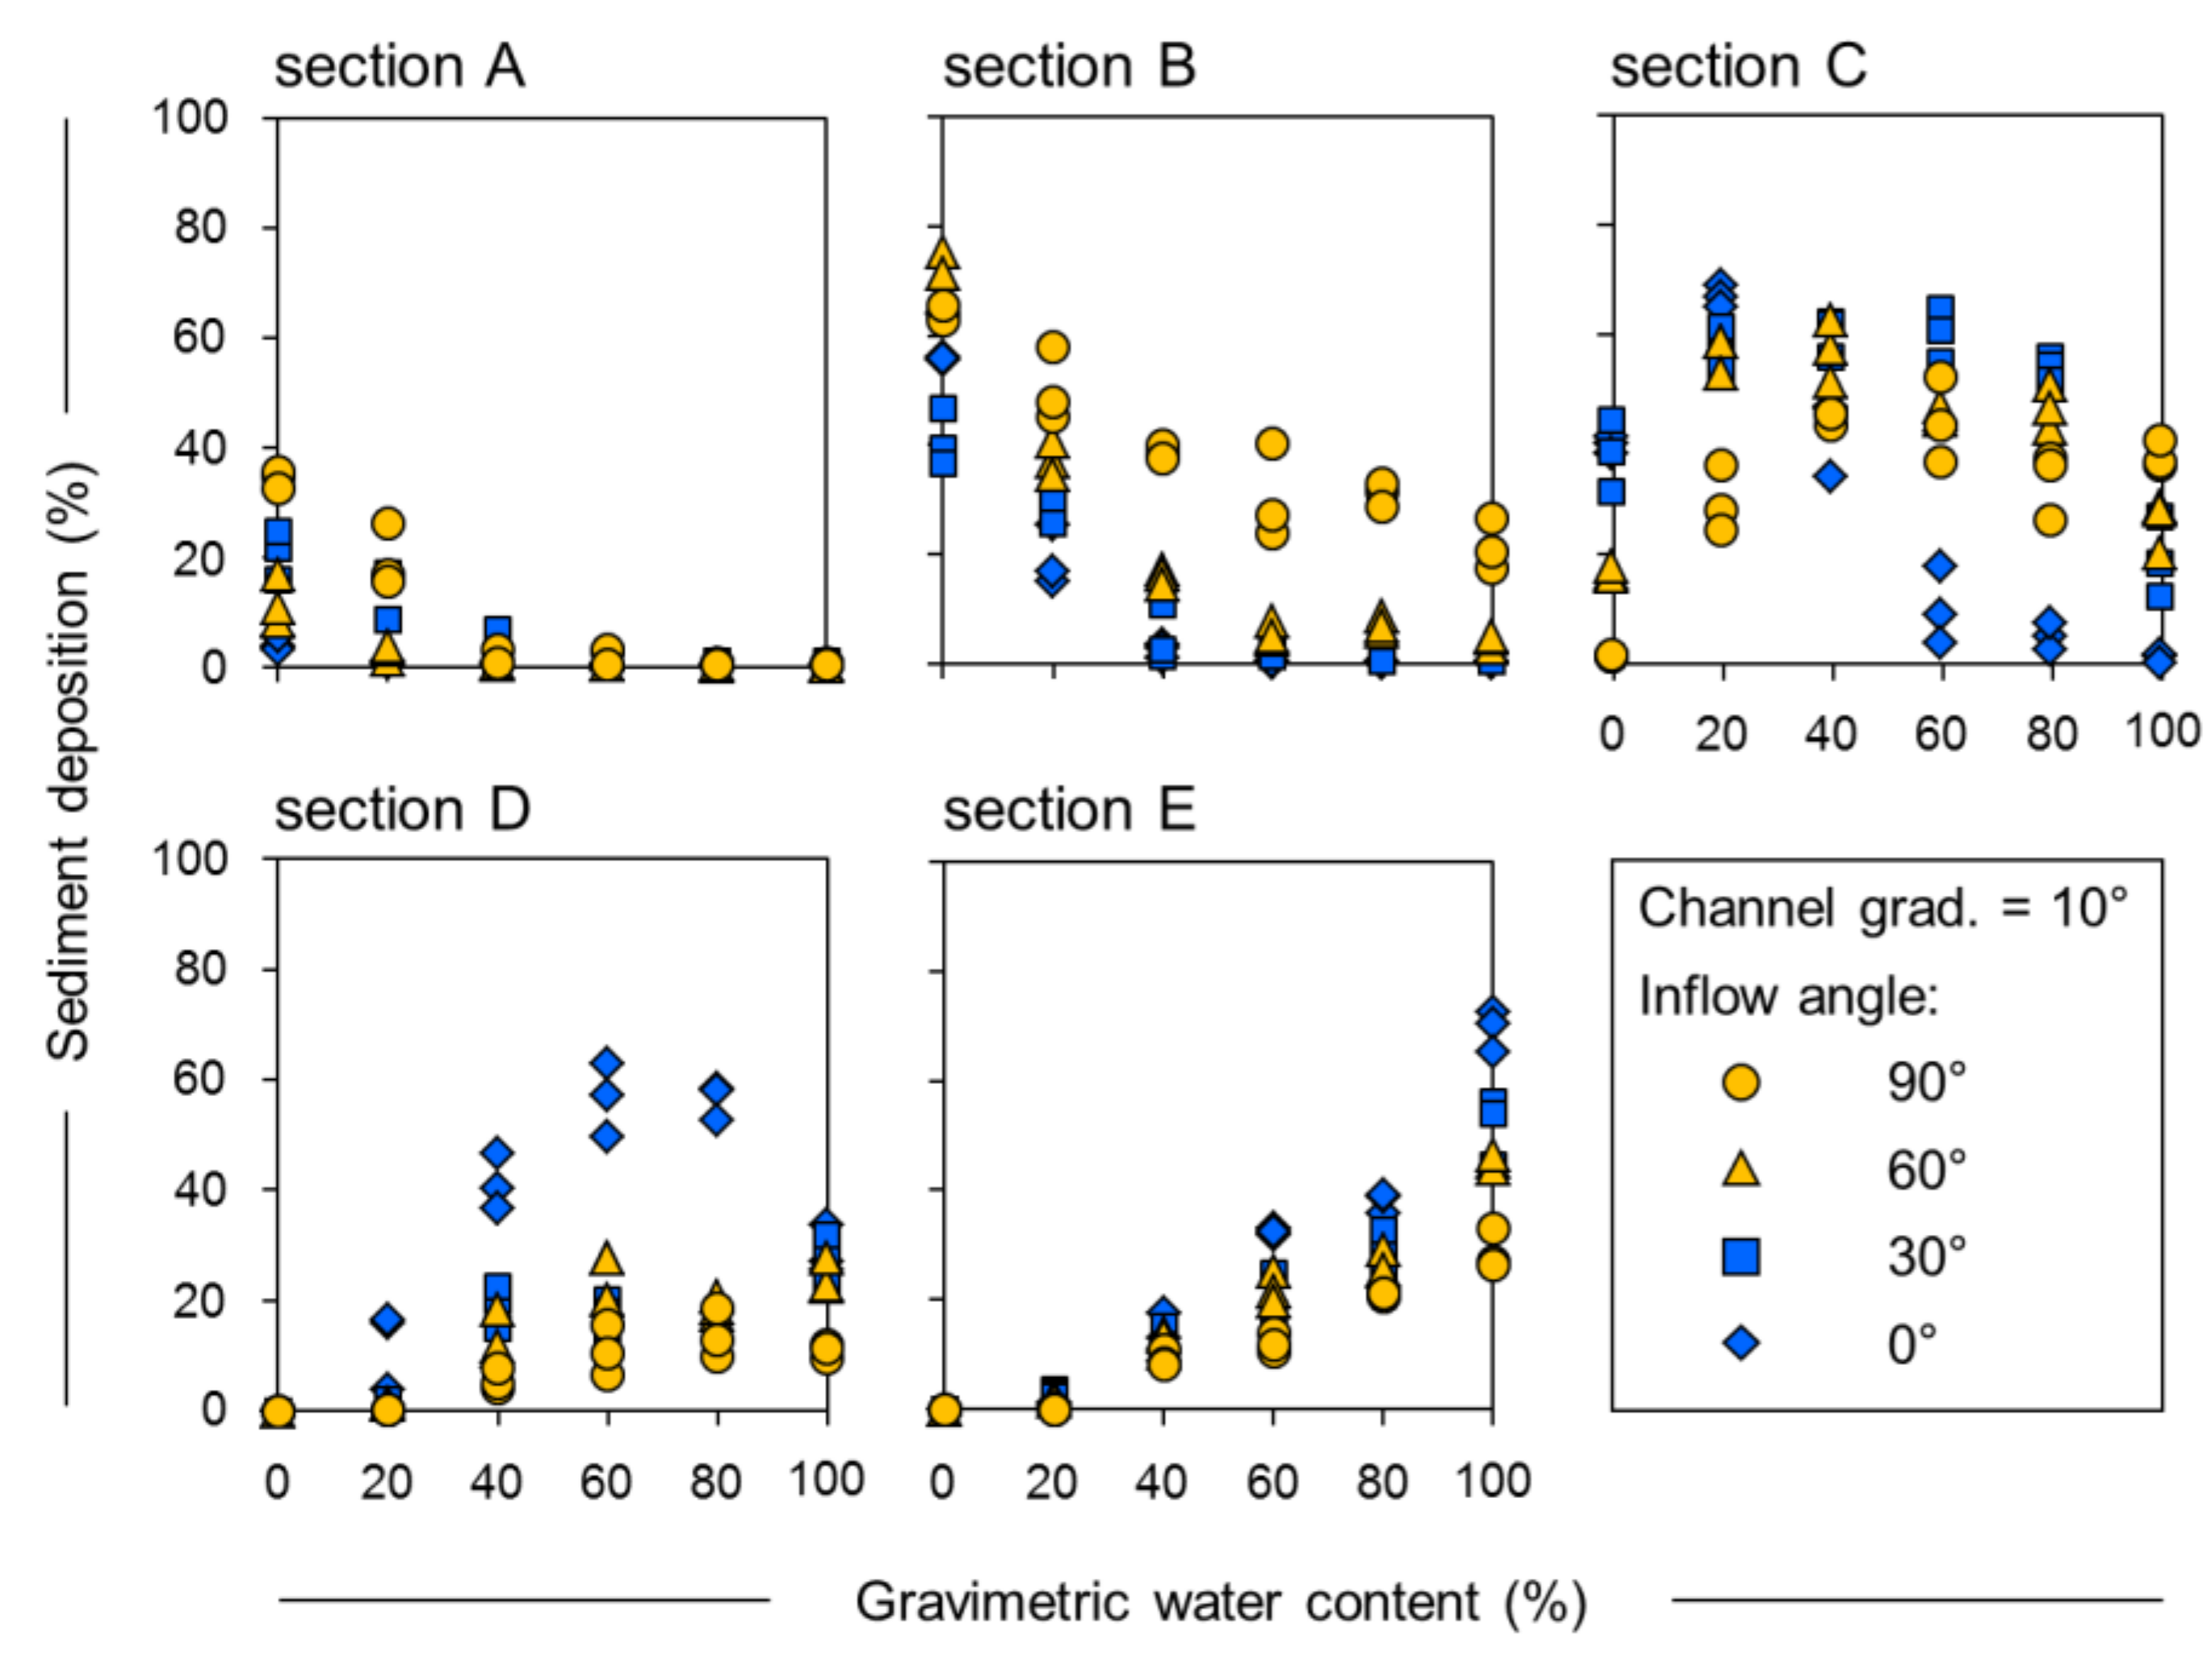
Amount of sediment deposits in each section varied, depending on inflow angle and water content (Figure 3, Table A1). For sections A, B, and E, relationships between sediment deposition (%) and water content were significant for all inflow angles. Mobility of sediment was highly variable among water contents and inflow angles in sections C and D. In all downstream sections under conditions of different inflow angles, the amount of sediment remaining in a given section was related to water content. Particularly, percentages of sediment deposition in the sections differed between conditions below and above saturation. For water content of 0%, all sediment remained in section C and the upstream sections. For water contents ≥40%, <5% of the sediment remained in section A and most was transported downstream (Figure 3).
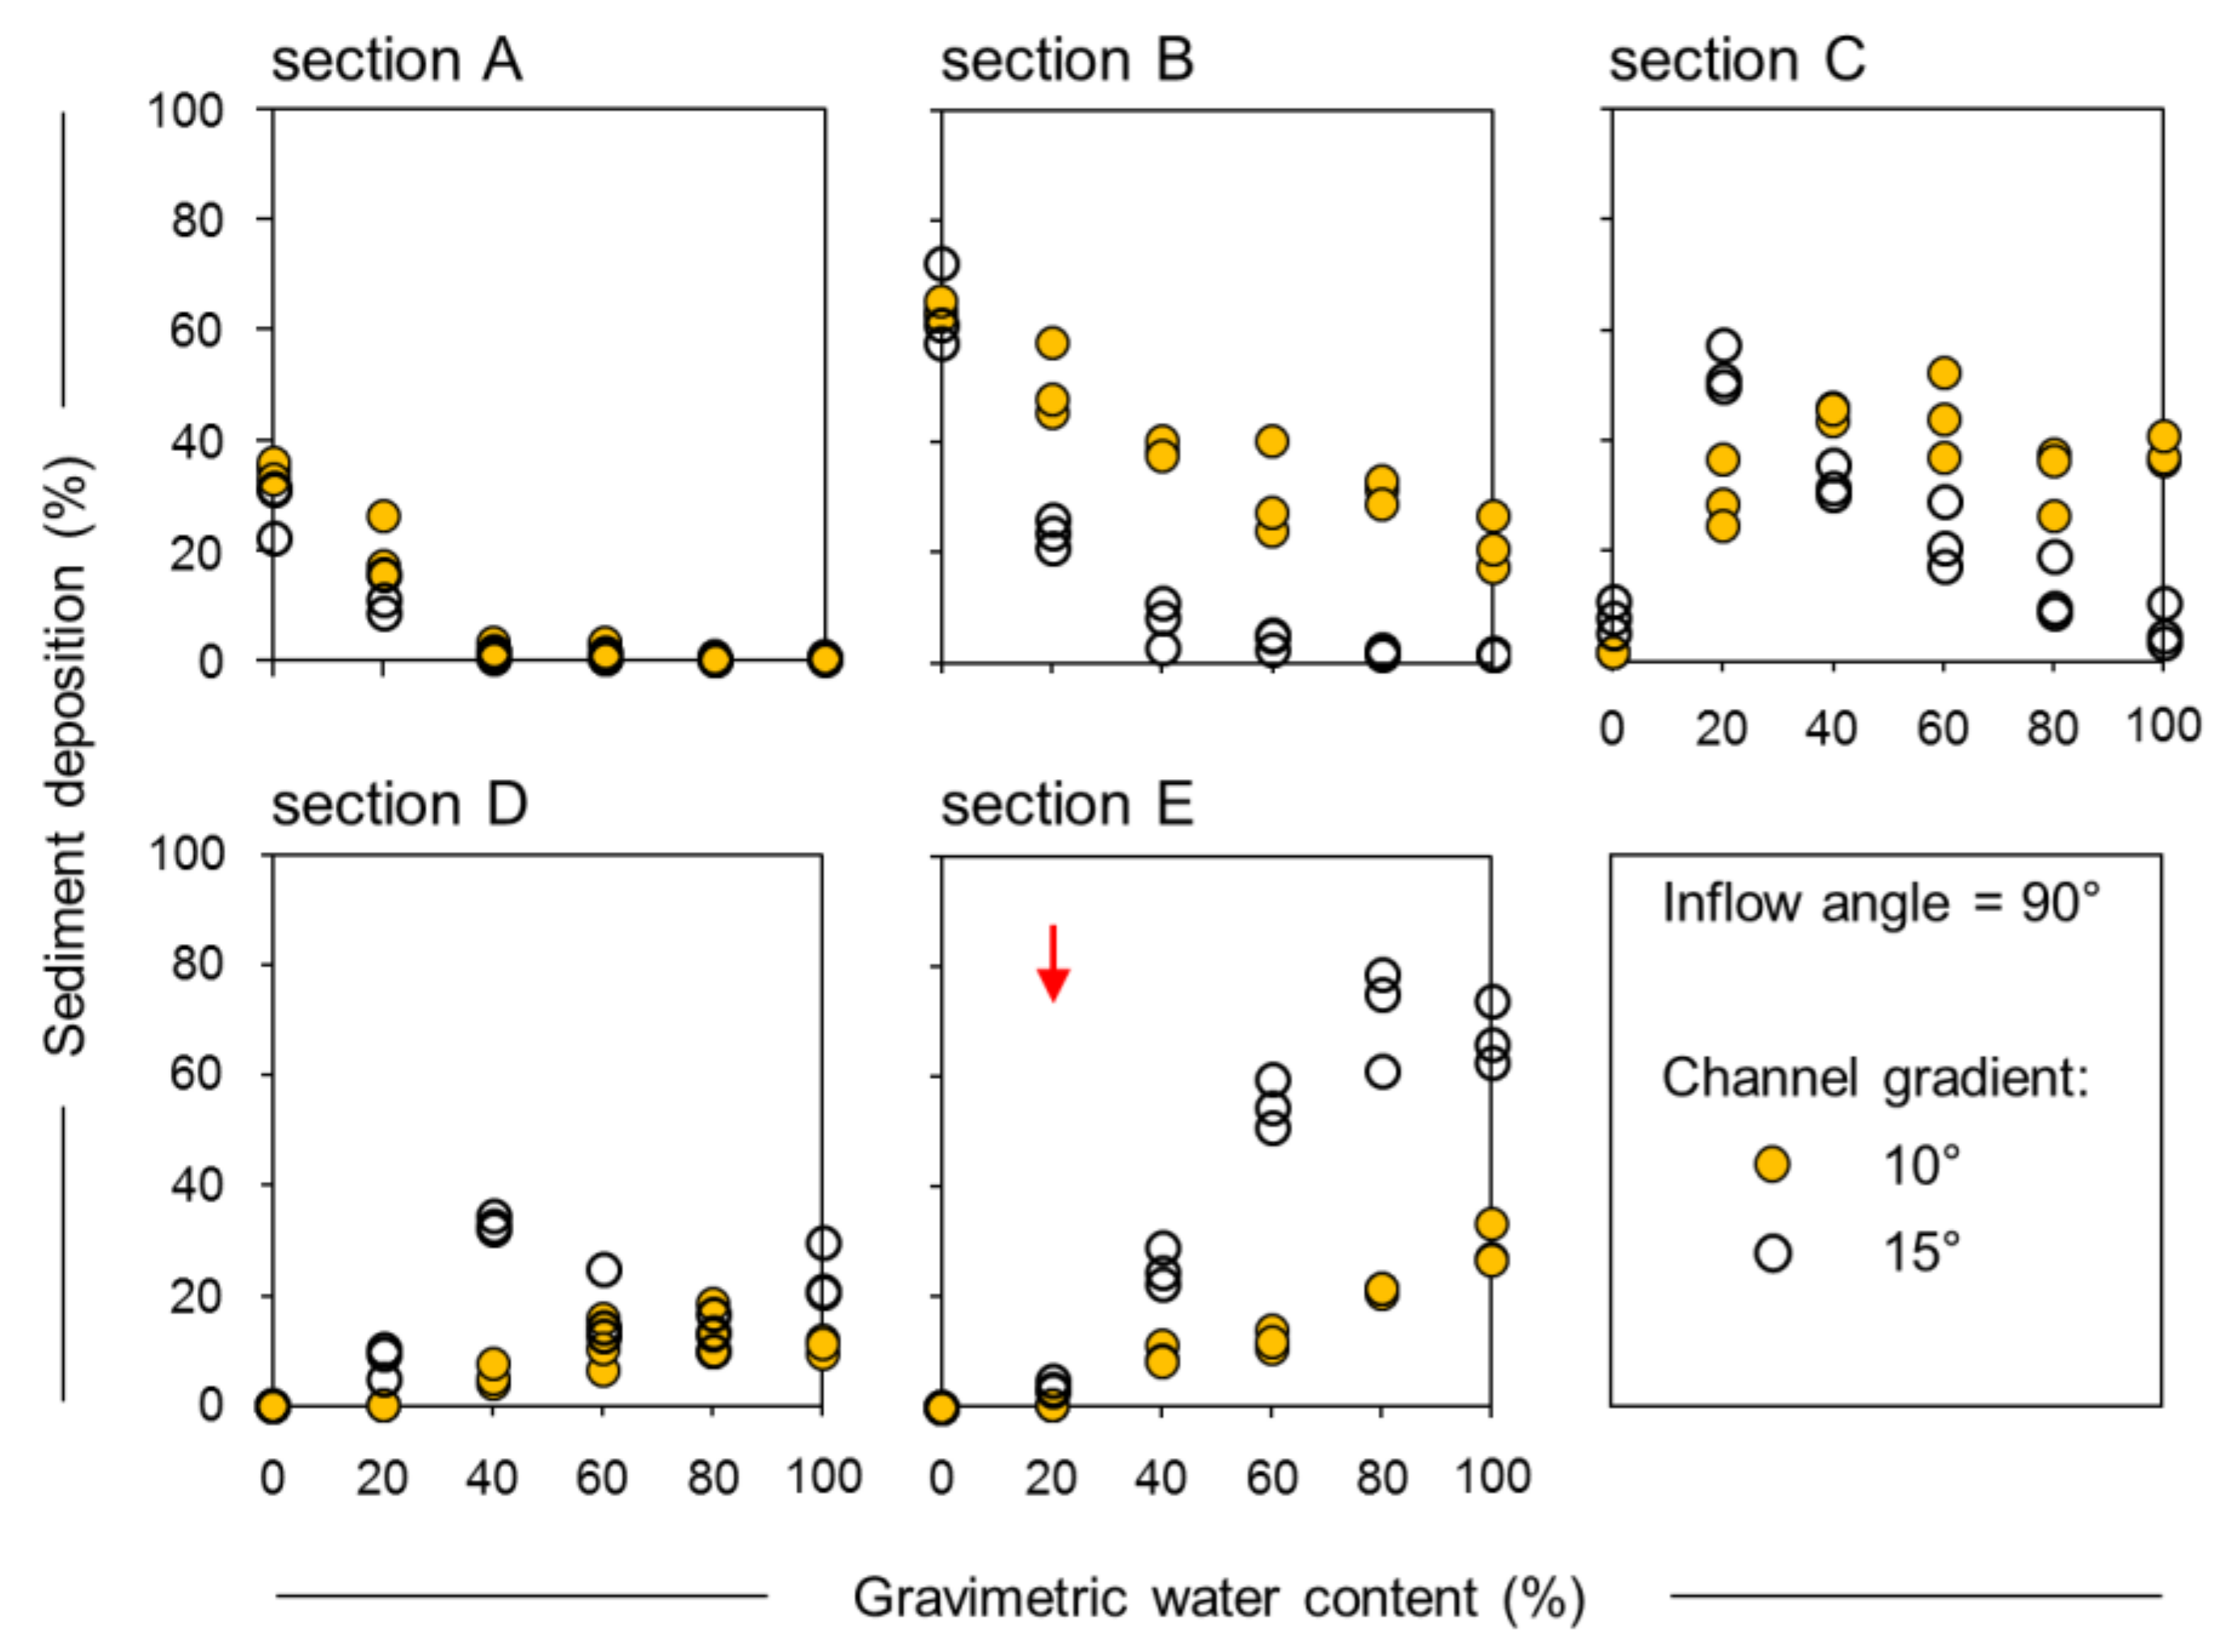
Responses of sediment movement in channel gradients of 15° and 10° differed, depending on flume sections (Figure 4, Table A1). For instance, percentages of sediment deposition between channel gradients of 15° and 10° did not differ so much in sections A, C, and D. Hence, the steep channel (15°) induced less sedimentation in section B and more sediment transfer to section E (Figure 4). Because sections C and D are transition zones of sediment movement, the remaining sediment tended to vary with water content. Sediment transported to section E differed with water added in the excess of saturation. For partial saturation (<wsat), percentages of sediment transferred to section E (end of the flume) were similar for both 10° and 15° channel gradients. Yet for excess saturation (>wsat), sediment transport and deposition at the end of the flume in the 15° channel increased rapidly and were much higher compared to the 10° channel.
3.3. Characteristics of Mobility Among Different Sediment Types
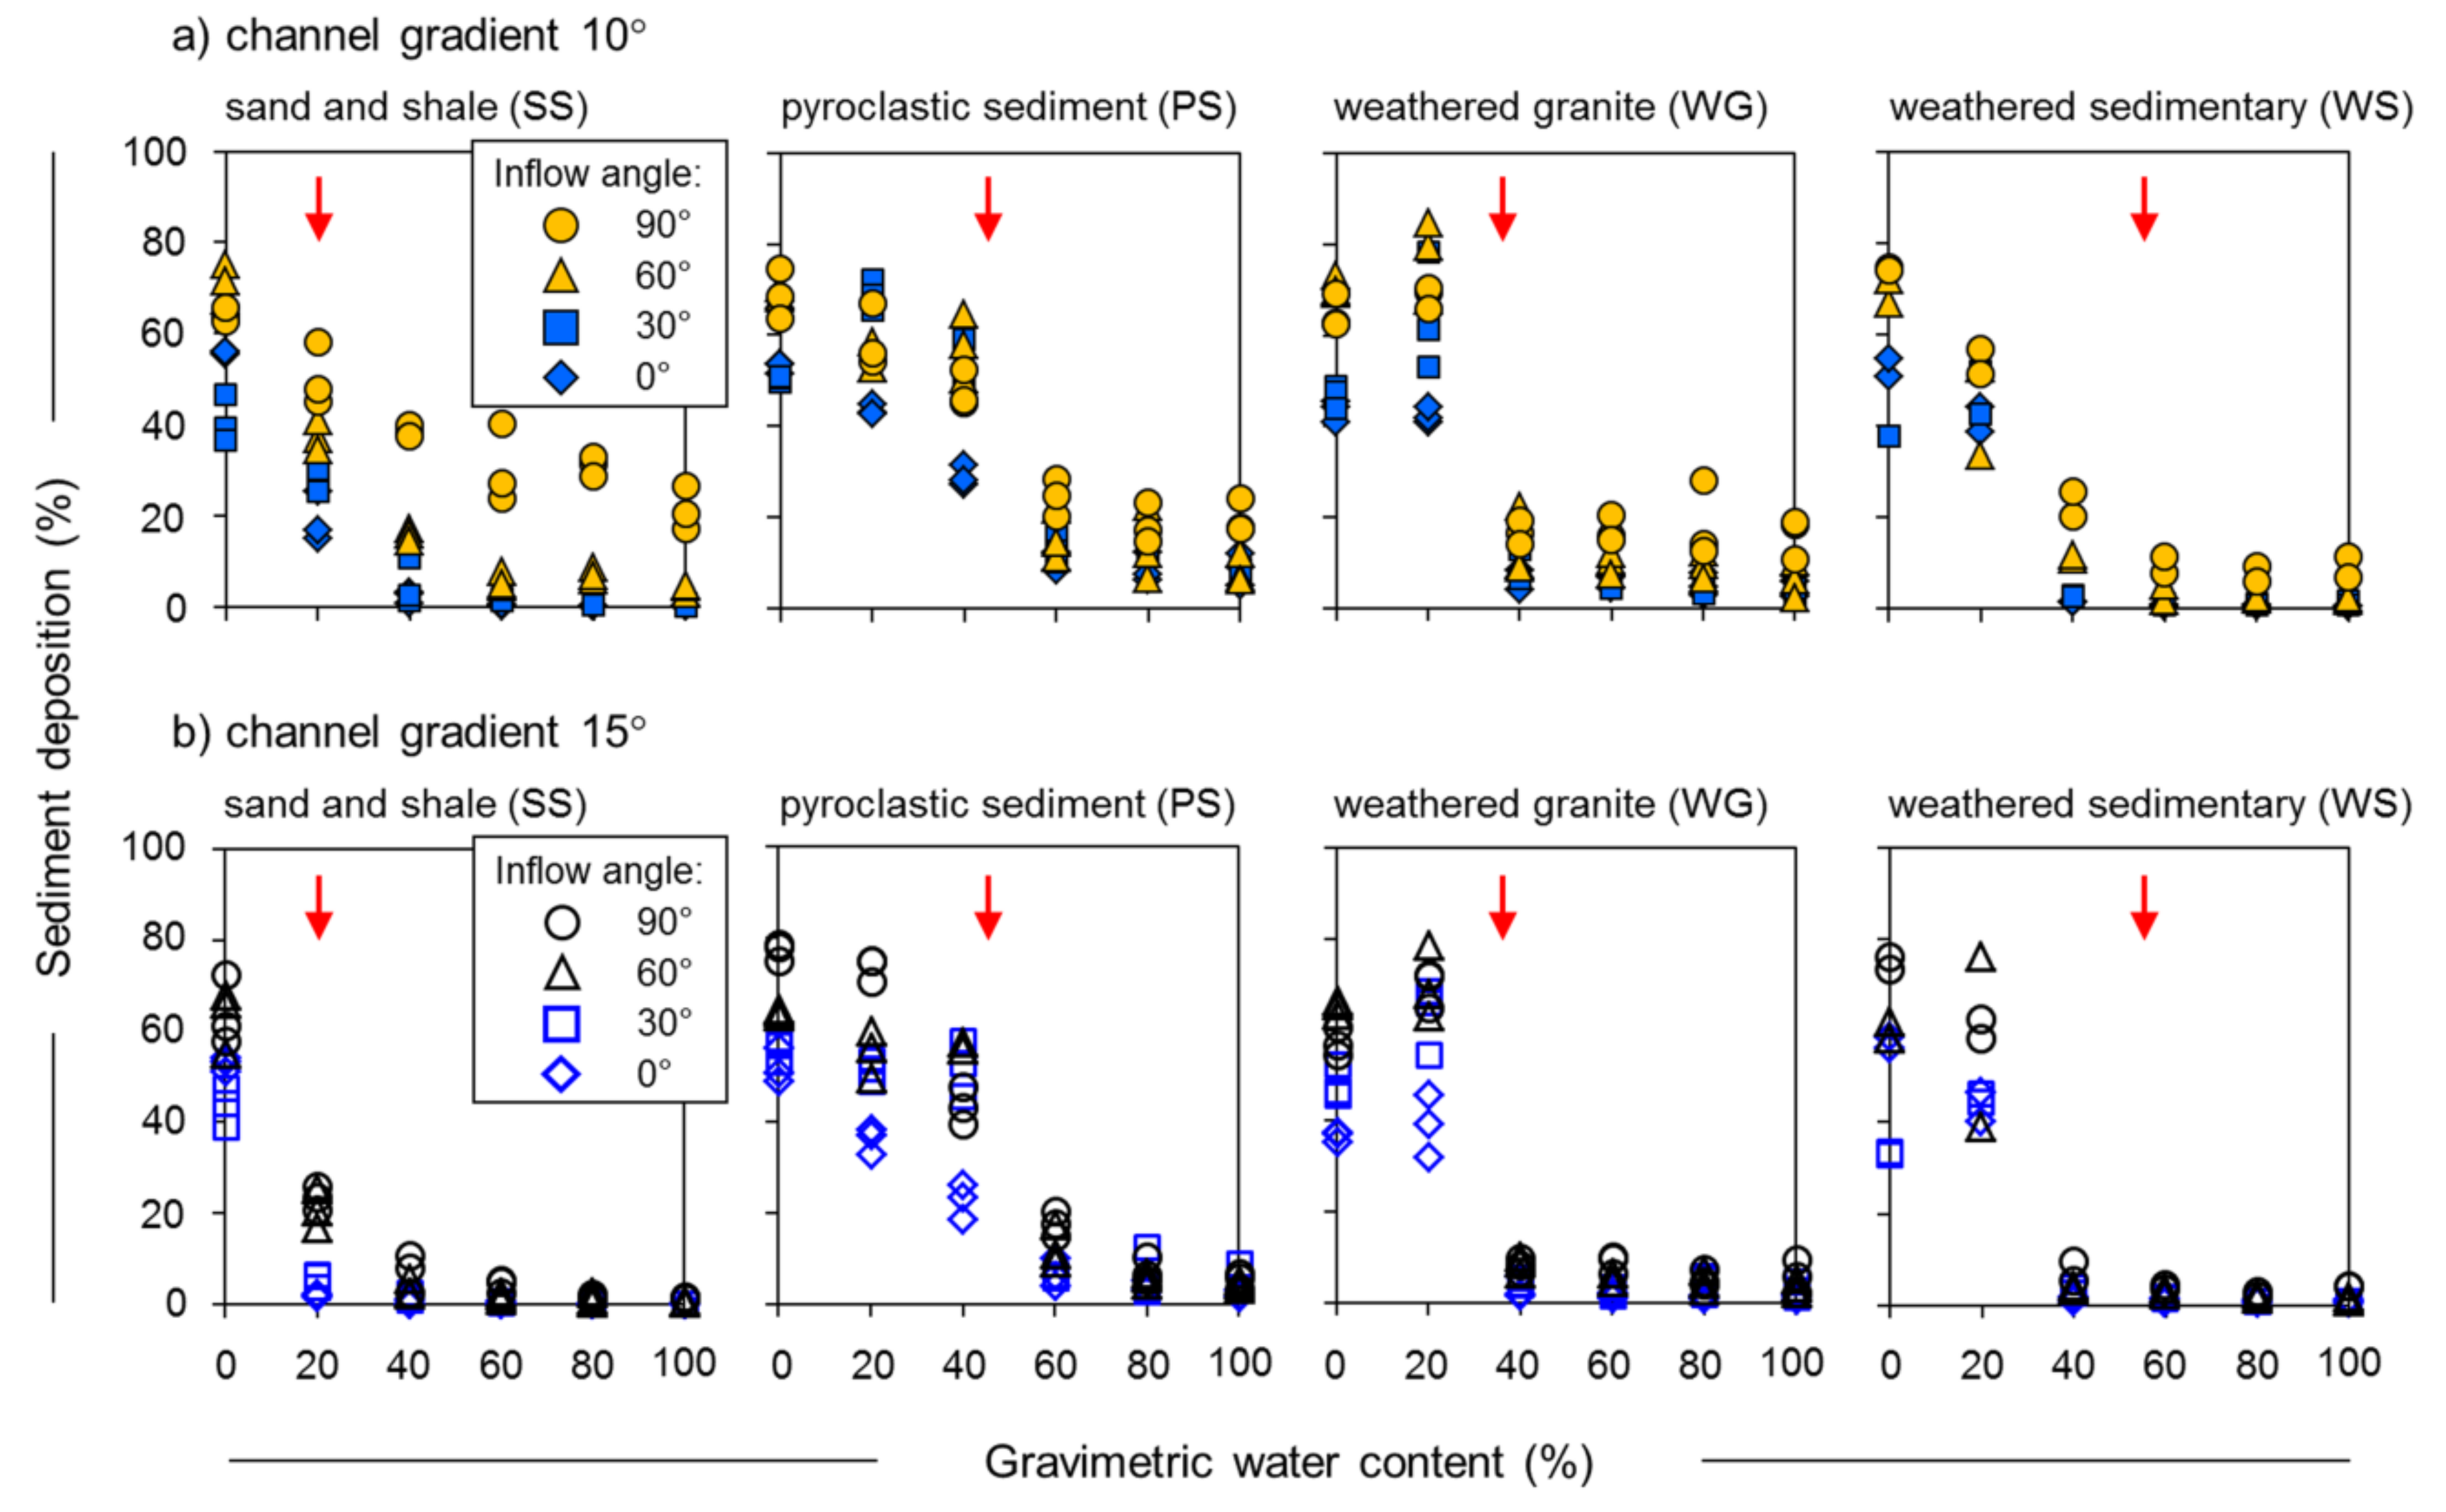
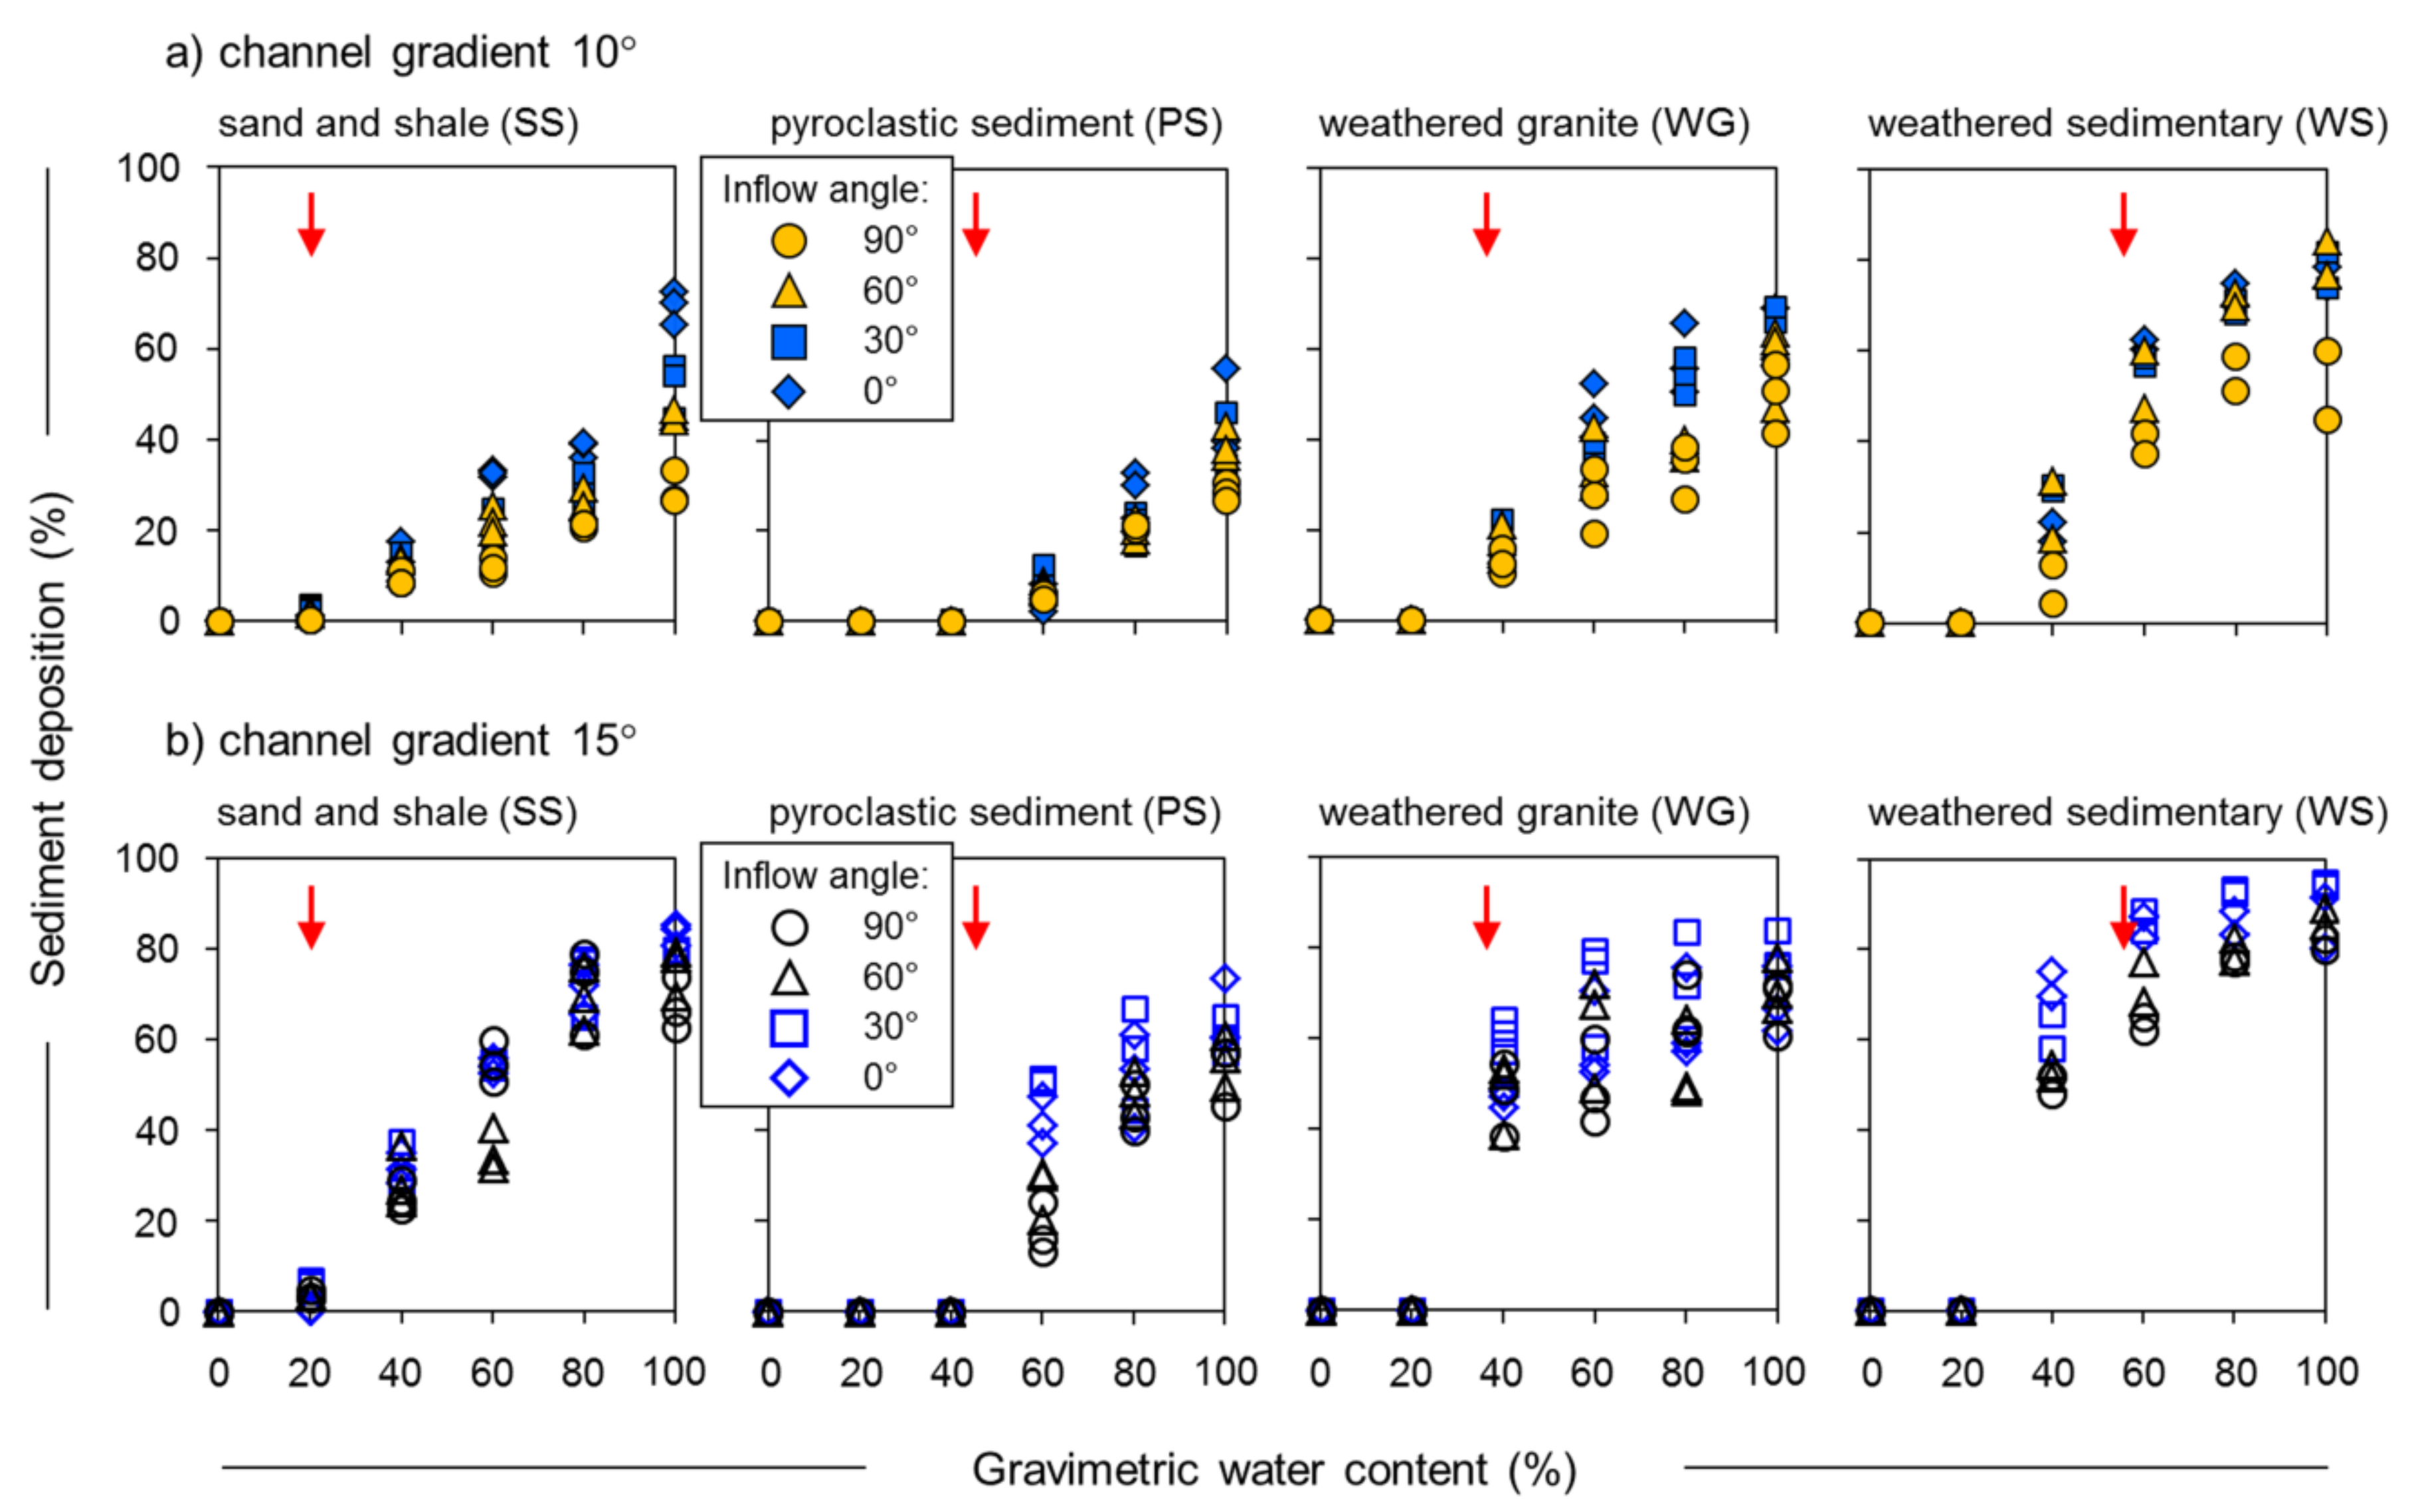
Although the general pattern of either decreases or increases in percentages of sediment in each section was similar, changes in sediment deposition for different water contents varied, depending on sediment types (Table A2, Table A3 and Table A4). The largest deposition in section B was formed by PS, followed by WG, SS, and WS (Figure 5, Table A5). Accordingly, PS transported the smallest amount of sediment to section E, while WS delivered the largest (Figure 6). The largest sediment transport to section E was generated when the inflow angle was 0°, channel gradient was 15°, and gravimetric water content was 100% (excess saturation). For these conditions, the average sediment transport to section E was 86%, 83%, 68%, and 65% for WS, SS, WG, and PS, respectively.
3.4. Connectivity Index
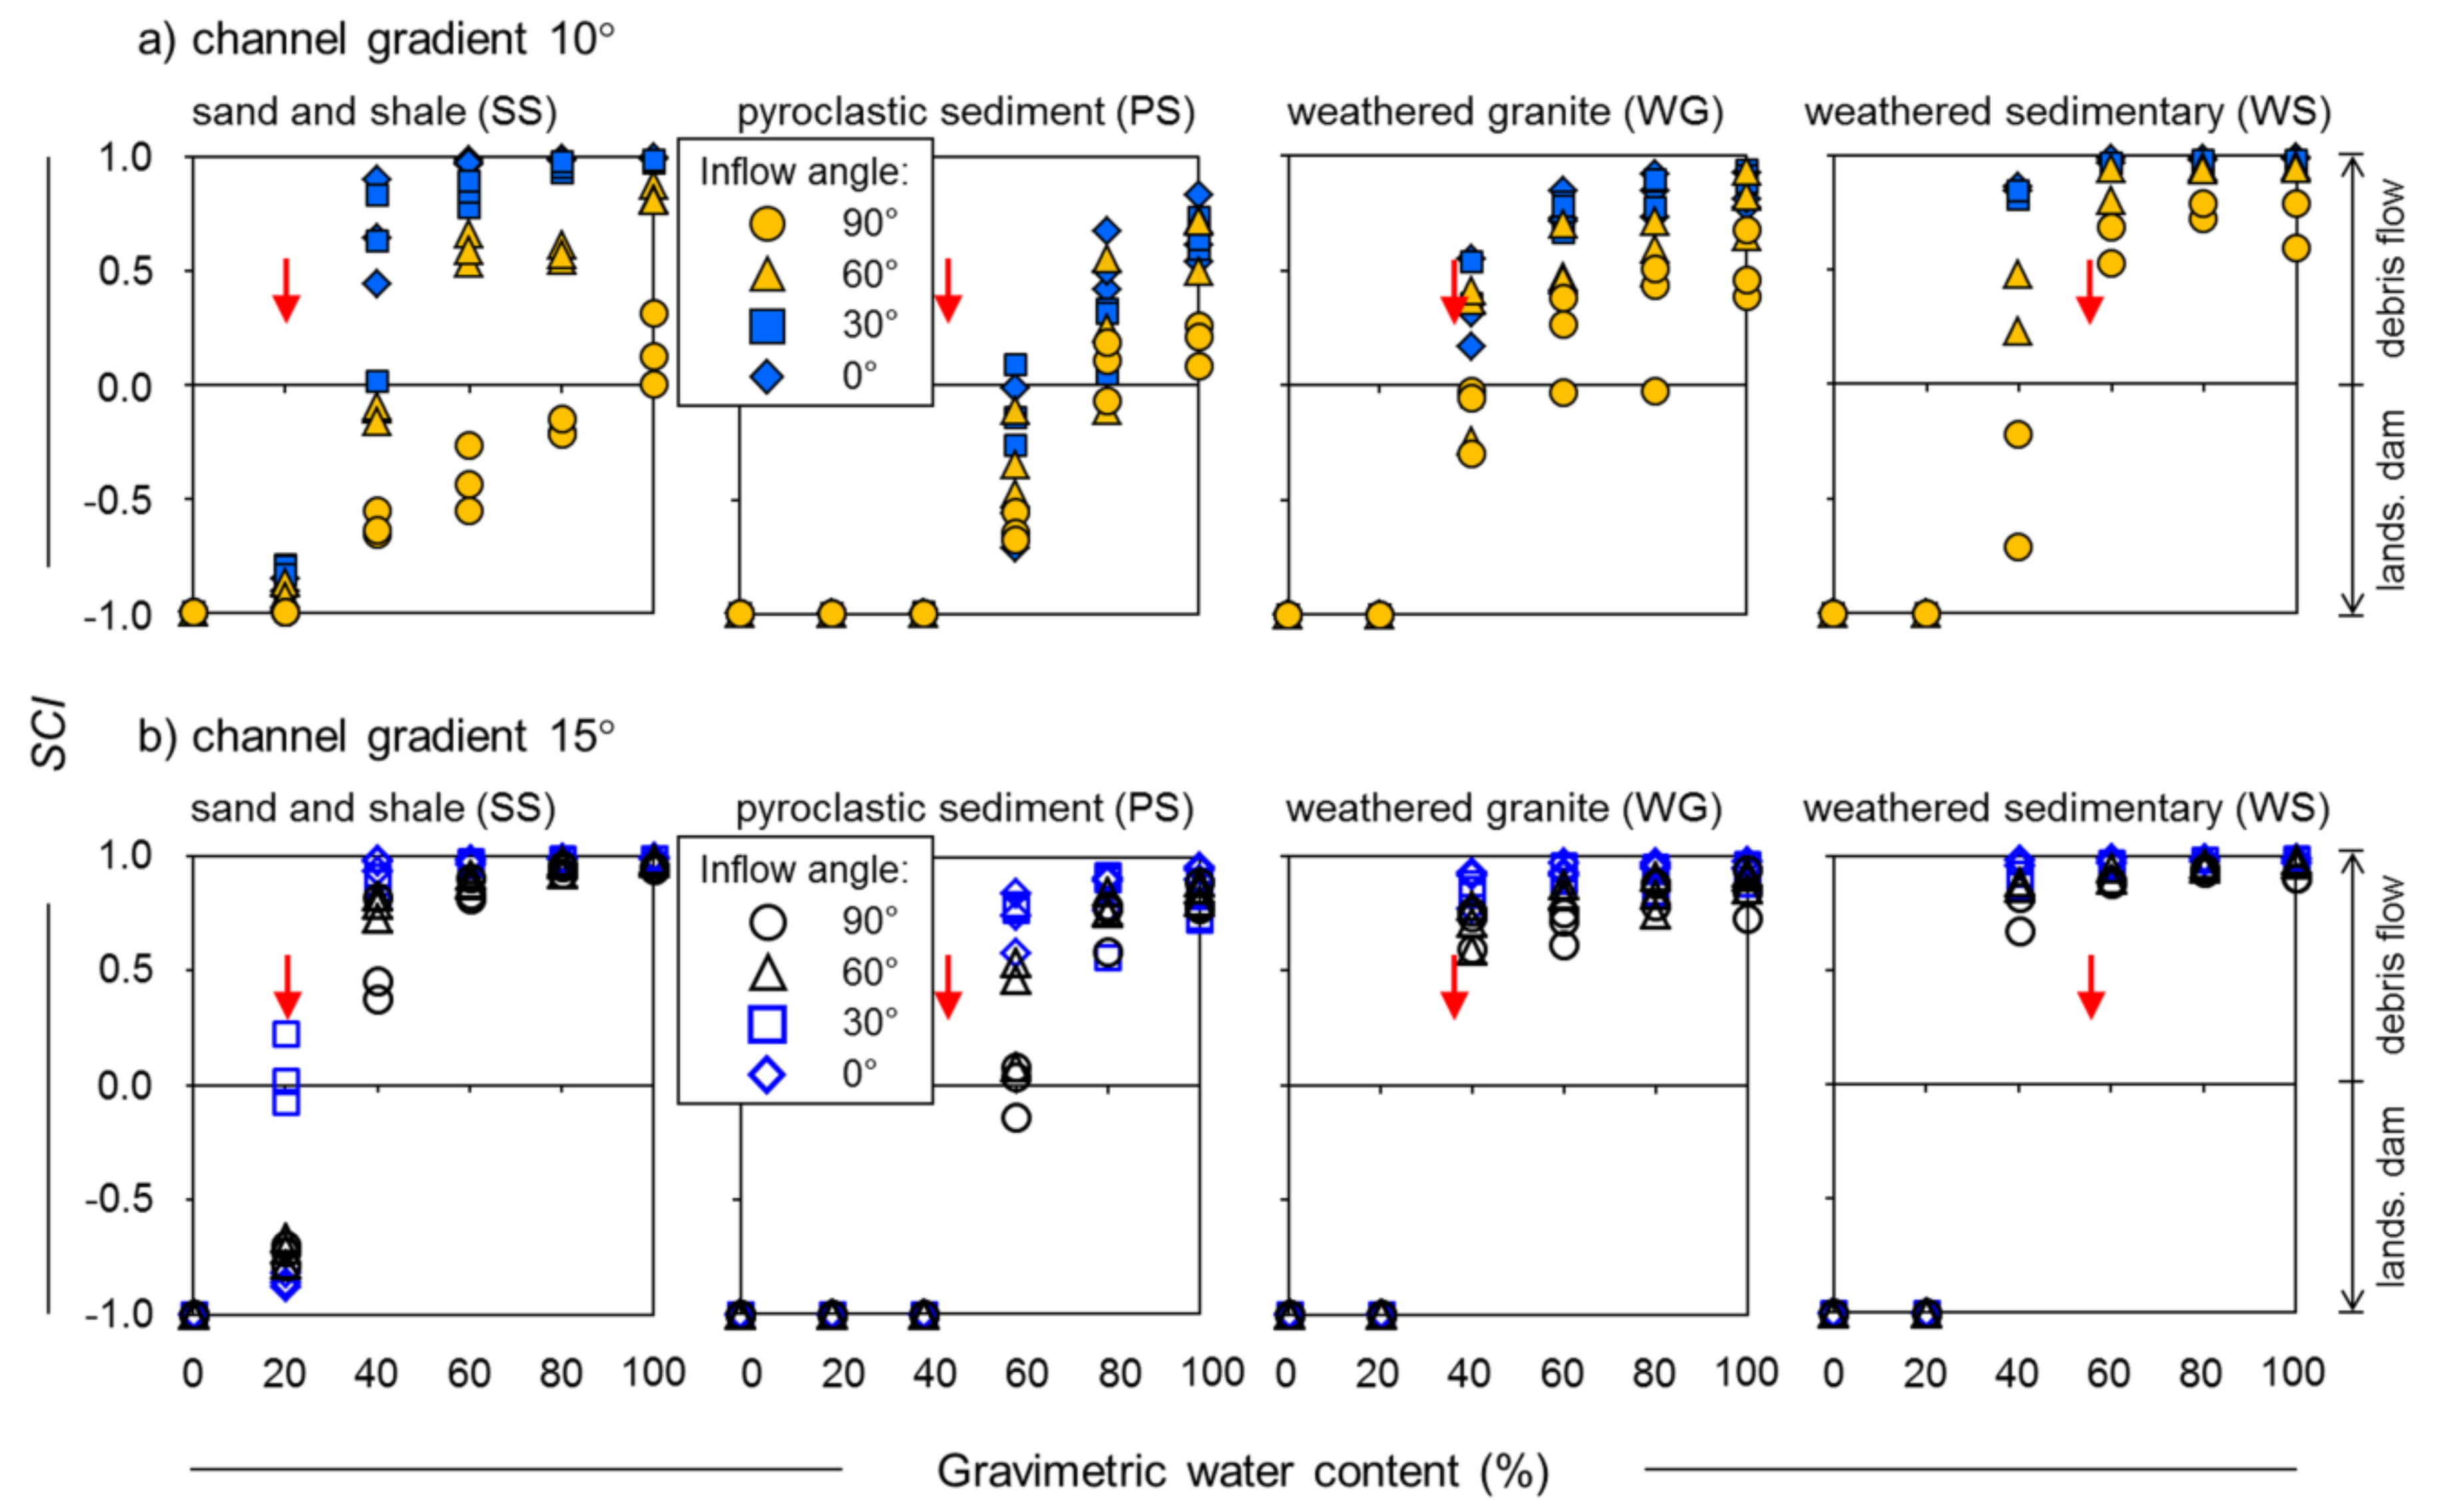
The assessment of sediment connectivity shows that SCI values change with respect to channel gradient and inflow angle (Figure 7). For the 10° channel gradient, SCI gradually increased from −1 to +1 as water content increased (Figure 7a). For this channel gradient, SCI values significantly differ, depending on the inflow angle. Inflow angles of 90° and 60° generated lower SCI than inflow angles of 30° and 0°. Contrastingly, for the 15° channel gradient, SCI increased rapidly to +1 once water contents reached saturation (Figure 7b). Differences in SCI values for various inflow angles were more apparent in the 10° channel compared to the 15° channel.
Associated with sediment mobility, the connectivity index differed among the sediment types and their properties. Sediments of SS, PS, and WG generated SCI values close to −1 for partial saturation, and increased to +1 for excess saturation conditions. In contrast, WS generated high SCI values, even though partially saturated. SCI values of WS began increasing after the water content exceeded the liquid limit.
4. Discussion
4.1. Effects of Topography on Landslide Dams and Debris Flows
Findings from our flume experiment for different topographic configurations confirmed previous field and flume studies. Based on field studies, Yamada et al. [48] suggested that inflow angle is the most important parameter for debris flow formation, with channel gradient as the second most important factor. An assessment of 24 earthquake-induced landslides in Japan found that those with inflow angles <70° and channel gradients >9° mobilized as debris flows [18]. Similarly, GIS analysis of 33 rainfall-induced deep-seated landslides suggested that landslide dams formed with inflow angles >60° and channel gradients <10°, while landslide materials with inflow angles <60° and channel gradients >10° were transported as debris flows [20]. Based on a flume experiment, an inflow angle of 45° generated smoother material flow into the channel and greater mobilization compared to a 90° inflow angle [29]. Contrastingly, an inflow angle of 90° distributed collapsed material across the channel and caused greater blockage than a 60° inflow angle [25].
Our flume experiment confirmed the formation of landslide dams. Risk of landslide dam formation can be estimated from the amount of material deposited at the junction. Based on 28 landslide dam cases during the Kii Peninsula 1889 disaster [49], the average percentage of landslide dam volume divided by the total landslide materials volume was 37%. Thus, landslide dams possibly formed at junctions when deposition exceeded 37% of the landslide volume. In contrast, sediment was likely transported as debris flows when deposition at the junction was below 37%. In our study, more than 37% of all sediment types deposited at the junction for inflow angles of 60° and 90°, particularly for partially saturated sediments (Figure 5). In contrast, inflow angles of 30° and 0° transported sediments as debris flows, specifically in excess saturation conditions. Our flume experiments suggest that inflow angle is a more important control of sediment transport and deposition than channel gradient. Although changes in the main channel gradient altered the amount of sediment transported to the outlet (Figure 6), landslide dams consistently formed at the junction because the deposition did not significantly change (Figure 5).
4.2. Effects of Sediment Types for Movement of Sediment
As suggested by numerous previous studies (e.g., [50]), our experiment, using sediment from different lithologies, confirmed that landslide mobility differed among sediment types. For instance, pyroclastic flow deposits are highly mobile during earthquake-triggered landslides (e.g., [18,51]). Theoretical analyses, experiments, and laboratory tests also suggest that the sediment porosity, permeability, and grain size distribution, which differ among sediment derived from different lithology, are key geotechnical properties that control the mobility of landslides [19]. Furthermore, when landslide dams form, these geotechnical properties also control the longevity of the dam [52].
Our experimental finding confirms that characteristics of mobility differ among sediment types. Pyroclastic sediment (PS) has the highest possibility of forming a landslide dam, while weathered sedimentary rock (WS) is least likely to form a dam. Yet WS differs from other sediment types because it mobilizes to downstream, even though partially saturated. The unique behavior of WS sediment mobility is associated with the combined effect of porosity, particle size distribution, and density. WS has the highest porosity and second highest D50, but the lowest density among the four sediment types. Laboratory experiments and numerical simulations indicate that landslide mobility and rates are acutely sensitive to sediment porosity [53] and are significantly influenced by particle size [54]. For instance, a simulation of the Oso landslide in Washington, USA, suggested that a 2% increase in porosity may accelerate the rapid movement and transport of sediment across greater distances because the porous and water-saturated sediment liquefies after the landslide [55]. Similarly, laboratory experiments of sediments with different D50 values indicate that sediment with smaller D50 values generates rapid sediment flow due to abrupt increases in pore water pressure [54].
4.3. Sediment Connectivity of Hillslope and Downstream
The Sediment Connectivity Index (SCI) represents the potential connection between parts of a catchment [32], particularly the connection between hillslopes and deposition areas (e.g., channels and relatively flat terrain) [3]. According to our SCI assessment, material mobilization depends on channel gradient and inflow angle, in association with water content and sediment type. For SS, PS, and WG, landslide material formed landslide dams for all inflow angles and channel gradients, specifically when sediments were partially saturated. Contrastingly, sediment transformed into debris flows in excess saturation conditions. WS exhibited the same movement characteristics, but with the water content boundary at the liquid limit, not saturation.
The assessment of sediment mobility using SCI has some limitations for comprehending sediment dynamics. In assessments of topographic conditions and sediment type, inflow angles of 30° and 0° are unlikely to form landslide dams (Figure 5). However, assessment by SCI suggests that these inflow angles have a high risk of forming a landslide dam because SCI was calculated based only on deposition at the junction (B) and the outlet (E). SCI values became high when differences of weight between sections B and E were high, despite the small deposition in the junction (B). To overcome this problem, further improvement of the connectivity index by considering different values (e.g., height of section B) should be developed. Assessment of sediment connectivity is crucial for hazard risk analysis by providing knowledge on possible end members of landslide material mobility on-site and off-site.
Scaling issues related to particle size may also affect the extrapolation of our flume findings to field situations. Our experiment used sediment collected from study sites which, if scaled up 2000 times, would likely have a coarser particle distribution compared to actual landslide materials. Previous studies noted that diversity in particle size is a critical component to debris flow behavior [54,56]. Fine sediment is prone to more rapid movement [54] and higher mobility than coarse sediment [31]. Therefore, our findings of sediment mobility are possibly underestimated compared to the actual sediment movement. Furthermore, because there was no flow in the main channel, such experimental design may also limit the mobility of landslide sediment, as well as the resultant estimation of connectivity. Nevertheless, our results highlight how topographic characteristics with different materials and water contents affect the formation of landslide dams and the mobility of debris flow materials. We believe that the findings of our flume experiment will help to develop meaningful connectivity indexes for hydrogeomorphic processes and different scales of sediment dynamics [4,57].
5. Conclusions
A two-segment flume was developed to examine the factors that control sediment connectivity between the hillslope and downstream, and the resultant end members of the sediment continuum. Previous studies revealed that inflow angle and channel gradient are major topographic factors influencing sediment mobility (e.g., [15,18,20]). Findings of our flume experiment agree with previous studies, indicating that inflow angle and channel gradient control sediment mobility. Material mobilization in the flume with inflow angles of 60° and 90° is poorly connected with downstream reaches and has a high risk of landslide dam formation. In contrast, with inflow angles of 0° and 30°, sediment sources and downstream reaches are closely connected, and material mobilizes downstream as debris flows. Our flume experiment suggests that inflow angle is the most important topographic factor related to sediment mobilization, followed by channel gradient.
Additionally, our results indicate that water content (hydrologic condition) and sediment properties (geologic condition) also affect sediment connectivity. Landslide material is mainly deposited at the hillslope-channel junction when the water content is below saturation and, in contrast, transported to the outlet for above saturation conditions. Among the four sediment types, pyroclastic sediment has the highest risk of forming a landslide dam, followed by weathered granite, weathered sedimentary rock, and sand and shale. In contrast, the risk of landslide material transforming into a debris flow is in the opposite order. The assessment of landslide mobility by a connectivity index shows that the formation of landslide dams and the occurrence of debris flows depend on hydrogeomorphic conditions and sediment properties. Because comprehensive spatial planning and land use strategies are key to ecosystem-based disaster risk reduction or green infrastructure strategies [57,58], and are more cost-effective methods than conventional structural approaches [59], the identification of sediment connectivity is an important aspect of disaster risk reduction.
Author Contributions
Conceptualization, resources, and supervision, Y.I.; Methodology, Y.I., T.G., R.C.S., and H.S.K.; Investigation, data curation, and writing—original draft preparation, H.S.K.; Validation, T.G., R.C.S., and K.S.; Visualization, T.G. and R.C.S.; Writing—review and editing, all co-authors.
Funding
Part of this study was supported by the Institute of Global Innovation Research, Tokyo University of Agriculture and Technology.
Acknowledgments
We thank Wakahara Taeko for valuable discussions and constructive feedbacks on conducting the flume experiment.
Conflicts of Interest
The authors declare no conflict of interest.
Appendix A

Table A1.
Summary of sediment deposition for 0° inflow angle (in %). Values in parentheses indicate standard deviations.
Table A1.
Summary of sediment deposition for 0° inflow angle (in %). Values in parentheses indicate standard deviations.
| Channel Gradient | Sediment Type | Water Content | Flume Sections | ||||||||||||||
|---|---|---|---|---|---|---|---|---|---|---|---|---|---|---|---|---|---|
| A | B | C | D | E | |||||||||||||
| 10° | sand and shale (SS) | 0% | 4.3 | (1.3) | 55.8 | (0.3) | 40.0 | (1.5) | 0.0 | (0.0) | 0.0 | (0.0) | |||||
| 20% | 0.8 | (0.2) | 19.1 | (5.5) | 67.0 | (2.0) | 12.1 | (7.2) | 1.0 | (0.3) | |||||||
| 40% | 0.6 | (0.1) | 2.4 | (1.3) | 42.7 | (7.2) | 41.2 | (5.0) | 13.1 | (4.3) | |||||||
| 60% | 0.4 | (0.0) | 0.4 | (0.1) | 10.3 | (7.0) | 56.5 | (6.5) | 32.4 | (0.6) | |||||||
| 80% | 0.3 | (0.1) | 0.3 | (0.0) | 5.2 | (2.4) | 56.3 | (3.2) | 37.9 | (1.9) | |||||||
| 100% | 0.4 | (0.0) | 0.3 | (0.1) | 1.3 | (0.8) | 28.7 | (4.4) | 69.3 | (3.7) | |||||||
| pyroclastic sediment (PS) | 0% | 26.4 | (1.5) | 52.8 | (1.2) | 20.8 | (0.9) | 0.0 | (0.0) | 0.0 | (0.0) | ||||||
| 20% | 46.1 | (2.0) | 43.5 | (1.2) | 10.4 | (0.8) | 0.0 | (0.0) | 0.0 | (0.0) | |||||||
| 40% | 42.1 | (4.5) | 28.9 | (2.2) | 28.9 | (2.2) | 0.0 | (0.0) | 0.0 | (0.0) | |||||||
| 60% | 4.4 | (1.0) | 10.9 | (2.3) | 38.4 | (7.7) | 41.7 | (5.9) | 4.5 | (3.2) | |||||||
| 80% | 2.9 | (1.2) | 8.7 | (3.2) | 23.9 | (4.8) | 36.1 | (3.2) | 28.4 | (5.2) | |||||||
| 100% | 1.8 | (0.7) | 8.7 | (3.4) | 17.4 | (1.7) | 27.6 | (5.2) | 44.5 | (9.8) | |||||||
| weathered granite (WG) | 0% | 34.9 | (4.1) | 43.6 | (2.4) | 21.5 | (1.9) | 0.0 | (0.0) | 0.0 | (0.0) | ||||||
| 20% | 39.6 | (2.3) | 42.3 | (1.6) | 18.1 | (0.7) | 0.0 | (0.0) | 0.0 | (0.0) | |||||||
| 40% | 2.2 | (0.9) | 6.4 | (2.1) | 25.4 | (2.8) | 52.9 | (2.4) | 13.0 | (1.4) | |||||||
| 60% | 2.4 | (0.2) | 6.1 | (1.5) | 26.9 | (5.2) | 18.8 | (1.7) | 45.8 | (6.0) | |||||||
| 80% | 2.4 | (1.0) | 5.1 | (2.6) | 20.3 | (6.3) | 14.9 | (2.1) | 57.3 | (7.7) | |||||||
| 100% | 1.3 | (0.8) | 5.2 | (2.3) | 18.5 | (6.2) | 13.8 | (1.9) | 61.1 | (6.9) | |||||||
| weathered sedimentary rock (WS) | 0% | 23.3 | (3.3) | 52.9 | (2.8) | 23.8 | (0.4) | 0.0 | (0.0) | 0.0 | (0.0) | ||||||
| 20% | 55.6 | (3.3) | 41.4 | (3.9) | 3.0 | (0.5) | 0.0 | (0.0) | 0.0 | (0.0) | |||||||
| 40% | 1.7 | (0.4) | 1.6 | (0.1) | 18.4 | (5.7) | 58.3 | (2.2) | 20.1 | (3.0) | |||||||
| 60% | 1.1 | (0.1) | 0.8 | (0.3) | 5.5 | (3.4) | 31.3 | (2.3) | 61.3 | (1.4) | |||||||
| 80% | 1.2 | (0.3) | 0.8 | (0.1) | 5.6 | (0.2) | 20.1 | (2.7) | 72.3 | (3.4) | |||||||
| 100% | 0.8 | (0.0) | 0.5 | (0.1) | 4.0 | (1.6) | 18.5 | (1.8) | 76.2 | (3.4) | |||||||
| 15° | sand and shale (SS) | 0% | 6.3 | (2.7) | 53.0 | (1.6) | 40.8 | (3.9) | 0.0 | (0.0) | 0.0 | (0.0) | |||||
| 20% | 1.2 | (0.3) | 2.0 | (0.3) | 36.9 | (8.8) | 59.8 | (8.7) | 0.2 | (0.0) | |||||||
| 40% | 0.4 | (0.1) | 0.5 | (0.5) | 5.4 | (2.1) | 62.2 | (6.0) | 31.5 | (3.4) | |||||||
| 60% | 0.3 | (0.0) | 0.6 | (0.3) | 10.6 | (2.2) | 34.3 | (2.4) | 54.2 | (1.6) | |||||||
| 80% | 0.3 | (0.0) | 0.3 | (0.0) | 5.9 | (3.1) | 22.2 | (2.8) | 71.3 | (5.5) | |||||||
| 100% | 0.3 | (0.0) | 0.2 | (0.1) | 2.4 | (1.5) | 13.7 | (0.8) | 83.3 | (2.3) | |||||||
| pyroclastic sediment (PS) | 0% | 17.4 | (5.8) | 51.8 | (3.8) | 30.8 | (2.0) | 0.0 | (0.0) | 0.0 | (0.0) | ||||||
| 20% | 46.4 | (5.4) | 36.0 | (2.8) | 17.6 | (2.6) | 0.0 | (0.0) | 0.0 | (0.0) | |||||||
| 40% | 38.2 | (2.8) | 22.6 | (3.8) | 39.2 | (4.1) | 0.0 | (0.0) | 0.0 | (0.0) | |||||||
| 60% | 3.9 | (1.5) | 6.7 | (3.0) | 13.6 | (1.8) | 32.0 | (2.0) | 41.9 | (5.2) | |||||||
| 80% | 1.9 | (0.6) | 3.7 | (1.3) | 12.6 | (2.7) | 30.2 | (6.8) | 51.6 | (10.5) | |||||||
| 100% | 1.4 | (0.5) | 2.1 | (0.8) | 7.2 | (0.7) | 24.5 | (6.5) | 64.8 | (7.4) | |||||||
| weathered granite (WG) | 0% | 31.4 | (2.1) | 36.7 | (1.2) | 31.9 | (2.3) | 0.0 | (0.0) | 0.0 | (0.0) | ||||||
| 20% | 33.3 | (5.6) | 39.0 | (6.8) | 27.7 | (4.2) | 0.0 | (0.0) | 0.0 | (0.0) | |||||||
| 40% | 1.9 | (0.1) | 3.1 | (2.3) | 18.0 | (6.0) | 30.2 | (6.6) | 46.8 | (1.8) | |||||||
| 60% | 1.2 | (0.4) | 1.7 | (0.6) | 10.0 | (3.6) | 27.9 | (5.9) | 59.1 | (9.9) | |||||||
| 80% | 0.9 | (0.3) | 1.2 | (0.2) | 7.9 | (2.2) | 26.0 | (8.2) | 64.0 | (10.1) | |||||||
| 100% | 0.6 | (0.1) | 1.4 | (0.5) | 7.9 | (2.8) | 22.0 | (4.1) | 68.0 | (7.2) | |||||||
| weathered sedimentary rock (WS) | 0% | 12.8 | (2.7) | 57.2 | (1.8) | 29.9 | (0.8) | 0.0 | (0.0) | 0.0 | (0.0) | ||||||
| 20% | 36.3 | (2.9) | 43.0 | (4.6) | 20.7 | (1.6) | 0.0 | (0.0) | 0.0 | (0.0) | |||||||
| 40% | 1.7 | (0.6) | 1.0 | (0.6) | 6.8 | (3.6) | 17.9 | (0.8) | 72.5 | (3.9) | |||||||
| 60% | 1.1 | (0.4) | 0.8 | (0.5) | 2.2 | (0.3) | 10.9 | (3.7) | 85.0 | (3.5) | |||||||
| 80% | 0.7 | (0.2) | 0.6 | (0.4) | 1.9 | (0.2) | 10.8 | (4.1) | 85.9 | (3.6) | |||||||
| 100% | 0.7 | (0.1) | 0.7 | (0.5) | 4.3 | (3.5) | 7.2 | (2.5) | 85.9 | (8.1) | |||||||
Table A2.
Summary of sediment deposition for 30° inflow angle (in %). Values in parentheses indicate standard deviations.
Table A2.
Summary of sediment deposition for 30° inflow angle (in %). Values in parentheses indicate standard deviations.
| Channel Gradient | Sediment Type | Water Content | Flume Sections | ||||||||||||||
|---|---|---|---|---|---|---|---|---|---|---|---|---|---|---|---|---|---|
| A | B | C | D | E | |||||||||||||
| 10° | sand and shale (SS) | 0% | 20.8 | (4.3) | 40.9 | (5.3) | 38.4 | (6.6) | 0.0 | (0.0) | 0.0 | (0.0) | |||||
| 20% | 11.5 | (4.8) | 27.0 | (2.5) | 57.3 | (3.8) | 1.2 | (0.6) | 2.9 | (0.6) | |||||||
| 40% | 2.7 | (3.4) | 5.0 | (5.2) | 60.1 | (3.6) | 19.2 | (3.8) | 12.7 | (2.1) | |||||||
| 60% | 1.2 | (1.0) | 1.7 | (0.5) | 60.2 | (4.8) | 17.0 | (3.6) | 19.6 | (4.5) | |||||||
| 80% | 0.8 | (0.4) | 0.7 | (0.3) | 54.0 | (2.1) | 15.3 | (2.4) | 29.0 | (3.5) | |||||||
| 100% | 0.7 | (0.5) | 0.5 | (0.3) | 19.3 | (7.4) | 27.4 | (4.4) | 51.6 | (6.2) | |||||||
| pyroclastic sediment (PS) | 0% | 30.7 | (3.5) | 50.4 | (0.7) | 19.0 | (2.9) | 0.0 | (0.0) | 0.0 | (0.0) | ||||||
| 20% | 28.9 | (2.1) | 68.8 | (3.3) | 2.3 | (1.4) | 0.0 | (0.0) | 0.0 | (0.0) | |||||||
| 40% | 38.7 | (5.0) | 53.5 | (4.9) | 7.7 | (3.1) | 0.1 | (0.2) | 0.0 | (0.1) | |||||||
| 60% | 5.4 | (1.1) | 13.6 | (3.5) | 43.6 | (3.3) | 26.3 | (5.2) | 10.7 | (1.4) | |||||||
| 80% | 4.6 | (0.6) | 12.9 | (1.9) | 37.1 | (2.2) | 23.9 | (1.6) | 21.0 | (3.9) | |||||||
| 100% | 2.8 | (1.0) | 7.8 | (0.9) | 31.3 | (1.8) | 19.5 | (5.7) | 38.2 | (6.9) | |||||||
| weathered granite (WG) | 0% | 31.3 | (2.4) | 46.8 | (2.4) | 21.9 | (0.5) | 0.0 | (0.0) | 0.0 | (0.0) | ||||||
| 20% | 35.7 | (12.9) | 64.3 | (12.9) | 0.0 | (0.0) | 0.0 | (0.0) | 0.0 | (0.0) | |||||||
| 40% | 3.8 | (1.7) | 8.7 | (3.7) | 35.4 | (10.7) | 36.3 | (10) | 15.8 | (5.5) | |||||||
| 60% | 3.2 | (2.5) | 5.2 | (1.5) | 28.7 | (4.0) | 26.6 | (2.6) | 36.2 | (2.7) | |||||||
| 80% | 1.1 | (0.1) | 4.2 | (1.8) | 19.0 | (7.0) | 21.6 | (4.5) | 54.1 | (4.2) | |||||||
| 100% | 0.8 | (0.2) | 3.1 | (1.1) | 11.9 | (4.0) | 16.9 | (2.3) | 67.3 | (1.7) | |||||||
| weathered sedimentary rock (WS) | 0% | 41.6 | (4.2) | 37.8 | (0.1) | 20.7 | (4.3) | 0.0 | (0.0) | 0.0 | (0.0) | ||||||
| 20% | 46.4 | (1.8) | 47.3 | (6.6) | 6.3 | (8.4) | 0.0 | (0.0) | 0.0 | (0.0) | |||||||
| 40% | 3.3 | (0.5) | 2.9 | (0.4) | 30.6 | (0.3) | 33.4 | (1.2) | 29.8 | (0.8) | |||||||
| 60% | 1.4 | (0.1) | 1.0 | (0.1) | 4.9 | (0.5) | 35.1 | (2.0) | 57.6 | (1.4) | |||||||
| 80% | 1.4 | (0.2) | 1.1 | (0.3) | 5.8 | (2.7) | 21.9 | (0.8) | 69.8 | (2.1) | |||||||
| 100% | 0.8 | (0.1) | 1.4 | (0.5) | 5.1 | (3.7) | 14.9 | (1.4) | 77.8 | (5.5) | |||||||
| 15° | sand and shale (SS) | 0% | 10.2 | (0.1) | 43.6 | (4.2) | 46.1 | (4.1) | 0.0 | (0.0) | 0.0 | (0.0) | |||||
| 20% | 1.0 | (0.3) | 5.7 | (1.5) | 38.8 | (4.3) | 47.4 | (3.0) | 6.3 | (0.4) | |||||||
| 40% | 0.3 | (0.1) | 2.0 | (0.6) | 20.9 | (4.3) | 44.8 | (6.6) | 31.1 | (5.6) | |||||||
| 60% | 0.2 | (0.0) | 0.8 | (0.2) | 10.2 | (0.9) | 33.9 | (1.4) | 54.2 | (0.8) | |||||||
| 80% | 0.2 | (0.0) | 0.4 | (0.0) | 2.5 | (2.5) | 23.3 | (4.6) | 73.3 | (7.1) | |||||||
| 100% | 0.2 | (0.0) | 0.3 | (0.0) | 0.7 | (0.1) | 18.9 | (0.2) | 79.5 | (0.3) | |||||||
| pyroclastic sediment (PS) | 0% | 12.2 | (1.1) | 55.8 | (2.4) | 32.1 | (1.3) | 0.0 | (0.0) | 0.0 | (0.0) | ||||||
| 20% | 40.7 | (1.2) | 51.2 | (2.3) | 8.1 | (2.0) | 0.0 | (0.0) | 0.0 | (0.0) | |||||||
| 40% | 33.0 | (5.5) | 52.0 | (6.0) | 15.0 | (1.3) | 0.0 | (0.0) | 0.0 | (0.0) | |||||||
| 60% | 2.6 | (1.1) | 6.2 | (0.4) | 17.1 | (1.4) | 23.0 | (2.7) | 51.0 | (0.5) | |||||||
| 80% | 2.2 | (1.5) | 6.0 | (5.6) | 18.1 | (7.4) | 17.1 | (3.3) | 56.6 | (11.3) | |||||||
| 100% | 3.7 | (0.2) | 7.1 | (3.1) | 12.7 | (1.9) | 15.7 | (0.7) | 60.9 | (4.0) | |||||||
| weathered granite (WG) | 0% | 16.5 | (0.8) | 48.2 | (3.7) | 35.3 | (4.5) | 0.0 | (0.0) | 0.0 | (0.0) | ||||||
| 20% | 35.6 | (8.5) | 63.0 | (7.4) | 1.3 | (2.3) | 0.0 | (0.0) | 0.0 | (0.0) | |||||||
| 40% | 1.3 | (0.2) | 4.6 | (0.7) | 15.2 | (1.3) | 18.0 | (2.5) | 60.8 | (3.5) | |||||||
| 60% | 1.0 | (0.3) | 2.3 | (0.9) | 11.9 | (6.0) | 13.3 | (5.2) | 71.5 | (11.7) | |||||||
| 80% | 1.0 | (0.3) | 4.5 | (2.1) | 11.4 | (4.6) | 11.5 | (5.5) | 71.7 | (11.8) | |||||||
| 100% | 0.9 | (0.9) | 3.0 | (1.7) | 8.3 | (3.1) | 9.1 | (2.7) | 78.7 | (4.4) | |||||||
| weathered sedimentary rock (WS) | 0% | 11.2 | (0.1) | 33.0 | (0.6) | 55.8 | (0.4) | 0.0 | (0.0) | 0.0 | (0.0) | ||||||
| 20% | 44.4 | (2.4) | 45.1 | (1.4) | 10.5 | (1.0) | 0.0 | (0.0) | 0.0 | (0.0) | |||||||
| 40% | 1.2 | (0.4) | 3.1 | (0.9) | 17.7 | (4.5) | 16.0 | (0.3) | 61.9 | (5.5) | |||||||
| 60% | 0.8 | (0.5) | 1.4 | (0.3) | 3.2 | (0.2) | 8.2 | (2.4) | 86.4 | (3.0) | |||||||
| 80% | 0.7 | (0.2) | 0.7 | (0.0) | 2.6 | (0.7) | 3.1 | (0.2) | 93.0 | (0.6) | |||||||
| 100% | 0.7 | (0.0) | 0.6 | (0.0) | 1.6 | (0.2) | 2.8 | (0.4) | 94.3 | (0.6) | |||||||
Table A3.
Summary of sediment deposition for 60° inflow angle (in %). Values in parentheses indicate standard deviations.
Table A3.
Summary of sediment deposition for 60° inflow angle (in %). Values in parentheses indicate standard deviations.
| Channel Gradient | Sediment Type | Water Content | Flume Sections | ||||||||||||||
|---|---|---|---|---|---|---|---|---|---|---|---|---|---|---|---|---|---|
| A | B | C | D | E | |||||||||||||
| 10° | sand and shale (SS) | 0% | 11.9 | (4.4) | 71.3 | (4.0) | 16.9 | (0.9) | 0.0 | (0.0) | 0.0 | (0.0) | |||||
| 20% | 2.7 | (1.2) | 37.4 | (3.2) | 56.8 | (3.4) | 1.2 | (0.2) | 1.8 | (0.5) | |||||||
| 40% | 0.5 | (0.1) | 15.9 | (1.5) | 57.1 | (5.7) | 13.6 | (4.1) | 12.5 | (1.9) | |||||||
| 60% | 1.0 | (1.0) | 5.7 | (1.7) | 45.6 | (1.2) | 25.1 | (4.3) | 22.1 | (2.9) | |||||||
| 80% | 0.3 | (0.1) | 7.2 | (1.3) | 46.7 | (4.0) | 18.9 | (1.6) | 26.6 | (2.3) | |||||||
| 100% | 0.3 | (0.0) | 4.2 | (1.0) | 25.7 | (4.7) | 24.2 | (3.0) | 45.1 | (1.2) | |||||||
| pyroclastic sediment (PS) | 0% | 13.3 | (0.7) | 69.1 | (1.2) | 17.7 | (0.7) | 0.0 | (0.0) | 0.0 | (0.0) | ||||||
| 20% | 41.2 | (3.4) | 54.7 | (3.4) | 4.1 | (0.2) | 0.0 | (0.0) | 0.0 | (0.0) | |||||||
| 40% | 38.9 | (9.1) | 57.5 | (7.2) | 3.6 | (2.0) | 0.0 | (0.0) | 0.0 | (0.0) | |||||||
| 60% | 1.2 | (0.3) | 15.7 | (5.4) | 50.1 | (2.4) | 24.7 | (5.7) | 7.9 | (0.9) | |||||||
| 80% | 0.6 | (0.3) | 13.6 | (8.0) | 43.8 | (2.2) | 21.5 | (3.8) | 20.1 | (2.3) | |||||||
| 100% | 0.4 | (0.2) | 8.4 | (3.3) | 28.6 | (2.8) | 23.0 | (4.0) | 39.1 | (3.5) | |||||||
| weathered granite (WG) | 0% | 14.7 | (4.9) | 70.7 | (2.2) | 14.6 | (2.7) | 0.0 | (0.0) | 0.0 | (0.0) | ||||||
| 20% | 14.7 | (6.2) | 77.3 | (8.6) | 8.0 | (13.8) | 0.0 | (0.0) | 0.0 | (0.0) | |||||||
| 40% | 0.9 | (0.1) | 13.6 | (7.6) | 39.2 | (7.1) | 27.8 | (10.3) | 18.6 | (4.3) | |||||||
| 60% | 0.5 | (0.2) | 10.0 | (2.3) | 32.9 | (13.5) | 21.7 | (8.8) | 34.9 | (6.8) | |||||||
| 80% | 0.3 | (0.1) | 9.5 | (2.8) | 30.6 | (2.6) | 21.8 | (3.3) | 37.8 | (2.1) | |||||||
| 100% | 0.4 | (0.2) | 6.2 | (3.9) | 16.4 | (5.6) | 19.7 | (0.9) | 57.4 | (9.2) | |||||||
| weathered sedimentary rock (WS) | 0% | 11.2 | (2.5) | 69.4 | (3.6) | 19.4 | (1.1) | 0.0 | (0.0) | 0.0 | (0.0) | ||||||
| 20% | 42.3 | (6.7) | 43.1 | (13.6) | 14.6 | (20.3) | 0.0 | (0.0) | 0.0 | (0.0) | |||||||
| 40% | 0.8 | (0.2) | 11.3 | (0.5) | 35.9 | (5.4) | 27.0 | (2.7) | 24.9 | (8.9) | |||||||
| 60% | 0.4 | (0.1) | 3.5 | (2.4) | 23.5 | (3.7) | 18.9 | (2.6) | 53.6 | (8.9) | |||||||
| 80% | 0.3 | (0.1) | 2.2 | (0.2) | 12.8 | (3.3) | 13.5 | (5.1) | 71.2 | (2.1) | |||||||
| 100% | 0.4 | (0.1) | 2.1 | (0.2) | 9.4 | (3.7) | 7.7 | (1.1) | 80.4 | (5.2) | |||||||
| 15° | sand and shale (SS) | 0% | 4.2 | (1.0) | 63.1 | (6.9) | 32.7 | (7.3) | 0.0 | (0.0) | 0.0 | (0.0) | |||||
| 20% | 0.5 | (0.2) | 21.1 | (4.3) | 72.1 | (3.9) | 3.0 | (0.7) | 3.3 | (0.2) | |||||||
| 40% | 0.3 | (0.1) | 3.6 | (1.7) | 25.8 | (2.4) | 40.5 | (10.4) | 29.0 | (6.6) | |||||||
| 60% | 0.2 | (0.0) | 2.0 | (0.7) | 22.5 | (2.7) | 39.3 | (2.6) | 35.2 | (4.7) | |||||||
| 80% | 0.2 | (0.0) | 1.6 | (1.0) | 14.4 | (9.3) | 14.7 | (2.5) | 68.9 | (7.0) | |||||||
| 100% | 0.2 | (0.1) | 0.7 | (0.2) | 5.8 | (4.3) | 17.4 | (3.9) | 75.6 | (5.3) | |||||||
| pyroclastic sediment (PS) | 0% | 7.1 | (1.3) | 63.9 | (0.8) | 29.0 | (0.6) | 0.0 | (0.0) | 0.0 | (0.0) | ||||||
| 20% | 34.7 | (7.8) | 55.1 | (5.3) | 10.2 | (2.9) | 0.0 | (0.0) | 0.0 | (0.0) | |||||||
| 40% | 36.7 | (2.3) | 56.2 | (0.8) | 7.0 | (1.5) | 0.0 | (0.0) | 0.0 | (0.0) | |||||||
| 60% | 1.5 | (0.6) | 12.4 | (4.2) | 31.8 | (4.9) | 27.3 | (3.8) | 26.9 | (5.8) | |||||||
| 80% | 0.8 | (0.5) | 5.6 | (1.2) | 16.1 | (3.6) | 29.2 | (1.7) | 48.2 | (4.7) | |||||||
| 100% | 0.7 | (0.3) | 4.3 | (0.9) | 12.3 | (2.5) | 27.3 | (3.7) | 55.4 | (5.7) | |||||||
| weathered granite (WG) | 0% | 8.9 | (2.2) | 65.2 | (1.6) | 25.9 | (0.6) | 0.0 | (0.0) | 0.0 | (0.0) | ||||||
| 20% | 19.2 | (6.3) | 69.8 | (7.9) | 11.1 | (10.3) | 0.0 | (0.0) | 0.0 | (0.0) | |||||||
| 40% | 1.0 | (0.2) | 8.4 | (1.8) | 17.8 | (4.7) | 24.8 | (2.2) | 48.0 | (8.1) | |||||||
| 60% | 0.7 | (0.3) | 5.2 | (1.1) | 12.0 | (3.2) | 19.2 | (9.9) | 62.9 | (12.2) | |||||||
| 80% | 0.5 | (0.2) | 4.8 | (2.1) | 16.6 | (5.8) | 24.1 | (1.2) | 54.0 | (8.8) | |||||||
| 100% | 0.7 | (0.5) | 3.7 | (1.5) | 9.7 | (1.0) | 14.6 | (5.7) | 71.4 | (5.8) | |||||||
| weathered sedimentary rock (WS) | 0% | 5.4 | (0.3) | 60.0 | (2.6) | 34.7 | (2.4) | 0.0 | (0.0) | 0.0 | (0.0) | ||||||
| 20% | 16.6 | (6.7) | 57.3 | (26.4) | 26.2 | (33.1) | 0.0 | (0.0) | 0.0 | (0.0) | |||||||
| 40% | 1.1 | (0.2) | 3.5 | (0.5) | 16.6 | (0.5) | 25.6 | (1.1) | 53.2 | (1.9) | |||||||
| 60% | 0.5 | (0.2) | 2.8 | (1.0) | 7.7 | (1.6) | 16.0 | (3.4) | 72.9 | (6.2) | |||||||
| 80% | 0.4 | (0.1) | 1.7 | (0.5) | 6.1 | (1.7) | 11.8 | (1.3) | 80.0 | (3.6) | |||||||
| 100% | 0.7 | (0.1) | 1.1 | (0.5) | 2.8 | (0.3) | 8.1 | (1.5) | 87.3 | (2.4) | |||||||
Table A4.
Summary of sediment deposition for 90° inflow angle (in %). Values in parentheses indicate standard deviations.
Table A4.
Summary of sediment deposition for 90° inflow angle (in %). Values in parentheses indicate standard deviations.
| Channel Gradient | Sediment Type | Water Content | Flume Sections | ||||||||||||||
|---|---|---|---|---|---|---|---|---|---|---|---|---|---|---|---|---|---|
| A | B | C | D | E | |||||||||||||
| 10° | sand and shale (SS) | 0% | 34.3 | (1.5) | 64.0 | (1.5) | 1.6 | (0.1) | 0.0 | (0.0) | 0.0 | (0.0) | |||||
| 20% | 19.5 | (5.8) | 50.4 | (6.8) | 29.8 | (6.0) | 0.2 | (0.1) | 0.1 | (0.0) | |||||||
| 40% | 1.5 | (1.3) | 38.7 | (1.3) | 45.0 | (1.3) | 5.5 | (1.9) | 9.2 | (1.6) | |||||||
| 60% | 2.2 | (1.4) | 30.4 | (8.7) | 44.3 | (7.7) | 10.9 | (4.6) | 12.1 | (1.6) | |||||||
| 80% | 0.6 | (0.1) | 31.1 | (2.0) | 33.3 | (6.2) | 13.8 | (4.5) | 21.0 | (0.4) | |||||||
| 100% | 0.5 | (0.1) | 21.6 | (4.7) | 37.9 | (2.5) | 10.9 | (1.3) | 28.8 | (3.8) | |||||||
| pyroclastic sediment (PS) | 0% | 27.4 | (5.0) | 68.8 | (5.5) | 3.7 | (0.7) | 0.0 | (0.0) | 0.0 | (0.0) | ||||||
| 20% | 38.4 | (7.2) | 59.1 | (7.0) | 2.5 | (0.3) | 0.0 | (0.0) | 0.0 | (0.0) | |||||||
| 40% | 36.0 | (2.5) | 47.8 | (4.0) | 16.2 | (1.6) | 0.0 | (0.0) | 0.0 | (0.0) | |||||||
| 60% | 8.1 | (2.6) | 24.4 | (4.0) | 44.1 | (8.6) | 17.8 | (8.2) | 5.6 | (0.7) | |||||||
| 80% | 5.9 | (1.0) | 18.3 | (4.4) | 38.8 | (1.4) | 16.1 | (3.3) | 21.0 | (0.6) | |||||||
| 100% | 5.6 | (1.5) | 19.8 | (3.8) | 33.0 | (2.7) | 12.9 | (3.2) | 28.6 | (1.9) | |||||||
| weathered granite (WG) | 0% | 32.4 | (3.4) | 64.8 | (3.8) | 2.8 | (0.5) | 0.0 | (0.0) | 0.0 | (0.0) | ||||||
| 20% | 31.5 | (2.5) | 68.5 | (2.5) | 0.0 | (0.0) | 0.0 | (0.0) | 0.0 | (0.0) | |||||||
| 40% | 4.7 | (3.3) | 16.7 | (2.7) | 27.2 | (6.0) | 38.6 | (4.3) | 12.9 | (2.7) | |||||||
| 60% | 2.8 | (0.7) | 17.2 | (2.9) | 31.8 | (5.4) | 21.4 | (2.4) | 26.8 | (7.1) | |||||||
| 80% | 4.2 | (3.2) | 18.3 | (8.7) | 25.3 | (4.4) | 18.6 | (3.9) | 33.7 | (6.0) | |||||||
| 100% | 1.0 | (0.4) | 16.0 | (4.5) | 15.8 | (4.4) | 17.5 | (1.0) | 49.6 | (7.6) | |||||||
| weathered sedimentary rock (WS) | 0% | 23.7 | (0.7) | 74.4 | (0.5) | 1.9 | (0.1) | 0.0 | (0.0) | 0.0 | (0.0) | ||||||
| 20% | 45.7 | (3.8) | 54.3 | (3.8) | 0.0 | (0.0) | 0.0 | (0.0) | 0.0 | (0.0) | |||||||
| 40% | 2.6 | (1.1) | 22.8 | (3.9) | 37.0 | (0.8) | 29.0 | (1.9) | 8.6 | (6.0) | |||||||
| 60% | 2.6 | (0.1) | 9.6 | (2.6) | 22.3 | (0.9) | 25.9 | (0.3) | 39.5 | (3.1) | |||||||
| 80% | 0.9 | (0.2) | 7.7 | (2.4) | 18.5 | (11.7) | 17.9 | (4.1) | 55.0 | (5.3) | |||||||
| 100% | 2.0 | (0.2) | 9.2 | (3.0) | 20.4 | (7.3) | 16.0 | (0.1) | 52.4 | (10.7) | |||||||
| 15° | sand and shale (SS) | 0% | 28.2 | (5.0) | 63.9 | (7.7) | 7.9 | (2.9) | 0.0 | (0.0) | 0.0 | (0.0) | |||||
| 20% | 11.7 | (3.5) | 23.5 | (2.6) | 52.8 | (4.0) | 8.3 | (3.0) | 3.6 | (1.0) | |||||||
| 40% | 1.2 | (0.6) | 7.4 | (4.2) | 32.5 | (2.7) | 33.1 | (1.4) | 25.2 | (3.3) | |||||||
| 60% | 0.7 | (0.5) | 4.4 | (1.5) | 22.4 | (6.0) | 17.3 | (6.5) | 55.0 | (4.4) | |||||||
| 80% | 0.2 | (0.0) | 2.0 | (0.5) | 12.5 | (5.6) | 13.4 | (3.4) | 71.7 | (9.3) | |||||||
| 100% | 0.4 | (0.2) | 1.7 | (0.2) | 6.2 | (3.8) | 23.8 | (5.2) | 67.5 | (5.7) | |||||||
| pyroclastic sediment (PS) | 0% | 8.0 | (1.3) | 77.4 | (2.0) | 14.7 | (0.8) | 0.0 | (0.0) | 0.0 | (0.0) | ||||||
| 20% | 25.0 | (2.1) | 73.7 | (2.7) | 1.3 | (0.6) | 0.0 | (0.0) | 0.0 | (0.0) | |||||||
| 40% | 37.7 | (2.7) | 43.3 | (4.1) | 18.9 | (2.2) | 0.0 | (0.0) | 0.0 | (0.0) | |||||||
| 60% | 7.4 | (4.2) | 17.7 | (2.8) | 26.4 | (2.5) | 30.6 | (3.7) | 17.9 | (5.6) | |||||||
| 80% | 2.5 | (0.8) | 7.2 | (2.7) | 17.9 | (3.6) | 28.0 | (1.5) | 44.3 | (5.3) | |||||||
| 100% | 1.8 | (1.0) | 5.3 | (1.8) | 14.1 | (1.8) | 25.7 | (5.6) | 53.2 | (6.9) | |||||||
| weathered granite (WG) | 0% | 34.8 | (2.7) | 57.2 | (3.1) | 8.0 | (0.6) | 0.0 | (0.0) | 0.0 | (0.0) | ||||||
| 20% | 30.4 | (4.2) | 69.6 | (4.2) | 0.0 | (0.0) | 0.0 | (0.0) | 0.0 | (0.0) | |||||||
| 40% | 2.4 | (0.6) | 8.2 | (1.5) | 18.3 | (3.7) | 23.8 | (3.8) | 47.2 | (8.1) | |||||||
| 60% | 0.8 | (0.1) | 8.8 | (1.9) | 18.0 | (5.8) | 22.9 | (6.3) | 49.5 | (9.4) | |||||||
| 80% | 0.9 | (0.8) | 5.3 | (1.9) | 10.7 | (2.5) | 17.1 | (4.2) | 65.9 | (7.1) | |||||||
| 100% | 0.9 | (0.6) | 5.9 | (3.7) | 11.9 | (3.0) | 13.4 | (1.5) | 67.9 | (6.3) | |||||||
| weathered sedimentary rock (WS) | 0% | 10.9 | (0.7) | 74.6 | (2.1) | 14.6 | (2.9) | 0.0 | (0.0) | 0.0 | (0.0) | ||||||
| 20% | 35.3 | (3.2) | 60.3 | (3.1) | 4.4 | (6.3) | 0.0 | (0.0) | 0.0 | (0.0) | |||||||
| 40% | 1.6 | (0.7) | 7.3 | (3.0) | 21.0 | (0.6) | 20.0 | (1.1) | 50.1 | (2.8) | |||||||
| 60% | 1.1 | (0.5) | 3.8 | (0.5) | 9.8 | (2.5) | 21.8 | (0.5) | 63.6 | (2.1) | |||||||
| 80% | 0.6 | (0.0) | 2.3 | (0.6) | 3.9 | (0.1) | 15.3 | (1.5) | 77.9 | (0.9) | |||||||
| 100% | 0.8 | (0.1) | 4.0 | (0.1) | 4.4 | (0.2) | 9.7 | (1.2) | 81.2 | (1.6) | |||||||
Table A5.
Summary of sediment thickness at the hillslope-channel junction (section B, in cm). Values in parentheses indicate standard deviations.
Table A5.
Summary of sediment thickness at the hillslope-channel junction (section B, in cm). Values in parentheses indicate standard deviations.
| Channel Gradient | Sediment Type | Water Content | Inflow Angle | |||||||||||
|---|---|---|---|---|---|---|---|---|---|---|---|---|---|---|
| 0° | 30° | 60° | 90° | |||||||||||
| 10° | sand and shale (SS) | 0% | 2.2 | (0.0) | 1.6 | (0.2) | 2.8 | (0.2) | 2.6 | (0.1) | ||||
| 20% | 0.8 | (0.2) | 1.1 | (0.1) | 1.5 | (0.1) | 2.0 | (0.3) | ||||||
| 40% | 0.1 | (0.1) | 0.2 | (0.2) | 0.6 | (0.1) | 1.5 | (0.1) | ||||||
| 60% | 0.0 | (0.0) | 0.1 | (0.0) | 0.2 | (0.1) | 1.2 | (0.3) | ||||||
| 80% | 0.0 | (0.0) | 0.0 | (0.0) | 0.3 | (0.1) | 1.2 | (0.1) | ||||||
| 100% | 0.0 | (0.0) | 0.0 | (0.0) | 0.2 | (0.0) | 0.9 | (0.2) | ||||||
| pyroclastic sediment (PS) | 0% | 2.4 | (0.3) | 2.3 | (0.3) | 3.2 | (0.4) | 3.2 | (0.5) | |||||
| 20% | 2.0 | (0.3) | 3.2 | (0.5) | 2.5 | (0.4) | 2.7 | (0.6) | ||||||
| 40% | 1.3 | (0.2) | 2.5 | (0.4) | 2.7 | (0.6) | 2.2 | (0.4) | ||||||
| 60% | 0.5 | (0.2) | 0.6 | (0.2) | 0.7 | (0.3) | 1.1 | (0.3) | ||||||
| 80% | 0.4 | (0.2) | 0.6 | (0.1) | 0.7 | (0.4) | 0.8 | (0.3) | ||||||
| 100% | 0.4 | (0.2) | 0.4 | (0.1) | 0.4 | (0.2) | 0.9 | (0.2) | ||||||
| weathered granite (WG) | 0% | 2.1 | (0.3) | 2.3 | (0.3) | 3.5 | (0.6) | 3.2 | (0.6) | |||||
| 20% | 2.1 | (0.4) | 3.1 | (0.2) | 3.8 | (0.7) | 3.4 | (0.5) | ||||||
| 40% | 0.3 | (0.1) | 0.4 | (0.2) | 0.7 | (0.5) | 0.8 | (0.2) | ||||||
| 60% | 0.3 | (0.1) | 0.3 | (0.1) | 0.5 | (0.1) | 0.9 | (0.2) | ||||||
| 80% | 0.2 | (0.1) | 0.2 | (0.1) | 0.5 | (0.1) | 0.9 | (0.5) | ||||||
| 100% | 0.2 | (0.1) | 0.2 | (0.1) | 0.3 | (0.1) | 0.8 | (0.2) | ||||||
| weathered sedimentary rock (WS) | 0% | 2.2 | (0.2) | 1.6 | (0.1) | 2.9 | (0.3) | 3.1 | (0.1) | |||||
| 20% | 1.7 | (0.1) | 2.0 | (0.4) | 1.8 | (0.6) | 2.2 | (0.0) | ||||||
| 40% | 0.1 | (0.0) | 0.1 | (0.0) | 0.5 | (0.0) | 1.0 | (0.2) | ||||||
| 60% | 0.0 | (0.0) | 0.0 | (0.0) | 0.1 | (0.1) | 0.4 | (0.1) | ||||||
| 80% | 0.0 | (0.0) | 0.0 | (0.0) | 0.1 | (0.0) | 0.3 | (0.1) | ||||||
| 100% | 0.0 | (0.0) | 0.1 | (0.0) | 0.1 | (0.0) | 0.4 | (0.1) | ||||||
| 15° | sand and shale (SS) | 0% | 2.1 | (0.1) | 1.7 | (0.2) | 2.5 | (0.3) | 2.6 | (0.3) | ||||
| 20% | 0.1 | (0.0) | 0.2 | (0.1) | 0.8 | (0.2) | 0.9 | (0.1) | ||||||
| 40% | 0.0 | (0.0) | 0.1 | (0.0) | 0.1 | (0.1) | 0.3 | (0.2) | ||||||
| 60% | 0.0 | (0.0) | 0.0 | (0.0) | 0.1 | (0.0) | 0.2 | (0.1) | ||||||
| 80% | 0.0 | (0.0) | 0.0 | (0.0) | 0.1 | (0.0) | 0.1 | (0.0) | ||||||
| 100% | 0.0 | (0.0) | 0.0 | (0.0) | 0.0 | (0.0) | 0.1 | (0.0) | ||||||
| pyroclastic sediment (PS) | 0% | 2.4 | (0.4) | 2.6 | (0.2) | 3.0 | (0.4) | 3.6 | (0.4) | |||||
| 20% | 1.7 | (0.3) | 2.4 | (0.4) | 2.6 | (0.5) | 3.4 | (0.4) | ||||||
| 40% | 1.0 | (0.2) | 2.4 | (0.4) | 2.6 | (0.3) | 2.0 | (0.1) | ||||||
| 60% | 0.3 | (0.1) | 0.3 | (0.0) | 0.6 | (0.2) | 0.8 | (0.1) | ||||||
| 80% | 0.2 | (0.1) | 0.3 | (0.3) | 0.3 | (0.1) | 0.3 | (0.2) | ||||||
| 100% | 0.1 | (0.0) | 0.3 | (0.1) | 0.2 | (0.1) | 0.2 | (0.1) | ||||||
| weathered granite (WG) | 0% | 1.8 | (0.3) | 2.4 | (0.2) | 3.2 | (0.6) | 2.8 | (0.3) | |||||
| 20% | 2.0 | (0.6) | 3.2 | (0.8) | 3.5 | (0.8) | 3.4 | (0.5) | ||||||
| 40% | 0.2 | (0.1) | 0.2 | (0.1) | 0.4 | (0.1) | 0.4 | (0.0) | ||||||
| 60% | 0.1 | (0.0) | 0.1 | (0.1) | 0.3 | (0.1) | 0.4 | (0.2) | ||||||
| 80% | 0.1 | (0.0) | 0.2 | (0.1) | 0.2 | (0.1) | 0.3 | (0.1) | ||||||
| 100% | 0.1 | (0.0) | 0.1 | (0.1) | 0.2 | (0.1) | 0.3 | (0.2) | ||||||
| weathered sedimentary rock (WS) | 0% | 2.4 | (0.0) | 1.4 | (0.0) | 2.5 | (0.0) | 3.1 | (0.2) | |||||
| 20% | 1.8 | (0.1) | 1.9 | (0.2) | 2.4 | (1.2) | 2.5 | (0.2) | ||||||
| 40% | 0.0 | (0.0) | 0.1 | (0.0) | 0.1 | (0.0) | 0.3 | (0.1) | ||||||
| 60% | 0.0 | (0.0) | 0.1 | (0.0) | 0.1 | (0.0) | 0.2 | (0.0) | ||||||
| 80% | 0.0 | (0.0) | 0.0 | (0.0) | 0.1 | (0.0) | 0.1 | (0.0) | ||||||
| 100% | 0.0 | (0.0) | 0.0 | (0.0) | 0.0 | (0.0) | 0.2 | (0.0) | ||||||
References
- Bracken, L.J.; Turnbull, L.; Wainwright, J.; Bogaart, P. Sediment connectivity: A framework for understanding sediment transfer at multiple scales. Earth Surf. Process. Landf. 2015, 40, 177–188. [Google Scholar] [CrossRef]
- Cavalli, M.; Trevisani, S.; Comiti, F.; Marchi, L. Geomorphometric assessment of spatial sediment connectivity in small Alpine catchments. Geomorphology 2013, 188, 31–41. [Google Scholar] [CrossRef]
- Persichillo, M.G.; Bordoni, M.; Cavalli, M.; Crema, S.; Meisina, C. The role of human activities on sediment connectivity of shallow landslides. Catena 2018, 160, 261–274. [Google Scholar] [CrossRef]
- Wohl, E.; Brierley, G.; Cadol, D.; Coulthard, T.J.; Covino, T.; Fryirs, K.A.; Grant, G.; Hilton, R.G.; Lane, S.N.; Magilligan, F.J.; et al. Connectivity as an emergent property of geomorphic systems. Earth Surf. Process. Landf. 2018. [Google Scholar] [CrossRef]
- Di Stefano, C.; Ferro, V. Modelling sediment delivery using connectivity components at the experimental SPA2 basin, Sicily (Italy). J. Mt. Sci. 2018, 15, 1868–1880. [Google Scholar] [CrossRef]
- Parsons, A.J.; Bracken, L.; Poeppl, R.E.; Wainwright, J.; Keesstra, S.D. Introduction to special issue on connectivity in water and sediment dynamics. Earth Surf. Process. Landf. 2015, 40, 1275–1277. [Google Scholar] [CrossRef] [Green Version]
- Sidle, R.C.; Gomi, T.; Loaiza Usuga, J.C.; Jarihani, B. Hydrogeomorphic processes and scaling issues in the continuum from soil pedons to catchments. Earth-Sci. Rev. 2017, 175, 75–96. [Google Scholar] [CrossRef]
- Gomi, T.; Sidle, R.C.; Swanston, D.N. Hydrogeomorphic linkages of sediment transport in headwater streams, Maybeso Experimental Forest, southeast Alaska. Hydrol. Process. 2004, 18, 667–683. [Google Scholar] [CrossRef]
- Hiraoka, M.; Gomi, T.; Oda, T.; Egusa, T.; Uchiyama, Y. Responses of bed load yields from a forested headwater catchment in the eastern Tanzawa Mountains, Japan. Hydrol. Res. Lett. 2015, 9, 41–46. [Google Scholar] [CrossRef]
- Sidle, R.C.; Ochiai, H. Landslides: Processes, Prediction, and Land Use; American Geophysical Union: Washington, DC, USA, 2006; ISBN 13 978-0-87590-322-4. [Google Scholar]
- Imaizumi, F.; Sidle, R.C. Linkage of sediment supply and transport processes in Miyagawa Dam catchment, Japan. J. Geophys. Res. Earth Surf. 2007, 112. [Google Scholar] [CrossRef] [Green Version]
- Schuster, R.L.; Costa, J.E. Perspective on landslide dams. In Proceedings of Landslide Dams: Processes, Risk, and Mitigation; Schuster, R.L., Ed.; ASCE: New York, NY, USA, 1986; pp. 1–20. [Google Scholar]
- Dade, B.W.; Huppert, H.E. Long-runout rockfalls. Geology 1998, 26, 803–806. [Google Scholar] [CrossRef]
- WMO (World Meteorological Organization). Management of Sediment-Related Risk. Available online: https://web.archive.org/web/20181101060723/http://www.floodmanagement.info/publications/tools/APFM_Tool_12.pdf (accessed on 1 November 2018).
- Benda, L.E.; Cundy, T.W. Predicting deposition of debris flows in mountain channels. Can. Geotech. J. 1990, 27, 409–417. [Google Scholar] [CrossRef]
- Zou, Z.; Xiong, C.; Tang, H.; Criss, R.E.; Su, A.; Liu, X. Prediction of landslide runout based on influencing factor analysis. Environ. Earth Sci. 2017, 76, 723. [Google Scholar] [CrossRef]
- Swanson, F.J.; Oyagi, N.; Tominaga, M. Landslide dams in Japan. In Proceedings of Landslide Dams: Processes, Risk, and Mitigation; Schuster, R.L., Ed.; ASCE: New York, NY, USA, 1986; pp. 131–145. [Google Scholar]
- Ishikawa, Y. Morphological and geological features of debris flows caused by earthquakes. Sabo Gakkaishi 1999, 51, 35–42. [Google Scholar] [CrossRef]
- McKenna, J.P.; Santi, P.M.; Amblard, X.; Negri, J. Effects of soil-engineering properties on the failure mode of shallow landslides. Landslides 2012, 9, 215–228. [Google Scholar] [CrossRef]
- Kharismalatri, H.S.; Ishikawa, Y.; Gomi, T.; Shiraki, K.; Wakahara, T. Collapsed material movement of deep-seated landslides caused by Typhoon Talas 2011 on the Kii Peninsula, Japan. Int. J. Eros. Control Eng. 2017, 10, 108–119. [Google Scholar] [CrossRef] [Green Version]
- Brayshaw, D.; Hassan, M.A. Debris flow initiation and sediment recharge in gullies. Geomorphology 2009, 109, 122–131. [Google Scholar] [CrossRef]
- Schumm, S.A.; Mosley, M.P.; Weaver, W. Experimental Fluvial Geomorphology; John Wiley & Sons: Hoboken, NJ, USA, 1987; ISBN 0-471-83077-1. [Google Scholar]
- Okura, Y.; Kitahara, H.; Kawanami, A.; Kurokawa, U. Topography and volume effects on travel distance of surface failure. Eng. Geol. 2003, 67, 243–254. [Google Scholar] [CrossRef]
- Moriwaki, H.; Inokuchi, T.; Hattanji, T.; Sassa, K.; Ochiai, H.; Wang, G. Failure processes in a full-scale landslide experiment using a rainfall simulator. Landslides 2004, 1, 277–288. [Google Scholar] [CrossRef]
- Stancanelli, M.L.; Musumeci, E.R. Geometrical characterization of sediment deposits at the confluence of mountain streams. Water 2018, 10, 401. [Google Scholar] [CrossRef]
- Best, J.L. Flow dynamics at river channel confluences: Implications for sediment transport and bed morphology. In Recent Developments in Fluvial Sedimentology; Ethridge, F.G., Flores, R.M., Harvey, M.D., Eds.; SEPM Society for Sedimentary Geology: Broken Arrow, OK, USA, 1987; pp. 27–35. [Google Scholar]
- Best, J.L. Sediment transport and bed morphology at river channel confluences. Sedimentology 1988, 35, 481–498. [Google Scholar] [CrossRef]
- Legros, F. The mobility of long-runout landslides. Eng. Geol. 2002, 63, 301–331. [Google Scholar] [CrossRef]
- Takahashi, T. Debris Flow: Mechanics, Prediction and Countermeasures; Taylor & Francis: London, UK, 2007; ISBN 978-0-415-43552-9. [Google Scholar]
- Yamamoto, S.; Ishikawa, Y.; Miyoshi, I.; Mizuhara, K. Soil characteristics and fluidity of debris flows at the Gamahara River, at the Harihara River and at the Hachimantai Area. J. Jpn. Soc. Eros. Control Eng. 1999, 51, 28–34. [Google Scholar]
- Iverson, R.M.; Logan, M.; LaHusen, R.G.; Berti, M. The perfect debris flow? Aggregated results from 28 large-scale experiments. J. Geophys. Res. Earth Surf. 2010, 115, F03005. [Google Scholar] [CrossRef]
- Borselli, L.; Cassi, P.; Torri, D. Prolegomena to sediment and flow connectivity in the landscape: A GIS and field numerical assessment. Catena 2008, 75, 268–277. [Google Scholar] [CrossRef]
- Van Tien, P.; Sassa, K.; Takara, K.; Fukuoka, H.; Dang, K.; Shibasaki, T.; Ha, N.D.; Setiawan, H.; Loi, D.H. Formation process of two massive dams following rainfall-induced deep-seated rapid landslide failures in the Kii Peninsula of Japan. Landslides 2018, 15, 1761–1778. [Google Scholar] [CrossRef]
- Davies, T.R.; Phillips, C.J.; Pearce, A.J.; Zhang, X.B. Debris flow behaviour–an integrated overview. In Erosion, Debris Flows and Environment in Mountain Regions; Walling, D.E., Davies, T.R., Hasholt, B., Eds.; IAHS Publ.: Oxfordshire, UK, 1992; Volume 209, pp. 217–225. [Google Scholar]
- Mitamura, M.; Tochimoto, Y.; Uto, H.; Tohda, J.; Murahashi, Y.; Okajima, S.; Yamashita, D. Geological and geomorphological features on groundwater situation of large scale landslides induced by Typhoon 1112 (Talas) in Nara Prefecture, Japan. In Proceedings of the International Symposium on Geoinformatics for Spatial Infrastructure Development in Earth and Allied Sciences (GIS-IDEAS) 2014, Danang City, Vietnam, 6–9 December 2014. [Google Scholar]
- Wang, F.; Wu, Y.-H.; Yang, H.; Tanida, Y.; Kamei, A. Preliminary investigation of the 20 August 2014 debris flows triggered by a severe rainstorm in Hiroshima City, Japan. Geoenviron. Dis. 2015, 2, 17. [Google Scholar] [CrossRef]
- Hao, X.; Ball, B.C.; Culley, J.L.B.; Carter, M.R.; Parkin, G.W. Chapter 57, Soil density and porosity. In Soil Sampling and Methods of Analysis, 2nd ed.; Carter, M.R., Gregorich, E.G., Eds.; CRC Press, Taylor & Francis: Boca Raton, FL, USA, 2008; ISBN 9780849335860. [Google Scholar]
- Lambe, T.W.; Whitman, R.V. Soil Mechanics; John Wiley & Sons: New York, NY, USA, 1969; ISBN 0 471 51192-7. [Google Scholar]
- Khoshkroudi, S.S.; Sefidkouhi, M.A.G.; Ahmadi, M.Z.; Ramezani, M. Prediction of soil saturated water content using evolutionary polynomial regression (EPR). Arch. Agron. Soil Sci. 2014, 60, 1155–1172. [Google Scholar] [CrossRef]
- ASTM (American Society for Testing and Materials) C136-01. Standard Test Method for Sieve Analysis of Fine and Coarse Aggregates; ASTM International: West Conshohocken, PA, USA, 2001. [Google Scholar]
- Cetin, H.; Fener, M.; Gunaydin, O. Geotechnical properties of tire-cohesive clayey soil mixtures as a fill material. Eng. Geol. 2006, 88, 110–120. [Google Scholar] [CrossRef]
- ASTM (American Society for Testing and Materials) D2487-06. Standard Practice for Classification of Soils for Engineering Purposes (Unified Soil Classification System); ASTM International: West Conshohocken, PA, USA, 2008. [Google Scholar]
- Chandrasekaran, S.S.; Sayed Owaise, R.; Ashwin, S.; Jain, R.M.; Prasanth, S.; Venugopalan, R.B. Investigation on infrastructural damages by rainfall-induced landslides during November 2009 in Nilgiris, India. Nat. Hazards 2013, 65, 1535–1557. [Google Scholar] [CrossRef]
- Ellen, S.D.; Fleming, R.W. Mobilization of debris flows from soil slips, San Francisco Bayregion, California. In Debris Flows/Avalanches; Costa, J.E., Wieczorek, G.F., Eds.; Geological Society of America: Boulder, CO, USA, 1987; pp. 31–40. [Google Scholar]
- ASTM (American Society for Testing and Materials) D4318-05. Standard Test Methods for Liquid Limit, Plastic Limit, and Plasticity Index of Soils; ASTM International: West Conshohocken, PA, USA, 2010. [Google Scholar]
- Phani Kumar, B.R.; Sharma Radhey, S. Effect of fly ash on engineering properties of expansive soils. J. Geotech. Geoenviron. Eng. 2004, 130, 764–767. [Google Scholar] [CrossRef]
- Hungr, O.; Evans, S.G.; Hutchinson, I. A review of the classification of landslides of the flow type. Environ. Eng. Geosci. 2001, 7, 221–238. [Google Scholar] [CrossRef]
- Yamada, T.; Minami, N.; Kikuchi, H.; Miura, I. Multiple discriminant analysis on the topographical factors of the deep-seated slope failure-induced debris flow occurrence. Sabo Gakkaishi 2000, 53, 23–29. [Google Scholar] [CrossRef]
- Chubu Regional Construction Bureau, River Section. Collection of Natural Dam Cases Investigation; Chubu Regional Construction Bureau: Nagoya, Japan, 1987. [Google Scholar]
- Hayashi, J.N.; Self, S. A comparison of pyroclastic flow and debris avalanche mobility. J. Geophys. Res. Solid Earth 1992, 97, 9063–9071. [Google Scholar] [CrossRef]
- Chigira, M. Geological and geomorphological characteristics of deep-seated landslides induced by rain and earthquakes. J. Chin. Soil Water Conserv. 2011, 42, 265–278. [Google Scholar]
- Nash, T.R. Engineering Geological Assessment of Selected Landslide Dams Formed from the 1929 Murchison and 1968 Inangahua Earthquakes. Master’s Thesis, University of Canterbury, Christchurch, New Zealand, 2003. [Google Scholar]
- Iverson, R.M.; Reid, M.E.; Iverson, N.R.; LaHusen, R.G.; Logan, M.; Mann, J.E.; Brien, D.L. Acute sensitivity of landslide rates to initial soil porosity. Science 2000, 290, 513. [Google Scholar] [CrossRef] [PubMed]
- Wang, G.; Sassa, K. Pore-pressure generation and movement of rainfall-induced landslides: Effects of grain size and fine-particle content. Eng. Geol. 2003, 69, 109–125. [Google Scholar] [CrossRef]
- Iverson, R.M.; George, D.L.; Allstadt, K.; Reid, M.E.; Collins, B.D.; Vallance, J.W.; Schilling, S.P.; Godt, J.W.; Cannon, C.M.; Magirl, C.S.; et al. Landslide mobility and hazards: Implications of the 2014 Oso disaster. Earth Planet. Sci. Lett. 2015, 412, 197–208. [Google Scholar] [CrossRef]
- Iverson, R.M. The physics of debris flows. Rev. Geophys. 1997, 35, 245–296. [Google Scholar] [CrossRef] [Green Version]
- Sidle, R.C.; Gomi, T.; Akasaka, M.; Koyanagi, K. Ecosystem changes following the 2016 Kumamoto earthquakes in Japan: Future perspectives. Ambio 2018, 47, 721–734. [Google Scholar] [CrossRef]
- Ministry of Environment, Nature Conservation Bureau. Ecosystem-Based Disaster Risk Reduction in Japan. Available online: https://swap.stanford.edu/20170516043751/http://www.env.go.jp/nature/biodic/eco-drr/pamph04. pdf (accessed on 16 May 2017).
- Takeuchi, K.; Nakayama, N.; Teshima, H.; Takemoto, K.; Turner, N. Ecosystem-based approaches toward a resilient society in harmony with nature. In Ecosystem-Based Disaster Risk Reduction and Adaptation in Practice; Renaud, F.G., Sudmeier-Rieux, K., Estrella, M., Nehren, U., Eds.; Springer International Publishing: Cham, Switzerland, 2016; pp. 315–333. ISBN 978-3-319-43633-3. [Google Scholar]
Figure 1.
Experimental flume characteristics. (a) flume diagram; (b) flume apparatus; (c) flume sections for inflow angle 0°; (d) flume sections for inflow angle 30°, 60°, and 90°.
Figure 1.
Experimental flume characteristics. (a) flume diagram; (b) flume apparatus; (c) flume sections for inflow angle 0°; (d) flume sections for inflow angle 30°, 60°, and 90°.

Figure 2.
Weight-based water content for the experiment. Below saturation, sediment in the flume is assumed to be sediment and water on hillslope. Above saturation, sediment in the flume is assumed to be sediment and water on hillslope with additional water from the channel.
Figure 2.
Weight-based water content for the experiment. Below saturation, sediment in the flume is assumed to be sediment and water on hillslope. Above saturation, sediment in the flume is assumed to be sediment and water on hillslope with additional water from the channel.

Figure 3.
Sediment deposition in response to inflow angle modification for the 10° channel gradient, using sand and shale sediment.
Figure 3.
Sediment deposition in response to inflow angle modification for the 10° channel gradient, using sand and shale sediment.

Figure 4.
Sediment deposition in response to channel gradient modification for the 90° inflow angle, using sand and shale sediment. The arrow represents saturated water content of sand and shale (20.3%).
Figure 4.
Sediment deposition in response to channel gradient modification for the 90° inflow angle, using sand and shale sediment. The arrow represents saturated water content of sand and shale (20.3%).

Figure 5.
Sediment deposition at the junction (section B) for four sediment types. The arrows represent the different saturated water contents of sediments. (a) sediment deposition for the 10° channel gradient; (b) sediment deposition for the 15° channel gradient.
Figure 5.
Sediment deposition at the junction (section B) for four sediment types. The arrows represent the different saturated water contents of sediments. (a) sediment deposition for the 10° channel gradient; (b) sediment deposition for the 15° channel gradient.

Figure 6.
Sediment deposition at the outlet (section E) for four sediment types. The arrows represent the different saturated water contents of sediments. (a) Sediment deposition for the 10° channel gradient; (b) sediment deposition for the 15° channel gradient.
Figure 6.
Sediment deposition at the outlet (section E) for four sediment types. The arrows represent the different saturated water contents of sediments. (a) Sediment deposition for the 10° channel gradient; (b) sediment deposition for the 15° channel gradient.

Figure 7.
Sediment Connectivity Index (SCI) for the classification of landslide dams and debris flows. The arrows represent the different saturated water contents of sediments. (a) Sediment deposition for the 10° channel gradient; (b) sediment deposition for the 15° channel gradient.
Figure 7.
Sediment Connectivity Index (SCI) for the classification of landslide dams and debris flows. The arrows represent the different saturated water contents of sediments. (a) Sediment deposition for the 10° channel gradient; (b) sediment deposition for the 15° channel gradient.

Table 1.
Summary of sediment properties for the four sediment types. Values in parentheses indicate standard deviations.
Table 1.
Summary of sediment properties for the four sediment types. Values in parentheses indicate standard deviations.
| Sediment Properties | Sand and Shale (SS) | Pyroclastic Sediment (PS) | Weathered Granite (WG) | Weathered Sedimentary Rock (WS) | ||||
|---|---|---|---|---|---|---|---|---|
| density (g/cm3) | 1.7 | (0.0) | 1.2 | (0.2) | 1.4 | (0.1) | 1.1 | (0.1) |
| void ratio | 0.5 | (0.0) | 1.2 | (0.3) | 1.0 | (0.1) | 1.5 | (0.1) |
| porosity (%) | 35.0 | (0.3) | 53.6 | (6.1) | 49.0 | (2.1) | 59.6 | (2.4) |
| saturated water content (%) | 20.3 | (3.1) | 44.5 | (11.0) | 36.3 | (3.2) | 55.7 | (5.6) |
| liquid limit (%) | 19.5 | (0.1) | 29.6 | (0.2) | 25.8 | (2.2) | 29.1 | (0.1) |
| Approximate Mobility Index (AMI) | 1.0 | (0.0) | 1.5 | (0.4) | 1.4 | (0.1) | 1.9 | (0.2) |
| D90 (mm) | 32.8 | (0.9) | 0.5 | (0.1) | 4.2 | (0.7) | 13.5 | (0.9) |
| D50 (mm) | 7.5 | (1.1) | 0.2 | (0.0) | 1.3 | (0.3) | 2.2 | (0.5) |
| D10 (mm) | 0.3 | (0.0) | 0.1 | (0.0) | 0.3 | (0.0) | 0.2 | (0.1) |
| gravel (>4.75 mm, %) | 59.9 | (2.9) | 0.1 | (0.2) | 5.5 | (4.3) | 30.7 | (1.9) |
| sand (4.75–0.075 mm, %) | 38.7 | (3.7) | 96.9 | (0.3) | 94.0 | (4.8) | 66.5 | (3.2) |
| fine particles (<0.075 mm, %) | 1.4 | (1.1) | 2.9 | (0.5) | 0.5 | (0.5) | 2.7 | (1.3) |
| Coefficient of Curvature (Cc) | 2.3 | (0.6) | 0.97 | (0.0) | 1.2 | (0.3) | 1.3 | (0.1) |
| Coefficient of Uniformity (Cu) | 42.2 | (8.6) | 2.2 | (0.3) | 6.1 | (0.3) | 18.3 | (9.3) |
© 2018 by the authors. Licensee MDPI, Basel, Switzerland. This article is an open access article distributed under the terms and conditions of the Creative Commons Attribution (CC BY) license (http://creativecommons.org/licenses/by/4.0/).
Share and Cite
MDPI and ACS Style
Kharismalatri, H.S.; Ishikawa, Y.; Gomi, T.; Sidle, R.C.; Shiraki, K. Evaluating Factors for Controlling Sediment Connectivity of Landslide Materials: A Flume Experiment. Water 2019, 11, 17. https://doi.org/10.3390/w11010017
AMA Style
Kharismalatri HS, Ishikawa Y, Gomi T, Sidle RC, Shiraki K. Evaluating Factors for Controlling Sediment Connectivity of Landslide Materials: A Flume Experiment. Water. 2019; 11(1):17. https://doi.org/10.3390/w11010017
Chicago/Turabian StyleKharismalatri, Hefryan Sukma, Yoshiharu Ishikawa, Takashi Gomi, Roy C. Sidle, and Katsushige Shiraki. 2019. "Evaluating Factors for Controlling Sediment Connectivity of Landslide Materials: A Flume Experiment" Water 11, no. 1: 17. https://doi.org/10.3390/w11010017
Note that from the first issue of 2016, this journal uses article numbers instead of page numbers. See further details here.