
Multitemporal Scenic Evaluation of Urban Coastal Sites: A Peruvian Case Study


1
Coastal Ecosystems of Peru Research Group, Universidad Científica del Sur, Lima 15842, Peru
2
Grupo de Investigación en Sistemas Costeros, Playas Corporation Ltda, Santa Marta 050022, Colombia
*
Author to whom correspondence should be addressed.
Water 2022, 14(15), 2336; https://doi.org/10.3390/w14152336
Submission received: 8 June 2022
/
Revised: 17 July 2022
/
Accepted: 24 July 2022
/
Published: 28 July 2022
(This article belongs to the Topic From Coastal Engineering to Integrated Coastal Zone Management)
Abstract
:Along the coast of Peru, intensive urbanization and tourism development were related to coastal scenery deterioration. This investigation carried out a scenery evaluation of 20 urban beaches from the “Circuito de Playas de la Costa Verde” (CPCV), a key beach corridor in Lima (Peru). For this purpose, the Coastal Scenic Evaluation System (CSES) was applied in three different seasons, using fuzzy logic to reduce observer subjectivity and estimate the Evaluation index (D). A total of 26 parameters were evaluated to estimate the D value during summer 2020, winter 2020, and summer 2021, to determine the temporal variability of the landscape of an urban coastal sector, such as the CPCV. The results show that all evaluated beaches are classified as very unattractive sites (Class V). Additionally, no significant differences were found between seasons but between beaches. Litter and disturbance factors (noise) were the main human parameters that had low and variable scores during assessments and influenced the D index value estimate. This scenery assessment proposes further implementations of new beach management strategies and actions focusing on landscaping and conserving coastal ecosystems. Strengthening monitoring to reduce noise and litter disturbance and promoting environmentally friendly coastal usage are vital aspects that must be implemented.
1. Introduction
Cities worldwide are increasingly urbanized and coastal [1], which means a higher number of citizens residing and working within coastal ecosystems, such as beaches, wetlands, dunes, and others. According to its anthropogenic dimension, beaches can be classified as remote, rural, village, urban, or resort. Remote beaches are defined by difficulty of access, and a very limited or no public transport service. Rural beaches can be found outside the urban/village environment and have virtually no facilities. Village beaches are found outside the main urban environment and have a small, permanent population. Resort beaches are located adjacent to an accommodation complex [2]. Urban beaches are mainly freely open to the public and are located near urban areas, which are characterized for having well-established public services adjacent to central business districts and commercial activities such as fishing [3].
The deterioration of coastal scenery can be associated with intensive urbanization that produces water and soil pollution, along with the loss of tourism potential, affecting the ecosystem equilibrium, local coastal communities, and national economies [4]. Various methodologies have been applied to assess “landscape” through the years, considering the character assessment factors as natural, cultural, and aesthetic. Landscape character assessment [5] and landscape assessment and decision-making process (LANDMAP) have been used to assess landscape resources to facilitate decision-making and natural resource planification [6]. LANDMAP methodology reunites five spatially related datasets with information about the characteristics that influence the geology, habitats, and cultural and historic landscape, along with visual and sensory, which is managed through a geographical information system. Hence, the characteristics of an area can be mapped by its landscape qualities and characteristics, and survey records document those qualities and characteristics in addition to management recommendations and criteria-based evaluations [5].
A coastal scenery evaluation system (CSES), developed by Ergin et al. [7], comprises an assessment (about priorities and preferences) of physical and human parameters which were addressed adequately by adapting fuzzy-logic mathematics to provide an evidence-based approach for coastal management decisions [8].The result of this evaluation provides a numerical ‘decision parameter’ referred to as the “D value” which values are bracketed to classify the attractiveness of coastal sites in a five-scale attribute rating system. The scale is detailed as follows: Class I (D ≥ 0.85) for coastal sites are extremely attractive sites with very high landscape value, to Class V (D < 0.00) for urban poor sites with low landscape value and intensive development.
Around the world, many CSES assessments have been performed on several urban beaches around the world (Table 1) to classify the attractiveness of beaches and to identify beaches in need of improvement [9]. Additionally, more than a thousand beaches worldwide have been assessed with the CSES, while the most investigated areas are in Latin American coastal countries such as Colombia, Brazil, Cuba, and Chile, followed by European coastal sites [6]. The attractiveness of a beach is important due to the perception of visitors since the scenery factor is one of the most important reasons to choose a specific beach [10]. Furthermore, CSES has been applied to enhance the reasonable use of coastal resources to benefit tourists and protect the environment from human pressures [6].
In South America, urban touristic beaches are localized in cities such as Mar del Plata (Argentina); this beach is positioned as the leading destination for sun, sea, and sand tourism (3S) in the country [20]. Montevideo, (e.g., Pocitos Beach, Uruguay) and Balneário Camboriú (Brasil) beaches are recognized for being surrounded by high-rise buildings and boulevards, while tourism is the most important economic activity related to the beaches [21]. In Peru, “The Circuito de Playas de la Costa Verde” (CPCV) is one of the most touristic and entertaining coastal beach corridors of Lima [22], receiving thousands of visitors every day during summer [23]. The CPCV is surrounded by sports complexes, restaurants, parks, and infrastructure for pedestrian and vehicular traffic [24], typical of urban beaches. The CSES assessment in this research aimed to highlight those parameters in need of improvement for better scenic quality, since the scenery is an essential component of tourism and drives the economy of many coastal areas [6,17].
The objective of this investigation was to determine the temporal variability of the landscape of the CPCV, an important beach corridor, which to date does not have evaluations of this type. In this corridor, CSES was applied to calculate the coastal scenic evaluation index (D) of twenty beaches during the summer (2020), winter (2020), and summer (2021 COVID-19) seasons. These results provide complementary information on the current situation of the evaluated beaches, facilitating the identification of those beaches with deficits in specific human parameters which can effectively be improved throughout the enhancement of coastal management. This information will be helpful for the authorities in charge interested in improving the scenic quality of the beaches and at the same time promoting this urban coastal site conservation and protection against human coastal resources pressures.
2. Materials and Methods
2.1. Study Area
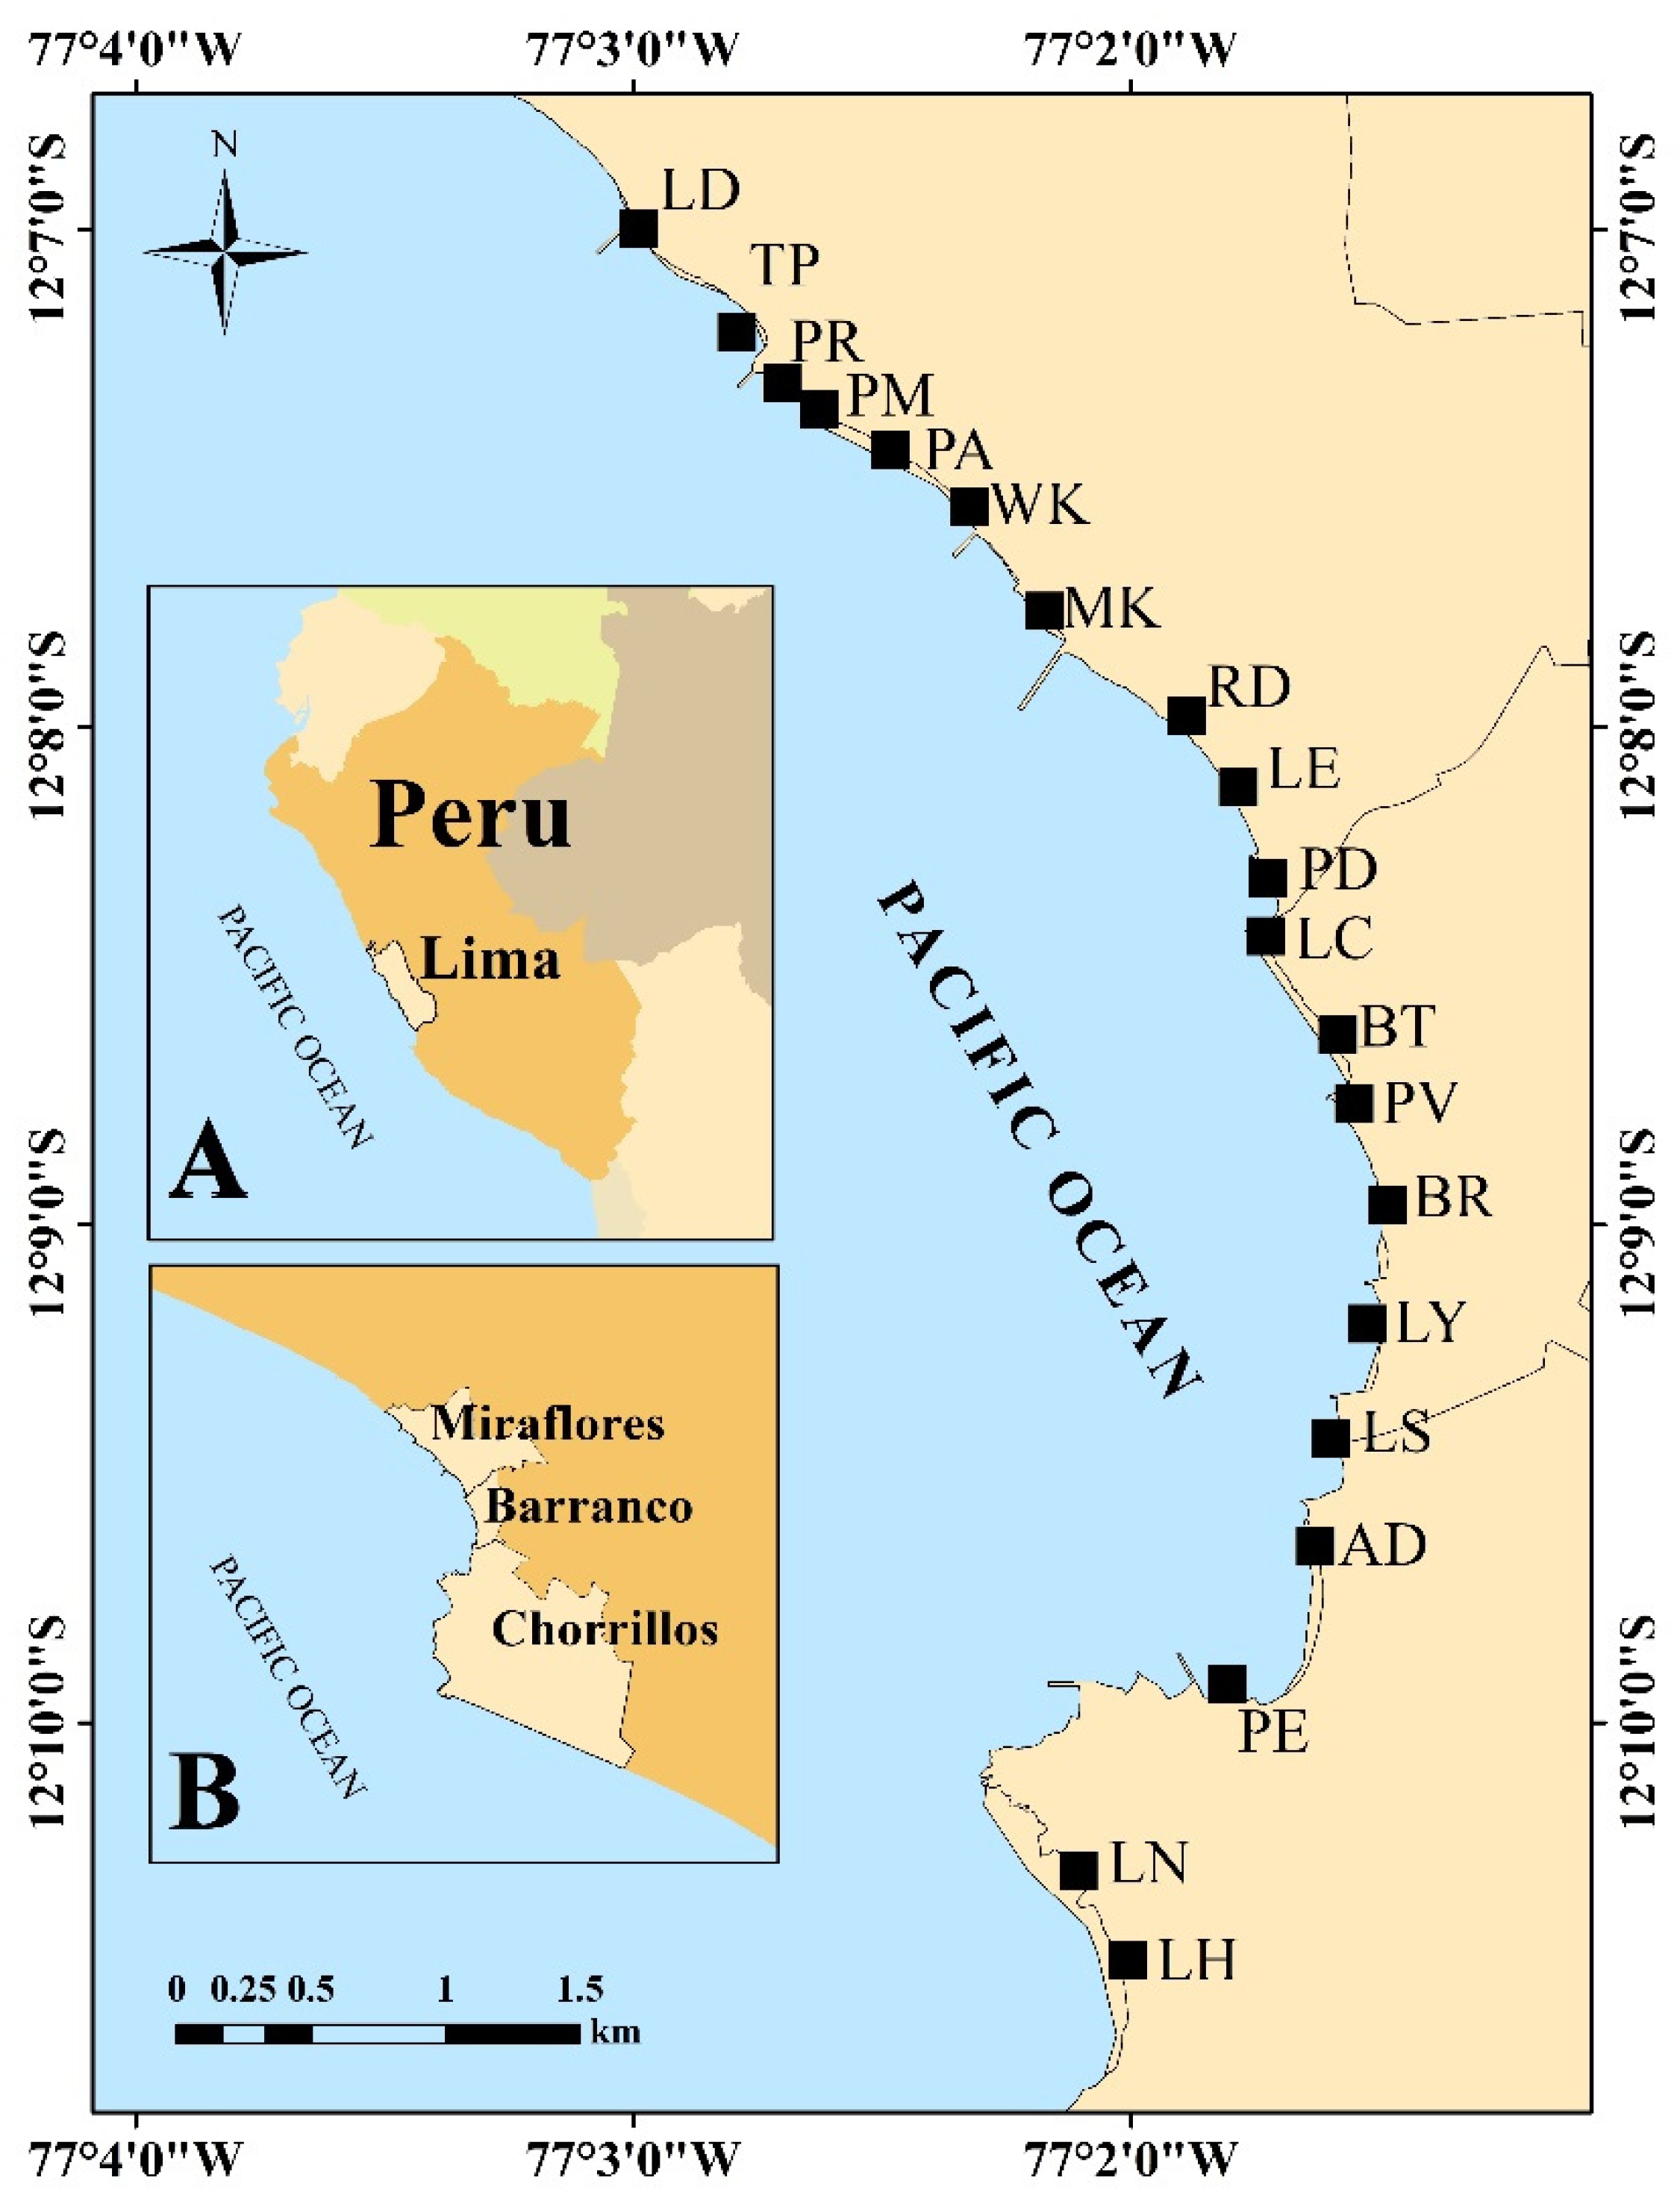
The CPCV is a coastal strip of approximately 33 km, connecting five districts of the city of Lima (Peru), with sandy, gravel, and pebble beaches along with rock groynes perpendicular to the coastline [25], that constitutes a touristic, recreational, and cultural area [26], where citizens and foreign tourists practice different sports such as cycling and surfing [27]. It was built in the 1970s to set up a fast vehicle traffic route linking isolated beaches, next to access roads to the beaches for the population recreation and tourism simultaneously [28,29]. This investigation was performed in twenty beaches located in the districts of Miraflores, Barranco, and Chorrillos, along the CPCV (Figure 1). The beaches along this corridor have certain differences between each other, Miraflores beaches have a minor number of visitors than Chorrillos beaches, and the predominant visitors are surfers followed by bathers. Beaches in Barranco are next to boulevards and restaurants, and are also directly connected to highly touristic sites in Lima. The southern beaches in Chorrillos district have a wider beach face width compared to beaches in the other two districts, and a broader visitors affluence, most of them bathers. These beaches provide important ecosystem services for the community, such as provisioning, regulating and cultural. Furthermore, the CPCV beaches are highly visited in Lima, overall, during summer seasons [30].
2.2. Data Collection
Three sampling campaigns were performed in three different periods. The first sampling was performed in February 2020 (summer season), before the beginning of the national state of emergency due to the SARS-CoV-2 virus pandemic (access to the beaches was permitted to all public). The second sampling was performed in September 2020 (winter season), during the SARS-CoV-2 virus pandemic; there was no access restriction to the beaches during this period. The last sampling was performed in February 2021 (summer season); this period was characterized by restricted access to the beaches due to health restrictions decreed by the government. Each beach was evaluated on three consecutive days following the north to the south route during bathing hours, between 9:00 a.m. and 2:00 p.m. Then, nine evaluations were performed for each place. Geographic coordinates were recorded in each sampled point with a GPS receiver Garmin eTrex® 20 (Southampton, UK).
Scenery assessment was performed through CSES [7], using fuzzy logic to reduce the observers’ subjectivity during each parameter evaluation [9,31]. The total number of parameters was 26, i.e., 18 physical (cliff height, cliff slope, cliff features, beach face type, beach face width, beach face color, rocky shore slope, rocky shore extent, rocky shore roughness, dunes, valley, skyline landform, tides, coastal landscape features, vistas, water color and clarity, natural vegetation cover, vegetation debris) and 8 human parameters (noise disturbance, litter, sewage discharge evidence, non-built environment, built environment, access type, skyline, utilities) considered essential to categorize a coastal scenery. Each parameter was scored in a ranking of 1 (absent or low quality) to 5 (excellent quality) following the scale detailed in Ergin et al. [7] (Table 2). The final D index is influenced by the 1 to 5 attribute rating since high scores such as 4 and 5 are related to characteristics and conditions of the 26 parameters preferred for beachgoers.
2.3. Data Analysis
The coastal scenic evaluation index (D) was estimated as an attractiveness indicator of the evaluated site [7]. According to D, the coastal site scenic value could be categorized into five distinct classes: Class I (D ≥ 0.85) for extremely attractive sites, Class II (0.65 ≤ D < 0.85), Class III (0.40 ≤ D < 0.65), Class IV (0 ≤ D < 0.40) and Class V (D < 0) for very unattractive urban areas.
A comparison between D values was performed (i) for each beach without considering the period, (ii) between periods without considering the beaches due to the normality and homoscedasticity test results (Shapiro–Wilk and Levene tests, p < 0.05; Supplementary Material), the non-parametric test of Kruskal–Wallis was performed following a Mann–Whitney pairwise post hoc test to find the significant differences. Analysis and figures were performed with PAST V 4.05 (MNH, University of Oslo, Oslo, Norway) [32] and ArcGIS 10.5 software (Redlands, CA, USA) [33].
3. Results
3.1. Beach Descriptions
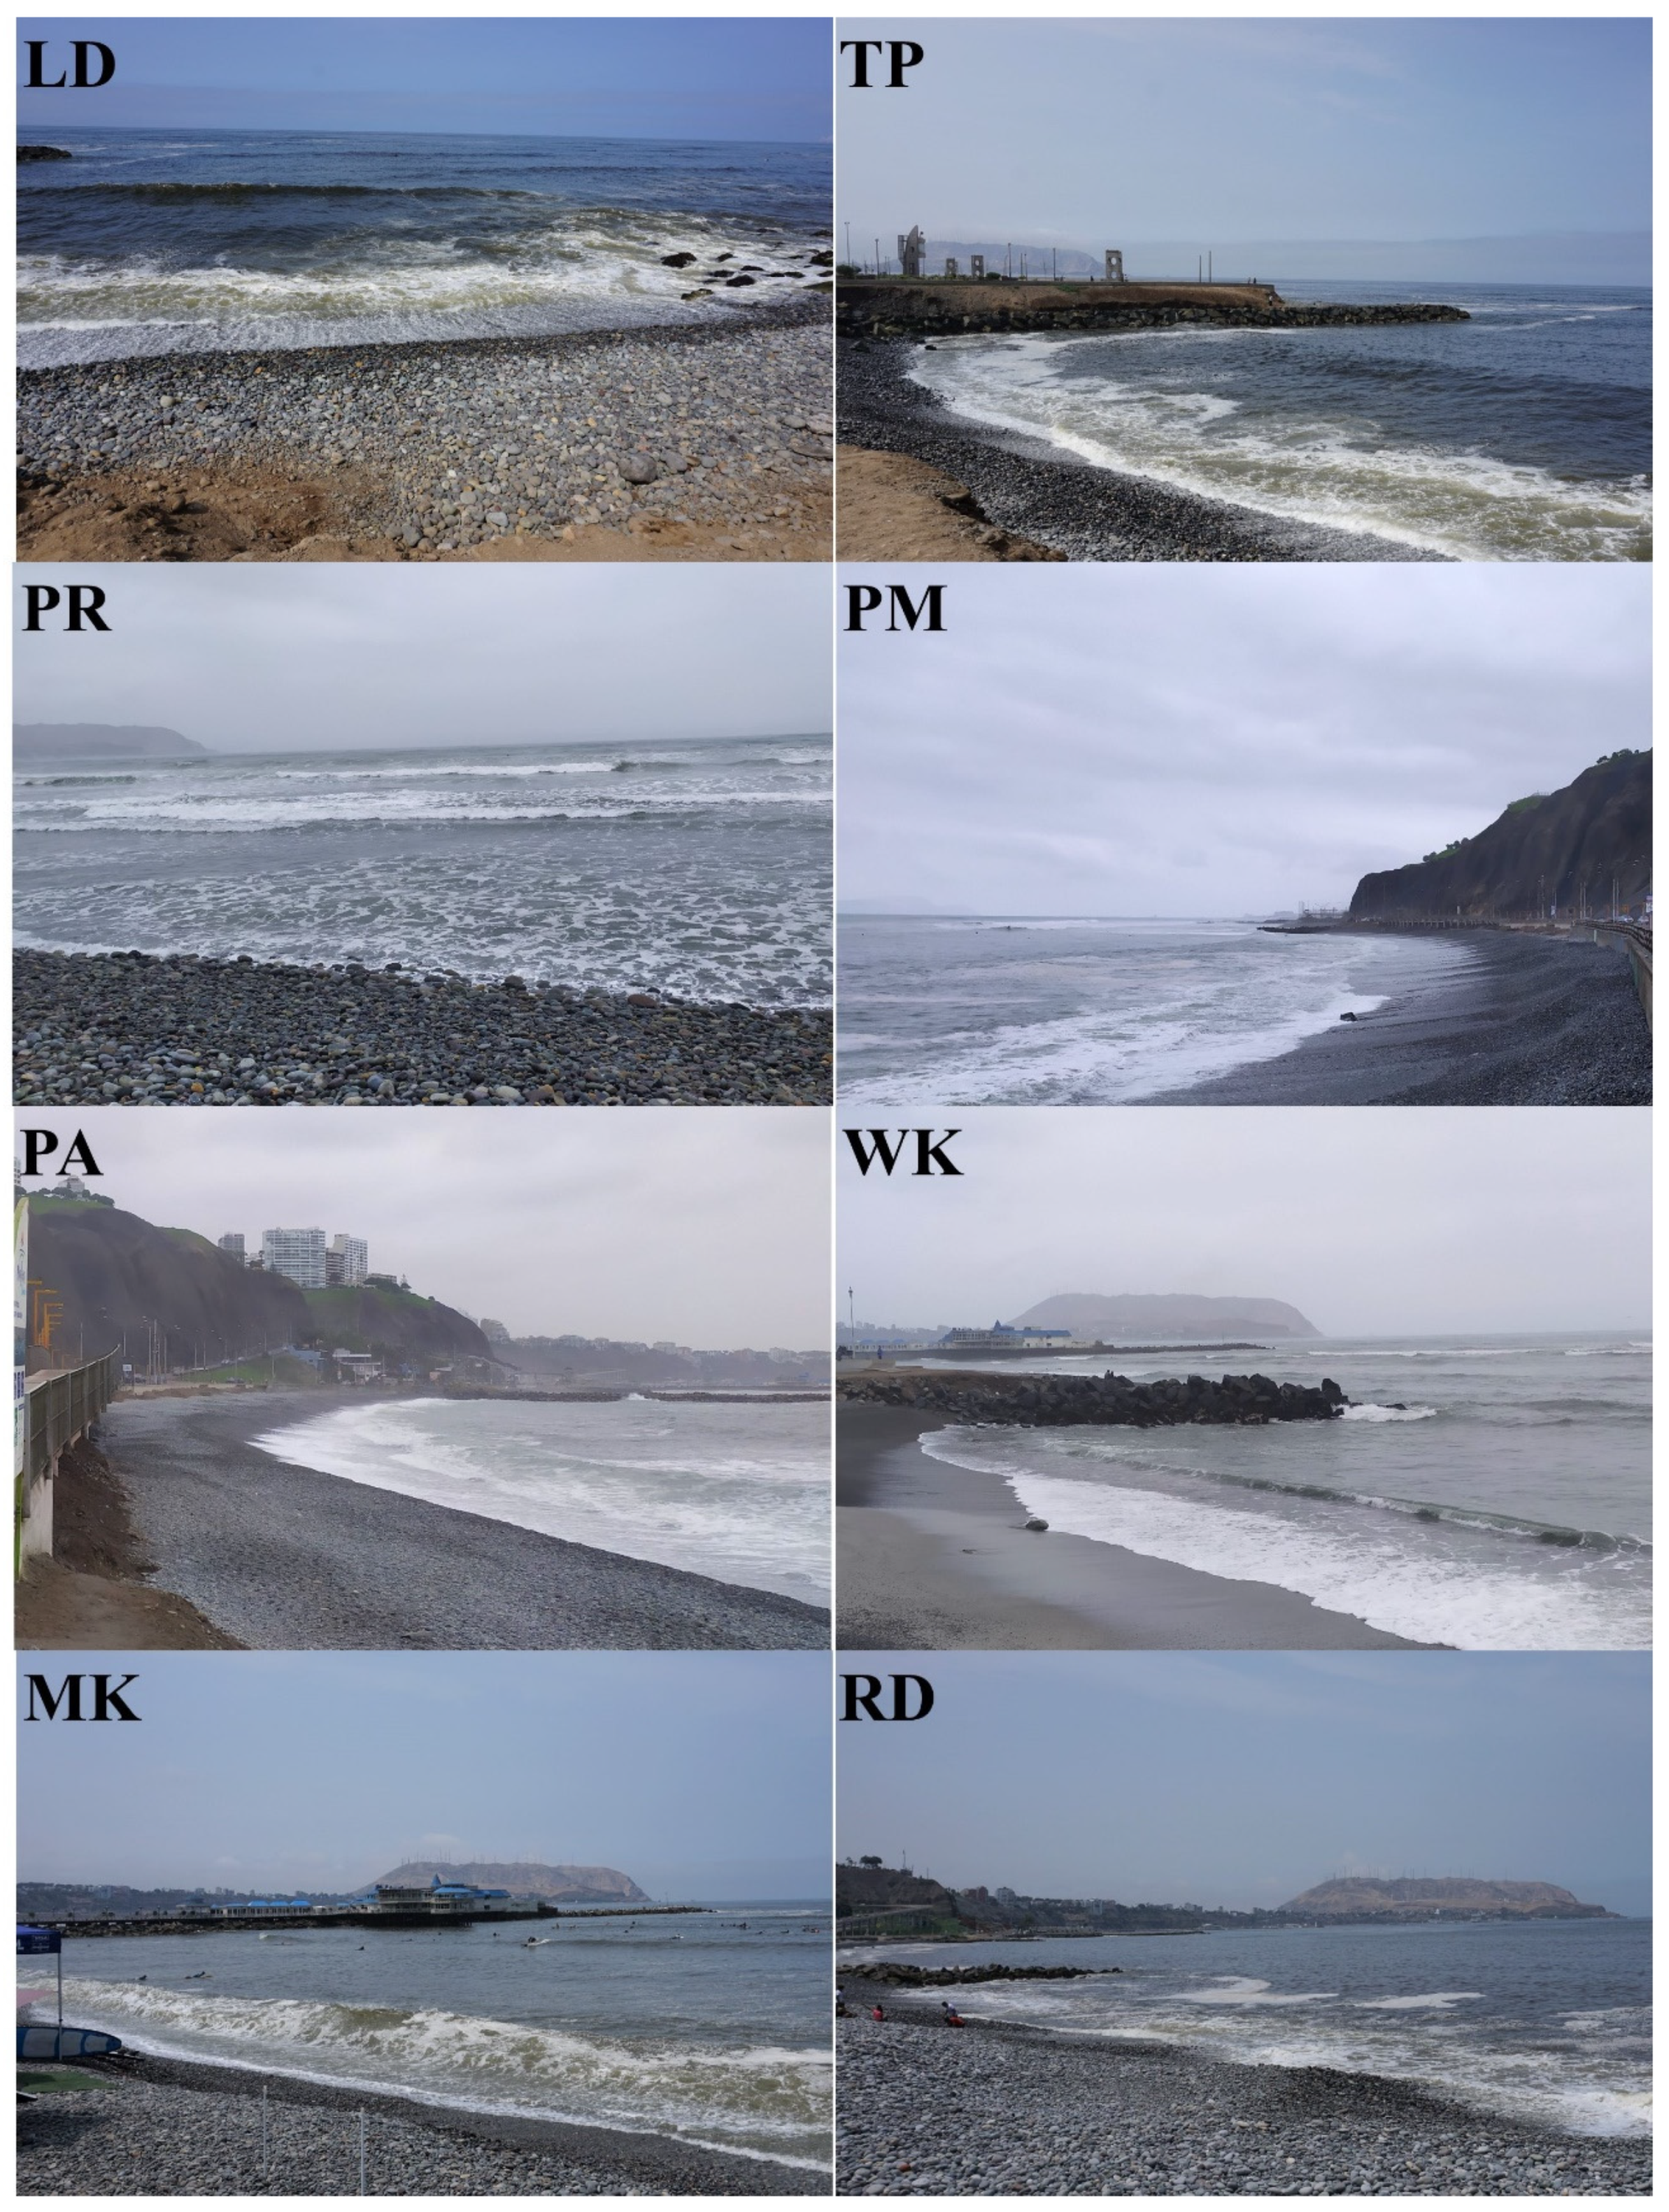
The CPCV beaches assessed in this investigation are localized in the Miraflores, Barranco, and Chorrillos districts inside Lima province. In the Miraflores district, gravel beaches such as Los Delfines and Tres Picos are normally less crowded than other beaches. In consequence, parameters such as litter and noise disturbance had higher scores on those beaches. Punta Roquitas beach is recognized for its strong surf break-off, alongside a pedestrian bridge, while Pampilla 2, Pampilla, and Waikiki beaches are also linked to surfing and other sports such as running or cycling activities. Makaha is a particular beach for beginner surfers surrounded by various surf schools and a touristic restaurant built in the middle of the groynes (Figure 2). Redondo and La Estrella are wider beaches with a bigger area separating each other and can also be used for many sports, such as running and cycling. On these beaches, litter and noise disturbance parameters were not evident, unlike on other beaches. One of the most important factors for litter management is the frequency of cleaning operations, this was most noticeable when evaluating beaches inside the Miraflores district, compared to other beaches in Barranco and Chorrillos districts. Additionally, cleaning operations were less observed during winter season evaluations.
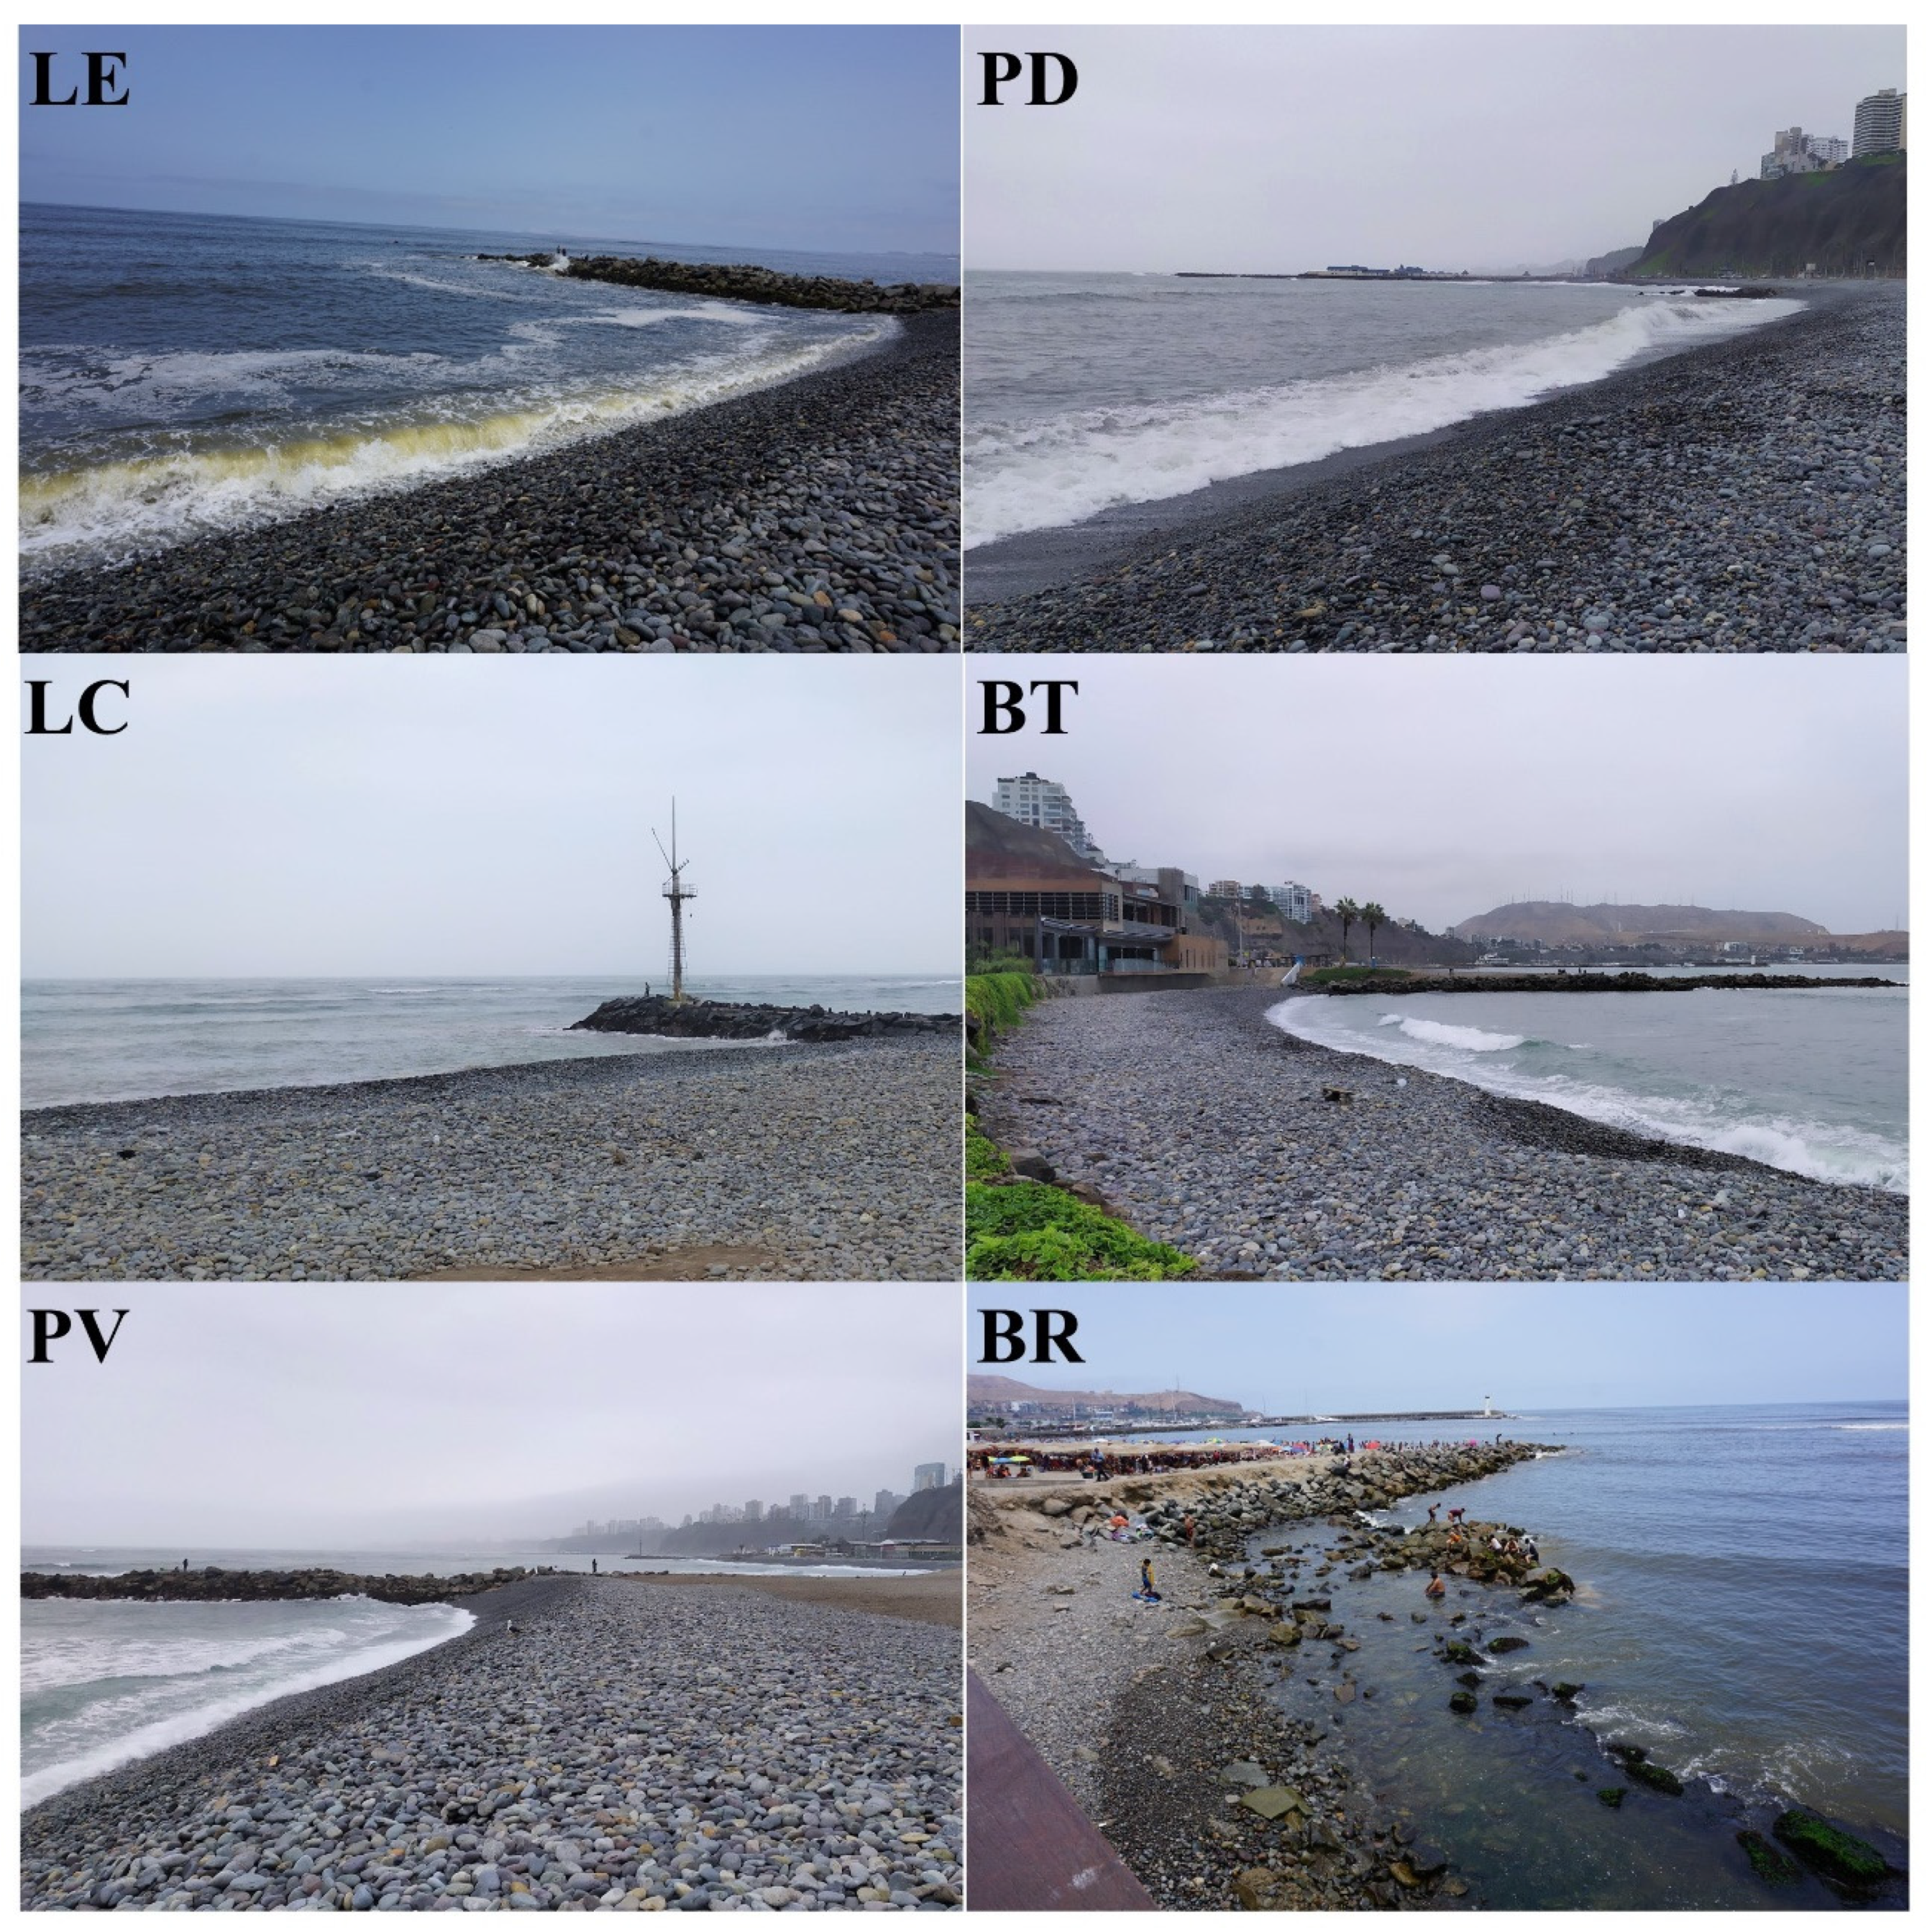
The first beach from north to south in Barranco district is Las Cascadas, where the access is not as recognizable as in the rest of the beaches (because it is next to the Aquatic Rescue Unit of the National Police of Peru), and the presence of people was low in all season’s campaigns, while litter and noise parameters had high scores. Barranquito beach is localized in the middle of a boulevard (Figure 3). Los Pavos and Barranco beaches are surrounded by clubs, restaurants, and a pedestrian bridge that gives direct access from touristic sites in Barranco district. It was also notable the presence of litter and an increase in noise disturbance in some beaches.
Chorrillos district is characterized for its wide sandy beaches; Los Yuyos, Las Sombrillas and Agua Dulce (Figure 4), which are calm water beaches close to various snack spots and large parking lots. Los Pescadores beach is next to a fishing terminal, local seafood markets, and restaurants. La Caplina is one of the least visited beaches due to its distance from the main access routes of the CPCV. La Herradura Broadwalk is surrounded of traditional food restaurants, benches, and a bikeway. Disturbance factor and litter parameter low scores in some of these beaches had negatively affected the scenic value, overall, during the winter season, when litter presence was higher.
3.2. D Value Estimate
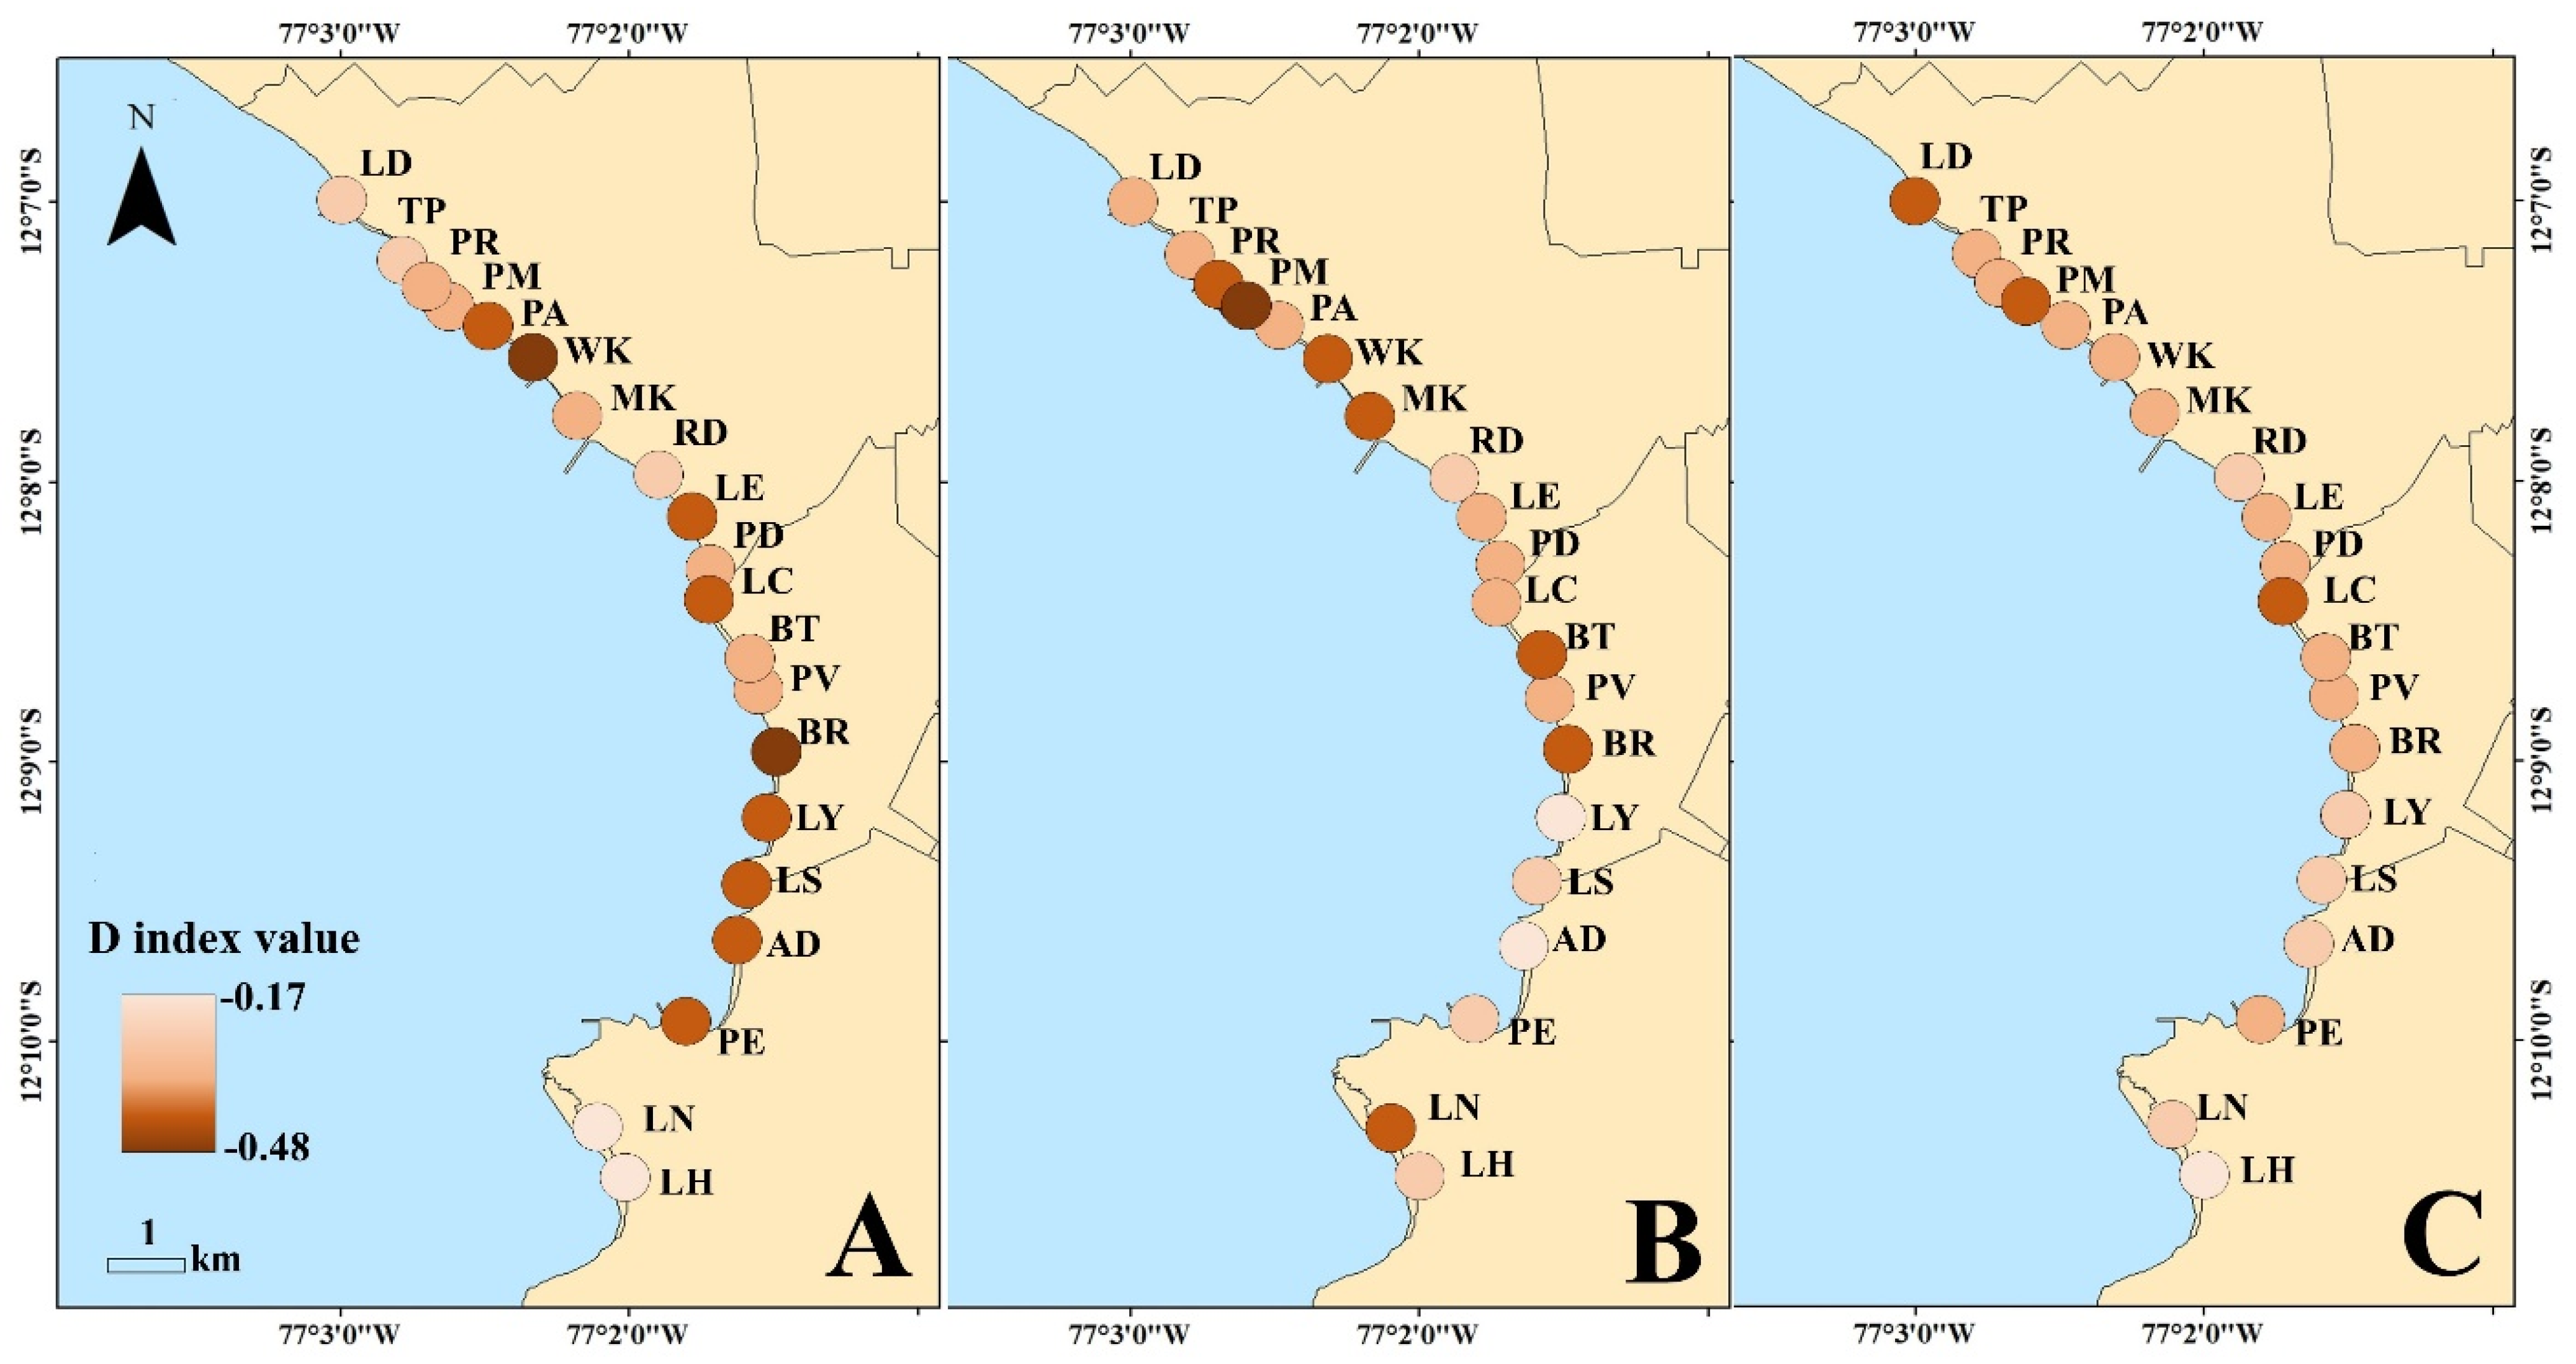
All sampled beaches were classified as “Class V” (D < 0): very unattractive urban areas, with a low scenery value and a D lower than zero. The results described in Table 3 are representing the “D” value that was used for the classification of beaches. The 2020 summer season 3-day average value was −0.46 to −0.17, the winter season 3-day average value ranged from −0.48 to −0.21, while the D 3-day average value for the summer season (2021) was −0.39 to −0.21 (Table 3). Significant differences between seasons were not found (H = 5.71; p = 0.06), while significant differences between beaches were found (H = 62.23; p = 0.00) (more detailed information is presented in Supplementary Material). The highest D index value was estimated in La Caplina beach (summer 2020); the lowest value was obtained in La Pampilla 2 beach (winter 2020, Table 3). Additionally, the highest mean (three seasons average) D index value was estimated in La Herradura and the lowest in Waikiki.
In some instances, D values increased in summer 2021, (e.g., La Pampilla, Waikiki, Barranquito, Barranco); in other cases, (e.g., Los Delfines, Redondo, Las Cascadas), this value had a decreasing trend. La Herradura and La Caplina beaches were examples where the D value was one of the highest in summer 2020; then, in winter 2020, the D value decreased; finally, in summer 2021, the D value increased again (Table 3, Figure 5). Despite the D index variations, the “Class V” classification remained in all sampling and beaches. Daily D values with significant differences were not found at any beach.
In winter 2020, despite the general noise reduction in the southernmost beaches, litter scattered items and accumulations in some of the beaches, (e.g., La Caplina and La Herradura) and punctual noise due to constructions in some northernmost beaches (Figure 1) were noticed, inducing a decrease in the D value (Table 3 and Table 4, Figure 5). In general, the D index value increased for summer 2021, except for: Los Delfines, Makaha, Redondo and Los Pavos (Figure 5), due to punctual crowded points inducing noise increasing (Table 3 and Table 4). Additionally, a considerable reduction in the number of beachgoers was observed in the summer 2021 season due to health restrictions. However, significant differences in the daily D index were not found due to constant people flow during the three consecutive days that influenced human parameters.
4. Discussion
4.1. D Index Seasonal Variation
In tropical areas, the seasonal variations of nature are less strong than subtropical areas, where the main variation were identified in the human features. In the same way, within the eight human parameters of CSES, litter and noise have a short time dynamic (days or even hours), while the other six can be static for months or years. Regarding summer 2020, noise disturbance and litter presence were higher in beaches where more people were observed during the evaluation days, (e.g., Barranco, Las Sombrillas, Los Yuyos, Agua Dulce) than in other samplings. Higher noise disturbance during summer is related to human activities carried out overall in this season. A seasonal increasing abundance of litter has been observed in other beaches worldwide, (e.g., Alicante-Spain beaches), where litter quantity was considerably more frequent in summer than in spring despite the cleaning operations [34]. Additionally, in Morocco, litter abundance was higher in autumn than in spring due to debris accumulation during summer and reduced cleaning operations [35]. For the first time, the coastal scenery valuation was compared in different periods, which use to be one of the critiques of this kind of study.
4.2. Physical Parameters in Urban Beaches
Physical parameters (Figure 2, Figure 3 and Figure 4) had a critical influence on the class calculation [17]. In our study, water color and clarity, and sand color ranked low scores since CPCV beaches are characterized as “Green/grey/blue” (water color) and “dark tan” (sand color), which are colors with low ranks. Water color parameter is linked to water masses characteristics, ocean currents, and benthic sediment because sandy beaches sediment is not as thicker as pebble beaches, then, the sand is easily resuspended, increasing the water turbidity [36]. The CPCV beach green water coloration is related to the high productivity of the Peruvian ocean [37].
At the same time, sand color in non-urbanized beaches depends on the mineralogical composition, vegetation debris, and degraded organic matter [38]. However, in urbanized areas, sand color can also be related to anthropogenic actions such as beach nourishments that can change the native sand color with different environmental and economic impacts [39,40]. Another explanation of the physical parameter’s results are the CPCV sandy beaches could be the erosion of sandy cliffs, which may have contributed in part to the dark tan color of the sand [41]. Although in many cases little can be done to improve these physical parameters, the recommendation is to improve the human parameters, which can be more easily managed to upgrade the D score [16].
4.3. Human Parameters Variation
Overall, urban beaches are classified as III, IV or V Class (Table 1), due to the poor scores on scenic features. Litter accumulation and noise disturbance factor on beaches were the parameters that most affect the scenic index value (D). A slight difference was noted on pebble/gravel beaches, (i.e., Los Delfines to Los Pavos, La Caplina, and La Herradura), which might be related to the beach typology since gravel reduces the accumulation rate of litter compared to sandy beaches [42], and because beachgoers prefer sandy beaches over gravel ones [7]. Hence, the most considerable number of users could generate more litter on those beaches.
Sand cleaning is a strategic management action on urban beaches, where litter sources are bigger and more frequent than rural or remote beaches [43]. However, during winter 2020 less frequent cleaning operations were observed (particularly in La Caplina and La Herradura), causing a lack of efficient solid waste management and security monitoring, continuous litter and single beach litter accumulation (cigarette butts, plastic bottles, bottle caps, food packaging). These observations were accord with other investigations where plastic products were the most common beach litter [44,45]. This issue is relevant because plastic is not only harmful to marine organisms, (e.g., by its ingestion or entanglement) [46,47], but can produce tourism and recreational loss [48]; in that instance, district managers should strengthen the beach security to avoid beach pollution. Similarly, the correct management of cleaning operations depending on the litter source need to be improved in all beaches [49]. In the CPCV beaches, one strategy to reduce the litter source may start with activities to increasing sensibility to the problem in the visitor’s behavior and to guarantee the cleaning service whole year around.
Noise disturbance, (e.g., horns, loudspeakers) was noticed in La Pampilla 2, Agua Dulce, Las Sombrillas, and Barranco beaches (Table 4), where wave sound was even imperceptible in some samplings (due to the beachgoers and traffic noise). Additionally, the absence of an appropriate buffer zone (an area that divides two separate entities: beach/road-parking lot) lowered the attractiveness of all the beaches, as observed in other coastal assessments [19]. In consequence, noise reduction must be considered to improve the management of the evaluated beaches and surpasses the deficit in this human parameter. In addition, awareness campaigns for drivers who transit the CPCV can help to reduce noise in this beach corridor.
4.4. Scenic Features Affecting Urban Beaches around the World
Beaches in Class V have low physical and human parameters [17] and are located on urban sites with an environmentally insensitive skyline [11], which is consistent with our observations on the CPCV beaches. Despite a Class V category “Very Unattractive,” the evaluated beaches attract thousands of people (overall citizens) daily, predominantly during the summer season [26]. An investigation during 2014 revealed that the number of daily users on these beaches was more than 7,000 per day, while most of the visitors lived in districts near the CPCV [30]. Thus, the several access routes and the proximity to the various districts of Lima are perhaps important factors driving visitors to the nearest beaches. Overall, “proximity” was the main aspect in beach selection for local and national visitors in the Caribbean littoral of Colombia [50]. Other examples of world coastal sites with similar D index values are detailed in the Supplementary Material, representing urban coastal sites with high tourism rates, despite the low attractiveness classification.
However, some urban beaches have been classified in Class II (Table 1), due to outstanding physical features (white sand and turquoise water), and the limited influence of human parameters, the absence of noise, sewage evidence, and litter [15,16]. Therefore, urban beaches with high human parameters scores can be classified as class III or IV as obtained in various investigations (Table 1). In the case of the CPCV, improving the human parameters (litter, noise, built environment, buffer zone) and maintain the control of sewage discharges could help to increase the D index value (Table 3).
It is also important to mention that the lowest D value estimated in CPCV (Table 3) was higher than other world urban beaches assessed with the CSES (Supplementary Material). Furthermore, urban beaches are not the only ones to classify as Class V, but also rural (Playa Piloto, Cuba [15]), resort (Mar Verde, Cuba [15]), village (Laidatxu, Spain [14]) and remote (Lido di Volano (South), Italy [19]), due to the presence of coastal protection structures, flat coastal morphology (poor scenic features), pollution issues and heavy traffic of ships.
4.5. Future Beach Management Actions
Specific actions, such as regular beach cleaning operations and community education and monitoring, should be implemented to raise awareness about the present and future environmental threats [48]. Repressive measures to reduce disturbance (noise) of tourists (loudspeakers usage) to prevent and avoid loud music might be applied to cover the regulations and restrictions; banning the horns and loudspeakers that generate acoustic pollution will help in this improvement [14,51]. Additionally, further scenery deterioration should be avoided by limiting the construction of non-sensible infrastructures, such as buildings or houses [18] near the coastline. Tourism incomes in Barranco and Chorrillos districts might be the most affected if these measures are not executed since visitors of CPCV prefer Barranco, Los Yuyos, Las Sombrillas, and Agua Dulce beaches [30]. Parameters such as litter and noise disturbance are two of the most critical parameters for beachgoers’ preferences [52]; hence its variation will significantly influence the D final index. Modifications of the “Plan Maestro de Desarrollo de la Costa Verde 2021–2031” (the official planning document for this area) should consider all the suggestions outlined above for better coastal scenery management.
This investigation represents the first effort to evaluate beaches applying a multitemporal CSES in Peruvian coastal sites. Further research should focus coastal scenic evaluation systems to assess “remote,” “rural,” and “village” beaches around the coast of Peru. Additionally, other classification scales, such as Litter Grade Classification [49] and Clean Coast Index [53], should be applied to identify and highlight the main points that require management improvements.
5. Conclusions
This investigation is the first study evaluating the scenery of Peruvian urban beaches and the first to do a multi-temporal analysis of CSES around the world at a seasonal scale, which is one of the critiques of this kind of study. Although no temporal differences in the D index value were found between seasons in CPCV, the methodology presented here could help similar studies in other geographical areas.
The 20 evaluated beaches of the CPCV were classified as Class V (very unattractive urban areas) despite being some of the most touristic beaches in Lima. Therefore, our evaluation of the coastal scenery on Lima’s beaches shows a contradiction between the premise of tourist attraction through beautiful sceneries and the actual tourist affluence. This finding reinforces the conclusion of other studies about the actual reasons for beach choices.
The majority of studies applying the CSES method are on beautiful beaches, but the novelty of our research is the analysis of only urban beaches. It demonstrates that CSES is also useful on unattractive beaches. In conclusion, coastal scenery valuation is a powerful and simple tool to guide beach management in urban areas, where naturalness is not the main goal. Although urban beaches are ugly from the scenery perspective, the multitemporal valuation of coastal scenery demonstrated to be useful to identify aspects to improve in the short term, (e.g., noise reduction or cleaning service) and long term, (e.g., design of utilities and infrastructure). In fact, future actions on the planning of the CPCV could encourage sustainable tourism development and conservation of the coastal ecosystem, based on the CSES outputs.
Supplementary Materials
The following supporting information can be downloaded at: https://www.mdpi.com/article/10.3390/w14152336/s1, I. Statistical tests; II. Detailed review of urban beaches assessed by CSES around the world.
Author Contributions
M.L.-P.: Conceptualization, Investigation, Methodology, Writing—Original draft preparation. H.A.: Conceptualization, Investigation, Supervision, Writing—Reviewing and Editing. C.M.B.: Supervision, Writing—Reviewing and Editing. All authors have read and agreed to the published version of the manuscript.
Funding
This research received no external funding.
Institutional Review Board Statement
Not applicable.
Informed Consent Statement
Not applicable.
Acknowledgments
We are grateful to Alex Lizarbe and Marina Palacios for the unconditional support during this study performance and to Luana Portz for her support in the data analysis. This research is in contribution to the RED PROPLAYAS network Nodo Local Científico C58-Universidad Científica del Sur.
Conflicts of Interest
The authors declare no conflict of interest.
References
- Mooser, A.; Anfuso, G. Las 50 Playas Más Atractivas de Andalucía Desde un Enfoque Innovador: El Paisaje; Editorial UCA: Andalusia, Spain, 2019; p. 301. [Google Scholar]
- Williams, A.T. Definitions and typologies of coastal tourism destinations. In Disappearing Destinations: Climate Change and Future Challenges for Coastal Tourism; Jones, A., Phillips, M., Eds.; CABI: Wallingford, UK, 2011; pp. 47–66. [Google Scholar]
- Williams, A.; Micallef, A. Beach Management: Principles and Practice; Earthscan: London, UK, 2009; ISBN 978-1-84407-435-8. [Google Scholar] [CrossRef]
- Corraini, N.R.; de Lima, A.D.S.; Bonetti, J.; Rangel-Buitrago, N. Troubles in the paradise: Litter and its scenic impact on the North Santa Catarina island beaches, Brazil. Mar. Pollut. Pulletin 2018, 131, 572–579. [Google Scholar] [CrossRef]
- Tudor, C. An Approach to Landscape Character and Assessment; Natural England: London, UK, 2014. [Google Scholar]
- Rangel-Buitrago, N. (Ed.) Coastal Scenery: Evaluation and Management; Springer International Publishing: Cham, Switzerland, 2018. [Google Scholar] [CrossRef]
- Ergin, A.; Karaesmen, E.; Micallef, A.; Williams, A.T. A new methodology for evaluating coastal scenery: Fuzzy logic systems. Area 2004, 36, 367–386. [Google Scholar] [CrossRef]
- Ergin, A. Coastal scenery assessment by means of a fuzzy logic approach. In Coastal Scenery; Springer: Cham, Switzerland, 2019; pp. 67–106. [Google Scholar]
- Asensio-Montesinos, F.; Anfuso, G.; Corbí, H. Evaluación paisajística de las playas de Alicante (Mediterráneo occidental) mediante parámetros físicos y antropogénicos: Implicaciones para la gestión. Geotemas 2017, 17, 183–186. [Google Scholar]
- Vaz, B.; Williams, A.T.; Silva CP, D.; Phillips, M. The importance of user’s perception for beach management. J. Coast. Res. 2019, 56, 1164–1168. [Google Scholar]
- Williams, A.T.; Micallef, A.; Anfuso, G.; Gallego, J.B. Andalusia, Spain: An assessment of coastal scenery. Landsc. Res. 2012, 37, 327–349. [Google Scholar] [CrossRef]
- Williams, A.T.; Rangel-Buitrago, N.G.; Anfuso, G.; Cervantes, O.; Botero, C.M. Litter impacts on scenery and tourism on the Colombian north Caribbean coast. Tour. Manag. 2016, 55, 209–224. [Google Scholar] [CrossRef]
- Cristiano, S.D.C.; Rockett, G.C.; Portz, L.C.; Anfuso, G.; Gruber NL, S.; Williams, A.T. Evaluation of Coastal Scenery in Urban Beach: Torres, Rio Grande do Sul, Brazil. Rev. Gestão Costeira Integr. 2016, 16, 71–78. [Google Scholar] [CrossRef]
- Iglesias, B.; Anfuso, G.; Uterga, A.; Arenas, P.; Williams, A.T. Scenic value of the Basque Country and Catalonia coasts (Spain): Impacts of tourist occupation. J. Coast. Conserv. 2017, 22, 247–261. [Google Scholar] [CrossRef]
- Anfuso, G.; Williams, A.T.; Casas-Martínez, G.C.; Botero, C.M.; Cabrera-Hernández, J.C.; Pranzini, E. Evaluation of the scenic value of 100 beaches in Cuba: Implications for coastal tourism management. Ocean Coast. Manag. 2017, 142, 173–185. [Google Scholar] [CrossRef]
- Rangel-Buitrago, N.; Williams, A.; Anfuso, G. Killing the goose with the golden eggs: Litter effects on scenic quality of the Caribbean coast of Colombia. Mar. Pollut. Bull. 2018, 127, 22–38. [Google Scholar] [CrossRef] [PubMed]
- Rangel-Buitrago, N.; Contreras-Lopez, M.; Martinez, C.; Williams, A. Can coastal scenery be managed? The Valparaíso region, Chile as a case study. Ocean Coast. Manag. 2018, 163, 383–400. [Google Scholar] [CrossRef]
- Asensio-Montesinos, F.; Anfuso, G.; Corbí, H. Coastal scenery and impacts at Alicante (SE Spain): Management issues. J. Coast. Conserv. 2019, 23, 185–201. [Google Scholar] [CrossRef]
- Rodella, I.; Corbau, C. Linking scenery and users’ perception analysis of Italian beaches (case studies in Veneto, Emilia-Romagna and Basilicata regions). Ocean Coast. Manag. 2020, 183, 104992. [Google Scholar] [CrossRef]
- Benseny, G. The coastal area as a tourist scenario: The case of Villa Gesell (Argentina). In Proceedings of the 7th World Conference for Graduate Research in Tourism Hospitality and Leisure, Istanbul, Turkey, 3–7 June 2014; pp. 764–768. [Google Scholar]
- Bombana, B.; Conde, D.; Polette, M. Gestión de playas urbanas: Un análisis comparativo de los procesos de gobernanza en las playas Pocitos (Montevideo, Uruguay) y Central (Balneário Camboriú-SC, Brasil). Desenvolv. Meio Ambiente 2016, 36, 291–313. [Google Scholar] [CrossRef] [Green Version]
- Aravena, T.; Arshad, H.; Campos de Andrade, A.; Farhad, N.; Iliya, C.; Jayaswal, L.; Nazir, S.; Zhu, Y. Costa Verde: Gobernanza de la costa. London’s Global University (UCL). 2016. Available online: https://www.ucl.ac.uk/bartlett/development/sites/bartlett/files/costa_verde_spn1_3.pdf (accessed on 30 March 2021).
- Moreyra, S. Hotel Cinco Estrellas en el Acantilado de La Costa Verde—Barranco. Bachelor’s Thesis, Universidad Peruana de Ciencias Aplicadas, Lima, Perú, 2013. [Google Scholar]
- Lozano-Sanllehi, S.; Zavalaga, C.B. Nonrandom spatial distribution of Neotropic Cormorants (Phalacrocorax brasilianus) along a coastal highway in Lima, Peru. PLoS ONE 2021, 16, e0242835. [Google Scholar] [CrossRef]
- Castillo, R. (Convenio Autoridad del Proyecto Costa Verde (APCV)—Instituto Metropolitano de Planificación (IMP), Lima). Plan Maestro de Desarrollo de la Costa Verde 1995–2010. Vol. A, D. Report. Lima: Municipalidad Metropolitana de Lima; Acuerdo de Consejo No. 079 APCV. 1995. Available online: https://apcvperu.gob.pe/files/planmaestro/03.Resumen_ejecutivo_plan_maestro_95_new_2018.pdf (accessed on 15 April 2021).
- Castillo-García, R. Hacia el desarrollo urbano sostenible de La Costa Verde de la Megalópolis Lima Callao, Perú, al 2050. Paid. XXI 2020, 10, 203–231. [Google Scholar] [CrossRef]
- Arana, V.; Knudsen, P. La Costa Verde y una Propuesta Para su Gestión. Available online: https://www.academia.edu/7319302/La_Costa_Verde_y_una_propuesta_para_su_Gesti%C3%B3n_Lima_Per%C3%BA (accessed on 23 February 2021).
- Venero, J. Estabilización del Talud de La Costa Verde en la Zona del Distrito de Magdalena. Bachelor’s Thesis, Pontificia Universidad Católica del Perú, Lima, Perú, 2008. [Google Scholar]
- Garrido, D.N. Implementación de un Plan de Contingencia ante Sismo y Tsunami en la Costa Verde Para la Gestión del Riesgo de Desastres en el Distrito San Isidro, Lima-Perú 2019. Master’s Thesis, Universidad Continental, Lima, Perú, 2019. [Google Scholar]
- Majluf, P.; Valqui, M.; Sueiro, J.; Leguía, M.; López, C.; Chang, D. Identificación de Ecosistemas y Servicios Ecosistémicos dentro del Ámbito De La Costa Verde”—Proceso De Selección N° 002-2014-Mml-Apcv-Ga/Aa. In Centro Para La Sostenibilidad Ambiental De La Universidad Peruana Cayetano Heredia; 2014; Available online: https://www.apcvperu.gob.pe/files/estudios/Ecosistemas_2.pdf (accessed on 24 April 2021).
- Ergin, A.; Özölçer, İ.H.; Şahin, F. Evaluating coastal scenery using fuzzy logic: Application at selected sites in Western Black Sea coastal region of Turkey. Ocean Eng. 2010, 37, 583–591. [Google Scholar] [CrossRef]
- Hammer, O.; Harper, D.A.T.; Ryan, P.D. PAST: Paleontological Statistics Software package for education and data analysis. Paleontol. Electr. 2001, 4, 9. [Google Scholar]
- Esri Inc. ArcGIS Desktop, Version 10.5 [software]; Environmental Systems Research Institute: Redlands, CA, USA, 2016. Available online: https://desktop.arcgis.com/es/arcmap/(accessed on 20 February 2021).
- Asensio-Montesinos, F.; Anfuso, G.; Randerson, P.; Williams, A.T. Seasonal comparison of beach litter on Mediterranean coastal sites (Alicante, SE Spain). Ocean Coast. Manag. 2019, 181, 104914. [Google Scholar] [CrossRef]
- Nachite, D.; Maziane, F.; Anfuso, G.; Williams, A.T. Spatial and temporal variations of litter at the Mediterranean beaches of Morocco mainly due to beach users. Ocean Coast. Manag. 2019, 179, 104846. [Google Scholar] [CrossRef]
- Anfuso, G.; Bolivar-Anillo, H.J.; Sánchez Moreno, H.; Villate Daza, D.A.; López Daza, O.L. Coastal Tourism Importance and Beach Users’ Preferences: The "Big Fives" Criterions and Related Management Aspects. J. Tour. Hosp. 2018, 7, 1000347. [Google Scholar] [CrossRef]
- Cardó, N.; Humphrey, C. Nuestro mar de cada día. Óptimas condiciones oceanográficas y actividades sostenibles. Cult. Rev. Assoc. Docentes USMP 2018, 32, 9. [Google Scholar] [CrossRef]
- Mestanza-Ramón, C.; Pranzini, E.; Anfuso, G.; Botero, C.M.; Chica-Ruiz, J.A.; Mooser, A. An Attempt to Characterize the “3S” (Sea, Sun, and Sand) Parameters: Application to the Galapagos Islands and Continental Ecuadorian Beaches. Sustainability 2020, 12, 3468. [Google Scholar] [CrossRef] [Green Version]
- Pranzini, E.; Anfuso, G.; Botero, C.M.; Cabrera, A.; Campos, Y.A.; Martinez, G.C.; Williams, A.T. Sand colour at Cuba and its influence on beach nourishment and management. Ocean Coast. Manag. 2016, 126, 51–60. [Google Scholar] [CrossRef]
- Asensio-Montesinos, F.; Pranzini, E.; Martinez-Martinez, J.; Cinelli, I.; Anfuso, G.; Corbí, H. The origin of sand and its colour on the south-eastern coast of Spain: Implications for erosion management. Water 2020, 12, 377. [Google Scholar] [CrossRef] [Green Version]
- Tsujimoto, G.; Tamai, M. Analysis of beach sand colour and its application to sedimentation. In Proceedings of the 7th International Conference on Asian and Pacific Coasts (APAC 2013), Bali, Indonesia, 24–26 September 2013; pp. 24–26. [Google Scholar]
- Schmuck, A.M.; Lavers, J.L.; Stuckenbrock, S.; Sharp, P.B.; Bond, A.L. Geophysical features influence the accumulation of beach debris on Caribbean islands. Mar. Pollut. Bull. 2017, 121, 45–51. [Google Scholar] [CrossRef] [PubMed]
- Zielinski, S.; Botero, C.M.; Yanes, A. To clean or not to clean? A critical review of beach cleaning methods and impacts. Mar. Pollut. Bull. 2019, 139, 390–401. [Google Scholar] [CrossRef] [PubMed]
- Ertaş, A. Assessment of beach litter pollution in Adana Akyatan Lagoon Coast of the East Mediterranean. Mar. Pollut. Bull. 2021, 163, 111943. [Google Scholar] [CrossRef] [PubMed]
- Aytan, U.; Sahin FB, E.; Karacan, F. Beach litter on Sarayköy Beach (SE Black Sea): Density, composition, possible sources and associated organisms. Turk. J. Fish. Aquat. Sci. 2019, 20, 137–145. [Google Scholar] [CrossRef]
- Guimarães, L.S.F.; Yves, A.; da Silva Mendes, S.; Maia, I.M.; Altomari, L.N.; de Carvalho, R.H.; de Sousa, B.M. Plastic debris ingestion by the green sea turtle (Chelonia mydas) in Espírito Santo state, southeastern Brazil. Herpetol. Notes 2020, 13, 391–392. [Google Scholar]
- Da Silva Videla, E.; de Araujo, F.V. Marine debris on the Brazilian coast: Which advances in the last decade? A literature review. Ocean Coast. Manag. 2021, 199, 105400. [Google Scholar] [CrossRef]
- Krelling, A.P.; Williams, A.T.; Turra, A. Differences in perception and reaction of tourist groups to beach marine debris that can influence a loss of tourism revenue in coastal areas. Mar. Policy 2017, 85, 87–99. [Google Scholar] [CrossRef]
- Botero, C.M.; Tamayo, D.; Zielinski, S.; Anfuso, G. Qualitative and Quantitative Beach Cleanliness Assessment to Support Marine Litter Management in Tropical Destinations. Water 2021, 13, 3455. [Google Scholar] [CrossRef]
- Botero, C.; Anfuso, G.; Williams, A.T.; Zielinski, S.; Da Silva, C.P.; Cervantes, O.; Silva, L.; Cabrera, J.A. Reasons for beach choice: European and Caribbean perspectives. J. Coast. Res. 2013, 65, 880–885. [Google Scholar] [CrossRef]
- Charifi, M.; Sow, M.; Ciret, P.; Benomar, S.; Massabuau, J.C. The sense of hearing in the Pacific oyster, Magallana gigas. PLoS ONE 2017, 12, e0185353. [Google Scholar] [CrossRef] [PubMed] [Green Version]
- Ergin, A.; Karaesmen, E.; Uçar, B. A quantitative study for evaluation of coastal scenery. J. Coast. Res. 2011, 27, 1065–1075. [Google Scholar] [CrossRef]
- Alkalay, R.; Pasternak, G.; Zask, A. Clean-coast index a new approach for beach cleanliness assessment. Ocean Coast Manag. 2007, 50, 352–362. [Google Scholar] [CrossRef]
Figure 1.
The study area in CPCV, Lima, Peru, indicating sampled points. (A) Map of Peru with emphasis on the department of Lima. (B) Districts included in the sample. Black squares represent the sampled points. From north to south: Los Delfines (LD), Tres Picos (TP), Punta Roquitas (PR), La Pampilla 2 (PM), La Pampilla (PA), Waikiki (WK), Makaha (MK), Redondo (RD), La Estrella (LE), Las Piedritas (PD), Las Cascadas (LC), Barranquito (BT), Los Pavos (PV), Barranco (BR), Los Yuyos (LY), Las Sombrilla (LS), Agua Dulce (AD), Los Pescadores (PE), La Caplina (LN) and La Herradura (LH).

Figure 2.
Images of the evaluated beaches. Los Delfines (LD), Tres Picos (TP), Punta Roquitas (PR), La Pampilla 2 (PM), La Pampilla (PA), Waikiki (WK), Makaha (MK), and Redondo (RD).
Figure 2.
Images of the evaluated beaches. Los Delfines (LD), Tres Picos (TP), Punta Roquitas (PR), La Pampilla 2 (PM), La Pampilla (PA), Waikiki (WK), Makaha (MK), and Redondo (RD).

Figure 3.
Images of the evaluated beaches. La Estrella (LE), Las Piedritas (PD), Las Cascadas (LC), Barranquito (BT), Los Pavos (PV), and Barranco (BR).
Figure 3.
Images of the evaluated beaches. La Estrella (LE), Las Piedritas (PD), Las Cascadas (LC), Barranquito (BT), Los Pavos (PV), and Barranco (BR).

Figure 4.
Images of the evaluated beaches. Los Yuyos (LY), Las Sombrilla (LS), Agua Dulce (AD), Los Pescadores (PE), La Caplina (LN), and La Herradura (LH).
Figure 4.
Images of the evaluated beaches. Los Yuyos (LY), Las Sombrilla (LS), Agua Dulce (AD), Los Pescadores (PE), La Caplina (LN), and La Herradura (LH).

Figure 5.
Variations on the D index values, (A) summer 2020, (B) winter 2020, (C) summer 2021. Variations occurred in the same class category V. From north to south: Los Delfines (LD), Tres Picos (TP), Punta Roquitas (PR), La Pampilla 2 (PM), La Pampilla (PA), Waikiki (WK), Makaha (MK), Redondo (RD), La Estrella (LE), Las Piedritas (PD), Las Cascadas (LC), Barranquito (BT), Los Pavos (PV), Barranco (BR), Los Yuyos (LY), Las Sombrilla (LS), Agua Dulce (AD), Los Pescadores (PE), La Caplina (LN) and La Herradura (LH).


Table 1.
State-of-the-art CSES performed on urban beaches around the world.
| Reference | Country | Number of Assessed Beaches | Number of Urban Beaches Assessed | Urban Beaches Scenery Class |
|---|---|---|---|---|
| [11] | Spain | 45 | 19 | II, III, IV, V |
| [12] | Colombia | 35 | 14 | IV, V |
| [13] | Brazil | 12 | 12 | III, IV, V |
| [14] | Spain | 54 | 14 | IV, V |
| [15] | Cuba | 100 | 10 | II, III, IV, V |
| [16] | Colombia | 137 | 31 | II, IV, V |
| [17] | Chile | 96 | 25 | IV, V |
| [4] | Brazil | 8 | 3 | IV, V |
| [18] | Spain | 56 | 22 | IV, V |
| [19] | Italy | 25 | 11 | III, IV, V |
Table 2.
Coastal scenic evaluation system [7].
Table 2.
Coastal scenic evaluation system [7].
| No: | Physical Parameters | Rating | |||||
|---|---|---|---|---|---|---|---|
| 1 | 2 | 3 | 4 | 5 | |||
| 1 | Cliff | Height (H) | Absent (<5 m) | 5 m ≤ H < 30 m | 30 m ≤ H ≤ 60 m | 60 m ≤ H ≤ 90 m | H ≥ 90 m |
| 2 | Slope | <45° | 45–60° | 65–75° | 75–85° | Circa Vertical | |
| 3 | Special features * | Absent | 1 | 2 | 3 | Many > 3 | |
| 4 | Beach face | Type | Absent | Mud | Cobble/boulder | Pebble/gravel (±sand) | Sand |
| 5 | Width (W) | Absent | W < 5 m or W > 100 m | 5 m ≤ W < 25 m | 25 m ≤ W < 50 m | 50 m ≤ W ≤ 100 m | |
| 6 | Color | Absent | Dark | Dark Tan | Light tan/bleached | White/Gold | |
| 7 | Rocky shore | Slope | Absent | <5° | 5–10° | 10–20° | >20° |
| 8 | Extent | Absent | <5 m | 5–10 m | 10–20 m | >20 m | |
| 9 | Roughness | Absent | Distinctly jagged | Deeply pitted and/or irregular | Shallow pitted | Smooth | |
| 10 | Dunes | Absent | Remnants | Fore-dune | Secondary ridge | Several | |
| 11 | Valley | Absent | Dry | Stream (<1 m) | Stream (1–4 m) | >4 m | |
| 12 | Skyline landform | Not Visible | Flat | Undulating | Highly undulating | Mountainous | |
| 13 | Tides | Macro (>4 m) | Meso (2–4 m) | Micro (<2 m) | |||
| 14 | Coastal landscape features ** | None | 1 | 2 | 3 | >3 | |
| 15 | Vistas | Open on one side | Open on two sides | Open on three sides | Open on four sides | ||
| 16 | Water color and clarity | Muddy Brown/Grey | Milky blue/green; opaque | Green/grey Blue | Clear blue/dark blue | Very clear turquoise | |
| 17 | Natural vegetation cover | Bare (<10% vegetation only) | Scrub/garigue/grass (marram/gorse/ferns, bramble/meadow etc) | Wetland/meadow | Wetland ± Mature tees | Variety of mature trees/mature natural cover | |
| 18 | Vegetation debris | Continuous > 50 cm high | Full strand line | Single accumulation | Few scattered items | None | |
| Human parameters | 1 | 2 | 3 | 4 | 5 | ||
| 19 | Noise disturbance | Intolerable | Tolerable | Little | None | ||
| 20 | Litter | Continuous accumulations | Full strand line | Single accumulation | Few scattered items | Virtually absent | |
| 21 | Sewage discharge evidence | Sewage evidence | Some evidence (1–3 items) | No evidence of sewage | |||
| 22 | Non-built environment *** | None | Hedgerow/terracing monoculture | Field mixed cultivation ± trees/natural | |||
| 23 | Built environment **** | Heavy industry | Heavy tourism and/or urban | Light tourism and/or urban and/or sensitive industry | Sensitive tourism and/or urban | Historic and/or none | |
| 24 | Access type | No buffer zone/heavy traffic | Buffer zone/light traffic | Parking lot visible from coastal area | Parking lot not visible from coastal area | ||
| 25 | Skyline | Very unattractive | Unattractive | Sensitively designed high/low | Very sensitively designed | Natural/historic features | |
| 26 | Utilities ***** | >3 | 3 | 2 | 1 | None | |
Note(s): * Cliff special features: indentation, banding, folding, scree, irregular profile, etc. ** Coastal landscape features: peninsulas, rock ridges, irregular headlands, arches, windows, caves, waterfalls, deltas, lagoons, islands, stacks, estuaries, reefs, fauna, embayment, tombola, etc. *** Non-built environment: **** Built environment caravans will come under tourism; grading 2: large intensive caravan site; grading 3: light, but still intensive caravan sites; grading 4: sensitively designed caravan sites. ***** Utilities: power lines, pipelines, streetlamps, groynes, seawalls, revetments, etc.
Table 3.
D index values for summer 2020, winter 2020, summer 2021 (3-day average) and the mean D index value per beach. Variations between the D index of the CPCV beaches were mainly due to human parameters (litter and noise disturbance) daily and period variation.
Table 3.
D index values for summer 2020, winter 2020, summer 2021 (3-day average) and the mean D index value per beach. Variations between the D index of the CPCV beaches were mainly due to human parameters (litter and noise disturbance) daily and period variation.
| Beach | Summer 2020 (D) | Winter 2020 (D) | Summer 2021 (D) | Mean (D) |
|---|---|---|---|---|
| Los Delfines | −0.28 | −0.30 | −0.36 | −0.31 |
| Tres Picos | −0.29 | −0.30 | −0.30 | −0.30 |
| Punta Roquitas | −0.33 | −0.40 | −0.33 | −0.35 |
| La Pampilla 2 | −0.30 | −0.48 | −0.39 | −0.39 |
| La Pampilla | −0.36 | −0.31 | −0.30 | −0.32 |
| Waikiki | −0.46 | −0.39 | −0.32 | −0.39 |
| Makaha | −0.30 | −0.36 | −0.35 | −0.34 |
| Redondo | −0.27 | −0.27 | −0.29 | −0.27 |
| La Estrella | −0.36 | −0.30 | −0.30 | −0.32 |
| Las Piedritas | −0.30 | −0.30 | −0.30 | −0.30 |
| Las Cascadas | −0.37 | −0.30 | −0.38 | −0.35 |
| Barranquito | −0.33 | −0.40 | −0.32 | −0.35 |
| Los Pavos | −0.31 | −0.30 | −0.32 | −0.31 |
| Barranco | −0.46 | −0.36 | −0.34 | −0.38 |
| Los Yuyos | −0.41 | −0.21 | −0.26 | −0.29 |
| Las Sombrillas | −0.41 | −0.23 | −0.27 | −0.31 |
| Agua Dulce | −0.41 | −0.22 | −0.26 | −0.30 |
| Los Pescadores | −0.41 | −0.28 | −0.35 | −0.34 |
| La Caplina | −0.17 | −0.36 | −0.24 | −0.26 |
| La Herradura | −0.20 | −0.27 | −0.21 | −0.23 |
Table 4.
Noise disturbance and litter parameters scores for summer 2020, winter 2020, summer 2021 (3-day average). Scores range from 1 to 5, with 5 as excellent.
Table 4.
Noise disturbance and litter parameters scores for summer 2020, winter 2020, summer 2021 (3-day average). Scores range from 1 to 5, with 5 as excellent.
| Summer 2020 | Winter 2020 | Summer 2021 | ||||
|---|---|---|---|---|---|---|
| Beach | Noise Disturbance | Litter | Noise Disturbance | Litter | Noise Disturbance | Litter |
| Los Delfines | 4 | 5 | 4 | 5 | 3 | 5 |
| Tres Picos | 4 | 5 | 4 | 5 | 4 | 5 |
| Punta Roquitas | 4 | 5 | 4 | 5 | 4 | 5 |
| La Pampilla 2 | 4 | 5 | 2 | 5 | 3 | 5 |
| La Pampilla | 3 | 5 | 4 | 5 | 4 | 5 |
| Waikiki | 3 | 5 | 3 | 5 | 4 | 5 |
| Makaha | 4 | 5 | 3 | 5 | 3 | 5 |
| Redondo | 4 | 5 | 4 | 5 | 5 | 5 |
| La Estrella | 3 | 5 | 4 | 5 | 5 | 5 |
| Las Piedritas | 4 | 5 | 4 | 5 | 4 | 5 |
| Las Cascadas | 3 | 5 | 4 | 5 | 4 | 5 |
| Barranquito | 4 | 5 | 3 | 5 | 4 | 5 |
| Los Pavos | 4 | 5 | 4 | 5 | 5 | 5 |
| Barranco | 3 | 5 | 3 | 4 | 4 | 5 |
| Los Yuyos | 2 | 4 | 4 | 4 | 4 | 4 |
| Las Sombrillas | 2 | 4 | 5 | 4 | 5 | 5 |
| Agua Dulce | 2 | 4 | 4 | 4 | 5 | 5 |
| Los Pescadores | 2 | 4 | 3 | 4 | 3 | 4 |
| La Caplina | 4 | 4 | 5 | 3 | 5 | 4 |
| La Herradura | 3 | 4 | 5 | 4 | 5 | 5 |
Publisher’s Note: MDPI stays neutral with regard to jurisdictional claims in published maps and institutional affiliations. |
© 2022 by the authors. Licensee MDPI, Basel, Switzerland. This article is an open access article distributed under the terms and conditions of the Creative Commons Attribution (CC BY) license (https://creativecommons.org/licenses/by/4.0/).
Share and Cite
MDPI and ACS Style
Lizarbe-Palacios, M.; Aponte, H.; Botero, C.M. Multitemporal Scenic Evaluation of Urban Coastal Sites: A Peruvian Case Study. Water 2022, 14, 2336. https://doi.org/10.3390/w14152336
AMA Style
Lizarbe-Palacios M, Aponte H, Botero CM. Multitemporal Scenic Evaluation of Urban Coastal Sites: A Peruvian Case Study. Water. 2022; 14(15):2336. https://doi.org/10.3390/w14152336
Chicago/Turabian StyleLizarbe-Palacios, Mary, Héctor Aponte, and Camilo M. Botero. 2022. "Multitemporal Scenic Evaluation of Urban Coastal Sites: A Peruvian Case Study" Water 14, no. 15: 2336. https://doi.org/10.3390/w14152336
Note that from the first issue of 2016, this journal uses article numbers instead of page numbers. See further details here.