
Abstract
The on-resistance of bipolar devices depends on the carrier lifetime, which is determined by Shockley–Read–Hall, surface, radiation, and Auger recombination processes. Values for the Auger recombination coefficient have been previously reported, but the values were constant in each report. However, the Auger recombination coefficient should depend on the concentration of excited carriers and the presence of traps. In this study, we observed excited carrier recombination in 4H-SiC under the high injection condition using time-resolved free carrier absorption measurements. Consequently, we discovered that the Auger recombination coefficient is dependent on the excited carrier concentration and that the traps have negligible effects on the coefficient.
Export citation and abstract BibTeX RIS
1. Introduction
Power semiconductor devices based on silicon carbide (SiC) have recently received significant attention for high-voltage operations. Commercialized SiC devices include metal oxide semiconductor field effect transistors (MOSFETs) and Schottky barrier diodes (SBDs), both of which have lower on-resistance and higher breakdown voltage than their Si counterparts. SiC SBDs and MOSFETs are unipolar devices because they conduct electricity using only electrons. By contrast, bipolar devices, which use electrons and holes for electrical conduction, exhibit conductivity modulation effects, resulting in lower on-resistance than that of unipolar devices. SiC bipolar devices are expected to operate at voltages higher than 10 kV with relatively low on-resistance. Because conductivity modulation can be realized using crystals with long carrier lifetimes, devices based on epitaxial layers with low recombination center concentrations are preferable. 1,2)
In general, carrier lifetime is determined by Shockley–Read–Hall (SRH), surface, radiative, and Auger recombination processes. 3–7) The SRH recombination process depends on the crystal's perfection because this process is based on electronic transitions and holes through the recombination center. 8–11) In 4H-SiC, the most common recombination centers are Z1/2 centers, and reductions in the concentration of the Z1/2 center have been reported, which are widely called lifetime enhancement processes. 1,2,12,13) Meanwhile, the surface recombination process depends on the surface structure and damage near the surface. 14–19) In the case of 4H-SiC, chemical-mechanical polishing (CMP) is effective in achieving low surface recombination velocities. 16,17)
When the recombination center concentrations are sufficiently low, radiation and Auger recombination take precedence over carrier recombination. Although the radiative recombination coefficient B and Auger recombination coefficient C have been reported experimentally, 3–7) the constant C has been shown in each report.
On the one hand, owing to the Coulomb enhancement of the Auger process, C is dependent on the donor concentration under conditions of low injection, as reported in Si. 20) On the other hand, C decreased with the increase in N, which is the excited carrier concentration, in the high injection condition. This is because of the screening of the Coulomb enhancement effect. 20) Therefore, we need to clarify the dependence of C on N to discuss the theoretical limit of on-resistance of the SiC bipolar devices. In addition, it has been reported that C is dependent on the trap concentration owing to the effects of trap-assisted Auger recombination (TAAR). 21) Thus, it is important to observe trap concentration dependence of C. In this study, we estimated C in the high injection condition using the low-doped SiC epilayer, including dependence on N and the trap concentration.
2. Experimental methods
The samples are n-type epitaxy layers with a donor concentration of 1014 cm−3 and film thicknesses of 150 μm (T-150) and 250 μm (T-250). These samples were treated with carbon ion implantation, annealing at 1650 °C, and CMP of the sample surface to extend the carrier lifetime. 1,2,22) We also evaluated a p-type sample (P-100) with an acceptor concentration of 6 × 1014 cm−3 and a thickness of 100 μm. 18,23) To evaluate the effect of TAAR, two self-standing epilayer samples with a donor concentration of 1 × 1015 cm−3 were used, and one of the self-standing epilayers was implanted with 1 × 1015 cm−2 of protons (H+) with an acceleration energy of 0.95 MeV to induce traps.
For carrier lifetime measurements, a third harmonic yttrium aluminum garnet laser with a wavelength of 355 nm and a pulse width of 1 ns was used as the excitation light source. A continuous-wave laser with a wavelength of 637 nm was used as the probe light, and micro-time-resolved free carrier absorption (FCA), 24–27) which constitutes an objective lens, was used.
3. Results and discussion
Figure 1 shows the time-resolved FCA decay curves observed from T-250 for various excited carrier concentrations N. To estimate N, the injected photon concentration and photon penetration depth were used. The injected photon concentrations were calculated using the power of the excited laser (approximately 0.001–1 mW), an oscillation frequency of 100 Hz, and the spot area of the laser (1.7 × 10⁻⁴ cm2), and the resulting injected photon concentrations were approximately 1014–1017 cm−2. The penetration depth was set to 42 μm at 355 nm, 28) and the distribution of excited carriers after excitation was calculated. Subsequently, the distribution of excited carriers from the surface to the penetration depth was averaged, and this average value was taken as N (resulting in N of approximately 1016–1019 cm−3). As shown in Fig. 1, with increasing excited carrier concentration N, the decay became faster.
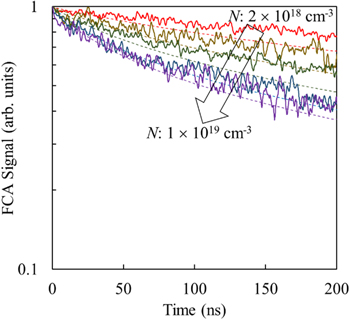
Fig. 1. (Color online) FCA decay curves for T-250 various excited carrier densities. The dotted lines are the calculated decay curves with τbulk = 10 μs, S0 = 1000 cm s−1, B = 1 × 10⁻¹² cm3 s−1, and C = 7.4 × 10⁻¹⁹ N−0.68 cm6 s−1.
Download figure:
Standard image High-resolution imageBecause the Auger recombination component is presented only at the beginning of the decay curves, the slopes at initial decay τini were extracted from the decay curve up to 10 ns. The extracted τini for all the samples are shown in Fig. 2, along with τini from the report by Scajev et al. at a higher N than that in our experiments (they employed a slope up to 12 ns). 5) However, because τini includes the radiative recombination component, we extracted Auger lifetimes τauger by using the following equation with the reported B of 1 × 10⁻¹² cm3 s−120,29)
where  is the donor or acceptor concentration in the sample. (Kerr and Cuevas
20) and Yablonovitch et al.
29) used bulk carrier lifetime τbulk extracted from the observed carrier lifetime of samples with different thicknesses to exclude surface recombination. However, we employed τini, which includes surface recombination contributions, because it was difficult to prepare the samples with different thicknesses). The extracted τauger are shown in Fig. 3. τauger clearly depended on N for T-250 and those from Ščajev et al.
5) Based on the slope of τauger against N,
20) we estimated the N dependent C to be 7.4 × 10⁻¹⁹
N−0.68 cm6 s−1. Although τauger for T-150 and P-100 did not show a clear dependence on N, and this independence would be due to faster SRH and surface recombination than those for T-250, as expected from the decay curves in our previous report.
25)
τauger at N > 5 × 1018 cm−3 for T-150 and P-100 show similar values to those in T-250. Therefore, C was 7.4 × 10⁻¹⁹
N−0.68 cm6 s−1 at N > 5 × 1018 cm−3, as shown by the line in Fig. 3.
is the donor or acceptor concentration in the sample. (Kerr and Cuevas
20) and Yablonovitch et al.
29) used bulk carrier lifetime τbulk extracted from the observed carrier lifetime of samples with different thicknesses to exclude surface recombination. However, we employed τini, which includes surface recombination contributions, because it was difficult to prepare the samples with different thicknesses). The extracted τauger are shown in Fig. 3. τauger clearly depended on N for T-250 and those from Ščajev et al.
5) Based on the slope of τauger against N,
20) we estimated the N dependent C to be 7.4 × 10⁻¹⁹
N−0.68 cm6 s−1. Although τauger for T-150 and P-100 did not show a clear dependence on N, and this independence would be due to faster SRH and surface recombination than those for T-250, as expected from the decay curves in our previous report.
25)
τauger at N > 5 × 1018 cm−3 for T-150 and P-100 show similar values to those in T-250. Therefore, C was 7.4 × 10⁻¹⁹
N−0.68 cm6 s−1 at N > 5 × 1018 cm−3, as shown by the line in Fig. 3.
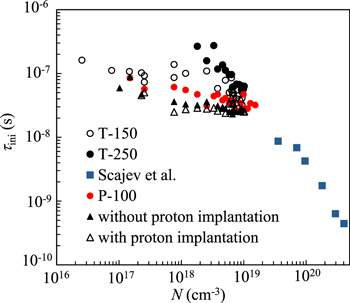
Fig. 2. (Color online) N dependence of τini for the samples with extracted values from Ref. 5.
Download figure:
Standard image High-resolution image
Fig. 3. (Color online) N dependence of τauger for T-150, T-250, and P-100 along with extracted values from Ref. 5. The symbols denote experimental values, and the dashed line indicates the slope of fitting to the experimental values with C = 7.4 × 10⁻¹⁹ N−0.68 cm6 s−1 at N > 5 × 1018 cm−3.
Download figure:
Standard image High-resolution imageFigure 4 shows τauger for the samples with and without proton implantation. The sample implanted with protons shows almost the same τauger as the sample without proton (H+) implantation, even though τauger did not show N dependence and is shorter than those for other samples. Therefore, we were not able to confirm the effects of TAAR even in the samples with a high concentration of traps (1015 cm−2 proton implantation would induce vacancies with 1018 cm−3 up to 10 μm from the surface). Considering τauger of 34 ns at the highest N = 9.4 × 1018 cm−3, C was less than 3.3 × 10⁻³¹ cm6 s−1 even with the effects of TAAR induced by proton implantation.

Fig. 4. N dependence of τauger for the samples with and without proton implantation.
Download figure:
Standard image High-resolution image
To confirm the validity of the estimated C, we reproduced the FCA decay curves by calculations. Generally, carrier recombination can be expressed using a partial differential equation that describes the temporal and spatial variations as follows: 19)

where t is the time, x is the depth of the semiconductor layer, Da is the ambipolar diffusion coefficient, and G is the generation rate of excess carriers. We set G = 0 because of the absence of excitation sources, except for the initial laser pulse.
Da was evaluated using the following equation:

where n is the free electron concentration, p is the free hole concentration, and Dn and Dp are the diffusion constants of holes and electrons, respectively, estimated from the mobilities of electrons μe and holes μh. 30) As N increases, μe and μh change owing to the influence of electron–hole scattering. 31) Thus, Dn and Dp depend on N, and from Eq. (3), Da also depends on Dn and Dp. The boundary conditions for Eq. (2) between the excited surface and other surfaces are expressed as:

where S0 and SW are the surface recombination velocities on the excited and back surfaces, respectively, and W is the layer thickness of 250 μm at which the value of SW has negligible effects on the calculated results.
We set τbulk at 10 μs and S0 at 1000 cm s−1, considering previous studies. 19,23,25) With B of 1 × 10⁻¹² cm3 s−1 and C of 7.4 × 10⁻¹⁹ N−0.68 cm6 s−1, we obtained the decay curves shown by the dotted lines in Fig. 1. The calculated decay curves were well reproduced, particularly at high N, and thus, the estimated C was reasonable.
Scajev et al. also reported the N dependence of C and speculated on the screening of the Coulomb enhancement, as seen in Si. 5,20) Our results also suggest the presence of the Coulomb enhancement screening. However, Scajev et al. showed slightly smaller dependence of C ∝ N−0.3 compared with our estimation. 5) The reasons for the different N dependences may be due to the different estimation method used by Ščajev et al. at N < 2 × 1019 cm−3. 5) They estimated C by fitting the shapes of the N dependent decay curves for several separated N ranges (C = 7 × 10⁻³¹ cm6 s−1 at N = 1018–19 cm−3 and C = 1.4 × 10⁻³¹ cm6 s−1 at N = 2 × 1019 cm−3). Consequently, even though C was estimated from the N dependent decay curves, they discussed N dependence using the estimated C. This method may include errors in N dependent C. Other possible reasons for the different N dependence are the differences in the samples; their samples have shorter τepi and larger S than those for our samples. Their short τepi and large S induce an apparently short τauger and mitigate N dependence. Another possible reason is N dependence of B, as discussed by Ščajev et al. 5) Their study, like ours, employed constant B for the analysis because all the previous reports show the same B of 1 × 10⁻¹² cm3 s−1. To reduce the difference in the experimental and calculated decay curves for the relatively low Nas shown in Fig. 1, B lower than 1 × 10⁻¹² cm3 s−1 at low N is required. Therefore, to estimate the longest limit of carrier lifetime using B and C at relatively low N, we need to observe N dependent B, as reported in the other studies, 32) and this observation will be the subject of our future study.
The estimated C of 7.4 × 10⁻¹⁹ N−0.68 cm6 s−1 at N > 5 × 1018 cm−3 induces a smaller value compared with the reported values of 5–7 × 10⁻³¹ cm6 s−1. 3–7) Therefore, the limit of carrier lifetime at the high injection condition will be longer than those expected so far, and on-resistance of SiC bipolar devices can be reduced if carriers more than 5 × 1018 cm−3 are injected.
4. Conclusions
We estimated the excited carrier concentration dependent Auger recombination coefficient as 7.4 × 10⁻¹⁹ N−0.68 cm6 s−1 at N > 5 × 1018 cm−3, and the N dependence is concluded to be caused by screening of the Coulomb enhancement. However, we were unable to observe the effects of traps on the Auger recombination coefficient, and thus, TAAR did not increase C more than 3.3 × 10⁻³¹ cm6 s−1 at N of 9.4 × 1018 cm−3. The estimated C of 7.4 × 10⁻¹⁹ N−0.68 cm6 s−1 is smaller than the reported values, and thus, the on-resistance of SiC bipolar devices can be reduced if carriers more than 5 × 1018 cm−3 are injected. We expect this estimated C to be useful in the development of SiC bipolar devices with high concentration carrier injection.
Acknowledgments
The authors thank Mr. A. Miyasaka of Showa Denko K.K. and Dr. K. Kojima, Dr. Y. Yonezawa, and Dr. T. Kato of the National Institute of Advanced Industrial Science and Technology for their cooperation in sample preparation. This work is partly supported by TEPCO Memorial Foundation.