the Creative Commons Attribution 4.0 License.
the Creative Commons Attribution 4.0 License.
 | 11 Jun 2018
Asymmetric responses of primary productivity to altered precipitation simulated by ecosystem models across three long-term grassland sites
Donghai Wu
Philippe Ciais
Nicolas Viovy
Alan K. Knapp
Kevin Wilcox
Michael Bahn
Melinda D. Smith
Sara Vicca
Simone Fatichi
Jakob Zscheischler
Xiangyi Li
Akihiko Ito
Almut Arneth
Anna Harper
Anna Ukkola
Athanasios Paschalis
Benjamin Poulter
Changhui Peng
Daniel Ricciuto
David Reinthaler
Guangsheng Chen
Hanqin Tian
Hélène Genet
Jiafu Mao
Johannes Ingrisch
Julia E. S. M. Nabel
Julia Pongratz
Lena R. Boysen
Markus Kautz
Michael Schmitt
Patrick Meir
Qiuan Zhu
Roland Hasibeder
Sebastian Sippel
Shree R. S. Dangal
Stephen Sitch
Xiaoying Shi
Yingping Wang
Yiqi Luo
Yongwen Liu
Shilong Piao
Field measurements of aboveground net primary productivity (ANPP) in temperate grasslands suggest that both positive and negative asymmetric responses to changes in precipitation (P) may occur. Under normal range of precipitation variability, wet years typically result in ANPP gains being larger than ANPP declines in dry years (positive asymmetry), whereas increases in ANPP are lower in magnitude in extreme wet years compared to reductions during extreme drought (negative asymmetry). Whether the current generation of ecosystem models with a coupled carbon–water system in grasslands are capable of simulating these asymmetric ANPP responses is an unresolved question. In this study, we evaluated the simulated responses of temperate grassland primary productivity to scenarios of altered precipitation with 14 ecosystem models at three sites: Shortgrass steppe (SGS), Konza Prairie (KNZ) and Stubai Valley meadow (STU), spanning a rainfall gradient from dry to moist. We found that (1) the spatial slopes derived from modeled primary productivity and precipitation across sites were steeper than the temporal slopes obtained from inter-annual variations, which was consistent with empirical data; (2) the asymmetry of the responses of modeled primary productivity under normal inter-annual precipitation variability differed among models, and the mean of the model ensemble suggested a negative asymmetry across the three sites, which was contrary to empirical evidence based on filed observations; (3) the mean sensitivity of modeled productivity to rainfall suggested greater negative response with reduced precipitation than positive response to an increased precipitation under extreme conditions at the three sites; and (4) gross primary productivity (GPP), net primary productivity (NPP), aboveground NPP (ANPP) and belowground NPP (BNPP) all showed concave-down nonlinear responses to altered precipitation in all the models, but with different curvatures and mean values. Our results indicated that most models overestimate the negative drought effects and/or underestimate the positive effects of increased precipitation on primary productivity under normal climate conditions, highlighting the need for improving eco-hydrological processes in those models in the future.
- Article
(2077 KB) - Full-text XML
-
Supplement
(1178 KB) - BibTeX
- EndNote


Precipitation (P) is a key climatic determinant of ecosystem productivity, especially in arid and semi-arid grasslands (Lambers et al., 2008; Sala et al., 1988; Hsu et al., 2012; Beer et al., 2010). Climate models project substantial changes in amounts and frequencies of precipitation regimes worldwide, and this is supported by observational data (Karl and Trenberth, 2003; Donat et al., 2016; Fischer and Knutti, 2016). Potential for increasing occurrence and severity of droughts and increased heavy rainfall events related to global warming will likely affect grassland growth (Knapp et al., 2008, 2017a; Gherardi and Sala, 2015; Lau et al., 2013; Reichstein et al., 2013). As a consequence, better understanding of the responses of grassland productivity to altered precipitation is needed to project future climate–carbon interactions, changes in ecosystem states, and to gain better insights on the role of grasslands in supporting crucial ecosystem services (e.g., livestock production).
Gross primary productivity (GPP) of ecosystems is controlled by environmental conditions, in particular water availability (Jung et al., 2017), and by biotic factors affecting leaf photosynthetic rates and stomatal conductance, which scale up to canopy-level functioning (Chapin III et al., 2011). About half of GPP is respired while the remainder, net primary productivity (NPP), is primarily invested in plant biomass production, including photosynthetic and structural pools aboveground (foliage and stem) and belowground (roots) (Waring et al., 1998; Chapin III et al., 2011). NPP responses to precipitation have been observed using multi-year, multi-site observations (Hsu et al., 2012; Estiarte et al., 2016; Knapp and Smith, 2001; Wilcox et al., 2015). Positive empirical relationships between grassland aboveground NPP (ANPP) and precipitation (P) have been found in spatial gradients across sites (Sala et al., 1988) and from temporal variability at individual sites (Huxman et al., 2004; Knapp and Smith, 2001; Roy et al., 2001; Hsu et al., 2012). The ANPP–P sensitivities obtained from spatial relationships are usually higher than those obtained by temporal relationships (Estiarte et al., 2016; Fatichi and Ivanov, 2014; Sala et al., 2012). Possible mechanisms behind the steeper spatial relationship may be (1) a “vegetation constraint” reflecting the adaptation of plant communities over long timescales in such a way that grasslands make the best use of the typical water received from rainfall for growth (Knapp et al., 2017b) and (2) the spatial variation in structural and functional traits of ecosystems (soil properties, nutrient pools, plant and microbial community composition) that constrain local ANPP–P sensitivities (Lauenroth and Sala, 1992; Smith et al., 2009; Wilcox et al., 2016). For projecting the effect of climate change on grassland productivity in the near to mid-term (coming decades), inter-annual relationships are arguably more informative than spatial relationships because spatial relationships reflect long-term adaptation of ecosystems and because ANPP–P relationships from spatial gradients are confounded by the covariation of gradients in other environmental variables (e.g., temperature and radiation) and soil properties (Estiarte et al., 2016; Knapp et al., 2017b).
In temporal ANPP–P relationships, an important observation is the asymmetric responses of productivity in grasslands to altered precipitation (Knapp et al., 2017b; Wilcox et al., 2017). Compared to negative anomalies of ANPP from years with decreased precipitation, positive anomalies of ANPP during years with increased precipitation were usually found to have a larger absolute magnitude, suggesting a convex positive response (positive asymmetry) (Bai et al., 2008; Knapp and Smith, 2001; Yang et al., 2008). Yet, when grasslands are subject to extreme precipitation anomalies that fall beyond the range of normal inter-annual variability, an extreme dry year is associated with a larger absolute ANPP loss than the gain found during an extreme wet year. This suggests a convex negative response (negative asymmetry) when considering a larger range of rainfall anomalies than the current inter-annual regime (Knapp et al., 2017b). This is also supported by current dynamical global vegetation models, which suggest a stronger response to extreme dry conditions compared to extreme wet conditions (Zscheischler et al., 2014). The sign of the asymmetric response of grassland productivity to altered rainfall thus depends on the magnitude of rainfall anomalies, the size distribution of rainfall events and ecosystem mean state (Gherardi and Sala, 2015; Hoover and Rogers, 2016; Parolari et al., 2015; Peng et al., 2013).
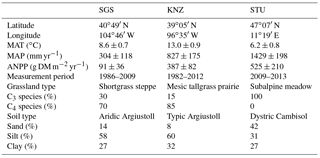
Table 1Key plant, soil and climate characteristics of the three grassland sites. MAT, mean annual temperature; and MAP, mean annual precipitation. MAT and MAP are based on the periods for the three sites with ANPP measurements.
Relationships between precipitation and grassland productivity have previously been studied with site observations (Hsu et al., 2012; Knapp et al., 2017b; Luo et al., 2017; Wilcox et al., 2017; Estiarte et al., 2016), but they remain to be quantified and characterized in ecosystem models used for diagnostic and future projections of the coupled carbon–water system in grasslands, in particular grid-based models used as the land surface component of Earth system models. In this study, we aim to evaluate the responses of simulated productivity to altered precipitation from 14 ecosystem models at three sites representing dry (304 ± 118 mm yr−1), mesic (827 ± 175 mm yr−1) and moist (1429 ± 198 mm yr−1) rainfall regimes. The specific objectives of this study are to (1) test if the productivity–P sensitivities of spatial relationships are greater than the temporal ones in the models such as those found in the observations; (2) test if models reproduce the observed asymmetric responses under inter-annual precipitation conditions; (3) assess the simulated productivity–P sensitivities related to different precipitation regimes including normal and extreme conditions, and to test in particular if sensitivities for extreme drought conditions are stronger than those for high-rainfall conditions; (4) analyze the simulated curvilinear productivity–P relationships for a large range of altered precipitation amounts across the three sites.
2.1 Experimental sites
We conducted model simulations using three sites: the Shortgrass steppe (SGS) site at the Central Plains Experimental Range, the Konza Prairie Biological Station (KNZ) site and the Stubai Valley meadow (STU) site. These sites represent three grassland types spanning a productivity gradient from dry to moist climatic conditions. The dry SGS site is located in northern Colorado, USA (Knapp et al., 2015; Wilcox et al., 2015). The KNZ site is a native C4-dominated mesic tallgrass prairie in the Flint Hills of northeastern Kansas, USA (Heisler-White et al., 2009; Hoover et al., 2014). The moist site of STU is a subalpine meadow located in the Austrian Central Alps near the village of Neustift (Bahn et al., 2006, 2008; Schmitt et al., 2010). Experimental measurements of annual ANPP were carried out spanning different time ranges. Estimated mean ANPP for SGS, KNZ and STU sites are 91 ± 36, 387 ± 82 and 525 ± 210 g DM (dry mass) m−2 yr−1. Details of the ecological and environmental factors are summarized in Table 1.
These three grasslands were selected because they lie along a mean annual precipitation (MAP) gradient and have detailed meteorological data to force the models. While two are “natural” grasslands (KNZ and SGS) and one (STU) is not, global land surface models do not typically differentiate regarding the origin of ecosystem types and heavily managed grasslands and pastures represent a significant fraction of mesic grasslands globally. Semi-natural subalpine grasslands in the Alps were created several centuries ago, are very lightly managed and should be in equilibrium concerning soil physical conditions. It should be noted though that the grassland at STU is cut once a year and lightly fertilized every 2–4 years and in consequence differs in plant composition and soil fungi : bacteria ratio, which leads to different drought responses compared to abandoned grassland (Ingrisch et al., 2017; Karlowsky et al., 2018). Further, it is worth noting that the mesic grassland in the USA would also be forested if human-initiated prescribed fires were to be removed from the system (Briggs et al., 2005). Thus, these grassland sites lie along a continuum of dry natural grassland, mesic natural grassland maintained by human management and anthropogenic moist grassland maintained by human management.
2.2 Ecosystem model simulations
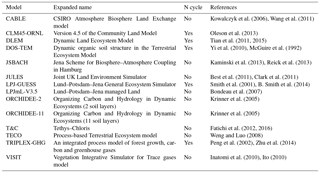
In order to test the hypothesis of an asymmetric response of productivity to variable rainfall (Knapp et al., 2017b), simulations were conducted with 14 ecosystem models – CABLE, CLM45-ORNL, DLEM, DOS-TEM, JSBACH, JULES, LPJ-GUESS, LPJmL-V3.5, ORCHIDEE-2, ORCHIDEE-11, T&C, TECO, TRIPLEX-GHG and VISIT – all using the same protocol defined by the precipitation subgroup of the model–experiment interaction study (Table 2). At all three grassland sites, observed and altered multi-annual hourly rainfall forcing time series were combined with observations of other climate variables. These variables were air temperature, incoming solar radiation, air humidity, wind speed and surface pressure. Model simulations were carried out using soil texture properties measured at each site as reported in Table 1. Simulated productivity during the observational period is influenced at least in some models (for instance those having C–N interactions) by historical climate change and CO2 changes since the preindustrial period. Thus, instead of assuming that productivity was in equilibrium with current climate, historical reconstructions of meteorological variables from gridded CRUNCEP data at half-hourly time step (Wei et al., 2014) were combined and bias corrected with site observations to provide bias corrected historical forcing time series from 1901 to 2013 (CRUNCEP-BC). In addition to the observed current climate defining the ambient simulation, nine altered rainfall forcing datasets were constructed by decreasing or increasing the amount of precipitation in each precipitation event by −80, −70, −60, −50, −20, +20, +50, +100 and +200 % during the time span of productivity observations at each site, leaving all other meteorological variables unchanged and equal to the observed values. Modelers performed all simulations described below based on the same protocol (see below) and the model output was compared with measured ecosystem productivities (GPP; NPP; ANPP; and BNPP, belowground NPP), whenever available.
Table 2Summary of ecosystem models used in this study, including model name, nitrogen (N) cycle and relevant references. Also see Tables S1–S14 in the Supplement for details of the simulated processes for grasslands in the ecosystem models, including the N cycle, phosphorus (P) cycle, carbon (C) allocation scheme, carbohydrate reserves, leaf photosynthesis and stomatal conductance including treatment of water stress, scaling of photosynthesis from leaf to canopy, phenology, mortality, soil hydrology, surface energy budget, root profile and dynamics, and grassland species.
Simulation S0 spin-up: models simulated an initial steady state spin-up run for water and biomass pools under preindustrial conditions using the 1901–1910 CRUNCEP-BC climate forcing in a loop and applying fixed atmospheric CO2 concentration at the 1850 level.
Simulation S1 historical simulation from 1850 until the first year of measurement (1986 for SGS, 1982 for KNZ and 2009 for STU): starting from the spin-up state, models were prescribed with increasing atmospheric CO2 concentrations and dynamic historical climate from CRUNCEP-BC. Because there is no CRUNCEP-BC data for 1850–1900, the CRUNCEP-BC climate data from 1901 to 1910 was repeated in a loop instead.
Simulation SC1 ambient simulation for the measurement periods (1986–2009 for SGS, 1982–2012 for KNZ and 2009–2013 for STU): starting from the initial state in the start year of the period and run with observed CO2 concentrations and meteorological data corresponding to site observations at the hourly or half-hourly scale.
Simulations SP1–SP9 altered precipitation simulations for the measurement periods (1986–2009 for SGS, 1982–2012 for KNZ and 2009–2013 for STU): starting from the initial state in the start year of the period and run using the nine altered rainfall forcing datasets with observed CO2 concentration.
2.3 Metrics of the response of productivity to precipitation changes
In the analysis, we begin with testing our first specific objective, i.e., if the productivity–P sensitivities of spatial relationships are greater than the temporal ones in the models as found in the observations. We calculated the temporal slopes and spatial slopes between productivities and precipitation from multi-year ambient simulations (SC1). Temporal slopes are site based and relate inter-annual variability in precipitation to inter-annual variability in the productivities using linear regression analysis. Spatial slopes relate mean annual precipitation to mean annual productivity across the three sites.
We then calculated two indices to analyze the asymmetric responses of primary productivity to precipitation simulated by ecosystem models and derived by observations whenever data were available. The two indices are (1) the asymmetry of productivity–P for current inter-annual variability, based on SC1 where observations for ANPP are also available; and (2) the sensitivity of productivity to P for simulations where mean precipitation was altered, based on SP results. With these metrics, we test our second and third specific objectives, i.e., whether models could reproduce the observed asymmetric responses of productivity in grasslands to altered precipitation under normal and extreme conditions.
Finally, we analyze the nonlinearity of modeled response of productivity to precipitation, which is described by the parameters of the curvilinear productivity–P relationships across the full range of altered precipitation scenarios, based on fits to model output for the ambient (SC1) and altered (SP) simulations. Detailed methods for the two indices used to analyze the asymmetric responses of primary productivity to altered precipitation and the curvilinear productivity–P relationships are introduced in the following.
2.3.1 Asymmetry index from inter-annual productivity and precipitation
In order to characterize the asymmetry of productivity to precipitation, we define the asymmetry index (AI) from inter-annual productivity and precipitation data as follows:
where Rp is the relative productivity pulse in wet years and Rd is the relative productivity decline in dry years defined by
where f is the inter-annual productivity, being a function of environmental factors from models or observation; is mean annual productivity in the period of measurements (Table 1); med(fp90) is the median value of productivities in wet years with annual precipitation higher than the 90th percentile level; and med(fp10) is median value of productivities in all the dry years when annual precipitation is lower than the 10th percentile level.
In general, Rp > 0 indicates that the median value of productivities in wet years is higher than the mean annual productivity in the period of measurements; and Rd > 0 indicates that the median value of productivities in dry years is smaller than the mean annual productivity in the period of measurements. Therefore, AI > 0, i.e., a positive asymmetry, means that there is a greater increase of productivity in wet years than decline in dry years; and AI < 0, i.e., a negative asymmetry, means that there is a greater decline of productivity in dry years than increase in wet years.
Furthermore, uncertainty ranges of Rp, Rd and AI were estimated as follows:
where and are the lower and upper bounds of Rp using one median absolute deviation, i.e., mad(fp90); and are the lower and upper bounds of Rd using one median absolute deviation, i.e., mad(fp10); and AIlow and AIup are the lower and upper bounds of AI corresponding to estimated Rp and Rd ranges.
2.3.2 Sensitivity of productivity to altered versus inter-annual precipitation variability
For altered precipitation, in particular for the extreme SP simulations where mean precipitation was altered and annual precipitation of a few years was outside the range of observed precipitation variation, we tested the hypothesis of whether the asymmetry response becomes negative – that is the impacts of extreme dry conditions on productivity are much greater than the positive effects of extreme wet scenarios (Knapp et al., 2017b). Thus, we tested the mean change in productivity imposed by the change in precipitation, and we defined the sensitivity of productivity to altered rainfall conditions (S) as
where and are the mean productivities of altered and ambient simulations; and are the mean annual precipitation amounts in altered and ambient simulations. It should be noted that the sensitivity of productivity to altered rainfall conditions could present the asymmetry response from normal to extreme conditions.
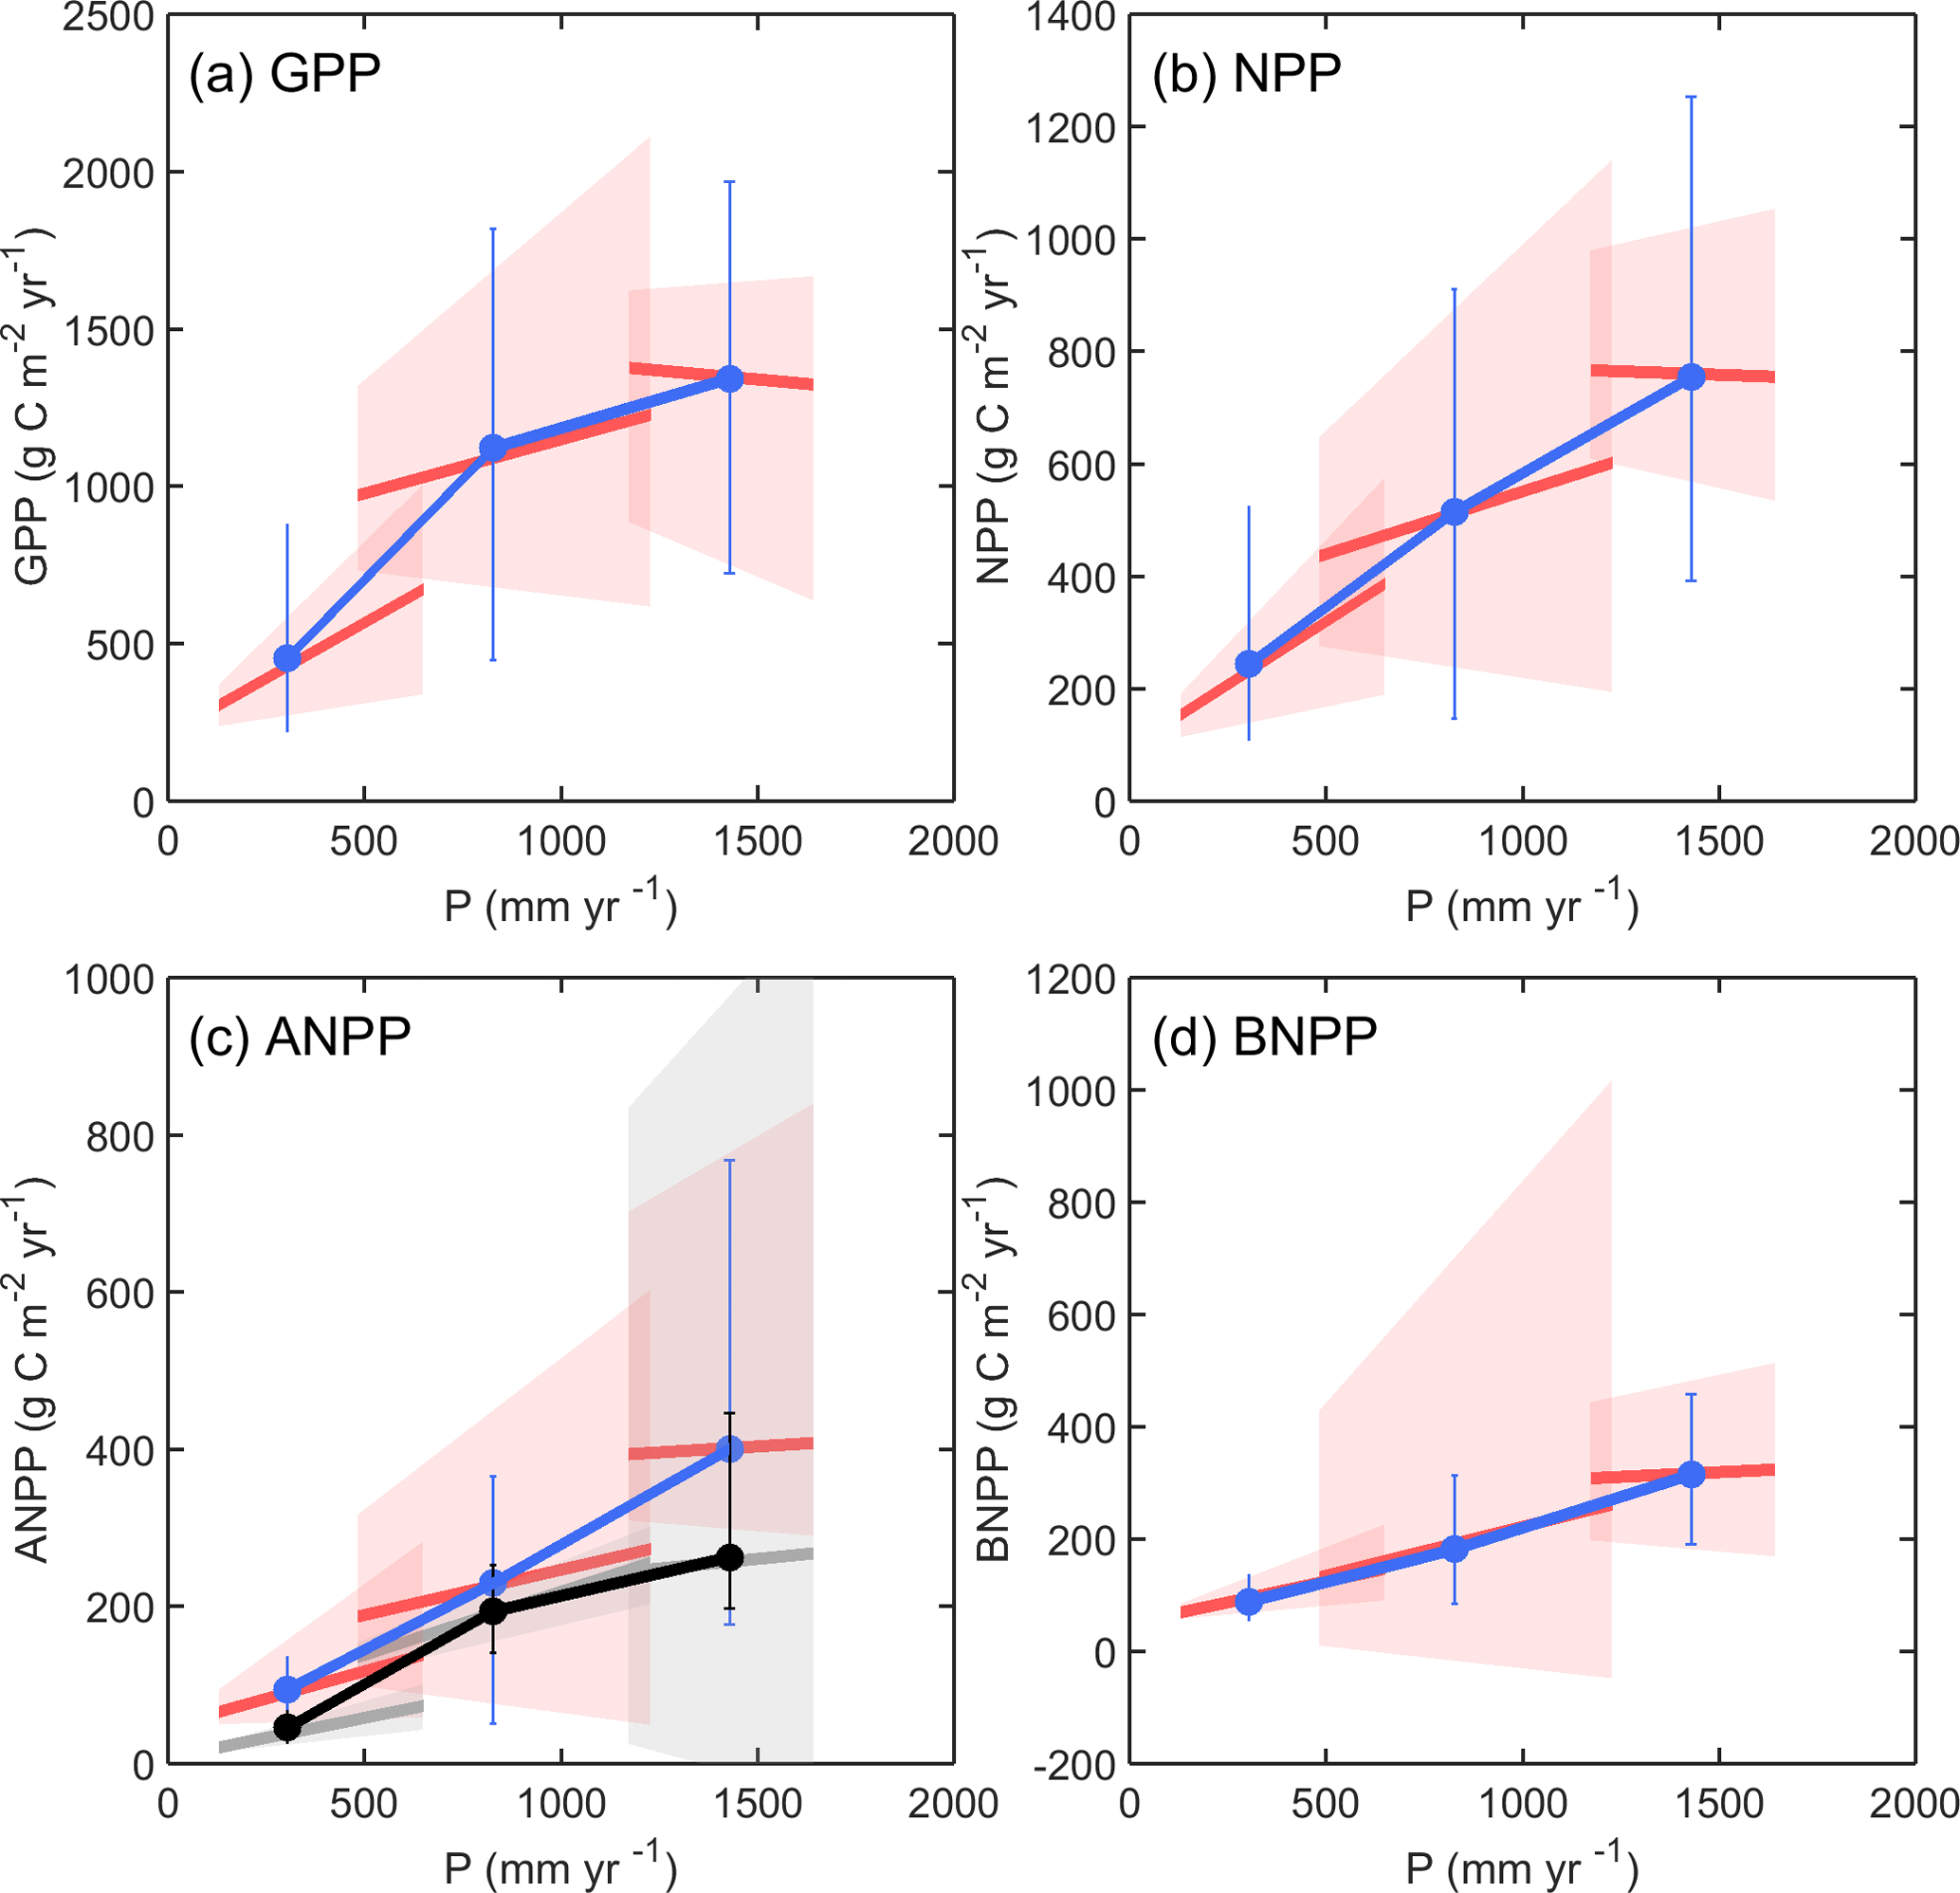
Figure 1Relationships between GPP (a), NPP (b), ANPP (c), and BNPP (d) and precipitation (P) derived from multi-year ambient simulations (SC1) in two ways. Temporal slopes are site based and relate inter-annual variability in P to inter-annual variability in the productivities using linear regression analysis. Spatial slopes relate mean annual P to mean annual productivity across three sites. In each panel, SGS, KNZ and STU are from dry to moist, given from left to right. The red lines are the ensemble mean of modeled temporal slopes, and the red shading represents the model uncertainty range using the interquartile spread of the temporal slopes between individual simulations (10th and 90th percentiles). The blue line is the ensemble mean of modeled productivities, and the blue error bar represents the model uncertainty range using the interquartile spread of the productivities between individual simulations (10th and 90th percentiles). In (c), the grey lines are the observed temporal slopes, and the black line shows the observed spatial slope. The grey shading represents the observed uncertainty range using the bootstrap sampling method (10th and 90th percentiles), and the black error bar represents the observed uncertainty range using the interquartile spread of the inter-annual productivities (10th and 90th percentiles). Note that we simply converted observed ANPP from dry mass (g DM m−2 yr−1) to carbon mass (g C m−2 yr−1) with a factor of 0.5.
2.3.3 Curvilinear productivity–P relationships across the entire range of altered P
In general, plant productivity increases with increasing precipitation and saturates when photosynthesis becomes less limited by water scarcity. We fitted the response of simulated productivity to altered precipitation using the Eq. (8):
where the independent variable x is the mean annual precipitation (mm) and the dependent variable y one of the productivities (GPP, NPP, ANPP and BNPP). Parameter a (g C m−2 yr−1) is the maximum value of productivity at high precipitation and parameter b (mm−1) is the curvature of modeled productivity to altered precipitation.
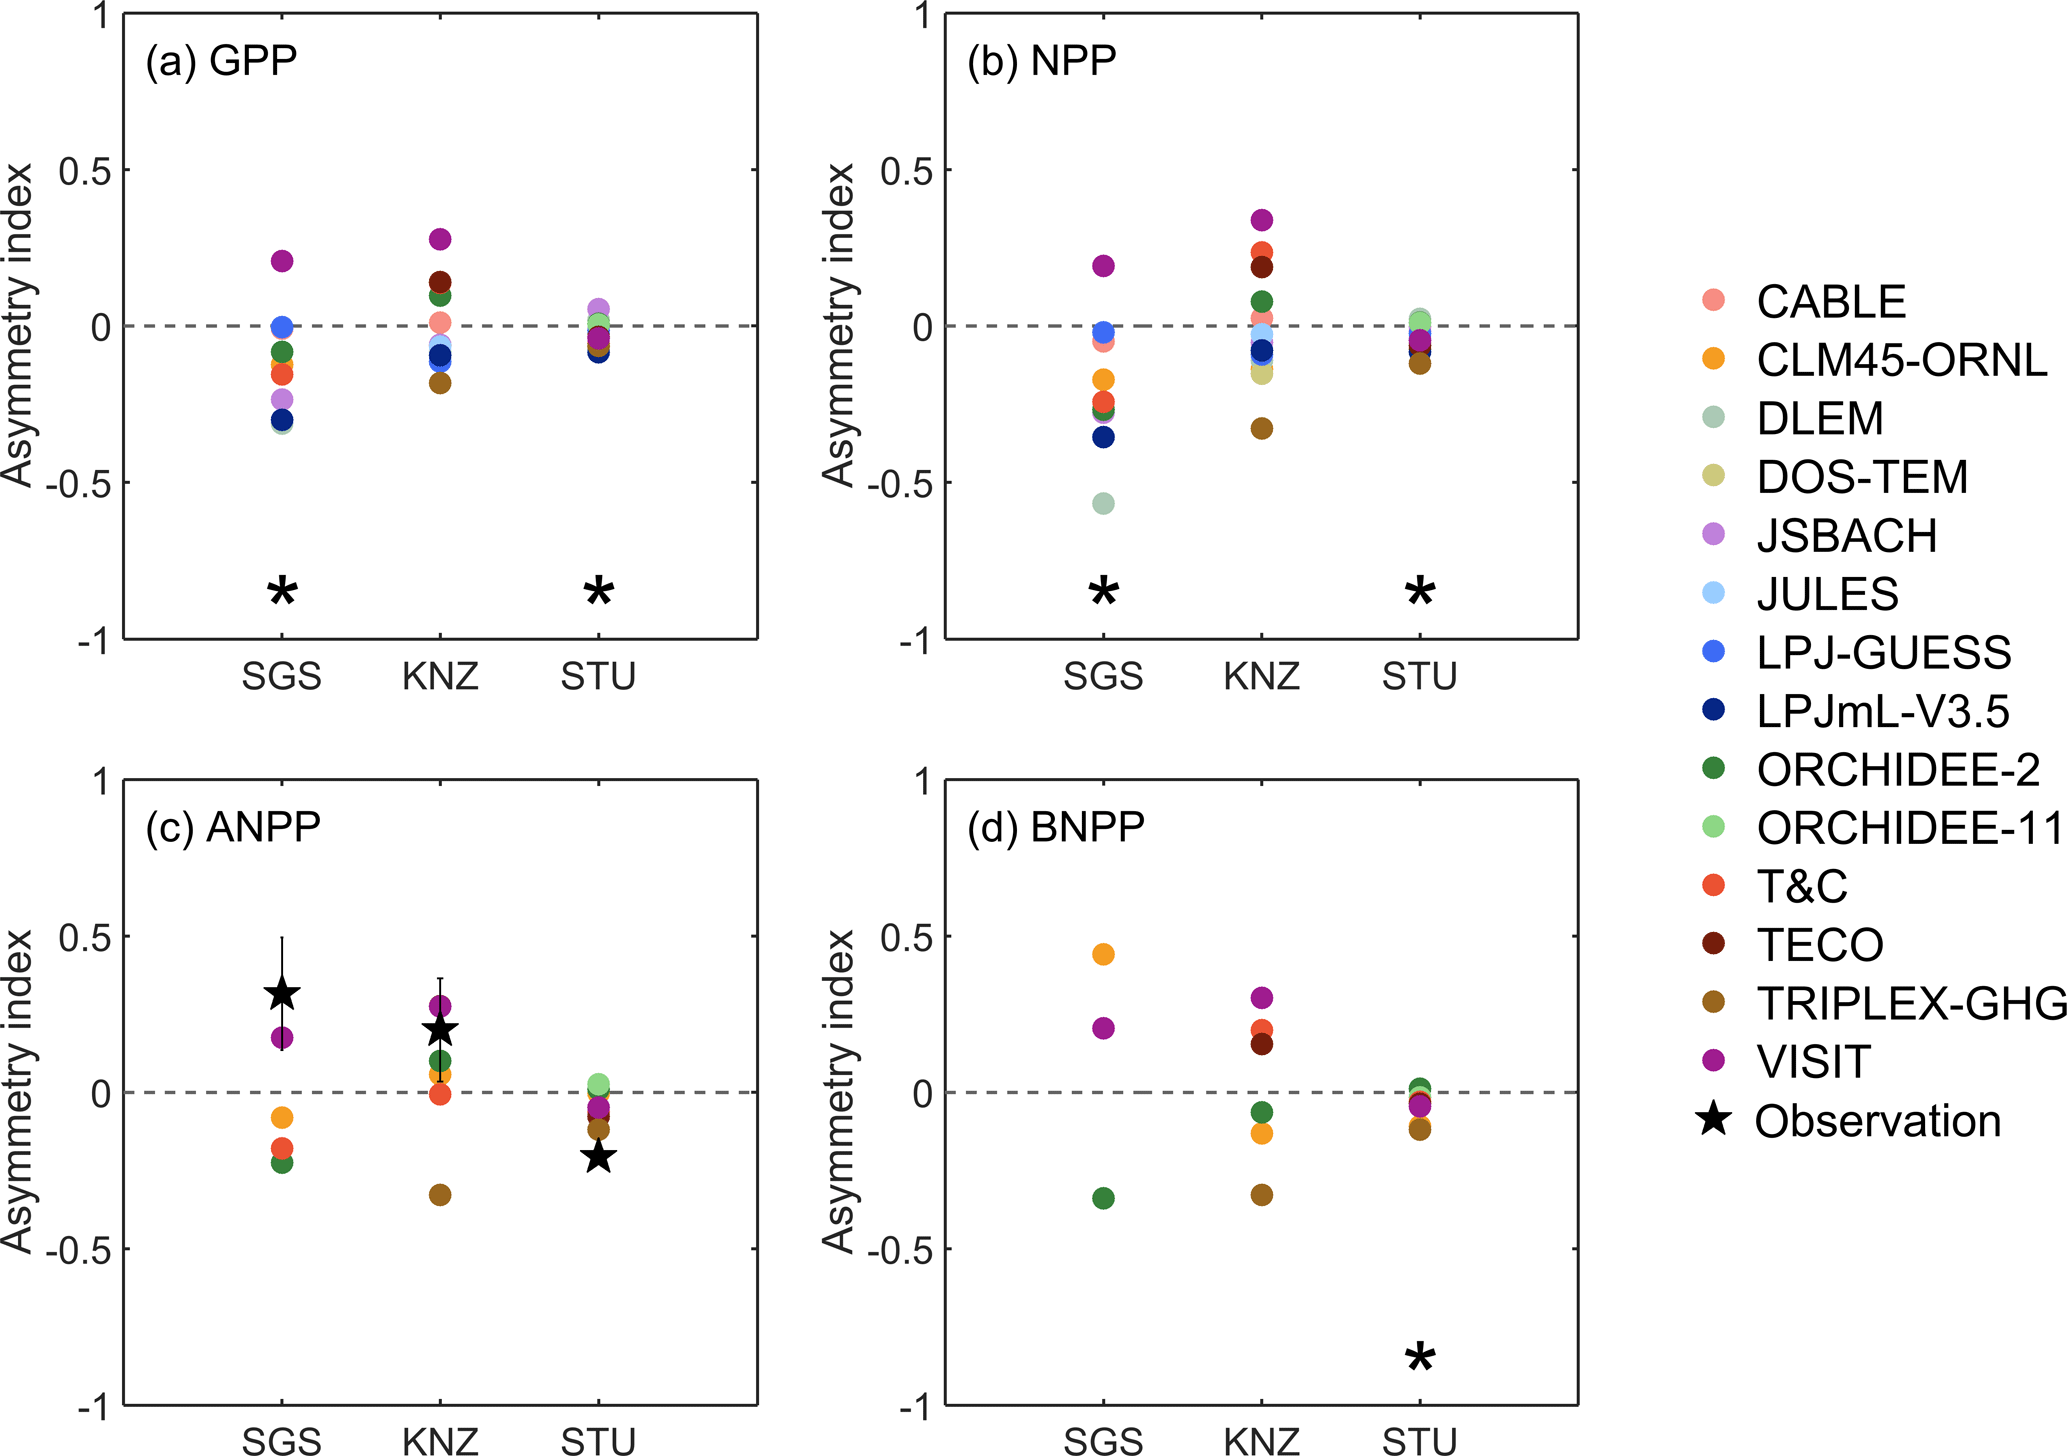
Figure 2Asymmetry responses of inter-annual GPP (a), NPP (b), ANPP (c) and BNPP (d) to precipitation in ambient simulations at the three sites SGS, KNZ and STU. The asymmetry index was calculated as the difference between the relative productivity pulses (Rp) and declines (Rd) in wet years and dry years (see Eqs. 1–3). Black pentagrams in (c) represent asymmetry indices from observations. The corresponding black error bars represent the observed uncertainty ranges using Eqs. (4)–(6). A black asterisk at the bottom of a panel indicates a significant asymmetry response of the model ensemble at a 0.1 significance level by a non-parametric statistical hypothesis test (Wilcoxon signed-rank test).
3.1 Temporal versus spatial slopes of productivity–P
From the ambient simulations, ensemble model results indicate that the slopes of the spatial relationships were steeper than the temporal slopes for GPP, NPP and ANPP for the subset of models that simulated this flux, while these differences in slopes were less obvious for BNPP (Fig. 1). We compared model results with site observations for ANPP–P temporal slopes of the ambient simulation across the three sites (Fig. 1c). Observed and modeled temporal slopes decreased from the dry (SGS) to moist (STU) site, from 0.10 g C m−2 mm−1 (0.05 to 0.14 for the 10th and 90th percentiles) to 0.05 g C m−2 mm−1 (−0.14 to 0.55 for the 10th and 90th percentiles) in the observations, and from 0.14 g C m−2 mm−1 (0.02 to 0.36 for the 10th and 90th percentiles) to 0.03 g C m−2 mm−1 (−0.04 to 0.29 for the 10th and 90th percentiles) for the model ensemble mean. Although there were some discrepancies in the range of spatial and temporal slopes across models (Fig. S1 in the Supplement), the multi-model ensemble mean captured the key observation of spatial slopes steeper than temporal slopes for ANPP (Fig. 1).
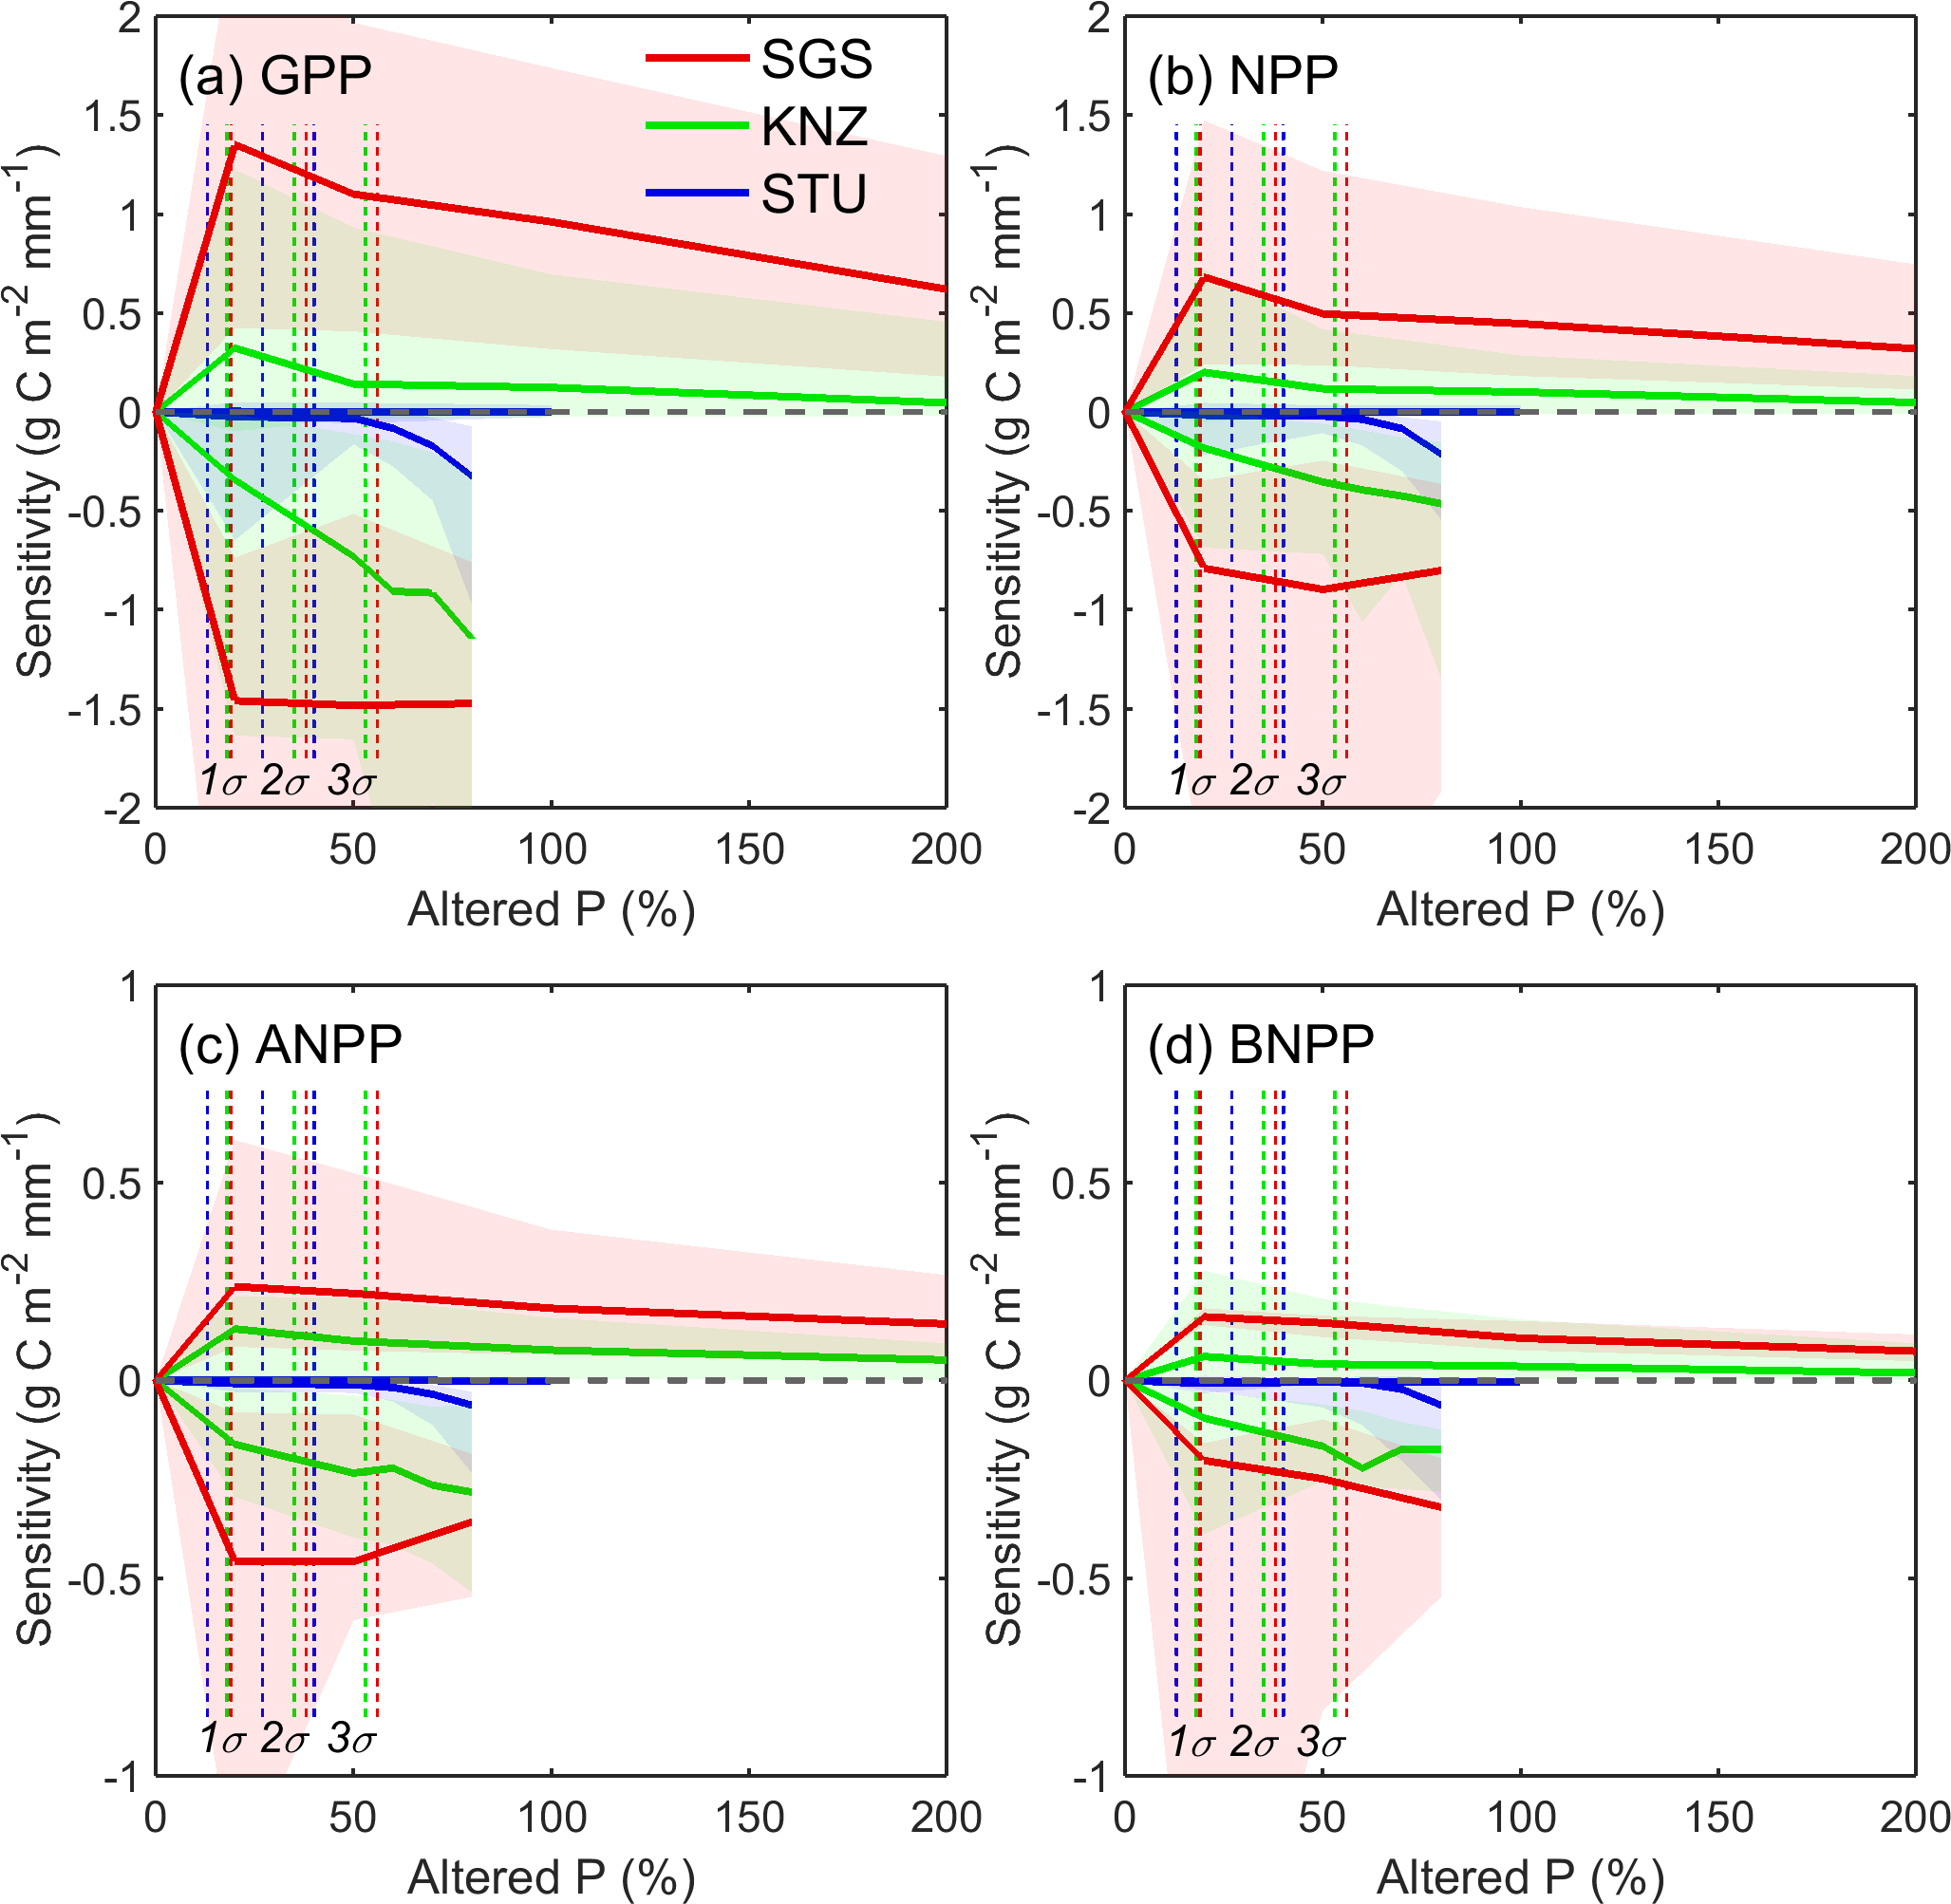
Figure 3Sensitivity of GPP (a), NPP (b), ANPP (c) and BNPP (d) for altered precipitation simulations at the three sites SGS, KNZ and STU. Curves show the ensemble mean of models, and the shading represents the model uncertainty range using the interquartile spread of the sensitivities between individual simulations (10th and 90th percentiles). Curves above the zero line represent responses under increasing precipitation conditions relative to the control, and curves below the zero line show responses under decreasing precipitation conditions relative to the control. Vertical dashed lines represent precipitation variations of 1 standard deviation (1σ), 2 standard deviations (2σ) and 3 standard deviations (3σ), which were derived from long-term annual precipitation at the three sites respectively.
3.2 Asymmetry of the inter-annual primary productivity response to precipitation
The asymmetry of each model was diagnosed using the asymmetry index (Eq. 1), which showed large variation across models (Figs. 2, S2). Considering all the models as independent ensemble members, the mean AI of GPP and NPP showed significantly negative values at p < 0.1 level for SGS (ensemble value of −0.11 and −0.20 respectively with 10th and 90th percentiles). Hence, for SGS simulated declines of GPP and NPP in dry years were larger than the increases in wet years. For STU, the mean AI values were only slightly negative (ensemble value for GPP −0.03 and for NPP −0.04 with 10th and 90th percentiles), while AI was very close to zero at KNZ. By contrast, observation-based AI values, estimated from long-term inter-annual ANPP measurements, suggest a decrease from positive ( for SGS and 0.20 for KNZ) to negative (−0.21 for STU). At the dry (SGS) and mesic (KNZ) sites (Fig. S2), most of the model simulations overestimated the extent of negative drought effects in dry years (Rd) and/or underestimated the positive impacts on ANPP in wet years (Rp). For example, CABLE and ORCHIDEE-2 overestimated the drought effects in dry years at both of the two sites, and CLM45-ORNL and VISIT underestimated the positive impacts in wet years at both of the two sites (Fig. S2). At the moist site (STU), models agreed with observations regarding the negative sign of AI (negative asymmetry) but AI magnitude is not well captured.
3.3 Sensitivities of primary productivity to altered precipitation
The model-derived sensitivities given by Eq. (7) generally presented greater negative impacts of reduced precipitation than positive effects of increased precipitation under both normal (inter-annual) and extreme conditions (Fig. 3). The results also indicated that models represented a constant asymmetry pattern (negative asymmetry under normal and extreme conditions) across the full range of altered precipitation rather than a double asymmetry pattern (positive asymmetry under normal condition and negative asymmetry under extreme condition) established by Knapp et al. (2017b), which confirmed that models did not capture the positive asymmetric responses of productivities to altered precipitation under normal conditions for the dry (SGS) and mesic (KNZ) sites.
Primary productivity at the dry site (SGS) was more sensitive to precipitation changes compared to the moist site (STU). Along with increases in precipitation, the largest sensitivity values were found for SGS (ensemble mean of g C m−2 mm−1 for GPP with 10th and 90th percentiles, g C m−2 mm−1 for NPP, g C m−2 mm−1 for ANPP and g C m−2 mm−1 for BNPP) and then KNZ ( g C m−2 mm−1 for GPP, g C m−2 mm−1 for NPP, g C m−2 mm−1 ANPP and g C m−2 mm−1 for BNPP with 10th and 90th percentiles) when precipitation was altered by +20 %. The values of S decreased with further increased precipitation, indicating that additional water does not increase productivity in the same proportion exceeding a certain threshold. In contrast to SGS, the values of sensitivity for both GPP and NPP at STU are close to zero in response to added precipitation conditions, implying that the precipitation above ambient was not a limiting factor for grassland production in the models at this site.
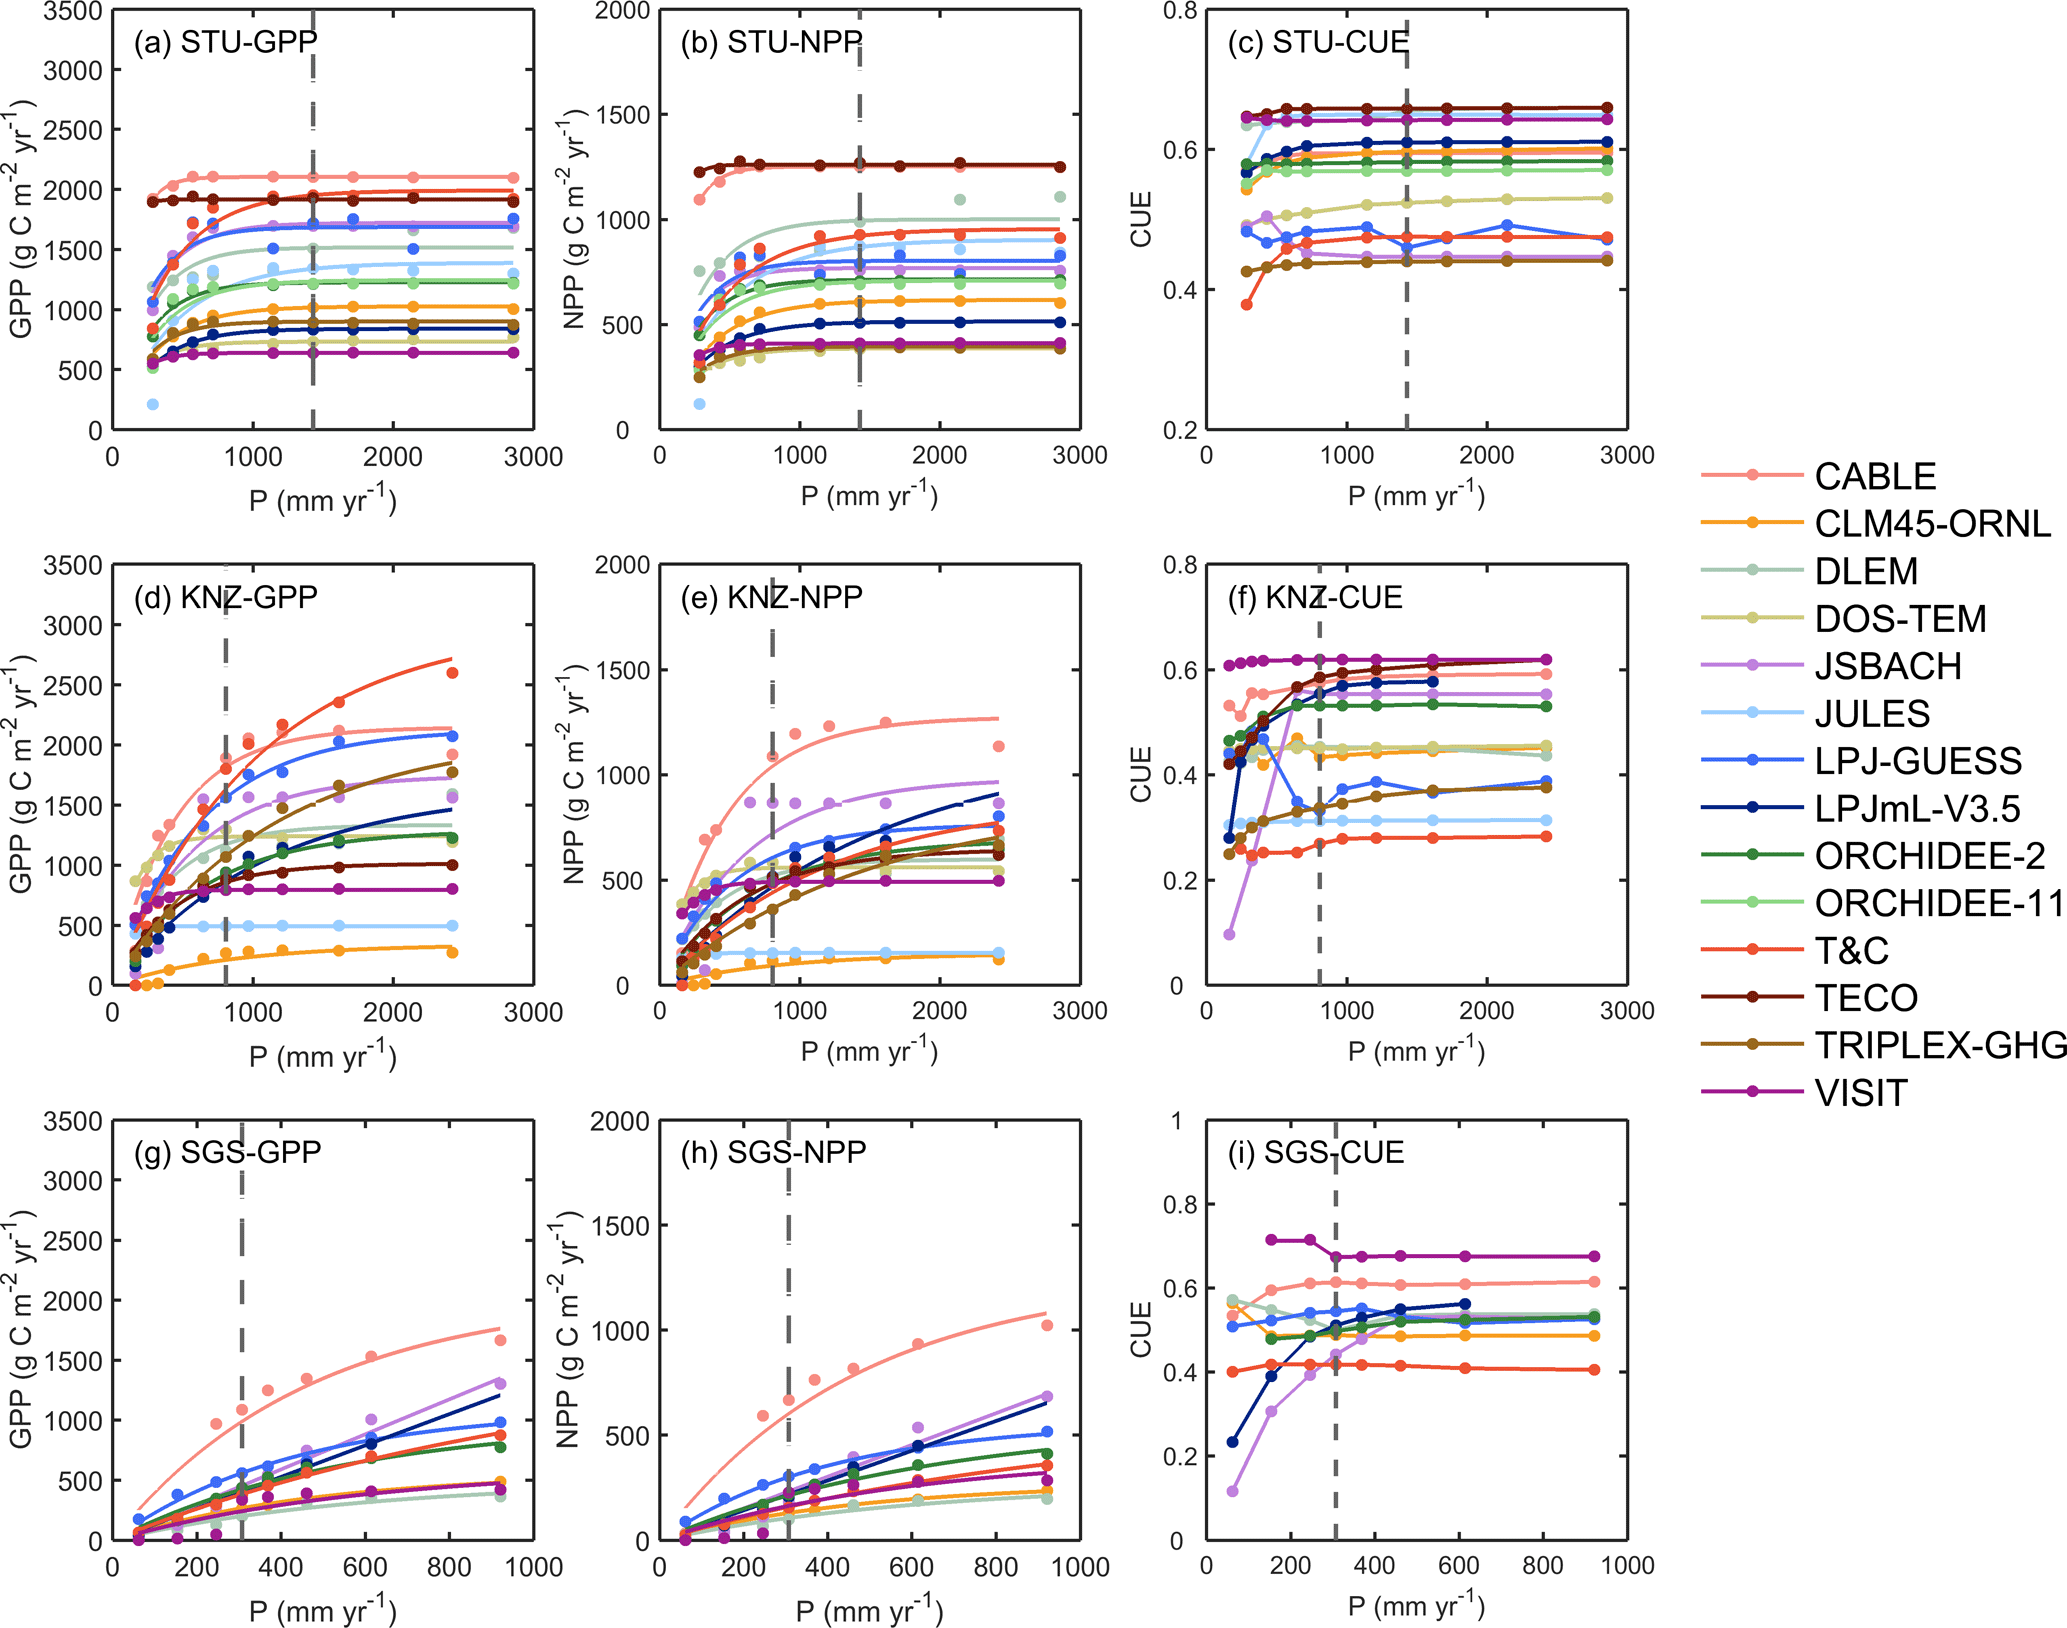
Figure 4Responses of simulated annual GPP (a, d, g), NPP (b, e, h) and CUE (NPP/GPP; c, f, i) to altered and ambient precipitation (P) levels at the three sites STU, KNZ and SGS. The fitted equation is Eq. (8) for GPP and NPP (see Fig. S3 for fitted a and b). The grey dashed line represents ambient precipitation. It should be noted that the x-axis scales are different between the sites.
The values of sensitivity decreased with reduced precipitation at KNZ and SGS, indicating larger negative impacts on primary productivity when conditions become drier. For the moist site of STU, primary productivities showed less sensitivity to moderately dry conditions, and sensitivity only increased with more extreme rainfall alterations out of 3σ (∼ 40 % precipitation change). Additionally, the values of S for ANPP were smaller than those of BNPP at KNZ and SGS, while there were no differences between ANPP and BNPP at STU (Fig. 3). Thus, model results suggest that the dry site (SGS) can be particularly vulnerable to altered rainfall compared to the moist site (STU), which was more robust in response to altered rainfall.
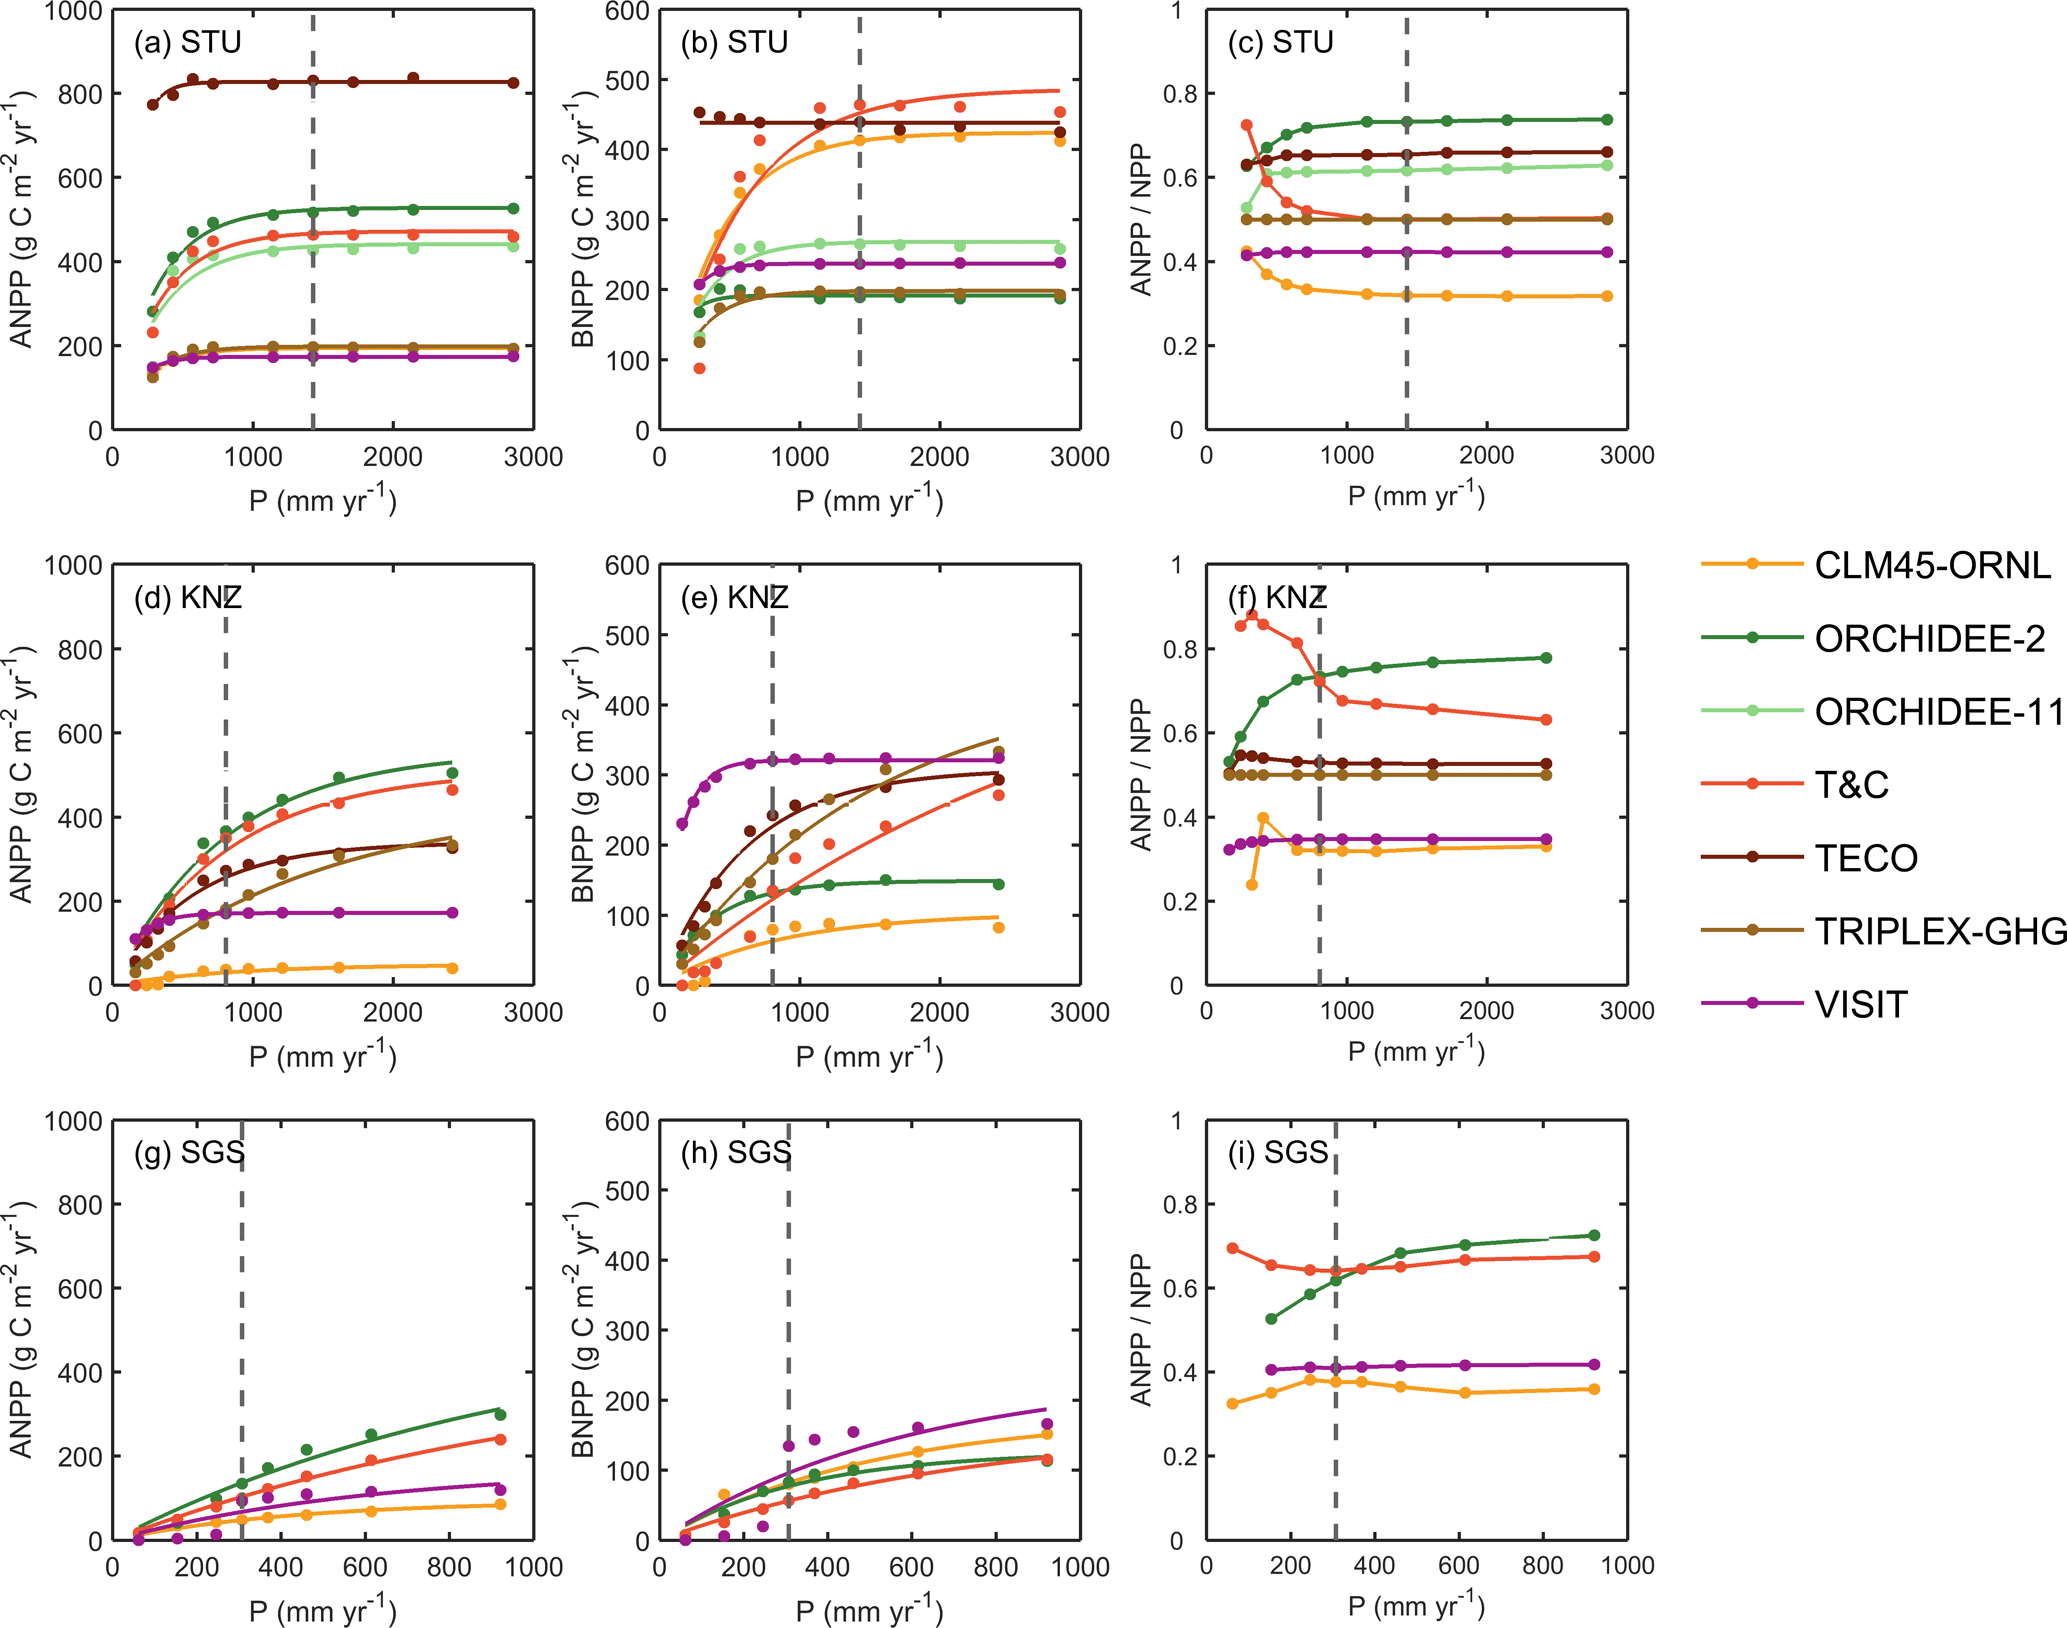
Figure 5Responses of simulated annual ANPP (a, d, g), BNPP (b, e, h), and the ratio of ANPP and NPP (c, f, i) to altered and ambient precipitation (P) levels at the three sites STU, KNZ and SGS. The fitted equation is Eq. (8) for ANPP and BNPP (see Fig. S4 for fitted a and b). The grey dashed line represents ambient precipitation. It should be noted that the x-axis scales are different between the sites.
3.4 Curvilinear responses of productivity to altered precipitation
At SGS and KNZ, simulated GPP and NPP increased with increasing precipitation. In contrast, at the moist STU, most models showed saturation in productivity for precipitation above ambient values (Fig. 4). Along with increasing precipitation, GPP and NPP showed nonlinear concave-down response curves in all models, with different curvatures b and maximum productivity a (Fig. S3). The ensemble mean values of the curvature parameter b fitted from Eq. (8) to each modeled GPP across the full range of altered precipitation are × 10−3 mm−1 at STU, × 10−3 mm−1 at KNZ and × 10−3 mm−1 at SGS with 10th and 90th percentiles (Fig. S3).
The responses of GPP and NPP to altered precipitation were proportional to each other for each model, and as a result changes in carbon use efficiency (CUE) were very small compared to the background CUE differences diagnosed in the ambient simulation (Fig. 4c, f, i). However, JSBACH and LPJmL-V3.5 produced a sharp decline of CUE below ambient precipitation at SGS and KNZ.
Only seven models simulated ANPP and BNPP separately (Fig. 5). The responses of ANPP and BNPP to altered precipitation were similar to those of GPP and NPP. When fitting Eq. (8) to ANPP–P (Fig. S4), the curvatures b ranged from 3.0 × 10⁻³ mm−1 (ORCHIDEE-11) to 9.2 × 10⁻³ mm−1 (TECO) at STU, from 0.7 × 10⁻³ mm−1 (TRIPLEX-GHG) to 6.1 × 10⁻³ mm−1 (VISIT) at KNZ, and from 0.9 × 10⁻³ mm−1 (T&C) to 2.3 × 10⁻³ mm−1 (CLM45-ORNL) at SGS; the modeled maximum values a for ANPP ranged between 173 g C m−2 yr−1 (VISIT) and 827 g C m−2 yr−1 (TECO) at STU, 49 g C m−2 yr−1 (CLM45-ORNL) and 557 g C m−2 yr−1 (ORCHIDEE-2) at KNZ, and 94 g C m−2 yr−1 (CLM45-ORNL) and 523 g C m−2 yr−1 (ORCHIDEE-2) at SGS.
The ANPP : NPP ratio, i.e., aboveground carbon allocation, showed a nonlinear increase (concave-down) with increasing precipitation in ORCHIDEE-2 and ORCHIDEE-11, a nonlinear decrease (concave-up) in T&C due to translocation of C reserves from roots and only minor changes in other models (Fig. 5c, f, i).
4.1 Comparison of modeled and observed responses of productivity to altered precipitation
Spatial slopes steeper than temporal slopes of ANPP to precipitation are usually explained by two hypotheses: (1) vegetation constraint effects on ANPP responses to precipitation play a more important role in the temporal as compared to the spatial domain (Knapp et al., 2017b; Estiarte et al., 2016); (2) biogeochemistry (mainly resource limitations) and confounding factors (e.g., temperature and radiation), rather than species attributes, constrain community-level ANPP in response to precipitation (Huxman et al., 2004). Thus, the former theory stresses more long-term intrinsic ecosystem properties, while the latter underlines the effects of external environmental factors. The current models tested here captured the relative magnitude of the difference between temporal and spatial slopes (Fig. 1c), which suggested that the models adequately considered the key processes underlying carbon–water interactions across different grassland sites. Only few grassland experiments have assessed BNPP (Luo et al., 2017), leaving the question open of whether the minor differences between temporal and spatial slopes for BNPP responses to precipitation as simulated by the models correspond to experimental observations (Fig. 1d).
The asymmetry index obtained from available long-term ANPP and precipitation observations reported positive values at SGS and KNZ (Fig. 2c), which suggested greater declines of ANPP in dry years than increases in wet years (Knapp and Smith, 2001). Knapp et al. (2017b) proposed the following underlying mechanisms. (1) In dry years, the carryover effects of soil moisture from previous years alleviate strong declines of ANPP (Sala et al., 2012), which is usually treated as a time-lag effect (Petrie et al., 2018; Wu et al., 2015). Additionally, rain use efficiency also increases with water scarcity, meaning that less water is lost through runoff (Gutschick and BassiriRad, 2003; Huxman et al., 2004). (2) In wet years, other resources such as nutrient availability may increase with increasing precipitation, contributing to a supplementary increase of ANPP (Knapp et al., 2017b; Seastedt and Knapp, 1993). In contrast, the negative asymmetry index derived from observations at the moist STU suggests that this process is not dominant for this site, while temperature and/or light limitations that are associated with rainy periods may become important during wet years and neutralize the effect of increased precipitation on ANPP (Fig. S4) (Nemani et al., 2003; Wu et al., 2015; Wohlfahrt et al., 2008).
In our results, most models did not capture the sign of observed asymmetry indices across the three sites (Fig. 2c), which suggests that some of the underlying processes (combined carbon–nutrient interactions, time-lag effects, dynamic root growth allowing variation in accessible soil water) are not accurately represented in the models. For example, grassland root depth affects ecosystem resilience to environmental stress such as drought, and arid and semi-arid grasses that have extensive lateral roots or possibly deep roots show relatively strong resistance (Fan et al., 2017). However, most models currently consider only two types of grasslands – C3 and C4 (Table S14), with fixed root fractions in each prescribed soil layers (Table S13). This is potentially unrealistic for semi-arid grass roots and can lead to underestimating the amount of soil water available to plants and their resistance to drought. The latter is a key candidate especially for explaining the negative asymmetry index at the dry SGS.
The sensitivity of productivity to increased and decreased precipitation for simulations where mean precipitation was normally altered generally suggested negative asymmetric responses at dry (SGS) and mesic (KNZ) sites (Fig. 3c). This contrasts with a meta-analysis of grassland precipitation manipulation experiments (Wilcox et al., 2017) and with the ANPP–P conceptual model (Knapp et al., 2017b), which suggest a positive asymmetry response in the range of normal rainfall variation. This emphasizes the finding that most models overestimate drought effects and/or underestimate wet year impacts on primary productivity of dry and mesic sites for current precipitation variability. Under extreme conditions with modified precipitation, models were in line with the hypothesis and the data showing that ANPP saturates in very wet conditions but declines strongly in very dry conditions (Knapp et al., 2017b). For BNPP sensitivities to altered precipitation, meta-analysis of previous experiments indicated symmetric responses to increasing and decreasing rainfall (Luo et al., 2017; Wilcox et al., 2017), which may be regulated by allocation controls on the ratio of ANPP and BNPP to total NPP in response to altered precipitation. However, in the participating models, BNPP shows a negative asymmetric response to altered rainfall (Fig. 3d), which may reflect a shortcoming of carbon–water interactions in the belowground ecosystems.
4.2 Curvilinear responses of productivities to altered precipitation by models
In general, precipitation in ecosystem models is distributed through three pathways (N. G. Smith et al., 2014): (1) intercepted by vegetation and subsequently evaporated or falling on the ground; (2) infiltrated into the upper soil layers with subsequent evaporation, root water uptake and plant transpiration, or percolated down to deeper layers to form ground water; (3) runoff from the soil surface if the intensity of precipitation exceeds infiltration rates. In reality as well as in models, soil moisture rather than precipitation is the variable regulating vegetation growth, and biological responses to changes in precipitation are manifested as functions of soil moisture in different soil layers (Sitch et al., 2003; N. G. Smith et al., 2014; Vicca et al., 2012). We calculated the surface soil water content (SSWC, 0–20 cm depth converted from reported soil layers) and total soil water content (TSWC) under ambient and altered precipitation as simulated by the 14 models, and we found different patterns with parabolic, asymptotic and threshold-like nonlinear curves, which is similar to the response curves of primary productivity at the three sites (Figs. S5, S6). For the moist STU, SSWC and TWSC did not show obvious changes in response to increased precipitation since soil moisture at this site is often relatively near field capacity, while the SSWC and TSWC quickly decreased with decreasing in precipitation (Figs. S5, S6). In contrast, SSWC and TSWC at SGS showed significant increases in response to altered increased precipitation and slow decreases for decreased precipitation, because the soil was already very dry under average ambient conditions. Thus, changes of SWC in response to precipitation contribute to driving the different response patterns of simulated primary productivity across the grassland sites.
The responses of primary productivity to precipitation in models might also be driven by the intrinsic structure and parameterizations of vegetation functioning besides changes of soil moisture (Gerten et al., 2008), which account for the large spread in the values of b and a among models at the three sites (Figs. 4, 5, S3, S4). For example, carbon–nitrogen cycle coupling in ecosystem models reduced the simulated vegetation productivity relative to a carbon-only counterpart model (Thornton et al., 2007; Zaehle et al., 2010). Of those models used in this study, only five of the 14 models include carbon–nitrogen–water interactions (Tables 2, S1, S2). We calculated the ensemble mean of productivity for this group of carbon–nitrogen models (CLM45-ORNL, DLEM, DOS-TEM, LPJ-GUESS and TRIPLEX-GHG) and carbon-only models (CABLE, JSBACH, JULES, LPJmL-V3.5, ORCHIDEE-2, ORCHIDEE-11, T&C, TECO and VISIT) across altered and ambient precipitation simulations at the three sites, and then fitted the productivity–P responses with Eq. (8) (Figs. S7, S8, S9). We found that ensemble mean of carbon–nitrogen models generally produce a weaker GPP, NPP and ANPP response to precipitation than ensemble mean of carbon-only models and similar responses for BNPP. The latter may be explained by fixed root profiles in most models (Table S13). Our findings suggest that N interactions in ecosystem models reduced the productivity–P sensitivities, but should be confirmed using the same model prescribed with different N availability. In addition to the influence of nutrient cycling, different definitions of vegetation compositions (C3/C4) (Table S14), root profiles (Table S13), phenology (Table S9) and carbon allocation (Table S4) at the three sites may also contribute to the large variations of modeled productivity–P responses and demands for more accurate calibration of models to the specificity of the local sites in future model intercomparison studies.
4.3 Uncertainties, knowledge gaps and suggestions of further work
In this work, we applied two indices to characterize the asymmetry responses in the normal precipitation range using inter-annual variability of present conditions and forcing models with continuously modified precipitation amounts. Asymmetry indices from the inter-annual gross and net primary productivities suggest large uncertainties (Fig. 2), while the sensitivity analysis to changes in mean precipitation reported clear responses (Fig. 3). This can be explained by the differences in other climatic factors (for example, temperature, radiation and vapor pressure), or timing and frequency of precipitation between dry and wet years. All these uncontrolled factors may contribute to the large uncertainties of asymmetric responses from inter-annual variations (Chou et al., 2008; Peng et al., 2013; Robertson et al., 2009).
Although the carbon–water interactions in current models have been improved during the last decades, there still exist large gaps for accurately diagnosing the errors in the representation of key processes and parameterizations. Suggestions that should be considered in future studies aimed at model–data interaction include the following. (1) Models should report SWC at the same depth of experiments and experimental data should be made available for better comparisons in following studies. This can provide insights into the bias of modeled sensitivities to precipitation and check explicitly the sensitivity of vegetation productivity to change in SWC. (2) More experiments are needed that assess also BNPP in order to evaluate the corresponding processes in models (Luo et al., 2017; Wilcox et al., 2017). (3) There still exist large gaps between changes of precipitation occurrence and intensity in reality and how we simulated them in the current work, i.e., the altered rainfall forcing datasets were constructed by decreasing or increasing the amount of precipitation in each precipitation event by a fixed percentage during the time span of productivity observations at each site and not by modifying precipitation structure or reproducing the real treatment. Further studies need to consider better different scenarios of precipitation occurrence and intensity under climate change (Lauenroth and Bradford, 2012), which will likely help to better understand the responses of productivities to altered precipitation in the next decades. In addition, modelers will need to simulate the control experiments corresponding to the real local precipitation manipulations applied by field scientists, e.g., considering the observed time series of modified precipitation and vegetation composition, root profiles, nutrient cycling, phenology and carbon allocation as close as possible to local conditions. This should be a priority for future model–experiment interaction studies.
This is the first study where a large group of modelers simulated the response of grassland primary productivity to precipitation using long-term observations for evaluating the asymmetry responses to altered precipitation. Our results demonstrated that the multi-model ensemble mean captured the key observation of spatial slopes steeper than temporal slopes for ANPP. On the other hand, our analyses revealed that most models do not capture the observed positive asymmetry responses for the dry (SGS) and mesic (KNZ) sites under the normal precipitation conditions, suggesting an overestimation of the drought effects and/or underestimation of the watering impacts on primary productivity in the normal state. In general, current models represented a constant asymmetry pattern (negative asymmetry under normal and extreme conditions) across the full range of altered precipitation rather than a double asymmetry pattern (positive asymmetry under normal condition and negative asymmetry under extreme condition) established by Knapp et al. (2017b).
This study paves the path for further analyses where collaboration between modelers and site investigators needs to be strengthened such that also data other than ANPP can be considered and to identify which specific processes in ecosystem models are responsible for the observed discrepancies. This will eventually allow us to produce more reliable carbon-climate projections when facing different precipitation patterns in the future.
All the modeled outputs in the first model–experiment interaction study can be publicly obtained from https://pan.baidu.com/s/1CXAnStQMBD_4a0tLGiIpiQ (last access: 6 June 2018).
The supplement related to this article is available online at: https://doi.org/10.5194/bg-15-3421-2018-supplement.
The authors declare that they have no conflict of interest.
This study was supported by National Natural Science Foundation of China
(41530528). PC was supported by the European Research Council Synergy project
SyG-2013-610028 IMBALANCE-P.
The field work at Stubai was funded by the EU FP7 project Carbo-Extreme and
the Austrian Science Fund (FWF); the synthesis and contribution to the
manuscript was supported by the Austrian Academy of Sciences (ClimLUC). We
also acknowledge support from the ClimMani COST action (ES1308). Sara Vicca
is a postdoctoral fellow of the Fund for Scientific Research – Flanders.
Markus Kautz acknowledges support from the EU FP7 project LUC4C, grant
603542. We thank Jeffrey S. Dukes, Shiqiang Wan and the organizers of the
conference for the model–experiment interaction study in Beijing. We thank
Sibyll Schaphoff, Werner von Bloh, Susanne Rolinski and Kirsten Thonicke from
PIK as well as Matthias Forkel from TU Vienna for their support of the LPJmL
code. Jiafu Mao, Daniel Ricciuto and Xiaoying Shi were supported by the
Terrestrial Ecosystem Science Scientific Focus Area (TES SFA) project funded
through the Terrestrial Ecosystem Science Program in the Climate and
Environmental Sciences Division (CESD) of the Biological and Environmental
Research (BER) Program in the US Department of Energy Office of Science. The
simulations of CLM4.5 used resources of the Oak Ridge Leadership Computing
Facility at the Oak Ridge National Laboratory, which is supported by the
Office of Science of the US Department of Energy under contract no.
DE-AC05-00OR22725.
Edited by: Trevor
Keenan
Reviewed by: two anonymous referees
Bahn, M., Knapp, M., Garajova, Z., Pfahringer, N., and Cernusca, A.: Root respiration in temperate mountain grasslands differing in land use, Glob. Change Biol., 12, 995–1006, https://doi.org/10.1111/j.1365-2486.2006.01144.x, 2006.
Bahn, M., Rodeghiero, M., Anderson-Dunn, M., Dore, S., Gimeno, C., Drösler, M., Williams, M., Ammann, C., Berninger, F., and Flechard, C.: Soil respiration in European grasslands in relation to climate and assimilate supply, Ecosystems, 11, 1352–1367, https://doi.org/10.1007/S10021-008-9198-0, 2008.
Bai, Y., Wu, J., Xing, Q., Pan, Q., Huang, J., Yang, D., and Han, X.: Primary production and rain use efficiency across a precipitation gradient on the Mongolia plateau, Ecology, 89, 2140–2153, https://doi.org/10.1890/07-0992.1, 2008.
Beer, C., Reichstein, M., Tomelleri, E., Ciais, P., Jung, M., Carvalhais, N., Rödenbeck, C., Arain, M. A., Baldocchi, D., Bonan, G. B., Bondeau, A., Cescatti, A., Lasslop, G., Lindroth, A., Lomas, M., Luyssaert, S., Margolis, H., Oleson, K. W., Roupsard, O., Veenendaal, E., Viovy, N., Williams, C., Woodward, F. I., and Papale, D.: Terrestrial Gross Carbon Dioxide Uptake: Global Distribution and Covariation with Climate, Science, 329, 834–838, https://doi.org/10.1126/science.1184984, 2010.
Best, M. J., Pryor, M., Clark, D. B., Rooney, G. G., Essery, R. L. H., Ménard, C. B., Edwards, J. M., Hendry, M. A., Porson, A., Gedney, N., Mercado, L. M., Sitch, S., Blyth, E., Boucher, O., Cox, P. M., Grimmond, C. S. B., and Harding, R. J.: The Joint UK Land Environment Simulator (JULES), model description – Part 1: Energy and water fluxes, Geosci. Model Dev., 4, 677–699, https://doi.org/10.5194/gmd-4-677-2011, 2011.
Bondeau, A., Smith, P. C., Zaehle, S., Schaphoff, S., Lucht, W., Cramer, W., Gerten, D., Lotze-Campen, H., Müller, C., and Reichstein, M.: Modelling the role of agriculture for the 20th century global terrestrial carbon balance, Glob. Change Biol., 13, 679–706, https://doi.org/10.1111/j.1365-2486.2006.01305.x, 2007.
Briggs, J. M., Knapp, A. K., Blair, J. M., Heisler, J. L., Hoch, G. A., Lett, M. S., and McCarron, J. K.: An ecosystem in transition: causes and consequences of the conversion of mesic grassland to shrubland, BioScience, 55, 243–254, https://doi.org/10.1641/0006-3568(2005)055[0243:AEITCA]2.0.CO;2, 2005.
Chapin III, F. S., Matson, P. A., and Vitousek, P.: Principles of terrestrial ecosystem ecology, Springer Science & Business Media, New York, 2011.
Chou, W. W., Silver, W. L., Jackson, R. D., Thompson, A. W., and Allen-Diaz, B.: The sensitivity of annual grassland carbon cycling to the quantity and timing of rainfall, Glob. Change Biol., 14, 1382–1394, https://doi.org/10.1111/j.1365-2486.2008.01572.x, 2008.
Clark, D. B., Mercado, L. M., Sitch, S., Jones, C. D., Gedney, N., Best, M. J., Pryor, M., Rooney, G. G., Essery, R. L. H., Blyth, E., Boucher, O., Harding, R. J., Huntingford, C., and Cox, P. M.: The Joint UK Land Environment Simulator (JULES), model description – Part 2: Carbon fluxes and vegetation dynamics, Geosci. Model Dev., 4, 701–722, https://doi.org/10.5194/gmd-4-701-2011, 2011.
Donat, M. G., Lowry, A. L., Alexander, L. V., Ogorman, P. A., and Maher, N.: More extreme precipitation in the world's dry and wet regions, Nature Clim. Change, 6, 508–513, https://doi.org/10.1038/NCLIMATE2941, 2016.
Estiarte, M., Vicca, S., Peñuelas, J., Bahn, M., Beier, C., Emmett, B. A., Fay, P. A., Hanson, P. J., Hasibeder, R., Kigel, J., Kröel-Dulay, G., Larsen, K. S., Lellei-Kovács, E., Limousin, J.-M., Ogaya, R., Ourcival, J.-M., Reinsch, S., Sala, O. E., Schmidt, I. K., Sternberg, M., Tielbörger, K., Tietema, A., and Janssens, I. A.: Few multiyear precipitation-reduction experiments find a shift in the productivity-precipitation relationship, Glob. Change Biol., 22, 2570–2581, https://doi.org/10.1111/gcb.13269, 2016.
Fan, Y., Miguez-Macho, G., Jobbágy, E. G., Jackson, R. B., and Otero-Casal, C.: Hydrologic regulation of plant rooting depth, P. Natl. Acad. Sci. USA, 114, 10572–10577, https://doi.org/10.1073/pnas.1712381114, 2017.
Fatichi, S. and Ivanov, V. Y.: Interannual variability of evapotranspiration and vegetation productivity, Water Resour. Res., 50, 3275–3294, https://doi.org/10.1002/2013WR015044, 2014.
Fatichi, S., Ivanov, V., and Caporali, E.: A mechanistic ecohydrological model to investigate complex interactions in cold and warm water-controlled environments: 1. Theoretical framework and plot-scale analysis, J. Adv. Model. Earth Sy., 4, 1–31, https://doi.org/10.1029/2011MS000086, 2012.
Fatichi, S., Leuzinger, S., Paschalis, A., Langley, J. A., Donnellan Barraclough, A., and Hovenden, M. J.: Partitioning direct and indirect effects reveals the response of water-limited ecosystems to elevated CO2, P. Natl. Acad. Sci. USA, 113, 12757–12762, https://doi.org/10.1073/pnas.1605036113, 2016.
Fischer, E. M. and Knutti, R.: Observed heavy precipitation increase confirms theory and early models, Nature Clim. Change, 6, 986–991, https://doi.org/10.1038/NCLIMATE3110, 2016.
Gerten, D., Luo, Y., Le Maire, G., Parton, W. J., Keough, C., Weng, E., Beier, C., Ciais, P., Cramer, W., Dukes, J. S., Hanson, P. J., Knapp, A. A. K., Linder, S., Nepstad, D. A. N., Rustad, L., and Sowerby, A.: Modelled effects of precipitation on ecosystem carbon and water dynamics in different climatic zones, Glob. Change Biol., 14, 2365–2379, https://doi.org/10.1111/j.1365-2486.2008.01651.x, 2008.
Gherardi, L. A. and Sala, O. E.: Enhanced precipitation variability decreases grass-and increases shrub-productivity, P. Natl. Acad. Sci. USA, 112, 12735–12740, https://doi.org/10.1073/pnas.1506433112, 2015.
Gutschick, V. P. and BassiriRad, H.: Extreme events as shaping physiology, ecology, and evolution of plants: toward a unified definition and evaluation of their consequences, New Phytol., 160, 21–42, https://doi.org/10.1046/j.1469-8137.2003.00866.x, 2003.
Heisler-White, J. L., Blair, J. M., Kelly, E. F., Harmoney, K., and Knapp, A. K.: Contingent productivity responses to more extreme rainfall regimes across a grassland biome, Glob. Change Biol., 15, 2894–2904, https://doi.org/10.1111/j.1365-2486.2009.01961.x, 2009.
Hoover, D. and Rogers, B.: Not all droughts are created equal: the impacts of interannual drought pattern and magnitude on grassland carbon cycling, Glob. Change Biol., 22, 1809–1820, https://doi.org/10.1111/gcb.13161, 2016.
Hoover, D. L., Knapp, A. K., and Smith, M. D.: Resistance and resilience of a grassland ecosystem to climate extremes, Ecology, 95, 2646–2656, https://doi.org/10.1890/13-2186.1, 2014.
Hsu, J. S., Powell, J., and Adler, P. B.: Sensitivity of mean annual primary production to precipitation, Glob. Change Biol., 18, 2246–2255, https://doi.org/10.1111/j.1365-2486.2012.02687.x, 2012.
Huxman, T. E., Smith, M. D., Fay, P. A., Knapp, A. K., Shaw, M. R., Loik, M. E., Smith, S. D., Tissue, D. T., Zak, J. C., Weltzin, J. F., Pockman, W. T., Sala, O. E., Haddad, B. M., Harte, J., Koch, G. W., Schwinning, S., Small, E. E., and Williams, D. G.: Convergence across biomes to a common rain-use efficiency, Nature, 429, 651–654, https://doi.org/10.1038/nature02561, 2004.
Inatomi, M., Ito, A., Ishijima, K., and Murayama, S.: Greenhouse gas budget of a cool-temperate deciduous broad-leaved forest in Japan estimated using a process-based model, Ecosystems, 13, 472–483, https://doi.org/10.1007/s10021-010-9332-7, 2010.
Ingrisch, J., Karlowsky, S., Anadon-Rosell, A., Hasibeder, R., König, A., Augusti, A., Gleixner, G., and Bahn, M.: Land Use Alters the Drought Responses of Productivity and CO2 Fluxes in Mountain Grassland, Ecosystems, 21, 689–703, https://doi.org/10.1007/s10021-017-0178-0, 2017.
Ito, A.: Evaluation of the impacts of defoliation by tropical cyclones on a Japanese forest's carbon budget using flux data and a process-based model, J. Geophys. Res.-Biogeo., 115, 1–10, https://doi.org/10.1029/2010JG001314, 2010.
Jung, M., Reichstein, M., Schwalm, C. R., Huntingford, C., Sitch, S., Ahlström, A., Arneth, A., Camps-Valls, G., Ciais, P., Friedlingstein, P., Gans, F., Ichii, K., Jain, A. K., Kato, E., Papale, D., Poulter, B., Raduly, B., Rödenbeck, C., Tramontana, G., Viovy, N., Wang, Y.-P., Weber, U., Zaehle, S., and Zeng, N.: Compensatory water effects link yearly global land CO2 sink changes to temperature, Nature, 541, 516–520, https://doi.org/10.1038/nature20780, 2017.
Kaminski, T., Knorr, W., Schürmann, G., Scholze, M., Rayner, P., Zaehle, S., Blessing, S., Dorigo, W., Gayler, V., and Giering, R.: The BETHY/JSBACH carbon cycle data assimilation system: experiences and challenges, J. Geophys. Res.-Biogeo., 118, 1414–1426, https://doi.org/10.1002/jgrg.20118, 2013.
Karl, T. R. and Trenberth, K. E.: Modern Global Climate Change, Science, 302, 1719–1723, https://doi.org/10.1126/science.1090228, 2003.
Karlowsky, S., Augusti, A., Ingrisch, J., Hasibeder, R., Lange, M., Lavorel, S., Bahn, M., Gleixner, G., and Wurzburger, N.: Land use in mountain grasslands alters drought response and recovery of carbon allocation and plant-microbial interactions, J. Ecology, 106, 1230–1243, https://doi.org/10.1111/1365-2745.12910, 2018.
Knapp, A. K. and Smith, M. D.: Variation among Biomes in Temporal Dynamics of Aboveground Primary Production, Science, 291, 481–484, https://doi.org/10.1126/science.291.5503.481, 2001.
Knapp, A. K., Beier, C., Briske, D. D., Classen, A. T., Luo, Y., Reichstein, M., Smith, M. D., Smith, S. D., Bell, J. E., Fay, P. A., Heisler, J. L., Leavitt, S. W., Sherry, R., Smith, B., and Weng, E.: Consequences of More Extreme Precipitation Regimes for Terrestrial Ecosystems, BioScience, 58, 811–821, https://doi.org/10.1641/B580908, 2008.
Knapp, A. K., Carroll, C. J., Denton, E. M., La Pierre, K. J., Collins, S. L., and Smith, M. D.: Differential sensitivity to regional-scale drought in six central US grasslands, Oecologia, 177, 949–957, https://doi.org/10.1007/s00442-015-3233-6, 2015.
Knapp, A. K., Avolio, M. L., Beier, C., Carroll, C. J. W., Collins, S. L., Dukes, J. S., Fraser, L. H., Griffin-Nolan, R. J., Hoover, D. L., Jentsch, A., Loik, M. E., Phillips, R. P., Post, A. K., Sala, O. E., Slette, I. J., Yahdjian, L., and Smith, M. D.: Pushing precipitation to the extremes in distributed experiments: recommendations for simulating wet and dry years, Glob. Change Biol., 23, 1774–1782, https://doi.org/10.1111/gcb.13504, 2017a.
Knapp, A. K., Ciais, P., and Smith, M. D.: Reconciling inconsistencies in precipitation-productivity relationships: implications for climate change, New Phytol., 214, 41–47, https://doi.org/10.1111/nph.14381, 2017b.
Kowalczyk, E., Wang, Y., Law, R., Davies, H., McGregor, J., and Abramowitz, G.: The CSIRO Atmosphere Biosphere Land Exchange (CABLE) model for use in climate models and as an offline model, CSIRO Marine and Atmospheric Research Paper, 13, 1–37, 2006.
Krinner, G., Viovy, N., de Noblet-Ducoudré, N., Ogée, J., Polcher, J., Friedlingstein, P., Ciais, P., Sitch, S., and Prentice, I. C.: A dynamic global vegetation model for studies of the coupled atmosphere-biosphere system, Global Biogeochem. Cy., 19, 1–33, https://doi.org/10.1029/2003GB002199, 2005.
Lambers, H., Chapin III, F. S., and Pons, T. L.: Plant Physiological Ecology, Springer Science & Business Media, New York, 2008.
Lau, W. K. M., Wu, H. T., and Kim, K. M.: A canonical response of precipitation characteristics to global warming from CMIP5 models, Geophys. Res. Lett., 40, 3163–3169, https://doi.org/10.1002/grl.50420, 2013.
Lauenroth, W. K. and Bradford, J. B.: Ecohydrology of dry regions of the United States: water balance consequences of small precipitation events, Ecohydrology, 5, 46–53, https://doi.org/10.1002/eco.195, 2012.
Lauenroth, W. K. and Sala, O. E.: Long-Term Forage Production of North American Shortgrass Steppe, Ecol. Appl., 2, 397–403, https://doi.org/10.2307/1941874, 1992.
Luo, Y., Jiang, L., Niu, S., and Zhou, X.: Nonlinear responses of land ecosystems to variation in precipitation, New Phytol., 214, 5–7, https://doi.org/10.1111/nph.14476, 2017.
McGuire, A. D., Melillo, J. M., Joyce, L. A., Kicklighter, D. W., Grace, A. L., Moore, B., and Vorosmarty, C. J.: Interactions between carbon and nitrogen dynamics in estimating net primary productivity for potential vegetation in North America, Global Biogeochem. Cy., 6, 101–124, https://doi.org/10.1029/92GB00219, 1992.
Nemani, R. R., Keeling, C. D., Hashimoto, H., Jolly, W. M., Piper, S. C., Tucker, C. J., Myneni, R. B., and Running, S. W.: Climate-driven increases in global terrestrial net primary production from 1982 to 1999, Science, 300, 1560–1563, https://doi.org/10.1126/science.1082750, 2003.
Oleson, K. W., Lawrence, D. M., and Bonan, G. B.: Technical description of version 4.5 of the Community Land Model (CLM), Ncar Tech. Note NCAR/TN-503+STR, National Center for Atmospheric Research, Boulder, Geophys. Res. Lett., 37, 256–265, https://doi.org/10.5065/D6FB50WZ, 2013.
Parolari, A. J., Goulden, M. L., and Bras, R. L.: Ecohydrological controls on grass and shrub above-ground net primary productivity in a seasonally dry climate, Ecohydrology, 8, 1572–1583, https://doi.org/10.1002/eco.1605, 2015.
Peng, C., Liu, J., Dang, Q., Apps, M. J., and Jiang, H.: TRIPLEX: a generic hybrid model for predicting forest growth and carbon and nitrogen dynamics, Ecol. Model., 153, 109–130, https://doi.org/10.1016/S0304-3800(01)00505-1, 2002.
Peng, S., Piao, S., Shen, Z., Ciais, P., Sun, Z., Chen, S., Bacour, C., Peylin, P., and Chen, A.: Precipitation amount, seasonality and frequency regulate carbon cycling of a semi-arid grassland ecosystem in Inner Mongolia, China: A modeling analysis, Agr. Forest Meteorol., 178–179, 46–55, https://doi.org/10.1016/j.agrformet.2013.02.002, 2013.
Petrie, M. D., Peters, D., Yao, J., Blair, J. M., Burruss, N. D., Collins, S. L., Derner, J. D., Gherardi, L. A., Hendrickson, J. R., Sala, O. E., Starks, P. J., and Steiner, J. L.: Regional grassland productivity responses to precipitation during multiyear above- and below-average rainfall periods, Glob. Change Biol., 24, 1935–1951, https://doi.org/10.1111/gcb.14024, 2018.
Reichstein, M., Bahn, M., Ciais, P., Frank, D., Mahecha, M. D., Seneviratne, S. I., Zscheischler, J., Beer, C., Buchmann, N., Frank, D. C., Papale, D., Rammig, A., Smith, P., Thonicke, K., van der Velde, M., Vicca, S., Walz, A., and Wattenbach, M.: Climate extremes and the carbon cycle, Nature, 500, 287–295, https://doi.org/10.1038/nature12350, 2013.
Reick, C. H., Raddatz, T., Brovkin, V., and Gayler, V.: Representation of natural and anthropogenic land cover change in MPI-ESM, J. Adv. Model. Earth Sy., 5, 459–482, https://doi.org/10.1002/jame.20022, 2013.
Robertson, T. R., Bell, C. W., Zak, J. C., and Tissue, D. T.: Precipitation timing and magnitude differentially affect aboveground annual net primary productivity in three perennial species in a Chihuahuan Desert grassland, New Phytol., 181, 230–242, https://doi.org/10.1111/j.1469-8137.2008.02643.x, 2009.
Roy, J., Mooney, H. A., and Saugier, B.: Terrestrial global productivity, Academic Press, San Diego, 2001.
Sala, O. E., Parton, W. J., Joyce, L. A., and Lauenroth, W. K.: Primary Production of the Central Grassland Region of the United States, Ecology, 69, 40–45, https://doi.org/10.2307/1943158, 1988.
Sala, O. E., Gherardi, L. A., Reichmann, L., Jobbágy, E., and Peters, D.: Legacies of precipitation fluctuations on primary production: theory and data synthesis, Philos. T. R. Soc. B, 367, 3135–3144, https://doi.org/10.1098/rstb.2011.0347, 2012.
Schmitt, M., Bahn, M., Wohlfahrt, G., Tappeiner, U., and Cernusca, A.: Land use affects the net ecosystem CO2 exchange and its components in mountain grasslands, Biogeosciences, 7, 2297–2309, https://doi.org/10.5194/bg-7-2297-2010, 2010.
Seastedt, T. R. and Knapp, A. K.: Consequences of Nonequilibrium Resource Availability Across Multiple Time Scales: The Transient Maxima Hypothesis, Am. Nat., 141, 621–633, https://doi.org/10.1086/285494, 1993.
Sitch, S., Smith, B., Prentice, I. C., Arneth, A., Bondeau, A., Cramer, W., Kaplan, J., Levis, S., Lucht, W., and Sykes, M. T.: Evaluation of ecosystem dynamics, plant geography and terrestrial carbon cycling in the LPJ dynamic global vegetation model, Glob. Change Biol., 9, 161–185, https://doi.org/10.1046/j.1365-2486.2003.00569.x, 2003.
Smith, B., Prentice, I. C., and Sykes, M. T.: Representation of vegetation dynamics in the modelling of terrestrial ecosystems: comparing two contrasting approaches within European climate space, Glob. Ecol. Biogeogr., 10, 621–637, https://doi.org/10.1046/j.1466-822X.2001.t01-1-00256.x, 2001.
Smith, B., Warlind, D., Arneth, A., Hickler, T., Leadley, P., Siltberg, J., and Zaehle, S.: Implications of incorporating N cycling and N limitations on primary production in an individual-based dynamic vegetation model, Biogeosciences, 11, 2027–2054, https://doi.org/10.5194/bg-11-2027-2014, 2014.
Smith, M. D., Knapp, A. K., and Collins, S. L.: A framework for assessing ecosystem dynamics in response to chronic resource alterations induced by global change, Ecology, 90, 3279–3289, https://doi.org/10.1890/08-1815.1, 2009.
Smith, N. G., Rodgers, V. L., Brzostek, E. R., Kulmatiski, A., Avolio, M. L., Hoover, D. L., Koerner, S. E., Grant, K., Jentsch, A., Fatichi, S., and Niyogi, D.: Toward a better integration of biological data from precipitation manipulation experiments into Earth system models, Rev. Geophys., 52, 412–434, https://doi.org/10.1002/2014RG000458, 2014.
Thornton, P. E., Lamarque, J. F., Rosenbloom, N. A., and Mahowald, N. M.: Influence of carbon-nitrogen cycle coupling on land model response to CO2 fertilization and climate variability, Global Biogeochem. Cy., 21, 405–412, https://doi.org/10.1029/2006GB002868, 2007.
Tian, H., Xu, X., Lu, C., Liu, M., Ren, W., Chen, G., Melillo, J., and Liu, J.: Net exchanges of CO2, CH4, and N2O between China's terrestrial ecosystems and the atmosphere and their contributions to global climate warming, J. Geophys. Res.-Biogeo., 116, 1–13, https://doi.org/10.1029/2010JG001393, 2011.
Tian, H., Chen, G., Lu, C., Xu, X., Hayes, D. J., Ren, W., Pan, S., Huntzinger, D. N., and Wofsy, S. C.: North American terrestrial CO2 uptake largely offset by CH4 and N2O emissions: toward a full accounting of the greenhouse gas budget, Climatic Change, 129, 413–426, https://doi.org/10.1007/s10584-014-1072-9, 2015.
Vicca, S., Gilgen, A. K., Camino Serrano, M., Dreesen, F. E., Dukes, J. S., Estiarte, M., Gray, S. B., Guidolotti, G., Hoeppner, S. S., Leakey, A. D. B., Ogaya, R., Ort, D. R., Ostrogovic, M. Z., Rambal, S., Sardans, J., Schmitt, M., Siebers, M., van der Linden, L., van Straaten, O., and Granier, A.: Urgent need for a common metric to make precipitation manipulation experiments comparable, New Phytol., 195, 518–522, https://doi.org/10.1111/j.1469-8137.2012.04224.x, 2012.
Wang, Y. P., Kowalczyk, E., Leuning, R., Abramowitz, G., Raupach, M. R., Pak, B., van Gorsel, E., and Luhar, A.: Diagnosing errors in a land surface model (CABLE) in the time and frequency domains, J. Geophys. Res.-Biogeo., 116, 1–18, https://doi.org/10.1029/2010JG001385, 2011.
Waring, R., Landsberg, J., and Williams, M.: Net primary production of forests: a constant fraction of gross primary production?, Tree Physiol., 18, 129–134, https://doi.org/10.1093/treephys/18.2.129, 1998.
Wei, Y., Liu, S., Huntzinger, D. N., Michalak, A. M., Viovy, N., Post, W. M., Schwalm, C. R., Schaefer, K., Jacobson, A. R., Lu, C., Tian, H., Ricciuto, D. M., Cook, R. B., Mao, J., and Shi, X.: The North American Carbon Program Multi-scale Synthesis and Terrestrial Model Intercomparison Project – Part 2: Environmental driver data, Geosci. Model Dev., 7, 2875-2893, https://doi.org/10.5194/gmd-7-2875-2014, 2014.
Weng, E. and Luo, Y.: Soil hydrological properties regulate grassland ecosystem responses to multifactor global change: A modeling analysis, J. Geophys. Res.-Biogeo., 113, 1–16, https://doi.org/10.1029/2007JG000539, 2008.
Wilcox, K. R., Fischer, J. C., Muscha, J. M., Petersen, M. K., and Knapp, A. K.: Contrasting above- and belowground sensitivity of three Great Plains grasslands to altered rainfall regimes, Glob. Change Biol., 21, 335–344, https://doi.org/10.1111/gcb.12673, 2015.
Wilcox, K. R., Blair, J. M., Smith, M. D., and Knapp, A. K.: Does ecosystem sensitivity to precipitation at the site-level conform to regional-scale predictions?, Ecology, 97, 561–568, https://doi.org/10.1890/15-1437.1, 2016.
Wilcox, K. R., Shi, Z., Gherardi, L. A., Lemoine, N. P., Koerner, S. E., Hoover, D. L., Bork, E., Byrne, K. M., Cahill, J., Collins, S. L., Evans, S., Katarina Gilgen, A., Holub, P., Jiang, L., Knapp, A. K., LeCain, D., Liang, J., Garcia-Palacios, P., Peñuelas, J., Pockman, W. T., Smith, M. D., Sun, S., White, S. R., Yahdjian, L., Zhu, K., and Luo, Y.: Asymmetric responses of primary productivity to precipitation extremes: a synthesis of grassland precipitation manipulation experiments, Glob. Change Biol., 23, 4376–4385, https://doi.org/10.1111/gcb.13706, 2017.
Wohlfahrt, G., Hammerle, A., Haslwanter, A., Bahn, M., Tappeiner, U., and Cernusca, A.: Seasonal and inter-annual variability of the net ecosystem CO2 exchange of a temperate mountain grassland: Effects of weather and management, J. Geophys. Res.-Atmos., 113, 1–14, https://doi.org/10.1029/2007JD009286, 2008.
Wu, D., Zhao, X., Liang, S., Zhou, T., Huang, K., Tang, B., and Zhao, W.: Time-lag effects of global vegetation responses to climate change, Glob. Change Biol., 21, 3520–3531, https://doi.org/10.1111/gcb.12945, 2015.
Yang, Y., Fang, J., Ma, W., and Wang, W.: Relationship between variability in aboveground net primary production and precipitation in global grasslands, Geophys. Res. Lett., 35, 1-4, https://doi.org/10.1029/2008GL035408, 2008.
Yi, S., McGuire, A. D., Kasischke, E., Harden, J., Manies, K., Mack, M., and Turetsky, M.: A dynamic organic soil biogeochemical model for simulating the effects of wildfire on soil environmental conditions and carbon dynamics of black spruce forests, J. Geophys. Res.-Biogeo., 115, 1–15, https://doi.org/10.1029/2010JG001302, 2010.
Zaehle, S., Friend, A. D., Friedlingstein, P., Dentener, F., Peylin, P., and Schulz, M.: Carbon and nitrogen cycle dynamics in the O-CN land surface model: 2. Role of the nitrogen cycle in the historical terrestrial carbon balance, Global Biogeochem. Cy., 24, 1–14, https://doi.org/10.1029/2009GB003522, 2010.
Zhu, Q., Liu, J., Peng, C., Chen, H., Fang, X., Jiang, H., Yang, G., Zhu, D., Wang, W., and Zhou, X.: Modelling methane emissions from natural wetlands by development and application of the TRIPLEX-GHG model, Geosci. Model Dev., 7, 981–999, https://doi.org/10.5194/gmd-7-981-2014, 2014.
Zscheischler, J., Michalak, A. M., Schwalm, C., Mahecha, M. D., Huntzinger, D. N., Reichstein, M., Berthier, G., Ciais, P., Cook, R. B., El-Masri, B., Huang, M., Ito, A., Jain, A., King, A., Lei, H., Lu, C., Mao, J., Peng, S., Poulter, B., Ricciuto, D., Shi, X., Tao, B., Tian, H., Viovy, N., Wang, W., Wei, Y., Yang, J., and Zeng, N.: Impact of large-scale climate extremes on biospheric carbon fluxes: An intercomparison based on MsTMIP data, Global Biogeochem. Cy., 28, 585–600, https://doi.org/10.1002/2014GB004826, 2014.