the Creative Commons Attribution 4.0 License.
the Creative Commons Attribution 4.0 License.
 | 03 May 2019
Water-level attenuation in global-scale assessments of exposure to coastal flooding: a sensitivity analysis
Athanasios T. Vafeidis
Mark Schuerch
Claudia Wolff
Tom Spencer
Jan L. Merkens
Jochen Hinkel
Daniel Lincke
Sally Brown
Robert J. Nicholls
This study explores the uncertainty introduced in global assessments of coastal flood exposure and risk when not accounting for water-level attenuation due to land-surface characteristics. We implement a range of plausible water-level attenuation values for characteristic land-cover classes in the flood module of the Dynamic and Integrated Vulnerability Assessment (DIVA) modelling framework and assess the sensitivity of flood exposure and flood risk indicators to differences in attenuation rates. Results show a reduction of up to 44 % in area exposure and even larger reductions in population exposure and expected flood damages when considering water-level attenuation. The reductions vary by country, reflecting the differences in the physical characteristics of the floodplain as well as in the spatial distribution of people and assets in coastal regions. We find that uncertainties related to not accounting for water attenuation in global assessments of flood risk are of similar magnitude to the uncertainties related to the amount of sea-level rise expected over the 21st century. Despite using simplified assumptions to account for the process of water-level attenuation, which depends on numerous factors and their complex interactions, our results strongly suggest that an improved understanding and representation of the temporal and spatial variation of water levels across floodplains is essential for future impact modelling.


Increased flooding due to sea-level rise (SLR) is a major natural hazard that coastal regions will face in the 21st century, with potentially high socio-economic impacts (Kron, 2013; Wong et al., 2014). Broad-scale (i.e. continental to global) assessments of coastal flood exposure and risk are therefore required to inform mitigation targets and adaptation decisions (Ward et al., 2013a), related financial needs, and loss and damage estimates. Towards these ends, a number of recent studies have assessed the exposure of area, population and assets to coastal flooding at national to global scales (Nicholls, 2004; Brown et al., 2016; Jongman et al., 2012a; Ward et al., 2013b; Arkema et al., 2013; Muis et al., 2017) as well as flood risk (Hinkel et al., 2014; Vousdoukas et al., 2018a).
Although methods for broad-scale coastal-flood exposure and risk assessment vary between studies, flood extent and water depth have commonly been assessed based on spatial analysis, assuming that all areas with an elevation below a certain water level that are hydrologically connected to the sea are flooded (the “bathtub” method) (Poulter and Halpin, 2008; Lichter et al., 2011). Notable exceptions are the studies of Dasgupta et al. (2011), who used a simple approach to account for wave height attenuation with distance from the coast, and Vousdoukas et al. (2018b), who, for the Iberian Peninsula, adopted a modified version of the bathtub approach that also considers water volume. The use of simplified methods for assessing flooding is primarily related to difficulties of using hydrodynamic methods at a broad scale, namely the limited availability and large volume of the necessary high-resolution input data and the prohibitive computational costs, which render hydrodynamic modelling applications impractical at global scales (Ramirez et al., 2016). Therefore, global applications have utilised elevation data with a spatial resolution of 1 km and a vertical resolution of 1 m (Mondal and Tatem, 2012; Jongman et al., 2012b; Ward et al., 2014), with only a few recent studies employing higher spatial resolution (90 m) datasets (e.g. Hinkel et al., 2014; Vousdoukas et al., 2018a; see also de Moel et al., 2015).
Hydrodynamic models are normally used only for local-scale applications. This is because they require detailed data on parameters such as coastal topography, bathymetry and land use in order to represent local-scale processes and to account for hydraulic properties. A range of simpler inundation models that partly account for hydraulic processes at intermediate scales using medium-resolution elevation data (<100 m2) have also been applied at subnational scales (e.g. Bates et al., 2010; Wadey et al., 2012; Lewis et al., 2013; Ramirez et al., 2016), and these models are beginning to inform analysis at broader scales (e.g. Vousdoukas et al., 2016, 2018a). There is also developing literature on hydrodynamic modelling of water-level attenuation over coastal wetlands at the landscape scale (<1 km) for salt marshes (Loder et al., 2009; Wamsley et al., 2009, 2010; Barbier et al., 2013; Smith et al., 2016) and mangrove forests (McIvor et al., 2012; Zhang et al., 2012; Liu et al., 2013). However, the incorporation of the above processes in global models is still very limited.
Not accounting for hydrodynamic processes in global models can, however, lead to overestimation of flood extent and water depth. Hydrodynamic models capture processes that are not included in global models, such as the effects of surface roughness (both natural and anthropogenic) and channel network density and connectivity (and its effect on landscape continuity) on the timing, duration and routing of floodwaters. For example, inundation extent has been shown in some cases to significantly decrease in urban and residential areas when the built environment is represented in numerical simulations (e.g. tsunami inundation: Kaiser et al., 2011; storm surge inundation: Brown et al., 2007; Orton et al., 2015).
To our knowledge, there is no study that has explored the uncertainty introduced into global models by not accounting for water-level attenuation due to hydrodynamic processes related to surface roughness. This paper aims to address this gap. We derive a range of plausible water-level attenuation values from existing literature and implement them in the flood module of the Dynamic Interactive Vulnerability Assessment (DIVA) modelling framework (Hinkel et al., 2014). Next, we assess the sensitivity of flood exposure and flood risk indicators to plausible changes in water-level attenuation values under a range of different SLR scenarios. Finally, we compare the uncertainty due to water-level attenuation rates with the uncertainty range associated with expected SLR during the 21st century.
2.1 The Dynamic Interactive Vulnerability Assessment (DIVA) modelling framework
DIVA is an integrated, global modelling framework for assessing the biophysical and socio-economic consequences of SLR, and associated extreme water levels, under different physical and socio-economic scenarios and considering various adaptation strategies (Hinkel and Klein, 2009). DIVA has been widely used for global- and continental-scale assessments of SLR impacts, vulnerability and adaptation (e.g. McLeod et al., 2010; Hinkel et al., 2010, 2013, 2014; Brown et al., 2016; Spencer et al., 2016; Schuerch et al., 2018). It is underpinned by a global coastal database which divides the world's coastline (excluding Antarctica) into 12 148 coastal segments (Vafeidis et al., 2008). Each segment contains approximately 100 elements of data concerning the physical, ecological and socio-economic characteristics of the coast. Here we focus on the impacts of increased exposure to coastal flooding and the potential damage of extreme sea level events (due to the combination of storm surges and astronomical high tides). We used the flood module of DIVA (for details see Hinkel et al., 2014) to estimate potential coastal flood damage, SLR impacts and associated costs.
We specifically considered the following five indicators, which progressively include additional components of flood risk:
-
Area below the 1-in-100-year flood event (km2), an estimate based on elevation data and information on water levels for a single hazard event (i.e. the height of the 1-in-100-year sea flood);
-
People living in the 1-in-100-year floodplain, a calculation based on spatial data on elevation and population as well as on information for a single hazard event (i.e. the height of the 1-in-100-year sea flood);
-
Assets in the 1-in-100-year floodplain (USD), a calculation that uses data on elevation, population, gross domestic product (GDP) and information for a single hazard event (i.e. the height of the 1-in-100-year sea flood);
-
Expected value of the number of people flooded per year (hereafter, people flooded), a calculation based on elevation and population data and the probability distribution of the hazard (i.e. sea flood heights and their probability of occurrence); and
-
Expected value of annual damages to assets (hereafter, flood damage) (USD), a calculation based on elevation, population, GDP data and the probability distribution of the hazard (i.e. sea flood heights and their probability of occurrence).
For each coastline segment, a cumulative exposure function for area and population that gives the areal extent (hydrologically connected to the sea) and number of people below a given elevation was constructed. Damages to assets were assessed using a depth-damage function with a declining slope, with 50 % of the assets being destroyed at a water depth of 1 m (Messner et al., 2007).
2.2 Coastal elevation and rate of water-level attenuation
To simulate the effect of different values of attenuation at the broad scale, we implemented a stylised elevation profile to represent the process of water-level attenuation. We assumed that water levels decrease at a constant slope (α) with increasing distance from the coastline. Location-specific coastal profiles for every coastline segment were based on floodplain areas contained within the DIVA database. The database reports total land area within different elevation increments (<1.5, 1.5–2.5, 2.5–3.5, 3.5–4.5, 4.5–5.5, 5.5–8.5, 8.5–12.5, 12.5–16.5 m) for each coastal segment. The elevation dataset that was used for estimating floodplain areas and developing the segment elevation profiles is the commonly used Shuttle Radar Terrain Mission (SRTM) digital elevation database (Jarvis et al., 2008), which has a vertical resolution of 1m and a spatial resolution of 3 arcsec (∼90 m at the equator).
We approximated the average coastal profile for every segment by assuming that elevation continuously increases with distance from the shore. Starting with the lowest elevation increment, the floodplain areas of all elevation increments were cumulatively summed to retrieve the total area below a certain elevation. The total areas were then divided by the segment length to derive the inundation length of the respective floodplain (dxi). To evaluate the representativeness of the assumption of continuously increasing elevation with increasing distance from the shore, we used the original SRTM dataset and calculated the Euclidian distance of each cell to the nearest coastline for every pixel. Mean distances from the coast were calculated for each of the floodplain areas of each segment. Subsequently, we compared these mean distances with the respective average floodplain elevation for each DIVA coastline segment to analyse the validity of the “continuous-increase” assumption. This comparison revealed that 55 % of the DIVA coastline segments show either a continuous increase or no change in the mean distance along the elevation profile (Fig. 1a), suggesting that elevation does not decrease with distance from the coast. Comparing all elevation increments of all segments (i.e. pairwise comparison of the mean distances of consecutive elevation increments in a segment), there was an increase, or no change, in the mean distance from the coastline in 88 % of cases. Only 12 % of cases showed a decrease (Fig. 1b). This result indicates that the stylised continuous profile (Fig. 1a) can be regarded as representative of global coastal topography (see also Schuerch et al., 2018).
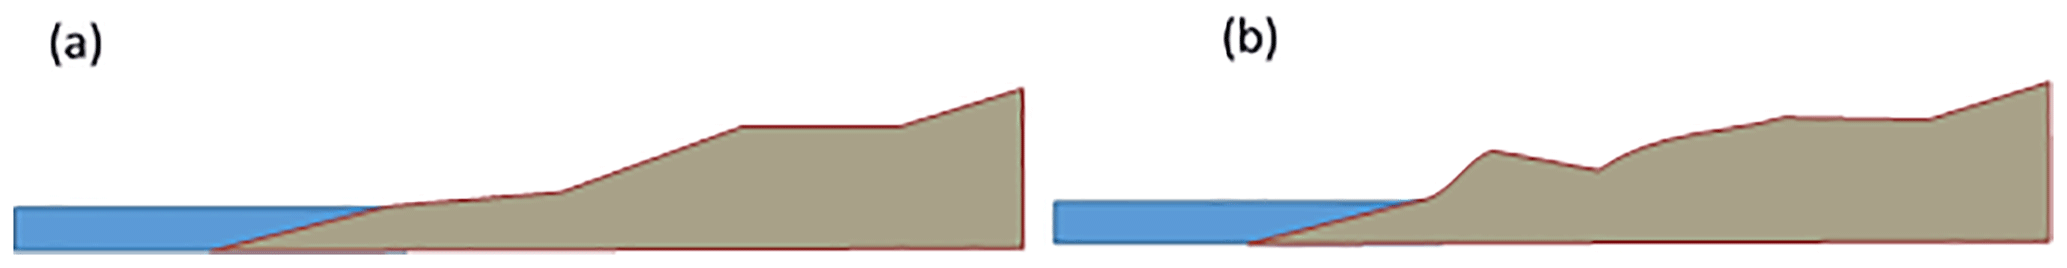
Figure 1Stylised coastal profile with (a) continuous and (b) discontinuous increases in elevation with distance from the shore.
We then adjusted the coastal profile using a range of possible attenuation rates that represent different water surface slopes. Depending on the applied value for water-level attenuation, the slope (α) of the inundating water surface was employed to modify (incline) the coastal profile. Based on this slope, the coastal profile is thereby elevated by the amount of the water-level reduction (hxi) computed at a distance dxi (Fig. 1):
In this way the original floodplain areas and inundation depths are reduced in order to account for the reduced (i) inundation length (dx) and (ii) inundation depth (hx) (see Fig. 2).
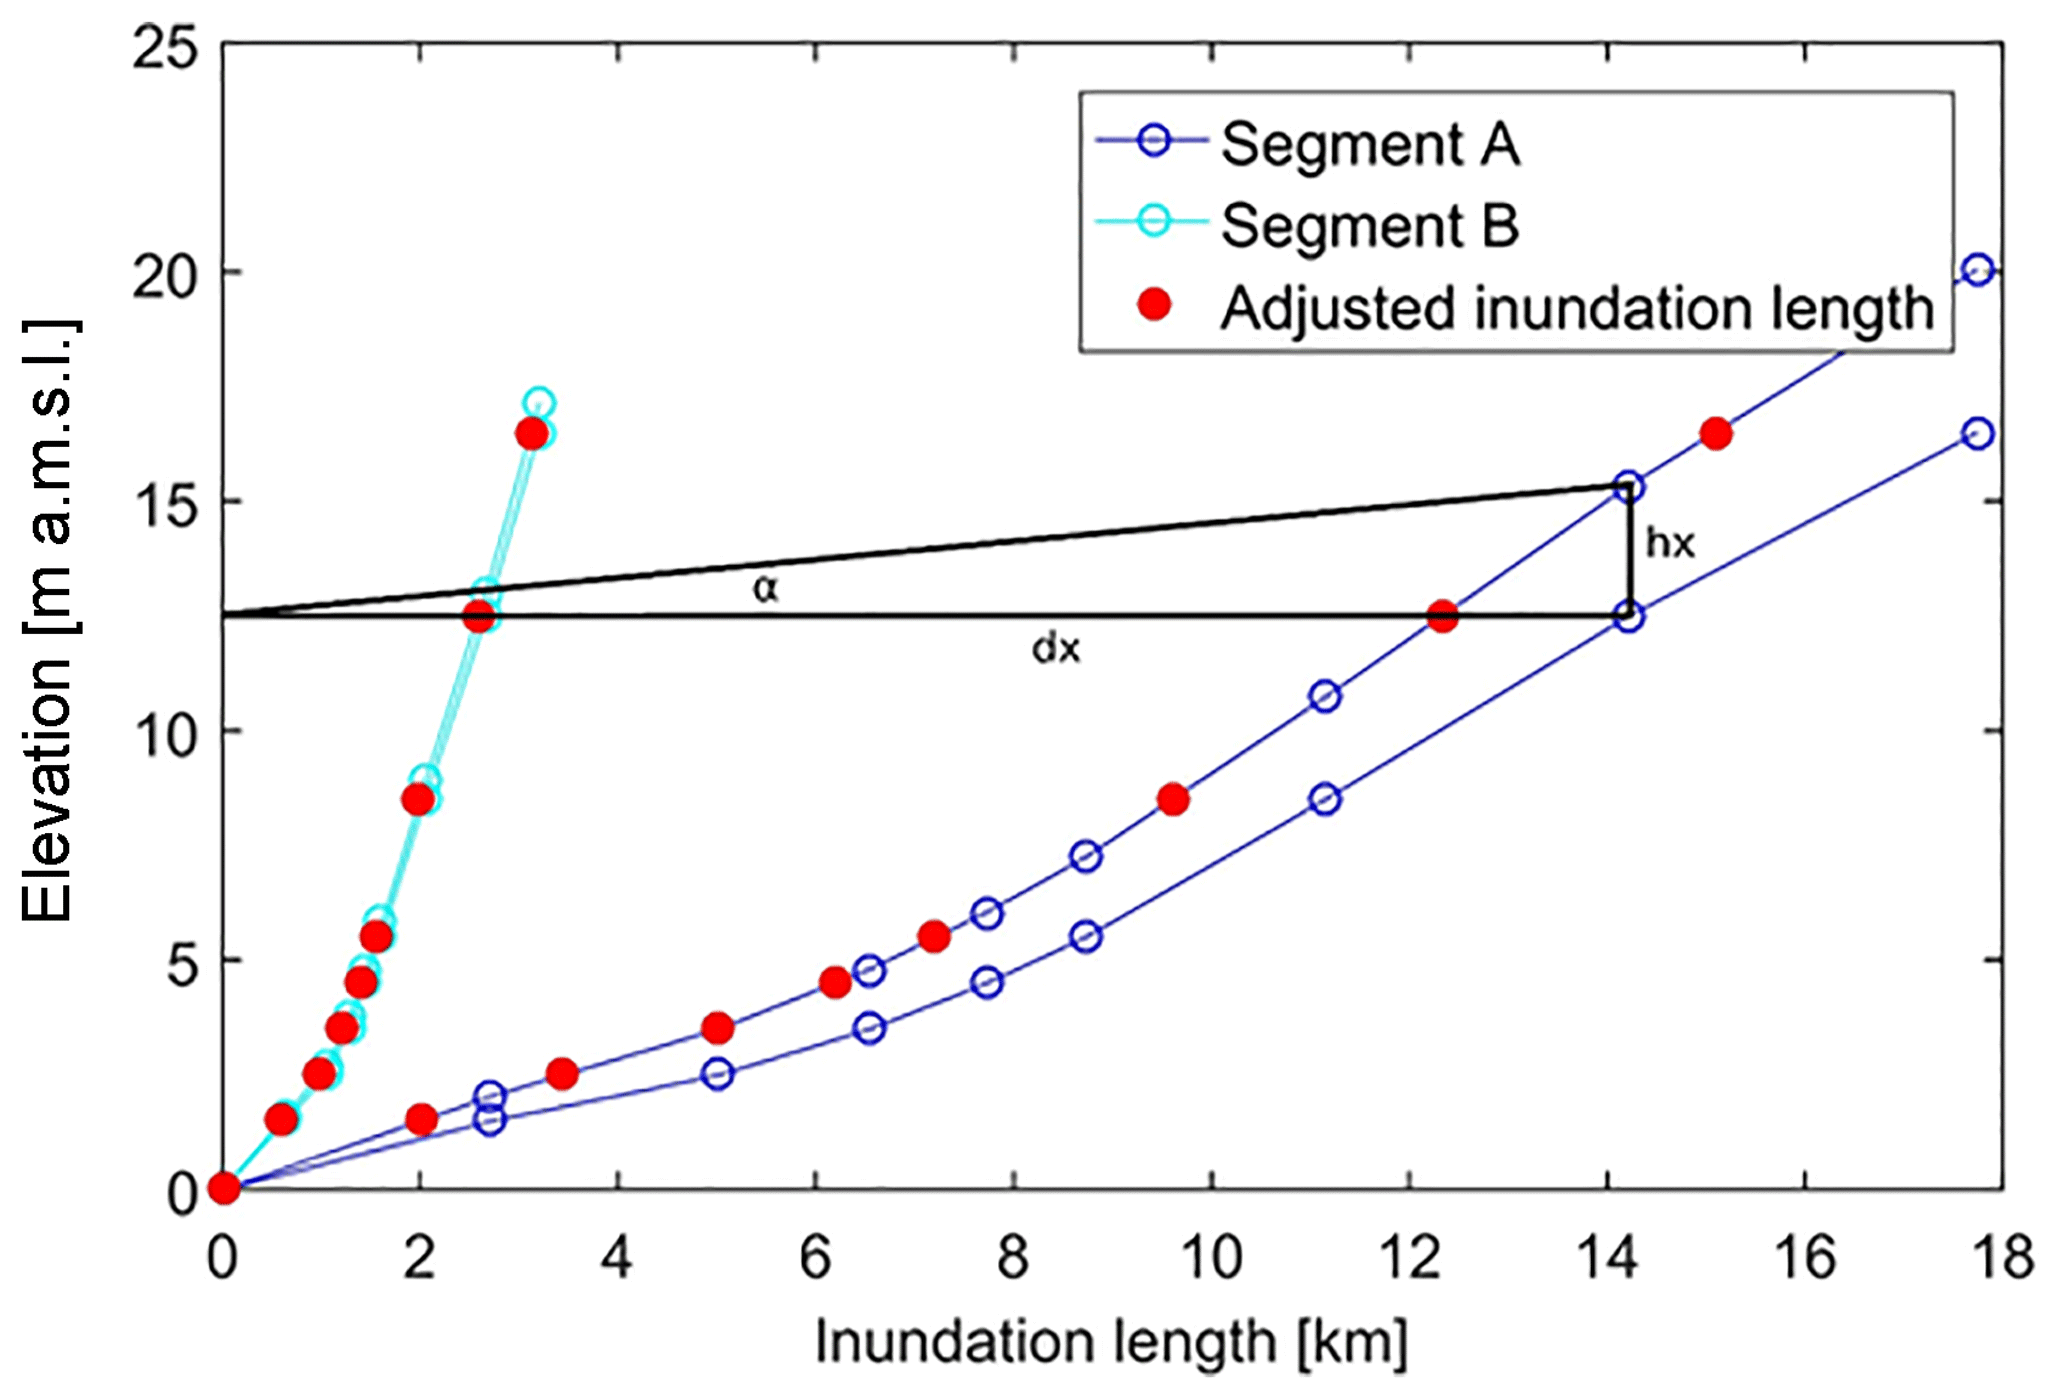
Figure 2The stylised coastal profile, based on the floodplain areas in the DIVA database (lower line), for two characteristic coastline segments (A with a flat and B with a steep profile). Water-level attenuation is accounted for by inclining the coastal profile according to Eq. (1) (upper line). Red dots on the adjusted coastal profile indicate the inundation length in the case of a water level with a constant slope of α, which represents the attenuation rate and for an incident water-level equal to the corresponding increment height.
Table 1Water-level reduction rates, for different types of land cover, as reported in the literature.

For the sensitivity analysis we used a range of attenuation rates that embraces the values reported in the literature (Table 1), where the water level under storm conditions has been shown to decrease with distance from the coast. For reviewing the literature we employed the ISI Web of Knowledge and based our search on the keywords “surge”, “attenuation” and “water-level”. We selected studies that directly reported values of water-level reduction with distance and did not include studies focussing on wave attenuation. We must note that the aim was not to conduct a systematic literature review but rather to identify a characteristic range of values that could support the sensitivity analysis. The identified studies all relate to coastal wetland environments. Although there are published studies of localised water-level dynamics from flow–form interactions in urban and other settings, we have not come across similar landscape-scale assessments for other land use types. Therefore we broadened this review, where reported attenuation values were up to 70 cm km−1, by directly contacting scientists and data analysts with experience in field or modelling studies. Following their expert judgement, we extended our analysis to include attenuation rates of up to 100 cm km−1 as an upper limit.
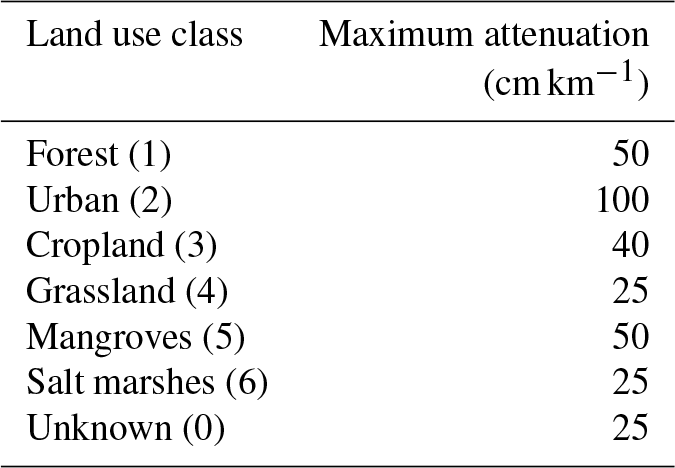
We further constrained the sensitivity analysis by adjusting the range of water attenuation rates for each segment based on the predominant land use type covering the area of every elevation increment. For estimating the predominant land use we employed the GlobCover Land Cover V2.3 dataset, a global land cover dataset with a resolution of 10 arcsec (∼300 m at the equator). It is based on the ENVISAT satellite mission's MERIS sensor (Medium Resolution Image Spectrometer) covering the period between January and December 2009 and includes 22 land cover classes. As the available information on water attenuation rates by land use type is limited, we reclassified the data to seven classes (forest, urban, cropland, grassland, mangroves, salt marshes and unknown) and assigned maximum attenuation rates to each class (Table 2). For the model runs we used the five attenuation categories (no, low, medium, high and maximum attenuation) corresponding to 0, 25 %, 50 %, 75 % and 100 % of the maximum values found in the literature or from expert judgement, for each class. These rates were then used to incline the water surface in order to represent a constant water-level attenuation and the associated reduction in water levels (α) across the floodplain for each coastline segment.
Table 2Maximum attenuation rates per land use class used in the sensitivity analysis.
2.3 Sea-level rise and socio-economic scenarios
For global SLR in 2100 from a 1985–2005 baseline we used three scenarios: the 5 % quantile of the low Representative Concentration Pathway (RCP) 2.6, the median of the medium scenario RCP 4.5 and the 95 % quantile of the high scenario RCP 8.5. These scenarios are represented by regionalised SLR projections, with a global mean rise of 29, 50 and 110 cm (by 2100 with respect to 1986–2005), respectively, and were developed in the Inter-Sectoral Impact Model Intercomparison Project Fast Track (for full details see Hinkel et al., 2014). Following Menendez and Woodworth (2010), once mean sea level had been determined, future extreme water levels were obtained by displacing upwards extreme water levels for different return periods (as included in the DIVA database) with the rising sea level.
We used a single shared socio-economic pathway (SSP), namely SSP2, to represent changes in coastal population and assets. SSP2 reflects a world with medium assumptions between the other four SSPs, in terms of resource intensity and fuel dependency as well as GDP and population development (O'Neill et al., 2014). Finally, we ran the DIVA model using a no-dike scenario, where no defence measures for preventing coastal flooding are present. This was done to better characterise water attenuation and to reduce complexity as dike heights in DIVA are modelled since no consistent global data on coastal protection exist (Schuerch et al., 2018).
We present results for the different classes of attenuation rates, across the five indicators that progressively include additional components of flood risk.
3.1 Reduction of current flood exposure and risk
Table 3 shows the results from the five categories of attenuation rates and both the absolute and percentage reductions in the values of the five indicators against this baseline.
Table 3Reduction, relative to the bathtub method, of five indicators of global exposure and risk for different water-level attenuation rates. Values are for a medium SLR scenario, in 2015.

Our results show that accounting for water-level attenuation in the assessment of flooding results in large differences in the values of the five indicators. For example, the area exposed to the 1-in-100-year flood in 2015 decreases by up to 44 % with the application of attenuation rates. The low attenuation category results in an area reduction of 23 % while the use of medium attenuation rates results in a reduction of 33 % (see Table 3). Interestingly, the number of people in the 1-in-100-year floodplain reduces to 87 million when considering high attenuation. This is a reduction of 50 %, which is similar to the respective reduction in assets (51 %) but higher than the reduction in area (44 %) exposure. This result reflects the high population density near the coast that has been reported in previous studies (e.g. Neumann et al., 2015). Flood damages from the 1-in-100-year event are reduced by a similar proportion, totalling a reduction of more than USD 220 billion (54 %) globally, when considering maximum attenuation rates.
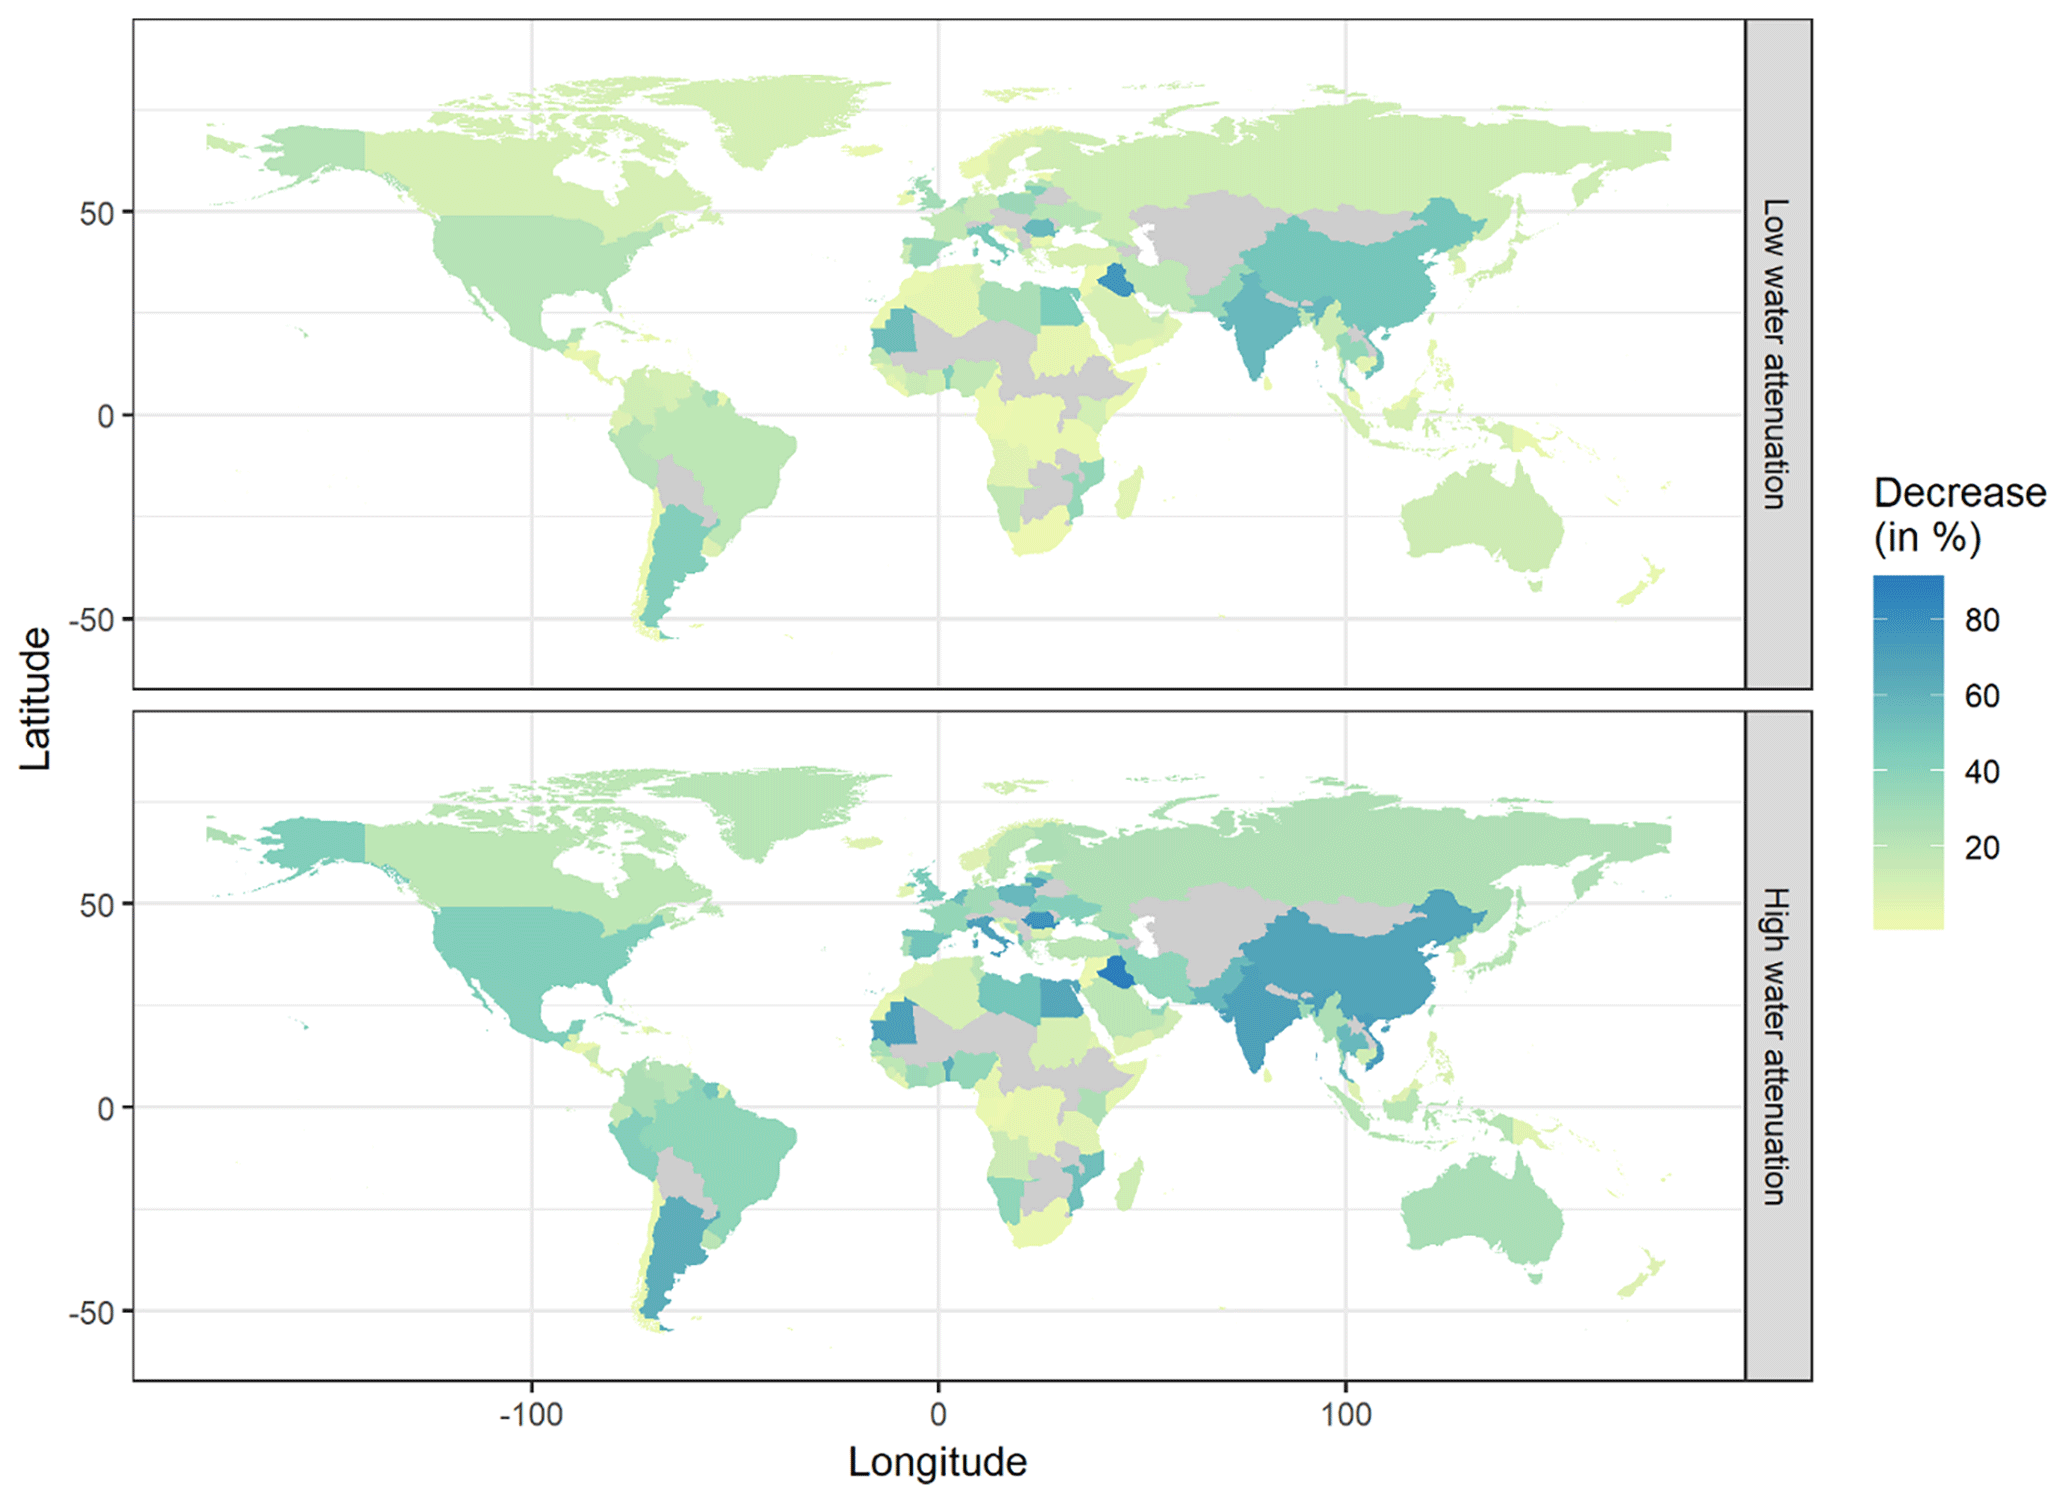
Figure 3Relative reduction in area exposure to 1-in-100-year coastal floods for low-attenuation (25 %) and high- attenuation (75 %) categories for 2020.
Table 4Absolute and relative reduction of the 1-in-100-year floodplain area and associated exposed assets when applying different water-level attenuation rates for Bangladesh, China and the USA in 2015. Values assume a medium SLR scenario.
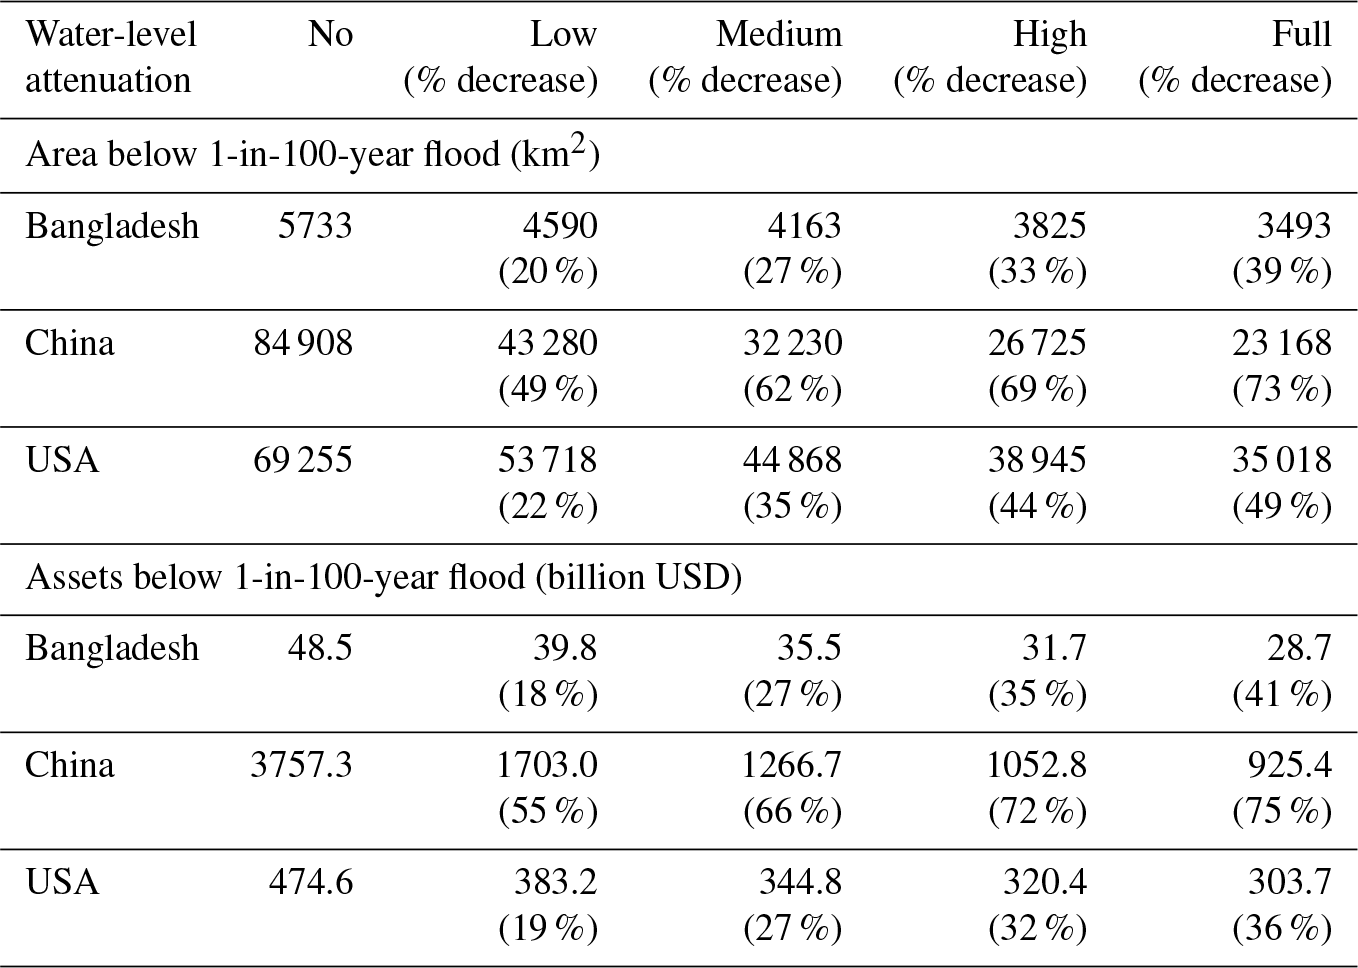
The reduction in impacts is not uniform across the globe and varies considerably between different countries. Some examples are given in Fig. 3 and Table 4. Figure 3 shows the spatial variability of the effects of accounting for water attenuation: low water attenuation can lead to reductions in area exposure of more than 50 % and high attenuation can reduce area exposure by more than 80 %. Table 4 shows results for three countries, namely China, Bangladesh and the USA, where accounting for water-level attenuation reduces area exposure by up to 73 % in China, 39 % in Bangladesh and 49 % in the USA. At the same time, the reduction in annual flood costs follows a different trend, with exposed assets reducing by up to 75 % in China, 41 % in Bangladesh and 36 % in the USA, reflecting differences in the elevation distribution and land cover characteristics of the floodplains, as well as in the spatial distribution of people and assets in the coastal regions of these countries.
3.2 Comparison of attenuation rate uncertainty with sea-level rise uncertainty
Figure 4 illustrates the area of land located below the 1-in-100-year storm surge level (H100), plotted against the different attenuation rates for water-level change. The inclusion of water-level attenuation in the assessment of flooding results in large reduction in the extent of the 100-year floodplain in 2100 (Fig. 4) under all SLR scenarios. Even the use of low attenuation of water levels results in a reduction of 230 000 km2 of area exposed to the 1-in-100-year flood under the no-SLR scenario. This increases to 350 000 km2 under the high-SLR scenario. For the medium-SLR scenario (median of the medium scenario RCP 4.5; 50 cm by 2100), this reduction amounts to 31 % and 40 % of the total exposed area at medium and full water-level attenuation respectively. The relative reduction is larger (up to 60 %) for the high-SLR scenario compared to the medium-, low- and no-SLR scenarios. Importantly, the overall difference in the extent of the area of the 100-year floodplain between the no- and high-SLR scenarios is of a similar order of magnitude to the difference in area extent between the no-water and low-water-level attenuation rates, under any scenario. This indicates that when assessing area exposure accounting for even relatively moderate rates of water-level attenuation can be of similar importance to the differences that result from different scenarios of SLR. This analysis, therefore, strongly suggests that uncertainties related to the omission of this factor in global assessments of flood risk are of similar magnitude to the uncertainties related to the magnitude of SLR expected over the 21st century.
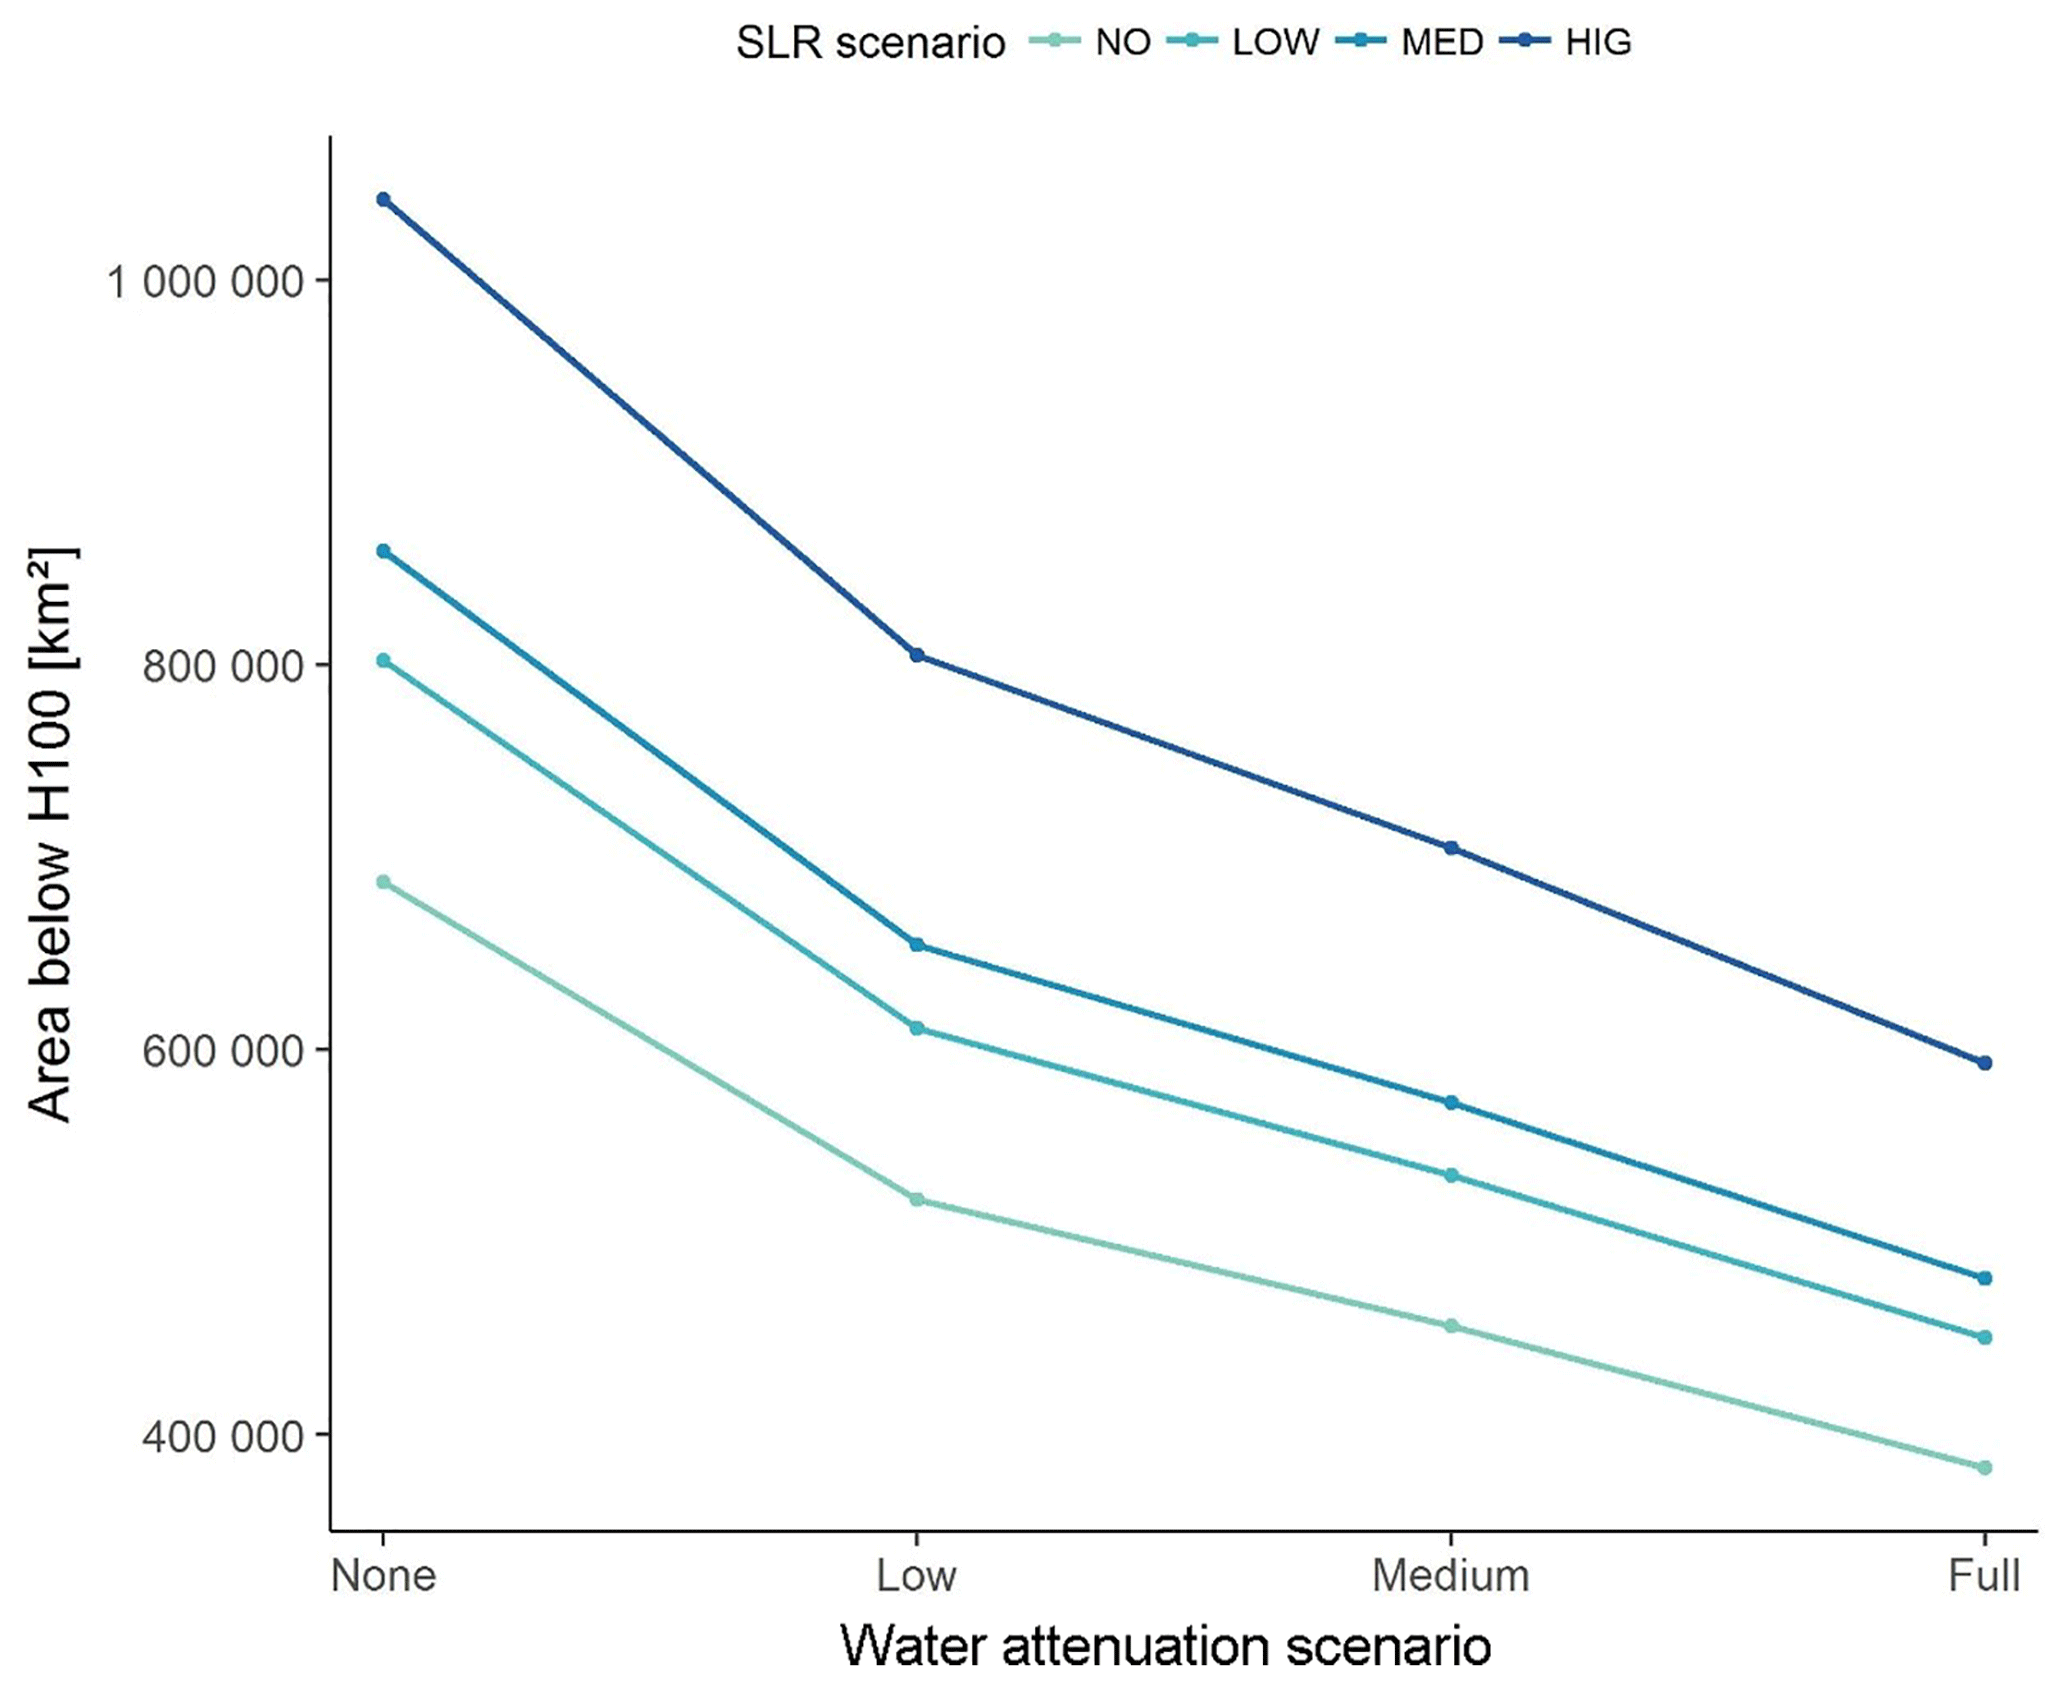
Figure 4Global total extent of the one-in-100-year floodplain, for different water-level attenuation rates and SLR scenarios.
Similar patterns can be observed for the exposure of population to the 1-in-100-year flood (Fig. 5). Low attenuation (Table 1) leads to a reduction of more than 30 % in the exposure of population in 2100, under the high-SLR scenario, bringing the number of people at risk in the 100-year floodplain down by approximately 75 million. Moreover, medium attenuation leads to a reduction in flood exposure by 100 million people, making population exposure lower than the exposure under no SLR when attenuation is not considered. Again, this result suggests that accounting for water-level attenuation may be equally important to accounting for SLR uncertainty when assessing the exposure of people to coastal flooding due to SLR.
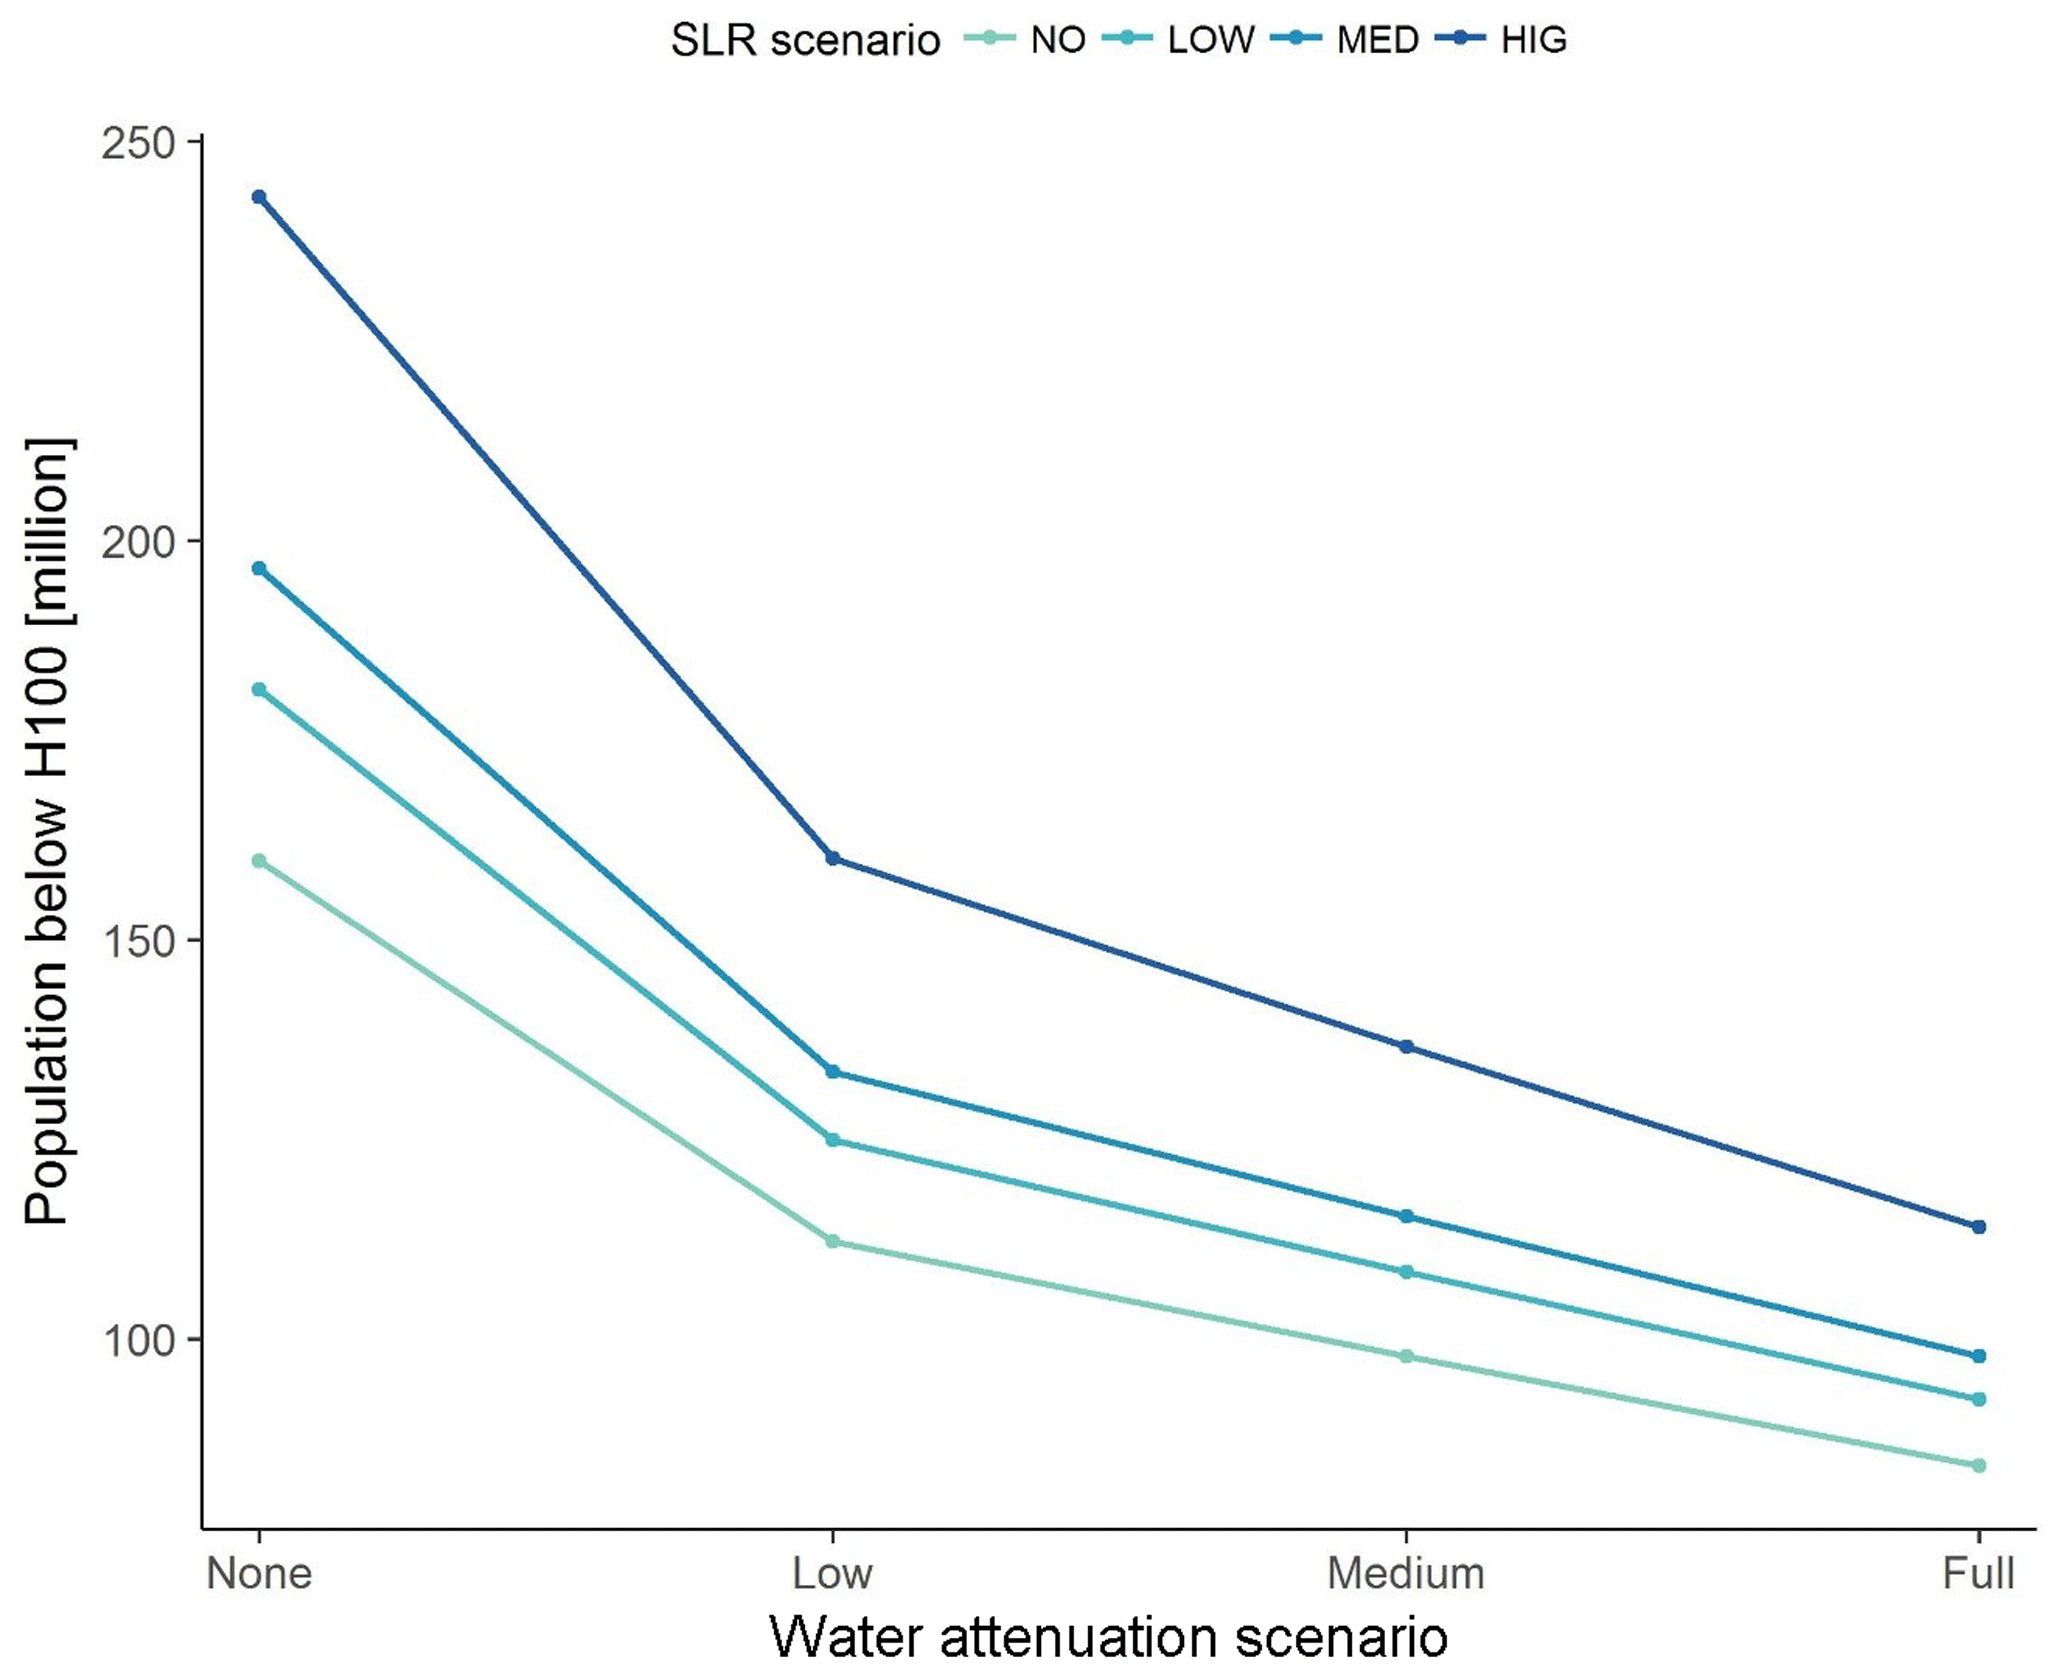
Figure 5Global estimates of population in the one-in-100-year floodplain for different water-level reduction rates (Table 1) and SLR scenarios.
The value of assets exposed to the 1-in-100-year flood is also substantially reduced, under all scenarios, when accounting for water-level attenuation (Fig. 6). Considering low attenuation rates results in a decrease in the exposure of assets of approximately 34 % in 2100, for a medium SLR scenario. A reduction of 50 % in assets' exposure occur when high attenuation is used. Furthermore, our results suggest that the use of a relatively moderate attenuation rate has an interesting temporal dimension as it shifts the extent of assets' exposure by approximately 30 years, under all SLR scenarios (Fig. 6).
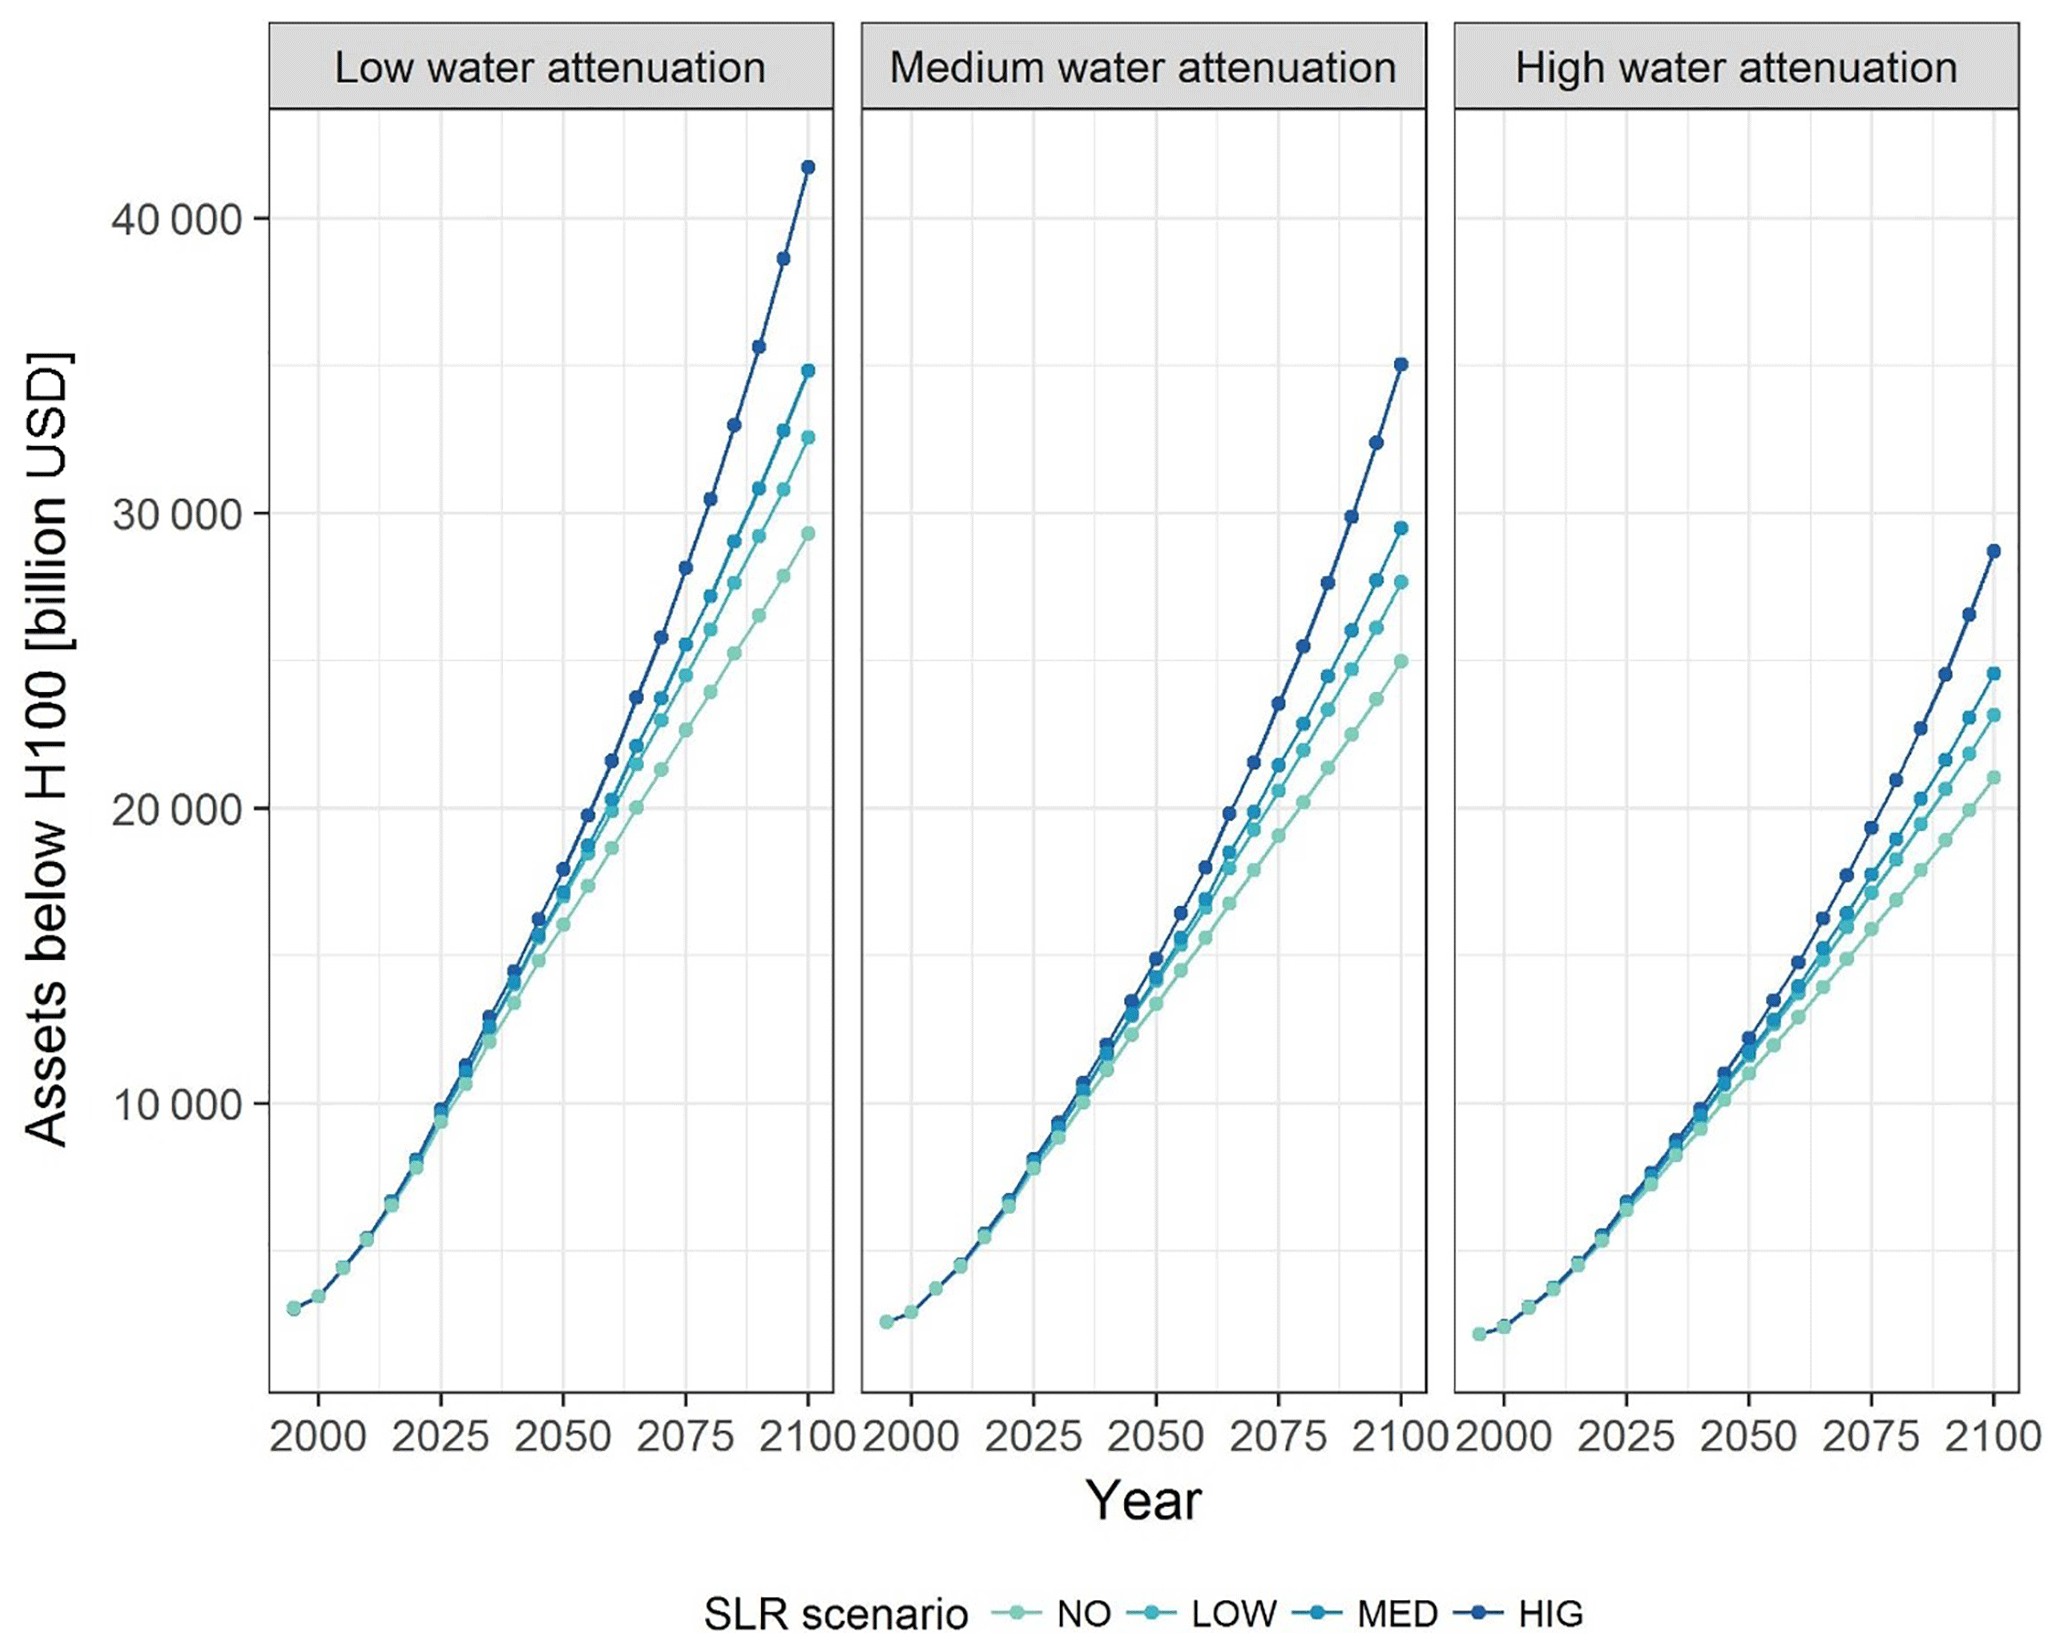
Figure 6Temporal evolution of the amount of assets that are located in the one-in-100-year floodplain for different water-level reduction rates (Table 1) and SLR scenarios.
Damages also reduce considerably with the introduction of water-level attenuation rates (Fig. 7). For example, the use of a low attenuation rate results in a 34 % reduction in damages to assets in 2100 from the 1-in-100-year flood. The larger decrease in damages due to water-level attenuation compared to population and area exposure is due to the fact that, besides the decrease in the flood area extent, water-level attenuation leads to an additional reduction of flood depth with distance from the coast. As water depth is an important parameter for calculating damages to assets (Thieken et al., 2005; Penning-Rowsell et al., 2013), depth reduction further reduces the potential damages of assets due to flooding and results in a temporal shift of damages of more than 25 years.
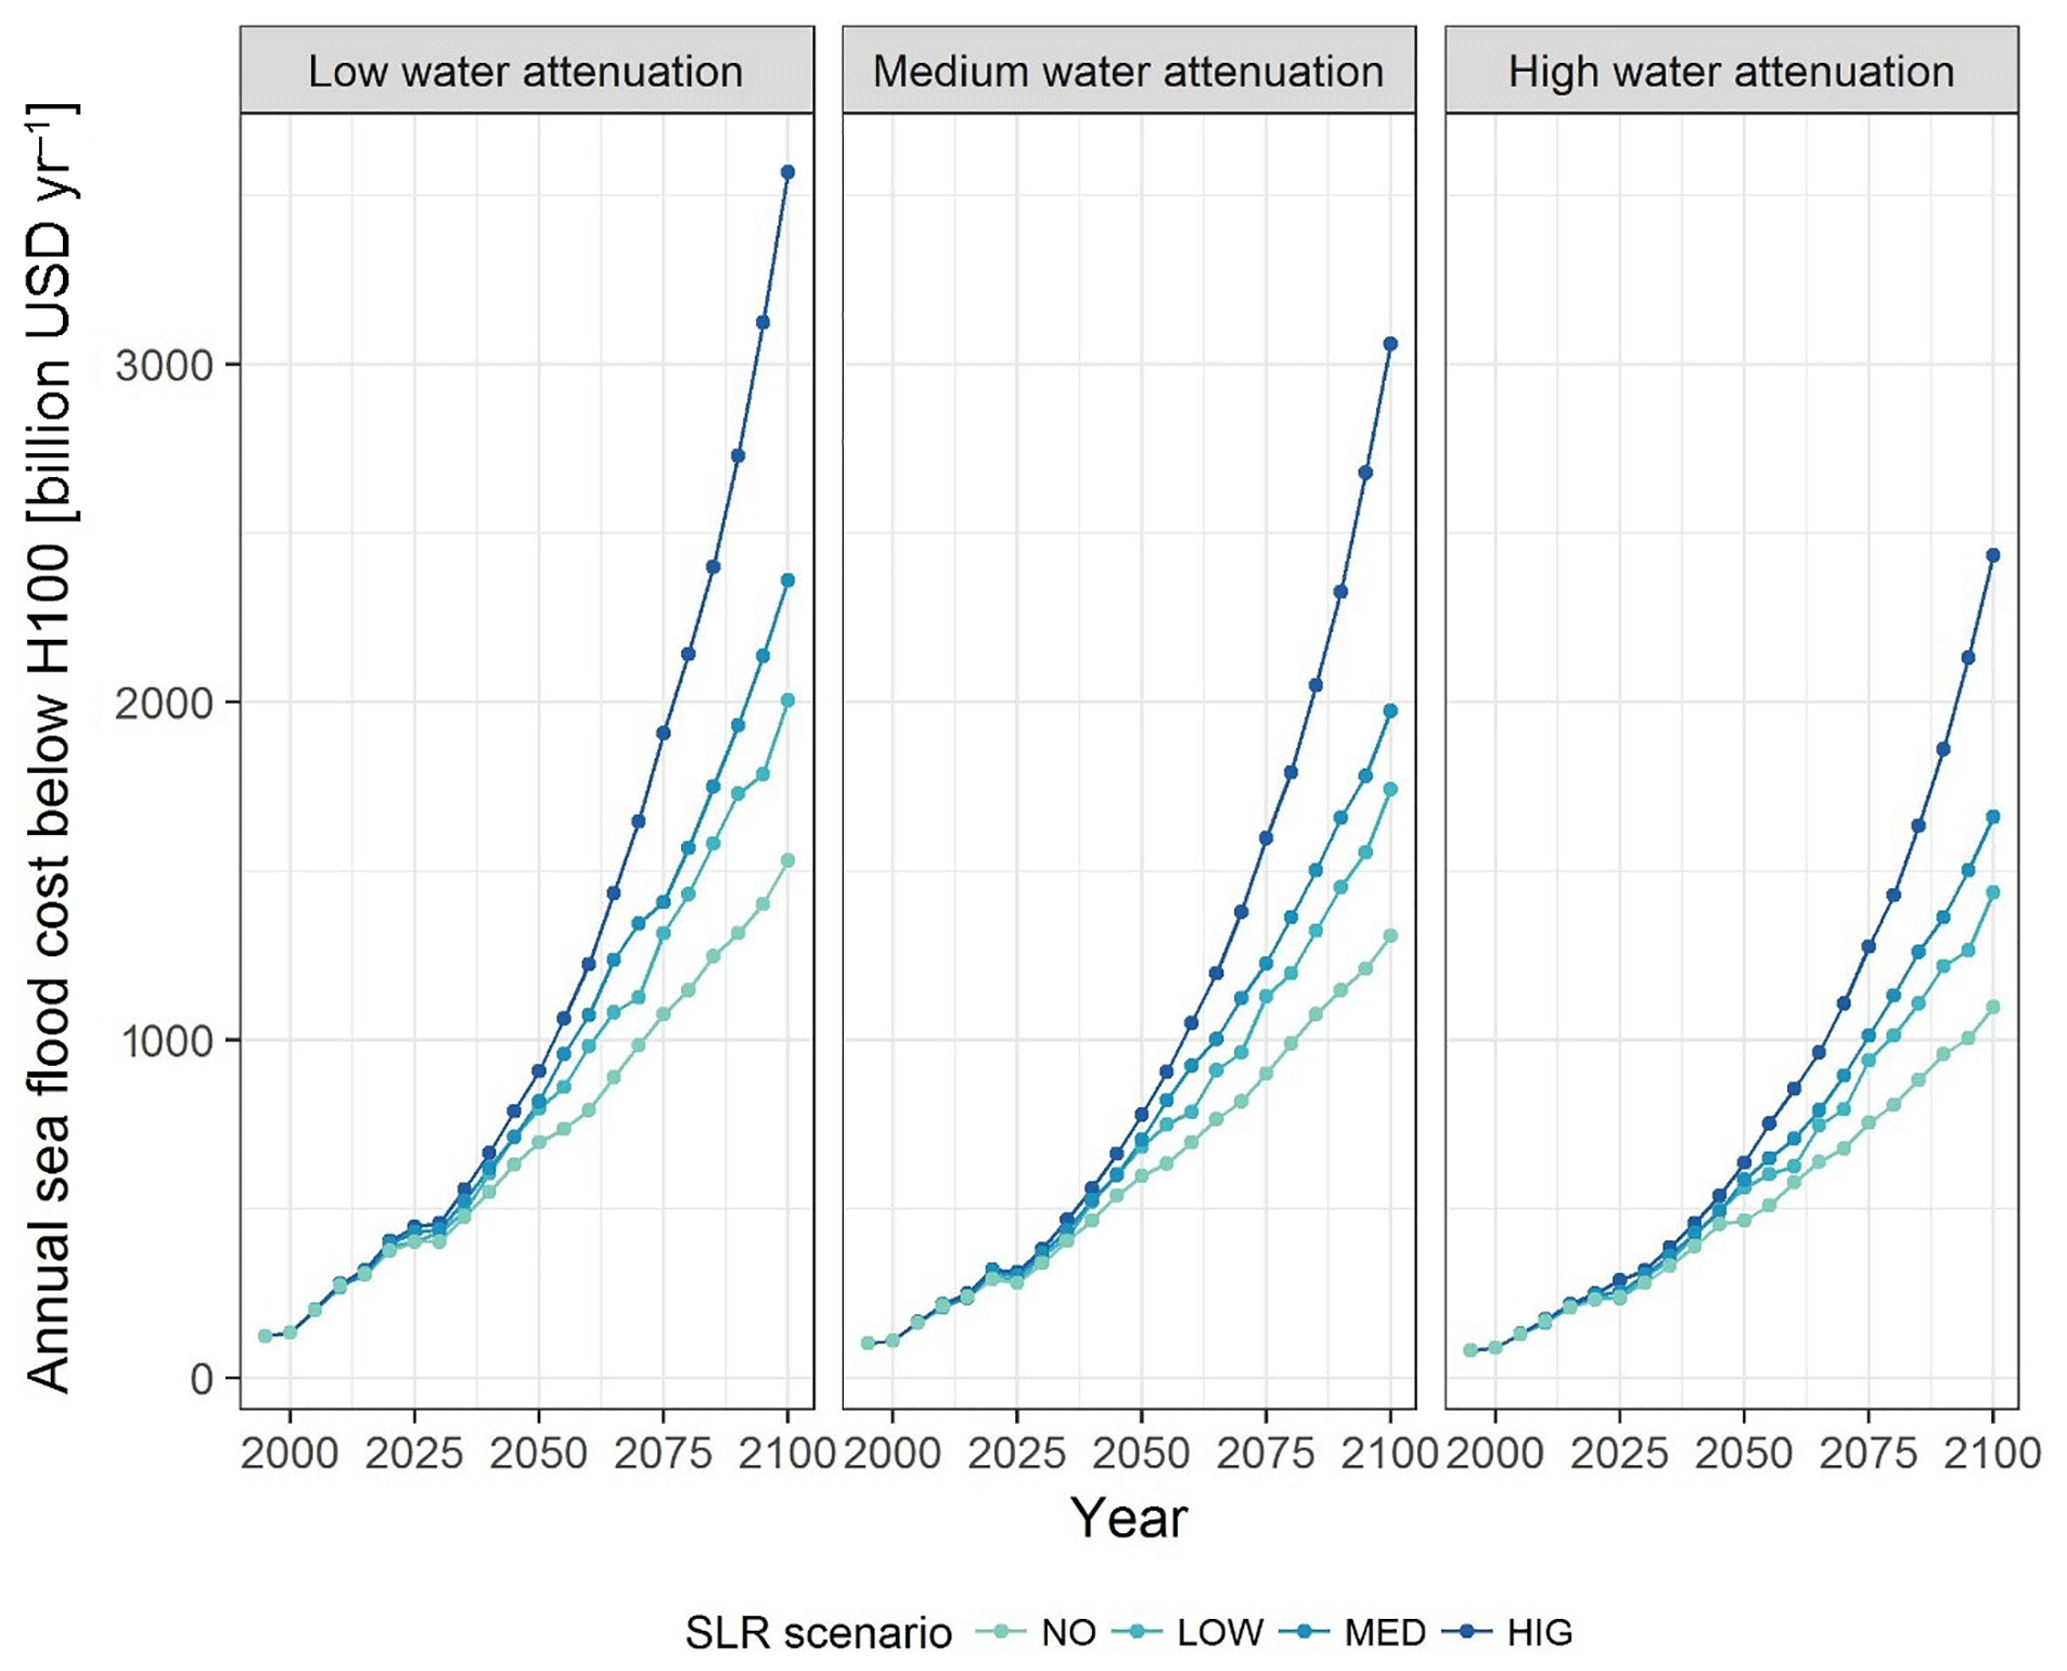
Figure 7Comparison of the temporal evolution of sea-flood-damage estimates for low, medium and high attenuation rates for different SLR scenarios.
This study highlights the importance of accounting for the effects of hydrodynamic processes when assessing the impacts of coastal flooding at national to global scales. In particular, water-level attenuation from the interaction of extreme inundation events with vegetated surfaces can lead to considerably lower estimates of exposure of land area and population to coastal flooding. Furthermore, this effect can lead to large reductions in potential damages, as lower water depths combined with smaller flood extents give significantly lower flood-damage costs. The reduction in exposure and risk is very pronounced, even when considering low water-level attenuation rates.
Accounting for water-level attenuation appears to be as important in assessing impacts as accounting for uncertainties related to the total magnitude of SLR. In many of the cases explored, the difference in impacts between no- and high-SLR scenarios is similar to the difference in impacts between no and low attenuation rates of up to 12.5 cm km−1 (excluding urban land use). This finding is of particular relevance in environments where the floodplain substantially extends inland, such as in many of the world's deltas and coastal plains.
It is widely acknowledged that the use of simplified methods, such as the bathtub method, can provide useful first-order estimates of global impacts of SLR and associated flooding (Lichter et al., 2011; Hinkel et al., 2014), although an overestimation of flood extent and depth with the use of the bathtub method should be generally anticipated (Vousdoukas et al., 2016). Further, we must note that the reduction that we observe with the use of water-level attenuation rates does not necessarily reflect actual impacts. These are likely to depend on additional factors, which are usually not considered in global assessments. For example, damage to assets in our analysis is based solely on water depth; factors such as high local flow velocities from channelised flow, storm wave impacts, inundation by saline water and sedimentation from flood waters are not taken into account. Such contributory factors can lead to an increased cost of damages and thus counteract the lower impacts predicted from the use of a water-level attenuation term alone. Furthermore, the analysis reported here is predicated on the assumption of a continuous increase in elevation with increasing distance from the shore. This study shows that whilst this assumption is valid for the majority of coastal segments, there are segments where this assumption does not hold true. In these cases model outputs may poorly describe flood areas, flooded population numbers and asset damages and incorrectly predict the effect of changes in the rate of water-level attenuation. New improved versions of the SRTM elevation model (Yamazaki et al., 2017) may help to partly address this limitation, while the lack of open-access elevation data of higher accuracy and resolution still constitutes a significant limitation for global studies (Schumann and Bates, 2018). Nevertheless, and despite these caveats, our results emphasise the importance of accounting for uncertainties in impact assessments stemming from the lack of consideration of water-level attenuation over coastal plains.
Our approach means to provide an illustration of the potential effects of water-level attenuation, as this process is not constant throughout the floodplain and depends on numerous parameters beyond the type of the surface cover. These factors include storm duration, wind direction, water depth and vegetation traits (Resio and Westerink, 2008; Smith et al., 2016; Stark et al., 2016). Furthermore, applying a constant slope to account for water-level attenuation is a strong simplification, since this will vary between different storm events, but also under the influence of SLR. Nevertheless, given the very high sensitivity of the outputs to even small changes in water-level reduction rates, and the obvious lack of sufficient data on the actual effect of different types of surface on attenuating water levels during surges, we suggest that future work needs to focus on quantifying the water-level attenuation terms for different land uses. Thus, for example, both Brown et al. (2007), in the case of modelled flooding following storm-surge-induced sea defence failure, and Kaiser et al. (2011), in the case of modelled tsunami wave impacts, have shown that disregarding buildings and associated infrastructure (roads, gardens, ditches) when assessing inundation can lead to a large overestimation of the extent of flooding. Furthermore, given the large range of uncertainty with respect to the actual values of water-level reduction associated with just one surface cover, wetland habitat (Table 1), future impact modelling needs to focus on a better understanding of the temporal and spatial variation of water levels across floodplains that show a wide variety of land use types and human occupancy, including densely urbanised regions (e.g. Lewis et al., 2013; Blumberg et al., 2015).
Given that coastal wetlands can efficiently attenuate surge water levels, the results of this study give a first estimate of how much of an impact reduction may result from the implementation of large-scale, ecosystem-based flood risk reduction management schemes (e.g. Temmerman et al., 2013). In addition, achieving lower water levels through the establishment of coastal wetlands not only reduces impacts but may also affect the timing of potential adaptation tipping points by extending the anticipated lifetime of adaptation measures. This would allow the development of alternative adaptation pathways, a sequential series of linked adaptation options triggered by changes in external conditions (Barbier, 2015), for coastal regions.
Data are made available in the main tables. Additional data that support the findings of this study are available upon reasonable request.
ATV and MS designed the research, with support from TS. MS extended the code for the simulations. MS, CW, JLM prepared the data and conducted the simulations, with support from DL. CW, JLM and ATV analysed the results. ATV prepared the manuscript with contributions from TS, MS, CW, JLM, JH, DL, SB and RJN. All authors discussed, reviewed and edited the different versions of the manuscript.
The authors declare that they have no conflict of interest.
This article is part of the special issue “Global- and continental-scale risk assessment for natural hazards: methods and practice”. It is a result of the European Geosciences Union General Assembly 2018, Vienna, Austria, 8–13 April 2018.
Athanasios T. Vafeidis, Jan L. Merkens, Jochen Hinkel, Daniel Lincke, Sally Brown and Robert J. Nicholls received funding from the European Union's Seventh Framework Programme for Research, Technological Development and Demonstration under grant agreement no. 603396 (RISES-AM project). This work is a contribution (Tom Spencer) to “Physical and biological dynamic coastal processes and their role in coastal recovery” (BLUECoast), UKRI NERC (NE/N015878/1).
This paper was edited by Hessel Winsemius and reviewed by two anonymous referees.
Arkema, K. K., Guannel, G., Verutes, G., Wood, S. A., Guerry, A., Ruckelshaus, M., Kareiva, P., Lacayo, M., and Silver, J. M.: Coastal habitats shield people and property from sea-level rise and storms, Nat. Clim. Change, 3, 913–918, https://doi.org/10.1038/nclimate1944, 2013.
Barbier, E. B.: Valuing the storm protection service of estuarine and coastal ecosystems, Ecosyst. Serv., 11, 32–38, https://doi.org/10.1016/j.ecoser.2014.06.010, 2015.
Barbier, E. B., Georgiou, I. Y., Enchelmeyer, B., and Reed, D. J.: The Value of Wetlands in Protecting Southeast Louisiana from Hurricane Storm Surges, Plos One, 8, e58715, https://doi.org/10.1371/journal.pone.0058715, 2013.
Bates, P. D., Horritt, M. S., and Fewtrell, T. J.: A simple inertial formulation of the shallow water equations for efficient two-dimensional flood inundation modelling, J. Hydrol., 387, 33–45, https://doi.org/10.1016/j.jhydrol.2010.03.027, 2010.
Blumberg, A. F., Georgas, N., Yin, L., Herrington, T. O., and Orton, P. M.: Street-Scale Modeling of Storm Surge Inundation along the New Jersey Hudson River Waterfront, J. Atmos. Ocean. Tech., 32, 1486–1497, https://doi.org/10.1175/jtech-d-14-00213.1, 2015.
Brown, J. D., Spencer, T., and Moeller, I.: Modeling storm surge flooding of an urban area with particular reference to modeling uncertainties: A case study of Canvey Island, United Kingdom, Water Resour. Res., 43, W06402, https://doi.org/10.1029/2005wr004597, 2007.
Brown, S., Nicholls, R. J., Lowe, J. A., and Hinkel, J.: Spatial variations of sea-level rise and impacts: An application of DIVA, Climatic Change, 134, 403–416, https://doi.org/10.1007/s10584-013-0925-y, 2016.
Dasgupta, S., Laplante, B., Murray, S., and Wheeler, D.: Exposure of developing countries to sea-level rise and storm surges, Climatic Change, 106, 567–579, https://doi.org/10.1007/s10584-010-9959-6, 2011.
de Moel, H., Jongman, B., Kreibich, H., Merz, B., Penning-Rowsell, E., and Ward, P. J.: Flood risk assessments at different spatial scales, Mitig. Adapt. Strat. Gl., 20, 865–890, https://doi.org/10.1007/s11027-015-9654-z, 2015.
Hinkel, J. and Klein, R. J. T.: Integrating knowledge to assess coastal vulnerability to sea-level rise: The development of the DIVA tool, Global Environ. Chang., 19, 384–395, https://doi.org/10.1016/j.gloenvcha.2009.03.002, 2009.
Hinkel, J., Nicholls, R. J., Vafeidis, A. T., Tol, R. S. J., and Avagianou, T.: Assessing risk of and adaptation to sea-level rise in the European Union: an application of DIVA, Mitig. Adapt. Strat. Gl., 15, 703–719, https://doi.org/10.1007/s11027-010-9237-y, 2010.
Hinkel, J., Nicholls, R. J., Tol, R. S. J., Wang, Z. B., Hamilton, J. M., Boot, G., Vafeidis, A. T., McFadden, L., Ganopolski, A., and Klein, R. J. T.: A global analysis of erosion of sandy beaches and sea-level rise: An application of DIVA, Global Planet. Change, 111, 150–158, https://doi.org/10.1016/j.gloplacha.2013.09.002, 2013.
Hinkel, J., Lincke, D., Vafeidis, A. T., Perrette, M., Nicholls, R. J., Tol, R. S. J., Marzeion, B., Fettweis, X., Ionescu, C., and Levermann, A.: Coastal flood damage and adaptation costs under 21st century sea-level rise, P. Natl. Acad. Sci. USA, 111, 3292–3297, https://doi.org/10.1073/pnas.1222469111, 2014.
Hu, K. L., Chen, Q., and Wang, H. Q.: A numerical study of vegetation impact on reducing storm surge by wetlands in a semi-enclosed estuary, Coast. Eng., 95, 66–76, https://doi.org/10.1016/j.coastaleng.2014.09.008, 2015.
Jarvis, A., Reuter, H. I., Nelson, A., and Guevara, E.: Hole-filled SRTM for the globe Version 4, available from the CGIAR-CSI SRTM 90m Database, available at: http://srtm.csi.cgiar.org (last access: 23 July 2018), 2008.
Jongman, B., Kreibich, H., Apel, H., Barredo, J. I., Bates, P. D., Feyen, L., Gericke, A., Neal, J., Aerts, J. C. J. H., and Ward, P. J.: Comparative flood damage model assessment: towards a European approach, Nat. Hazards Earth Syst. Sci., 12, 3733–3752, https://doi.org/10.5194/nhess-12-3733-2012, 2012a.
Jongman, B., Ward, P. J., and Aerts, J.: Global exposure to river and coastal flooding: Long term trends and changes, Global Environ. Chang., 22, 823–835, https://doi.org/10.1016/j.gloenvcha.2012.07.004, 2012b.
Kaiser, G., Scheele, L., Kortenhaus, A., Løvholt, F., Römer, H., and Leschka, S.: The influence of land cover roughness on the results of high resolution tsunami inundation modeling, Nat. Hazards Earth Syst. Sci., 11, 2521–2540, https://doi.org/10.5194/nhess-11-2521-2011, 2011.
Krauss, K. W., Doyle, T. W., Doyle, T. J., Swarzenski, C. M., From, A. S., Day, R. H., and Conner, W. H.: Water Level Observations In Mangrove Swamps During Two Hurricanes In Florida, Wetlands, 29, 142–149, https://doi.org/10.1672/07-232.1, 2009.
Kron, W.: Coasts: the high-risk areas of the world, Nat. Hazards, 66, 1363–1382, https://doi.org/10.1007/s11069-012-0215-4, 2013.
Lewis, M., Bates, P., Horsburgh, K., Neal, J., and Schumann, G.: A storm surge inundation model of the northern Bay of Bengal using publicly available data, Q. J. Roy. Meteor. Soc., 139, 358–369, https://doi.org/10.1002/qj.2040, 2013.
Lichter, M., Vafeidis, A. T., Nicholls, R. J., and Kaiser, G.: Exploring Data-Related Uncertainties in Analyses of Land Area and Population in the “Low-Elevation Coastal Zone” (LECZ), J. Coastal Res., 27, 757–768, https://doi.org/10.2112/Jcoastres-D-10-00072.1, 2011.
Liu, H. Q., Zhang, K. Q., Li, Y. P., and Xie, L.: Numerical study of the sensitivity of mangroves in reducing storm surge and flooding to hurricane characteristics in southern Florida, Cont. Shelf Res., 64, 51–65, https://doi.org/10.1016/j.csr.2013.05.015, 2013.
Loder, N. M., Irish, J. L., Cialone, M. A., and Wamsley, T. V.: Sensitivity of hurricane surge to morphological parameters of coastal wetlands, Estuar. Coast. Shelf Sci., 84, 625–636, 2009.
Lovelace, J. K.: Storm-tide elevations produced by Hurricane Andrew along the Louisiana coast, August 25–27, 1992, U.S. Geological Survey. Prepared in cooperation with the Federal Emergency Management Agency, Open-File Report, Baton Rouge, Louisiana, USA, 94–371, 1994.
McIvor, A. L., Spencer, T., Möller, I., and Spalding, M.: Storm surge reduction by mangroves, Natural Coastal Protection Series: Report 2, Cambridge Coastal Research Unit Working Paper 41, The Nature Conservancy and Wetlands International 36, Cambridge, UK, 2012.
McLeod, E., Poulter, B., Hinkel, J., Reyes, E., and Salm, R.: Sea-level rise impact models and environmental conservation: A review of models and their applications, Ocean Coast. Manage., 53, 507–517, https://doi.org/10.1016/j.ocecoaman.2010.06.009, 2010.
Menendez, M. and Woodworth, P. L.: Changes in extreme high water levels based on a quasi-global tide-gauge data set, J. Geophys. Res.-Oceans, 115, C10011, https://doi.org/10.1029/2009jc005997, 2010.
Messner, F., Penning-Rowsell, E., Green, C., Meyer, V., Tunstall, S., Van der Veen, A., Tapsell, S., Wilson, T., Krywkow, J., Logtmeijer, C., and Fernández-Bilbao, A.: Evaluating flood damages: guidance and recommendations on principles and methods, Floodsite Project, Deliverable 9.1, Leipzig, Germany, 2007.
Mondal, P. and Tatem, A. J.: Uncertainties in Measuring Populations Potentially Impacted by Sea Level Rise and Coastal Flooding, Plos One, 7, e48191, https://doi.org/10.1371/journal.pone.0048191, 2012.
Muis, S., Verlaan, M., Nicholls, R. J., Brown, S., Hinkel, J., Lincke, D., Vafeidis, A. T., Scussolini, P., Winsemius, H. C., and Ward, P. J.: A comparison of two global datasets of extreme sea levels and resulting flood exposure, Earths Future, 5, 379–392, https://doi.org/10.1002/2016ef000430, 2017.
Neumann, B., Vafeidis, A. T., Zimmermann, J., and Nicholls, R. J.: Future Coastal Population Growth and Exposure to Sea-Level Rise and Coastal Flooding – A Global Assessment, Plos One, 10, e0118571, https://doi.org/10.1371/journal.pone.0118571, 2015.
Nicholls, R. J.: Coastal flooding and wetland loss in the 21st century: changes under the SRES climate and socio-economic scenarios, Global Environ. Chang., 14, 69–86, https://doi.org/10.1016/j.gloenvcha.2003.10.007, 2004.
O'Neill, B. C., Kriegler, E., Riahi, K., Ebi, K. L., Hallegatte, S., Carter, T. R., Mathur, R., and van Vuuren, D. P.: A new scenario framework for climate change research: the concept of shared socioeconomic pathways, Climatic Change, 122, 387–400, https://doi.org/10.1007/s10584-013-0905-2, 2014.
Orton, P., Vinogradov, S., Georgas, N., Blumberg, A., Lin, N., Gornitz, V., Little, C., Jacob, K., and Horton, R.: New York City Panel on Climate Change 2015 Report Chapter 4: Dynamic Coastal Flood Modeling, in: Building the Knowledge Base for Climate Resiliency: New York City Panel on Climate Change 2015 Report, edited by: Rosenzweig, C., and Solecki, W., Annals of the New York Academy of Sciences, New York, USA, 56–66, 2015.
Penning-Rowsell, E. C., Parker, D. J., Morris, J., Viavattene, C., Chatterton, J., and Owen, D.: Flood and coastal erosion risk management: a manual for economic appraisal, Routledge, Taylor & Francis, London, UK, 2013.
Poulter, B. and Halpin, P. N.: Raster modelling of coastal flooding from sea-level rise, Int. J. Geogr. Inf. Sci., 22, 167–182, https://doi.org/10.1080/13658810701371858, 2008.
Ramirez, J. A., Lichter, M., Coulthard, T. J., and Skinner, C.: Hyper-resolution mapping of regional storm surge and tide flooding: comparison of static and dynamic models, Nat. Hazards, 82, 571–590, https://doi.org/10.1007/s11069-016-2198-z, 2016.
Resio, D. T. and Westerink, J. J.: Modeling the physics of storm surges, Phys. Today, 61, 33–38, https://doi.org/10.1063/1.2982120, 2008.
Schuerch, M., Spencer, T., Temmerman, S., Kirwan, M. L., Wolff, C., Lincke, D., McOwen, C. J., Pickering, M. D., Reef, R., Vafeidis, A. T., Hinkel, J., Nicholls, R. J., and Brown, S.: Future response of global coastal wetlands to sea-level rise, Nature, 561, 231–234, https://doi.org/10.1038/s41586-018-0476-5, 2018.
Schumann, G. J. P. and Bates, P. D.: The Need for a High-Accuracy, Open-Access Global DEM, Front. Earth Sci., 6, 225, https://doi.org/10.3389/feart.2018.00225, 2018.
Smith, J. M., Bryant, M. A., and Wamsley, T. V.: Wetland buffers: numerical modeling of wave dissipation by vegetation, Earth Surf. Proc. Land., 41, 847–854, https://doi.org/10.1002/esp.3904, 2016.
Spencer, T., Schuerch, M., Nicholls, R. J., Hinkel, J., Lincke, D., Vafeidis, A. T., Reef, R., McFadden, L., and Brown, S.: Global coastal wetland change under sea-level rise and related stresses: The DIVA Wetland Change Model, Global Planet. Change, 139, 15–30, https://doi.org/10.1016/j.gloplacha.2015.12.018, 2016.
Stark, J., Plancke, Y., Ides, S., Meire, P., and Temmerman, S.: Coastal flood protection by a combined nature-based and engineering approach: Modeling the effects of marsh geometry and surrounding dikes, Estuar. Coast. Shelf S., 175, 34–45, https://doi.org/10.1016/j.ecss.2016.03.027, 2016.
Temmerman, S., De Vries, M. B., and Bouma, T. J.: Coastal marsh die-off and reduced attenuation of coastal floods: A model analysis, Global Planet. Change, 92–93, 267–274, https://doi.org/10.1016/j.gloplacha.2012.06.001, 2012.
Temmerman, S., Meire, P., Bouma, T. J., Herman, P. M. J., Ysebaert, T., and De Vriend, H. J.: Ecosystem-based coastal defence in the face of global change, Nature, 504, 79–83, https://doi.org/10.1038/nature12859, 2013.
Thieken, A. H., Muller, M., Kreibich, H., and Merz, B.: Flood damage and influencing factors: New insights from the August 2002 flood in Germany, Water Resour. Res., 41, W12430, https://doi.org/10.1029/2005wr004177, 2005.
Vafeidis, A. T., Nicholls, R. J., McFadden, L., Tol, R. S. J., Hinkel, J., Spencer, T., Grashoff, P. S., Boot, G., and Klein, R. J. T.: A new global coastal database for impact and vulnerability analysis to sea-level rise, J. Coastal Res., 24, 917–924, https://doi.org/10.2112/06-0725.1, 2008.
Vousdoukas, M. I., Voukouvalas, E., Annunziato, A., Giardino, A., and Feyen, L.: Projections of extreme storm surge levels along Europe, Clim. Dynam., 47, 3171–3190, https://doi.org/10.1007/s00382-016-3019-5, 2016.
Vousdoukas, M. I., Bouziotas, D., Giardino, A., Bouwer, L. M., Mentaschi, L., Voukouvalas, E., and Feyen, L.: Understanding epistemic uncertainty in large-scale coastal flood risk assessment for present and future climates, Nat. Hazards Earth Syst. Sci., 18, 2127–2142, https://doi.org/10.5194/nhess-18-2127-2018, 2018a.
Vousdoukas, M. I., Mentaschi, L., Voukouvalas, E., Bianchi, A., Dottori, F., and Feyen, L.: Climatic and socioeconomic controls of future coastal flood risk in Europe, Nat. Clim. Change, 8, 776–780, https://doi.org/10.1038/s41558-018-0260-4, 2018b.
Wadey, M. P., Nicholls, R. J., and Hutton, C.: Coastal Flooding in the Solent: An Integrated Analysis of Defences and Inundation, Water, 4, 430–459, https://doi.org/10.3390/w4020430, 2012.
Wamsley, T. V., Cialone, M. A., Smith, J. M., Ebersole, B. A., and Grzegorzewski, A. S.: Influence of landscape restoration and degradation on storm surge and waves in southern Louisiana, Nat. Hazards, 51, 207–224, https://doi.org/10.1007/s11069-009-9378-z, 2009.
Wamsley, T. V., Cialone, M. A., Smith, J. M., Atkinson, J. H., and Rosati, J. D.: The potential of wetlands in reducing storm surge, Ocean Eng., 37, 59–68, https://doi.org/10.1016/j.oceaneng.2009.07.018, 2010.
Ward, P. J., Jongman, B., Weiland, F. S., Bouwman, A., van Beek, R., Bierkens, M. F. P., Ligtvoet, W., and Winsemius, H. C.: Assessing flood risk at the global scale: model setup, results, and sensitivity, Environ. Res. Lett., 8, 044019, https://doi.org/10.1088/1748-9326/8/4/044019, 2013a.
Ward, P. J., Pauw, W. P., van Buuren, M. W., and Marfai, M. A.: Governance of flood risk management in a time of climate change: the cases of Jakarta and Rotterdam, Environ. Polit., 22, 518–536, https://doi.org/10.1080/09644016.2012.683155, 2013b.
Ward, P. J., Jongman, B., Kummu, M., Dettinger, M. D., Weiland, F. C. S., and Winsemius, H. C.: Strong influence of El Nino Southern Oscillation on flood risk around the world, P. Natl. Acad. Sci. USA, 111, 15659–15664, https://doi.org/10.1073/pnas.1409822111, 2014.
Wong, P. P., Losada, I. J., Gattuso, J. P., Hinkel, J., Khattabi, A., McInnes, K. L., Saito, Y., Sallenger, A., Cheong, S. M., Dow, K., Duarte, C. M., Ebi, K. L., Faulkner, L., Isobe, M., Middelburg, J., Moser, S., Pelling, M., Penning-Rowsell, E., Seitzinger, S., Stive, M., Tol, R. S. J., and Vafeidis, A.: Coastal Systems and Low-Lying Areas, Climate Change 2014: Impacts, Adaptation, and Vulnerability, Pt a: Global and Sectoral Aspects: Working Group Ii Contribution to the Fifth Assessment Report of the Intergovernmental Panel on Climate Change, edited by: Field, C. B., Barros, V. R., Dokken, D. J., Mach, K. J., Mastrandrea, M. D., Bilir, T. B., Chatterjee, M., Ebi, K. L., Estrada, Y. O., Genova, R. C., Girma, B., Kissel, E. S., Levy, A. N., MacCracken, S., Mastrandrea, P. R., and White, L. L., Cambridge, UK and New York, NY, USA, 361–409, 2014.
Yamazaki, D., Ikeshima, D., Tawatari, R., Yamaguchi, T., O'Loughlin, F., Neal, J. C., Sampson, C. C., Kanae, S., and Bates, P. D.: A high-accuracy map of global terrain elevations, Geophys. Res. Lett., 44, 5844–5853, https://doi.org/10.1002/2017gl072874, 2017.
Zhang, K. Q., Liu, H. Q., Li, Y. P., Xu, H. Z., Shen, J., Rhome, J., and Smith, T. J.: The role of mangroves in attenuating storm surges, Estuar. Coast. Shelf S., 102, 11–23, https://doi.org/10.1016/j.ecss.2012.02.021, 2012.