Otoferlin acts as a Ca2+ sensor for vesicle fusion and vesicle pool replenishment at auditory hair cell ribbon synapses
- Institut Pasteur, France
- UMRS 1120, Institut National de la Santé et de la Recherche Médicale, France
- Sorbonne Universités, UPMC Université Paris 06, Complexité du Vivant, France
- Instituto de Investigaciones en Ingeniería Genética y Biología Molecular, Consejo Nacional de Investigaciones Científicas y Técnicas, Argentina
- Yale University School of Medicine, United States
- Université de Bordeaux, France
- University Paris Descartes, Sorbonne Paris Cité, France
- Ultrapole, Institut Pasteur, France
- Centre National de la Recherche Scientifique, France
- Texas Tech University Health Sciences Center, United States
- Université Clermont Auvergne, France
- UMR 1107, Institut National de la Santé et de la Recherche Médicale, France
- Centre Jean Perrin, France
- Institute of Neurology, University College London, United Kingdom
- Institut de la Vision, France
- Collège de France, France
Abstract
Hearing relies on rapid, temporally precise, and sustained neurotransmitter release at the ribbon synapses of sensory cells, the inner hair cells (IHCs). This process requires otoferlin, a six C2-domain, Ca2+-binding transmembrane protein of synaptic vesicles. To decipher the role of otoferlin in the synaptic vesicle cycle, we produced knock-in mice (Otof Ala515,Ala517/Ala515,Ala517) with lower Ca2+-binding affinity of the C2C domain. The IHC ribbon synapse structure, synaptic Ca2+ currents, and otoferlin distribution were unaffected in these mutant mice, but auditory brainstem response wave-I amplitude was reduced. Lower Ca2+ sensitivity and delay of the fast and sustained components of synaptic exocytosis were revealed by membrane capacitance measurement upon modulations of intracellular Ca2+ concentration, by varying Ca2+ influx through voltage-gated Ca2+-channels or Ca2+ uncaging. Otoferlin thus functions as a Ca2+ sensor, setting the rates of primed vesicle fusion with the presynaptic plasma membrane and synaptic vesicle pool replenishment in the IHC active zone.
https://doi.org/10.7554/eLife.31013.001Introduction
The extremely precise encoding of sound temporal features by the first synapse of the mammalian auditory system, that is, between the sensory inner hair cell (IHC) and the primary auditory neuron, is crucial for many perceptive tasks. It is involved in periodicity-pitch detection, prosody cue detection, and sound source localization required for voice and melody identification, speech perception, and auditory scene analysis, respectively (Schnupp et al., 2011). Sound-evoked mechanical stimulation of the IHC sensory antenna, the hair bundle, induces changes in membrane potential, modulating synaptic exocytosis with submillisecond precision (Glowatzki and Fuchs, 2002; Goutman, 2012; Li et al., 2014). This temporal precision exceeds that for most conventional synapses, and allows sound-evoked action potentials of the primary auditory neurons to be phase-locked to the sinusoidal acoustic signal up to frequencies of ~4 kHz (Fuchs, 2005; Moser et al., 2006; Safieddine et al., 2012). In addition, IHCs can maintain neurotransmitter release at high frequency for several minutes (Kiang, 1965), which implies a continuous supply of an unusually large number of vesicles to the synaptic active zones. The basolateral region of IHCs contains 10 to 30 synaptic active zones, each of which faces the single dendritic bouton of a primary auditory neuron. Most of the vesicles in each synapse are tethered to a ribbon-shaped osmiophilic structure (hence the name ‘ribbon synapse’), presumably forming a pool of primed vesicles for the immediate and sustained replenishment of the pool of fusion-competent vesicles located between the base of the ribbon and the presynaptic plasma membrane (von Gersdorff and Matthews, 1997; Lenzi et al., 1999; Moser and Beutner, 2000).
Mature IHCs lack several common synaptic proteins (Safieddine and Wenthold, 1999; Vogl et al., 2015). The molecular composition of the exocytosis machinery underlying the functional features of IHC synapses remains largely unknown. In particular, mature IHC synapses lack the synaptic vesicle transmembrane proteins synaptotagmin 1 and 2 (Syt1 and Syt2) (Safieddine and Wenthold, 1999; Beurg et al., 2010), which function as Ca2+ sensors for rapid, synchronous neurotransmitter release at central nervous system synapses (Südhof, 2013). These proteins, which contain two cytoplasmic C2-domains, bind to membrane phospholipids in a Ca2+-dependent manner (Brose et al., 1992; Sutton et al., 1995; Wang et al., 2014), and trigger the final steps of synaptic exocytosis by interacting with complexin and the SNARE molecular complex (Bennett et al., 1992; Söllner et al., 1993; Li et al., 1995; Giraudo et al., 2006; Südhof, 2013). However, unlike vesicles of central nervous system synapses, IHC vesicles contain otoferlin, a Ca2+-binding single-pass membrane protein with six C2 domains (C2A-F) and two Fer domains in its cytoplasmic region (Yasunaga et al., 1999; Roux et al., 2006; Lek et al., 2010). Otoferlin belongs to the ferlin family, which is thought to have originated earlier than synaptotagmins and E-synaptotagmins during evolution (Lek et al., 2012) (Figure 1A). Otoferlin, defective in a recessive form of profound congenital deafness (Yasunaga et al., 1999; Roux et al., 2006; Lek et al., 2010), is required for normal synaptic exocytosis in auditory (Roux et al., 2006) and vestibular hair cells (Dulon et al., 2009). Its role in the hair cell synaptic vesicle cycle remains unclear. IHC synaptic exocytosis is almost entirely abolished in adult mutant mice lacking otoferlin (Otof -/- mice), despite normal Ca2+ currents and ribbon synapse morphogenesis (Roux et al., 2006). This finding, together with the absence of Syt1, Syt2, and Syt9 from mature IHCs (Safieddine and Wenthold, 1999; Beurg et al., 2010), has led to the hypothesis that otoferlin acts as the major Ca2+ sensor triggering synaptic vesicle fusion with the plasma membrane in the IHC active zone (Roux et al., 2006). However, the IHC synapses of Otof -/- mice being silent, these mice cannot be used to determine in which step(s) of the synaptic vesicle cycle otoferlin exerts its putative Ca2+ sensing role. The Pachanga mutant, a deaf mouse harboring a missense mutation in the otoferlin C2F domain, showed unaffected vesicle fusion but a major decrease of the sustained component of IHC synaptic exocytosis (Pangrsic et al., 2010), which led Pangrsic and coll. to suggest a role for otoferlin in synaptic vesicle pool replenishment. However, the Ca2+ sensing role of otoferlin could not be assessed in the Pachanga mice because the mutation does not target a Ca2+-binding site and the otoferlin cell content is much lower than normal. Nevertheless, the results obtained in these mice raise the possibility that a deficiency in the dynamics of vesicle pool replenishment explains the synaptic exocytosis defect in Otof -/- mice, despite their unaffected number of synaptic vesicles at the presynaptic zone (Roux et al., 2006). Of note, Otof I515T/I515T knock-in mice, harboring a Ile515Thr missense mutation in the C2C domain, also display abnormal synaptic exocytosis and sustained release (Strenzke et al., 2016). Similarly to the Pachanga mutation, the Ile515Thr mutation does not affect the Ca2+-binding site of the C2 domain, and results in a strongly reduced otoferlin content, again precluding any conclusion regarding a possible Ca2+ sensing role of otoferlin in synaptic vesicle pool replenishment. Finally, a possible role of otoferlin in synaptic endocytosis and the reformation of correctly sized vesicles has been suggested, based on the in vitro interaction between otoferlin and the AP-2 adaptor protein complex involved in clathrin-mediated endocytosis (Duncker et al., 2013), the presence of large abnormal endosome-like vacuoles containing otoferlin in the IHCs of mutant mice lacking AP-2µ (Revelo et al., 2014; Jung et al., 2015), and the presence of enlarged otoferlin-immunoreactive vesicular structures, potentially of endosomal origin, in Otof I515T/I515T mutant mice (Strenzke et al., 2016).
Figure 1
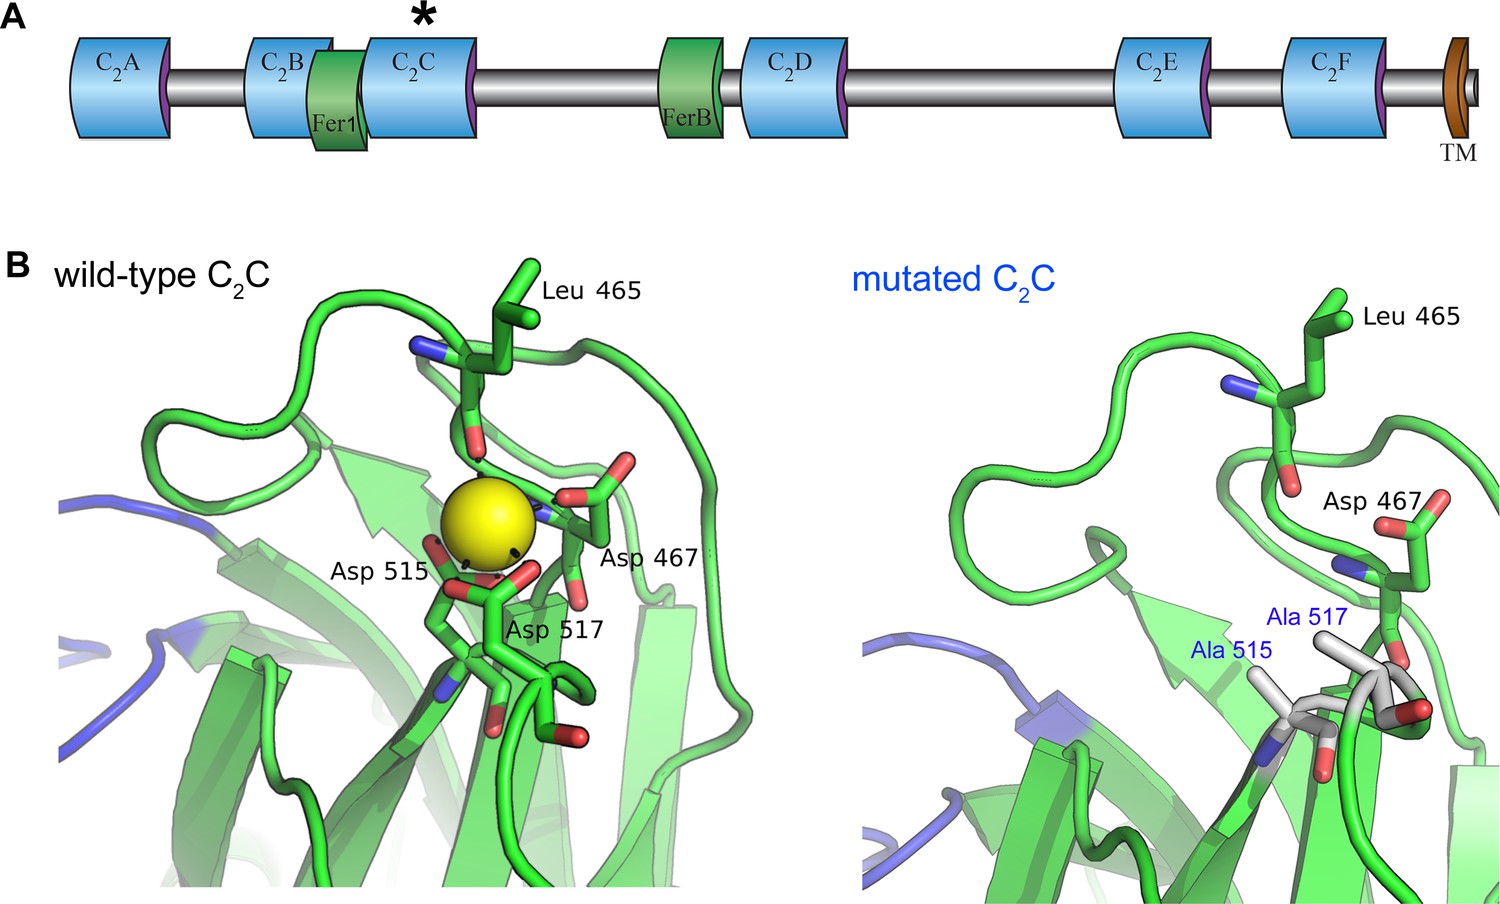
Homology model of the otoferlin C2C domain.
(A) Predicted domain structure of the otoferlin protein. Otoferlin is a transmembrane vesicular protein (1997 amino acids in the mouse) consisting of six C2 domains (C2A-F), one Fer1 domain, and one FerB domain (central domains of still unknown function in proteins of the ferlin family) in its extravesicular (i.e cytoplasmic) portion. The asterisk indicates the C2C domain targeted for mutagenesis. (B) Ten candidate models were calculated with MODELLER (Webb and Sali, 2014), based on the X-ray structure of the human dysferlin C2A domain (4ihb) (Fuson et al., 2014). The primary sequence identity between dysferlin C2A and mouse otoferlin C2C, assuming type II C2 domain topology, is 23%. The model with the lowest energy score was selected for analysis. Further refinement was performed with ModRefiner (Xu and Zhang, 2011) using dysferlin C2A as the structural reference. At least one Ca2+ ion (yellow sphere) could be modeled in the C2C domain of otoferlin. The position and coordination of this ion within the putative divalent cation binding pocket of the homology model was refined by simulating 20 ns of molecular dynamics using NAMD (Phillips et al., 2005).
We sought to identify the step(s) of the synaptic vesicle cycle at which otoferlin may act as a Ca2+ sensor, by generating a mutant mouse line carrying otoferlin mutations modifying the binding of Ca2+ ions to a C2 domain whilst preserving both protein levels and the ultrastructure of the IHC ribbon synapse. By studying these mice, we were able to demonstrate the Ca2+ sensing role of otoferlin both in the fusion of synaptic vesicles with the presynaptic membrane and in vesicle pool replenishment.
Results
Genetic modification of the otoferlin C2C domain Ca2+-binding site
We investigated the roles of otoferlin in the IHC synaptic vesicle cycle through a mutagenesis strategy similar to that previously used to demonstrate that Syt1 and Syt2 function as Ca2+ sensors for fast exocytosis, and that Syt7 functions as the Ca2+ sensor for synaptic facilitation, at central nervous system synapses (Fernández-Chacón et al., 2001; Schneggenburger et al., 2012; Jackman et al., 2016). The Ca2+-binding pockets of the Syt C2-domains consist of a cluster of conserved aspartic acid residues surrounded by a ring of positively charged residues (Sutton et al., 1995; Shao et al., 1996). Substitution of any of these residues reduces the Ca2+-binding affinity of Syt1 and Syt2, decreasing the Ca2+ sensitivity of exocytosis, or that of Syt7, eliminating facilitation (Fernández-Chacón et al., 2001; Schneggenburger et al., 2012; Jackman et al., 2016). The otoferlin C2A domain does not bind Ca2+, but the C2 B-F domains have sizeable in vitro Ca2+-binding affinities (about 13–25 µM) (Johnson and Chapman, 2010). The C2C and C2F domains have been shown to interact specifically with phosphatidylinositol 4,5-bisphosphate [PI(4,5)P2] in vitro, suggesting a possible role in mediating the preferential membrane targeting of otoferlin (Padmanarayana et al., 2014). In addition, the neutralization of two aspartic acid residues (Asp515 and Asp517) in the otoferlin C2C domain has been shown to prevent C2C domain-mediated membrane fusion in in vitro assays (Johnson and Chapman, 2010). These results prompted us to target the C2C domain for in vivo mutagenesis. Using the crystal structure of the dysferlin C2A domain as a template (Fuson et al., 2014), we constructed a homology model of otoferlin C2C, to predict the structure of the Ca2+-binding site of the C2C domain. Otoferlin C2C probably folds into a typical type-II C2 domain. At least one Ca2+ ion could be bound by three aspartic acid residues (Asp467, Asp515, and Asp517) located on top loops 1 and 3 of the C2C domain. The substitution of two of these aspartic acid residues by alanine residues (Asp515Ala and Asp517Ala) is predicted to affect Ca2+ binding (Figure 1B). We therefore generated a knock-in mouse line carrying these two missense mutations in the homozygous state, Otof Ala515,Ala517/Ala515,Ala517 mice (hereafter referred to as Otof C2C/C2C mice), by homologous recombination (see Materials and methods).
Otof C2C/C2C mice have abnormal auditory nerve fiber responses
We first recorded auditory brainstem responses (ABRs), to monitor the electrical response of the primary auditory neurons and the successive neuronal relays of the central auditory pathway to brief sound stimuli, in Otof +/+, Otof C2C/+, and Otof C2C/C2C mice. At the age of one month, ABR thresholds were similar in Otof +/+ (n = 5) and Otof C2C/+ (n = 4) mice (Figure 2—figure supplement 1A, p>0.3), but they were slightly higher in Otof C2C/C2C mice (n = 11), by about 5.4 ± 3.3 dB, on average, than in Otof C2C/+ mice (n = 9), for all frequencies tested (Figure 2A; two-way-ANOVA, p=0.04). Strikingly, the mean peak amplitude for ABR wave-I (in response to 100–200 tone bursts), reflecting the synchronous electrical response of primary afferent neurons, was lower in Otof C2C⁄C2Cmice (n = 7) than in Otof C2C/+ mice (n = 7), by a factor of 2.7 (Figure 2B–C and E) (p=0.006). This lower ABR wave-I amplitude did not affect ABR waves-II to V, which reflect the mean neuronal activity of the cochlear nucleus and higher auditory relays (Figure 2B). Earlier in development, on postnatal days 16–21 (P16-P21), the ABR thresholds of Otof C2C/C2C mice (n = 7) were similar to those of Otof C2C/+ mice (n = 8; Figure 2D; two-way-ANOVA, p>0.2), but the wave-I amplitude was already lower for all sound intensities tested between 35 dB and 105 dB (Figure 2D; two-way-ANOVA, p<10−4). From the age of three months onwards, ABR thresholds increased in Otof C2C/C2C mice (n = 5–6) to reach, on average, values 19 ± 5.8 dB higher than those in Otof C2C/+ mice (n = 5; Figure 2—figure supplement 1B; two-way-ANOVA, p<10−4 for the 3-month-old and 5-month-old mouse groups). The peak amplitude of the ABR wave-I also decreased further by a factor of about 10 (p<0.01, for all ages, with a minimum of 5 animals per group; Figure 2E). By contrast, distortion-product otoacoustic emissions (DPOAEs), which probe outer hair cell (OHC) function, were similar in Otof C2C/+ (n = 5) and Otof C2C/C2C (n = 5–8) mice, in terms of both threshold and amplitude. The cochlear amplification of sound stimuli was, thus, preserved in homozygous mutant mice (Figure 2—figure supplement 1C; two-way-ANOVA, p=0.6 and p=0.1 for the 1-month-old and 5-month-old mouse groups, respectively). Overall, the auditory phenotype of Otof C2C/C2C mice is consistent with the restriction of otoferlin dysfunction to IHCs (Roux et al., 2006), with the decrease in ABR wave-I amplitude suggesting a dysfunction of the ribbon synapses.
Figure 2 with 1 supplement see all

Smaller amplitude of ABR wave-I in Otof C2C/C2C mice.
(A) ABR thresholds of one-month-old Otof C2C/+ (black) and Otof C2C/C2C (blue) mice, for pure tone frequencies between 5 kHz and 32 kHz. (B) Mean ABR trace recorded in Otof C2C/+ (black line, n = 7 mice) and Otof C2C/C2C (blue line, n = 7 mice) mice upon a 95 dB SPL (sound pressure level) pure tone stimulation at 10 kHz. The gray area and the area between the blue dotted lines denote the overlapping 95% confidence intervals of the traces recorded in Otof C2C/+ and Otof C2C/C2C mice, respectively. (C) Detailed view of ABR wave-I from individual ABR recordings in the Otof C2C/C2C mice, used to calculate the mean traces in (B). Each colored trace corresponds to an individual Otof C2C/C2C mouse. The 95% confidence intervals of the mean traces in (B) are shown in gray for Otof C2C/+ mice. (D) Left: ABR thresholds of P16-P21 Otof C2C/+ (black) and Otof C2C/C2C (blue) mice, for pure tone frequencies between 5 kHz and 32 kHz. Right: Plot of the amplitude of ABR wave-I as a function of sound level for a 10 kHz pure tone. (E) Plot of ABR wave-I amplitude against age (sound at 10 kHz and 105 dB SPL; the numbers indicated in parentheses correspond to the number of mice studied at each age). Data information: In (A, D), data are presented as the mean ±SEM. *p<0.05, ***p<0.001, ns not significant (two-way-ANOVA test). In (B), data are presented as the mean and its 95% confidence intervals. In (E), data are presented as the mean ± SEM. **p<0.01, ***p<0.001 (Student's t-test with Welch correction).
Otof C2C/C2C IHCs have normal otoferlin contents and ribbon synapse ultrastructure
We analyzed the IHC ribbon synapses, immunofluorescently labeled for ribeye (a core ribbon protein), the presynaptic L-type Ca2+ channel Cav1.3, and the postsynaptic glutamate receptor GluA2 (Figure 3—figure supplement 1), by confocal microscopy, in Otof C2C/+ and Otof C2C/C2C mice on P15-P17 (i.e., a few days after hearing onset). All ribeye-immunoreactive ribbons in Otof C2C/+ and Otof C2C/C2C IHCs displayed Cav1.3 staining systematically apposed to the GluA2 subunit staining. The mean number of ribbons per IHC did not differ significantly between Otof C2C/+ mice (16.4 ± 0.2) and Otof C2C/C2C mice (16.2 ± 0.2) (63 IHCs from the apical coil of four mice per genotype, p=0.4). In mature IHCs of Otof C2C/+ and Otof C2C/C2C mice, otoferlin was detected throughout the cytosol, with intense immunolabeling of the basolateral region containing the ribbon synapses, whereas it was undetectable in the IHCs of Otof -/- mice, as previously reported (Roux et al., 2006) (Figure 3A–B). The immunofluorescence levels of otoferlin at the apex, middle, and base of IHCs were similar between Otof C2C/+ and Otof C2C/C2C mice (p>0.3 for all comparisons; Figure 3C), indicating that levels of otoferlin expression were unaffected in Otof C2C/C2C IHCs (n = 51 cells from seven mice for each genotype).
Figure 3 with 2 supplements see all
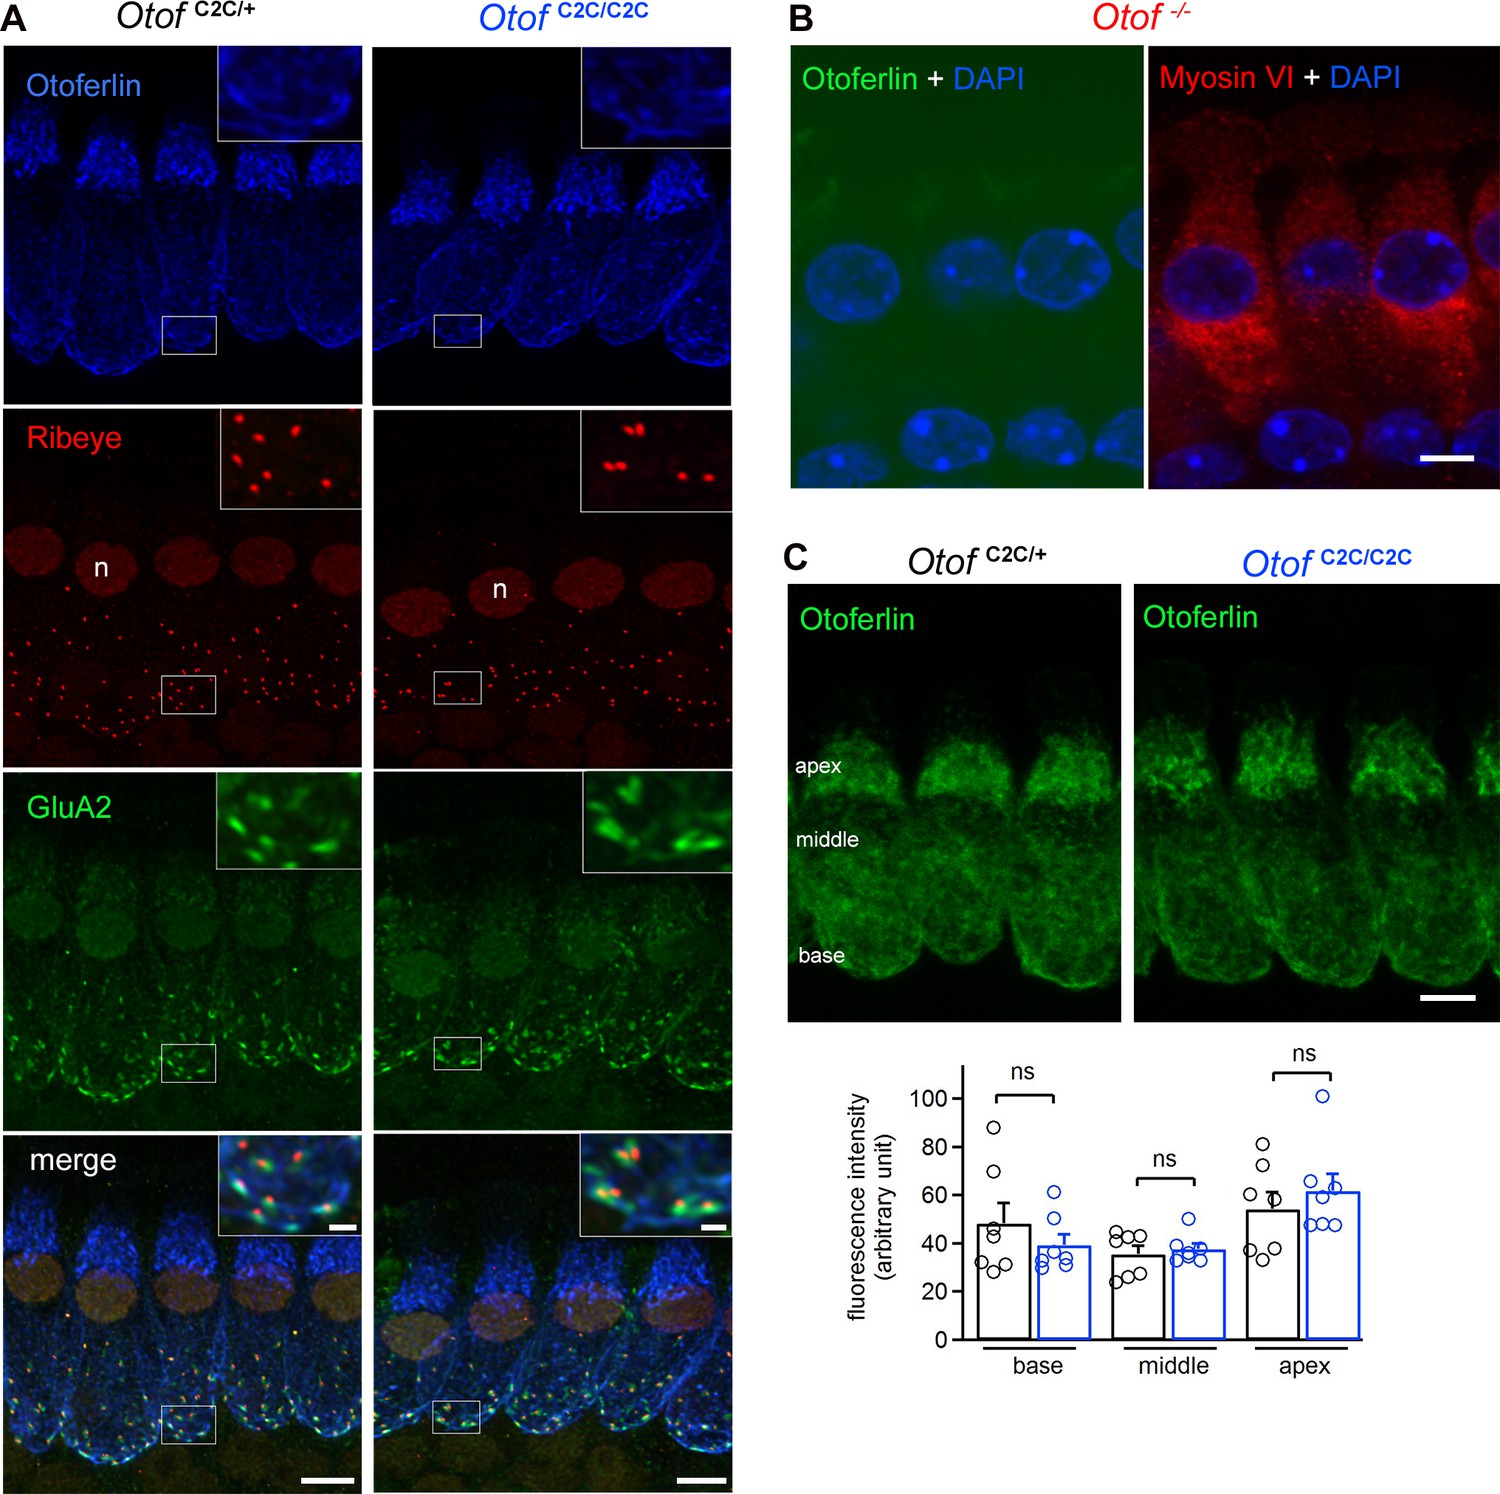
Normal expression and subcellular distribution of otoferlin in Otof C2C/C2C IHCs.
(A) Confocal microscopy images of IHCs from whole-mount preparations of the organ of Corti from P15 Otof C2C/+ and Otof C2C/C2C mice triple-labeled for otoferlin (blue), ribeye (red), and postsynaptic GluA2 receptors (green). Insets: detailed views of the boxed synaptic areas. n: cell nucleus. Scale bar: 5 µm. Inset scale bar: 1 µm. (B) Confocal microscopy image of IHCs from a whole-mount preparation of an organ of Corti from a P15 Otof -/- mouse triple-labeled for otoferlin (green), the hair cell marker myosin VI (red), and the cell nucleus marker DAPI (blue). Note that the luminosity of the green channel (otoferlin) has been enhanced to show the absence of otoferlin expression in Otof -/- mice. Scale bar: 5 µm. (C) Top: Summed projected z-stack confocal microscopy images of IHCs from whole-mount preparations of organs of Corti from P15 Otof C2C/+ and Otof C2C/C2C mice labeled for otoferlin (green). Scale bar: 5 µm. Bottom: Quantification of otoferlin fluorescence in Otof C2C/+ (n = 51 cells in 7 mice) and Otof C2C/C2C IHCs (n = 51 cells from 7 mice) at the apex, middle, and the base of IHCs. Data information: in (C), data are presented as the mean ± SEM. ns, not significant (Student's t-test with Welch correction).
We also compared the distributions of immunostaining for otoferlin and the vesicular glutamate transporter Vglut3, imaged at high resolution by stimulated emission depletion microscopy (STED) (Hell and Wichmann, 1994). In both Otof C2C/+ and Otof C2C/C2C IHCs, the distance of a given otoferlin immunostaining spot to the closest spot of Vglut3 immunostaining had a different distribution than the distance of a given Vglut3 immunostaining spot from the closest Vglut3 immunostaining spot, with a distinctly smaller mode value (Kolmogorov-Smirnov test, p<10−8 in the four examples shown in Figure 3—figure supplement 2). Moreover, the distributions of the distances between a given otoferlin spot and the closest Vglut3 spot were similar in Otof C2C/+ and Otof C2C/C2C IHCs (Kolmogorov-Smirnov test, p>0.05 in the four examples shown in Figure 3—figure supplement 2). This distribution pooled from 7 Otof C2C/C2C IHCs sections peaked at 124 nm, a value smaller by a factor of 2.3 than the peak of the distribution of nearest neighbor distances between Vglut3 spots (285 nm), and probably corresponding to the resolution of our imaging conditions. These results suggest that otoferlin associates correctly with synaptic vesicles in Otof C2C/C2C IHCs.
We then studied the ultrastructure of IHC ribbon synapses by 3D electron tomography (Figure 4A). We reconstructed the ribbon synapses of IHCs located in the cochlear apical turn from seven Otof C2C/+ and ten Otof C2C/C2C mice, on P17 (Figure 4—video 1,2). Synaptic vesicles were classified into three different pools, according to their position relative to the presynaptic plasma membrane and the ribbon: (i) ribbon-associated vesicles with centers lying within 40 nm of the presynaptic plasma membrane were classified as the presumptive readily releasable pool (RRP); (ii) vesicles lying within 80 nm of the ribbon but not apposed to the presynaptic plasma membrane were classified as the ribbon-attached pool (RAP), and (iii) vesicles located between 80 nm and 350 nm from the ribbon surface and not apposed to the presynaptic plasma membrane comprised the outlying pool (OP) (Figure 4A) (Lenzi et al., 1999; Kantardzhieva et al., 2013). In Otof C2C/C2C ribbons (n = 10), the RRP, RAP, and OP contained 14.0 ± 0.8, 42.4 ± 5.0, and 32.9 ± 3.6 synaptic vesicles per ribbon synapse, respectively (Figure 4B). These values are similar to those previously reported for wild-type mice and other species (Lenzi et al., 1999; Schnee et al., 2005; Kantardzhieva et al., 2013; Vogl et al., 2015), and are consistent with the pool sizes we measured in Otof C2C/+ IHCs (n = 7; RRP, 15.0 ± 0.8; RAP, 41.0 ± 2.8; OP, 33.9 ± 2.0; p>0.4 for each pool). Estimated vesicle densities in the RAP and OP (see Materials and methods) were similar in Otof C2C/+ and Otof C2C/C2C IHCs (Figure 4C; p>0.4 for each pool). The mean distance of RRP vesicles from the presynaptic plasma membrane was also similar in Otof C2C/+ (27.8 ± 1.2 nm) and Otof C2C/C2C IHCs (24.3 ± 1.4 nm) (Figure 4D; p=0.1). However, the mean distance of RAP vesicles from the ribbon was slightly larger in Otof C2C/C2C IHCs (46.6 ± 1.5 nm) than in Otof C2C/+ IHCs (39.5 ± 1.7 nm) (Figure 4D, p<0.01). The normal expression of otoferlin and the well-preserved structure of the ribbon synapse in Otof C2C/C2C IHCs rendered this mouse model suitable for assessment of the roles of otoferlin in vesicle fusion and in synaptic vesicle pool replenishment.
Figure 4 with 2 supplements see all
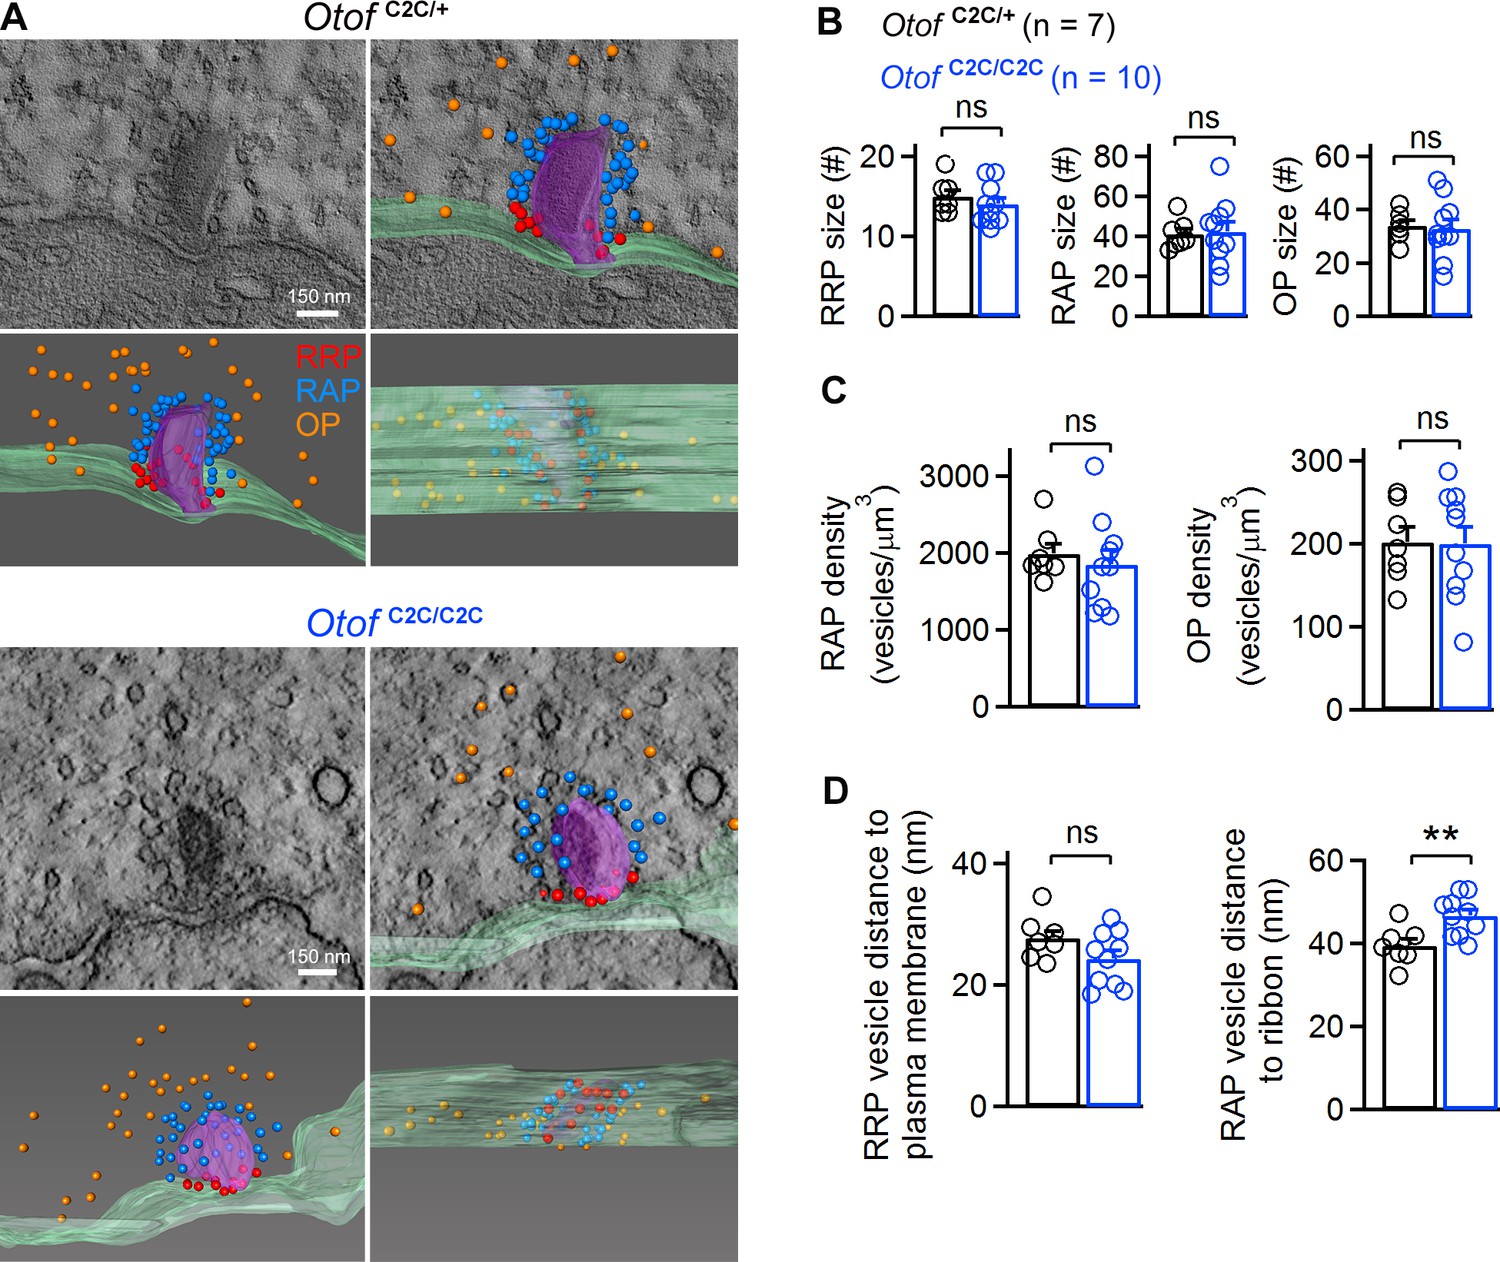
Ultrastructural analysis of the different vesicle pools in Otof C2C/C2C IHC ribbon synapses.
(A) Representative transmission electron micrographs of ribbon synapses from an Otof C2C/+ IHC (upper panels) and an Otof C2C/C2C IHC (lower panels). Side views of the electron tomographic reconstruction of Otof C2C/+ and Otof C2C/C2C ribbon synapses are overlaid on the 3D tomograms. Renderings show the presynaptic plasma membrane (green) relative to the ribbon (purple), vesicles of the presumptive readily-releasable pool (RRP) in red, of the ribbon-associated pool (RAP) in blue, and of the outlying pool (OP) in orange. The ribbon was made semitransparent for visualization of its 3D shape and of the vesicles behind it. (B) Mean numbers of vesicles in the RRP, RAP, and OP of reconstructed Otof C2C/+ (n = 7) and Otof C2C/C2C (n = 10) ribbon synapses. (C) Mean vesicle densities in the RAP and OP of reconstructed Otof C2C/+ (n = 7) and Otof C2C/C2C (n = 10) ribbon synapses. (D) Mean Euclidean distance from RRP vesicle centers to the plasma membrane and from RAP vesicle centers to the ribbon in reconstructed Otof C2C/+ (n = 7) and Otof C2C/C2C (n = 10) ribbon synapses. Data information: In (B–D), data are presented as the mean ± SEM. **p<0.01, ns not significant (Student's t-test with Welch correction).
The Ca2+ sensitivity of RRP vesicle fusion is affected in Otof C2C/C2C IHCs
Deficient IHC synaptic exocytosis may be due to a failure of synaptic vesicle fusion, vesicle pool replenishment, or endocytosis and synaptic vesicle reformation. We sought to identify the steps of the IHC synaptic vesicle cycle affected in Otof C2C/C2C mice, by monitoring depolarization-evoked membrane capacitance changes (ΔCm) in the IHCs of P15-P18 mice, under various conditions of stimulation. We varied Ca2+ influx through the L-type voltage-gated Ca2+ channels by modifying IHC depolarization level, depolarization duration, or extracellular Ca2+ concentration.
We first measured Ca2+ currents (ICa) and the corresponding ΔCm in response to depolarizations of various amplitudes (from a holding membrane potential of −95 mV to potentials between −65 mV and +35 mV), each lasting 20 ms, during which synaptic exocytosis mostly reflects the fusion of RRP vesicles (Figure 5A1–A2 and Figure 5—figure supplement 1A) (Moser and Beutner, 2000). Plots of ICa amplitude as a function of membrane potential were similar between Otof +/+ (n = 8) and Otof C2C/+ IHCs (n = 11; two-way-ANOVA, p=0.12), and between Otof C2C/+ (n = 11) and Otof C2C/C2C IHCs (n = 15; two-way-ANOVA, p=0.4). The ICa plots had the typical inverted bell shape, with a negative peak at around −10 mV (Figure 5A2, top and Figure 5—figure supplement 1B, top). The corresponding ΔCm also peaked at about −10 mV (Figure 5A2, bottom and Figure 5—figure supplement 1B, bottom). In Otof +/+ and Otof C2C/+ IHCs, the evoked ΔCm was identical (two-way-ANOVA, p=0.93; Figure 5—figure supplement 1B, bottom), and we used Otof C2C/+ IHCs as control cells (see Materials and methods). In comparisons of release in Otof C2C/C2C and Otof C2C/+ IHCs, the ΔCm evoked by stepwise depolarization from a holding membrane potential of −95 mV to potentials between −65 mV and −30 mV, characterized by a low opening probability for Ca2+-channels and a strong Ca2+ influx-driving force, was similar. However, for depolarization to −30 mV and beyond (see dashed line in Figure 5A2), corresponding to a high open probability of Ca2+-channels and a decreasing driving force for Ca2+ entry, ΔCm was significantly smaller in Otof C2C/C2C IHCs than in Otof C2C/+ IHCs (two-way-ANOVA, p<10−4). A 1.6-fold decrease was observed for depolarization to −10 mV. Assuming a membrane capacitance of 45 aF for a single synaptic vesicle (Neef et al., 2007), this corresponds to a difference of 8.3 vesicles/ms in vesicle fusion rate during the 20 ms of depolarization between Otof C2C/+ IHCs (21.7 vesicles/ms) and Otof C2C/C2C IHCs (13.4 vesicles/ms). We then assessed the Ca2+ efficiency of RRP release, by plotting ΔCm as a function of ICa amplitude for depolarization to membrane potentials of −65 mV to −10 mV, corresponding to the falling segment of the Ca2+ current amplitude-voltage (ICa/Vm) curve (Figure 5A3), in which Ca2+ currents display minimal contamination with residual unblocked K+ currents. The Ca2+ efficiency of RRP release, evaluated by plotting the mean derivative of ΔCm against ICa, was lower (by a factor of 1.7) in Otof C2C/C2C IHCs ((3.9 ± 0.7) x 10−2 fF.pA−1) than in Otof C2C/+ IHCs ((6.6 ± 0.4) x 10−2 fF.pA−1) (Figure 5A3; 95% confidence interval of the fitted slope).
Figure 5 with 1 supplement see all

Ca2+-dependence of the RRP vesicle fusion defect in Otof C2C/C2C IHCs.
(A1) Protocol used to depolarize IHCs from −95 mV to potentials between −65 to +35 mV (top). Examples of Ca2+ currents (ICa) (middle) and corresponding Cm traces (bottom) for P15-P18 Otof C2C/+ and Otof C2C/C2C IHCs after 20 ms of depolarization to −10 mV. (A2) Mean Ca2+ current amplitudes (ICa) (top) and ΔCm (bottom) for P15-P18 Otof C2C/+ and Otof C2C/C2C IHCs after 20 ms of depolarization to potentials between −65 mV to +35 mV. The vertical dashed line indicates the −30 mV voltage point. (A3) Mean ΔCm values plotted against the Ca2+ currents elicited by depolarizing steps to potentials underlying the falling segment of the ICa/Vm curve (−65 mV to −10 mV), corresponding to increasing Ca2+ currents. The vertical dashed line indicates the −30 mV voltage point. The Otof C2C/+ and Otof C2C/C2C ΔCm data were fitted with a power function, yielding an exponent of 0.94 and 0.83, respectively. (B1) Protocol used to depolarize IHCs from −95 mV to −10 mV for voltage steps of different durations from 2 ms to 50 ms (top). Corresponding example Cm traces from P15-P18 Otof C2C/+ and Otof C2C/C2C IHCs (bottom). The example traces for each genotype come from the same patch-clamped IHC. (B2) Kinetics of Ca2+-dependent exocytosis in P15-P18 Otof C2C/+ and Otof C2C/C2C IHCs for voltage steps of 2 ms to 50 ms. Mean ΔCm is plotted against the duration of the depolarization to −10 mV (Δt). The inset shows the detail for Δt values between 2 ms and 10 ms. For the 2 ms and 5 ms depolarizations, five repetitions of the recordings were averaged, to increase the signal-to-noise ratio. The decrease in Ca2+-sensitivity of RRP vesicle fusion was evaluated by fitting the ΔCm versus Δt plots with a line for Δt between 2 and 10 ms in Otof C2C/+ IHCs and for Δt between 2 and 20 ms in Otof C2C/C2C IHCs. The Otof C2C/+ fit was plotted for durations greater than 10 ms, to illustrate the onset of the second component of release corresponding to the initiation of vesicle pool replenishment. (B3) We evaluated the coupling of voltage-gated Ca2+ channels to RRP vesicles, by setting the intracellular EGTA concentration to 5 mM in Otof C2C/+ IHCs (gray, n = 9) and in Otof C2C/C2C IHCs (light blue, n = 10). The data for an intracellular EGTA concentration of 0.5 mM are as in (B2). (C1) Protocol used to depolarize IHCs from −95 mV to −10 mV for 20 ms with different extracellular Ca2+ concentrations (top). Example Cm traces from P15-P18 Otof C2C/+ and Otof C2C/C2C IHCs for different extracellular Ca2+ concentrations (bottom). Each example Cm trace for a given genotype was obtained from a different IHC. (C2) ΔCm values plotted against the Ca2+ currents elicited at different extracellular Ca2+ concentrations ([Ca2+]e) in Otof C2C/+ and Otof C2C/C2C P15-P18 IHCs. Dashed lines show linear fits to the data. Data information: In (A2, B2–B3), data are presented as the mean ± SEM. ***p<0.001, ns not significant (two-way-ANOVA). In (B2, inset), *p<0.05 (Student's t-test with Welch correction). In A1, example Ca2+ traces are corrected for linear leak conductance, leading to a subtraction of the sinusoidal signal. In (A1, B1, C1), the raw Cm traces are shown.
We investigated the role of otoferlin in the kinetics of RRP synaptic vesicle fusion further, by analyzing the ΔCm elicited by brief depolarizations, of 2 to 50 ms duration, to −10 mV (Figure 5B1), first in low intracellular Ca2+-buffering conditions with an intracellular solution containing 0.5 mM EGTA. The presence of a vesicle fusion defect per se, independent of vesicle pool replenishment, could be inferred from the ΔCm evoked by very short IHC depolarizations (<10 ms) (Figure 5B2). For depolarizations of 2 and 5 ms, the ΔCm values in Otof C2C/C2C mice (n = 16) were about a third (p=0.01) and a half (p=0.02) those in Otof C2C/+ mice (n = 11), respectively, indicating a direct effect of the C2C domain mutations on vesicle fusion. By fitting the average relationship between ΔCm and depolarization duration (Δt) for the shortest depolarizations, we found that the slope of this fit, taken as an approximation of the Ca2+ sensitivity of release, was lower (by a factor of 1.5) in Otof C2C/C2C IHCs (0.46 ± 0.04 fF.ms−1) than in Otof C2C/+ IHCs (0.69 ± 0.05 fF.ms−1) (Figure 5B2; 95% confidence interval of the fitted slope). This result again suggests that the C2C domain mutations substantially decrease the Ca2+-sensitivity of RRP vesicle fusion. We verified that the low vesicle fusion rate in Otof C2C/C2C IHCs was not due to a looser coupling of Ca2+ channels with the release sites, by patch-clamping a subset of IHCs with an intracellular solution containing 5 mM EGTA, a high buffer concentration reported to limit intracellular Ca2+ diffusion from its entry point, thereby reducing the fusion of vesicles lying more than a few tens of nm away from Ca2+ channels (Moser and Beutner, 2000; Spassova et al., 2004; Brandt et al., 2005; Levic et al., 2011) (Figure 5B3). In Otof C2C/+ IHCs, RRP release at intracellular EGTA concentrations of 0.5 mM (n = 11) and 5 mM (n = 9) was similar for depolarization durations between 2 and 10 ms, reflecting a tight coupling of Ca2+ channels to RRP vesicles (Figure 5B3, top, two-way-ANOVA, p=0.3 for the 2–10 ms interval and p=3×10⁻⁴ for the 2–30 ms interval). In Otof C2C/C2C IHCs, RRP release at intracellular EGTA concentrations of 0.5 mM (n = 16) and 5 mM (n = 10) was also similar for depolarization durations between 2 and 10 ms (Figure 5B3, bottom; two-way-ANOVA, p=0.2 for the 2–30 ms interval), suggesting that the spatial coupling between voltage-gated Ca2+ channels and RRP vesicles is not modified by the otoferlin C2C domain mutations. Remarkably, unlike the exocytotic response of Otof C2C/+ IHCs, which did not plateau for depolarizations lasting up to 50 ms, that of Otof C2C/C2C IHCs rapidly saturated for depolarizations lasting 15–20 ms (Figure 5B2), and was insensitive to 5 mM intracellular EGTA (Figure 5B3), suggesting that vesicle pool replenishment at the release sites was also impaired in these cells.
We then characterized the defect in Ca2+ sensitivity by varying the amplitude of Ca2+ entry through the voltage-gated Ca2+ channels using a set of different extracellular Ca2+ concentrations ([Ca2+]e = 0.5 mM, 1.25 mM, 5 mM, 10 mM) during depolarizations of the IHCs for 20 ms to −10 mV (Figure 5C1). Similar maximal voltage-gated Ca2+ currents were obtained, ranging from 45 ± 3 pA ([Ca2+]e = 0.5 mM) to 268 ± 18 pA ([Ca2+]e = 10 mM) in Otof C2C/+ IHCs (n = 43) and from 40 ± 4 pA ([Ca2+]e = 0.5 mM) to 246 ± 9 pA ([Ca2+]e = 10 mM) in Otof C2C/C2C IHCs (n = 47; p>0.2 for both comparisons). However, for any given level of Ca2+ current, synaptic release in Otof C2C/C2C IHCs was only about half that in Otof C2C/+ IHCs. Moreover, the Ca2+ sensitivity of release, evaluated by fitting a linear function to the ΔCm/ICa curve, was lower (by a factor of 2.2) in Otof C2C/C2C IHCs ((2.2 ± 0.5) x 10−2 fF.pA−1) than in Otof C2C/+ IHCs ((4.8 ± 1.0) x 10−2 fF.pA−1) (Figure 5C2; 95% confidence interval of the fitted slope). Together, these results support the notion that C2C domain mutations decrease the Ca2+-dependent efficiency and kinetics of RRP vesicle fusion.
Vesicle release in response to intracellular Ca2+ uncaging is delayed and slower in Otof C2C/C2C IHCs
We studied the Ca2+ dependence of the C2C-mutated otoferlin independently of the Ca2+ channels, by monitoring ΔCm upon intracellular Ca2+ uncaging, using a single high-energy UV flash delivered to P14-P16 IHCs loaded with Ca2+-saturated DM-nitrophen (Heidelberger et al., 1994; Beutner et al., 2001; Vincent et al., 2014). This protocol, which triggered a rapid and global increase in intracellular Ca2+ concentration, from a few tens of nM to up to 59 ± 7 µM (n = 7) (Vincent et al., 2015), led to a total synaptic release that was similar in Otof C2C/+ IHCs (2.25 ± 0.18 pF; n = 18) and Otof C2C/C2C IHCs (2.19 ± 0.22 pF; n = 19; Mann-Whitney test, p=0.4; Figure 6A), corresponding to about 50 000 vesicles for both genotypes. This result suggests that all the vesicles in Otof C2C/C2C IHCs can fuse when exposed to high Ca2+ concentrations throughout the entire vesicle cycle pathway. We then analyzed the kinetics of ΔCm in the first few milliseconds after the UV flash in Otof C2C/C2C IHCs. The most striking features were the delayed onset of synaptic release and the longer time required to reach the maximal rate of release in Otof C2C/C2C IHCs (7.3 ± 1.2 ms and 52.1 ± 9.2 ms, respectively) than in Otof C2C/+ IHCs (4.2 ± 0.7 ms and 24.3 ± 2.7 ms, respectively; Mann-Whitney test, p=0.02 and p=0.001, respectively; Figure 6B–C). The maximal rate of release was also lower (by a factor of 1.6) in Otof C2C/C2C IHCs (67 ± 14 fF.ms−1, corresponding to 1490 ± 310 vesicles/ms) than in Otof C2C/+ IHCs (107 ± 23 fF.ms−1, corresponding to 2380 ± 510 vesicles/ms; Mann-Whitney test, p=0.03; Figure 6C).
Figure 6
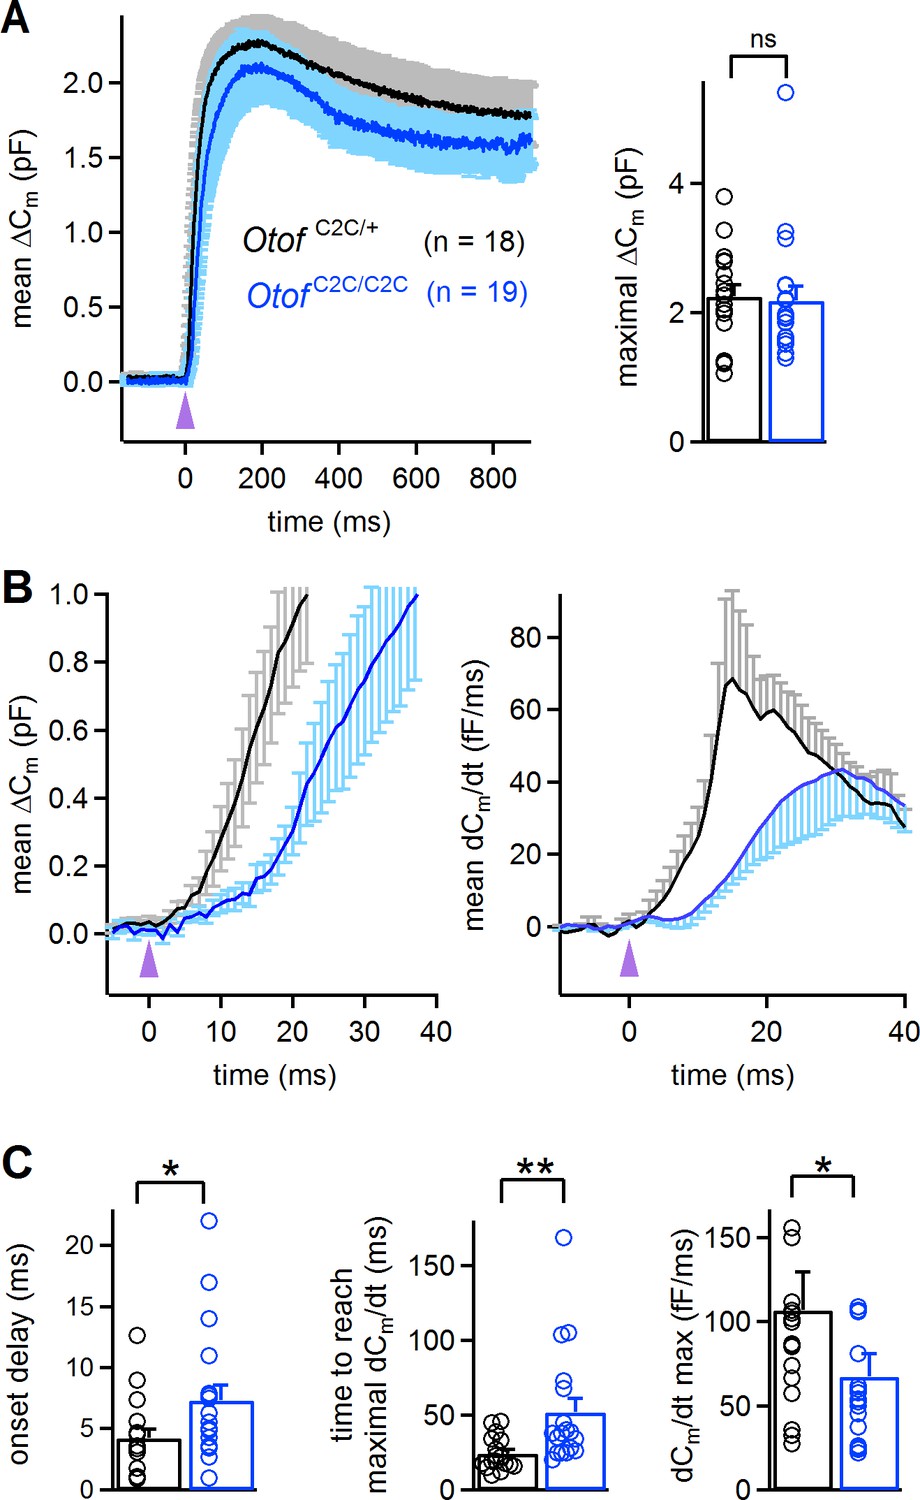
Abnormal kinetics of exocytosis evoked by intracellular Ca2+ uncaging in Otof C2C/C2C IHCs.
(A) Left: Mean ΔCm response curves in P14-P16 Otof C2C/+ and Otof C2C/C2C IHCs after a single UV flash (purple arrowhead) uncaging intracellular Ca2+. Right: Bar graph showing mean and individual maximal ΔCm values. (B) Left: Close-up of the wave shown in A, focusing on the first 40 ms after the UV flash (purple arrowhead). Right: Mean time derivative of the Cm response curves in the first 40 ms following the UV flash. (C) Bar graphs of the mean and individual onset delay of the ΔCm (left), time taken to reach the maximal release rate (middle), and time derivative of release (right) in Otof C2C/+ (n = 18) and Otof C2C/C2C (n = 19) IHCs. Data information: in (A–C), data are presented as the mean ± SEM. *p<0.05, **p<0.01, ns not significant (Mann-Whitney test).
We estimated the Ca2+ sensitivity of vesicle fusion in Otof C2C/+ and Otof C2C/C2C IHCs, by simultaneously monitoring ΔCm and intracellular Ca2+ variations in IHCs loaded with the low-affinity fluorescent Ca2+-indicator Oregon Green BAPTA 5N (OGB-5N) (Figure 7A). The use of the long-wavelength excitation dye (488 nm) OGB-5N allowed continuous fast monitoring of the Ca2+ signal under confocal microscopy in IHCs (line scan at 1 kHz), no photolysis of DM-nitrophen being triggered by visible-light excitation at 488 nm (Vincent et al., 2014). In these recording conditions, the kinetics of the intracellular Ca2+ increase in Otof C2C/+ (t = 28.8 ± 1.7 ms; n = 6) and Otof C2C/C2C IHCs (26.6 ± 9.2 ms; n = 7) upon UV flash were similar (p=0.8), whereas the peak exocytosis rate occurred later in Otof C2C/C2C IHCs than in Otof C2C/+ IHCs in agreement with the first set of Ca2+ uncaging experiments (Figures 6A and 7A). We estimated the cooperativity and Ca2+ sensitivity of synaptic release in Otof C2C/+ and Otof C2C/C2C IHCs, by fitting the relationship between the rate of exocytosis and the quantitatively calibrated fluorescent Ca2+ signal for each cell with a Hill equation (Figure 7B, left). No major effect on the cooperativity of release was detected in Otof C2C/C2C IHCs (Hill coefficient value: 3.3 ± 0.3 for both genotypes; p>0.9; Figure 7B), whereas the Ca2+ sensitivity of vesicle fusion was about four times lower in Otof C2C/C2C IHCs (EC50: 9.8 ± 0.7 µM) than that in Otof C2C/+ IHCs (EC50: 2.3 ± 0.6 µM; p=0.004; Figure 7B). Taking into account the normal number of docked vesicles in Otof C2C/C2C IHCs (Figure 4) and the lower efficiency of Ca2+-dependent exocytosis following the activation of their Ca2+ channels (Figure 5 C1–C2), these Ca2+ uncaging results are consistent with a deleterious effect of C2C domain mutations on the Ca2+ affinity of otoferlin for triggering and setting the rate of RRP vesicle fusion.
Figure 7

Reduced Ca2+-sensitivity of exocytosis in Otof C2C/C2C IHCs.
(A) Mean ΔCm response curves (top) and normalized exocytosis rates (dCm/dt) (bottom), with mean intracellular fluorescent Ca2 signals of OGB-5N (green traces) recorded simultaneously after Ca2+ uncaging (purple arrowhead) in P14-P16 Otof C2C/+ (in black) and Otof C2C/C2C (in blue) IHCs. (B) Left: For each recorded Otof C2C/+ (in black) and Otof C2C/C2C (in blue) IHC, the rate of exocytosis was plotted as a function of [Ca2+]i, and each data set was fitted with a Hill function y = Vmax.xn /(EC50n + xn). Right: Mean cooperativity and Ca2+-affinity of release in Otof C2C/+ and Otof C2C/C2C IHCs. Note that for 3 out of 6 Otof C2C/C2C IHCs, the fit of the sigmoidal Hill function to the data was only partial. For those IHCs, the Ca2+ affinity was estimated as the value of [Ca2+] for which dCm/dt = 0.5, rather than the EC50 of the fitted Hill function, which was larger. Data information: in (B), one IHC of each genotype was removed because of the lack of experimental points for a reliable fitting with a Hill function. In (A–B), data are presented as the mean ± SEM. **p<0.01, ns not significant (Mann-Whitney test).
The Ca2+ dependence of synaptic vesicle pool replenishment is affected in Otof C2C/C2C IHCs
It has been suggested that vesicle pool replenishment is otoferlin-dependent at the IHC ribbon synapse (Pangrsic et al., 2010), and Ca2+-dependent thereafter (Schnee et al., 2011b; Levic et al., 2011). This prompted us to investigate the possible role of otoferlin as a Ca2+ sensor for synaptic vesicle pool replenishment. We first determined the extent to which RRP replenishment was affected in Otof C2C/C2C IHCs, by performing paired-pulse experiments, using 20 ms-long pulses with various intervals between stimuli (Figure 8A–B). The paired-pulse ratio of release, used as a proxy for RRP replenishment, was much lower (by a factor of 2.2 at its minimum value) in Otof C2C/C2C IHCs (n = 13) than in Otof C2C/+ IHCs (n = 9), for interpulse intervals of up to 500 ms (two-way ANOVA, p<10−4). This result led us to conclude that the impairment of sustained release in Otof C2C/C2C IHCs is not merely a consequence of impaired RRP release; the recruitment of synaptic vesicles per se is also defective. However, the paired-pulse ratio recovered fully at interpulse intervals of about 1 s. We probed the response of Otof C2C/C2C IHCs (n = 8) to long depolarizations to −10 mV of up to 3 s and observed a much lower (by a factor of 5.3) rate of exocytosis than that measured in Otof C2C/+ IHCs (n = 8; 80 fF/s versus 420 fF/s; two-way ANOVA, p<10−4; Figure 8C).
Figure 8 with 1 supplement see all
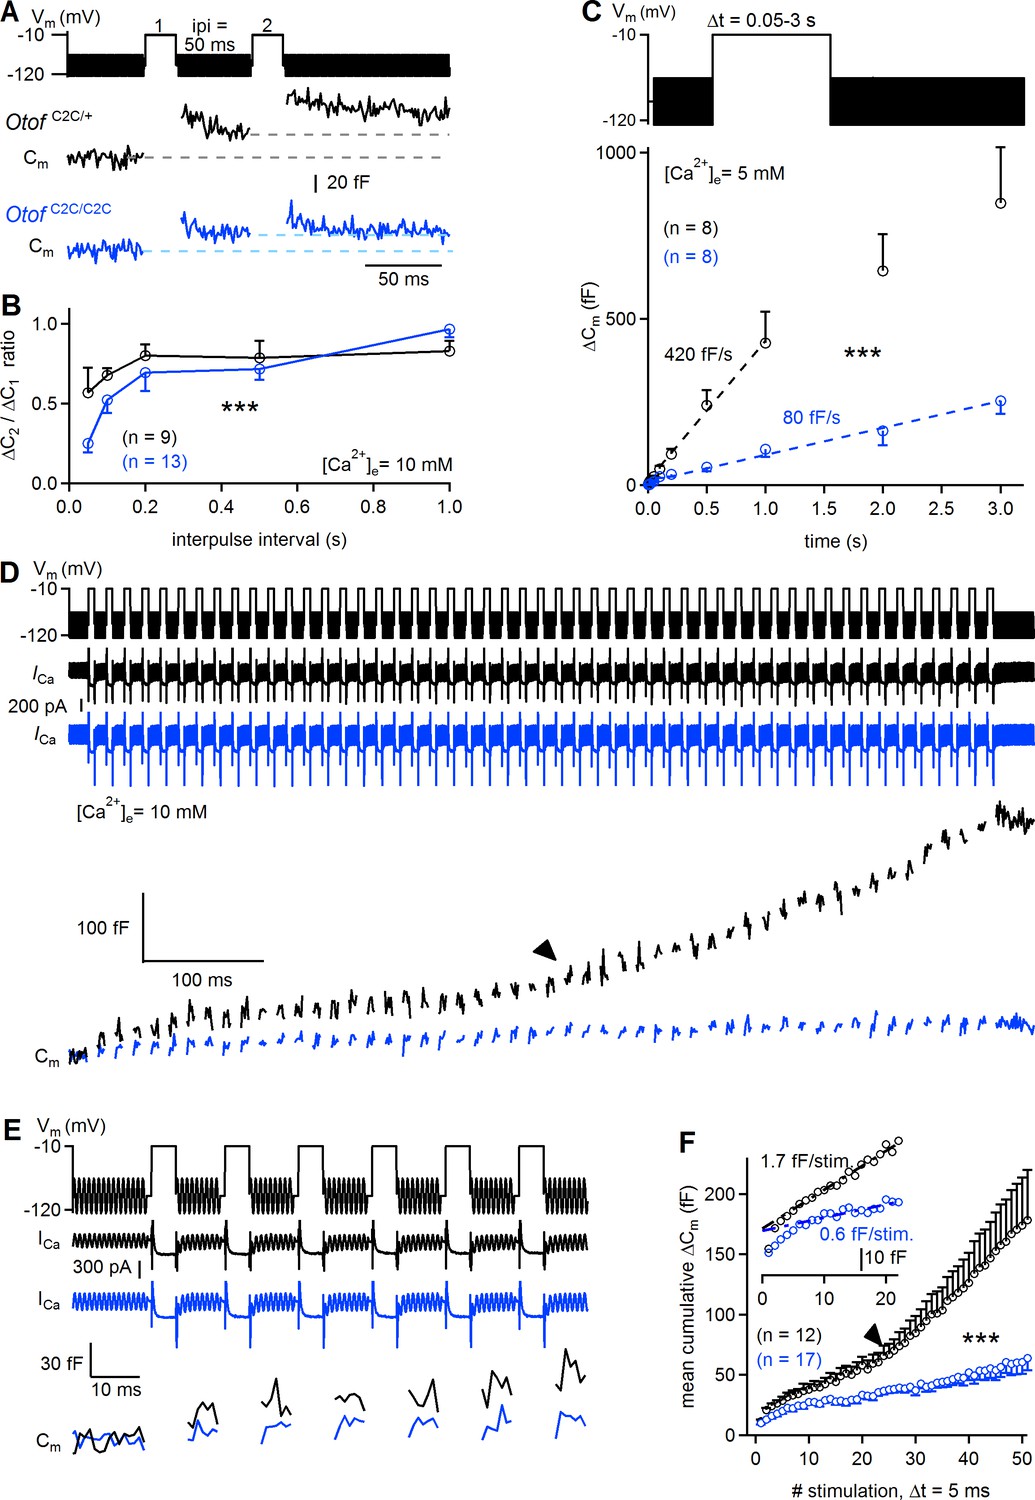
Reduced sustained release in Otof C2C/C2C IHCs.
(A) Paired-pulse stimulation protocol, showing two consecutive 20 ms depolarizations from a holding potential of −95 mV to −10 mV (top), and example Cm traces from Otof C2C/+ and Otof C2C/C2C IHCs (bottom). (B) Mean ΔCm ratio for the second depolarization relative to the first depolarization (ΔC2/ΔC1) as a function of interpulse interval (ipi = 50, 100, 200, 500, and 1000 ms), for P15-P18 Otof C2C/+ and Otof C2C/C2C IHCs. (C) Kinetics of Ca2+-dependent exocytosis for single depolarizations to −10 mV lasting between 50 ms and 3 s in P15-P18 IHCs. Mean ΔCm values are plotted as a function of depolarization duration (Δt), together with linear fits for Otof C2C/+ IHCs and Otof C2C/C2C IHCs. These recordings were carried out with an extracellular solution containing 5 mM Ca2+. (D) Protocol used to elicit a train of 50 successive short depolarizations (duration 5 ms, interpulse interval 10 ms) to −10 mV (top). Example ICa (middle) and corresponding Cm traces (bottom) in Otof C2C/+ and Otof C2C/C2C IHCs. Note the transition between the linear and superlinear components of release for the Otof C2C/+ IHC (arrowhead). (E) Expanded view of the first 100 ms in D. (F) Plots of mean cumulative ΔCm as a function of stimulus number in response to the train of 50 successive short depolarizations in Otof C2C/+ and Otof C2C/C2C P15-P18 IHCs. For each depolarization, ΔCm was evaluated in this particular case by averaging only the last 3 ms of the Cm values of each interstimulus interval to prevent contamination by the initial peaks. Note the transition from the linear component to a superlinear component of release for Otof C2C/+ IHCs (arrowhead). The inset is a magnification of the first 20 depolarizations, with linear fits to ΔCm during successive depolarizations for Otof C2C/+ and Otof C2C/C2C IHCs. Data information: in (B–C, F), data are presented as the mean ± SEM. ***p<0.001 (two-way-ANOVA). In (A, D, E) raw Cm traces are shown. In (D, E) the Cm transient change following each depolarization has been blanked for the sake of clarity. In (D), the example ICa traces were not corrected for the linear leak conductance, leaving the sinusoidal ICa component apparent.
We characterized the kinetics of synaptic vesicle pool replenishment further, by subjecting Otof C2C/C2C IHCs to periodic stimulation with 50 short (5 ms long) depolarizations to −10 mV, separated by 10 ms intervals (Figure 8D–E). This periodic stimulation induced a mean ΔCm of 51 fF in Otof C2C/C2C IHCs (Figure 8F). This value exceeding that for RRP depletion (~20 fF), indicates the occurrence of vesicle pool replenishment. Assuming full depletion of the RRP by the train of depolarizations, we can estimate the rate of vesicle pool replenishment at about 1.5 vesicles/ms/IHC in Otof C2C/C2C IHCs, a much lower value (by a factor of 3.7) than obtained for Otof C2C/+ IHCs (~5.6 vesicles/ms/IHC). The time course of synaptic exocytosis in Otof C2C/+ IHCs during the train of successive depolarizations (Figure 8D–F) had three kinetic components, as previously described (Schnee et al., 2011b): a rapid depletion of the RRP during the first two to three stimulations, followed by a linear release component between the 3rd and 23rd (approximately) stimulation, with a superlinear release component beyond the 23rd stimulation. The linear release component has been suggested to reflect Ca2+-dependent replenishment of the fusion site by vesicles from the recycling pool (Rizzoli and Betz, 2005), possibly corresponding to RAP vesicles, and the superlinear component observed at high Ca2+ loads to reflect additional vesicle replenishment from the reserve pool, possibly involving OP vesicles transported to release sites by a mechanism dependent on Ca2+-induced Ca2+ release (Schnee et al., 2011b; Castellano-Muñoz et al., 2016). The linear replenishment component was less efficient (by a factor of 2.8) in Otof C2C/C2C IHCs (n = 17) than in Otof C2C/+ IHCs (n = 12), at 0.6 fF and 1.7 fF per depolarization step, respectively. The onset of the superlinear release component has been shown to be Ca2+-dependent (Schnee et al., 2011b). In Otof C2C/C2C IHCs, superlinear release was observed in only one of seventeen Otof C2C/C2C IHCs subjected to such trains of depolarization, whereas it was observed in six of the twelve Otof C2C/+ IHCs studied and six of the eleven Otof +/+ IHCs studied (Fisher’s exact test, p=0.01). This almost total absence of superlinear release in Otof C2C/C2C IHCs was probably unlinked to intracellular Ca2+ diffusion defects, because the patterns of calcium entry and diffusion imaged by high-speed swept-field confocal microscopy in IHCs loaded with OGB-5N were similar in Otof C2C/+ (n = 10–12) and Otof C2C/C2C IHCs (n = 6–10). Thus, the C2C domain mutations did not affect the temporal and spatial dynamics of Ca2+ entry and diffusion around the synaptic ribbon (Figure 8—figure supplement 1). These results suggest that otoferlin may also function as the Ca2+ sensor triggering superlinear release.
Endocytosis is normal in Otof C2C/C2C IHCs
It has also been suggested that otoferlin is involved in endocytosis (Duncker et al., 2013) and synaptic vesicle reformation (Strenzke et al., 2016). We therefore investigated endocytosis in OtofC2C/C2C IHCs, because a possible defect of endocytosis might account for the low rates of vesicle pool replenishment. In wild-type ribbon synapses, two modes of membrane retrieval following IHC depolarization, with different kinetics, have been described: a slow one involving linear Cm decline upon short depolarizations (typically <50 ms in our recording conditions) and a fast one with an exponential decline upon longer depolarizations (typically >100 ms) (Moser and Beutner, 2000; Beutner et al., 2001; Neef et al., 2014). In Otof C2C/+ and Otof C2C/C2C IHCs, both these modes of endocytosis were observed (Figure 9A–B and Figure 9—figure supplement 1). However, a 100 ms depolarization was sufficient to observe the exponential component of endocytosis in seven of the eight Otof C2C/+ IHCs studied, but the same protocol elicited the exponential component in only one of the 10 Otof C2C/C2C IHCs recorded (Fisher’s exact test, p=0.003). Increasing the duration of depolarization to 200–500 ms increased this proportion to six of the ten recorded Otof C2C/C2C IHCs. We therefore compared the slow and rapid endocytotic components between Otof C2C/+ and Otof C2C/C2C IHCs with similar preceding exocytosis levels. In IHCs for which values of 20 to 150 fF had previously been recorded for exocytosis, the rate of the slow component was similar in Otof C2C/+ (6.4 ± 0.8 fF.s−1, n = 8) and Otof C2C/C2C IHCs (5.3 ± 0.5 fF.s−1, n = 9; p=0.24; Figure 9A) and the Cm traces systematically returned to the baseline Cm value within 30 s after IHC depolarization. Likewise, when considering IHCs with an amplitude of the exponential component of endocytosis exceeding 100 fF, the time constant and amplitude of the exponential component of endocytosis were similar in Otof C2C/+ (3.2 ± 0.5 s and 266 ± 44 fF, respectively, n = 8) and Otof C2C/C2C IHCs (3.4 ± 0.3 s and 244 ± 34 fF, respectively, n = 6; p>0.7 for both comparisons; Figure 9B), but the Cm traces rarely reached the baseline Cm value within 30 s after IHC depolarization. Finally, we further analyzed the ΔCm measurements following a UV-flash. Upon Ca2+ uncaging, the exocytotic peak was followed by a fast decline in Cm that was probably due to endocytotic membrane retrieval, as previously described (Beutner et al., 2001). In these experimental conditions, endocytosis kinetics were also similar in Otof C2C/+ (n = 13) and Otof C2C/C2C (n = 15; p=0.17; Figure 9C) IHCs. Together, our results indicate that endocytosis is unaffected in Otof C2C/C2C IHCs.
Figure 9 with 1 supplement see all
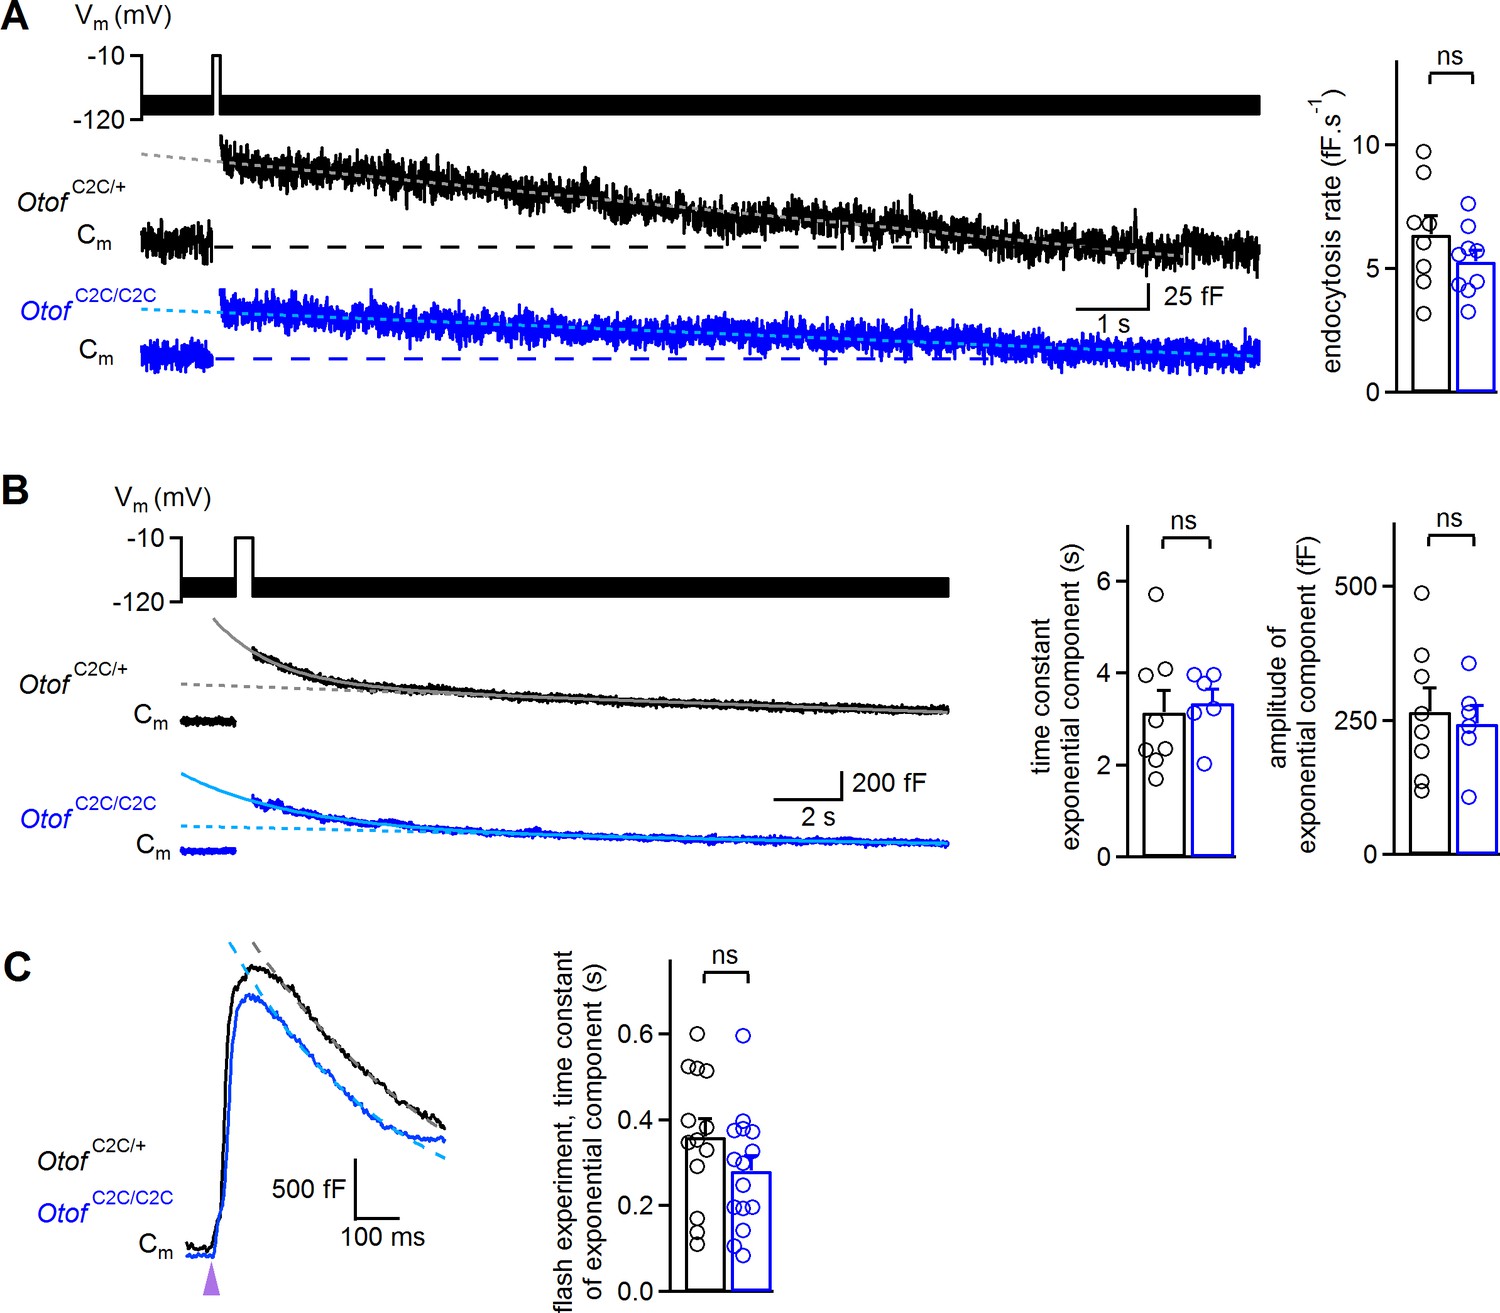
Normal endocytosis, assessed by prolonged Cm measurements, in Otof C2C/C2C IHCs.
(A) Left: Examples of Cm traces, recorded over a period of 15 s, in response to a 100 ms depolarization to −10 mV from a holding potential of −95 mV, in P14-P17 Otof C2C/+ and Otof C2C/C2C IHCs. Horizontal dashed lines indicate the baseline Cm. The decay phase of Cm traces was fitted with a linear function (gray and light blue dotted lines). Right: Mean endocytosis rate in response to depolarizations lasting 20–100 ms in P14-P17 Otof C2C/+ and Otof C2C/C2C IHCs. (B) Left: Examples of Cm traces, recorded over a period of 20 s, in response to a 500 ms long depolarization to −10 mV from a holding potential of −95 mV, in Otof C2C/+ and Otof C2C/C2C P14-P17 IHCs. The decay phase of Cm traces was fitted with a monoexponential function added to a linear function (gray and light blue lines). Dotted lines correspond to the linear component of these fits. Right: Mean time constant and amplitude of the exponential component of Cm decay in Otof C2C/+ and Otof C2C/C2C IHCs. (C) Left: Example traces of the decay following exocytosis evoked by intracellular Ca2+ uncaging (purple arrowhead) in Otof C2C/+ and Otof C2C/C2C IHCs. The decay period was fitted with a monoexponential function (gray and light blue dashed lines). Right: Mean time constant of the exponential component of Cm decay following exocytosis evoked by intracellular Ca2+ uncaging. The data were collected from the IHCs used in Figure 6. Data information: in (A–C), data are presented as the mean ± SEM. ns not significant (Student's t-test with Welch correction). In (A–B), Cm traces were 100 Hz low-pass filtered.
The EPSC rate in IHC postsynaptic boutons is reduced in Otof C2C/C2C mice
The mean amplitude of excitatory postsynaptic currents (EPSCs) recorded at IHC postsynaptic boutons is known to be independent of presynaptic membrane voltage and Ca2+ influx during sustained stimulation (Goutman and Glowatzki, 2007). We therefore expected the mean EPSC amplitude to be unaffected in Otof C2C/C2C mice. We recorded EPSCs from single boutons on P8-P11, in the whole-cell patch-clamp configuration, as previously described (Glowatzki and Fuchs, 2002), eliciting IHC depolarization by increasing extracellular K+ concentration from 5.8 mM to 25 mM (Figure 10A). EPSC frequency increased in both Otof C2C/C2C and Otof +/+ IHCs. Mean EPSC amplitude and EPSC decay time constant did not differ significantly between Otof C2C/C2C (n = 8) and Otof +/+ IHCs (n = 8; p>0.3; Figure 10B). The mean EPSC rate in the first 10 s following 25 mM KCl application was, however, slower in Otof C2C/C2C than in Otof +/+ IHCs (by a factor of 3.3; Figure 10C, p=0.003), consistent with the smaller amplitude of the ABR wave-I and the presynaptic exocytosis deficit in Otof C2C/C2C IHCs. Single-vesicle and multivesicular release events were observed in both Otof C2C/C2C and Otof +/+ IHCs (Figure 10A). However, the distribution of EPSC amplitudes was more variable in Otof C2C/C2C IHCs than in Otof +/+ IHCs (Kolmogorov-Smirnov test, p<10−3; Figure 10D), probably due to the defective vesicle fusion and vesicle pool replenishment in Otof C2C/C2C IHCs. Our results do not support the existence of a specific effect of the C2C domain mutations on one release mechanism — uniquantal (Chapochnikov et al., 2014) or multiquantal (Li et al., 2014) — rather than the other. Overall, our postsynaptic EPSC recordings confirmed that the synaptic vesicles of Otof C2C/C2C IHCs can fuse with the plasma membrane, but at a slower rate than those of Otof +/+ IHCs.
Figure 10

Lower EPSC rates in Otof C2C/C2C IHCs.
(A) Superimposed example EPSC traces (IEPSC) recorded at Otof +/+ and Otof C2C/C2C IHC afferent boutons on P8-P11, after extracellular application of 25 mM KCl (top), and histograms of EPSC amplitude distribution for the corresponding cells (bottom). (B) Bar graphs displaying the mean and individual EPSC amplitude and EPSC decay time constant (τ)in Otof +/+ (n = 8) and Otof C2C/C2C (n = 8) IHCs. (C) Left: EPSC count as a function of time after the extracellular application of 25 mM KCl (indicated by an arrowhead) for all recorded Otof +/+ and Otof C2C/C2C IHCs. Middle: Zoom on the first 10 s of recording. Right: Bar graph displaying mean EPSC rate in the first 10 s of the K+ challenge, in Otof +/+ and Otof C2C/C2C IHCs. (D) Mean and individual normalized cumulative EPSC number plotted against EPSC amplitude for Otof +/+ and Otof C2C/C2C IHCs. Data information: in (B–D), data are presented as the mean ± SEM. In (B–C), **p<0.01, ns not significant (Student's t-test with Welch correction). In (D), ***p<0.001 (Kolmogorov-Smirnov test).
Modeling of IHC synaptic release supports a dual role for otoferlin in Ca2+ sensing for vesicle fusion and vesicle pool replenishment
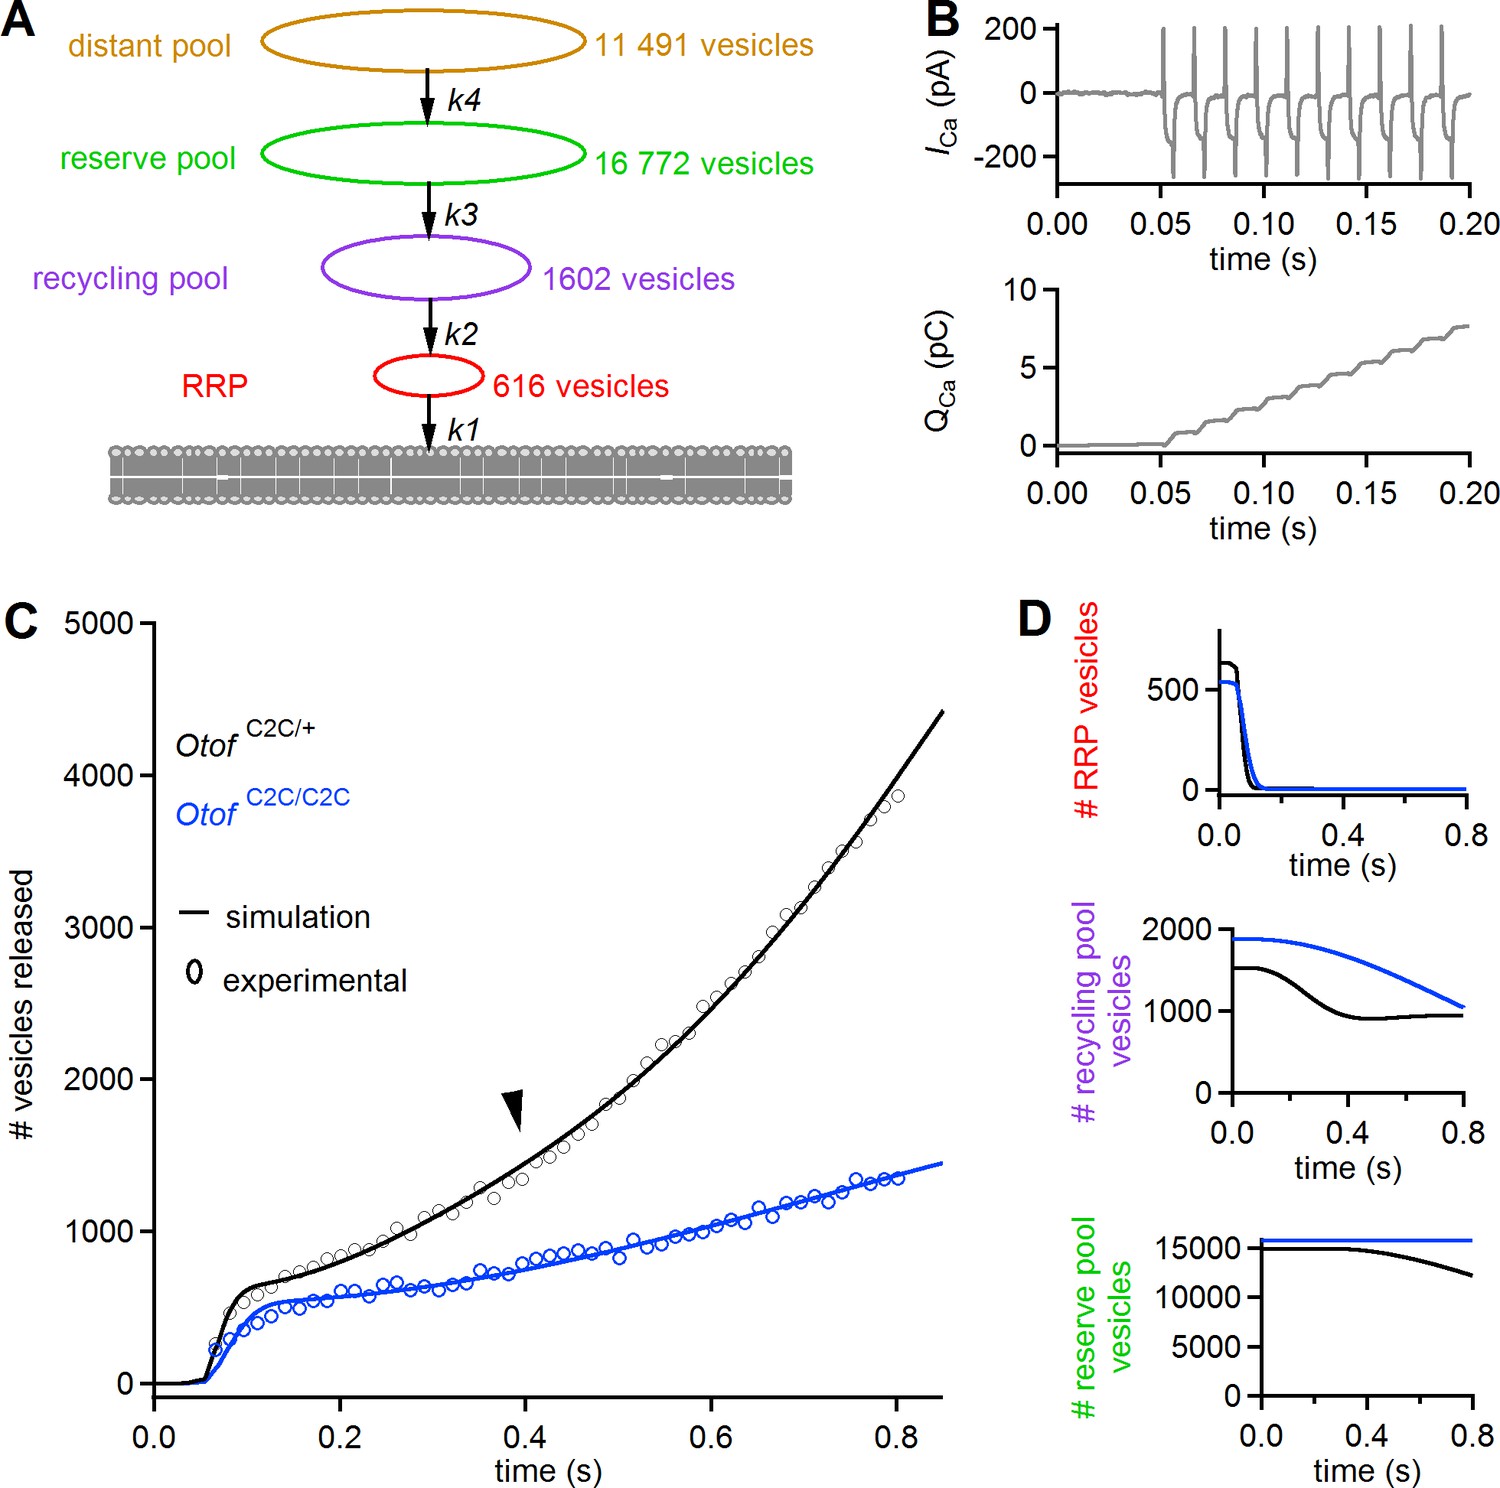
We used a previously described simplified model of IHC synaptic vesicle exocytosis (Schnee et al., 2005, 2011b) to obtain a quantitative estimate of the in vivo Ca2+-sensing characteristics of otoferlin in RRP fusion and linear and superlinear release (Figure 11A). This model considers four vesicle pools (1 to 4) with different dynamics: pools 1, 2, and 3 correspond to the functionally defined RRP, recycling pool, and reserve pools, respectively. A 'distant pool' (DP, pool 4), equivalent to the entire IHC synaptic vesicle reservoir, is also included in the model. In normal conditions, this pool has little influence on the dynamics of the other pools. The main assumptions of the model are as follows: each of the four pools has a fixed size limit; vesicles exiting one pool immediately enter the next pool closer to the fusion site; and all vesicles entering the RRP eventually fuse. The kinetics of the various pools are governed by four mass-action equations describing the transitions of vesicles from pool 4 to pool 1 and their ensuing fusion (with transition rates K4, K3, K2, and K1, respectively (see Equations (7)-(10) in Materials and methods), and Ca2+ thresholds for the recruitment of each vesicle pool (see Equations (1)-(4), in Materials and methods)). We took the observed Ca2+ dependence of replenishment into account by modifying the model of Schnee et al. (Schnee et al., 2011b) such that all transition rates were explicitly dependent on intracellular Ca2+ concentration (see Equations (1)-(4), in Materials and methods).
Figure 11
A mass action model of synaptic release reproduces Ca2+ sensitivity defects in Otof C2C/C2C IHCs.
(A) Diagram of the synaptic vesicle pools described by the model: the RRP (red), the recycling pool (violet), the reserve pool (green), and the distant pool (yellow). The process of synaptic exocytosis is governed by four rate constants, for RRP vesicle fusion (k1), replenishment of the RRP from the recycling pool (k2), replenishment of the recycling pool from the reserve pool (k3), and replenishment of the reserve pool from the distant pool (k4). The vesicle numbers indicated for each pool are the results obtained by least-squares fitting to the experimental data for Otof C2C/+ IHCs. (B) Original Ca2+ current (ICa) trace (recorded without the sine wave variation of the holding potential used to determine Cm) elicited by a train of 50 successive 5 ms depolarizations in an Otof C2C/+ IHC (upper panel), and the corresponding integrated charge QCa as a function of time (lower panel). (C) Experimental mean ΔCm data as in Figure 8F, converted into the number of fused vesicles (black and blue circles) during a train of 50 successive 5 ms depolarizations, superimposed onto the best least-squares fits (black and blue lines) of the model for Otof C2C/+ and Otof C2C/C2C IHCs (see Table 1). (D) Corresponding simulation of changes in vesicle numbers for each vesicle pool in Otof C2C/+ and Otof C2C/C2C IHCs.
The input Ca2+ concentration used was the integral of the Ca2+ currents (taking the effective volume in which Ca2+ diffusion occurs as a unit volume) recorded in Otof C2C/+ mice (Equation (5) in Materials and methods) during trains of 50 depolarizations of 5 ms each, separated by 10 ms (Figure 11B, top). The values of the various model parameters (Table 1) were determined by least-squares fitting of all model parameters to experimental data (see Table 1 and, Figure 11C–D). Under the conditions described in Table 1, this modified model faithfully reproduced the three dynamic components observed in Otof C2C/+ IHCs (RRP depletion, linear and superlinear release; Figure 11C–D). No Ca2+ load terms other than those in the equations were required to reproduce the superlinear release component. Least-squares fits of the model to the experimental results for Otof C2C/C2C IHCs yielded values for the RRP fusion rate (K1) and the rate of transition from the recycling pool to the RRP (K2) lower than those in Otof C2C/+ IHCs, by factors of 3.0 and 7.7, respectively (Table 1). The rate of transition from the reserve pool to the recycling pool (K3) was also markedly lower, but with a large confidence interval (Table 1). The Ca2+ thresholds for the recruitment of each vesicle pool were similar in Otof C2C/+ and Otof C2C/C2C IHCs. The sizes of the four vesicle pools were also similar in Otof C2C/+ IHCs and Otof C2C/C2C IHCs, consistent with the electron tomography results (Figure 4). Changes in the K1, K2, and K3 transition rates were, therefore, sufficient to reproduce the main features of the impairment of synaptic exocytosis observed in Otof C2C/C2C IHCs (slower RRP depletion, lower rate of linear release, and absence of superlinear release) (Figure 11C–D).
Table 1
Values of the parameters used in the mass action model of synaptic release
https://doi.org/10.7554/eLife.31013.021| Parameter | Otof C2C/+ | Otof C2C/C2C |
|---|---|---|
| VM1 | 616 ± 105 vesicles | 570 ± 81 vesicles |
| VM2 | 1 602 ± 248 vesicles | 1 877 ± 487 vesicles |
| VM3 | 16772 ± 8792 vesicles | 11 312 ± 3835 vesicles |
| VM4 | 11 491 ± 2015 vesicles | 14 171 ± 3562 vesicles |
| k1 | 1062 ± 583 C−1.s−1 | 349 ± 169 C−1.s−1 |
| k2 | 6.4 ± 3.9 C−1.s−1 | 0.8 ± 0.4 C−1.s−1 |
| k3 | 4.5 ± 9.9 C−1.s−1 | 0.95 ± 0.86 C−1.s−1 |
| k4 | (6.6 ± 5.2) x 10−3 C−1.s−1 | (8.5 ± 3.6) x 10−3 C−1.s−1 |
| [Ca2+]1 | (1.7 ± 0.8) x 10−14 C | (2.1 ± 0.1) x 10−14 C |
| [Ca2+]2 | (8.3 ± 5.9) x 10−13 C | (6.7 ± 2.7) x 10−13 C |
| [Ca2+]3 | (8. 7 ± 2. 6) x 10−12 C | (10.2 ± 1.4) x 10−12 C |
| [Ca2+]4 | (9.7 ± 3.4) x 10−12 C | (9.7 ± 1.6) x 10−12 C |
Discussion
By genetically modifying the Ca2+-binding properties of the otoferlin C2C domain, we were able to investigate the hypothetical Ca2+-sensor function(s) of the protein in the mature IHC synapse in vivo. By contrast to previously reported Otof mouse mutants (Roux et al., 2006; Longo-Guess et al., 2007; Pangrsic et al., 2010; Strenzke et al., 2016), most morphological and functional features of the mature IHC synapse, and the amount and subcellular distribution of otoferlin were unchanged in the mutant Otof C2C/C2C mice. The structure of the IHC ribbon synapse, the sizes and densities of the different vesicle pools, and the distance of RRP synaptic vesicles from the presynaptic plasma membrane were similar in Otof C2C/+ and Otof C2C/C2C mice. Only the distance between RAP vesicles and the ribbon was slightly larger in Otof C2C/C2C mice. The pool size of vesicles able to fuse was unaffected in Otof C2C/C2C IHCs, as shown by the normal maximal ΔCm evoked by Ca2+ uncaging. The amplitude of voltage-triggered Ca2+ currents and the spatiotemporal pattern of intracellular Ca2+ diffusion were also unaffected. Finally, the tight coupling between Ca2+ channels and RRP vesicles was unmodified, with no observed change in RRP fusion kinetics in the presence of high intracellular EGTA concentrations. The necessary conditions for assessment of the specific effects of the C2C mutations on IHC synaptic exocytosis were therefore met.
Convergent lines of evidence indicate that mutations of the otoferlin C2C domain affected the Ca2+ sensing domains involved in triggering the fusion of RRP vesicles at the IHC ribbon synapse. Through the various experimental protocols used to manipulate intracellular Ca2+ levels near release sites during Ca2+ channel activation, we found that these mutations almost halved the Ca2+ sensitivity of the RRP sensor (i.e., decrease by a factor of 1.7 based on the modulation of depolarization levels, of 1.5 for variation of the duration of depolarization, or of 2.2 for the variation of extracellular Ca2+ concentrations). The lower Ca2+ sensitivity of vesicle fusion in Otof C2C/C2C IHCs was further established by rapid increases in intracellular Ca2+ concentration upon photolysis of caged Ca2+ that resulted in a delayed onset of exocytosis and a doubling of the time taken to reach the maximal rate of fusion. By simultaneously monitoring ΔCm and intracellular Ca2+ concentration, we were able to show that the C2C domain mutation, by reducing the Ca2+ affinity of otoferlin, affected the Ca2+ sensitivity of synaptic release but with no major effect on its cooperativity. Finally, the results of the simulation derived from the modified mass-action model (Schnee et al., 2011b) were consistent with a lower rate of RRP vesicle fusion at Otof C2C/C2C IHC synapses. Together, our results show that otoferlin functions as a Ca2+ sensor for vesicle fusion with the plasma membrane at the IHC ribbon synapse, and implicate the C2C domain in the Ca2+ dependence of RRP vesicle fusion rate.
Otof C2C/C2C IHCs displayed sustained exocytosis in response to trains of depolarizing pulses (Figure 8D–F), but the rate for the linear component of this sustained release was about a third that in Otof C2C/+ IHCs, and the superlinear component of this release observed in Otof C2C/+ IHCs could be elicited in only one of 17 Otof C2C/C2C IHCs. The finding of normal vesicle numbers, densities, and distributions in the RAP and OP, which are thought to underlie RRP replenishment, excluded the possibility of a smaller number of vesicles being the cause of the lower rate of sustained release in Otof C2C/C2C IHCs. This conclusion was also supported by the unaffected maximal release in Ca2+ uncaging experiments in these mutants. The paired-pulse ratio (for different inter-pulse intervals) experiments, probing synaptic vesicle pool replenishment efficiency independently of fusion efficiency (Moser and Beutner, 2000), indicated that peak replenishment efficiency in Otof C2C/C2C IHCs was only half that in Otof C2C/+ IHCs, ruling out the possibility of the replenishment defect being merely a consequence of the impairment of RRP fusion. Consistent with this result, modification of the parameters governing the kinetics of RRP fusion alone in the model did not reproduce the slower rate of sustained release observed experimentally in Otof C2C/C2C IHCs. The simulations were consistent with the experimental results only if both the transition rate for vesicle fusion (K1) and that for synaptic vesicle pool replenishment (K2) were decreased. The detrimental effect of C2C mutations on synaptic vesicle pool replenishment is unlikely to be caused by an impairment of endocytosis, because endocytosis rates and synaptic vesicle numbers were similar in Otof C2C/+ and Otof C2C/C2C IHCs. Finally, the RRP replenishment defect in Otof C2C/C2C IHCs was partially rescued, in terms of total synaptic release, by making Ca2+ available at high concentrations throughout the cytoplasm, as in Ca2+ uncaging experiments, suggesting that synaptic vesicle reformation is not affected in Otof C2C/C2C IHCs. The similar patterns of Ca2+ entry and diffusion in Otof C2C/+ and Otof C2C/C2C IHCs excluded a lower local Ca2+ concentration as the cause of the superlinear release suppression in Otof C2C/C2C IHCs, and provided additional evidence that the lack of superlinear sustained release is due to the abnormal Ca2+ sensing properties of the mutated otoferlin. We therefore conclude that the synaptic vesicle pool replenishment defect in Otof C2C/C2C IHCs is independent of the RRP fusion defect, and results from the slower recruitment of vesicles to the release site caused by the lower Ca2+ affinity of the mutated otoferlin. The molecular motor myosin VI, which has been shown to interact with otoferlin (Roux et al., 2006; Heidrych et al., 2009), might be involved in this recycling process.
What role does the otoferlin C2C domain play in IHC synaptic vesicle fusion and in synaptic vesicle pool replenishment? Otoferlin interacts with neuronal t-SNARE proteins through the C2A, C2B, C2C, C2E and C2F domains, and with the Cav1.3 channel through the C2A, C2B, C2D and C2F domains, but not the C2C domain, in vitro (Roux et al., 2006; Ramakrishnan et al., 2009; Johnson and Chapman, 2010; Hams et al., 2017). However, the presence of neuronal SNARE proteins in IHCs is under debate (Nouvian et al., 2011). The Otof C2C/C2C mutant IHCs still showed significant vesicle fusion and vesicle pool replenishment. Moreover, by contrast to the findings for Otof -/- (Roux et al., 2006), pachanga mutant (Pangrsic et al., 2010), and Otof I515T/I515T mutant mice (Strenzke et al., 2016), all vesicles in Otof C2C/C2C IHCs were able to fuse when exposed to high Ca2+ loads, such as those released in Ca2+ uncaging experiments, although the fusion process was both slower and delayed. These results suggest that the lower Ca2+-binding affinity of otoferlin due to the C2C mutations can be partially overcome by high Ca2+ concentrations. Consistent with this hypothesis, exocytosis levels in Otof C2C/+ and Otof C2C/C2C IHCs were similar in particular recording conditions. For 20 ms-long IHC depolarizations of small amplitudes (to between −65 mV and −30 mV), resulting in few open Ca2+ channels but strong Ca2+ influx-driving forces, the Ca2+ dependence of ΔCm was similar in Otof C2C/C2C and Otof C2C/+ IHCs. At these membrane potentials, the Ca2+ sensor of the RRP vesicles closest to the few open Ca2+ channels is readily saturated with Ca2+, triggering vesicle fusion at similar levels in Otof C2C/C2C and Otof C2C/+ IHCs. Based on the proposed role of the C2A domain in Syt1 (Shin et al., 2009), we suggest that Ca2+ binding to the C2C domain of otoferlin enhances the activity of other C2 domains, resulting in an increase in the overall Ca2+-sensitivity of release. Mutations of the otoferlin encoding gene are among the most frequent causes of inherited profound deafness in humans. Gene therapy projects based on the transfer of an otoferlin ‘minigene’, a method similar to that being developed for dysferlin defects (Sinnreich et al., 2006; Lek et al., 2013; Fuson et al., 2014), require to extend the present functional characterization of the otoferlin C2C domain to the other C2 domains of the protein.
What consequences do the C2C domain mutations have for hearing? In one-month-old Otof C2C/C2C mice, hearing thresholds were only slightly higher than normal, but the amplitude of the ABR wave-I, reflecting the synchronous activity of the auditory nerve fibers in vivo, was a third that in Otof C2C/+ mice. The lower amplitude of ABR wave-I in Otof C2C/C2C mice is probably due to significantly lower rates of synaptic release and/or a desynchronization of synaptic vesicle fusion. Accordingly, although the mean amplitudes and decay time constants of primary auditory neuron EPSCs were unchanged, the EPSC rate following the extracellular application of 25 mM KCl was smaller in Otof C2C/C2C mice than in Otof +/+ mice. This effect may be minimal on hearing in vivo since the receptor potentials of IHCs are unlikely to reach values beyond −20 mV upon sound stimulation (Palmer and Russell, 1986), that is they are expected to stay in a range at which not all Ca2+ channels are open but the Ca2+ driving force is relatively large, potentially leading to the local saturation of Ca2+ sensors. In contrast, the much slower sustained release related to vesicle pool replenishment failure may affect hearing much more by contributing to a desynchronization of the auditory nerve fiber responses. Remarkably, despite the smaller ABR wave-I, the timing and amplitude of wave-II, which reflects the synchronous activity of the central auditory synaptic relays in the cochlear nucleus, were preserved in Otof C2C/C2C mice. It has been suggested that the anatomical convergence of many auditory nerve fibers onto principal neurons of the ventral cochlear nucleus may compensate to a certain degree the asynchronism effect of impaired IHC exocytosis on the response of auditory neurons (Buran et al., 2010).
We show here that the same Ca2+ sensor, otoferlin, is involved in synaptic vesicle fusion and in synaptic vesicle pool replenishment at the IHC ribbon synapse. In many synapses, different steps of the synaptic vesicle cycle involve different Ca2+ sensors. For instance, at the calyx of Held synapse, Syt2 drives synchronous vesicular exocytosis (Sun et al., 2007), and vesicle pool replenishment requires the Ca2+-calmodulin-Munc13-1 complex (Lipstein et al., 2013). Likewise, rapid vesicular exocytosis at hippocampal synapses depends on Syt1, whereas vesicle pool replenishment involves Syt7 and calmodulin (Liu et al., 2014; Jackman et al., 2016). In some synapses, however, Syt1 or Syt2 are involved in several steps of the synaptic vesicle cycle. At the neuromuscular junction in drosophila, Syt1 is involved both in exocytosis and endocytosis (Poskanzer et al., 2003), and in mouse cerebellum basket cells, the major Ca2+ sensor for exocytosis, Syt2, also mediates fast vesicle pool replenishment (Chen et al., 2017). In IHCs we cannot exclude the possibility of otoferlin being assisted by other Ca2+-sensing proteins, such as Syt4, which has been shown to be involved in the developmental transition of exocytosis from nonlinear to linear Ca2+ dependence (Johnson et al., 2010). Mature IHC ribbon synapses lack several proteins critical for vesicle fusion in synapses of the central nervous system, including Syt1 and Syt2 (Safieddine and Wenthold, 1999; Beurg et al., 2010), complexins, which act as important regulators of spontaneous and fast synchronous Ca2+-evoked fusion (Giraudo et al., 2006; Strenzke et al., 2009; Krishnakumar et al., 2011; Lai et al., 2014), synaptophysin (Safieddine and Wenthold, 1999), and Munc13 (Vogl et al., 2015). In addition, neuronal SNARE proteins (synaptobrevins, snap-25, and syntaxin-1) have been reported to be dispensable for exocytosis at the IHC ribbon synapse, suggesting that other molecular components take on the role of these proteins (Nouvian et al., 2011). Such a singular molecular setting of the mature IHC ribbon synapse presumably optimizes the coordination between fast vesicle fusion and synaptic vesicle pool replenishment, allowing this synapse to operate indefatigably at high rates and with a high degree of temporal precision.
Materials and methods
Animals
Animal experiments were carried out in accordance with European Community Council Directive 2010/63/UE under authorizations 2012–028, 2012–038, and 2014–005 from the Institut Pasteur ethics committee for animal experimentation. The Otof Ala515,Ala517/Ala515,Ala517 (referred to as Otof C2C/C2C) knock-in mouse mutant was generated by homologous recombination (Institut Clinique de la Souris, Illkirch, France). The targeting construct, spanning exon 15 (ENSEMBL ENSMUSE00001209343) and containing the two missense mutations, was introduced by electroporation into embryonic stem cells from the 129S1/SvlmJ mouse strain. Stem cells carrying the desired construct were injected into blastocysts from C57BL/6J mice to obtain chimeric mice. After germline transmission, mice were crossed with C57BL/6J mice. Birth rates for all genotypes conformed to Mendelian ratios. Experiments were carried out on both male and female mice, mostly obtained by crossing heterozygous mice (Otof C2C/+) with homozygous mutant mice (Otof C2C/C2C), genotyped by PCR with the following primers: forward 5’-ATTACCTCTGCTGCTTTTGCACCTG-3’ and reverse 5’-CTCAGCAGGTGCTTCTGACCAC-3’, spanning the excised selection marker region in intron 15. As IHC synaptic exocytosis was similar in Otof C2C/+ and Otof +/+ (i.e. wild-type) mice, this breeding scheme was used to produce substantial numbers of Otof C2C/C2C homozygous mutant mice and Otof C2C/+ mice (used as controls) within a given mouse litter. For all experiences, except otoferlin immunofluorescence quantification, experimentalists were not blinded against the genotypes of the mice.
Immunohistofluorescence
Request a detailed protocolThe entire mouse inner ear was isolated from the surrounding bone, as previously described (Roux et al., 2006). For rapid fixation of the cochlear sensory epithelium (organ of Corti), the round and oval windows were opened, the bone over the cochlear apical turn was removed, and the cochlea was perfused with 4% paraformaldehyde in phosphate-buffered saline (PBS). The cochlea was then post-fixed by incubation in the same fixative for 30 min at 4°C. Whenever the anti-Cav1.3 antibody was used, the cochlea was fixed by incubation with 99% methanol for 20 min at −20°C. Cochlear whole-mount preparations were permeabilized by incubation with 0.3% Triton X-100 in PBS supplemented with 20% normal horse serum for one hour at room temperature. 4',6-diamidino-2-phenylindole (DAPI) was used to stain cell nuclei. The following antibodies were used: rabbit anti-otoferlin (1:250 dilution) (Roux et al., 2006), goat anti-CtBP2/ribeye (1:150 dilution; Santa Cruz Biotechnology; # sc-5966), rabbit anti-Cav1.3 (1:50 dilution; Alomone Labs; #ACC-005), mouse anti-GluA2 (1:200 dilution; Millipore; #MAB397), rabbit anti-Vglut3 (1:250, Synaptic Systems, # 135 203) and secondary Atto Fluor Cy5-conjugated anti-mouse, Alexa Fluor 488-conjugated anti-goat, and Atto Fluor 647-conjugated anti-rabbit IgG (1:200 dilution, Sigma) antibodies. Anti-Ctbp2, anti-GluA2 and anti-Cav1.3 antibodies have been widely used and shown to be specific (Beurg et al., 2010; Liberman et al., 2011; Jing et al., 2013; Wong et al., 2014; Vincent et al., 2017). After incubation with the appropriate antibodies, the samples were washed three times in PBS, and mounted in one drop of Fluorsave medium (Biochem Laboratories, France). Fluorescence confocal z-stacks from selected cochlear regions were obtained with an LSM 700 confocal microscope (Zeiss, Oberkochen, Germany) equipped with a high-resolution objective (numerical aperture of 1.4, 60 x oil-immersion objective). Images were acquired with a 4 x digital zoom in a 1024 × 1024 raster (pixel size = 0.036 μm in x and y) with 0.2 μm steps in z. Three Otof C2C/+ and five Otof C2C/C2C mice were examined for the analysis of otoferlin labeling. Four Otof C2C/+ and four Otof C2C/C2C mice were examined for determination of the number of ribbon synapses per IHC.
For otoferlin immunofluorescence quantification, whole-mount preparations of organs of Corti from Otof C2C/+ and Otof C2C/C2C littermates were blind-processed in parallel, using the same experimental settings from tissue fixation to confocal imaging. For each organ of Corti, fluorescence intensity was averaged in Gaussian volumes with standard deviations of 1 µm along the X, Y and Z axes, centered around points selected at the apex, the middle, and the base of 7–8 IHCs per confocal stack (for a total of 51 Otof C2C/+ IHCs and 52 Otof C2C/C2C IHCs). In effect, the 3D images were blurred by convolution with a Gaussian of the prescribed standard deviations, and intensity values of the blurred images at the selected points were retrieved.
STED microscopy
Request a detailed protocolDual-color STED microscopy was carried out with a custom-built system (Lauterbach et al., 2013) using two excitation beams at 480 ± 10 nm and 532 ± 5 nm obtained by filtering a super-continuum laser beam, and one STED beam tuned at 647 nm, coupled with a helical phase mask (VPP-A1, RPC Photonics, New York) to produce a toroidal (donut-shaped) diffraction pattern centered on the excitation spot in the focal plane of a 100x/1.4NA objective lens (Olympus, Tokyo, Japan). Since the two excitation beams arise from a single monomode optical fiber, the two color-channels are co-aligned by design. Two-color STED imaging was achieved with two dyes, Atto565 and DY485XL, excited with the 532 nm and 480 nm excitation beams, respectively. Atto565 has excitation and emission peaks around 563 nm and 592 nm, respectively, whereas the long Stokes-shift dye DY485XL displays maximal excitation at about 485 nm, with an emission peak at around 560 nm. Fluorescence images were sequentially collected with an avalanche photodiode (Perkin Elmer) behind a 585/65 emission filter. A pixel size of 50 nm and a scanning dwell time of 100 µs were used for the acquisitions.
STED microscopy image processing and colocalization analysis
Request a detailed protocolWavelet denoising and deconvolution were applied to the images, as previously described, with a point spread function extracted from the images (de Monvel et al., 2003), and linear unmixing was used to compensate for slight leakage between the two excitation channels. The staining patterns observed in the Atto565- and the DY485-channel images was granular, and consisted in many resolution-limited spots representing structures stained for otoferlin and Vglut3, referred to as otoferlin spots and Vglut3 spots, respectively, within the cells. The densities of either the Vglut3 or the otoferlin spots were similar within all the cells analyzed (p>0.05, Kolmogorov-Smirnov test). This made it possible to analyze the colocalization of otoferlin and Vglut3 spots by determination of the positions of each type of spots within the cells of interest, which could be achieved with a resolution better than the pixel size by maxima detection. Nearest-neighbor analysis was then performed by comparing the distribution of the distance between a randomly chosen otoferlin spot and the nearest Vglut3 spot, to quantify the colocalization of the two proteins, with the distribution of the distance between a random Vglut3 spot and the nearest neighboring Vglut3 spot, corresponding to the expected distribution of nearest-neighbor distances for randomly distributed points. The shift of the otoferlin-Vglut3 nearest-neighbor distance distribution towards distance values smaller than expected for a purely random distribution indicated colocalization of the two proteins.
Electron tomography
Request a detailed protocolCochleas were perfused with 4% paraformaldehyde and 2% glutaraldehyde in Sorensen buffer at pH 7.4, and immersed in the fixative solution for 2 hr. They were then postfixed by incubation overnight in 1% osmium tetraoxide in cacodylate buffer at 4°C. They were dehydrated in a graded series of acetone concentrations and embedded in Spurr’s low-viscosity epoxy resin (EMS, Hatfield, USA), which was then hardened at 70°C. For tomographic analysis, thick (200 or 250 nm) sections of the sensory epithelium (organ of Corti) were collected on 100-mesh parallel bar copper grids, and incubated, for 10 min on each side, with 15 nm protein gold particles (UMC Utrecht, The Netherlands). The grids were contrast-stained with 4% uranyl acetate in dH2O for 40 min, followed by Reynold’s lead citrate for 3 min. The sections were viewed in an FEI Tecnai G2 200kV transmission electron microscope, and single- or double-tilt series were acquired from approximately −65° to +65° with 1° increments, with FEI Xplore 3D software and a Gatan US 4000 camera. The acquired tilt series were processed with a wavelet-denoising algorithm implemented in Matlab (Mathworks) (Boutet de Monvel et al., 2001) to reduce background noise without losing fine detail. The images of the tomographic tilt series were then aligned, and the final volume was reconstructed with a weighted back-projection algorithm and IMOD software (Kremer et al., 1996).
3D reconstructions and estimates of vesicle pool sizes
Request a detailed protocolAnalyses of the ribbon synapses, including segmentation, 3D reconstruction, and rendering, were carried out with AMIRA software (version 5.1; Mercury Computer Systems, San Diego, CA) and with custom Matlab functions (Mathworks). The contours of the ribbon, the presynaptic density of the afferent dendrite, and nearby organelles, such as mitochondria, coated pits, and tubular structures, were drawn on every section. Spheres of constant diameter were used to mark synaptic vesicles. The ribbon was defined as the center of the active zone. For each ribbon, we counted the number of synaptic vesicles within 80 nm of the ribbon surface. These vesicles were considered to constitute the ribbon-attached vesicle pool (RAP), which is thought to correspond to the functional recycling and reserve pools (Rizzoli and Betz, 2005). A subset of the ribbon-attached vesicles, with centers lying within 40 nm of the presynaptic membrane and below the ribbon (within 80 nm of the center of the active zone), was considered to form the pool of docked or readily releasable vesicles (the RRP), thought to be released first during depolarization (Lenzi et al., 1999; Schnee et al., 2011a). We chose this distance of 40 nm, because the mean radius of a vesicle was ~20 nm and because the cytosolic parts of t-SNARE and v-SNARE are ∼10 nm long, so SNARE interactions may occur at distances of up to 20 nm from the presynaptic plasma membrane (Zenisek et al., 2000; Castorph et al., 2010). Using our ribbon reconstruction data and taking the distribution of synaptic vesicles into account, we estimated the total size and volume density of the synaptic vesicles attached to each ribbon, and the number and volume density of outlying cytoplasmic vesicles located within 350 nm of the ribbon surface — the outlying vesicle pool (OP) thought to contribute to the functional reserve pool (Rizzoli and Betz, 2005). We estimated these vesicle pools in our tomographic reconstructions of ribbon synapses, using only ribbon reconstructions including more than half of the ribbon surface. The numbers and densities of vesicles in each pool were obtained with a distance transformation (implemented in Matlab) providing volume shells around the ribbon delimited by various distances from the ribbon surface.
Functional hearing tests
Request a detailed protocolAuditory brainstem responses (ABRs) and distortion product otoacoustic emissions (DPOAEs) were recorded, as previously described (Le Calvez et al., 1998), in mice aged between 1 and 13 months. ABR waves were recorded in response to pure tone bursts at sound frequencies of 10, 15, 20, and 32 kHz. ABR signals were averaged after the presentation of a series of 100–200 pure tone bursts. ABR thresholds were defined as the lowest stimulus for which recognizable ABR waves could be observed. The amplitude of ABR wave-I was estimated by measuring the voltage difference between the wave-I peak and the trough between wave-I and wave-II.
DPOAEs were collected with a miniature microphone positioned at the entry of the ear canal. Two primary pure-tone stimuli of frequencies f1 and f2 were applied simultaneously, with f2 between 5 and 20 kHz, and the f2 /f1 ratio kept constant at 1.2. The cubic difference tone at 2f1 – f2, the most prominent distortion product tone produced by the mammalian ear, was measured for primary tone frequencies of equal levels, ranging from 30 to 75 dB SPL.
Electrophysiology and Ca2+ imaging
Request a detailed protocolElectrophysiological recordings were carried out on excised cochlear apical coils of either prehearing (P8-P12) or hearing (P15-P18) Otof +/+, Otof C2C/+, and Otof C2C/C2C mice, as previously described (Beurg et al., 2010). The dissection solution contained 143 mM NaCl, 6 mM KCl, 1.3 mM CaCl2, 0.9 mM MgCl2, 0.7 mM NaH2PO4, 5 mM glucose, 2 mM sodium pyruvate, 10 mM HEPES, pH 7.4. Recordings were carried out at room temperature (20–23°C). The patch pipette electrodes were made of borosilicate glass (World Precision Instruments).
For cell capacitance experiments on IHCs, the pipette resistance in the external solution was 2–3 MΩ. Only cells with a series resistance below 10 MΩ (uncompensated) were included in the study. Ca2+ current and ΔCm were recorded with an EPC-9 patch-clamp amplifier and Patchmaster software (HEKA, Ludwigshafen, Germany). We used a single 30 mV amplitude sine wave from a holding potential of −95 mV. Except for endocytosis recordings, the acquisition frequency was 50 kHz, low-pass filtered at 6–10 kHz, and the frequency of the sine wave was 1 kHz. In the case of endocytosis recordings, the acquisition frequency was set to 10 kHz, and the frequency of the sine wave to 800 Hz. The resulting maximal depolarization to ∼−65 mV was sufficiently small to avoid activation of the Ca2+ current. Ca2+ current recordings were corrected for the linear leak conductance measured near −95 mV. Liquid junction potential (~−15.5 mV) was corrected off-line for Cs-gluconate-based intracellular solutions. The extracellular recording solution consisted of 111.5 mM NaCl, 6 mM KCl, 10 mM CaCl2, 1 mM MgCl2, 27 mM TEA-Cl, 2 mM sodium pyruvate, 5 mM glucose, 10 mM Na-HEPES, pH 7.4 (adjusted with NaOH). Tetrodotoxin (1 μM) and apamin (1 μM) were added to the extracellular solution. The intracellular pipette solution for cell membrane capacitance recordings contained 140 mM Cs-gluconate, 20 mM TEA-Cl, 0.5 mM EGTA, 5 mM creatine phosphate, 4 mM Mg-ATP, 0.3 mM Na2-GTP, 10 mM HEPES, pH 7.2 (adjusted with CsOH). We used 10 mM extracellular Ca2+ and 0.5 mM intracellular EGTA unless otherwise specified. The ΔCm evoked by membrane depolarization was measured as ΔCm = Cm (response) − Cm (baseline), and was used as a measure of synaptic vesicle exocytosis in IHCs. Cm (baseline) was obtained by averaging capacitance data points before the depolarizing pulse, and Cm (response) was obtained by averaging capacitance data points after the transient current following the depolarizing pulse (Figure 5—figure supplement 1A). With depolarizing protocols, possible kinetic perturbations in Otof C2C/C2C IHCs are likely to be masked by the relatively long time interval between the end of the depolarizing stimulus and the measurement of the post-stimulus Cm (typically 50–100 ms for a depolarization lasting 20 ms).
Ca2+ imaging experiments were carried out by adding 200 µM Oregon Green Bapta 5N dye (OGB-5N, Invitrogen) to the intracellular patch pipette solution. Images were acquired at a rate of 500 Hz, with a high-speed camera (Photometrics) mounted on a swept-field confocal microscope (Bruker, Billerica, MA, USA). Imaging protocols began two minutes after cell opening, to allow the OGB-5N dye to diffuse. Ca2+ entry was assessed by selecting regions of interest (a circle with a 6-pixel radius), in which the standard deviation of the fluorescent Ca2+ signal was maximal during IHC depolarization (see the images in Figure 8—figure supplement 1A).
Ca2+ uncaging experiments
Request a detailed protocolWe triggered a rapid rise in the intracellular Ca2+ concentration from the Ca2+ caged by the DM-nitrophen chelator (Interchim, France), using a single flash from a high-power UV LED light source (Mic-LED 365, 128 mW, Prizmatix, Givat Shmuel, Israel). The UV LED TTL triggered through the EPC10 patch clamp amplifier, was directly connected to the epi-illumination port at the rear of an upright Nikon FN1 microscope, and illumination was focused through the 60 x objective (CFI Fluor 60 x W NIR, WD = 2.0 mm, NA = 1). Hair cells were loaded with 145 mM CsCl, 5 mM HEPES, 20 mM TEA, 10 mM DM-nitrophen and 10 mM CaCl2. After patch rupture, we systematically kept the cells at a holding potential of −70 mV (without leak correction) for 2 min, for cell loading and equilibration.
In some experiments, intracellular Ca2+ concentration was measured by adding 50 µM OGB-5N to the intracellular solution, as previously described (Vincent et al., 2014; Vincent et al., 2015). Changes in [Ca2+]i were measured with a C2 confocal system and NIS-elements imaging software (Nikon, Japan) coupled to the FN1 Nikon upright microscope. The dye was excited with a 488 nm solid-state laser (85-BCD-010–706, Melles Griot, CA USA) and emission was recorded at 500–530 nm. OGB-5N-emission fluorescence was continuously monitored before and after the UV flash, by fast line scan analysis at 1 kHz spanning the middle part of the IHC. The Ca2+-dependent fluorescent signal of OGB-5N was calibrated in situ, in the hair cell cytoplasm, as previously described (Vincent et al., 2014). Hair cells were voltage-clamped at −70 mV in the whole-cell configuration with different solutions containing various free calcium concentrations ([Ca2+]free), from 1 to 100 µM. The patch pipettes were filled with a Cs-based solution (145 mM CsCl, 5 mM HEPES, 20 mM TEA, 0.05 mM OGB-5N 0.05) and various concentrations of Ca2+ and EGTA. The Ca-EGTA Maxchelator freeware (Stanford, CA, USA) was used to determine [Ca2+]free. After 2 min of cell loading and equilibrium, the fluorescence signal was measured at each [Ca2+]free in different cells. Fluorescence emission values were plotted as F/Fmax against [Ca2+]free. Data points were best fitted by a sigmoidal function with a KD of 23.30 ± 0.71 µM. This KD value is very close to the value reported in vitro (KD = 20 µM, Molecular Probes, Life Technologies). We quantified Ca2+ responses in each hair cell during the Ca2+ uncaging experiments, by calculating the intracellular Ca2+ concentration ([Ca2+]i) as follows ([Pawley, 2006], chapter 42): [Ca2+]i = KD (F-Fmin)/(Fmax-F), where KD is the estimated constant of dissociation, F the fluorescence at time t, Fmin the minimum fluorescence, and Fmax the maximal fluorescence.
Cm recordings in Ca2+ uncaging experiments were performed with an EPC-10 patch-clamp amplifier. The amplitude and frequency of the sine wave were 20 mV and 1 kHz, respectively.
EPSC recordings
Request a detailed protocolPostsynaptic bouton recordings of EPSCs were performed as previously described (Glowatzki and Fuchs, 2002). Pipette resistance in the external solution was 8–10 MΩ. The external solution contained 5.8 mM KCl, 144 mM NaCl, 0.9 mM MgCl2, 1.3 mM CaCl2, 0.7 mM NaH2PO4, 5.6 mM glucose, 10 mM HEPES, pH 7.4 (adjusted with NaOH), and the pipette solution for intracellular recording contained 135 mM KCl, 3.5 mM MgCl2, 0.1 mM CaCl2, 5 mM EGTA, 5 mM HEPES, 2.5 mM Na2ATP, pH 7.2 (adjusted with KOH). EPSCs were induced by increasing extracellular K+ concentration from 5.8 mM to 25.8 mM, by replacing 20 mM NaCl with 20 mM KCl in the external solution. EPSC recordings were performed with a MultiClamp 700B amplifier (Molecular Devices), and a National Instruments digitizer (NI-PCIe 6351). They were low-pass filtered at 6 kHz, and digitized at 50 kHz.
Data were analyzed as previously described (Glowatzki and Fuchs, 2002; Goutman and Glowatzki, 2007). In the case of overlapping EPSCs, the amplitude of the second EPSC was estimated by fitting the decay of the first EPSC and subtracting the fitted value at the time of the second peak. Decay time constants were calculated with monophasic recorded EPSCs only.
Statistical analysis
Request a detailed protocolThe data were analyzed with Igor Pro (WaveMetrics, Portland, OR, USA) and Prism (Graphpad, La Jolla, CA, USA) softwares. Values of p<0.05 were considered to indicate that the differences observed between groups were statistically significant. Two-tailed unpaired Student's t tests with Welch’s correction, which does not assume equal variances, were used, unless otherwise stated. The other tests performed included two-way ANOVA with Bonferroni post hoc tests to assess the interaction between two independent variables, Kolmogorov-Smirnov tests to compare distributions, Fisher’s exact tests to compare proportions, and nonparametric Mann-Whitney tests when the data could not be assumed to be normally distributed, precluding use of the parametric Student’s t test. The normality of data distribution was assessed with the D’Agostino and Pearson normality test. Data are expressed as the mean ± standard error of the mean (SEM) unless otherwise stated. Numbers (n) in the figures and text indicate the number of biological replicates derived from independent experiments. Asterisks on bar graphs denote the statistical significance of the differences indicated in brackets (*p<0.05; **p<0.01; and ***p<0.001), whereas ns indicates ‘not significant’ (p>0.05).
Modeling
Request a detailed protocolSimulations of synaptic vesicle fusion in Otof C2C/C2C and Otof C2C/+ IHCs were carried out with a modified version of a published mass action model of synaptic vesicle fusion in IHCs (Schnee et al., 2005; Schnee et al., 2011b) (Figure 11A). This model considers four functional vesicle pools: the RRP, the recycling pool, the reserve pool (Rizzoli and Betz, 2005), and a distant pool equivalent to the entire reservoir of IHC vesicles (Schnee et al., 2011b). Vesicle trafficking between pools is governed by five first-order differential equations. The transition rate constants for RRP vesicle fusion (K1), and for vesicle trafficking from the recycling pool to the RRP (K2), from the reserve pool to the recycling pool (K3), and from the distant pool to the reserve pool (K4) (see Figure 11A), were set so as to depend on intracellular Ca2+ concentration ([Ca2+]i) (here expressed in units of charge (C), which corresponds to taking the effective volume in which Ca2+ diffusion occurs as a unit volume) as follows:
(1)
(2)
(3)
(4)
(5)
where k1, k2, k3, and k4 are Ca2+-independent rate constants associated with the various pools, [Ca2+]1, …, [Ca2+]4 represent the minimum Ca2+ concentrations triggering RRP fusion, and vesicle transitions from the recycling pool, the reserve pool, and the distant pool, respectively (Figure 11A). Minimum Ca2+ concentrations were set to mimic recruitment of the additional pools of vesicles with the delays observed experimentally. Vesicle trafficking between pools and fusion were also constrained by the use of a maximum vesicle number: VM1, VM2, VM3, and VM4 for the RRP, recycling pool, reserve pool, and distant pool, respectively. These properties give rise to the following five equations governing the number of fused vesicles F(t) and vesicle number V(t) in each of the four vesicle pools:
(6)
(7)
(8)
(9)
(10)
Initial conditions were set as follows:
(11)
Equations were implemented in Igor Pro 6 software (Wavemetrics) and in Matlab. The parameters [Ca2+]1, [Ca2+]2, [Ca2+]3, [Ca2+]4, k1, k2, k3, k4, VM1, VM2, VM3, and VM4 were obtained by least-squares fitting to the experimental data obtained for Otof C2C/+ and Otof C2C/C2C IHCs. In detail, the sum-of-squares error on the Cm curve was defined as the sum of squared differences between the averaged Cm values measured as a function of some experimental parameter (depolarisation amplitude, duration of stimulus, or number of depolarisation pulses) and the corresponding Cm values predicted by the model for a given set of fitting parameters. This error was minimized using the Matlab built-in minimization function (fminsearch function), which is a general-purpose nonlinear minimization function based on the simplex algorithm (Lagarias et al., 1998). Weighting of the squared errors was uniform. The following interval constraints were applied to the fitting parameters at all iterations: k1,…, k4 between 0 and 104; VM1, VM2 between 0 and 105; VM3 between 5000 and 105, and VM4 between 10000 and 105; [Ca2+]1,…, [Ca2+]4 between 0 and 10. Error estimates on the fitted parameters were obtained by a Monte-Carlo sensitivity analysis of the fit. Namely, we generated 60 randomized versions of the Cm curves, assuming for each data point a gaussian distribution with the same mean and standard deviation as observed experimentally; we applied the same fitting procedure on each randomized Cm curve. The mean values and standard deviations stated in Table 1 were computed from 60 such Monte Carlo runs performed for each phenotype.
References
-
Control of exocytosis by synaptotagmins and otoferlin in auditory hair cellsJournal of Neuroscience 30:13281–13290.https://doi.org/10.1523/JNEUROSCI.2528-10.2010
-
Few CaV1.3 channels regulate the exocytosis of a synaptic vesicle at the hair cell ribbon synapseJournal of Neuroscience 25:11577–11585.https://doi.org/10.1523/JNEUROSCI.3411-05.2005
-
Onset coding is degraded in auditory nerve fibers from mutant mice lacking synaptic ribbonsJournal of Neuroscience 30:7587–7597.https://doi.org/10.1523/JNEUROSCI.0389-10.2010
-
Calcium-induced calcium release supports recruitment of synaptic vesicles in auditory hair cellsJournal of Neurophysiology 115:226–239.https://doi.org/10.1152/jn.00559.2015
-
Structure parameters of synaptic vesicles quantified by small-angle x-ray scatteringBiophysical Journal 98:1200–1208.https://doi.org/10.1016/j.bpj.2009.12.4278
-
Image-adaptive deconvolution for three-dimensional deep biological imagingBiophysical Journal 85:3991–4001.https://doi.org/10.1016/S0006-3495(03)74813-9
-
Otoferlin couples to clathrin-mediated endocytosis in mature cochlear inner hair cellsJournal of Neuroscience 33:9508–9519.https://doi.org/10.1523/JNEUROSCI.5689-12.2013
-
Time and intensity coding at the hair cell's ribbon synapseThe Journal of Physiology 566:7–12.https://doi.org/10.1113/jphysiol.2004.082214
-
Transmitter release at the hair cell ribbon synapseNature Neuroscience 5:147–154.https://doi.org/10.1038/nn796
-
Otoferlin is a calcium sensor that directly regulates SNARE-mediated membrane fusionThe Journal of Cell Biology 191:187–197.https://doi.org/10.1083/jcb.201002089
-
Quantitative analysis of ribbons, vesicles, and cisterns at the cat inner hair cell synapse: correlations with spontaneous rateJournal of Comparative Neurology 521:3260–3271.https://doi.org/10.1002/cne.23345
-
Computer visualization of three-dimensional image data using IMODJournal of Structural Biology 116:71–76.https://doi.org/10.1006/jsbi.1996.0013
-
A conformational switch in complexin is required for synaptotagmin to trigger synaptic fusionNature Structural & Molecular Biology 18:934–940.https://doi.org/10.1038/nsmb.2103
-
Convergence properties of the nelder--mead simplex method in low dimensionsSIAM Journal on Optimization 9:112–147.https://doi.org/10.1137/S1052623496303470
-
STED microscope with spiral phase contrastScientific Reports 3:2050.https://doi.org/10.1038/srep02050
-
Phylogenetic analysis of ferlin genes reveals ancient eukaryotic originsBMC Evolutionary Biology 10:231.https://doi.org/10.1186/1471-2148-10-231
-
Synaptic vesicle populations in saccular hair cells reconstructed by electron tomographyJournal of Neuroscience 19:119–132.
-
Hair cell ribbon synapsesCell and Tissue Research 326:347–359.https://doi.org/10.1007/s00441-006-0276-3
-
Probing the mechanism of exocytosis at the hair cell ribbon synapseJournal of Neuroscience 27:12933–12944.https://doi.org/10.1523/JNEUROSCI.1996-07.2007
-
Modes and regulation of endocytic membrane retrieval in mouse auditory hair cellsThe Journal of Neuroscience 34:705–716.https://doi.org/10.1523/JNEUROSCI.3313-13.2014
-
Scalable molecular dynamics with NAMDJournal of Computational Chemistry 26:1781–1802.https://doi.org/10.1002/jcc.20289
-
Direct interaction of otoferlin with syntaxin 1A, SNAP-25, and the L-type voltage-gated calcium channel Cav1.3Journal of Biological Chemistry 284:1364–1372.https://doi.org/10.1074/jbc.M803605200
-
A new probe for super-resolution imaging of membranes elucidates trafficking pathwaysThe Journal of Cell Biology 205:591–606.https://doi.org/10.1083/jcb.201402066
-
The auditory hair cell ribbon synapse: from assembly to functionAnnual Review of Neuroscience 35:509–528.https://doi.org/10.1146/annurev-neuro-061010-113705
-
Tracking vesicle fusion from hair cell ribbon synapses using a high frequency, dual sine wave stimulus paradigmCommunicative & Integrative Biology 4:785–787.https://doi.org/10.4161/cib.17822
-
Evidence that rapid vesicle replenishment of the synaptic ribbon mediates recovery from short-term adaptation at the hair cell afferent synapseJournal of the Association for Research in Otolaryngology 5:376–390.https://doi.org/10.1007/s10162-004-5003-8
-
Complexin-I is required for high-fidelity transmission at the endbulb of Held auditory synapseJournal of Neuroscience 29:7991–8004.https://doi.org/10.1523/JNEUROSCI.0632-09.2009
-
Unconventional molecular regulation of synaptic vesicle replenishment in cochlear inner hair cellsJournal of Cell Science 128:638–644.https://doi.org/10.1242/jcs.162099
-
Depletion and replenishment of vesicle pools at a ribbon-type synaptic terminalJournal of Neuroscience 17:1919–1927.
-
Current Protocols in Bioinformatics5.6.1–5.6.5, Comparative Protein Structure Modeling Using MODELLER, Current Protocols in Bioinformatics.
Article and author information
Author details
Jacques Boutet de Monvel

Jean-Pierre Hardelin
Shyam S Krishnakumar
Funding
Foundation Raymonde et Guy Strittmatter (Research project grant)
- Christine Petit
Fondation BNP Paribas (Research project grant)
- Christine Petit
LHW-Stiftung (Research project grant)
- Christine Petit
LabExLifesenses (ANR‐10‐LABX‐65)
- Christine Petit
Investissements d'Avenir (ANR‐11‐IDEX‐0004‐02)
- Christine Petit
Agir pour l'Audition (Prix Emergence scientifique)
- Nicolas Michalski
The funders had no role in study design, data collection and interpretation, or the decision to submit the work for publication.
Acknowledgements
We thank Dominique Weil and the Institut Clinique de la Souris (Illkirch, France) for providing us with the recombinant Otof C2C/C2C mice, and Philippe Vincent for advice for the Ca2+ uncaging experiments. This work was supported by Foundation Raymonde et Guy Strittmatter, Foundation BNP Paribas and LHW‐Stiftung grants to CP. This work was carried out in the framework of the LabEx Lifesenses [ANR‐10‐LABX‐65] and was supported by French state funds managed by the Agence Nationale pour la Recherche within the Investissements d'Avenir program under reference ANR‐11‐IDEX‐0004‐02, and the Prix Emergence of the Agir pour l’Audition foundation to NM.
Ethics
Animal experimentation: Animal experiments were carried out in accordance with European Community Council Directive 2010/63/UE under authorizations 2012-028, 2012-038, and 2014-005 from the Institut Pasteur ethics committee for animal experimentation.
Version history
- Received: August 11, 2017
- Accepted: November 6, 2017
- Accepted Manuscript published: November 7, 2017 (version 1)
- Version of Record published: November 23, 2017 (version 2)
Copyright
© 2017, Michalski et al.
This article is distributed under the terms of the Creative Commons Attribution License, which permits unrestricted use and redistribution provided that the original author and source are credited.
Metrics
-
- 3,071
- views
-
- 589
- downloads
-
- 88
- citations
Views, downloads and citations are aggregated across all versions of this paper published by eLife.
Download links
A two-part list of links to download the article, or parts of the article, in various formats.
Downloads (link to download the article as PDF)
Open citations (links to open the citations from this article in various online reference manager services)
Cite this article (links to download the citations from this article in formats compatible with various reference manager tools)
Otoferlin acts as a Ca2+ sensor for vesicle fusion and vesicle pool replenishment at auditory hair cell ribbon synapses
eLife 6:e31013.
https://doi.org/10.7554/eLife.31013
Further reading
-
- Neuroscience
The central tendency bias, or contraction bias, is a phenomenon where the judgment of the magnitude of items held in working memory appears to be biased toward the average of past observations. It is assumed to be an optimal strategy by the brain and commonly thought of as an expression of the brain’s ability to learn the statistical structure of sensory input. On the other hand, recency biases such as serial dependence are also commonly observed and are thought to reflect the content of working memory. Recent results from an auditory delayed comparison task in rats suggest that both biases may be more related than previously thought: when the posterior parietal cortex (PPC) was silenced, both short-term and contraction biases were reduced. By proposing a model of the circuit that may be involved in generating the behavior, we show that a volatile working memory content susceptible to shifting to the past sensory experience – producing short-term sensory history biases – naturally leads to contraction bias. The errors, occurring at the level of individual trials, are sampled from the full distribution of the stimuli and are not due to a gradual shift of the memory toward the sensory distribution’s mean. Our results are consistent with a broad set of behavioral findings and provide predictions of performance across different stimulus distributions and timings, delay intervals, as well as neuronal dynamics in putative working memory areas. Finally, we validate our model by performing a set of human psychophysics experiments of an auditory parametric working memory task.
-
- Neuroscience
The brain regulates food intake in response to internal energy demands and food availability. However, can internal energy storage influence the type of memory that is formed? We show that the duration of starvation determines whether Drosophila melanogaster forms appetitive short-term or longer-lasting intermediate memories. The internal glycogen storage in the muscles and adipose tissue influences how intensely sucrose-associated information is stored. Insulin-like signaling in octopaminergic reward neurons integrates internal energy storage into memory formation. Octopamine, in turn, suppresses the formation of long-term memory. Octopamine is not required for short-term memory because octopamine-deficient mutants can form appetitive short-term memory for sucrose and to other nutrients depending on the internal energy status. The reduced positive reinforcing effect of sucrose at high internal glycogen levels, combined with the increased stability of food-related memories due to prolonged periods of starvation, could lead to increased food intake.


