
Abstract
In this demonstrator we introduce DataGraft – a platform for Open Data management. DataGraft provides data transformation, publishing and hosting capabilities that aim to simplify the data publishing lifecycle for data workers (i.e., Open Data publishers, Linked Data developers, data scientists). This demonstrator highlights the key features of DataGraft by exemplifying a data transformation and publishing use case with property-related data.
You have full access to this open access chapter, Download conference paper PDF
Keywords
- Data Transformation
- Open Data Management
- Publishing Property Data
- Database As A Service (DBaaS)
- OpenRefine
These keywords were added by machine and not by the authors. This process is experimental and the keywords may be updated as the learning algorithm improves.
1 Introduction
In the recent years, various government organisations around the world have committed to making data accessible under open licenses and, in most cases, in reusable formats. Unfortunately, due to the high cost and domain-specific expertise required for publishing and maintaining Open Data, this approach is still not adopted by the majority of government institutions.
DataGraft started with the goal to alleviate some of these obstacles by providing new tools for faster and lower-cost publication of Open Data. The lifecycle for the creation and provisioning of (Linked) Open Data typically involves raw data cleaning, transformation, and preparation (most often from tabular formats), mapping to standard linked data vocabularies and generating a semantic RDF graph. The resulting semantic graph is then stored in a triple store, where applications can easily access and query the data. Conceptually, this process is rather straightforward; however, such an integrated workflow is not commonly implemented. Instead, publishing and consuming (Linked) Open Data remains a tedious task due to a variety of reasons:
-
1.
The technical complexity of preparing Open Data for publication is high – toolkits are poorly integrated and require expert knowledge, particularly for publishing of linked data;
-
2.
There is considerable cost for publishing data and providing reliable access to it. In the absence of clear monetisation channels and cost recovery incentives, the relative investment costs can easily become excessively high for many organisations;
-
3.
The poorly maintained and fragmented supply of Open Data reduces the reuse of data: datasets are often provided through disconnected outlets; sequential releases of the same dataset are often inconsistently formatted and structured.
What is needed is an integrated platform for effective and efficient data publication and reuse. At the very core, this means automating the Open Data publication process to a significant extent – in order to increase the speed and lower its cost.
2 The DataGraft Platform
DataGraftFootnote 1 was developed as a platform for data workers to manage their data in a simple, effective, and efficient way, supporting the data publication and access process discussed in Sect. 1. Its key features and benefits are:
-
Interactive design of data transformations: transformations that provide instant feedback to publishers on how data changes speed-up the transformation process and improve the quality of the outcome;
-
Repeatable data transformations: data transformation/publication processes often need to be repeatedly executed as new data arrives (e.g., publishing monthly budget reports). Executable and repeatable transformations are a key requirement for a lower-cost data publication process;
-
Shareable and reusable data transformations: Capabilities to share, reuse and extend existing data transformations created by other developers further improves the speed and lowers the cost of the data publication;
-
Reliable data access: provisioning data reliably is another key aspect for the third party data services and applications utilising Open Data.
The key enablers of DataGraft are shown in Fig. 1. Grafterizer is a front-end framework for data cleaning and transformation. It builds on GrafterFootnote 2, which is a framework of reusable components designed to support complex and reliable data transformations. Grafter provides a domain-specific language (DSL), which allows the specification of data transformations.
Another key enabler is the semantic graph database-as-a-service (DBaaS) triple store [1], which is used for accessing the Linked Data on the platform. With this DBaaS solution, publishers do not have to deal with typical administrative tasks such as installation, upgrades, provisioning and deployment, back-ups, etc. The utilization of cloud resources by the DBaaS depends on the utilisation of the DataGraft platform, and resources are elastically provisioned or released to match the current usage levels.
Finally, the portal integrates the previously discussed components together in a web-based interface designed to ensure a natural flow of the supported data processing and publication workflow. The entire process of publishing data is reduced to a simple wizard-like interface, where publishers can simply drop their data and enter some basic metadata. The portal also provides a module that helps visualize data from the semantic graph database (triple store). Currently, the platform provides a number of visualization widgets, including tables, line charts, bar charts, pie charts, scatter charts, bubble charts and maps (using the Google Maps widget).
The key capabilities of DataGraft are also accessible via RESTful services, so that they can be easily incorporated into 3rd party applications and data publishing workflows.

DataGraft key enablers
Related Work. In the current state-of-the art there are several software tool ecosystem solutions that provide support for publication of Linked Data (data extraction, RDF-isation, storage, querying). Examples of such are the Linked Data Stack Footnote 3 and the LinDA project Footnote 4. Whereas they may come functionally close to the features supported by DataGraft, neither solution is provided “as-a-service”, thus leaving the burden of deploying the services and managing the infrastructure around the toolsets.
The COMSODE project Footnote 5 provides a set of software tools and methodology for Open Data processing and publishing. The COMSODE tools are focused on specifying, monitoring and debugging data workflows on Linked Data. Data workflow specification addresses an aspect that is orthogonal to DataGraft’s transformation approach, which is focused on lower level operations such as cleaning and RDF-isation of the actual data. Additionally, similar to LinDA and the Linked Data Stack, COMSODE tools are not provided as-a-service.
OpenRefine Footnote 6, with its RDF plugin implements an approach with similar capabilities to DataGraft when it comes to data cleaning, transformation, and RDF-isation. However, OpenRefine is unsuitable for use in a service offering context, such as the one DataGraft was built for. Additionally, the processing engine itself is not suitable for robust ETL processes, as it is inefficient with larger data volumes – it implements a multi-pass approach to individual operations, and is thus memory-intensive. Nevertheless, OpenRefine currently provides some powerful RDF mapping features.
3 Demo Scenario: Transforming and Publishing Data
The demonstration scenario highlights the capabilities of the DataGraft platform by transforming and publishing property data that will be used by the State of Estate (SoE) service – a registration and reporting portal for state-owned properties in Norway. The application will use different types of property-related datasets for overall data integration with the support of DataGraft. The demonstration scenario is summarised in Fig. 2.

Demo scenario
The usage scenario will demonstrate the following core aspects of DataGraft:
-
1.
Interactive specification of tabular data transformations and mapping of tabular data to graph data (RDF);
-
2.
Publication of data transformations on the DataGraft asset catalogue;
-
3.
Execution and storage of transformed data on the semantic graph DBaaS;
-
4.
Sharing, reusing and extending user-generated content;
-
5.
Querying data from the live endpoint and visualising query results (Fig. 3).
Fig. 3. 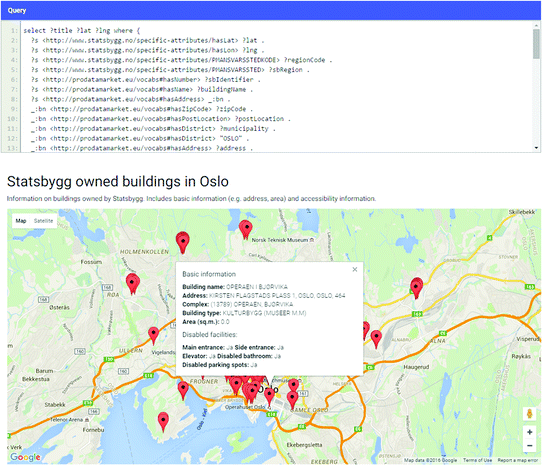
Data query and visualization in DataGraft

A visitor of the demonstration will learn how to:
-
Use DataGraft to simplify the tasks of data transformation and data publishing;
-
Create data transformations with minimal effort through DataGraft’s portal/GUI (for tabular data cleaning/transformation and mapping to graph data);
-
Share and reuse data transformations already published in DataGraft;
-
Run data transformations and host/publish the resulting data on DataGraft’s reliable, cloud-based semantic graph database;
-
Query data hosted/published on DataGraft;
-
Work with the transformations and data catalogues in DataGraft;
-
Use DataGraft for real life applications (publishing property data).
DataGraft is available via http://datagraft.net/ and further details can be found in [2].
References
Dimitrov, M., Simov, A., Petkov, Y.: Low-cost open data as-a-service in the cloud. In: Proceedings of the 2nd Semantic Web Developers Workshop (SemDev 2015), Part of ESWC 2015, 31 May 2015, Portoroz, Slovenia (2015)
Roman, D., Nikolov, N., Putlier, A., Sukhobok, D., Elvesæter, B., Berre, A., Ye, X., Dimitrov, M., Simov, A., Zarev, M., Moynihan, R., Roberts, B., Berlocher, I., Kim, S., Lee, T., Smith, A., Heath, T.: DataGraft: One-Stop-Shop for Open Data Management. Semant. Web J. (SWJ) (2016, to appear). http://www.semantic-web-journal.net/system/files/swj1428.pdf
Acknowledgements
This work was partly funded by the European Commission within the following research projects: DaPaaS (FP7 610988), SmartOpenData (FP7 603824), InfraRisk (FP7 603960), and proDataMarket (H2020 644497).
Author information
Authors and Affiliations
Corresponding author
Editor information
Editors and Affiliations
Rights and permissions
Copyright information
© 2016 Springer International Publishing AG
About this paper
Cite this paper
Roman, D. et al. (2016). DataGraft: Simplifying Open Data Publishing. In: Sack, H., Rizzo, G., Steinmetz, N., Mladenić, D., Auer, S., Lange, C. (eds) The Semantic Web. ESWC 2016. Lecture Notes in Computer Science(), vol 9989. Springer, Cham. https://doi.org/10.1007/978-3-319-47602-5_21
Download citation
DOI: https://doi.org/10.1007/978-3-319-47602-5_21
Published:
Publisher Name: Springer, Cham
Print ISBN: 978-3-319-47601-8
Online ISBN: 978-3-319-47602-5
eBook Packages: Computer ScienceComputer Science (R0)