
Abstract
It is not uncommon for researchers to want to interrogate paired binomial data. For example, researchers may want to compare an organism’s response (positive or negative) to two different stimuli. If they apply both stimuli to a sample of individuals, it would be natural to present the data in a 2 × 2 table. There would be two cells with concordant results (the frequency of individuals which responded positively or negatively to both stimuli) and two cells with discordant results (the frequency of individuals who responded positively to one stimulus, but negatively to the other). The key issue is whether the totals in the two discordant cells are sufficiently different to suggest that the stimuli trigger different reactions. In terms of the null hypothesis testing paradigm, this would translate as a P value which is the probability of seeing the observed difference in these two values or a more extreme difference if the two stimuli produced an identical reaction. The statistical test designed to provide this P value is the McNemar test. Here, we seek to promote greater and better use of the McNemar test. To achieve this, we fully describe a range of circumstances within biological research where it can be effectively applied, describe the different variants of the test that exist, explain how these variants can be accessed in R, and offer guidance on which of these variants to adopt. To support our arguments, we highlight key recent methodological advances and compare these with a novel survey of current usage of the test.
Significance statement
When analysing paired binomial data, researchers appear to reflexively apply a chi-squared test, with the McNemar test being largely overlooked, despite it often being more appropriate. As these tests evaluate a different null hypothesis, selecting the appropriate test is essential for effective analysis. When using the McNemar test, there are four methods that can be applied. Recent advice has outlined clear guidelines on which method should be used. By conducting a survey, we provide support for these guidelines, but identify that the method chosen in publications is rarely specified or the most appropriate. Our study provides clear guidance on which method researchers should select and highlights examples of when this test should be used and how it can be implemented easily to improve future research.
Introduction
What hypothesis does the McNemar test evaluate?
When analysing paired binomial data using a 2 × 2 contingency table, either the McNemar test or the chi-squared test could be applied. Although application of the latter is more common, the McNemar test is frequently more appropriate. The null hypothesis of the chi-squared test is that the two categorical variables being tested are independent. In contrast, the null hypothesis of the McNemar test is ‘marginal homogeneity’ in that the row and column marginal frequencies are equal. As these hypotheses test different questions, selecting the appropriate test is paramount for accurate analysis.
Consider an example where a number of chimpanzees are tested to see whether they can extract food from two puzzle boxes A and B (Example dataset: Table 1).
We could apply a chi-squared test (or equivalent G-test or Fisher’s Exact Test) to see if there is an interaction between the two variables to test whether success or failure on one puzzle box is associated with success or failure on the other. In other words, whether knowing the outcome of a chimpanzee’s attempt at one puzzle box should affect our expectation of the outcome of their attempt at the other.
Alternatively, the McNemar test could be used in order to investigate a different research question: whether failure is more likely with one puzzle box than the other. That is, it asks whether the fact that 24 succeeded in opening puzzle box A but failed on puzzle box B and only 12 succeeded on B but failed on A should lead us to conclude that B is harder to open. Notice that the 32 chimpanzees who either succeeded on both or failed on both are irrelevant for this test, since they offer no information on the relative difficulty of the puzzles. However, it is worth noting that the relevance of the concordant pairs is largely model dependent. The assumption above is made in the derivation of the McNemar test which can be derived from a simple conditional logistic regression which has a fixed subject-specific intercept. However, the number of concordant pairs may affect the testing result when using models which have a random intercept (see later discussion on GLMMs). For example, regardless of whether chimpanzees find one box is harder to open, the fraction of pairs which are concordant and discordant are roughly equal, suggesting that the puzzles required to open each box are of similar difficulty. In this case, the number of concordant pairs does provide relevant information.
A follow-up investigation could be conducted in which the sex of the chimpanzees is recorded alongside their ability to open box B (Example dataset: Table 2).
Similar to the first experiment, a chi-squared test can be applied in order to identify whether sex is associated with the success of opening the puzzle box. That is, we test the null hypothesis that knowing an individual’s sex offers no added information for predicting whether or not they are likely to open the box.
However, unlike the previous dataset, the McNemar test should not be applied as the null hypothesis tested in this example would be that the number of females who fail is the same as the number of males who succeed, since the two variables (sex and success in opening box B) are not analogous to each other.
These examples highlight the circumstances where the McNemar test might usefully be applied in behavioural ecology research. Common uses also include the need to compare the effects of an intervention, when monitoring a captive organism’s response to an enclosure redesign. For example, when investigating an individual’s reproductive rate (‘low’ or ‘high’) prior to and after an enclosure redesign, a chi-squared test could be used to see whether knowledge of whether an organism’s reproductive rate was high prior to the intervention improves your ability to guess whether it will be high afterwards. In contrast, the McNemar test explores whether the intervention seems to affect the rate of reproduction as it identifies whether the number who switched in one direction (high to low) is significantly different to those that switched in the other direction (low to high).
Another way that McNemar test might be used in behavioural ecology research is in a paired study. Imagine that our unit of measurement is a bush in which we place two baited artificial birds’ nests. One of these nests is selected by the toss of a coin to have a putatively camouflaging treatment added to its exterior. We then record whether each nest was predated or not over a set period of time (Example dataset: Table 3).
Applying a chi-squared test to this data tests to see if knowledge of whether one nest in the pair was predated helps you predict whether the other nest will be predated. This then is a test of whether predators generally find both nests in a bush or not, or whether bushes vary in their inherent vulnerability to predators.
The McNemar test investigates whether the putatively camouflaging treatment is effective in influencing predation risk. It asks whether the likelihood of the camouflaged nest being predated when the control one in the same bush was not is different from the likelihood that the control is predated but the camouflaged nest in the same pair is not.
In general, the McNemar test can be applied to a 2 × 2 table if the cells on one diagonal can be unambiguously considered as two concordant outcomes and the other two cells considered as discordant outcomes. We can see that in our last example, the discordant cells are where one nest is predated but the other is not; similarly, in our first example, puzzle box A is successfully opened but puzzle box B is not. Whereas, in our sex and puzzle box example, we cannot unambiguously identify the concordant and discordant cells. The McNemar test then asks if the difference between the values of the two discordant cells is significantly high based on the null hypothesis that both types of discord are equally likely.
Are researchers overlooking this test?
It is difficult to provide a systematic evaluation of how often a chi-squared test (or its equivalents) is applied in published studies when a McNemar test might have been more appropriate to the research hypothesis under investigation. However, here, we provide a series of recent illustrative examples where we feel the McNemar test would have been a more suitable analytical method. First, research by Skukan et al. (2020) suggested that participation of a purpose-designed outdoor game increased children’s understanding of biological invasions using seaweeds as a focus. Children took a test to evaluate their knowledge of the core concepts; they then participated in the game and retook the test. The authors were interested in identifying whether, for each question in the text, the number of students who answered the questions correctly was different before or after an outdoor game had been carried out. We feel this is the type of data and research question for which the McNemar test is ideally suited; however, the paper used the chi-squared test. As we emphasise above, these two tests test different hypotheses.
Magris et al. (2020) investigated mating behaviour in spiders using a chi-squared test. The key experiment presented in this paper has a paired design: 24 females interacted sequentially (in random order) with a control male and a male that had been sterilised by receiving a sublethal dose of radiation. In part of the analysis, the two types of males were compared in terms of six aspects of their mating behaviour: shudder number, shudder duration, rock number, gap duration, copulation duration, and whether or not sexual cannibalism by the female occurred. The last of these measures was investigated with a chi-squared test, whereas the other five were evaluated by tests that acknowledge the paired nature of the data (either a paired t-test or Wilcoxon signed-rank test). By selecting the chi-squared test, the authors chose to ignore the paired nature of the data that they considered relevant for the other five measures of mating. As a result, all males were treated as being statistically independent for this one measure. If the authors had instead used a McNemar test, which would have treated the female as the independent unit of measurement, this would have fully accounted for the paired nature of the data that was considered in all other analyses.
Similarly, a recent paper by Haines et al. (2020) used a chi-squared test to identify if women were more likely to be first authors on papers investigating female bird song in comparison with papers investigating bird song in general. In this example, for each female song paper included in the study, a matching general song paper was identified and selected. By using a chi-squared test, the paired nature of the data was ignored, and the assumptions of the statistical test did not match those of the experimental design. Identifying the gender of the first author in a pair of papers produces either two concordant (F-F or M-M) or two discordant (M-F or F-M) possibilities. As the results in this paper provide two clear concordant and discordant results, we feel that the McNemar test would have been a more appropriate test with which to analyse this data.
We have selected examples where, although we think the analyses could be improved with use of the McNemar test, it highly unlikely that this would change the major conclusions of the paper. Therefore, in highlighting these papers, we do not imply any criticism of the authors and reviewers and do not suggest that the published analysis should be corrected nor a caveat applied. However, they do support our contention that the McNemar test being unjustly neglected.
Some authors do, however, use the McNemar test effectively in similar studies. Chen and Pfennig (2020) used an experimental arena with two sound sources mimicking different types of male courtship call and investigated which attracted female toads placed individually in the arena. Each female was tested under two conditions: deep and shallow water. McNemar tests were instrumental in demonstrating that water depth affected female choice in a way that acknowledged the paired nature of the data.
How to carry out McNemar test in R
There are four versions of the McNemar test (classical, continuity corrected, exact, and mid-P) (see Fagerland et al. (2013) for the definitions of these).
The classical and continuity corrected versions of the test are available through the function mcnemar.test in the base package of R (R Core Team 2017). The exact version can be obtained from the function mcnemar.exact in the package exact2x2. The mid-P version is not directly available in any package but can be obtained relatively simply using the recipe below, where b and c are the values in the two discordant cells of the contingency table. The P value is given by:
where b < c. Where binomcdf(x, n, 0.5) is the cumulative probability of getting at least x successes from n binomial trials with probability of success in any trial being 0.5; binompdf(x, n, 0.5) is the probability of observing exactly x successes in n such trials.
In R, this can be obtained from the code below for the example with b = 10 and c = 13:
For the case where b = c, the P value simplifies to:
In Appendix 1, we provide an example of the R implementation of all four McNemar methods.
Given that there are four different methods, which should a researcher use?
Until recently, the common advice (e.g. Agresti 1990) was to apply the McNemar test in its classical (asymptotic) form unless the values in the two discordant cells (call these values b and c with b < c) were small. If these values are small, then the classical version of the test cannot be guaranteed to preserve the type I error rate at close to the nominal (normally 5%) value. Generally, the advice was that if b + c < 25, then an exact version of the test or the continuity correction to the classical test should be applied. However, this advice has recently been challenged on the evidence of extensive simulations (Fagerland et al. 2013, 2014). The conclusions of these studies are threefold:
-
1.
The exact version of the test and other corrections that have been suggested do control the type I error rate below the nominal value, but they actually produce type I error rates that are considerably below the nominal value and thus offer low statistical power to detect real effects that may exist. On this basis, these alternatives cannot be recommended.
-
2.
The classical asymptotic version of the McNemar test does frequently exceed the nominal type I error rate when sample sizes are low, but apparently never by much—never above 5.37% for a nominal 5% level in the extensive simulations of those two studies. On this basis, the classical version could be used routinely, if this slight inflation of the type I error rate is considered when interpreting the results in cases where sample sizes are low.
-
3.
A mid-P version of the test seems to offer the best combination of properties. Its power seems always to be very similar to the classical version, but its control of type I error rate is better. While it has not been demonstrated analytically to preserve the nominal type I error rate in all circumstances, it never exceeded the nominal level in the extensive set of simulations provided in these two papers. On this basis, this version can also be recommended for routine use. Its calculation is relatively simple, as detailed above.
Methods
We surveyed a range of journals in behaviour, ecology, and evolution that allowed electronic searching of the whole text of papers. Journals were included in our survey subjectively on the basis of our interpretation of their subject areas. We found that all journals that we considered for inclusion allowed searching of their text and had relevant papers. Thus, all journals considered in our survey can be found in Table 4 and ESM 1. We searched the full text of papers in target journals for the keyword ‘McNemar’, in order to find instances where the McNemar test was applied. This produced no false positives, that is, this word was always associated with our focal statistical test. We focussed only on the first use of the McNemar test in any paper but excluded articles where the data on which the test was applied was not provided in the paper, supplements, or data repositories. For the 50 papers produced by this method, we identified the sample size and subsequently obtained or inferred the values in the concordant cells (which we label a and d) and the discordant cells (labelled b and c). The P values for each version of the test: exact, classical, corrected or mid-P were then calculated, using the formula and packages described above (R Core Team 2017), in order to identify (1) which version was used by the authors of the original study; (2) if the correct version of the test had been chosen based on the recent research advice (Fagerland et al. 2013, 2014); and (3) how different the P value would be if the authors had used a different version of the test. In the 50 studies analysed, the papers rarely stated which of the four possible variants of the test were used to calculate the P value given. In a small minority of cases, inference could be made on the basis of information provided on statistical packages used, but generally, this was not conclusive. However, we could perform the test by all four methods, and on this basis were unambiguously able to identify the method used in all cases.
Results
We sampled 50 recent papers published between 1990 and 2019 which used the McNemar test (see Table 4 and ESM 1 for full citations of these papers). We found that 17 had used the classical method and 33 the corrected method. None had used the mid-P method recommended by Fagerland et al. (2013, 2014). Earlier consensus advice on the best method to use, the classical method if b + c > 25 or the corrected or exact method otherwise, was not commonly followed either. In only 8 of our 50 papers was b + c > 25, of these, one used the classical version and the other seven the corrected version. Of the remaining 42 papers with small samples, 16 used the classical method and 26 the corrected. Our data, and the observation that the papers in our survey rarely provided readers with information on which of the four methods was actually implemented, suggests that current practice in terms of test version selection and how it is reported is far from optimal.
Discussion
We can use the data in the surveyed papers to explore how much choice of method influences the calculated P value for the datasets typically generated by researchers. Table 4 suggests choice of method can have a strong impact on the P value obtained: in 39 out of the 50 cases, the highest of the 4 alternative P values was more than twice the lowest value. This number remains substantial even when ignoring the 6 out of these 39 cases where all the P values where less than 0.001. In seven of the 50 cases (references 8, 9, 10, 17, 32, 34 and 49 in Table 4), the highest and lowest values straddle the nominal 5% threshold that many still use to allocate statistical significance. The authors of references 8 and 32 did use this 5% threshold, and the inference drawn from the McNemar test would have been different in both papers if they had adopted the mid-P value recommended by Fagerland et al. (2013, 2014), reference 8 changing from significance to not and reference 32 in the opposite direction. Hence, overall, our survey does suggest that, for the types of datasets generated by researchers, selection of the appropriate version of the McNemar test is of practical importance.
When using the McNemar test, it is not the total sample size that determines power, but the total number of discordant pairs. Although there was a range of total sample sizes in our survey of published tests (N = 6 to N = 411), the number of discordant pairs (b + c) was generally low. In 20 out of the 50 data sets studied, the number of discordant pairs was less than 10, 10 of which were less than 5. Our table suggests that, in order to obtain a significant P value, the frequency of discordant pairs should be greater than 4, with a very large effect size required when the frequency is between 4 and 10 (Table 4). As such, although we recommend the mid-P version of the test when sample sizes are small, its power is dependent on discordant pair sample size. We caution against implementation of the test when the number of discordant pairs is lower than ten, to avoid issues of interpretation resulting from low statistical power.
Model fitting within a Generalized Linear Mixed Effects Model (GLMM) framework could be an alternative to the McNemar test (see http://www.metafor-project.org/doku.php/tips:clogit_paired_binary_data for alternative approaches to this in R). Using these approaches, the null hypothesis tested is slightly different from that of the McNemar test. Returning to our hypothetical example outlined in Table 1, the McNemar test generates a P value associated with the null hypothesis that for those chimpanzees than only open one box, that box is just as likely to be one type as the other. The GLMM model generates a P value associated with the null hypothesis that (controlling for between-chimpanzee differences in general box-opening ability) knowledge of the type of box does not improve our ability to predict whether it will be opened or not.
As well as the different null hypotheses, there are other issues that might sway the researcher towards either the McNemar test or a GLMM. Unlike non-model-based analysis, a GLMM accounts for intra-individual correlations via the addition of a random effect (like the inter-chimpanzee differences in general box-opening skills mentioned above). It also provides the effect size, easy computation of the 95% confidence intervals, can be extended to analyse triplet (or even more complex) data easily, and allows for covariate adjustment. However, the mechanics of model fitting may be challenging when sample sizes are low. As such, although the McNemar test is a simple and effective way to address the null hypothesis, when sample sizes are high and covariates need to be considered, a GLMM may sometimes be a more appropriate analytical method.
Lastly, we can use our survey to evaluate the argument of Fagerland et al. (2013, 2014) suggesting that the mid-P variant of the test should be routinely adopted. This recommendation was based on extensive simulations. In Appendix 2, we compare their simulated datasets to the real datasets found in our survey. This allows us to evaluate if the data produced by Fagerland et al. (2013, 2014) is representative of real data that has been analysed using the McNemar test. Our results suggest that there is strong overlap between the two, and thus, it is reasonable to conclude that the recommendations of Fagerland et al. (2013, 2014) have practical relevance to the types of dataset actually generated.
Conclusion
We believe that the McNemar test can be useful in behavioural ecology research and beyond, but current implementation of this test can be improved upon.
First of all, we explain the range of circumstances where the test can be applied, and we hope this helps raise awareness and usage of the test.
When conducting a McNemar test, there are four methods of calculating a P value; something that often appears to be neglected in the literature. Here, we provide clear guidance on how to implement all of these variants easily in R. We also highlight and further support the simple and clear guidance that the mid-P variant of the test can always be used by researchers as their preferred option. Regardless of the method chosen, researchers should clearly specify the method they are using, along with a brief justification for their choice.
Lastly, for researchers interested in offering an effect size as well as (or instead of) a P value, Fagerland et al. (2014) provides clear guidance on this too.
We hope our short article can stimulate both more and better use of the McNemar test.
Data Availability
No data is associated with this submission.
References
Agresti A (1990) Categorical data analysis. John Wiley & Sons, New York, pp 350–354
Chen C, Pfennig KS (2020) Female toads engaging in adaptive hybridization prefer high-quality heterospecifics as mates. Science 367:1377–1379
Fagerland MW, Lydersen S, Laake P (2013) The McNemar test for binary matched-pairs data: mid-p and asymptotic are better than exact conditional. BMC Med Res Methodol 13:91
Fagerland MW, Lydersen S, Laake P (2014) Recommended tests and confidence intervals for paired binomial proportions. Stat Med 33:2850–2875
Haines CD, Rose EM, Odom KJ, Omland KE (2020) The role of diversity in science: a case study of women advancing female birdsong research. Anim Behav 168:19–24
R Core Team (2017) R: a language and environment for statistical computing. R Foundation for Statistical Computing, Vienna https://www.R-project.org/
Skukan R, Borrell YJ, Ordás JMR, Miralles L (2020) Find invasive seaweed: an outdoor game to engage children in science activities that detect marine biological invasion. J Environ Educ (published online. https://doi.org/10.1080/00958964.2019.1688226
Magris M, Wignall AE, Herberstein ME (2020) Courtship and copula duration influence paternity success in a spider. Anim Behav 165:1–9
Acknowledgements
We would like to thank the two reviewers for their helpful comments when revising this document.
Author information
Authors and Affiliations
Contributions
Not applicable.
Corresponding author
Ethics declarations
Conflict of interest
The authors declare that they have no conflict of interest.
Ethics approval
Not Applicable.
Consent to participate
Not Applicable.
Consent for publication
Not Applicable
Code availability
No code is associated with this submission.
Additional information
Communicated by J. Lindström
Publisher’s note
Springer Nature remains neutral with regard to jurisdictional claims in published maps and institutional affiliations.
Electronic supplementary material
List of the 50 papers used in our suit of datasets
ESM 1
(XLSX 16 kb)
Appendices
Appendix 1
By convention, the R code used is printed in the Courier font and includes the ‘>’ produced by the R command window for each input line. To run a line of code, the ‘>’ is not typed in.
This code was used to analyse data obtained from reference 2 in Table 4.
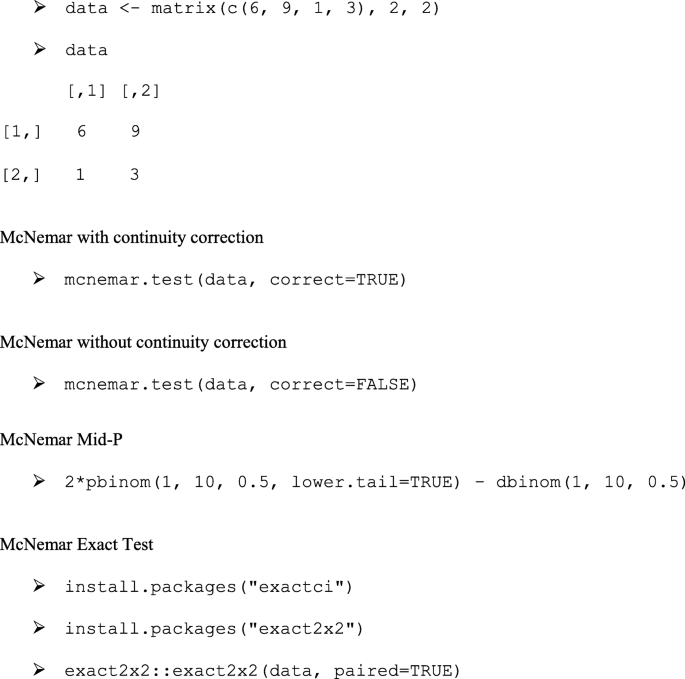
Appendix 2
Comparison of real datasets with the simulations of Fagerland et al. (2013, 2014)
Fagerland et al. (2013, 2014) define a test situation in terms of N matched pairs of two binomial events that might each be a success or failure. They define not just N but the overall probabilities of a success in the two events (denoted P1+ and P + 1) and the overall odds ratio (denoted θ). N and the other three parameters estimated for each of our 50 datasets were obtained from the literature; this is done in Table 5 (although sometimes, the odds ratio is undefined for cases with low sample sizes). In terms of type I error rate, Fagerland et al. (2013) consider N values from 10, 15, … 100; and value of 1, 2, 3, 4…100 in terms of power. In our suite of 50 datasets, one was below this range (N = 6) and five where above it. Many researchers would not have carried out a statistical test with a total sample size of 6 due to concerns about low power. Both power and adherence to the nominal type I error rate improved with sample size. Subsequently, in terms of sample size, the values chosen by Fagerland et al. (2013) are in good accord with our suite of real datasets. They used odds ratios of 1, 2, 3, 5, and 10 for both their power and type I error simulations: only three of estimated odds ratios were greater than 10, and the results in both papers suggest that performance is not strongly affected by the value of odds ratio. For type I error rate, the two probabilities take the same value, and Fagerland et al. (2013, 2014) investigate all values 0, 0.01, 0.02, … 1.0. The rank relative performance of the different methods seems insensitive to the value chosen, and the type I error rate of the preferred mid-P method strayed from the nominal level only when the sample size was low (N < 25), and the probabilities were either less than 0.1 or more than 0.9. In only one of our 50 datasets was the mean of the two estimated probabilities this extreme, and in that case, the sample size was over 100.
Rights and permissions
Open Access This article is licensed under a Creative Commons Attribution 4.0 International License, which permits use, sharing, adaptation, distribution and reproduction in any medium or format, as long as you give appropriate credit to the original author(s) and the source, provide a link to the Creative Commons licence, and indicate if changes were made. The images or other third party material in this article are included in the article's Creative Commons licence, unless indicated otherwise in a credit line to the material. If material is not included in the article's Creative Commons licence and your intended use is not permitted by statutory regulation or exceeds the permitted use, you will need to obtain permission directly from the copyright holder. To view a copy of this licence, visit http://creativecommons.org/licenses/by/4.0/.
About this article

Cite this article
Pembury Smith, M.Q.R., Ruxton, G.D. Effective use of the McNemar test. Behav Ecol Sociobiol 74, 133 (2020). https://doi.org/10.1007/s00265-020-02916-y
Received:
Revised:
Accepted:
Published:
DOI: https://doi.org/10.1007/s00265-020-02916-y