
Abstract
Intelligent separation is a core technology in the transformation, upgradation, and high-quality development of coal. Realising the intelligent recognition and accurate classification of coal flotation froth is a key technology of intelligent separation. At present, the coal flotation process relies on artificial recognition of froth features for adjusting the reagent dosage. However, owing to the low accuracy and subjectivity of artificial recognition, some problems arise, such as reagent wastage and unqualified product quality. Thus, this paper proposes a new froth image classification method based on the maximal-relevance-minimal-redundancy (MR MR)-semi-supervised Gaussian mixture model (SSGMM) hybrid model for recognition of reagent dosage condition in the coal flotation process. First, the features of morphology, colour, and texture are extracted, and the optimal froth image features are screened out using the maximal-relevance-minimal-redundancy (MRMR) feature selection algorithm based on class information. Second, the traditional GMM clusterer is improved, called SSGMM, by introducing a small number of marked samples, the traditional GMM’ problems of unclear training goals, invisible clustering results, and artificially judged clustering results are solved. Then a new hybrid classification model is proposed by combining the MRMR with the modified GMM (SSGMM) which can be named as (MRMR - SSGMM). The optimal froth image features are screened by MRMR to provide the SSGMM classifier. In the process of training and learning the feature samples, using the marked feature samples of froth images to guide the unmarked feature samples. The information of marked feature samples of froth images is mapped to the unmarked feature samples, the classification of the froth images were realised. Finally, the accuracy of the SSGMM classifier is used as the evaluation criterion for the screened features by MRMR. By automatically executing the entire learning process to find the best number of froth image features and the optimal image features, so that the classifier achieves the maximum classification accuracy. Experimental results show that the proposed classification method achieves the best results in accuracy and time, compared with other benchmark classification methods. Application results show that the method can provide reliable guidance for the adjustment of the reagent dosage, realize the accurate and timely control of the reagent dosage, reduce the consumption of the reagent and the incidence of production accidents, and stabilize the product quality in the coal flotation production process.
1 Introduction
Coal, which continues to occupy a dominant position in the energy structure of the present China, is currently facing the challenges of energy transformation and upgradation as well as clean and efficient utilisation. The intelligent separation of coal is the core technology for transforming and upgrading coal, as well as its clean and efficient utilisation, where an intelligent recognition and accurate classification of the froth play key roles in the main flotation link. Coal flotation mainly uses the difference between the surface hydrophilicity and hydrophobicity of coal particles, caused by their interaction with reagents, which results in the separation of clean and tail coal from coal slime in the flotation machine or flotation column [1, 2]. In the flotation process, the reagent dosage is the main factor affecting a stable operation and the quality of clean coal products. However, in most of the Chinese coal preparation plants, the reagent dosage of the flotation process is adjusted by experienced flotation workers through visual observation of features such as morphology, colour, and texture [3]. Owing to the insufficient accuracy of artificial recognition and classification, it is impossible to quantify the reagent dosage control. Moreover, the dosing process incurs subjectivity and extensiveness, which results in poor stability of the flotation condition, low flotation precision, unqualified product-quality indicators, wastage of flotation reagents, high cost of coal preparation, and low economic benefit. These problems have long troubled the flotation production of coal preparation plants. If the image device can be used instead of human eyes to collect the image of coal flotation froth, and the visual features of the froth image can be extracted through image processing and other methods. Based on some mathematical models and algorithms, the distribution characteristics of coal flotation froth image features in various typical dosing conditions are studied, and then real-time recognition of the reagent dosage condition of coal flotation process is carried out, which will be expected to solve the above technical bottlenecks. Current machine vision and machine learning technologies have the advantages of high accuracy, high repeatability, short recognition time, and high objectivity. It is the best scheme for an intelligent recognition and accurate classification of coal flotation froth images, optimal control of the reagent dosage, stable operation of the working condition, and maintenance of product quality [4, 5].
Recently, the visual image features of certain metal and non-metal industry flotation froth have been extensively studied. The morphology, colour, and texture features of froth images are often referred to as the good performance indicators for working condition recognition [6, 7]. Haralick proposed GLCM and defined the texture features of an image [8]. Ren et al. extracted the texture features of a froth surface based on GLCM, to recognise the flotation conditions [9]. Sun and Wee used NGLDM-based second-order statistics to describe the image texture [10]. It has been verified that the fineness and roughness extracted by NGLDM can be appropriately used to represent the appearance information of froth [11, 12]. Peng proposed a working condition recognition method based on an improved NGLDM for the antimony roughing process [13]. Xu et al. proposed a complex network-based texture extraction and classification method for mineral flotation froth images [14]. Liu studied the relations among morphology, texture, and froth classification, and proposed a statistical pattern recognition method for determining the health status of reagent operations in the flotation process based on adaptive learning of froth size dynamic distribution features, as well as a comprehensive classification and recognition method for the flotation production conditions based on multi-scale and multi-direction texture representation of the froth images [15]. Cheng took the extracted colour and texture features of a froth image as input and constructed a condition recognition model for realising the classification and recognition of the froth images in the selection process [16]. Liu used colour features of a flotation froth image to recognise the flotation production conditions [17].
Various researches have extracted more and more features from froth images for working condition recognition. However, the above mentioned recognition methods selected only one or two types of froth image features for working condition recognition or improving the original extraction method. No study has yet explained why a certain feature is selected and whether this feature has a useful contribution to froth image classification. Moreover, only a little feature information is available, which may lead to inaccurate recognition results. No attempt has been made to apply all these extracted features to recognise production conditions. However, too many features may contain some redundant or irrelevant features, which may increase the difficulty of model training and reduce the recognition performance. Therefore, it is very necessary to filter features and eliminate irrelevant and redundant features. Feature selection can solve this problem well. The aim is to find the feature subset that has the greatest relevance and the least redundancy with the class information from the original feature set, and can provide the greatest contribution to the subsequent classification model.
Froth image classification and working condition recognition have always been the hotspots of continuous exploration and research by experts and scholars. In the early stage, Xu took the texture features as input and used linear discriminant analysis (LDA) classifier to recognise production condition [14]. Zhao took the extracted scale texture features as input and used k-means (KM) clustering algorithm to cluster froth images offline under different working conditions [18]. Peng took the froth image texture features as input, and used the support vector machine (SVM) classifier to recognise the working condition of the antimony rough selection process [13]. Wang took the BoW description of the image as input, and used Bayesian probability model (BMP) classifier to classify froth images [19]. However, the LDA classifier is limited by the types of sample. SVM classifier has difficulty in solving multi-classification problems and is sensitive to the choice of parameters and kernel functions. The BMP classifier may fail to predict the feature variables in the test set that have not appeared in the training set, if there is a probability dependency relationship between the variables, the performance of the classifier will be reduced. The KM clusterer limits the types of data and its clustering effect depends on the initialization of the cluster centers. The LDA, BPM and SVM classification methods mentioned above are all supervised learning algorithms. They need to mark training samples, especially when there are many samples, the cost of manual class marking is too high. KM clustering is an unsupervised learning algorithm, because there are no marked froth image samples, its training target is not clear and the results of froth image clustering are judged based on the distribution of test samples in the feature space so that the accuracy is poor.
In recent years, with the development of computer technology, convolution neural network has been used more and more in image recognition, and has also been involved in recognition of flotation froth images. Zarie used convolutional neural networks to classify the froth images of coal flotation under various working conditions [20]. Wang used convolutional neural networks to extract the pixel set features of the froth image and fuse it with the morphological features of the froth image to realize the clustering of the froth image [21]. Fu used three pre-trained convolutional neural networks (namely AlexNet, VGG16 and ResNet) to estimate the froth level from a large amount of industrial image data, of which the advantage of AlexNet is more obvious [22]. Flotation froth images are different from natural scenery pictures. Froth is formed by countless bubbles surrounded by mineral particles, meaning there is no prominent background or attractive subject in froth images. And the difference between the froth images is not very obvious. Convolutional neural network has certain limitations in the application of flotation froth image classification, and it requires parameter adjustment, large samples, long training time, and complex implementation.
The above works have adopted supervised and unsupervised machine learning and deep learning methods to carry out related research on the classification and recognition of froth images, but there are few reports on the research work of semi-supervised machine learning in classification and recognition of froth images. In the process of coal flotation production, there are many types of froth, each of which exhibits multiple features simultaneously. In terms of one of its features, when there are a sufficient number of froth samples within a time period, there is a Gaussian distribution trend. GMM is very suitable for this nonlinear, high-dimensional pattern recognition. However, the traditional Gauss mixture model (GMM) belongs to the unsupervised machine learning. It has the disadvantages of clustering results which are not visible and needs human judgment to implement classification. In order to solve the shortcoming of the Gauss mixture model, this paper improves on its basis and proposes a semi-supervised Gauss mixture model (SSGMM) froth image classification method.
In addition, due to the complexity of froth image feature data, the low accuracy of froth recognition and classification, and the difficulty of precise control of reagent dosage, an accurate and applicable classification and recognition model is still a very important research topic for flotation production system. This requires not only to obtain better feature data in many complex and diverse froth image feature data, but also to establish an accurate froth image classification model. This prompts us to propose a combined classification model to achieve high accuracy classification of froth images. In this paper, we aim to design a hybrid classification model for coal flotation froth images. The novelty and contribution of the proposal are summarized as follows:
-
1.
The multi-dimensional froth image features including morphology, color and texture are extracted, and the optimal froth image features are screened out using the maximal-relevance-minimal-redundancy (MRMR) feature selection algorithm based on class information.
-
2.
An improved GMM (SSGMM) is proposed. By introducing a small number of marked samples, the problems of unclear training goals, invisible clustering results, artificially judged clustering results based on the distribution of test samples in the feature space, and low clustering accuracy in traditional GMM are solved.
-
3.
A new hybrid classification model is proposed by combining the MRMR with the modified GMM (SSGMM) which can be named as (MRMR - SSGMM). The optimal froth image features that contribute the highest to SSGMM classifier are screened out using MRMR, and the SSGMM classifier is used as the evaluation criterion for the pros and cons of screening features with MRMR. Through repeated iterations to find the best number of froth image features and the optimal froth image features, so that the classifier achieves the maximum classifier accuracy.
-
4.
Compared with other classification methods, the proposed hybrid model has more advantages in classification accuracy, precision and time.
-
5.
Applying the proposed MRMR-SSGMM method to the flotation production process of a coal preparation plant can improve the accuracy of froth classification and recognition, realize accurate and timely control of reagent dosage, stabilize product quality, reduce reagent consumption, and promote the intelligent development of coal flotation to a higher level.
The remainder of this paper is organised as follows. Section 2 introduces the flotation froth recognition system based on machine vision. Section 3 introduces the related work. Section 4 presents the proposed hybrid classification method (MRMR-SSGMM). Section 5 arranges the experiments, conducts a contrast analysis, and discusses its results. Section 6 concludes the paper. Abbreviations and full names of the words are listed in Table 1.
2 Flotation froth recognition system based on machine vision
2.1 System architecture introduction
Figure 1 shows the process flow of coal flotation and the architecture of proposed froth image recognition system. The production equipment of the flotation system is a mechanical stirring self-suction-type flotation machine with model XJX-20, where the four rooms are connected, the coal slurry and reagent are pumped into the slurry pre-processor and completely mixed, and then, the mixture is flown into the flotation machine from the first chamber inlet. Utilising the negative-pressure self-absorbed gas generated by the rotating impeller of each chamber and the reagent to form bubbles to contact the coal particles, the clean coal floats up and is scraped to the clean flotation coal tank by scrapers, while the tail coal flows out from the tail part of the fourth chamber.

Froth image recognition system for coal flotation. (The left picture shows the process flow of coal flotation process. The right picture shows is the actual installation diagram of the image system)
In conventional froth flotation, experienced workers usually manually adjust the reagent dosage by observing the state variables of the froth (froth color, texture, morphology, etc.) with the naked eye until the expected value is reached. Obviously, accurate recognition of the current reagent dosage conditions is essential for real-time adjustment of coal flotation process. However, due to the low accuracy of manual recognition and some subjective human factors, it is considered to replace experienced workers with image device. The image acquisition device is installed between the second and third chambers, where the froth exhibits clearly suitable features that can be used for recognition and is the most representative. Different types of froth images reflect different reagent dosage conditions, the images are processed by pre-processing, feature extraction, feature selection, and semi-supervised learning, so that the current reagent dosage condition can be automatically recognised, and then decisions can be made to control or optimize the flotation process and guide production.
2.2 Analysis of froth image features and flotation reagent dosage condition
At present, the main coal flotation reagents used in most coal preparation plants are collectors and frothers. The biggest effect of a collector is to change the surface wettability of coal particles, followed by its hydrophilicity and hydrophobicity, to increase the difference in the surface properties of coal particles so that the bubbles carrying the clean coal particles have floatability, thereby achieving the purpose of separation. A frother can reduce the surface tension of the coal slurry solution and make the gas entering the coal slurry easily diffuse into the solution; thus, the air and coal slurry merge to form bubbles, enhance their stability, and provide enough bubbles for the flotation process, to ensure the adsorption of clean coal particles.
During the flotation process, froth acts as a ’consignment’ of clean coal. The froth features, such as morphology, colour, and texture, are closely related to the adsorption efficiency of clean coal, and are mainly affected by the reagent dosage. When the amounts of collector and frother are appropriate, a type a froth is formed, as shown in Fig. 2a. In this case, the bubble sizes are uniform, the colours are grey, and the textures are more complicated; moreover, the flotation process is good, the froth surface carries more clean coal particles, and the ash content of clean coal is moderate. When the amount of collector is excessive, a type b froth is formed, as shown in Fig. 2b, where the froth layer is dense, the bubbles are mostly oblong and black, the textures are very complicated, and the ash content of clean coal is higher. This is because the surface properties of the coal particles have been changed, causing many clean coal particles to be adhered to the bubbles. Simultaneously, considerable slime floats up, and the sludge and collapse phenomena occur. When the amount of collector is small, a type c froth is formed, as shown in Fig. 2c, where the froth surface becomes smoother, with larger bubble morphologies, lighter greys, and less complex textures; moreover, the ash content of clean coal is lower. This is mainly because most of the floating coal particles are fine-grained, while most coarse-grained coal particles are lost. When there is an excessive amount of frother, a type d froth is formed, as shown in Fig. 2d, where the froth layer is thick, numerous froths overlap like a honeycomb, the bubbles formed are small and mostly broken, the morphologies are irregular and have many connected organisms, the edges between the bubbles are not obvious, the colours are black, the textures are very complicated, the bubbles are highly stable, the overflow speed is slow, and the ash content of clean coal ash is very high. This is mainly because of several bubbles being generated by the excessive frother, which causes several coal particles, and even some gangues, to be floating. When the amount of frother is small, a type e froth is formed, as shown in Fig. 2e, where the froth layer becomes thinner; the bubble sizes are different; the colours are lighter grey; the textures are less complex; the bubbles have thin walls, and thus, they can easily burst or merge; the bubbles are unstable; and the ash content of clean coal is very low. This is mainly due to the lack of sufficient froth to float on the clean coal owing to the small amount of frother, which causes some clean coal particles originally attached to the bubbles fall back into the coal slurry.

Images of coal flotation froth under different reagent dosage ratio
Among the above five types of froths, only under the froth production condition shown in Fig. 2a, the produced clean coal is a qualified product and the ash content meets the production requirements of the coal preparation plant. All other types, b–e (Fig. 2), are substandard products, and such situations in the production process are all production accidents. If these production conditions are not detected in time or even under a long-term production of these bubbles under these conditions, the ash content of the entire batch of clean coal will be affected, which is an extremely serious problem. Thus, type a froth is a clean coal product froth pursued under the optimal reagent dosage ratio. There is a certain relation among the features of froth morphology, colour, texture and reagent dosage; therefore, these features can be used to guide the reagent dosage of the flotation process to ensure high quality of clean coal products.
3 Related work
This section introduces the related algorithms on which our proposed method is based. These algorithms include the maximal-relevance-minimal-redundancy feature selection algorithm and the Gaussian mixture model clustering algorithm.
3.1 Maximal-relevance-minimal-redundancy (MRMR)
In the sample classification, using a large number of features to design the classifier is too expensive and the classification performance is poor. Feature selection aims to convert samples in high-dimensional space to low-dimensional space through mapping or transformation to achieve dimensionality reduction, and then the minimum feature subset is obtained by deleting redundant and irrelevant features, which does not significantly reduce the classification accuracy and does not affect the class distribution, and provides the maximum contribution rate to the next classification model. For example, Zhang et al. developed a systematic feature extraction and selection framework for whole-building automated fault detection and diagnostics. The features are aggressively extracted from raw sensor data and the best feature set is select by hybrid feature selection algorithm that combines the filter and wrapper method [23]. Syed computes the most relevant feature subset of heart disease data by taking advantage of feature selection and extraction techniques, and classifies them based on the radial basis function kernel-based support vector machines. An automatic diagnosis method for clinical heart disease is proposed [24]. Priyanka used the GLCM method to extract 44 texture features of kidney ultrasound images, and the obtained features are reduced to optimal subset using principal component analysis. These features are helpful for further neural network classification of different types of kidney ultrasound images [25]. In the research work of shape recognition, Wang designed to extract features in different ways and adopt the wrapper-based feature selection driven by different learning algorithms for obtaining diverse subsets of fused features [26].
In the process of coal flotation, the froth image has multiple features (Morphology, texture, color, etc.) as described in Section 2.2. These reflect the image information of froth from different angles, however, it is not enough to use only one of the features as the feature quantity for recognition, which may lead to inaccurate classification, and thus we attempt at determining multiple froth image features for classification. However, too many features excessively increase the dimensions of the classification model, which affects the calculation time and efficiency. Especially, the introduction of some unrelated or redundant features may affect the classification of other features, reduce the classification ability of the learning algorithm, and affect the accuracy of the classification model. Therefore, it is necessary to filter the features and eliminate the unrelated and redundant ones. Let us consider a comprehensive feature set containing morphology, colour, and texture of a froth image, \(X_{h \times t}=\left \{X_{1}, X_{2}, {\cdots } X_{t}\right \}\). Our task is to screen out m froth image features that are strongly correlated with the froth class and weakly correlated with each other from these t features, which are usually measured by mutual information [27]. Mutual information can be regarded as the amount of information present in one random variable containing another random variable, which is a measure of the statistical relevance of two random variables and measures the degree of mutual constraint between them. Given two continuous random variables x and y , their probability density and joint probability density are determined as p(x) and p(y) and p(x,y), respectively. Then, the formula for the mutual information F between two continuous variables can be expressed as:
Feature selection aims to find a feature subset S with m features, \(\left \{X_{f}\right \}\), from a comprehensive feature set of the froth image, which has the largest dependency on the target class Cl. The maximum relevance is obtained by calculating the mean value of the mutual information of the single froth image feature Xf and class Cl; that is,
The froth image features selected by the maximum relevance may be redundant, and the relevance between them may be very large. When the two features are redundant and one of them is removed, the classification result does not change much. Therefore, the minimum redundancy criterion can be used to eliminate the redundant froth image features. This is expressed as
A combination of the maximum relevance R1 and minimum redundancy R2 is called the ’maximum-relevance-minimum-redundancy criterion’. It is defined by the operator \({\varPhi }\left (R_{1}, R_{2}\right )\) and optimised in the form of MIR.
In practice, we use the incremental search method to determine the optimal froth image features. Assuming that there is already a subset of froth image feature Sm− 1, the next step is to find the mth feature in the remaining froth image feature set X − Sm− 1 and select the feature that maximises Φ(⋅), that is, the mth optimal froth image feature. The specific incremental search algorithm can be expressed as
3.2 Gaussian Mixture Model (GMM)
Clustering is an important unsupervised machine learning technology, which divides a data set into different classes or clusters according to a certain standard (such as distance criterion), that the similarity of data objects in the same cluster is as great as possible, and the differences of data objects not in the same cluster are also as large as possible. Cluster methods mainly include conventional clustering, dynamic clustering, fuzzy clustering and meta-clustering, etc. The most common conventional clustering includes k-means clustering, Gaussian mixture model clustering and so on. The literature [28] proposed a novel technique for unsupervised change detection in multitemporal satellite images using principal component analysis (PCA) and k-means (KM) clustering. The literature [29] adopted an improved clustering method based on k-means (KM) algorithm to perform brain tumor segmentation on MRI images. The literature [30] proposed a target detection method based on HSV fusion Gaussian mixture model. The literature [31] adopted Gaussian mixture model and predict the COVID-19 pandemic. Fuzzy clustering includes fuzzy c-means clustering etc., such as the literature [32] proposed a cloud and cloud shadow detection method based on fuzzy c-means algorithm. The literature [33] presented a wavelet frame-based fuzzy c-means (FCM) algorithm for segmenting images on graphs. Dynamic clustering method such as two dynamic clustering approaches, Maria proposes a dynamic clustering based driving styles identification and profiling approach to identify which driving style transitions are more likely to happen given different surrounding environments [34]. To mitigate the adverse economic impact of COVID-19 flare-up, Md proposes a data-driven dynamic clustering framework through an intelligent fusion of healthcare and simulated mobility data [35]. A concept of meta-clustering was described in literature [36] this paper presented a recursive clustering technique for such networked environments, that is, granular meta-clustering based on hierarchical, network, and temporal connections.
The GMM is very suitable for non-linear, high-dimensional pattern recognition. It is much more flexible than k-means in terms of clustering covariance. According to the standard deviation parameter, the cluster can adopt any ellipse shape, rather than being limited to a circle. Gaussian distribution is a normal distribution from the statistical viewpoint, and a Gaussian model can well-describe the sample distribution and has been widely used [37]. In the process of coal flotation, various froth image samples exist randomly and independently. When there are enough froth image samples, their distribution tends to be Gaussian, according to the central limit theorem. The histogram in Fig. 3 shows the distribution of the average perimeter of bubbles in a coal flotation froth image over a time period, where the distribution of the bubble number is concentrated within 0–500, interval distribution of 150–300 is dense, and the frequency is large. In other words, the distribution is closely related to Gaussian distribution, and thus, can be fitted with it. The black solid line represents the approximate fitting result, where the fitting curve well-reflects the frequency distribution of the histogram.

Gaussian distribution fitting of number of bubbles
For a certain feature of a certain type of froth image sample, Xf = [x1;x2;⋯;xn], the fitting formula for its 1D Gaussian distribution is expressed as follows:
where μx is the mean value of Xf, σ is its standard deviation, and \(\hat {\mu }_{x}\) and \(\hat {\sigma }\) are the unbiased estimates of μx and σ, respectively.
For k image features of a certain froth type \(X_{n \times k}=\left \{X_{1}, X_{2}, \cdots , X_{k}\right \}\), to describe its distribution, the multi-dimensional Gaussian distribution can be used to fit, and the formula is as follows:
where μX represents the mean value of sample Xn×k, \(\hat {\mu }_{X}\) is an unbiased estimate of μX, k represents the dimension of sample Xn×k, and Σ represents its covariance matrix.
For a froth image feature set that contains multiple froth image sample types, each containing multiple froth image features, to describe the distribution of all its samples, a GMM can be introduced to fit the samples [38], that is, the weighted sum of multiple Gaussian distributions, as follows:
where \(p\left (x_{i}\right )\) is the probability that the feature xi(i = 1,2,⋯ ,q q is the total number of samples of the froth image) belongs to each froth image type, \(N\left (x_{i} \mid \mu _{z}, {\varSigma }_{z}\right )\) is the zth Gaussian distribution, πz indicates the zth (z = 1,2,…,Z, Z is the number of froth types) Gaussian distribution coefficients, μz is the froth image feature samples’ mean of the zth Gaussian distribution, and Σz is the covariance matrix of the zth Gaussian distribution of the froth image feature samples. The estimation of the froth image feature of GMM can be fitted using the maximum likelihood estimation method. Because the continuous multiplication result of joint probability density is very small, logarithms are often taken for a simplified calculation. Therefore, the likelihood function of the GMM of the froth image feature can be expressed as:
The direct calculation of the extreme value of \(L\left (x_{i}\right )\) by using the derivation method is very complex, and thus, it is difficult to obtain a closed solution. Therefore, the EM algorithm can be used for the iteration [39] which is divided into E and M steps. In step E, according to the initial value or clustering centre μ, the covariance matrix Σ, and the weight π of the mixed model of the previous iteration, the posterior probability MAP of each distribution is calculated using the Bayesian formula. The M step determines the new μ, Σ, and π values according to the posterior probability. The specific formulas involved in the algorithm are as follows:
E step:
M step:
The convergence condition of the EM algorithm, that is, the variation in steps z and z + 1 of the above formula, is less than the error value eps, which indicates the end of the iteration.
4 The proposed method MRMR-SSGMM
4.1 Improved GMM (SSGMM)
The traditional GMM has no marked samples, which leads to its unclear training objectives, and the clustering results are not visible. Therefore, it is necessary to judge the clustering results artificially according to the distribution of test samples in the feature space, and the accuracy is poor. In order to solve its drawbacks and improve its accuracy, “cluster-map” semi-supervised GMM classification structure, called SSGMM, is proposed in this paper, which is more suitable for classifying few marked samples and several unmarked samples [40,41,42,43]. Using the froth image features as samples. First, a few known froth image feature samples are marked and mixed with several unmarked froth image feature samples. Various clusters are obtained by clustering the mixed froth image feature samples through the GMM clusterer, and the information of the marked froth image feature samples in various clusters is mapped to that of the unmarked samples, so that the SSGMM classifier is obtained to realize the classification of mixed samples The specific semi-supervised classification model structure is shown in Fig. 4, where D indicates a few marked froth image feature samples, Z indicates the types of marked feature samples, and L indicates several unmarked froth image feature samples.

The structure of improved GMM (SSGMM)
4.2 The proposed MRMR-SSGMM
The performance of a classifier or clusterer is not only related to its own precision, but also closely related to the input samples, so the quality of the input sample is critically important to the classification accuracy of the classifier. In this paper, MRMR is used to filter the optimal froth image feature samples for SSGMM classifier. In turn, the quality and quantity of the samples screened by MRMR can be evaluated using the classification results of the SSGMM classifier. Through the automatic execution of the whole learning process, the optimal input samples and the highest accuracy classifier are obtained. The flow chart in Fig. 5 can be used to summarize the entire process of the proposed MRMR-SSMGG algorithm.

The flow chart of the proposed MRMR-SSMGG algorithm (It mainly includes two parts: feature selection and semi-supervised classification. Through feature selection, the optimal features are selected to the classifier, and the accuracy of the classifier is used to evaluate the selected features. Finally the best number of features and the maximum classification accuracy are obtained)
For a given froth image’s comprehensive feature set \(X_{h \times t}=\left \{X_{1}, X_{2}, \cdots , X_{t}\right \}\), h is the number of froth image samples and t is the number of froth image features. \(C_{l_{h \times 1}}\) is the class set. The specific feature selection algorithm includes the following steps.
-
Step 1: Load feature sample set Xh×t = {X1, X2, ⋯, Xt}, category set \(C_{l_{h \times 1}}\).
-
Step 2: Initialize the parameters of MRMR and SSGMM.
-
Step 3: Set the number of froth image features to be filtered as m.
-
Step 4: Calculate the mutual information of each feature and class from Xh×t and \(C_{l_{h\times 1} }\) according to formula 2, and arrange the mutual information in descending order.
-
Step 5: Extract the feature ranking first in information as the first feature of the candidate subset.
-
Step 6: Suppose Sm− 1 is a selected subset containing “m-1” features. The next purpose is to select the mth feature from the remaining feature set by using the incremental search algorithm in formula 5, and maximise Φ(⋅) in formula 4.
-
Step 7: Extract the features step-by-step using Step 6, continue feature selection until \(\left |S_{m}\right |=m\), and then output the feature set Sm.
-
Step 8: Mark the selected feature set Sm as the features of the known froth image and mix it with the unmarked feature set \(\boldsymbol {X}_{\boldsymbol {q} \boldsymbol {\times m}}=\left \{\boldsymbol {X}_{1}, \boldsymbol {X}_{2}, \cdots , \boldsymbol {X}_{m}\right \}\), namely Rm.
-
Step 9: Set the number of Gaussian distributions, that is, the number of froth image types Z, and set the iteration error value eps.
-
Step 10: Initialize the cluster centers and weights of each Gaussian distribution.
-
Step 11: calculate the maximum posterior probability of Gaussian distribution of each froth image feature using Bayesian formula in the E-step of formula 16, according to the initial value or cluster centre μ, the covariance matrix Σ, and the mixed model weight π in the previous step.
-
Step 12: Determine the new cluster centre μ, covariance matrix Σ, and mixed model weight π by the M step in formulae 19-21 based on the maximum posterior probability.
-
Step 13: Repeat step11 and step12 until convergence, that is, the end of training and learning.
-
Step 14: Stain all froth image samples under a certain class and using different colors as symbols of different classes.
-
Step 15: Map the information of the marked froth image feature samples to that of the unmarked froth image feature samples, and the froth image feature sample classification is completed.
-
Step 16: Calculate the accuracy of MRMR-SSGMM hybrid classifier.
-
Step 17: Repeat Step3-Step16 until the hybrid classifier has the highest accuracy.
5 Experiments and discussion
5.1 Experiment and results
5.1.1 Feature extraction and selection of froth images
First, the images of coal flotation froth are collected, and before extracting their features, they were subjected to a series of pre-processing, including image enhancement, image denoising, binarisation, and morphological processing.
Owing to the different reagent dosages, the amount of clean coal carried by the froth, as well as the size and type of the clean coal particles, differs. These, combined with the principle of the reagent itself, cause the interaction between the bubbles, showing different forms. In the actual flotation process, the froth sizes are different, and the shapes are irregular. To describe the bubble sizes quantitatively, a single bubble is approximated as an ellipse, as shown in Fig. 6, where the length of the long axis is 2m and that of the short axis is 2n. The morphological features of the coal flotation froth image are important in reflecting the flotation index, and the feature quantities include the number of bubbles, N; their area, A; and their circumference, C. In the coal flotation process, the focus is not on the morphology of a single bubble but on that of groups of bubbles with different diameters. This paper uses the average size to describe the area and circumference of a bubble. After the segmentation of the froth images based on the hierarchical watershed algorithm, the number of bubbles can be obtained by marking the disconnected bubble regions in the froth images [44], the bubble area is obtained by statistical calculation of the pixels in the cross-sectional area of the horizontal plane projection, the bubble ridge lines are obtained after image segmentation, and the bubble circumference is obtained by calculating the number of pixels of the bubble ridge line. A and C are given by (1) and (2), respectively.

Bubble size
Owing to the different reagent dosages, the amount of clean coal carried in the froth and the particle size of clean coal are different. Because of the difference in the clean coal content of the froth, the light absorbed and reflected by the froth differs, resulting in different froth colours. According to the structure of the human eye, all colours can be expressed as different combinations of three basic colours. The colour value of each pixel can be represented by a point in 3D space. In this paper, the R, G, and B colour components of the RGB colour space are selected as the colour features of a froth image.
Because of the different reagent dosages, the amount of clean coal carried on the froth surface, the particle size, and the bearing of gangue and slime are different, resulting in different degrees of smoothness or wrinkles on the froth surface, showing different texture features. Thus, the surface smoothness and roughness of the froth can be described by texture features. Texture expresses the grey-level correlation of adjacent pixels, and an effective method for texture feature extraction aims to extract secondary features based on GLCM. Haralick et al. defined 14 feature parameters of GLCM for texture analysis [8]. Ulaby et al. found that only 4 of the 14 GLCM texture feature parameters were unrelated, which were not only easy to calculate but also had high classification accuracy [45]. These parameters included energy E, entropy En, moment of inertia I, and relevance Re. This paper uses these features as the texture features of the froth image. In summary, this paper extracts 10 features—-N, A, C, R, G, B, E, En, I, and Re—-from a flotation froth image.
Five groups of experiments were conducted under the conditions of five collector-to-frother ratios (this frother performs the function of collecting): 1:3, 2:3, 0.5:3, 1:4, and 1:2. Each experiment group was performed 10 times, and one froth image sample was collected each time. Simultaneously, the ash content of clean coal at this time, corresponding to each froth image, was sampled and measured, as shown in Table 2.
We extracted 10 features, N, A, C, R, G, B, E, En, I, and Re, from the 50 froth images collected above, and formed a subset of comprehensive features, including morphology, colour, and texture, as shown in Table 3.
To select the features that contribute most to froth image classification, each feature was evaluated and screened. In this experiment, the ash contents of clean coal were used as class information C50×1 and the extracted 10 froth image features were used as the comprehensive froth image feature set X50×10. Using the MRMR feature selection algorithm mentioned in this section for screening, as well as the results shown in Fig. 7, the relevance and redundancy of these 10 froth image features were in the order C>En> N > R > I > G > B > A > E >Re. From the results, the morphological and texture features are better than the colour features, the morphological features have the greatest relevance with the ash content of the clean coal, followed by the texture features, and then the color features. This may be due to the black characteristic of coal itself, the color difference of various types of froth is not obvious, which is not conducive to the extraction of color features. Secondly, it may also be affected by the light environment

Selection result of froth image features
5.1.2 Analysis and comparison of offline classification results
Taking the 50 coal flotation froth image samples under the known dosing ratio used for feature selection in the previous section as the known samples, and 800 froth image samples under the unknown dosing ratio were collected. The two kinds samples are mixed and preprocessed, and 10 froth image sample features are extracted from them. The features are sequentially input into the SSGMM classifier in the order of selection. As shown in Fig. 8, it is an analysis diagram of the number of froth image features and the accuracy of the classifier. With the increase of the number of features, the accuracy of the classifier becomes higher and higher. When the number of features is 4, the accuracy of the classifier reaches the highest (97.77%). As the number of features continues to increase, the accuracy of the classifier decreases instead. This is because when the number of features is small, the classification accuracy is low due to single information. However, when the number of features is too large, the introduction of some irrelevant or redundant features reduces the accuracy of the classification model. Therefore, the best number of the froth image features finally selected is 4, these features include: C, En, N, R. A classification situation is discussed and analyzed based on these 4 features, the classification results of the feature samples of the mixed froth image by the SSGMM classifier are shown in Fig. 9(1)(2)(3)(4). The feature samples of five types of froth image with known dosage ratios were marked, and those of a–e froth images were marked as \(\blacksquare \), \(\bigstar \), \(\blacktriangle \), \(\blacklozenge \) and ∙, respectively. The feature samples of froth images under unknown dosage ratios were not marked. The mixed feature samples of the froth image were clustered to obtain all types of clusters. Then different clusters are dyed and different colours were used as markers of different class clusters. Finally, the information of the marked feature samples of the froth images in various clusters was mapped to that of the unmarked feature samples. Because a 4D spatial structure is difficult to represent, four 3D graphs (each representing any three features) were used to represent the classification results. The mapping information of the froth image feature samples were marked as \(\blacklozenge \), \(\bigstar \), \(\blacksquare \), \(\blacktriangle \) and ∙ to five clusters of pink, blue, yellow, red, and green, respectively. Then, five types of froth images of a-e were obtained.

The relationship between the number of features and the accuracy of the classifier

Classification results of different froth images by feature selection (The classification results of the 4-dimensional optimal froth image features (C, En, N, R): (1) The three-dimensional spatial structure of N, En, C features; (2) The three-dimensional spatial structure of R, En, C features; (3) The three-dimensional spatial structure of R, N, C features; (4) The three-dimensional spatial structure of R, N, En features. Class a (froth images obtained at a reagent ratio of 1:3); Class b (froth images obtained at a reagent ratio of 2:3); Class c (froth images obtained at a reagent ratio of 0.5:3); Class d (froth images obtained at a reagent ratio of 1:4); Class e (froth images obtained at a reagent ratio of 1:2))
5.2 Discussion and analysis
5.2.1 Validity analysis of MRMR feature selection
To evaluate the classification accuracy of the above selected features of the froth image, it is better applied to the coal flotation production process. We randomly choose any two features from the 10 froth image features for classification and compared the classification of the two cases. Using the E and Re features as input, we performed classification based on the SSGMM introduced in Sections 4.1–4.2. The experimental results are shown in Fig. 10.

Classification results of different froth images without feature selection (classification results of arbitrary froth image features (take E, Re as examples): Class a (froth images obtained at a reagent ratio of 1:3); Class b (froth images obtained at a reagent ratio of 2:3); Class c (froth images obtained at a reagent ratio of 0.5:3); Class d (froth images obtained at a reagent ratio of 1:4); Class e (froth images obtained at a reagent ratio of 1:2))
The data show that by classifying the unselected features, there are more overlapping parts between classes, such as the parts of the graph circle, which lead to some features making it difficult to distinguish the classes. There are misjudgements and a low classification accuracy of \(\sim \)87.6% [9,10,11]. In contrast, the selected multi-feature classification method has much higher classification accuracy, irrespective of whether it is the classification accuracy of different classes or the average accuracy of all classes. In addition, the average accuracy of all classes is 98.4%. This is mainly because the selected optimal features provide a useful contribution rate to the classes. More importantly, the multiple feature classification increases the sample dimension, reduces the interference of some similar feature data in some dimensions, and then substantially increases the classification accuracy. Our proposed method can be effectively used for classification the reagent dosage condition in the production process, and provides more accurate guidance information for a timely adjustment of the operation of the coal flotation process. Table 4 compares the two classification cases.
5.2.2 Performance evaluation of SSGMM
In order to prove the efficiency of the proposed MRMR-SSGMM over other published methods, its performance is compared with other well-known and recently published methods. The methods used in comparison are as follows: Support Vector Machine (SVM), Artificial Neural Network (ANN), Naive Bayes (NB), Latent Dirichlet Allocation (LDA). As shown in Table 5, the data set is divided into training set and test set according to the ratio of 8:2 for the 1120 froth images obtained at the industrial site. The two sets obtained contain 896 and 224 image samples respectively. Using the above methods and the proposed method in this paper for training and testing.
-
(1)
Performance analysis of five methods
Table 5 Image data quantity and distribution
Table 6 shows the classification accuracy of SVM, ANN, NB, LDA and our proposed MRMR-SSGMM method. The overall accuracy and the accuracy of each type of froth image are listed. The accuracy of each type of froth image equals the number of correctly classified images divided by the total number of images of this type.
-
(2)
Confusion matrix of five methods
Table 6 Performance of five methods
Furthermore, the confusion matrix results are illustrated in Figs. 11, 12, 13, 14 and 15. In a confusion matrix, the first column contains the names of the true classes, and the first row corresponds to the names of the predicted classes. The diagonal cells correspond to items that are classified correctly.
-
(3)
Other evaluation indicators
Fig. 11 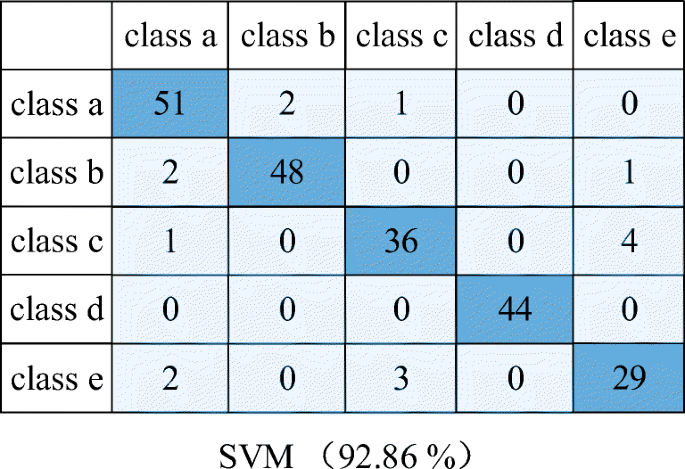
Confusion matrix of SVM
Fig. 12 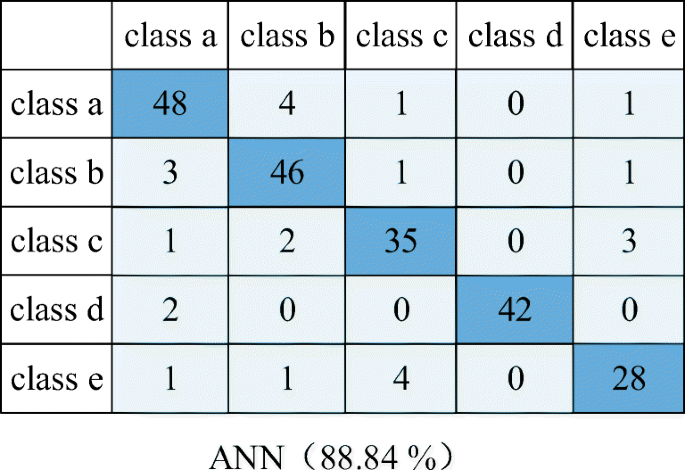
Confusion matrix of ANN
Fig. 13 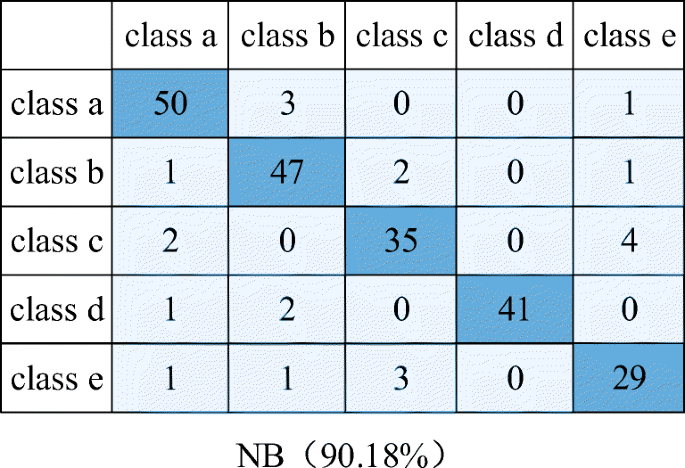
Confusion matrix of NB
Fig. 14 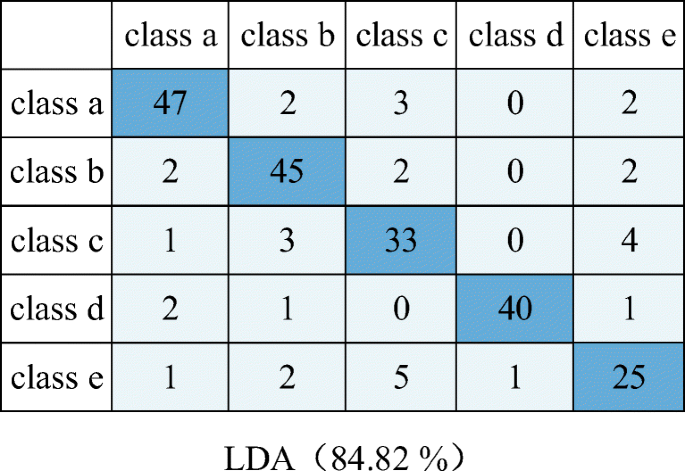
Confusion matrix of LDA
Fig. 15 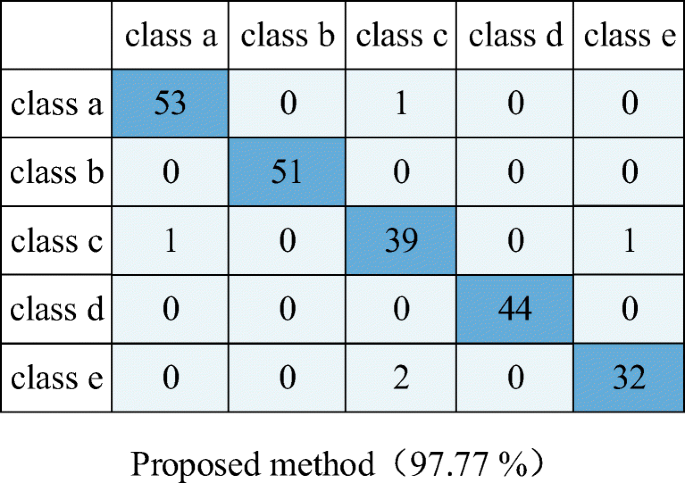
Confusion matrix of Proposed method


We also provide other evaluation indicators for the five methods, such as precision, recall rate and F1-score in Table 7. Among them, the precision is for the prediction result, which means the probability of actual positive samples among all the predicted positive samples. The recall rate is for the original sample, it indicates how many of the actual positive samples are predicted correctly. The F1-score can be regarded as a harmonic mean of the precision and recall of the model. Its maximum value is 1 and its minimum value is 0.
For the two-classification problem, the TP, FN, TN, and FP represent the numbers of true positives, false negatives, true negatives, and false positives, respectively. These indicators reflect the quality of the hybrid classification model and its generalization capabilities. The specific formulas of the three evaluation indicators are as follows:
For multi-classification problems, we can extend the evaluation criterion of two-classification to multi-classification problems. In the k-class classification matrix, there will be k confusion matrices. The precision and recall of each confusion matrix need to be obtained separately, and then calculating their average value. The specific calculation formula is as follows:
It can be seen from the table that our model has achieved the best performance compared with other benchmark networks.
-
(4)
The average computational time of five methods
The average computational time for froth image classification method is also depicted in Fig. 16. The results are 0.4 seconds for SVM, 0.37 seconds for ANN, 0.33 seconds for NB, 0.28 seconds for LDA, and 0.3 seconds for our proposed method. Obviously, our proposed method ranks second in computation speed.

The computation cost of five classification model
5.3 Analysis of application effect
5.3.1 Record of reagent dosage condition recognition
We apply our proposed method to a coal preparation plant in China, and construct a reagent dosage condition recognition system for the coal flotation. As shown in Table 8, from 16:00 on 6 August 2019 to 16:00 on 7 August 2019, the three shifts of coal flotation production were continuously tracked for the recognition of the dosage condition. According to the table, during the 21:00–21:40 night shift, the reagent dosage condition was abnormal, the amount of collector was excessive, and the ash content of clean coal was too high. During the 2:51–3:20 morning shift, the reagent dosage condition was abnormal, the amount of collector was small, and the ash content of clean coal was on the lower side. During the 4:32–5:00 morning shift, the reagent dosage condition was abnormal, the amount of collector was excessive, and the ash content of clean coal was high. During the 10:31–11:11 middle shift, the reagent dosage was abnormal, the amount of frother was excessive, and the ash content of clean coal was very high. The ash content of clean coal predicted by the reagent dosage condition recognition was consistent with the measured ash content of clean coal, indicating that this recognition method is effective and feasible. After a few days of observation, many faults were detected in the morning shift, which may be because some operators’ observations were not timely, owing to the biological function and other factors, resulting in delay in reagent dosage adjustment and the frequent occurrence of production accidents. This shows that the rapid and accurate recognitions of the reagent dosage conditions are critical for the coal flotation process, and thus, the proposed method is highly applicable.
5.3.2 Analysis of economic benefits
To compare the economic benefits of the proposed method with those of the flotation production of the coal preparation plant, this paper compares the annual number of reagents, annual incidence of production accidents in 2019 and 2018, and the index of ash content of clean coal in June 2019 and 2018. Through the online recognition of the current reagent dosage condition, accurate and reliable guidance information is provided in time to accurately and timely adjust the reagent dosage. Figure 17(1) shows that after using the proposed method, the monthly number of reagents in 2019 decreased substantially compared to the same period in 2018, in which the monthly savings of the frother and collector were 1.25 ton and 0.37 ton, respectively. At the same time, the number of production accidents caused by abnormal reagent conditions clearly decreased, as shown in Fig. 17(2). The average monthly production accident rate in 2019 was 12.7% lower than that in 2018. Thus, the stability of ash content of clean coal improved visibly. As shown in Fig. 17(3), the daily ash content in June 2018 fluctuated within 9.628–11.815, and that in June 2019 fluctuated within 10.125–10.779. The fluctuation range of the ash content was small and the daily average ash content of clean coal was reduced by 0.2 percentage points compared to the case of June 2018. This indicates that the consumption of the collector and frother, as well as the production accident rate, was substantially reduced, and the clean coal product index was more stable compared to the original reliance on the flotation workers to visually adjust the dosage. Thus, to a certain extent, the economic efficiency and primary intelligence level of the coal preparation plant have been improved.

Comparison of economic benefits. ((1)Comparison of the use of two kinds of reagents in 2018 and 2019:the first and third curves are the frother and collector used in each month of 2018, and the second and fourth curve are the frother and collector used in each month of 2019; (2) Comparison of the incidence of production accidents in 2018 and 2019: the green curve is the incidence of production accidents in each month of 2018, and the yellow curve is the incidence of production accidents in each month of 2019; (3)Comparison of the daily average ash content of clean coal in July 2018 and July 2019: the blue curve is the daily average ash content of clean coal in July 2018, and the purple curve is the daily average ash content of clean coal in July 2019)
6 Conclusion
In view of the low recognition accuracy of artificial naked eye of coal flotation froth, and the subjectivity, extensiveness and hysteresis in the process of reagent release, this paper presents a new froth image classification method based on the MRMR-SSGMM hybrid model for recognition of reagent dosage condition in the coal flotation process.
-
(1)
Aiming at traditional research on single froth image features, only a little feature information is available, which may lead to inaccurate recognition results. This paper begins with the multiple features of a coal flotation froth image—-morphology, colour, and texture—-to study their relevance to the ash content of clean coal. It then screens out the optimal froth image features with a high contribution rate to classification.
-
(2)
In the process of coal flotation production, there are many types of froth, each of which exhibits multiple features simultaneously. GMM is very suitable for this nonlinear, high-dimensional pattern recognition. However, the traditional unsupervised GMM clustering results are not visible, and human judgment is required to achieve classification. This paper proposes an improved GMM (SSGMM) froth image classifier.
-
(3)
A new hybrid classification model MRMR-SSGMM is proposed, the optimal froth image feature that contributes the highest to the SSGMM classifier is screened out using MRMR. Conversely, the SSGMM classifier is used as the evaluation criterion for the features screened by MRMR. Through constant search, the best number of froth image features and the optimal froth image features are found, so that the classifier achieves the maximum classifier accuracy.
-
(4)
Using the marked feature samples of coal flotation froth images to guide their unmarked feature samples. The marked feature sample information of the coal flotation images was mapped to the unmarked feature sample, the classification of the froth images were realised under different reagent dosage conditions, and acts as a feedback information to guide the abnormal reagent dosage conditions in the coal flotation production process.
-
(5)
Experimental and application results show, this hybrid classification method, which selects the features, merges multiple features, and guides learning through tag information, has significant advantages for an intelligent recognition and accurate classification of coal flotation froth images. This technology is expected to change the present situation of low-level intelligent control of the coal flotation process, and plays a key role in improving the monitoring level, optimising operation, and processing intelligent control of flotation production. The breakthrough of this technology can realise accurate and timely control of the reagent dosage, stabilise the product quality, reduce the reagent’s consumption, and promote an intelligent development of coal flotation to a higher level.
References
Wu C, Yang X, Xu D, et al. (2002) Study of a coal slurry flotation optimizing control system based on ash on-line measurement. High Tech Let 13:85–90
Shi J, Zhu Z (2014) Study and application of flotation automatic dosing device. Coal Prep Tech 3:68–71
Xu C, Gui W, Yang C, et al. (2012) Flotation process fault detection using output PDF of bubble size distribution. Miner Eng 26:5–12
Backes A, Bruno O (2010) Shape classification using complex network and multi-scale fractal dimension. Pattern Recognit Lett 31:44–51
Hosseini M, Shirazi H, Massinaei M, et al. (2015) Modeling the relationship between froth bubble size and flotation performance using image analysis and neural networks. Chem Eng Commun 202:911–919
Bonifazi G, Massacci P, Meloni A (2000) Prediction of complex sulfide flotation performances by a combined 3D fractal and colour analysis of the froths. Miner Eng 13:737–746
Bonifazi G, Massacci P, Meloni A (2002) A 3D froth surface rendering and analysis technique to characterize flotation processes. Int J Miner Process 64:153–161
Haralick R, Shanmugam K, Dinstein I (1973) Textural features for image classification. IEEE Trans Syst Man Cybern SMC 3:610–621
Ren H, Yang C, Zhou X, et al. (2011) Froth image feature weighted SVM based working condition recognition for flotation process. Chinese J Zhejiang Univ 45:2115–2119
Sun C, Wee W (1983) Neighboring gray level dependence matrix for texture classification. Comput Vis Graph Image Process 23:341–352
Zhao L, Peng T, Zhao L, et al. (2015) Fault condition recognition based on multi-scale texture features and embedding prior knowledge k-means for antimony flotation process. IFAC-Papers OnLine 28:864–870
Liu W, Lu M, et al. (2003) Extraction of textural feature and recognition of coal flotation froth. Chinese J Chem Indus 54:830–835
Peng X, Peng T, Zhao L, et al. (2016) Working condition recognition based on an improved NGLDM and interval data-based classifier for the antimony roughing process. Miner Eng 86:1–9
Xu D, Chen X, Xie Y, et al. (2015) Complex networks-based texture extraction and classification method for mineral flotation froth images. Miner Eng 83:105–116
Liu J (2013) Statistical modeling of froth images and its applications in the monitoring of the mineral flotation process. Ph.D. dissertation Central South Univ, Hunan, China
Cheng C (2010) Classification of mineral flotation selected froth based on color and texture feature. M.S. thesis Central South Univ, Hunan, China
Liu M, Tang Z, Wang X, et al. (2015) Performance recognition of antimony flotation based on multi-information fusion and extension theory. J Cent South Univ 46:4512–4520
Zhao L, Peng T, Zhao L (2015) Fault Condition Recognition Based on Multi-scale Texture Features and Embedding Prior Knowledge K-means for Antimony Flotation Process. IFAC-PapersOnLine 48:864–870
Wang Y, Sun B, Zhang R, et al. (2018) Sulfur flotation performance recognition based on hierarchical classification of local dynamic and static froth features. IEEE Access 6:14019–14029
Zarie M, Jahedsaravani A, Massinaei M (2020) Flotation froth image classification using convolutional neural networks. Miner Eng 155:106443
Wang X, Song C, Yang C, et al. (2020) Process working condition recognition based on the fusion of morphological and pixel set features of froth for froth flotation. Miner Eng 128:17–26
Fu Y, Aldrich C (2020) Flotation froth image recognition with convolutional neural networks. Miner Eng 132:183–190
Zhang L, Frank S, Kim J, et al. (2020) A systematic feature extraction and selection framework for data-driven whole-building automated fault detection and diagnostics in commercial buildings. Build Environ 186:107338
Shah S, Shah F, Hussain S, et al. (2020) Support vector machines-based heart disease diagnosis using feature subset, wrapping selection and extraction methods. Comput Electr Eng 84:106628
Priyanka KD (2020) Feature extraction and selection of kidney ultrasound images using GLCM and PCA. Procedia Computer Science 167:1722–1731
Wang X, Ding W, Liu H, et al. (2020) Shape recognition through multi-level fusion of features and classifiers. Granul Comput 5:437–448
Peng H, Long F, Ding C (2005) Feature selection based on mutual information: criteria of max-dependency, max-relevance, and min-redundancy. IEEE Trans Pattern Anal Mach Intell 27:1226–1238
Celik T (2009) Unsupervised change detection in satellite images using principal component analysis and k-means clusterer. IEEE Geosci Remote Sens Lett 6:772–776
Mehidi I, Chouaib Belkhiat D, Jabri D (2019) An improved clustering method based on k-means algorithm for MRI brain tumor segmentation. In: The 6th international conference on image and signal processing and their applications (ISPA), Mostaganem, Algeria, pp 1–6
Xiang C, Mao J (2019) Research on target detection method based on HSV fusion gaussian mixture model. In: The 3rd international conference on electronic information technology and computer engineering (EITCE), Xiamen, China, pp 327–331
Amit S, Pushpendra S, Brejesh L, et al. (2020) Modeling and prediction of COVID-19 pandemic using Gaussian mixture model. Chaos, Solitons & Fractals 138:110023
Ping B, Su F, Meng Y (2020) A cloud and cloud shadow detection method based on fuzzy c-means algorithm. IEEE J Sel Top Appl Earth Obs Remote Sens 13:1714–1727
Wang C, Pedrycz W, Yang J, et al. (2020) Wavelet frame-based fuzzy c-means clustering for segmenting images on graphs. IEEE Trans Cybern 50:3938–3949
de Zepeda M, Meng F, Su J (2021) Dynamic clustering analysis for driving styles identification. Eng Appl Artif Intel 97:104096
Rahman M, Zaman N, Asyhari A, et al. (2020) Data-driven dynamic clustering framework for mitigating the adverse economic impact of Covid-19 lockdown practices. Sustainable Cities and Society 62:102372
Lingras P, Haider F, Triff M (2016) Granular meta-clustering based on hierarchical, network, and temporal connections. Granul Comput 1:71–92
DeGroot M, Schervish M (2002) Probability and statistics. Journal of the Royal Statistical Society. Series A (Statistics in Society)
Dukkipati A, Ghoshdastidar D, Krishnan J (2016) Mixture modeling with compact support distributions for unsupervised learning. In: The International Joint Conference on Neural Networks (IJCNN), Vancouver, BC, 2706–2713
Liu S, Hu J, Hao S, et al. (2016) Improved EM method for internet traffic classification. In: The 8th International conference on knowledge and smart technology (KST), Chiangmai, Thailand, pp 13–17
Leng Y, Xu X, Qi G (2013) Combining active learning and semi-supervised learning to construct SVM classifier. Knowledge-Based Syst 44:121–131
Gong C, Tao D, Maybank S, et al. (2016) Multi-modal curriculum learning for semi-supervised image classification. IEEE Trans Image Process 25:3249–3260
Qin Y, Ding S, Wang L, et al. (2019) Research progress on semi-supervised clustering. Cognit Comput 11:599–621
Luo S, Zheng B, Ye X (2009) Image segment based on the self-adaptive threshold EM and GMM algorithm. Acta Photo Sini 38:1581–1585
Gui W, Yang C, Xu D, Lu M, et al. (2013) Machine-vision-based online measuring and controlling technologies for mineral flotation-a review. Acta Autom Sin 39:1879–1888
Wang Z (2010). Research on the classification method of remote sensing images based on texture and spectral information fusion, M.S. thesis Xidian Univ, Xian, China
Author information
Authors and Affiliations
Corresponding author
Additional information
Publisher’s note
Springer Nature remains neutral with regard to jurisdictional claims in published maps and institutional affiliations.
Rights and permissions
About this article

Cite this article
Cao, W., Wang, R., Fan, M. et al. A new froth image classification method based on the MRMR-SSGMM hybrid model for recognition of reagent dosage condition in the coal flotation process. Appl Intell 52, 732–752 (2022). https://doi.org/10.1007/s10489-021-02328-z
Accepted:
Published:
Issue Date:
DOI: https://doi.org/10.1007/s10489-021-02328-z