
Abstract
Quasi-2D, low-velocity experiments of colliding granular projectiles against granular targets were performed by means of a 7 m-long Hele-Shaw cell. The processes involved in the crater-opening mechanism of low-velocity granular-against-granular collisions are described. We show that the crater is opened mainly by a compaction process of the target. The projectile is fragmented and its lower section suffers a severe compaction; this projectile remnant forms a central dome or peak inside the crater. When the target reaches its maximum degree of compaction, the excess of momentum generates fast avalanches sliding on the slopes of the confined material, and exerts pressure on the crater walls, increasing its diameter. We propose that low-velocity collisions between granular aggregates are a possible mechanism that allows the growth of small planetary objects or the aggregation after catastrophic or high-energy collisions.
1 Introduction
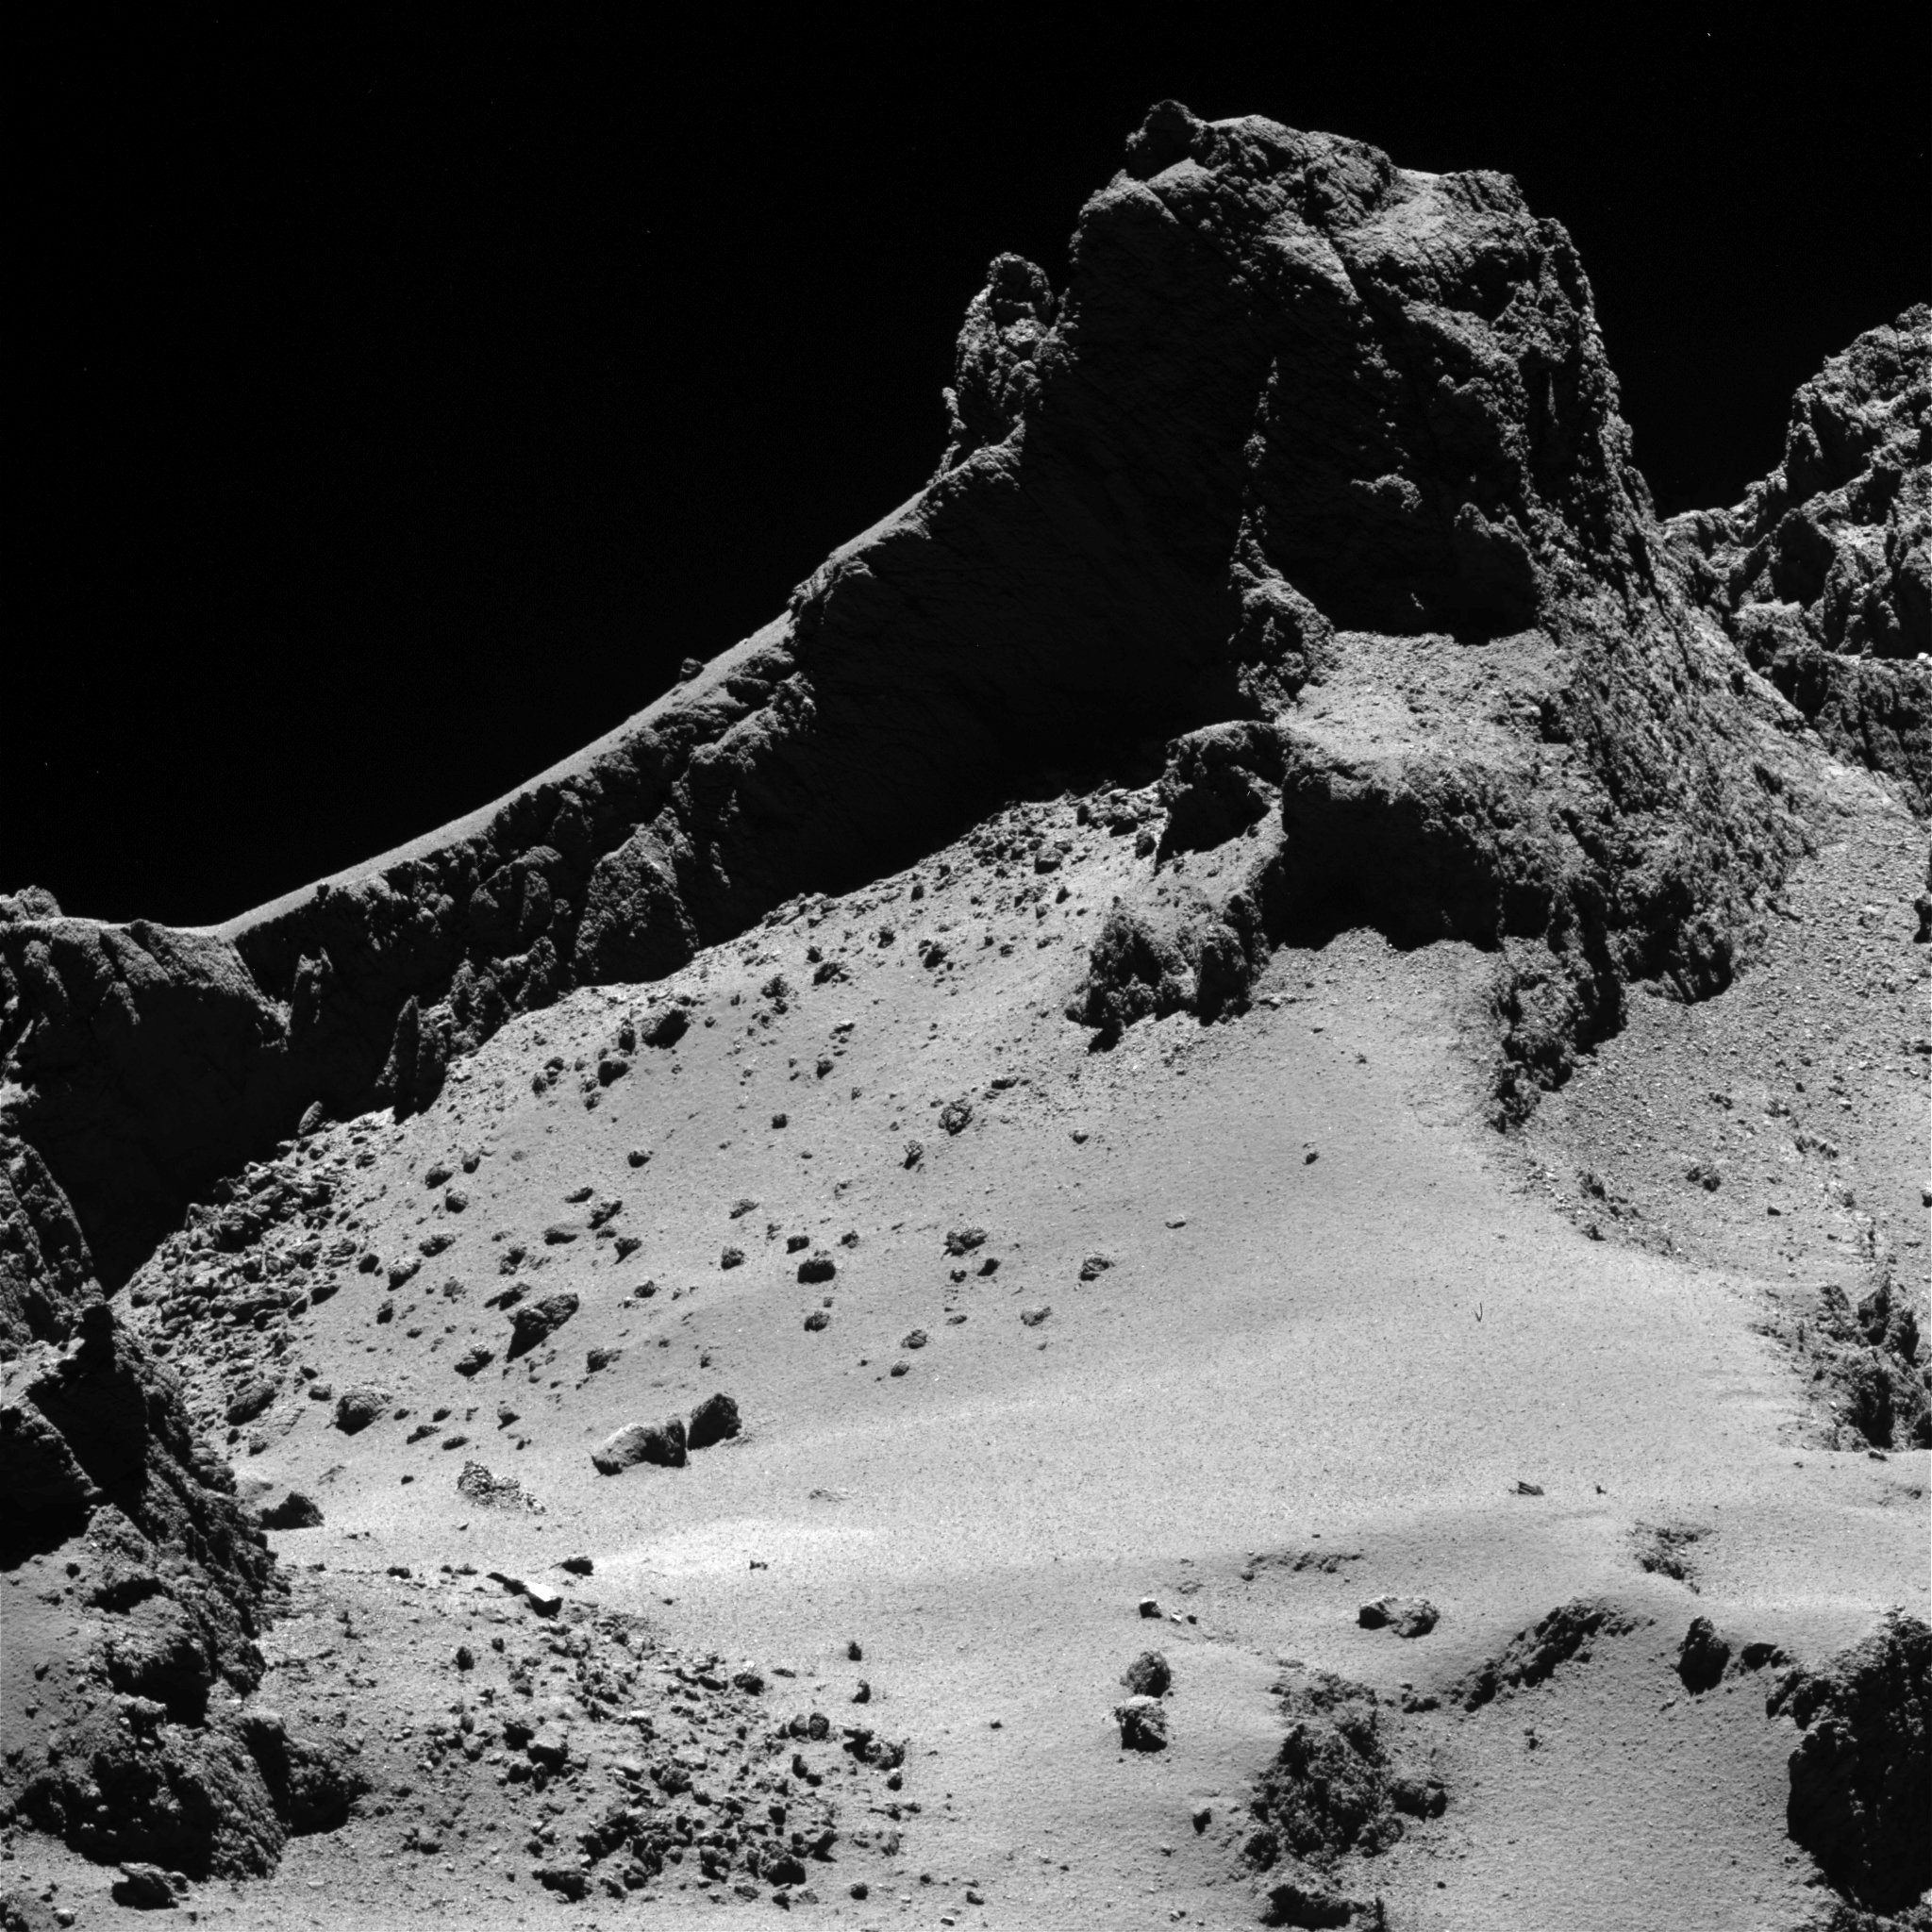
Granular, rubble-pile, and highly fragmented minor celestial bodies are loose agglomerates of silicate and/or metallic grains spanning a wide range of grain sizes, from dust to large boulders; among these minor bodies, comet 67P/Churyumov-Gerasimenko (Fig. 1a) and asteroid (25,143) Itokawa (Fig. 1b) are good representative examples. Such celestial bodies have a high porosity, which gives them a very limp structure (Britt et al. 2002). Almost all small-diameter (<250–300 km) asteroids have these properties, and they can be thought as granular bodies. Nonetheless, there exist some superfast rotators (Pravec and Harris 2000; Paolicchi and Kryszczyńskab 2012) that should be assumed as monolithic bodies. Minor celestial bodies may have been formed as a result of catastrophic collisions between larger objects (e.g. Wilkison et al. 2002; Carry 2012; Morbidelli et al. 2009; Nelson et al. 1994) or they might be the remnants of the primordial condensation of the solar nebula. Particles that make them up are held together by gravity and by van der Waals forces; the latter are the strongest on micrometer-sized particles (Scheeres et al. 2010; Sánchez and Scheeres 2014). Compaction, reorganization, fractal growth and critical sticking velocities were observed in experiments of aggregation of dust particles; collision of these simple aggregates at low speeds, in order to simulate coagulation in the early planetary nebula, are reported by Poppe and Blum (1997),. Nucleation and coagulation in an early nebula can indeed be assumed to be homogeneous at very early stages, producing monodisperse aggregates. However, homogeneity breaks down by fluctuations, instabilities (Morbidelli et al. 2009) or perturbations from external bodies; all those events have already occurred in an accretion disc, for which isotropy was broken much earlier. In this scenario, collision of small granular bodies impacting larger ones of the same nature is very likely. Furthermore, runaway growth of planetesimals, for which relative speed among these granular aggregates is smaller than the escape velocity of the largest one, implies sizes of the order of tens of kilometers and collision speeds on the order of the velocities we will treat in this report (<12 m/s).

Rubble-pile bodies. a Surface detail of comet 67P/Churyumov–Gerasimenko imaged by the ESA Rosetta spacecraft from a distance about 8 km to the surface on October 14th, 2014 (image id: 333933). The image resolution is roughly 15 cm/px. The surface is covered by fine regolith and boulders of all sizes (credit: ESA/Rosetta/MPS for OSIRIS Team MPS/UPD/LAM/IAA/SSO/INTA/UPM/DASP/IDA) (source http://www.esa.int/var/esa/storage/images/esa_multimedia/images/2015/01/comet_from_8_km/15206382-1-eng-GB/Comet_from_8_km.jpg). b Surface of asteroid (25,143) Itokawa taken on November 12, 2005 by the Japanese spacecraft Hayabusa, before its landing (image ID: st_2539423137). The resolution is roughly 2.2 cm/px (source https://darts.isas.jaxa.jp/pub/planet/darts/hayabusa/amica/thumbnails/ST_2539423137_v.jpg)
Images and gravitational data sent back by spacecrafts that visited rocky asteroids: (433) Eros (11 × 11 × 34 km) (Veverka et al. 2000), (25,143) Itokawa (0.535 × 0.294 × 0.209 km) (Fujiwara et al. 2006), (253) Mathilde (66 × 48 × 44 km) (Veverka et al. 1999), (243) Ida (59.8 × 25.4 × 18.6 km) (Sullivan et al. 1996), showed that they have a granular (high-porosity or highly fractured) internal structure. Even M-type asteroids may have a granular structure (Margot and Brown 2003), inferred by their low density, such as (22) Kalliope (235 × 144 × 124 km) (Descamps et al. 2008) or (16) Psyche (240 × 185 × 145 km) (Lupishko 2006). Irregular bodies, like those cited above, could be the remnants of catastrophic or semi-catastrophic collisions, or even the product of the re-accumulation of a shattered parent body, so their internal structure must be weak and highly fragmented (e.g. Asphaug et al. 2002; Baer et al. 2011; Britt et al. 2002; Kiuchi and Nakamura 2014). Their irregular shape also suggests that they did not experienced large metamorphic processes and, certainly, they did not suffer differentiation. Computations of masses and porosities of small to medium-sized main-belt asteroids lead to the conclusion that most of them are rubble piles (e.g. Housen and Holsapple 2003; O’Brien et al. 2006; Magri et al. 2001; Asphaug et al. 1998; Housen and Holsapple 1999; Thomas 1999; Nakamura 2002).
Kepler’s third law implies a continuous velocity field in its tangential component for an accreting disc as a function of the radial distance to the central mass, obeying the equation
where v is the radial velocity of a particle at the distance r from the central mass M and G is the gravitation constant. This means that the velocity of objects orbiting or accreting (around 1 AU of distance from the central mass) around a central mass of one solar mass, within a neighborhood, would differ in 1 m/s if they are separated in radial distance by no more than 6000 km. As the radial distance increases in the hypothetical accretion disk, the relative separation between particles having differential velocity of the same 1 m/s increase.
In this sense, granular materials sharing similar orbits (semi-major axis and inclination) would collide at very small relative velocities to conform aggregates. This kind of collisions will model and give shape to small bodies, like asteroids or planetesimals, allowing them to grow up.
A very small number of objects can collide with any relative velocity; these collisions occur between objects moving in very different orbits. Collisions of this kind can be called “fortuitous orbit intersection” and may be rather rare. Instead, almost all impacts might occur at low relative velocity and could be called “gravitationally directed”.
At these low relative velocities (few hundreds of m/s), a considerable portion of the projectile can survive inside the crater. Nonetheless, even at velocities of some km/s, remnants are calculated to stay within the impact crater (Bland et al. 2007, 2008). At low velocity, the kinetic energy of the collision is not high enough to produce severe melting and vaporization of the projectile and the target terrain. High-resolution imaging and spectral data from lunar craters and asteroid (4) Vesta (e.g. Le Corre et al. 2015; Reddy et al. 2012) suggest that a large portion of the impactor may survive for impacts that take place at velocities on the order of few kilometers per second. From these evidences, it is easy to assume that even a larger quantity of material could survive within the crater if collisions take place at much lower speeds. Moreover, if the projectile has a granular structure, its remnant could be the observed central peak or dome, as the experiments done by Pacheco-Vázquez and Ruiz-Suárez (2011) could suggest. More recently, spectroscopic and mineralogical data also suggest that some of the projectile material can be found mixed with the original material in the crater’s floor and the central peaks on the Moon, reported, for example, by Joy et al. (2012). In the case of our own planet, specifically the case of Meteor Crater in Arizona (Artemieva and Pierazzo 2010), not all the impactor suffered a total destruction or evaporation. Numerical simulations on low-velocity (<12 km/s) or oblique collisions, demonstrate that a large fraction of the projectile may survive (e.g. Yue et al. 2013; Bland et al. 2008). Furthermore, the lack of ejecta observed in high-porosity asteroids, like (253) Mathilde, suggests that, under these low-energy conditions, craters are formed by compaction, instead of excavation (Housen et al. 1999).
In the light of these evidences, it is necessary to take into account, experimentally and theoretically, the granular structure and high porosity of both the projectile and the target. Thus, the study of collisions at low velocities is necessary. Under these conditions, the energy dissipation processes involved during collisions are different from those present when a solid projectile collides against a solid target or a highly consolidated granular target (for example, a granite block) at high speed (e.g. Buhl et al. 2014). These processes can lead to the different crater morphologies and morphometry observed on the surface of asteroids, satellites and planets. It is worth to mention that, after the first impact, a solid target terrain will be heavily fractured, so subsequent collisions, on the same area, must be modeled as an impact onto a granular and low-consolidated target (Asphaug et al. 1998, 2002).
Up to date, several research groups have only considered the granularity of the target, but not that of the impactor. They have developed mathematical models and theoretical work on the opening of impact craters in planetary bodies, based on the hypothesis that asteroids are solid or highly consolidated bodies (e.g. Schwartz, et al. 2014; Ivanov and Artemieva 2002; Wada et al. 2006). Just recently, Collins et al. (2011) developed a simple and intuitive model incorporating to their hydrocodes, the behavior of porous materials undergoing compaction during impact cratering processes.
Experimentally, a great amount of work was done during the past decades, making solid projectiles collide against a highly consolidated granular target (e.g. Yamamoto et al. 2006; Dufresne et al. 2013). Some research groups have also developed experiments involving collisions of solid projectiles against a solid target, covered by a variable thickness of softly consolidated granular layers (e.g. Dohi et al. 2012; Oberbeck and Quaide 1967; and references therein). In contrast, there is a very small quantity of research and experimentation published on granular–granular impacts (Poppe and Blum 1997; Pacheco-Vázquez and Ruiz-Suárez 2011; Ruiz-Suárez 2013).
In this work, we describe the crater morphogenesis of such granular-versus-granular collisions and the internal structure of the crater. Crater-opening mechanism in this kind of collisions presents diverse phenomena related to granular materials, such as dynamic-pressure-induced confinement and compaction, Reynolds dilatancy of the rim (Reynolds 1885, 1886), when avalanches shear the inner walls of the recently opened crater. Kelvin–Helmholtz instabilities (Kelvin 1871; von Helmholtz 1868) are produced in these highly sheared regions by the avalanche flow during the ejecta formation and lateral crater growth. This particular crater-opening mechanism is unveiled by experiments carried out using sand discs sliding inside a Hele-Shaw cell (Batchelor 2000, p. 222) and colliding against a layered sand bed. Our main scope is to understand the processes involved in a granular–granular low-velocity collision that we conjecture is an important scenario during the planetesimal growth process, asteroid mutual collisions and, in general, all impacts on softly consolidated, or regolith-covered, bodies at low relative velocities.
2 Experimental Set-up
In order to visualize the impact process, we developed an experimental setup to observe, with high spatial and temporal resolution, the whole sequence of events that takes place during a granular–granular impact. We built a vertical, 7 m high, 15 cm wide and 1.2 cm thick channel or Hele-Shaw cell consisting in two parallel walls separated by a thin gap (schematically shown in Fig. 2). The cell was made of a very smooth MDF sheet supported by a metallic structure and covered by a transparent polycarbonate foil. At the end of the channel we placed a rectangular box 96 cm wide, 78 cm high with a variable thickness from 1.3 cm to 3.1 cm. The box was also made of a MDF sheet, covered by a tempered 6 mm thick glass, allowing the observation of the entire impact process. Thickness variation of the target Hele-Shaw cell allows to explore any confinement effect produced by frontal and rear walls.

Experimental set-up sketch. Hele-Shaw cell and target box shown frontally (left image) and laterally (right image). The target box width can be changed from 1.3 to 3.1 cm, while the width of the Hele-Shaw column is fixed (1.2 cm). The thickness, color, grain size and the number of sand layers can be modified at will. (Color figure online)
We chose those materials for the Hele-Shaw cell and the target box because they offer little resistance to the projectile motion. Due to the polycarbonate coating, the channel behaved like a closed rectangular tube, so the disk moved over a thin air cushion (1.5 mm thick) with a very low friction coefficient. In this way, only the aerodynamic drag was working against the projectile motion; this lead to a measured impact velocity of 10 ± 0.5 m/s, whereas the theoretically one should have been 11.7 m/s. Projectile masses were between 0.09 and 0.13 kg, giving a kinetic energy of the collision in the range from 6.2 to 8.9 J.
Three video cameras were placed in front of the target box, in order to record each experiment. Two of them (Sony HDR-XR150) were capable to record at 120 frames per second (fps), and were placed at different distances from the target, in order to have different fields of view. The third camera was a Red Lake Motion running at 500 and 1000 fps.
2.1 Projectiles
We made disks with a diameter of 92 mm and a thickness of 9 mm (Fig. 3), by mixing quartz sand grains (125 μm–1 mm mean diameter) with lead spheres (2.5 mm), polystyrene spheres (3.5 mm) and 1000 cm3 of water.

Granular projectile examples. a Low mass (90 g) disc containing polystyrene spheres. b High mass disc (130 g) containing lead and polystyrene spheres. Each disc diameter is 92 mm with a thickness of 9 ± 1 mm
For preparing a set of porous discs, we filled with sand a 1 l recipient and added a fixed amount (250 cm3) of polystyrene spheres, mixing them with the sand. We then include 384, 500, 563, 588 and 640 g, (respectively) of lead spheres (2.5 mm in diameter), in order to obtain the set of discs with densities shown in Table 1. After mixing all components, we added a 3 % by mass of 64-μm sand grains and re-mix all the ingredients.
The whole mixture was poured into a plastic mold, with the desired dimension, and pressed (with a constant value) using a 10-kg weight. The discs were introduced in an oven during 2 h at 130 °C, in order to allow complete evaporation of water and shrinkage of the polystyrene spheres to half their original size. This allowed us to create small holes, simulating inter-particle voids, increasing the porosity of the projectile. In this way, we obtained a packing fraction of 45 %. All the particles were held together only by van der Waals forces, due to the presence of the finest grains (64-μm mean diameter), like it might occur in asteroids and comet nuclei (Scheeres et al. 2010).
2.2 Target
The target terrain was set within the Hele-Shaw cell described previously. The target was prepared by emptying the cell after each experiment and refilling it by pouring the different layers of granular materials used. The lowest layer consisted of a 10-cm-height layer of coarse material (smooth, semiangular polyethylene, 1520-kg/m3 plastic grains with 2.8 ± 0.45 mm mean size, and repose angle of 30°). We used this distribution with coarse irregular particles at the bottom to simulate, more realistically, the inferred conditions that may exist on a rubble-pile asteroid or any fine regolith-covered target with a highly fragmented nucleous. On top of this coarse layer, several layers (1 cm thick, approximately) of colored sand (0.35 ± 0.07 mm mean size, repose angle 33°) were poured from the upper open slit. No compaction by pressing the sand or shaking was performed, in order to keep reproducible preparation conditions of the target. The surface was leveled by skimming it with a wooden board.
The cell had a variable separation between frontal and rear walls that was able to acquire values of 13, 19, 25 or 31 mm. The variable separation among these walls allowed studying the effect of reducing dimensionality of collision, due to walls effect. The main effect that can be expected is due to the Janssen effect (Janssen 1895) observed in silos, in which the stress exerted on top of a granular material in a container is transmitted towards the walls, instead of being transmitted to the bottom of the silo. Many arches supported on silo walls, spanning the entire medium, redirect the stress to the walls avoiding pressure growth at the bottom of the silo.
3 Method
We may consider the disc as a thin slice of a granular sphere, and the narrow target box as a thin section of the target terrain. Therefore, this setup allows us to observe the processes occurring inside the projectile and the target. Previous work done by Pacheco-Vázquez and Ruiz-Suárez (2011), on 3D granular–granular impacts, showed that the bottom section of the projectile suffered a severe compaction; the upper section was fragmented and fast avalanches slid down the slopes of the confined projectile. At the same time, the target was also highly compressed. The quasi-2D character of our experiments allowed us to quantify the compaction-to-expansion ratios (area changes) of each layer during the crater formation. Extrapolating this information, we can infer the processes that take place during the morphogenesis of a granular–granular impact crater at low speeds.
We took a picture of the target box before (Fig. 4a) and after the impact (Fig. 4c), from the same vantage point, in order to maintain both the scale, orientation and the field of view. This allowed us to obtain complete stratigraphic and topographic maps of the crater, measuring precisely the thickness and the area occupied by each layer before (Fig. 4b) and after the impact (Fig. 4d). We then measured the absolute elevation of each layer (see Fig. 5a) and calculated the thickness change of each one with an horizontal spatial bin of 2 mm over the whole image as shown in Fig. 5b. For clarity we show only data that belongs to the uppermost layer (crater surface). It should be noted that layer thickness will change due to mobilization and/or compression processes that will be described in subsection “Crater growth, layer overturn and ejecta blanket deposit”. In Fig. 5a, the thickness of the surface layer before the impact is represented by the dotted line, and the difference of the upper layer’s thickness before and after the impact is represented by the solid line. It can be observed that the region including the crater rim suffered expansion (increment in the layer’s thickness) and other regions, like the crater bottom were compressed (reduction in the layer’s thickness). In order to have a better visualization of each layer’s profile, we applied a low-pass filter function to the thickness data, obtaining the smoothed profile shown in Fig. 5. The next step was the evaluation of the change in thickness of each layer, expressed as a percentage of the original thickness before the collision event, and the one resulting after the crater were fully formed and the material stabilized. In Fig. 5b, the percentage of the thickness’ changes measured respect to the original level of the surface of the target terrain can be seen.

Stratigraphyc analysis. a Target box layers before impact. b Target box stratigraphy before impact. c Target box layers after impact. d Target box stratigraphy after impact. All images are at the same scale

Upper layer stratigraphy analysis (referred to Fig. 4). a Upper blue layer thickness before the collision (dotted line), compared to its thickness after the impact. Regions showing high changes are the crater rims (b, c, g, h) and the bottom of the inner crater slopes (d, f). Region e, below the dynamically confined projectile, shows a very low change in thickness. b Upper blue layer thickness changes expressed as a percentage of the thickness before the collision and its value after the impact in different regions of the target terrain inside and around the crater: Region definitions: a left distal area, b left outer crater rim, c left inner crater wall, d left inner dome slope, e Crater floor, f right inner dome slope, g right inner crater wall, h right outer crater rim, i right distal area
We also measured the thickness and distribution of the projectile’s fragments (dotted line) and the confined section of the projectile (long-dashed line), as shown in Fig. 6. The solid line is the level of the surface before the impact, and the short-dashed line is the surface level, of the target terrain, after the collision; these lines are depicted only for reference purposes.

Global crater topography. Solid line represents the surface of the target terrain before the collision. Short-dashed line is the profile of the uppermost layer after the impact and represents the crater profile. Long-dashed line is the profile of the dynamically confined projectile forming the central dome of the crater. Dotted line is the profile of the ejecta layer, including large fragments of the projectile deposited on top of the central dome
Since using a Hele-Shaw cell strongly perturbs the processes occurring in a full 3D collision event, we performed experiments varying the cell thickness. Front and rear walls are confining the granular material of the target at just tens of particle diameters of the finer uppermost granular material in such a way that arching is very likely and thus a strong Janssen effect should be expected.
4 Results and Discussion
In this section, we will present both static and dynamic analysis, i.e. stratigraphic changes, over the target terrain after the collision and mobilization of material that occur during the very collision event. Experimental parameters of those impacting events, that are relevant to this study, are presented succinctly in Table 1, where rim to rim diameter of the opened crater and the height of the central peak (confined projectile height) are presented for projectiles with different densities and masses. Data is shown sorted by increasing projectile mass.
4.1 General Picture of the Collision Process
After first contact of the projectile with the target terrain, a sudden crumbling of the impactor and a compression of both the target and the impactor take place. During this compression stage, dynamic pressure exerted by the projectile pushes the terrain downwards, like a piston. During the collision, the lower part of the projectile is dynamically confined by the pressure exerted by the flow of particles from the crumbled uppermost part of the impactor. This confined material will end up forming a dome-like structure, below which strata show the highest downward displacement (see Fig. 4d). The confined material forms a conic mound, on top of which a fast granular avalanche, conformed by the fragmented uppermost part of the projectile, slides down, hitting the just formed inner crater walls. This avalanche erodes the material on the crater floor and shears the inner walls, pushing particles outwards and forming the ejecta, containing material from both, the projectile and the eroded uppermost layer of the target. The flow of the avalanche shearing the target terrain will produce a Kelvin–Helmholtz instability, clearly noted during the ejecta projection as a breaking-wave-shaped pattern. It is worth to note that, for a high-slope dome (Fig. 7a), there will be an almost entirely lateral ejection of material, while for low-slope or almost flat domes, the material will be ejected more isotropically, as can be seen in Fig. 7b.

Particle ejection habit depending on the cell width. a High-slope central mound leads to a lateral ejection of the material coming from the projectile in the form of an avalanche, which erodes inner walls of the just opened crater. b Isotropic ejection of the material due to a low-slope central mound. The low slope is attributed to small confining effects due to distant front and rear transparent walls
For comparison purposes, we presented in Fig. 8 two high-speed photographic sequences of a granular impactor hitting a granular target (Fig. 8a), and a solid disk hitting the same target (Fig. 8b). Strikingly, the final crater morphology is completely different, being flat in the first case and conic in the second one. Nevertheless, both impacts have the same energy, evocating natural complex and simple craters respectively. The first impactor pushes the target terrain down as a flat piston, while the second one penetrates like a bullet. The solid impactor evacuates the sand of the target, excavating a void below it, whereas the softly consolidated projectile first deforms itself into a flat bottomed object that present a huge resistance to penetrate into the target. This deformed projectile exerts dynamic pressure, like a piston, over the target terrain, which, in turn, undergoes a compressive subduction, leading to a much shallower crater. Note that the time scale is the same in both sequences.

Quasi-2D granular–granular and solid–granular collision sequences. a Collision sequence showing the crater formation and growth when a granular projectile (sand disk) collided against a granular target. The resulting crater is flat, shallow and shows a central mound. b Collision sequence showing the crater formation and growth when a solid (stainless steel disk) projectile collided against a granular target. The resulting crater is conical, deeper and its diameter is smaller than that in the previous example
4.2 Crater Stratigraphy Analysis
After a detailed observation of the crater morphology, whose profile is determined by the topographic level of the free surface layer (upper blue in Fig. 4a, c), we can distinguish at least nine regions (reported in Fig. 5b) in the target terrain after the impact, which were affected by the collision in different ways. These regions are defined as follows: a) left distal area; b) left outer crater rim; c) left inner wall; d) left inner dome slope; e) crater floor; f) right inner dome slope; g) right inner wall; h) right outer crater rim; i) right distal area. It can be seen that the crater is almost symmetric. The criterion used to identify each region is as follows: The distal areas, (a) and (i), were defined as the zones where the target is less affected by the impact and the thickness of the ejecta is very small, or even not measurable (except for the presence of some large fragments). The outer rim zones, (b) and (h), are the areas where the rims rise over the initial terrain level. They are delimited by the point where the slope of the distal area toward the crater changes, until it reaches the highest point of the rim on each side of the crater. The inner walls, (c) and (g), are measured from the highest point of the rim to the point where there is a change in the slope inside the crater, corresponding to the crater floor. The crater inner dome slopes, (d) and (f), are the deepest zones inside the crater floor where the erosive excavation took place and the remnant of the projectile conforms the central elevation (dome or peak). The crater floor, (e), is the region which suffered the highest vertical displacement but a small differential thickness change, and it is the area inside the crater and below the central dome. In Fig. 5b, a positive ratio accounts for expansion and accumulation of material of the same color coming from other region of the layer, and a negative value means that the layer was compressed or eroded in that region.
In the typical experiment, shown in Fig. 4, the target box contains six different layers, defined by the color of grains: (1) upper blue, (2) upper black, (3) middle blue, (4) lower black, (5) lower blue and (6) yellow layers and (7) ejecta blanket layer. During the impact, there are two compressive and shearing stresses acting on each layer: one of them normal to the target terrain (vertical) and the other parallel to it (horizontal). The normal stress is due to the dynamical pressure exerted by the projectile. This stress rearranges all particles below it, increasing the compaction of the target in a region of the same width as the projectile and just below it. The magnitude of this compressive stress determines the final depth of the crater. The shear stress is due to the transfer of momentum from the fast avalanche of the crumbled projectile and large fragments of it, leading to the crater’s lateral expansion and the layer’s overturn during the formation of the ejecta. This lateral compressive stress and the shear exerted by the flow of the fast avalanche determine the final crater diameter. The uppermost layer of the target ends up expanded at the crater rim, which is topographically elevated with respect to the original (before the impact) level, mainly due to Reynolds dilatancy.
4.3 Uppermost Free Surface Layer
The lateral transfer of momentum from the projectile to the target exerted by the fast avalanches (in the inner crater walls region) leads also to the expansion of the upper blue layer in the outer rim regions. This is due to the shear stress (Reynolds dilatancy) it exerts on the crater’s inner walls, increasing the rim elevation, as can be seen in Fig. 4. The thickness of this upper layer is reduced almost to zero on both internal rim zones (regions d and f in Fig. 5b). This material is expelled from the inner crater rim together with material of the impactor, forming the ejecta. Fast avalanches and fragments from the projectile running down the slopes of the just formed central dome (confined projectile) press the inner walls, pushing the grains outwards. On the other hand, the strata below the crater floor (below the confined part of the projectile) undergo subduction or the maximum vertical downwards displacement, due to the compressive rearrangement of particles in deeper layers (Fig. 5).
4.4 Crater Growth, Layer Overturn and Ejecta Blanket Deposit
Fast avalanches and projectile fragments sliding down the slopes of the highly compressed and dynamically confined material exert pressure and transfer their momentum to the base and the inner walls of the crater rim, as can be seen in the time-lapse sequence shown in Fig. 9. This avalanche (which is a fluidized granular material, having a much lower packing fraction than the compressed granular material below) pushes the grains laterally, eroding and simultaneously deforming the crater rim at high shear rates. This shear produces an erosive mobilization of the uppermost layers (pink and purple grains in Fig. 9), that will eventually settle down as overturned strata over the rim and the outer rim regions. This inversion of the order of layers also occurs in natural impact craters observed, for example, in the Barringer crater (e.g. Shoemaker 1960; Kring 2007). Even though there is no proof on any scale-free mechanism, we observe a coincidence on some morphologic features of our experimental craters with those produced in silico by hydrocodes or observed in natural structures concerning high-energy, hyper- velocity collisions (Goldin et al. 2005; Collins et al. 2002). Furthermore, the shear produced by the avalanche flowing down the slope of the central mound will produce a folding of lower strata, as can be seen in Figs. 4c, 9, 10. This folding, caused by lateral compressive stresses and shearing erosive processes during ejection, elevates the rim zone over the original topographic level. These sheared and folded regions are likely dilated due to Reynolds dilatancy, producing a lower packing fraction of the rim with respect to the crater floor and distal zones, as will be treated in further sections.

Folding and layer overturn sequence. a Stratified structure of the target terrain before impact. b–i Example of the layer’s overturning process, due to the lateral pressure exerted by the projectile fragments and fast avalanches against the inner crater rims. j Stratified structure of the target terrain after the impact, clearly showing that the pink layer is overturned over the violet one. The blue layer was also lifted by folding. (Color figure online)

Ejecta blanket layer formation. Sequence of the ejection of particles during the collision. The ejecta blanket is layered and comprises projectile particles (upper layer) and target particles (lower layer)
Notoriously, the expelled material from the fast avalanche and the eroded material of the inner walls shears the rim region, producing a behavior similar to a Kelvin–Helmholtz instability and an associated breaking-wave-shaped pattern (finally deposited as a layer inversion). The number of layers showing this process depends on the impact energy.
The lateral pressure exerted by the avalanche is the main growth process for crater diameter after the compressive subduction of the terrain has taken place below the impactor. The white diagonal streaks that can be seen in Fig. 9 are unwanted reflections, but they were used as reference lines.
After the collision, the material ejected from the projectile and the inner crater is deposited as the ejecta blanket. The uppermost layer of the ejecta blanket is material from the projectile, as can clearly be seen as brown grains in Fig. 10. The same can be seen in Fig. 9, but it is more difficult to discern, due to the poor contrast in colors of the projectile material and the uppermost layer. The projectile material deposited over the rim and outside the crater contains both fine particles and large fragments. Crumbling produces fine particles between the confined central mound and the large fragments from the uppermost part of the projectile. This fine material makes up fast avalanches running down the slopes of the confined central mound. Other large fragments are expelled laterally during the collision and slide down, floating on top of the fast avalanche flow. Lower layers of the ejecta blanket contain material ejected from the crater’s inner walls by the erosion exerted by the flowing avalanche on regions (d) and (f) in Fig. 5b. This material can be ejected from different depths inside the crater, depending on the energy transferred from the projectile to the target.
4.5 Projectile Remnant and Target Constriction
During the collision, the ejecta are expelled in two different ways: one is mainly a lateral fashion (confined dome with high slope), while the other is a more isotropic one (confined dome with low slope), as stated above and shown in Fig. 7. Each particular behavior depends mainly on the cell thickness that allows the confined material to acquire a high or low slope, due to different strengths of the Janssen effect with the walls, as shown below.
In Fig. 7a, it can be seen that, for collisions in which there is mainly a lateral ejection, large fragments of the projectile remain on top of the confined material. Survival of large fragments of such a fragile object is due to a large braking effect of sand penetrating into sand and the buoyancy of fragments on the fluidized sand bed that makes up the fast avalanche. This braking effect is due to the fact that solids colliding against solids have collision times much smaller than collision times observed in a granular–granular collision, since, in the last case, collision times are determined by length scales of the order of the projectile itself, whereas in the first case, collision times are determined by the deformation produced during the process. This allows a mild braking of the granular projectile, leading to survival of large fragile fragments. Projectile’s fragments that sit over the surface of the central mound or close to the crater rim show no visible evidence of the impact, as can be seen in Fig. 11a, b. In addition, this braking effect produces a sudden velocity reduction of the ejected particles; the resulting velocity is much lower than the projectile’s initial velocity. For these ejected particles, we measured a velocity of 0.5 m/s for lateral ejection, and 1.1 m/s for isotropic ejection. Some fragments, ejected almost vertically, fall back into the crater, partially filling it, and many of them possess enough kinetic energy to produce small “secondary” craters within the primary crater or near it.

Projectile fragments. Large projectile fragments on top of the central mound are left intact with no visible compaction as can be seen in the upper part of a and b. The central mound is formed by the dynamic confinement suffered by the bottom section of the projectile during the collision event. Packing fraction of confined particles is 40 % higher than the value measured on the projectile before the impact
The bottom of the projectile suffers a compression, due to the dynamic pressure exerted by the moving particles and the target terrain. This leads to the formation of a standing triangular zone—the final mound (Fig. 12). Particles inside this zone reach a high packing fraction of approximately 66 %, while the original packing fraction of the projectile was 0.44 before the collision. This phenomenon has been observed in 2D vertical avalanche experiments (Amarouchene et al. 2001). In fact, a collision of a softly consolidated granular projectile can be interpreted as a granular avalanche. As stated above, the changes in thickness of strata are due to mobilized material or to changes in packing fraction induced by compression or dilatancy. However, image resolution allowed us to estimate the packing fraction changes only in the impactor’s material before and after the impacting event. Further research is planned in order to determine local packing fraction changes in the target strata by X-ray opacity measurements.

Dynamic confinement of the projectile. False color representation of the dynamic confinement of the projectile that leads to the formation of a triangle containing highly packed particles. These particles conform the central mound of the final crater. (Color figure online)
4.6 Target Constriction
We modified the thickness of the target box from 13 to 31 mm. Since the experiments were performed within Hele-Shaw cells, the restriction imposed by the confining front and rear walls enhances the dynamic confinement, due to Janssen effect. This means that lateral confinement due to this cell configuration produces a linear increment of the height of the confined material with the cell width, as shown in Fig. 13a. During these experiments, the diameter of the projectiles and their mass were kept constant. We observe qualitatively that, when the cell’s width is increased, the central mound’s slope is lower and the ejecta are more isotropic and finer. Moreover, the crater diameter reduces linearly with the increment of the cell’s width (Fig. 13b). This occurs because, since there is more confinement, the Janssen effect is larger, producing a central mound with a higher slope, and the fast vertical avalanche is able to change easier its direction of motion, producing a coherent and robust lateral motion of the granular flow that will enlarge the crater diameter and produce the ejecta.

Target box constriction effect. a Height of the dynamically confined projectile as a function of the Hele-Shaw cell width. b Diameter of the crater as a function of the Hele-Shaw cell’s width
4.7 Global Surface Topography
Stratigraphic analysis shows a thinning or a thickening of each layer in different zones of the crater. These variations in the layer’s local thickness are attributed to mobilization, compaction, and dilation that, in turn, produce changes in the target terrain’s packing fraction. The question arises on the degree of compaction of the terrain below the impactor, since large global changes in the height of the terrain take place there and in the crater rim.
Gravity anomalies in impact craters are associated to the density of target material. When a granular collision occurs, the crater floor is highly compacted, so an increment in density is expected. High-density materials or highly compacted regions show a positive gravity anomaly, while low-density materials or expanded regions show a negative anomaly. According to our experiments (see Fig. 14), the central region of the crater shows the highest compaction, due to negative area changes that cannot be compensated by the positive ones (crater rim). Moreover, if the impactor material is considered, it will account for an even larger increase in volume fraction or density at the crater’s bottom. On the contrary, regions with positive area changes, which correspond to the crater rims, have been highly sheared, implying Reynolds dilatancy and soft deposition of mobilized material and, consequently, low-density regions. Figure 14 shows the area changes, over the whole target terrain, of the uppermost layer (crater surface) depicted as a false-color diagram, following the standard colors used in gravimetric anomaly maps. There, red stands for a positive value (higher density), green represent no or very little variations and blue colors are used to show negative values (lower density). This area-change profile recalls the Pratt isostatic model for gravimetric anomalies observed in planetary craters.

Crater global area change. Changes in the area of the target terrain after the collision, depicted as a false-color map. Red sections correspond to a more compressed zone (reduction in the total area) observed in the crater floor, while the blue ones represent less compacted or expanded zones observed in the crater rims (increment in the total area). For reference purposes we included a picture of the crater that was analyzed for the production of this plot. (Color figure online)
It should be remarked that changes (before and after collision) in packing fraction were calculated only for the impactor, by measuring the final volume occupied by its deposit and fragments. On the other hand, compaction or dilation of individual strata were not measured due to technical limitations (X-ray opacity is proposed). However global area changes of the surface level calculated over the whole target terrain account for a net compaction below the crater floor (negative values, depicted in blue in Fig. 14) as compared to large values of sheared or dilated regions (positive area changes, depicted in red in Fig. 14). In this sense, the physical crater-opening picture of a compressive subduction—not an explosive excavation— as the main mechanism, is supported.
5 Conclusions
We performed granular–granular 2D impact experiments aimed to simulate collisions occurring during the early stages of planetary dust aggregation, at the light of the rubble-pile structure of asteroids recently observed. Craters are opened by compaction of the target, due to the dynamic pressure exerted by the projectile, forming flat-floored, domed and peaked structures. Avalanches of the projectile material sliding down the slope of some confined material exert pressure on the crater inner walls, enlarging its diameter and forming the ejecta. A layer inversion is produced on the crater rim, during the growth of the crater’s diameter.
Collisions between softly consolidated aggregates (ruble piles) at low energies allow deposition of most of the projectile material onto the target, due to dynamic confinement, promoting aggregate’s growth. On the contrary, deposition of the impactor onto the target is unlikely for solid–solid collisions or high-energy events, which, instead, would produce disaggregation.
We proposed that granular–granular collisions at low energies should be considered as a likely mechanism for aggregation of planetary dust and rocks, at forming granular asteroids and planetesimals, or for gravitational re-aggregation after catastrophic collisions.
Two-dimension experiments of granular–granular impact crater formation reveal how flat-aspect-ratio craters containing peaks and domes form, due to dynamic-pressure-associated phenomena (compression, erosion and confinement). Our technique represent a good way to observe and measure, with high spatial and temporal resolution, the full-step sequences of the crater formation, since it permits us to discern the inner phenomena occurring within the projectile and the target. Additionally, we have shown that increasing the thickness of the cell allows evaluating the effect of the front and rear walls during the compression and confinement of the impactor and target.
References
Y. Amarouchene, J.F. Boudet, H. Kellay, Dynamic sand dunes. Phys. Rev. Lett. V 86, 4286 (2001). doi:10.1103/PhysRevLett.86.4286
N. Artemieva, E. Pierazzo, Projectile material in Meteor crater. In European Planetary Science Congress Abstracts, Vol. 5, EPSC2010-182 (2010)
E. Asphaug, S.J. Ostro, R.S. Hudson, D.J. Scheeres, W. Benz, Disruption of kilometer-sized asteroids by energetic collisions. Lett. Nat. 393, 437–440 (1998). doi:10.1038/30911
E. Asphaug, E.V. Ryan, M.T. Zuber, in Asteroid Interiors, ed. by W.F. Bottke. Asteroid III (University of Arizona press, ISBN: 0-8165-2281-2, 2002)
J. Baer, S.R. Chesley, R.D. Matson, Astrometric masses of 26 asteroids and observations on asteroid porosity. Astron. J. 141, 143 (2011). doi:10.1088/0004-6256/141/5/143
G.K. Batchelor, An Introduction to Fluid Dynamics, Cambridge University Press, ISBN 9780521663960 (2000)
P.B. Bland, N.A. Artemieva, D.B.J. Bussey, G.S. Collins, K.H. Joy, Survival of asteroidal impactor material on the moon. In 70th Annual Meteoritical Society Meeting (2007), abstract 5251 (2007)
P.A. Bland, N.A. Artemieva, G.S. Collins, W.F. Bottke, D.B.J. Bussey, K.H. Joy, Asteroids on the moon: projectile survival during low velocity impact. Lunar Planet. Sci. XXXIX, abstract 2045 (2008)
D.T Britt, D. Yeomans, K. Housen, G. Consolmagno, Asteroids III, ed. by W.F. Bottke Jr., A. Cellino, P. Paolicchi, R.P. Binzel. Asteroid density, porosity, and structure (University of Arizona Press, Tucson, ISBN 0816 52281 2, 2002), pp. 485–500
E. Buhl, M. Poelchau, G. Dresen, T. Kenkmann, Scaling of sub-surface deformation in hypervelocity impact experiments on porous sandstone. Tectonophysics 634(2014), 171–181 (2014). doi:10.1016/j.tecto.2014.07.030
B. Carry, Density of asteroids. Planet. Space Sci. 73(1), 98–118 (2012). doi:10.1016/j.pss.2012.03.009
G.S. Collins, H.J. Melosh, J.V. Morgan, M.R. Warner, Hydrocode simulations of Chicxulub crater collapse and peak-ring formation. Icarus 157, 24–33 (2002). doi:10.1006/icar.2002.6822
G.S. Collins, H.J. Melosh, K. Wünnemann, Improvements to the ɛ-α porous compaction model for simulating impacts into high-porosity solar system objects. Int. J. Impact Eng. 38(6), 434–439 (2011). doi:10.1016/j.ijimpeng.2010.10.013
P. Descamps, F. Marchis, J. Pollock, J. Berthier, F. Vachier, M. Birlan, M. Kaasalainen, A.W. Harris, M. Wong, W. Romanishin, E.M. Cooper, K.A. Kettner, P. Wiggins, A. Kryszczynska, M. Polinska, J.F. Colliac, A. Devyatkin, I. Verestchagina, D. Gorshanov, New determination of the size and bulk density of the binary asteroid 22 Kalliope from observations of mutual eclipses. Icarus 192–2, 578–600 (2008). doi:10.1016/j.icarus.2008.03.014
K. Dohi, M. Arakawa, C. Okamoto, S. Hasegawa, M. Yasui, The effect of a thin weak layer covering a basalt block on the impact cratering process. Icarus 218(2012), 751–759 (2012). doi:10.1016/j.icarus.2012.01.018
A. Dufresne, M.H. Poelchau, T. Kenkmann, A. Deutsch, T. Hoerth, F. Schäfer, A. Thoma, Crater morphology in sandstone targets: the MEMIN impact parameter study. Meteorit. Planet. Sci. 48(1), 50–70 (2013). doi:10.1111/maps.12024
A. Fujiwara, J. Kawaguchi, D.K. Yeomans, M. Abe, T. Mukai, T. Okada, J. Saito, H. Yano, M. Yoshikawa, D.J. Scheeres, O. Barnouin-Jha, A.F. Cheng, H. Demura, R.W. Gaskell, N. Hirata, H. Ikeda, T. Kominato, H. Miyamoto, A.M. Nakamura, R. Nakamura, S. Sasaki, K. Uesugi, The rubble-pile asteroid itokawa as observed by Hayabusa. Science 312(5778), 1330–1334 (2006). doi:10.1126/science.1125841
T.J. Goldin, K. Wünnemann, H.J. Melosh, G.S. Collins, Hydrocode modeling of Sierra Madera impact structure. Meteorit. Planet. Sci. 41(Nr 12), 1947–1958 (2005). 2006
K.R. Housen, K.A. Holsapple, Scale effects in strength-dominated collisions of rocky asteroids. Icarus 142, 21–33 (1999). doi:10.1006/icar.1999.6206
K.R. Housen, K.A. Holsapple, M.E. Voss, Compaction as the origin of the unusual craters on the asteroid Mathilde. Nature 402, 155–157 (1999). doi:10.1038/45985
K.R. Housen, K.A. Holsapple, Impact cratering on porous asteroids. Icarus 163(1), 102–119 (2003). doi:10.1016/S0019-1035(03)00024-1
B.A. Ivanov, N.A. Artemieva, Numerical modeling of the formation of large impact craters. GSA Spec. Pap. 356, 619–630 (2002). doi:10.1130/0-8137-2356-6.619
H.A. Janssen, Versuche Uber Getreiedruch in silozellen. Z. Ver. Dtsch. Ing. 39(1045), 8 (1895)
K.H. Joy, M.E. Zolensky, K. Nagashima, G.R. Huss, D.K. Ross, D.S. McKay, D.A. Kring, Direct detection of projectile relics from the end of the lunar basin-forming epoch. Science 336, 1426–1429 (2012). doi:10.1126/science.1219633
W.T. Kelvin, Hydrokinetic solutions and observations. Philos. Mag. 42, 362–377 (1871)
M. Kiuchi, A.M. Nakamura, Relationship between regolith particle size and porosity on small bodies. Icarus 239(2014), 291–293 (2014). doi:10.1016/j.icarus.2014.05.029
D.A. Kring, Guidebook to the Geology of Barringer Meteorite Crater, Arizona (a.k.a. Meteor Crater). Lunar and Planetary Institute, LPI Contribution No. 1355 (2007)
L. Le Corre, V. Reddy, J.A. Sanchez, T. Dunn, E.A. Cloutis, M.R.M. Izawa, P. Mann, A. Nathues, Exploring exogenic sources for the olivine on Asteroid (4) Vesta. Icarus (2015). doi:10.1016/j.icarus.2015.01.018
D.F. Lupishko, On the bulk density of the M-type asteroid 16 Psyche. Sol. Syst. Res. 40(3), 214–218 (2006). doi:10.1134/S0038094606030051
C. Magri, G.J. Consolmagno, S.J. Ostrch, L.A.M. Benner, B.R. Beeney, Radar constraints on asteroid regolith properties using 433 Eros as ground truth. Meteorit. Planet. Sci. 36(12), 1697–1709 (2001). doi:10.1111/j.1945-5100.2001.tb01857.x
J.L. Margot, M.E. Brown, A low-density M-type asteroid in the main belt. Science 300(5627), 1939–1942 (2003). doi:10.1126/science.1085844
A. Morbidelli, W.F. Bottke, D. Nesvorny, H.F. Levison, Asteroids were born big. Icarus 204(2009), 558–573 (2009). doi:10.1016/j.icarus.2009.07.011
A.M. Nakamura, Cratering of asteroids and small bodies. Adv. Space Res. 29(8), 1221–1230 (2002). doi:10.1016/S0273-1177(02)00140-0
M.L. Nelson, D.T. Britt, L.A. Lebofsky, Review of Asteroid Compositions, ed. by M.L. Guerrieri. Resources of near-earth space (University of Arizona press, ISBN-13: 978-0816514045, 1994), pp. 493–522
V.R. Oberbeck, W.L. Quaide, Estimated thickness of a fragmental surface layer of Oceanus Procellarum. J. Geophys. Res. 72, 4697–4704 (1967)
D.P. O’Brien, R. Greenberg, J.E. Richardson, Craters on asteroids: reconciling diverse impact records with a common impacting population. Icarus 183(2006), 79–92 (2006). doi:10.1016/j.icarus.2006.02.008
F. Pacheco-Vázquez, J.C. Ruiz-Suárez, Impact craters in granular media: grains against grains. Phys. Rev. Lett. 107, 218001 (2011). doi:10.1103/PhysRevLett.107.218001
P. Paolicchi, A. Kryszczyńskab, Spin vectors of asteroids: updated statistical properties and open problems. Planet. Space Sci. 73(1), 70–74 (2012). doi:10.1016/j.pss.2012.02.017
T. Poppe, J. Blum, Experiments on pre-planetary grain growth. Adv. Space Res. 20(8), 1595–1604 (1997). doi:10.1016/S0273-1177(97)00817-X
P. Pravec, A.W. Harris, Fast and slow rotation of asteroids. Icarus 148(1), 12–20 (2000). doi:10.1006/icar.2000.6482
V. Reddy, L. Le Corre, D.P. O’Brien, A. Nathues, E.A. Cloutis, D.D. Durda, W.F. Bottke, M.U. Bhatt, D. Nesvorny, D. Buczkowski, J.E.C. Scully, E.M. Palmer, H. Sierks, P.J. Mann, K.J. Becker, A.W. Beck, D. Mittlefehldtj, J-Y.k Li, R. Gaskell, C.T. Russell, M.J. Gaffey, H.Y. McSween, T.B. McCord, J.-P.m Combe, D. Blewett, Delivery of dark material to Vesta via carbonaceous chondritic impacts. Icarus 221(2012), 544–559 (2012). doi:10.1016/j.icarus.2012.08.011
O. Reynolds, On the dilatancy of media composed of rigid particles in contact, with experimental illustrations. Philos. Mag. Ser. 5 20, 469–481 (1885)
O. Reynolds, Experiments showing dilatancy, a property of granular material, possibly connected with gravitation. Proc. R. Inst. G. B. 51, 217–227 (1886)
J.C. Ruiz-Suárez, Penetration of projectiles into granular targets. Rep. Prog. Phys. 76, 066601 (2013). doi:10.1088/0034-4885/76/6/066601
P. Sánchez, D.J. Scheeres, The strength of regolith and rubble pile asteroids. Meteorit. Planet. Sci. 49(5), 788–811 (2014). doi:10.1111/maps.12293
D.J. Scheeres, C.M. Hartzell, P. Sánchez, M. Swift, Scaling forces to asteroid surfaces: the role of cohesion. Icarus 210(2010), 968–984 (2010). doi:10.1016/j.icarus.2010.07.009
S.R. Schwartz, P. Michel, D.C. Richardson, H. Yano, Low-speed impact simulations into regolith in support of asteroid sampling mechanism design I: comparison with 1-g experiments. Planet. Space Sci. 103(2014), 174–183 (2014). doi:10.1016/j.pss.2014.07.013
E.M. Shoemaker, Penetration mechanics of high velocity meteorites, illustrated by Meteor crater, Arizona. In International Geological Congress, 21st, Copenhagen (1960), pp. 418–434
R. Sullivan, R. Greeley, R. Pappalardo, E. Asphaug, J.M. Moore, D. Morrison, M.J.S. Belton, M. Carr, C.R. Chapman, P. Geissler, R. Greenberg, J. Granahan, J.W. Head III, R. Kirk, A. McEwen, P. Lee, P.C. Thomas, J. Veverka, Geology of 243 Ida. Icarus 120(1), 119–139 (1996). doi:10.1006/icar.1996.0041
P.C. Thomas, Large craters on small objects: occurrence, morphology, and effects. Icarus 142, 89–96 (1999). doi:10.1006/icar.1999.6211
J. Veverka, P. Thomas, A. Harch, B. Clark, J.F. Bell III, B. Carcich, J. Joseph, NEAR encounter with asteroid 253 Mathilde: overview. Icarus 140, 3–16 (1999). doi:10.1006/icar.1999.6120
J. Veverka, M. Robinson, P. Thomas, S. Murchie, J.F. Bell III, Chapman, N.C. Izenberg, A. Harch, M. Bell, B. Carcich, A. Cheng, B. Clark, D. Domingue, D. Dunham, R. Farquhar, M.J. Gaffey, E. Hawkins, J. Joseph, R. Kirk, H. Li, P. Lucey, M. Malin, P. Martin, L. McFadden, W.J. Merline, J.K. Miller, W.M. Owen Jr, C. Peterson, L. Prockter, J. Warren, D. Wellnitz, B.G. Williams, D.K. Yeomans, NEAR at Eros: imaging and spectral results. Science 289(5487), 2088–2097 (2000). doi:10.1126/science.289.5487.2088
H. von Helmholtz, Über discontinuierliche Flüssigkeits-Bewegungen. Mon. Rep. R. Prussian Acad.Philos. Berlin 23, 215–228 (1868)
K. Wada, H. Senshu, T. Matsui, Numerical simulation of impact cratering on granular material. Icarus 180(2006), 528–545 (2006). doi:10.1016/j.icarus.2005.10.002
S.L. Wilkison, M.S. Robinson, P.C. Thomas, J. Veverka, T.J. McCoy, S.L. Murchie, L.M. Prockter, D.K. Yeomans, An estimate of Eros’s porosity and implications for internal structure. Icarus 155, 94–103 (2002). doi:10.1006/icar.2001.6751
S. Yamamoto, K. Wada, N. Okabe, T. Matsui, Transient crater growth in granular targets: an experimental study of low velocity impacts into glass sphere targets. Icarus 183(2006), 215–224 (2006). doi:10.1016/j.icarus.2006.02.002
Z. Yue, B.C. Johnson, D.A. Minton, H.J. Melosh, K. Di, W. Hu, Y. Liu, Projectile remnants in central peaks of lunar impact craters. Nat. Geosci. 6, 435–437 (2013). doi:10.1038/ngeo1828
Acknowledgments
Authors acknowledge support from Conacyt CB 221961 Grant, and D. Sarocchi from Instituto de Geología, UASLP, for allowing us to use his facilities. GM. Rodríguez-Liñán and R. Bartali acknowledge Conacyt for Ph.D. scholarships Nos. 358584 and 45697, respectively. We wish to thank anonymous reviewers for their comments that improved this manuscript.
Author information
Authors and Affiliations
Corresponding author
Ethics declarations
Conflict of interest
Yuri Nahmad-Molinari has received grants from CONACYT. Roberto Bartali and Gustavo M. Rodríguez-Liñán declare that they are members and collaborators in the Project headed by Yuri Nahmad-Molinari, so all the authors declare that there are no conflict of interest.
Rights and permissions
About this article

Cite this article
Bartali, R., Nahmad-Molinari, Y. & Rodríguez-Liñán, G.M. Low Speed Granular–Granular Impact Crater Opening Mechanism in 2D Experiments. Earth Moon Planets 116, 115–138 (2015). https://doi.org/10.1007/s11038-015-9475-9
Received:
Accepted:
Published:
Issue Date:
DOI: https://doi.org/10.1007/s11038-015-9475-9