
Abstract
Are countries at a low level of socio-economic development catching up with developed countries over time or rather falling further behind? Existing work on the subject is not conclusive, partially due to methodological differences. The aim of the paper is to carry out a broader analysis with longer time series and a more diverse set of indicators. The study divides countries of the world into 21 developed “benchmark” countries and 156 developing countries. The distance between the benchmark and developing countries is measured using the “time lags” method, applied here to nine indicators covering topics such as the economy, health, education and the environment. The study further utilizes a probabilistic approach to extrapolate missing historical data for developing countries, so that the analysis can cover a full century starting in 1920 and ending with short-term projections to year 2020. The study finds that a majority of developing countries, and the population-weighted developing world as a whole, has reduced its lag in most indicators between 1920 and 2020. Progress was unevenly distributed, with East Asian and European countries converging the most with the benchmark, while most African countries have diverged along with some American ones. Catch-up in education attainment and life expectancy has been more successful than in infant survival rate, GDP per capita or technology adoption. The findings are put in context of United Nations’ Sustainable Development Goals, showing how the time lag method could improve setting targets for some of the goals. Further, time lags are used to analyze the current demographic, economic and political situation of developing countries, identifying opportunities and risks for future catch-up with developed countries.
1 Introduction
The problem of disparities between developed and developing countries has long been an interest of scientists (Barro and Sala-i-Martin 1992; Baumol 1986). The origin of this global inequality is seen in the Enlightenment and the Industrial Revolution, which brought wealth to some countries, leaving the rest behind (Deaton 2014; Piketty 2014). Maddison (2001, 2008) has shown that the divergence in income and life expectancy has started even earlier—already by the beginning of the early modern era. This raises questions about the trajectory of recent and future inequality between countries, which is considered a major problem that needs to be addressed globally (ISSC et al. 2016). For instance, Sustainable Development Goal 10 is to “reduce inequality within and among countries” (United Nations 2018a). Numerous studies have investigated time series of various development indicators (primarily income, health and education indicators) across countries of the world in order to determine whether countries are converging (i.e. inequality between them is decreasing) or diverging (increasing inequality). They have shown evidence for both divergence (Decancq et al. 2009; Mazumdar 2003; McGillivray and Pillarisetti 2004; Milanovic 2005), with Pritchett (1997) declaring „divergence, big time”, and convergence (Kónya and Guisan 2008; McGillivray and Markova 2010; Jordá and Sarabia 2015; Jordá and Niño-Zarazúa 2017), with Sala-i-Martin (2006) declaring in dissent “convergence, period!” The lack of consensus in the findings is caused by the use of different developments indicators, sets of countries, time frames, and methodologies. Milanovic (2012) has shown that the Gini coefficient indicated an increase in inequality (divergence) between countries of the world between 1952 and 2011 if average GDP per capita or mean income of countries is considered. Yet, if average income is assigned to individual citizens of countries, the Gini coefficient will show a decrease in inequality (convergence).
There are two main concepts of convergence. One is “Beta” convergence, which proposes that poorer countries (or regions of countries) growth faster than richer ones and therefore catch-up on them (Barro and Sala-i-Martin 1992; Monfort 2008). The concept originates from Solow’s (1956) neoclassical growth theory, which postulates that factors of production, mainly capital, are subject to diminishing returns. In the long run, a steady-state should be reached depending only on exogenous factors (technological progress, labor growth). However, it was argued that countries in fact converge towards different steady-states (Quah 1993), hence poor countries will not necessarily catch-up with richer ones. Therefore, the concept of “Sigma” convergence was proposed (Sala-i-Martin 1996), indicating simply a reduction in dispersion between countries or regions as they converge towards different steady-states. In contrast to “Beta” convergence, “Sigma” convergence can be inspected with a variety of methods, e.g. coefficient of variation or Gini, Theil and Atkinson indices (Monfort 2008).
The problem with the convergence concepts is that they were created in context of economic development and income growth. Application to other measures of well-being is problematic. Noorbakhsh (2006) suggested that the concept of diminishing returns is also applicable to health and education indicators. This is because e.g. college education is more expensive than primary education and improvements in life expectancy in developed countries rely on advanced medical technology in contrast to low-cost prevention and treatment options that can easily reduce mortality in developing countries (Jordá and Sarabia 2015). Still, existing measures of “Beta” and “Sigma” convergence have some general weaknesses. First, they are intended to compare the disparity of a group of countries (or regions) and not the distance between particular countries. Hence, they do not indicate the extent of effort needed by poor countries to reach the rich ones, or in other words, how far behind they are. It is also not possible to compare how far behind (or lagged) the poor countries are in different indicators, namely which indicator requires more attention due to a greater lag than other indicators.
A different approach to analyze convergence, which forms the basis of this study, is the “time lag” method. This simple concept had its first dedicated study with Comin et al. (2008), who applied it to explain adoption rates of different technologies. The paper illustrated the concept with the following question: “how many years before the year 2000 did the United States last have the real gross domestic product (GDP) per capita that China had in 2000?”. As the authors’ data revealed, it was in 1894, which translates into a time lag of 106 years. If China’s time lag would increase over time, it would mean that its GDP per capita growth rate was lower than in the United States, when it was at the same level of economic development. Several authors followed-up this study with analyses of transportation, communication or medical technology adoption time lags for various demographic and economic applications (Comin and Hobijn 2010; Ferraro 2017; French 2014; Jovanovic 2009).
Still, utilization of the method to other socio-economic development indicators has been limited so far. Paprotny (2014) used GDP per capita and three demographic indicators of mortality to show that Poland largely failed to converge with a group of 25 developed countries, except for technology adoption. Paprotny (2016) expanded the analysis to central and eastern European countries and added employment in agriculture as an indicator of the modernity of the economy. The results have broadly shown slight catch-up with developed countries. The latter study has shown how time lags could be used to set convergence indicators in the context of European Union’s cohesion policy, and development goals in context of national development strategies made by European countries. The time lags reveal how many years a country is behind the frontier in economic, social and technological development, and which indicator requires most effort as it has the highest number of years to catch-up.
The aim of this paper is to analyze convergence between a “benchmark” comprising a group of developed countries and the rest of the world using the time lag method. The study builds upon data and methods described in Paprotny (2016), but expands its scope from central and eastern Europe to the whole world, introducing additional indicators of development, and improving data collection and processing. The starting point of analysis is year 1920, in the aftermath of the First World War. This date was chosen due to the data availability, which is reduced substantially in earlier years. The study then incorporates short-term projections up to year 2020 in order to round off a full century. It should be noted that this study was completed before the start of the COVID-19 pandemic and that projections for year 2020 do not include the severe economic disruption brought by the epidemic, extent of which was uncertain at the time of writing.
The paper is organized as follows: Sect. 2 describes the time lag method, selection of benchmark and developing countries, the indicators of socio-economic development and finally handling of missing country-level data. Details of the data sources and the subdivisions of the world used to synthesize the results are provided in the Appendices. Section 3 presents the results firstly by giving a global overview and then providing more details on major parts of the developing world. Section 4 analyses the demographic and political factors that could influence future progress in developing countries, looks into next research steps and possible applications of the method and results. The paper draws conclusions in Sect. 5. The complete time lag dataset and graphs from the study are available on figshare (https://doi.org/10.6084/m9.figshare.9436514).
2 Materials and Methods
2.1 The Time Lag Method
The time lag method can be illustrated with the following example. The mean number of years of schooling attained by people in Bangladesh in 2017 was 5.8 years, according to the United Nations Development Programme (2018). By comparison, the mean years of schooling in Iceland exceeded 5.8 years already in 1960 (Barro and Lee 2013) and, until 2017, the indicator’s value hasn’t fallen below that threshold. Consequently, Bangladesh can be said to lag Iceland in terms of educational attainment of its population by 57 years. The method can be also written more formally (Comin et al. 2008; Paprotny 2016). An observation \(X_{d,t}\) of the value of an indicator in a developing country \(d\) in year \(t\) (e.g. mean year of schooling in Bangladesh in 2017) can be compared with a set of observations \(\left\{ {X_{b,s} } \right\}\) for a developed (benchmark) country \(b\), indexed by \(s\) (e.g. Iceland, with annual observations between 1870 and 2017). The result will be a set of observations of \(s\) during which the value of \(X_{d,t}\) has been lower or equal to \(\left\{ {X_{b,s} } \right\}\). The year after the last year of this set of observations will be the starting year of uninterrupted observations higher than \(X_{d,t}\), denoted \(\bar{s}_{b}\):
where \(S\) is the entire set of observations for country \(b\), assumed here to be without any gaps in the annual time series. Using the aforementioned example of Bangladesh and Iceland, \(\bar{s}_{b} = 1960\). As there are multiple developed countries that could be compared against, the time lag \(L_{d,t}\) will be:
where \(B\) is the number of benchmark countries. For Bangladesh in 2017, using a set of 21 benchmark countries (see Sect. 2.2), \(L_{d,t} = 73.0\). In other words, Bangladesh lags behind developed countries in terms of educational attainment of its population by 73 years on average. Positive values of time lags \(L_{d,t}\) indicate lower level of development for country \(d\) in year \(t\), compared with developed countries, while negative values are possible if it is ahead of a majority of developed countries already.
Equation (1) is valid for indicators with values increasing over time. Yet, one of the indicators used in this study (described in Sect. 2.3) decreases when countries achieve higher level of development. Therefore, Eq. (1) is slightly modified as follows:
while Eq. (2) remains the same. It should be further noted that Eq. (2) uses a simple average of time lags of individual developed countries. As noted in Paprotny (2016), this makes the analysis more comparative, since a population-weighted average would result in large countries such as the United States, Japan and Germany dominating the analysis.
2.2 Study Area
Selection of countries and territories for the analysis required consideration of possible limitations in data availability as well as changes to the political divisions of the world in the past century. To the extent possible, present-day borders were used throughout. As a starting point of country selection, ISO 3166 standard (International Organization for Standardization 2019) was used to identify 249 countries and territories, with one additional territory (Kosovo) added from the databases of the World Bank (2019). The first selection criterium was the population figure, which had to exceed 250,000 as of mid-2019 (Fig. 1). This was done to remove very small countries that typically have very limited data available. The population data were obtained from United Nations (2019). The remaining 187 countries were split according to whether they are independent (according to information contained in ISO 3166) or not. All independent states were assumed to have sufficient data, while non-independent territories were assessed individually. In the end, only four such territories were included in the analysis (Hong Kong, Kosovo, Puerto Rico and Taiwan). For brevity, the term “country” will be used henceforth to encompass all territories, present-day or defunct, included in the study irrespective of their international status.
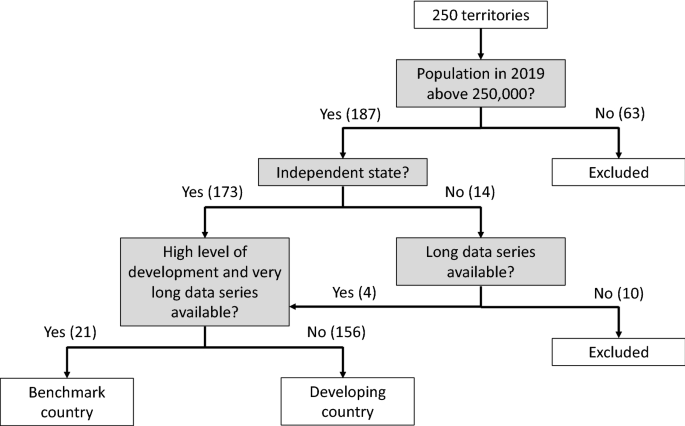
Selection of benchmark (developed) and developing countries for the analysis
The remaining 177 countries were divided into benchmark (developed) and developing countries. Benchmark countries are those that have been among the most developed countries in the world in the past century and at the same time have very good availability of very long data series, i.e. going back into the nineteenth century; 21 such countries have been identified: Australia, Austria, Belgium, Canada, Denmark, Finland, France, Germany, Iceland, Ireland, Italy, Japan, Luxembourg (except indicator “GDP per capita”), the Netherlands, New Zealand, Norway, Spain, Sweden, Switzerland, the United Kingdom and the United States. Compared to Paprotny (2016), the list of benchmark countries was reduced by two through the exclusion of Greece and Portugal, as they have been increasingly falling behind the other developed countries in recent years. Overall, the 21 countries constituted exactly 12% of world population in 2019, according to the United Nations (2019). All benchmark countries are member states of the Organisation for Economic Co-operation and Development (OECD), a club comprising only developed countries.
The other 156 countries will be referred to as “developing” countries. They represent 87.84% of the global population as of 2019, which means the study only excludes entities containing barely 0.16% of the world’s inhabitants (12 million). Due to geopolitical changes in the past century, nine “aggregate” countries had to be created, representing countries that have split into smaller states, but historical data is available mostly for those defunct states rather than their successors. The reader is referred to “Appendix 1” for a list of such cases. To synthesize the large amount of country-level information, the results mostly refer to various country groupings. Several divisions of the world are referred to here: Sustainable Development Goals (SDG) regions, United Nations subregions, United Nations development regions (More, Less and Least developed, Land-Locked Developing Countries, Small Island Developing States), geographical continents and World Bank income groups (Low, Lower-middle, Upper-middle and High income). However, those divisions had to be adjusted to fit the political division of the world including the nine aggregate countries. Maps in “Appendix 1” show the grouping of countries into eight SDG regions and four income groups, as those divisions are used most frequently in the analysis. Detailed listing of all countries and regions is provided in Supplementary Information 1. In the paper, the time lags for regions (and the developing world altogether) are calculated primarily on the basis of population-weighted indicators for individual countries. An alternative calculation using the median value of an indicator per region was also made, but the results are only mentioned when they led to different conclusions than results from the other method.
2.3 Indicators
The study utilizes nine indicators, as listed in Table 1. Their choice was broadly practical given the aim of the paper to track long-term development. Datasets with historical statistics on various topics were investigated for comparable (across time and countries) indicators with at least century-long time series, e.g. International Historical Statistics by Mitchell (1993, 1998a, b), CLIO Infra (2019) database and almost a century of yearbooks by the League of Nations and United Nations. Relatively few indicators have been calculated commonly enough to provide a global long-term outlook. Seven out of nine indicators were also used in Paprotny (2016), who discussed those and several other potential indicators. He noted that some indicators are strongly influenced by geographical factors. For instance, agricultural efficiency depends on climate, soils and availability of land (some countries practice low-yield extensive farming and others high-yield intensive farming). Electricity consumption depends on the climate and availability of energy production sources within the country (fossil fuels, hydropower). Other indicators are not comparable between countries due to great variation in definition of particular phenomena (e.g. urban population share, crime statistics). Some have no definite direction in which an indicator changes with progress (e.g. industrial share of labor or economy, gender inequality in labor or education, income inequality). Adoption of technologies, analyzed by various authors with time lags, can be used only for those technologies that were used throughout the study’s timeframe (1920–2020). Therefore, modern technologies such as computers or internet are not applicable (Ferraro 2017).
Thanks to improved data availability from new research datasets, it was possible to add two indicators (compared with Paprotny 2016). They expanded the coverage into the domain of education (education attainment) and environment (CO2 emissions index), apart from the economy, health and technology adoption in transport and communications. All indicators could be connected to the Sustainable Development Goals (United Nations 2018a), especially goals 3 (Good Health and Well-Being), 4 (Quality Education), 7 (Affordable and Clean Energy), 8 (Decent Work and Economic Growth) and 9 (Industry, Innovation and Infrastructure). Wider use of SDGs is not possible, as few of the goals are quantified and measurable (McArthur and Rasmussen 2019) and long data series for the whole world are available for even fewer goals.
Mean years of schooling is an indicator of educational attainment preferable to enrollment rates, as it synthesizes multiple levels of education in one variable. Recently, the mean years of schooling has replaced literacy rate in the Human Development Index (United Nations Development Programme 2018). Enrollment ratios were replaced by the expected years of schooling in the index. However, long-term data are not available for either indicator of youth education, therefore we can only analyze here information on the education level of adults. An index of CO2 emissions measures progress towards clean energy sources. However, emissions per unit of gross domestic product (GDP) rise at first when countries industrialize—peak emissions relative to the size of the economy were achieved in the benchmark countries between 1880s (United Kingdom) and 1980s (Australia), according to the data collected here (see “Appendix 2”). Additionally, emissions per unit of GDP vary substantially between countries due to the different structures of the economy or availability of alternative energy sources such as hydropower. Therefore, the emissions index was constructed by first identifying peak emissions per GDP using a 5-year moving average. This average emission value forms the basis of the index. Emissions after the year of the peak are divided by the baseline emission. Then, the baseline emission is divided by the emissions that have occurred before the year of the peak. In this way, an index with a downward trajectory is achieved, representing at which stage of transition from agricultural to industrial and finally post-industrial economy is the country in question.
Definitions of the indicators and data sources are described in “Appendix 2”. The data for benchmark and developing countries were handled separately, largely due to the different timeframes of the two. Data on the benchmark countries had to be more extensive in order to provide adequate comparison to the developing countries. As a result, the time series for the benchmark countries cover three centuries (1800–2100) instead of only one century for developing countries (1920–2020). On occasion, such a long time series might not be enough for comparison, e.g. GDP per capita in Ghana in 1980 was lower than at any point of time since 1800 in the Netherlands. In such occurrences, the value of \(\bar{s}_{b}\) was set to 1800 or 2100, except for the late-nineteenth century inventions, passenger cars and telephones, for which the oldest data series begin in 1895 and 1876, respectively.
The dataset for benchmark countries is largely based on the data collected in Paprotny (2016), but it was expanded, thoroughly revised with latest estimates and projections, and amended with new sources of historical statistics. The primary source of data were national statistical institutes’ publications and databases of all 21 benchmark countries, with other sources being used mainly when national data were not obtainable directly or the use of international resources offered better comparability of the data. By contrast, the data on the 156 developing countries were collected specifically for this study, using compilations of data by international organizations as the main resource, supplemented by databases of historical statistics produced by researchers. Due to the amount of territories involved, the use of country-specific sources was limited.
2.4 Data Gap-Filling
Data collection efforts have been extensive, but the dataset of indicators is not free of missing information. Where possible, the data was interpolated linearly between available records. For the developing countries, a small number of pre-1920 data points were collected specifically for interpolation with data referring to years after 1920. Similarly, GDP per capita figures for some benchmark countries before 1820 were interpolated using estimates for year 1700 from Maddison (2010). Remaining data had to be extrapolated. The dataset for the benchmark countries was amended as in Paprotny (2016). For future projections up to 2100, available demographic and economic projections were used, with other indicators extrapolated using growth rates for the benchmark countries as a whole (see “Appendix 2” for details per indicator). For backwards projections to year 1800, it was assumed that the values of an indicator for a country with missing data changed by the same rate as in a geographically proximate country, for which data are available. For example, change in life expectancy in Sweden during 1800–1846 is used to extrapolate values of this indicator for Norway, where available data series start in 1846. However, due to the large number of developing countries, the method is not practical and further doesn’t provide information on the uncertainty of the extrapolation. Consequently, a different, probabilistic method was applied.
Extrapolation of the data for developing countries utilizes a similar approach to a series of research on probabilistic projections of demographic indicators (Alkema et al. 2011; Raftery et al. 2014; Azose and Raftery 2019). It relies on predicting future changes in the values of an indicator based on the observed changes between values at timesteps \(t\) and \(t - 1\). By modelling the bivariate distributions of an indicator at those two timesteps it is possible to predict, with uncertainty bounds, the change of the indicator from any given timestep to the next one. The bivariate dependency is modelled here through copulas, which are, loosely, joint distributions on the unit hypercube with uniform [0, 1] margins. They are applicable to any continuous joint distribution (Morales-Nápoles et al. 2017). Firstly, random variables \(X_{t}\), \(X_{t - 1}\) and \(X_{t + 1}\) are derived from the nine indicators involved, using a dataset combining the data for the benchmark and developing countries, the latter without interpolations. Then, they are transformed to [0, 1] margins and correlated (through Spearman’s rank correlation) in two pairs: \(X_{t}\) with \(X_{t + 1}\) and \(X_{t}\) with \(X_{t - 1}\). The first pair is used to extrapolate values after the last year of data for a given country forward, and the other for the same purpose, but in the opposite direction (backwards projection).
The pairs of transformed margins were fitted to four one-parameter copula types (Gaussian, Gumbel, Clayton, Frank), representing various dependency structures (Joe 2014). For each pair and indicator, an optimal copula type was chosen utilizing a goodness-of-fit test statistic. It is based on the Cramèr–von Mises statistic \(M\), described by Genest et al. (2009), which is the sum of squared differences between the empirical and the parametric copulas:
where \(B\left( \varvec{u} \right) = \frac{1}{n}\sum 1\left( {U_{i} \le \varvec{u}} \right)\) is the empirical copula, \(C_{{\hat{\theta }_{n} }} \left( \varvec{u} \right)\) is a parametric copula with parameter \(\hat{\theta }_{n}\) estimated from the sample of length \(n\). In most cases, Frank copula was the best dependency model (11 out of 18), followed by Clayton (5) and Gumbel (2), with no instances of the Gaussian copula. The equations of the Frank, Clayton and Gumbel copulas are as follows:
where \(u,v \in \left[ {0,1} \right]\) are the copula margins, while \(\theta\), \(\alpha\) and \(\delta\) are the Frank, Clayton and Gumbel copula-specific parameters, fitted in the modelling process. Once the copula models and their margins (priors) are defined, they can be sampled to obtain a posterior distribution of \(v\) given \(u\). In order to calculate a time series of projected values, a Markov Chain Monte Carlo simulation is carried out. This means that at each timestep a single sample is drawn from the posterior distribution of \(v\) given \(u\), and that sample becomes the conditionalizing value of \(u\) margin. The process is repeated until the desired timestep is reached. The process is repeated 1000 times to obtain 1000 random trajectories of a given indicator in a given country. The median value and uncertainty bounds (e.g. 95% confidence interval) could be obtained. Figure 2 presents the final indicator values aggregated for benchmark and developing countries.

Raw values of development indicators. Population-weighted averages for benchmark countries (1800–2100) and developing countries (1920–2020). 95% confidence interval for developing countries indicates the uncertainty in extrapolation of indicators for some countries
It should be noted that data for the CO2 emissions index had to be handled slightly differently. First, the median predictions of GDP per capita using the method highlighted above were used to fill gaps in economic data when computing emissions per unit of GDP. Then, the extrapolation was done on the dataset of emissions per GDP unit directly, rather than on the converted index. For each of the 1000 Markov Chain Monte Carlo simulations the index was computed separately, so that the uncertainty related to the year of the peak emissions is included in the overall uncertainty of the emissions index.
Validation of the extrapolation method was carried out by abbreviating the dataset to year 1990 and analyzing the accuracy of predictions up to year 2020. Out of 161 countries (including 9 aggregate countries) for which data are available, GDP per capita in year 2017 was within the 80% confidence interval in 77 cases (48%) and within the 95% confidence interval in 124 cases (77%). For infant mortality rate, the number of predicted values for 2017 within the 80% and 95% intervals were 138 (84%) and 157 (95%) out of 165, respectively.
3 Results
3.1 Global Overview
Results for the developing world as a whole indicate moderate catch-up to the benchmark countries in the century since 1920 (Fig. 3). In 1920, the developing world was lagging 70 years or more in seven indicators (all but the adoption of much more novel inventions of cars and telephones), especially for GDP per capita, by 103 years. The lag was increasing until around year 1950 and then declining until the 1970s. The progress after the Second World War was driven mainly by countries in the present-day upper-middle income group (Fig. 4), e.g. in eastern Europe (postwar reconstruction) and Western Asia (beginning of large-scale oil production). Since 1980, those countries haven’t converged further with the benchmark, but it was rather lower-middle income countries (mostly in Southern Asia) that cut their time lag by almost half. This positive effect on the developing world was, however, countered by low-income (mostly African) countries, which diverged from benchmark countries without interruption during the whole century. All income groups except high income (no trend in time lag throughout) started at the same level in the 1920s, but the low-income group diverged from the upper-middle income in the 1930s, and from the lower-middle income in the 1970s (Fig. 4). The lack of economic catch-up of the developing world in recent decades despite very high growth in the most populous countries (China and India) can be explained by the fact that the current lag of 65 years to an average benchmark country corresponds to a time when the developed world was experiencing exceptionally high growth after the Second World War. Still, many developing countries have had lower economic growth than the Asian developed countries, hence the median time lag in GDP per capita for developing countries declined by only 23 years (97 to 74 years) compared to 38 years for the population-weighted score for developing world (Fig. 4).

Time lags (inverted scale) for the developing world per indicator with the 95% confidence intervals, with population-weighting of countries or the median value of developing countries

Time lags (inverted scale) for developing countries by World Bank income groups per indicator, population-weighted without uncertainty bounds
The time lag in non-agricultural employment share, an indicator of the modernity of the economy, declined in the developing world in the past century from 101 to 89 years, but increased for a median developing country, from 75 to 80 years (Fig. 3), though there is considerable uncertainty in the findings due to scarce pre-1950 evidence. From a low point around 1960, countries other than high-income diverged (Fig. 4). Upper-middle income countries made good progress after 1980, but almost entirely thanks to the Chinese economy, as a median country in this group actually increased its lag since 1980 after a decline between 1960 and 1980. The lower-middle income group has shown considerable catch-up since year 2000, also for a median country in the group. Low-income countries only managed to stop further increase of the lag in the late 2000s (Fig. 4).
Three health indicators included here largely follow a similar pattern, also when considered at the aggregation level of income groups. The developing world is currently behind almost 60 years in life expectancy and infant survival rate, with most progress made in female life expectancy (Fig. 3). Yet, almost all progress in catching-up with the developed world has been made before 1960, though with high uncertainty for the actual pre-1950 trajectory for male life expectancy and infant survival rate. Since the 1960s, the catch-up process has stalled in all income groups and indicators (Fig. 4). The findings are largely the same for population-weighted and median time lags.
Adoption of two important technologies, passenger cars and telephones followed quite different patterns especially in recent years. There has been almost constant increase in time lag since 1920 for cars, in all income groups (Fig. 4), so that car usage is presently lagging by more than 60 years (Fig. 3). High-income countries were actually slightly ahead of an average benchmark country around the year 1930, but have been increasingly falling behind, only reversing this trend in the most recent decade (Fig. 4). The time lag in telephone usage follows interesting patterns when split by income groups, as all of them recorded declines until a particular moment of reversal of the trends. For high-income countries, this happened around 1970, upper-middle income around 1980, lower-middle income around 1990 and lower income around 2000. Still, it was only with the advent of mobile telephony that all countries achieved very fast catch-up with the developed world. High-income developing countries have now even more telephones per 1000 persons than an average benchmark country (Fig. 4). Overall, the time lag for telephone usage in the developing world increased from 31 years in 1920 to a maximum of 57 years in 1983 and is projected to decline to 15 years in 2020 (Fig. 3).
Education attainment in the developing world was lagging by 89 years in 1920 and remained almost unchanged until 1960 (Fig. 3). Since then, significant catch-up was achieved, though mainly before year 1990. The convergence was heavily driven by China and, from 1980, India. Still, noticeable improvements have been made by low-income countries since 1980 (Fig. 4) and they continue until the most recent years, whereas progress in the middle-income countries has stalled. High-income countries were continuously not far behind the benchmark throughout the whole century.
The final indicator, CO2 emissions index, represents the progress in transition from low-emission to high-emission economies and back. In general, the time lag of the developing world has declined by more than half, from 70 to 34 years (Fig. 3). However, convergence has largely stopped around 1990 in all income groups except the low-income countries (Fig. 4). The time lag for upper-middle income countries is lower than in the high-income group, which is the only such occurrence here. However, this is largely due to the fast-paced developments in China, which is slightly ahead of the benchmark. A median upper-middle income country is still further behind the developed world than a median high-income country. The time lag for a median developing country has fallen less than in the population-weighted score, from 64 to 39 years in the past century (Fig. 3).
Results aggregated to the three United Nations development categories (More, Less and Least developed) show very similar patterns as for income groups. More developed countries (Europe and former USSR) converged with the benchmark countries between 1920 and 1960 in most indicators, then have fallen behind, reversing the negative trend from around year 2000. Least developed countries have increasingly diverged in the economic indicators (GDP per capita and employment outside agriculture) not only from the benchmark group, but also from the less developed countries. However, the least developed group has seen progress in recent decades regarding telephone usage, educational attainment and CO2 emissions. Land-Locked Developing Countries (LLDC) have very similar results to low-income or least developed countries, diverging from non-LLDC in economic indicators, but developing largely in parallel in other variables. Small Island Developing States (SIDS), another special UN grouping, has actually smaller lag in eight indicators (all except the CO2 emissions index) in population-weighted terms than non-SIDS countries. Using the median lag, SIDS are ahead of non-SIDS also in eight indicators, with the exception of GDP per capita.
Finally, plotting time lags per country (Fig. 5) it is clear that the time lags are highly prevalent over time and few countries have radically improved or fallen behind. The indicator-averaged time lag in 2020 was found to be highly correlated with the lag both in 1970 (R2 = 0.81) and 1920 (R2 = 0.65). Though more countries reduced their lags than didn’t, the diversity within the developing world has increased.

Comparison of indicator-averaged time lags between different years (inverted scales)
3.2 Regional Perspectives
The regional findings are presented here split by eight regions based on Sustainable Development Goals (SDG) regions with reference to UN subregions. Snapshots of average time lags per countries (at modern borders) are presented in Fig. 6, while lags per indicator and SDG region are shown in Fig. 7. Graphs for individual countries as well as various country groups can be downloaded from figshare (https://doi.org/10.6084/m9.figshare.9436514).

Time lags per country, simple average of all indicators, 1920 (a), 1970 (b) and 2020 (c). Small countries represented as points. Country boundaries from EuroGeographics (Eurostat 2019), Robinson projection

Time lags (inverted scale) for developing countries by SDG region per indicator, population-weighted without uncertainty bounds
3.2.1 Sub-Saharan Africa
Sub-Saharan Africa, i.e. without the northernmost countries of the continent, has the highest time lag measured as a simple average of all indicators. Also, it has increased since 1920 from 75 to 83 years. It has particularly fallen behind in economic indicators and passenger car usage, though the lag in GDP per capita has been declining since reaching maximum value in 2001. The region has reduced its time lag in life expectancy to benchmark countries by a third until the AIDS epidemic reversed the trend around 1990, with the time lag in Southern Africa reaching highest ever value in the 2000s. Since 1920, the lag in infant survival increased except in Southern Africa, though the gains in that subregion where concentrated in the first half of the century. The region has the highest concentration of poorly-performing countries, with 9 out of 10 countries with the highest increases in indicator-averaged time lag located here. Somalia, Burundi, the Central African Republic, Guinea-Bissau, and Sierra Leone have experienced the biggest increases. Only 5 out of 46 countries assessed in the region reduced their indicator-averaged time lag, with most progress made by Botswana, Mauritius, and Gabon.
3.2.2 Northern Africa and Western Asia
This region comprises many oil-producing countries; its discovery between the world wars enabled the reduction of the indicator-averaged time lag from 68 to 50 years, more than most of other parts of Africa and Asia. However, large gains in GDP per capita have been mostly erased after 1980, a year in which Western Asia even came slightly ahead of the average benchmark country. Considerable reduction of the lag in health indicators was achieved, though most of the gains were recorded before 1980. Since then, time lag was mostly cut in the field of education attainment. Countries of the region which do not rely on oil also made significant progress, with Israel and Cyprus projected to reduce their indicator-averaged time lags below zero in 2019 and 2020, respectively. Still, the strongest catch-up was recorded in the United Arab Emirates (fourth highest in the world), Bahrain and Saudi Arabia, with Sudan and particularly South Sudan on the other end of the scale with further increases to their time lags.
3.2.3 Southern Asia
Southern Asia consists mostly of large countries and is dominated by former British colonies and protectorates, mainly India. The region has achieved moderate reduction of the indicator-averaged time lag from 80 to 65 years, mainly thanks to very strong economic progress in the past 20 years. Since the 1970s, the time lag in education attainment was also cut by almost half. Yet, time lag reduction in health indicators stopped in the 1970s; it is currently increasing. As in the other aforementioned regions, passenger car usage is steadily falling behind the benchmark countries, while the consistent increase in the lag in telephone usage was only reversed by the introduction of mobile telephony. Maldives, Iran and Sri Lanka have reduced their lags more than other countries in the region, with no change in Pakistan and Nepal. Afghanistan is the only country in Southern Asia to noticeably increase its indicator-average time lag.
3.2.4 Eastern and South-Eastern Asia
The region has cut its time lag more than any other part of the developing world, from 74 to 38 years. Catch-up was recorded in all indicators except passenger car usage. At first, the lag in economic indicators was growing fast until around 1970, but was cut by two-thirds since then. The substantial decline in the lag in the CO2 emissions index further highlights the fast-moving economic transition of the region. The lag in life expectancy was also reduced by two-thirds, with progress more evenly spread throughout the century, though progress in the infant survival rate was small. In general, very little reduction in the time lag in health indicators was achieved since the 1990s. Meanwhile, motorization has gained speed in the region, with the time lag unchanged since the late 2000s. Almost all countries in the region have reduced their indicator-averaged time lags, with only North Korea retaining the level of year 1920 (76 years). This contrasts heavily with South Korea, which achieved more reduction in the lag than any other country, by 71 years. More than 40 years was cut from the lags of Taiwan, China, Brunei and Singapore. Consequently, Eastern Asia recorded a catch-up of 42 years (to 33 years), while South-Eastern Asia made a comparatively less impressive 22-year reduction of the lag (to 47 years). Three countries of the region are currently ahead of an average benchmark country: Brunei (since 1979), Singapore (since 1987) and Hong Kong (since 1990).
3.2.5 Oceania
The smallest of SDG regions consists of only four independent states with populations above 250,000; Papua-New Guinea is by far the largest of them. All four countries are located in the subregion of Melanesia. In this region, increasing lags in economic and technology adoption indicators were compensated by modest catch-up in health and education domains. The indicator-averaged lag has changed little over the course of the century, as the lag amounted to 76 years in 1920, the same value in 1970 or 1980 and is projected to be 74 years in 2020. The small island states—Fiji, the Solomon Islands and Vanuatu—have all slightly diverged from the benchmark countries in the timeframe of the study.
3.2.6 Latin America and the Caribbean
Latin America and the Caribbean is characterized by moderate progress in all indicators except passenger car usage, with the average lag cut from 52 to 41 years. However, catch-up with the benchmark countries was largely achieved until around year 1970. Since then, the lag in GDP per capita has doubled, with no convergence for health indicators or the CO2 emissions index. Some reduction in the time lag were observed for the education attainment and telephone usage. Progress has been stronger in Central America than in South America, with all countries of the subregion reducing their indicator-averaged time lag. The strongest catch-up was achieved by Costa Rica and Guatemala, while Colombia and Bolivia made most progress in South America. Some countries of the region were regarded as developed early in the century, but have consistently been falling behind the benchmark, especially Argentina, Paraguay and Uruguay. Argentina had the smallest lag of all developing countries in 1920 (9 years on average), but it has increased by 22 years since then, which more than any country outside Africa. The Caribbean subregion has a whole made much less progress than the other two parts of the region, but it also has been very diverse. Strong catch-up by Puerto Rico and the Dominican Republic is compensated by the increasing lags of Cuba and Haiti.
3.2.7 Former USSR
This region does not exist in the original SDG regions. It was created here because countries in three different SDG regions belonged to one political entity—the Soviet Union, or USSR—until 1991. Time lags for all indicators for this region ran largely in parallel, with two distinct phases. Firstly, economic, health and education indicators show significant catch-up until the early 1960s, with little change in the lags for technology adoption and CO2 emissions index. Later, the lag is increasing with accelerating speed, peaking at the transition from socialist to market economy in the 1990s, with only education attainment still reducing the lag. Since around year 2000, there is very modest catch-up for most indicators. Still, the indicator-averaged lag in the region declined from 61 years in 1920 to 35 years at present. The Baltic States, which were independent also before 1940 and therefore separate statistics are available, largely converged with the benchmark countries, with Estonia even projected to reduce its lag below zero in 2019. The other successor states went various paths after 1990, with Georgia and Moldova making most reductions in their time lags (albeit from a high level) and countries like Uzbekistan and Russia falling further behind the benchmark countries.
3.2.8 Europe
This region consists of a relatively small selection of European countries, as a large part of the continent is either in the group of benchmark countries or included under Former USSR. The countries of Eastern and Southern Europe were comparatively better developed than most of the developing world, yet all managed to catch-up further with the benchmark countries. Indicator-average time lag was 38 years in 1920 and projected to be 19 years in 2020. Eastern Europe followed almost identical pattern as the Former USSR as all countries in the subregion had socialist economies between approximately 1945 and 1990. Still, the recovery after the transition to the market economy has been stronger than in the Former USSR. It is also the only subregion that has, mostly in recent years, converged with the benchmark countries in passenger car usage. Southern Europe is a diversified region, with good progress of Malta, Portugal and Greece. Malta had third best catch-up in the world and its time lag is below zero since 2007. On the other hand, many countries of the former Yugoslavia, especially the former Serbia and Montenegro have struggled to converge much in the past century given several setbacks such as the chaotic break-up of Yugoslavia.
3.3 Opportunities and Dangers in Future Development
Opportunities and dangers to future catch-up of developing countries could be further investigated by applying the time lags from a given indicator to draw corresponding values from other indicators. Hence, nine auxiliary indicators covering demography, economics and politics were collected for 2017 (the latest year available) and years 1800–2100 for benchmark countries (see “Appendix 2”). The results show that least developing countries have higher natural growth and younger demographic structure than an average benchmark country at the time when it had the same level of GDP per capita as the least developed countries. Though birth rate and fertility are only slightly higher than the corresponding historical values for the developed countries, much lower death rate results in almost three times higher natural growth. The share of people in working age (15–64 years) is also lower, which could be a drag on economic growth. On the positive side, the government debt in the least developed group is more than a third lower than it used to be in the benchmark countries; it is also more democratic.
The results of the comparison between present-day developing countries split by SDG regions and the average for benchmark countries at the time when they were at equal level of economic development, is presented in Fig. 8. Only two out of eight regions have higher fertility and birth rates than the historical values for benchmark countries (Sub-Saharan Africa, Northern Africa and Western Asia), while also only two have higher death rates (Europe, Former USSR). The same two groups are the only ones with higher share of old-age population, though they still have a higher share of working-age population, like all regions except Sub-Saharan Africa. Most regions are more indebted than the benchmark countries, except for the Former USSR, Oceania and, by a small margin, Sub-Saharan Africa. Finally, only two regions have more democratic governments than the benchmark group used to have: Oceania and Sub-Saharan Africa. Those findings suggest most of the developing countries have good growth perspectives thanks to larger share of working-age population than developed countries at this stage (Cervellati et al. 2019). Yet, the low fertility and population aging might soon become a problem, firstly in Europe and Eastern Asia, especially since they have a relatively high level of debt in a historical context.

2017 values of selected demographic, economic and political indicators for developing countries by SDG regions. The comparative value for benchmark countries is the population-weighted average of the values of the indicator in the year (per benchmark country) corresponding to the value of GDP per capita in the developing countries in 2017
4 Discussion
4.1 Relevance of the Findings
Trends in time lags have shown narrow convergence, but with large variation between indicators, and in time and space. Still, some common patterns are visible. Most indicators have shown great stability in the values of time lags, except for brief periods of improvement, across the world, income groups and continents. This suggests that history is difficult to “escape”: changes in income, mortality or education in developing countries have mostly followed historical paths taken by developed countries. The only periods of convergence, considering the developing world together, could be connected with diffusion of important technological advancements. For instance, it was found that more than half of the improvement to life expectancy in England and Italy between 1871/1881 and 1951 was due to the control of infectious and respiratory diseases (Livi-Bacci 2012). The spread of vaccination and knowledge on disease prevention and treatment beyond developed countries could explain why convergence between developing and benchmark countries only occurred until the 1970s. That is because life expectancy in developing countries reached levels of developed countries at the time when communicable diseases had no longer a significant impact on mortality. Further reduction in mortality requires high health-care investments rather than easily available knowledge and technologies (Preston 2007).
Another example is the adoption of telephony, in which the developing world was slowly, but increasingly falling behind the developed world. However, advent of much cheaper mobile telephony quickly reduced much of the lag. The concept of universal primary education spread slowly in the developed world, but was implemented at a faster pace in the developing world. Since the 1990s, advances in education require more expensive forms of education (secondary, tertiary), which have proven as difficult to implement as in the developed countries in the past. Meanwhile, the lag in the CO2 emissions index follows a similar trajectory as GDP per capita. This is an unsatisfactory result in context of the need to reduce greenhouse gas emissions to prevent catastrophic climate change, which threatens global convergence in well-being as well (Baarsch et al. 2020). On the other hand, the time lag is lower in general, hence the adoption of modern fuels and industry was quicker in developing countries at the beginning, so a quicker decarbonization might be possible too.
A few countries in east and south-east Asia managed to achieve significant convergence when most countries didn’t. They were broadly helped by globalization (Deaton 2014), but the time lag data also show that their economic success was preceded by a considerable reduction in lags in life expectancy and education. Those lags remained at a similar level since the convergence in income and non-agricultural labor share really started. Other countries follow historically-established development rates. A noticeable feature of Fig. 4 is that the time lag trajectories of different income groups are very similar, but shifted in time, with richer developing countries advancing first before the lower-income groups followed with the same pattern.
4.2 Uncertainties and Limitations
The results are subject to uncertainty related to the extrapolations made to fill missing data. Though the method used provides a quantification of the uncertainty, it might not capture trends that occurred in a particular country, especially if the lack of data was a result of major disruptions in a country, such as war or revolution. Also, the present study didn’t quantify the uncertainty of extrapolation for benchmark countries, while future changes of several indicators for those countries are assumptions rather than actual projections made by statistical agencies. Quantifying the uncertainty for the benchmark countries is a task for future research.
An uncertainty difficult to account for is the quality of underlying statistics. The United Nations Population Division adjusts the demographic indicators to improve their comparability, but such cases are estimates often based on scarce input information, therefore still having considerable uncertainty. Other indicators are usually unadjusted data from national agencies, which could include many inaccuracies, errors or methodological differences. The most known and highly contested examples involve GDP growth rates of the biggest developing economies, China and India, which might be grossly exaggerated (Subramanian 2019; Wu 2014). Another known instance is that of Argentina, which in 2013 became the first country to be sanctioned by the International Monetary Fund for misreporting economic data (“An Augean Stable” 2016). Problems of accuracy aside, it should be noted that the GDP per capita indicator depends on the choice of the time point to which the different countries are compared to. Here, 2011 purchasing power parities (PPPs) are used, which will yield different time lags than e.g. 1990 PPPs also used in historical economic research (Maddison 2001; Bolt et al. 2018). However, this would not affect the trends in the time lag for this indicator.
4.3 Future Outlook
The study can provide not only insights on the historical progress in the “catch-up” of developing countries to the developed ones, but also on the rate of future development necessary to continue the convergence process. This can also serve as a plausibility check against international or national development goals. For instance, SDG 8.1 calls for a 7% annual GDP per capita growth between 2015 and 2030 in the least developed countries (United Nations 2018a). In 2015, the least developed countries lagged an average benchmark country by 178 years. If the goal is achieved, the lag in 2030 would be reduced to 103 years. In reality, the group is projected to achieve a growth of barely 1.3% per annum between 2015 and 2020. However, this is very close to the historical record of benchmark countries, which have grown, on average, 1.6% per annum in the 15 years after reaching the 2015 level of GDP per capita of the least developed countries. The 7% growth threshold was only surpassed by Japan in the postwar reconstruction years (7.8% on average between 1946 and 1961). Otherwise, the best results were achieved by Australia and New Zealand in the mid-nineteenth century (5% growth).
Another goal, SDG 9.2, has a target of doubling the industrial share of employment in the least developed countries between 2015 and 2030. If all new industrial employment was to come from the reduction of the agricultural share, the latter would need to decline from 65 to 52%, or by a fifth, based on industrial employment as of 2015 (World Bank 2019). This would still result only in the reduction of the time lag from 173 to around 160 years. In the period of 15 years after achieving comparable GDP per capita to the least developed countries, an average benchmark country has only reduced its agricultural employment share from 57 to 54%. Again, out of 20 benchmark countries (excluding Luxembourg for the lack of GDP data), only Japan managed an economic transition with a speed comparable to what is needed to achieve SDG 9.2.
The examples presented above highlight the daunting task to improve well-being in the least developed countries. It also suggests that the two SDGs are unrealistic and very unlikely to be achieved. The time lags method can’t help with the imprecision of the SDGs, as only 35 out of 169 goals are quantifiable and measurable on a country level (McArthur and Rasmussen 2019). However, it can help setting more realistic and measurable goals, as few countries are on track to reach more than a handful of SDGs (Sachs et al. 2019). Those quantifiable goals often call for an improvement by a given proportion of an indicator, e.g. reducing poverty by half (SDG 1.2), reducing mortality from non-communicable diseases by a third (SDG 3.4) and doubling the global rate of improvement in energy efficiency (SDG 7.3). In practice, the difficulty of achieving each goal can depend on the starting level, as has been noticeable in this study with GDP per capita growth rates, which have been low for both the poorest countries (presently and in the past) and the richest ones too. Time lags allow to set a single goal (reducing the lag by a given number of years to the benchmark), which will require a different rate of progress for different countries, but will lead to convergence between the developing countries and the benchmark. Time lags would also allow setting a uniform goal in convergence across different indicators, helping to synchronize goal-setting across different SDGs, as synergy between the goals is highly desirable (Nilsson et al. 2016; Pradhan et al. 2017). The downside of this approach is that it requires a country or group of countries as a benchmark. The benchmark group couldn’t be assessed this way. On the other hand, a “standard” goal could be set for the benchmark countries, while for other countries the goal would be to reduce the time lag by the same number of years.
5 Conclusions
This paper examined the time lags of nine development indicators for most countries of the world compared with a set of 21 developed (benchmark) countries. The results provide insights which parts of the developing world have converged with the developed countries in social and economic aspects and which have fallen behind. In most general terms, the developing world has cut its distance to an average benchmark country by a quarter in the past century (Sect. 3.1). The same finding is true for a median developing country. Progress was made in GDP per capita, education attainment, life expectancy, infant survival rate, telephone usage and the CO2 emissions index, with mixed record on employment outside agriculture and increasing lag only for passenger car usage. However, much of the catch-up has occurred between the 1950s and 1970s, with recent small reductions in the time lags driven mostly by the introduction of mobile phones, which cut most of the distance in telephone usage to the benchmark countries. Also, the global result in population-weighted terms is mostly influenced by progress in China, which can be estimated to be responsible for more than 90% of positive contribution to the reduction of the indicator-averaged time lag in the 1990s and almost 70% in both 2000s and 2010s.
The paper highlighted the diverse pathways of different regions of the world (Sect. 3.2). Most countries in Africa, already lagging far behind, are failing to catch-up. Countries that could have been classified as developed in 1920 have also sometimes fallen behind substantially, mainly in South America. Several countries, mostly in Eastern Asia and Eastern Europe have closed the gap despite less favorable starting conditions. Still, lags in 2020 are highly correlated with lags in 1920 or 1970, highlighting the difficulty to radically improve a country’s development level and catch-up with the benchmark.
The result section ends with a comparison of selected auxiliary indicators, mostly demographic, between present-day developing countries and their historical counterparts—benchmark countries at the time when they had corresponding GDP per capita levels. It is found that developing countries mostly have lower fertility and mortality, higher share of working-age population, higher public debt and less democratic governments than benchmark countries at the same stage of development. This creates both opportunities and risks to future convergence with the developed countries.
After briefly discussing the possible explanations of the results in Sect. 4.1 and the uncertainties in Sect. 4.2, the paper explains the possible application of the method to setting development goals in Sect. 4.3. Using the example of Sustainable Development Goals (SDGs) 8.1 and 9.2, it shows how unrealistic those targets might be, by putting them into a historical context. Using time lags, a realistic target that is comparable across indicators is possible.
References
Aldcroft, D. (1993). The European economy 1914–1990. New York: Routledge.
Alkema, L., Raftery, A. E., Gerland, P., Clark, S. J., Pelletier, F., Buettner, T., et al. (2011). Probabilistic projections of the total fertility rate for all countries. Demography, 48(3), 815–839. https://doi.org/10.1007/s13524-011-0040-5.
Allen, R. C. (2000). Economic structure and agricultural productivity in Europe, 1300–1800. European Review of Economic History, 4(1), 1–25.
An Augean Stable. (2016). The Economist.. https://www.economist.com/theamericas/2016/02/13/an-augean-stable.
Azose, J. J., & Raftery, A. E. (2019). Estimation of emigration, return migration, and transit migration between all pairs of countries. Proceedings of the National Academy of Sciences, 116(1), 116–122. https://doi.org/10.1073/pnas.1722334116.
Baarsch, F., Granadillos, J. R., Hare, W., Knaus, M., Krapp, M., Schaeffer, M., et al. (2020). The impact of climate change on incomes and convergence in Africa. World Development, 126, 104699. https://doi.org/10.1016/j.worlddev.2019.104699.
Barro, R., & Lee, J.-W. (2013). A new data set of educational attainment in the world, 1950–2010. Journal of Development Economics, 104, 184–198. https://doi.org/10.1016/j.jdeveco.2012.10.001.
Barro, R., & Sala-i-Martin, X. (1992). Convergence. Journal of Political Economy, 100(2), 223–251. https://doi.org/10.1086/261816.
Baumol, W. J. (1986). Productivity growth, convergence and welfare: What the long-run data show. American Economic Review, 76, 1072–1085.
Boden, T.A., G. Marland, & Andres, R. J. (2017). Global, regional, and national fossil-fuel CO2 emissions, carbon dioxide information analysis center [data file]. http://dx.doi.org/10.3334/CDIAC/00001_V2017. Retrieved July 31, 2019.
Bolt, J., Inklaar, R., de Jong, H., & van Zanden, J. L. (2018). Rebasing ‘Maddison’: new income comparisons and the shape of long-run economic development. GGDC Research Memorandum GD-174. Groningen: Groningen Growth and Development Centre, University of Groningen.
Broadberry, S., Campbell, B. M. S., & van Leeuwen, B. (2013). When did Britain industrialise? The sectoral distribution of the labour force and labour productivity in Britain, 1381–1851. Explorations in Economic History, 50(1), 16–27. https://doi.org/10.1016/j.eeh.2012.08.004.
Cervellati, M., Meyerheim, G., & Sunde, U. (2019). The timing of the demographic transition and economic growth. Economics Letters, 181, 43–46. https://doi.org/10.1016/j.econlet.2019.04.022.
Clio Infra. (2019). Reconstructing global inequality [Data file]. https://clio-infra.eu/. Retrieved July 31, 2019.
Comin, D., & Hobijn, B. (2010). An exploration of technology diffusion. American Economic Review, 100(5), 2031–2059. https://doi.org/10.1257/aer.100.5.2031.
Comin, D., Hobijn, B., & Rovito, E. (2008). Technology usage lags. Journal of Economic Growth, 13(4), 237–256. https://doi.org/10.1007/s10887-008-9035-5.
Deaton, A. (2014). The great escape: Health, wealth, and the origins of inequality. Princeton, NJ: Princeton University Press.
Decancq, K., Decoster, A., & Schokkaert, E. (2009). Evolution of world inequality in well-being. World Development, 37, 11–25. https://doi.org/10.1016/j.worlddev.2007.12.006.
European Automobile Manufacturers Association. (2019). Vehicles in use [Data file]. https://www.acea.be/statistics/tag/category/vehicles-in-use. Retrieved July 31, 2019.
Eurostat. (2010). Illustrated glossary for transport statistics (4th ed.). Luxembourg: Publications Office of the European Union. https://doi.org/10.2785/58454.
Eurostat. (2013). European system of accounts ESA 2010. Luxembourg: Publications Office of the European Union. https://doi.org/10.2785/16644.
Eurostat. (2019). Database [Data file]. https://ec.europa.eu/eurostat/data/database. Retrieved July 30, 2019.
Ferraro, D. (2017). Volatility and slow technology diffusion. European Economic Review, 96, 18–37. https://doi.org/10.1016/j.euroecorev.2017.04.005.
French, D. (2014). International mortality modelling—An economic perspective. Economics Letters, 122(2), 182–186. https://doi.org/10.1016/j.econlet.2013.10.039.
Genest, C., Remillard, B., & Beaudoin, D. (2009). Goodness-of-fit tests for copulas: A review and a power study. Insurance: Mathematics and Economics, 44, 199–213. https://doi.org/10.1016/j.insmatheco.2007.10.005.
International Labor Organization. (2019). ILOSTAT Bulk download facility [Data file]. https://ilostat.ilo.org/data/bulk/. Retrieved July 30, 2019.
International Monetary Fund. (2019a). World economic outlook database [Data file]. https://www.imf.org/external/pubs/ft/weo/2019/01/weodata/index.aspx. Retrieved July 30, 2019.
International Monetary Fund. (2019b). Historical public debt database [Data file]. https://www.imf.org/external/datamapper/datasets/DEBT/1. Retrieved July 31, 2019.
International Monetary Fund. (2019c). Global debt database [Data file]. https://www.imf.org/external/datamapper/datasets/GDD. Retrieved July 31, 2019.
International Organization for Standardization. (2019). Country codes—ISO 3166. https://www.iso.org/iso-3166-country-codes.html. Retrieved July 26, 2019.
International Organization of Motor Vehicle Manufacturers. (2017). Vehicles in use [Data file]. http://www.oica.net/category/vehicles-in-use/. Retrieved July 31, 2019.
International Telecommunications Union. (2019). Statistics [Data file]. https://www.itu.int/en/ITU-D/Statistics/Pages/stat/default.aspx. Retrieved July 31, 2019.
ISSC, IDS, & UNESCO. (2016). World social science report 2016: Challenging inequalities—Pathways to a just world. Paris: UNESCO Publishing.
Joe, H. (2014). Dependence modeling with Copulas. London: Chapman & Hall/CRC.
Jordá, V., & Niño-Zarazúa, M. (2017). Global inequality in length of life: 1950–2015. WIDER working paper 2017/192, United Nations University, Helsinki, Finland. http://dx.doi.org/10.2139/ssrn.3076786.
Jordá, V., & Sarabia, J. M. (2015). International convergence in well-being indicators. Social Indicators Research, 120(1), 1–27. https://doi.org/10.1007/s11205-014-0588-8.
Jovanovic, B. (2009). The technology cycle and inequality. Review of Economic Studies, 76(2), 707–729. https://doi.org/10.1111/j.1467-937X.2009.00532.x.
Kónya, L., & Guisan, M. C. (2008). What does the human development index tell us about convergence? Applied Econometrics and International Development, 8, 19–40.
Le Quéré, C., Andrew, R. M., Friedlingstein, P., Sitch, S., Hauck, J., Pongratz, J., et al. (2018). Global carbon budget 2018. Earth System Science Data, 10, 2141–2194. https://doi.org/10.5194/essd-10-2141-2018.
Lee, J.-W., & Lee, H. (2016). Human capital in the long run. Journal of Development Economics, 122, 147–169. https://doi.org/10.1016/j.jdeveco.2016.05.006.
Livi-Bacci, M. (2012). A concise history of world population. Chichester, UK: Wiley-Blackwell.
Maddison, A. (1997). Causal influences on productivity performance 1820–1992: A global perspective. Journal of Productivity Analysis, 8(4), 325–359. https://doi.org/10.1023/A:1007763404305.
Maddison, A. (2001). The world economy: A millennial perspective. Paris: OECD.
Maddison, A. (2008). Shares of the rich and the rest in the world economy: Income divergence between nations, 1820–2030. Asian Economic Policy Review, 3, 67–82. https://doi.org/10.1111/j.1748-3131.2008.00090.x.
Maddison, A. (2010). Historical statistics of the world economy: 1–2008 AD [Data file]. www.ggdc.net/maddison/Historical_Statistics/horizontal-file_02-2010.xls. Retrieved July 30, 2019.
Marshall, M. G., Gurr, T. R., & Jaggers, K. (2018). Polity IV project—Political regime characteristics and transitions, 1800–2017, Dataset Users’ Manual. http://www.systemicpeace.org/inscrdata.html.
Max Planck Institute for Demographic Research. (2018). Human fertility collection [Data file]. https://www.fertilitydata.org/cgi-bin/index.php. Retrieved July 31, 2019.
Max Planck Institute for Demographic Research. (2019). Human life-table database [Data file]. http://www.lifetable.de. Retrieved July 31, 2019.
Mazumdar, K. (2003). Do standards of living converge? A cross-country study. Social Indicators Research, 64(1), 29–50. https://doi.org/10.1023/A:1024736308509.
McArthur, J. W., & Rasmussen, K. (2019). Classifying sustainable development goal trajectories: A country-level methodology for identifying which issues and people are getting left behind. World Development, 123, 104608. https://doi.org/10.1016/j.worlddev.2019.06.031.
McEvedy, C., & Jones, R. (1978). Atlas of World Population History. London: Penguin.
McGillivray, M., & Markova, N. (2010). Global inequality in well-being dimensions. The Journal of Development Studies, 46(2), 371–378. https://doi.org/10.1080/00220380903033280.
McGillivray, M., & Pillarisetti, J. R. (2004). International inequality in well-being. Journal of International Development, 16(4), 563–574. https://doi.org/10.1002/jid.1078.
Milanovic, B. (2005). Worlds apart: Measuring international and global inequality. Princeton, NJ: Princeton University Press.
Milanovic, B. (2012). Global income inequality by the numbers: In history and now. Policy research working paper 6259, World Bank. http://documents.worldbank.org/curated/en/959251468176687085/pdf/wps6259.pdf.
Mitchell, B. R. (1993). International historical statistics: The Americas 1750–1988. London: Palgrave Macmillan.
Mitchell, B. R. (1998a). International historical statistics: Africa Asia and Oceania 1750–1993. London: Palgrave Macmillan.
Mitchell, B. R. (1998b). International historical statistics: Europe 1750–1993. London: Palgrave Macmillan.
Monfort, P. (2008). Convergence of EU regions—Measures and evolution. Working paper 01/2008, Regional Policy, European Commission, Brussels, Belgium. http://ec.europa.eu/regional_policy/sources/docgener/work/200801_convergence.pdf.
Morales-Nápoles, O., Paprotny, D., Worm, D., Abspoel-Bukman, L., & Courage, W. (2017). Characterization of precipitation through copulas and expert judgement for risk assessment of infrastructure. ASCE-ASME Journal of Risk and Uncertainty in Engineering Systems, Part A: Civil Engineering, 3, 04017012. https://doi.org/10.1061/AJRUA6.0000914.
Nilsson, M., Griggs, D., & Visbeck, M. (2016). Policy: Map the interactions between sustainable development goals. Nature, 534, 320–322. https://doi.org/10.1038/534320a.
Nixon, J. W. (1938). On the statistics available concerning the occupied population of the world and its distribution. Review of the International Statistical Institute, 6(3), 377–393. https://doi.org/10.2307/1401192.
Noorbakhsh, F. (2006). International convergence or higher inequality in human development? Evidence for 1975–2002. WIDER research paper no. 2006/15.
Oak Ridge National Laboratory. (2019). Transportation energy data book [Data file]. https://tedb.ornl.gov/data/. Retrieved July 31, 2019.
OECD. (2018). GDP long-term forecast (indicator) [Data file]. https://doi.org/10.1787/d927bc18-en. Retrieved July 30, 2019.
OECD. (2019). OECD.Stat [Data file]. https://stats.oecd.org/. Retrieved July 30, 2019.
Paprotny, D. (2014). Poziom rozwoju Polski w relacji do państw zachodnich. The Polish Statistician, 59(3), 48–65.
Paprotny, D. (2016). Measuring Central and Eastern Europe’s socio-economic development using time lags. Social Indicators Research, 127(3), 939–957. https://doi.org/10.1007/s11205-015-0991-9.
Piketty, T. (2014). Capital in the twenty-first century. Cambridge, MS: Harvard University Press.
Pradhan, P., Costa, L., Rybski, D., Lucht, W., & Kropp, J. P. (2017). A systematic study of sustainable development goal (SDG) interactions. Earth’s Future, 5, 1169–1179. https://doi.org/10.1002/2017EF000632.
Preston, S. H. (2007). The changing relation between mortality and level of economic development. International Journal of Epidemiology, 36, 484–490.
Pritchett, L. (1997). Divergence, big time. Journal of Economic Perspectives, 11(3), 3–17.
Quah, D. (1993). Galton’s fallacy and tests of the convergence hypothesis. Scandinavian Journal of Economics, 95, 427–443.
Raftery, A. E., Lalic, N., & Gerland, P. (2014). Joint probabilistic projection of female and male life expectancy. Demographic Research, 30, 795–822. https://doi.org/10.4054/DemRes.2014.30.27.
Rothenbacher, F. (2013). The Central and East European population since 1850. London: Palgrave Macmillan.
Sachs, J., Schmidt-Traub, G., Kroll, C., Lafortune, G., & Fuller, G. (2019). Sustainable development report 2019. New York: Bertelsmann Stiftung and Sustainable Development Solutions Network.
Sala-i-Martin, X. (1996). The classical approach to convergence analysis. The Economic Journal, 106, 1019–1033.
Sala-i-Martin, X. (2006). The world distribution of income: Falling poverty and … convergence, Period. Quarterly Journal of Economics, 71(2), 351–397.
Schön, L., & Krantz, O. (2015). Swedish historical national accounts 1300–2010 [Data file]. https://www.ekh.lu.se/en/research/economic-history-data/shna. Retrieved July 30, 2019.
Solow, R. M. (1956). A contribution to the theory of economic growth. Quarterly Journal of Economics, 70, 65–94.
Statistics Iceland. (2019). Gross domestic product [Data file]. https://www.statice.is/statistics/economy/national-accounts/gross-domestic-product/. Retrieved July 30, 2019.
Statistics Poland. (2006). Historia Polski w liczbach, tom II—Gospodarka. Warsaw: Statistics Poland.
Subramanian, A. (2019). India’s GDP mis-estimation: Likelihood, magnitudes, mechanisms, and implications. CID Faculty working paper no. 354, Harvard University. https://www.hks.harvard.edu/centers/cid/publications/faculty-working-papers/india-gdp-overestimate.
UN Inter-agency Group for Child Mortality Estimation. (2019). Child mortality estimates [Data file]. https://childmortality.org/. Retrieved July 31, 2019.
UNESCO Institute for Statistics. (2019). UIS Statistics [Data file]. http://data.uis.unesco.org/. Retrieved July 31, 2019.
United Nations. (2018a). Sustainable development goals. https://www.un.org/sustainabledevelopment/. Retrieved July 30, 2019.
United Nations. (2018b). National accounts: Analysis of main aggregates (AMA) [Data file]. https://unstats.un.org/unsd/snaama/. Retrieved July 30, 2019.
United Nations. (2019). World population prospects 2019. https://population.un.org/wpp/. Retrieved July 26, 2019.
United Nations Development Programme. (2018). Human development data (1990–2017) [Data file]. http://hdr.undp.org/en/data. Retrieved July 29, 2019.
United Nations Economic Commission for Europe (2019). UNECE Statistical Database [Data file]. Retrieved from https://w3.unece.org/PXWeb/en (accessed July 31, 2019).
University of California and Max Planck Institute for Demographic Research. (2019). Human mortality database [Data file]. http://www.mortality.org. Retrieved July 31, 2019.
World Bank. (2019). World development indicators [Data file]. https://datacatalog.worldbank.org/dataset/world-development-indicators. Retrieved July 26, 2019.
Wu, H. X. (2014). China’s growth and productivity performance debate revisited—Accounting for China’s sources of growth with a new data set. Economics program working paper series, The Conference Board. https://www.conference-board.org/pdf_free/workingpapers/EPWP1401.pdf.
Acknowledgements
The author would like to thank Oswaldo Morales-Nápoles (Delft University of Technology) for his help with developing the Matlab code used for the copula-based simulation.
Funding
This research did not receive any specific grant from funding agencies in the public, commercial, or not-for-profit sectors.
Author information
Authors and Affiliations
Corresponding author
Ethics declarations
Conflict of interest
The author declares that he has no conflict of interest.
Additional information
Publisher's Note
Springer Nature remains neutral with regard to jurisdictional claims in published maps and institutional affiliations.
Electronic supplementary material
Below is the link to the electronic supplementary material.
Appendices
Appendix 1: Definitions of Regions
1.1 Former Countries
The following “aggregate” countries, representing defunct states, where used when calculating time lags by means of averaging (median or population-weighted average) of countries comprising a given region of the world:
-
1.
British India [Former]: Bangladesh, India, Myanmar, Pakistan.
-
2.
Czechoslovakia [Former]: Czechia, Slovakia.
-
3.
Ethiopia [Former]: Eritrea, Ethiopia.
-
4.
Korea [Former]: North Korea, South Korea.
-
5.
Sudan [Former]: South Sudan, Sudan.
-
6.
USSR [Former]: Armenia, Azerbaijan, Belarus, Estonia, Georgia, Kazakhstan, Kyrgyzstan, Latvia, Lithuania, Moldova, Russia, Tajikistan, Turkmenistan, Ukraine, Uzbekistan.
-
7.
Yugoslavia [Former]: Bosnia and Herzegovina, Croatia, Kosovo, Montenegro, North Macedonia, Serbia, Slovenia.
Additionally, for collection of historical statistics and creating the aggregates for British India and Yugoslavia, the following aggregates were used:
-
1.
Pakistan [Former]: Bangladesh, Pakistan.
-
2.
Serbia and Montenegro [Former]: Kosovo, Montenegro, Serbia.
1.2 Regions of the World
The subdivisions of the world were obtained from United Nations (2019), with modifications. The two most important divisions analyzed here are presented in Figs. 9 and 10, while a listing of all countries and their respective regions is provided in Supplementary Information 1.

Sustainable Development Goals regions, modified. Small countries represented as points. Country boundaries from EuroGeographics (Eurostat 2019), Robinson projection

World Bank income groups, modified. Small countries represented as points. Country boundaries from EuroGeographics (Eurostat 2019), Robinson projection
Appendix 2: Definitions of Indicators and Data Sources
2.1 GDP Per Capita
Definition Gross domestic product (GDP) “is the final result of the production activity of resident producer units” (Eurostat 2013). Here, it is measured in constant prices and 2011 purchasing power parities (price levels of United States in 2011, in US dollars).
Data sources for benchmark countries: 1800–1979: Maddison Project Database (Bolt et al. 2018), Maddison (2010) and Statistics Iceland (2019); 1980–2024: estimates and projections from World Economic Outlook, April 2019 (International Monetary Fund 2019a), Maddison Project Database and the National Accounts Main Aggregates Database (United Nations 2018b); 2025–2060: extrapolated with GDP growth rates from the OECD long-term economic projection, July 2018 (OECD 2018); 2061–2100: extrapolated with GDP growth rate for 2060.
Data sources for developing countries: 1920–1979: Maddison Project Database, Maddison (2010), Statistics Poland (2006) and the National Accounts Main Aggregates Database; 1980–2020: World Economic Outlook, Maddison Project Database and the National Accounts Main Aggregates Database.
2.2 Employment Outside Agriculture
Definition: the share of employed or economically active population whose primary occupation is in the industrial or services sector. In practice, the indicator was calculated based on the employment share in the agricultural sector, i.e. agriculture, hunting, fishery and forestry (World Bank 2019). The exact coverage of the population of this indicator varies slightly between countries and time periods.
Data sources for benchmark countries: 1800–1954: United Nations Demographic Yearbook, various editions, League of Nations Statistical Yearbook, various editions, Allen (2000), Broadberry et al. (2013), Maddison (2001), Mitchell (1993, 1998a, b), Nixon (1938), Schön and Krantz (2015) and national statistical institutes; 1955–2018: Eurostat (2019) and OECD (2019); 2019–2100: extrapolated using average annual change in employment share in the group of benchmark countries (2008–2017).
Data sources for developing countries: 1920–1990: United Nations Demographic Yearbook, various editions, League of Nations Statistical Yearbook, various editions, ILOSTAT (International Labor Organization 2019), Aldcroft (1993), Mitchell (1993, 1998a, b), Nixon (1938) and national statistical institutes; 1991–2020: estimates and projections from ILOSTAT, except Argentina (from national statistical institute).
2.3 Life Expectancy (Men and Women)
Definition: life expectancy at birth “indicates the number of years a newborn infant would live if prevailing patterns of mortality at the time of its birth were to stay the same throughout its life” (World Bank 2019).
Data sources for benchmark countries: 1800–2018: United Nations Demographic Yearbook, League of Nations Statistical Yearbook, Human Life-Table Database (Max Planck Institute for Demographic Research 2019), Human Mortality Database (University of California and Max Planck Institute for Demographic Research 2019), World Population Prospects: the 2019 revision (United Nations 2019), Eurostat (2019), OECD (2019), Raftery et al. (2014) and national statistical institutes; 2019–2100: projections from the World Population Prospects: the 2019 revision.
Data sources for developing countries: 1920–1949: United Nations Demographic Yearbook, League of Nations Statistical Yearbook, Human Life-Table Database, Human Mortality Database, Rothenbacher (2013) and national statistical institutes; 1950–2100: estimates and projections from the World Population Prospects: the 2019 revision.
2.4 Infant Survival Rate
Definition: Infant survival rate is calculated from the infant mortality rate, which is “the number of infants dying before reaching one year of age, per 1000 live births in a given year” (World Bank 2019). The quality of this indicator varies significantly between countries and is usually underestimated outside developed countries. Data from 1950 for developing countries used here are adjusted estimates from United Nations, while pre-1950 data (mostly from the United Nations Demographic Yearbook) were adjusted, on per-country basis, by a constant factor comparing original 1950 data with adjusted UN estimates. Data for almost all European countries (except for Albania) did not need adjustment.
Data sources for benchmark countries: 1800–2018: United Nations Demographic Yearbook, League of Nations Statistical Yearbook, Human Life-Table Database, Human Mortality Database, World Population Prospects: the 2019 revision, Eurostat (2019), Mitchell (1998a, b), Rothenbacher (2013), UN Inter-agency Group for Child Mortality Estimation (2019) and national statistical institutes; 2019–2100: projections from the World Population Prospects: the 2019 revision.
Data sources for developing countries: 1920–1949: United Nations Demographic Yearbook, League of Nations Statistical Yearbook, Human Life-Table Database, Rothenbacher (2013), UN Inter-agency Group for Child Mortality Estimation (2019) and national statistical institutes; 1950–2100: estimates and projections from the World Population Prospects: the 2019 revision.
2.5 Passenger Cars
Definition: the number of passenger cars per 1000 persons, with passenger car usually defined as a “road motor vehicle, other than a moped or a motor cycle, intended for the carriage of passengers and designed to seat no more than nine persons (including the driver)” (Eurostat 2010). In practice, the exact definition varies between countries. Adjustment were made to data for Japan and United States by aggregating multiple categories of vehicles to match the general definition of passenger cars.
Data sources for benchmark countries: 1895–2017: United Nations Statistical Yearbook, various editions, League of Nations Statistical Yearbook, Mitchell (1993, 1998a, b), Eurostat (2019) and national statistical institutes, divided by total population (see Sect. 7.9); 2018–2100: extrapolated using average annual change in passenger cars per 1000 persons in the group of benchmark countries (2008–2017).
Data sources for developing countries: 1920–2018: United Nations Statistical Yearbook, various editions, League of Nations Statistical Yearbook, Mitchell (1993, 1998a, b), Eurostat (2019), United Nations Economic Commission for Europe (2019), Oak Ridge National Laboratory (2019), European Automobile Manufacturers Association (2019), International Organization of Motor Vehicle Manufacturers (2017) and national statistical institutes, divided by total population (see Sect. 7.9).
2.6 Telephones
Definition: the number of active fixed-line and mobile cellular telephone subscriptions per 1000 persons (World Bank 2019). For some countries, historical data might vary in defining “active” subscription. In some cases, the data refer to the number of devices rather than subscriptions, which overestimates telephone adoption (multiple fixed-line telephone devices could be used at home per one subscription). Where possible, historical series using the number of devices (mostly from Mitchell) have been adjusted to match later series with the number of subscriptions (mostly from World Development Indicators).
Data sources for benchmark countries: 1876–2017: World Development Indicators (World Bank 2019), Mitchell (1993, 1998a, b), International Telecommunications Union (2019) and national statistical institutes, divided by total population (see Sect. 7.9); 2018–2100: extrapolated using average annual change in the number of telephones per 1000 persons in the group of benchmark countries (2008–2017).
Data sources for developing countries: 1920–2017: as for benchmark countries.
2.7 Education Attainment
Definition: the mean number of years that a person has spent in school (Barro and Lee 2013). Data from 1950 refer to all persons aged 25 and more, while 1870–1945 data refer to people aged 25–64 and pre-1870 data vary in age definition.
Data sources for benchmark countries: 1800–1869: Clio Infra (2019) and Maddison (1997); 1870–1949: Lee and Lee (2016); 1950–1969: Barro and Lee (2013), 1970–2017: Barro and Lee (2013), UNESCO Institute for Statistics (2019) and United Nations Development Programme (2018); 2018–2050: extrapolated assuming all countries reaching the expected years of schooling from 2017 (i.e. the mean years of schooling expected to be achieved at constant school enrollment rates of 2017) by 2050; 2051–2100: 2050 value used.
Data sources for developing countries: 1920–1949: Lee and Lee (2016); 1950–1970: Barro and Lee (2013), 1971–2017: Barro and Lee (2013), UNESCO Institute for Statistics (2019) and United Nations Development Programme (2018).
2.8 CO2 Emissions Index
Definition A dimensionless index for carbon dioxide (CO2) emissions per unit of GDP. Includes emissions from gas, liquid and solid fossil fuels, cement production, and gas flaring. The index was constructed by first identifying peak emissions using a 5-year moving average. This average emission value forms the basis of the index. Emissions after the year of the peak are divided by the baseline emission. Then, the baseline emission is divided by the emissions that have occurred before the year of the peak. The base value of the index is 100, with values above 100 indicating pre-peak emissions (capped at 10,000) and values below 100 indicating post-peak emissions. Total GDP was calculated by multiplying GDP per capita (see Sect. 7.1) and total population (see Sect. 7.9).
Data sources for benchmark countries: 1800–1989: Boden et al. (2017) divided by total GDP; 1990–2017: Le Quéré et al. (2018) divided by total GDP; 2018–2100: extrapolated using average annual change in CO2 emissions in the group of benchmark countries (2008–2017) and divided by projected total GDP.
Data sources for developing countries: 1920–2014: Boden et al. (2017), with 1990–2014 data for some countries from Le Quéré et al. (2018) divided by total GDP; 2015–2017: Le Quéré et al. (2018) divided by total GDP.
2.9 Auxiliary Data
Calculating passenger car and telephone usage, total GDP for the CO2 emissions index and finally population-weighting of data for regional aggregates required collecting population data for all countries.
Total population, benchmark countries: 1800–1949: Maddison (2010) and national statistical institutes; 1950–2019: World Prospects: the 2019 revision, except for United States, which is from the US Census Bureau; 2020–2100: projections from the World Population Prospects: the 2019 revision.
Total population, developing countries: 1920–1949: United Nations Demographic Yearbook, League of Nations Statistical Yearbook, Maddison (2010), McEvedy and Jones (1978) and national statistical institutes; 1950–2020: World Population Prospects: the 2019 revision, except Serbia, Kosovo, South Yemen and South Vietnam, which was taken from the United Nations Demographic Yearbook and the National Accounts Main Aggregates Database (United Nations 2018b).
For the analysis in Sect. 4.2, data on the population structure, live births and deaths, total fertility rate, gross general government debt (% of GDP) and political regime type were collected for all years for the benchmark countries, but only year 2017 for developing countries (latest year available for all datasets).
Demographic data, benchmark countries: 1800–2018: United Nations Demographic Yearbook, League of Nations Statistical Yearbook, World Population Prospects: the 2019 revision, Mitchell (1993, 1998a, b), Eurostat (2019), OECD (2019), Human Fertility Collection (Max Planck Institute for Demographic Research 2018) and national statistical institutes; 2019–2100: projections from the World Population Prospects: the 2019 revision.
Demographic data, developing countries: 2017: World Population Prospects: the 2019 revision.
Gross general government debt, benchmark countries: 1800–2024: Historical Public Debt Database, Global Debt Database and World Economic Outlook, April 2019 (International Monetary Fund 2019a, b, c); 2025–2100: assumed constant after 2024, as per OECD (2018) long-term forecasts.
Gross general government debt, developing countries: World Economic Outlook, April 2019. Data is not available for some countries, therefore they were excluded from regional aggregates.
Political regime type, benchmark countries: 1800–2017: Revised Combined Polity Score from Polity IV Project (Marshall et al. 2018); 2018–2100: 2017 value used. For Iceland, Denmark’s score was used. In cases where a given country didn’t exist in a particular year, the overlord’s Polity score was used.
Political regime type, developing countries: 2017: Combined Polity Score from Polity IV Project. Four cases of “interregnum” and “interruption” were recoded as full autocracy (–10).
Rights and permissions
About this article

Cite this article
Paprotny, D. Convergence Between Developed and Developing Countries: A Centennial Perspective. Soc Indic Res 153, 193–225 (2021). https://doi.org/10.1007/s11205-020-02488-4
Accepted:
Published:
Issue Date:
DOI: https://doi.org/10.1007/s11205-020-02488-4