
Abstract
Teacher’s evaluation of students is sometimes negatively affected by diagnostic labels. We explored such negative effects caused by the labels “dyscalculia”, “dyslexia”, and “ADHD” in teacher students. In Experiment 1, we varied the presence of the dyscalculia and dyslexia label in vignettes between participants. The dyslexia but not the dyscalculia label had a negative effect on participant’s academic expectations. In our preregistered Experiment 2, the presence of the ADHD label in vignettes was manipulated within participants. To understand the cognitive mechanisms driving label effects, we explored participants’ attributions regarding the students’ problems. Furthermore, a short dissonance-based intervention for counteracting negative label effects was implemented. Unexpectedly, we found both negative and positive label effects. The label led to more positive performance expectations and to more negative ratings of problem stability and problem control. The dissonance-based intervention led to more positive evaluations regardless of whether the ADHD label was mentioned or not. Overall, our findings suggest that learning-disorder labels affect teachers’ expectations in different ways.
When teenagers awake in the morning of their 18th birthday, neither their abilities nor their personalities have changed fundamentally. However, in several countries, they become full-grown adults overnight. Societies treat teenagers and adults in categorically different ways despite the dimensional nature of the relevant underlying traits and abilities (e.g., intelligence, decision-making ability, personality development, etc.).
This tendency of categorization also lies at the core of psychiatric diagnoses, fundamental controversies about categorical versus dimensional approaches to mental disorders notwithstanding (e.g., Coghill & Sonuga-Barke, 2012). The formation of diagnostic categories is important for the scientific investigation of mental health problems and for developing effective treatments. However, some scholars argue that mental disorder labels, such as “depression”, “anxiety disorder”, or “schizophrenia”, can be the causes of stigmatization (e.g., Corrigan, 2007; Link et al., 1989). These scholars worry that the public might treat people with mental health diagnoses negatively because diagnoses are associated with widespread stereotypical beliefs.
Teachers often encounter students with diagnoses. In a meta-analysis, Polanczyk et al. (2015) found a world-wide prevalence of mental disorders in children and adolescents of 13.4%. The reasoning outlined above gives rise to concerns about stigmatization of students with learning and behavioral disorders. People in general tend to associate diagnostic labels with stereotypical attitudes (e.g., Carrizosa-Moog et al., 2019; Cuttler & Ryckman, 2019) and teachers might be no exception to the rule. Take the example of ADHD. Given the prevalence of ADHD of about 5% (Polanczyk et al., 2007), teachers often will encounter at least one student in their class with this label. As a teacher learns that one of their new students has been diagnosed with ADHD, they might automatically expect the student to have serious problems paying attention and sitting still (Batzle et al., 2010). The teacher might even expect the student to disrupt the classroom and to perform poorly in class exams (Ohan et al., 2011). The present study seeks to understand such negative effects of the labels dyslexia, dyscalculia, and ADHD.
Mental Health Stigma
Theories of mental health stigma differentiate between stereotypes (i.e., beliefs about people suffering from mental illness), prejudice (i.e., evaluative reactions), and discrimination (i.e., overt negative behavior; A. B. Fox et al., 2018; Rüsch et al., 2005). Mental health stereotypes and prejudice are assumed to be learned via socialization (Link et al., 1989) and later triggered by diagnostic labels (Corrigan, 2007). However, diagnostic labels are not only presumed to be activating cues, theory suggests that they can also amplify stereotypes and prejudice (Corrigan, 2007). Every clinical label is associated with diagnostic criteria, and these criteria imply that mentally ill people share the same basic characteristics. This can evoke the perception of mentally ill people as a homogenous out-group. Furthermore, diagnostic criteria can be interpreted by people as evidence that mental disorders are extremely difficult to treat or even unalterable.
Research supports the assumed role of diagnostic labels in the formation of stigmatizing believes and discriminatory behavior. Foroni and Rothbart (2011, 2013) reported that female silhouettes were perceived as more homogenous when categorized with eating disorder labels. Meta-analytic research suggested that the labels psychopathy, psychosis, antisocial personality disorder, and paraphilia led to harsher punishments of the defendant. Labeled defendants were also perceived to be more dangerous and less amenable to treatment (Berryessa & Wohlstetter, 2019). Cuttler and Ryckman (2019) manipulated the presence of the labels delusional disorder, schizophrenia, bipolar disorder, major depressive disorder, and alcohol use disorder and found a negative impact on ratings of perceived aggressiveness, attention-seeking, incompetence, confusion, disorganization, embarrassment, unreliability, unhappiness, and volatility. Finally, there is evidence that labels which identify the person with the disorder (e.g., “He is an epileptic”) cause even worse judgements about the person than labels implying that a person has a certain disorder (e.g., “He has epilepsy”; Carrizosa-Moog et al., 2019; Cuttler & Ryckman, 2019).
Label Effects in the Classroom
Self-Fulfilling Prophecy
One process possibly associated with label effects on teachers’ performance expectations is the self-fulfilling prophecy in the classroom (e.g., Jussim & Harber, 2005; Madon et al., 2011). In studies exploring this phenomenon, teachers are told that some of their students had performed well in a test of the potential for IQ development. When tested later, the students with the alleged potential performed comparatively well in class exams or IQ tests (Raudenbush, 1984). Given that these students were randomly selected, their performance improvement can be attributed to the teachers’ expectation and corresponding behavior. Thus, simply labeling a child can have a positive impact on the child’s intellectual development by changing teachers’ expectations. However, existing research on negative effects of the self-fulfilling prophecy is inconclusive (Jussim & Harber, 2005; Madon et al., 2011).
Experimental Studies
After watching a video about a child labeled emotionally disturbed or learning disabled, teachers rated the child’s personality, behavior, and academic future (Foster et al., 1975; Foster & Ysseldyke, 1976; Jacobs, 1978) and the child’s academic skills, activity level, and personal-social adjustment (Foster et al., 1976; Foster et al., 1980; Ysseldyke & Foster, 1978) more negatively compared to an unlabeled child. Other video studies found comparable results when the child was labeled as behaviorally disordered (Johnson & Blankenship, 1984) and “educable mentally retarded” (Foster & Keech, 1977). Nonetheless, there are other video-based studies in which not every label had an effect (Allday et al., 2011; Shuller & McNamara, 1976), labels affected only some of the dependent variables (Fogel & Nelson, 1983), or a label effect was found only with vignettes but not with videos (Dukes & Saudargas, 1989; Reschly & Lamprecht, 1979; Salvia et al., 1973). Some studies that used only videos did not find a label effect at all (Cornett-Ruiz & Hendricks, 1993; Fernald et al., 1985; Yoshida & Meyers, 1975).
Vignettes with the label learning disability led to more negative academic, social, and behavioral expectations (Harvey & Pellock, 2003; Minner, 1982; Minner & Prater, 1984; Thelen et al., 2004) and to a reduced tendency to refer a talented child to a program for gifted children (Bianco, 2005; Bianco & Leech, 2010; Minner et al., 1987; Minner, 1990). Beyond that, a broad range of labels have been identified to cause a negative label effect such as “mentally retarded” or “educable mentally retarded” (Aloia & MacMillan, 1983; Carroll & Reppucci, 1978; Thelen et al., 2004), emotionally disturbed (Gillung & Rucker, 1977; Parish et al., 1979), behavior disorder (Harvey & Pellock, 2003), and ADHD (Ohan et al., 2011; Stinnett et al., 2001).
However, it is important to note that several vignette studies suggested that there are limitations of negative label effects (Aloia et al., 1981; Bromfield et al., 1988; Combs & Harper, 1967; J. D. Fox & Stinnett, 1996; Levin et al., 1982; Rolison & Medway, 1985). Finally, several vignette studies have yielded null results (Duke & Prater, 1991; Graham & Leone, 1987; Javel & Greenspan, 1983; Kedar-Voivodas & Tannenbaum, 1979; Minner, 1989; O’Donohue & O’Hare, 1997; Pfeiffer, 1980; Tournaki, 2003).
Summary
Despite inconsistent findings and null results, considerable evidence exists for negative effects of diagnostic labels on teachers’ expectations, especially for the learning disability label and—to a much lesser extent—ADHD. However, while many studies have explored effects of the broad term learning disability, research on specific learning disabilities is sparse. One study found negative effects on the evaluation of students described as having a specific learning disability (Harvey & Pellock, 2003). Furthermore, only three studies investigated the impact of the dyslexia label and yielded inconclusive results. Levin et al. (1982) found no effect of that label, whereas Gibbs and Elliott (2015) reported evidence for negative and positive effects, but these results were later only partially replicated (Gibbs et al., 2020). No published study has explored the effects of the dyscalculia label. Our first experiment was conducted to fill this research gap.
Attributional Patterns Triggered by Labels
It is vital to explore the specific cognitive mechanisms that are triggered by diagnostic labels. Several studies have provided some clues to these processes (Clark, 1997; Vlachou et al., 2014; Woodcock, 2014; Woodcock & Hitches, 2017; Woodcock & Moore, 2018; Woodcock & Vialle, 2010, 2011, 2016). In all of these studies, teachers experienced less frustration and more sympathy toward a student with a learning disability, and they gave the student more positive feedback compared to a student without the diagnosis. Furthermore, they expected future failure of a diagnosed child to be more likely than failure of an undiagnosed child.
The attributional pattern explored by these studies can be interpreted as an amplification of teachers’ general tendency for a fundamental attribution error (Wang & Hall, 2018). When a child has a learning disability, the disability itself is perceived as an internal and stable cause of the child’s academic problems. Thereby, teachers neglect situational influences on the child’s behavior and focus on the student’s lack of control over its condition. Consequently, teachers react with less frustration, more sympathy, and more positive feedback, and they expect the student to fail in the future. This interpretation coheres well with the literature on mental health stigma. The diagnosis of a learning disability triggers stereotypes about the stability of a student’s condition. Furthermore, the diagnostic criteria of learning disabilities (e.g., extreme difficulties in acquiring basic academic skills) are interpreted as indicative of students’ inability to improve their academic performance.
Nevertheless, this interpretation is limited by the fact that the learning disability label has not been stated in the studies (Clark, 1997; Vlachou et al., 2014; Woodcock, 2014; Woodcock & Hitches, 2017; Woodcock & Moore, 2018; Woodcock & Vialle, 2010, 2011, 2016). The learning disability diagnosis was only implied for participants in the experimental group by describing the student as having problems with math, reading, writing, and as receiving support from a resource specialist. Furthermore, participants were not asked about their perception of the student’s problem control and problem stability.
However, three other studies in which a label was mentioned provided evidence for the outlined attributional pattern (Severence & Gasstrom, 1977; Stanley & Comer, 1988; Weisz, 1981). Participants in these studies judged a labeled child’s problems to be more stable and less under the child’s control than the problems of an unlabeled child. However, these results are limited to the outdated “mentally retarded” label. Consequently, it remains unclear whether other labels, such as ADHD, influence teachers’ attributions. For this reason, we examined label effects and attributional patterns caused by an ADHD diagnosis in Experiment 2.
Counteracting Negative Effects of Diagnostic Labels
Despite the numerous studies that have investigated interventions for reducing mental illness stigma (Corrigan et al., 2012; Rüsch et al., 2005), research is lacking on interventions for changing negative label effects in the classroom, with the exception of familiarizing participants with rating methods (Graham & Dwyer, 1987; Madle et al., 1980), providing contact with diagnosed children (Herr, 1975; Herr et al., 1976), or educating participants about disorders (Kutcher et al., 2016; Ohan et al., 2008; Parish et al., 1977; Toye et al., 2019). However, the evidence provided by these studies is limited due to small sample sizes, partially outdated labels, or the lack of an unlabeled control group.
To explore a different approach, we drew on cognitive dissonance theory (Festinger, 1957). In a typical dissonance intervention, participants are asked to generate arguments that counter their initial attitude. This request is often couched in a cover story that makes this activity seem reasonable in the context of the experiment. Arguing against one’s own attitude creates cognitive dissonance, which can be reduced by changing the initial attitude. An important part of this procedure is that participants engage in the argument generation voluntarily because otherwise they might reduce cognitive dissonance by attributing the activity to external causes (Cooper, 2007). A dissonance-based intervention seems promising because research has shown that people change their attitudes and their behavior through the mechanisms of dissonance reduction (Festinger & Carslmith, 1959; Kenworthy et al., 2011; McGrath, 2017; Stone & Fernandez, 2008). Based on this research, psychologists have deployed dissonance-based strategies to reduce stereotypes and prejudice (Heitland & Bohner, 2010), promote condom use (Stone et al., 1994), encourage the conservation of water while showering (Dickerson et al., 1992), and diminish aggression and violence in relationships (Schumacher & Slep, 2004). Other researchers have developed effective interventions for promoting ecofriendly (Osbaldiston & Schott, 2012) or health-enhancing behavior (Freijy & Kothe, 2013), and for the prevention of eating disorders (Watson et al., 2016).
The Present Research
In order to pinpoint the influence of diagnostic labels, we opted for an experimental approach based on the presentation of vignettes similar to the vignette-based approaches in the literature reviewed above. Vignettes are well-suited for keeping the information constant that is presented to participants and for manipulating only the presence of a diagnostic label. Our first aim was to explore negative label effects of specific learning disorders in German teacher students. In Experiment 1, we added the label dyslexia or dyscalculia to otherwise identical descriptions of student’s performance in reading or mathematics. We constructed the vignettes as descriptions of problems that are typical for dyslexia or dyscalculia. For this purpose, the vignettes described a discrepancy both between the child’s domain-specific performance (i.e., math or reading and spelling) and its general school related skills and a discrepancy between the child’s domain-specific performance and the performance of children of similar age. We predicted that, compared to descriptions without the label, the dyslexia label would lead to more negative performance expectations in the area of reading (Hypothesis 1a) and that the dyscalculia label would lead to more negative performance expectations in the area of mathematics (Hypothesis 1b).
In Experiment 2, we examined label effects induced by the ADHD label. For this purpose, we used vignettes that were originally constructed, validated, and successfully deployed in research by Ohan et al. (2011). Because these vignettes contained typical descriptions of ADHD-related symptoms and because Ohan et al. (2011) found large negative label effects using them, we deemed the vignettes as suitable for our research purpose. We predicted that participants’ academic expectations would be more negative when a label was given compared to the same vignette without the label (Hypothesis 2). We further hypothesized that the ADHD label would lead to a stronger tendency to perceive a student’s academic problems as stable (Hypothesis 3) and as not under the student’s control (Hypothesis 4). We also predicted that a dissonance-based intervention would diminish the label effects (Hypothesis 5). Finally, we were curious about potential gender differences in label effects of ADHD. Existing research on such differences is inconclusive (Batzle et al., 2010; Eisenberg & Schneider, 2007; Lee et al., 2019; Ohan et al., 2011). Thus, this part of our study was exploratory.
The present study adds to existing literature by providing the first investigation of the effects of the dyscalculia label and the first comparison of the dyscalculia and the dyslexia label. Furthermore, the study contributes by exploring the multifaceted effects of the ADHD label and by trying to impede these effects with a dissonance-based approach. Both contributions are important because, for the purpose of make teaching practice more unbiased, it is vital to understand the different effects of different labels and to explore ways of counteracting these effects.
Experiment 1
Method
Participants
A total of 163 teacher students (studying to become elementary school teachers, middle/secondary school teachers, teachers at an academic-track high school, or special education teachers) participated. They were recruited from university lectures on school related psychology topics and participated voluntarily. Eleven participants were excluded because of randomly answering the questions, and thus 152 students (84% female) remained in the final sample. Most of the participants (82%) were first-semester students.
Material
We constructed two pairs of vignettes (length: 91–103 words) describing a boy in fourth grade with problems in mathematics or in reading and spelling. Two of them used the label dyslexia or dyscalculia, the other two the terms “reading and spelling difficulties” or “arithmetic difficulties.” Apart from this variation, the two pairs of vignettes were identical. The vignettes described the boys as having poor spelling and math abilities in the form of low normed scores in standardized tests prior to entering a specialized treatment with a percentile of 6 in spelling and a percentile of 5 in arithmetic tests. Additional information was stated concerning the number of correct answers and errors in the standardized tests. Prior to the training, the dyslexia vignette reported 30 spelling errors in 50 words and stated an average of 12 spelling errors as the norm in regular developing students in fourth grade. For the test of arithmetic skills, the information about the performance prior to the training was a raw score of 8 from 45 points, with average students achieving 29 points in fourth grade as the frame of reference (see supplementary material for full wording of the vignettes https://osf.io/rks5g/).
In addition, a filler vignette was constructed (length 45 words) describing a girl performing at an average level in physical education who is being trained in ball throwing.
Dependent Variables
The dependent variables assessed participants’ expectations regarding the boy’s future performance in the field of the difficulties described in the vignettes. First, participants were asked to predict the number of mistakes the same boy would make or the score the boy would achieve at the end of the school year after a one-year training in spelling (for the vignettes describing a boy with reading and writing difficulties) or calculation (for the vignettes describing a boy with arithmetic difficulties). Second, participants were asked to estimate the boys’ grade before and after the training (in Germany, grades range from 1 = very good to 6 = insufficient).
Procedure
At the end of lecture session, students were informed about the study and invited to participate on a voluntary and anonymous basis. The study was characterized as an exploration of how teachers evaluate their students. Students were asked to use their smartphones or laptops to participate. They were presented with a link leading them to an online questionnaire. Participants were randomly assigned to one of four groups. First, participants were asked to indicate their gender, their current semester, and the type of school for which they were studying. Then one of the four vignettes was presented, followed by the filler vignette and a second vignette. The presentation of the vignettes was balanced as follows: Group 1 (spelling difficulties – filler – dyscalculia; n = 41), Group 2 (dyscalculia – filler – spelling difficulties; n = 33), Group 3 (dyslexia – filler – arithmetic difficulties; n = 40), Group 4 (arithmetic difficulties – filler – dyslexia; n = 38).
Design and Data Analysis Strategy
The statistical analysis of Experiment 1 was based on a one-factorial between-group design with the independent variable presence of label (label vs. no label). Labeling effects were analyzed separately for dyslexia and dyscalculia because in the spelling vignettes, errors were estimated, and in the arithmetic vignettes, raw score performances were given. Therefore, the dependent measures were not directly comparable. A repeated measures ANOVA was computed for the grades, which participants predicted prior to and after the intervention. Participants’ predictions of standardized test results were analyzed with a one-way ANOVA. For all hypothesis tests, the Type-I error probability was set at .05. To facilitate potential future meta-analyses, we also report effect sizes for nonsignificant effects.
Results
We hypothesized that performance expectations would be more favorable when participants had received the vignette without the label compared to the vignette with the label (negative label effect, Hypothesis 1a). In line with this prediction, performance expectations (number of errors) for the boy’s spelling performance after the training were more favorable after reading the non-label vignette (M = 18.95; SE = 0.40) compared to the vignette with the dyslexia label (M = 20.22; SE = 0.41), F(1, 150) = 4.89, p = .014, ηP2 = .03. For the prediction of grades, the hypothesis of a negative label effect was also supported. We found no difference between the conditions on predicted grades before the training, (label: M = 4.99; SE = 0.08; non-label: M = 4.92; SE = 0.08), F(1, 150) = 0.387, p = .535, ηP2 < .01. Participants predicted a strong overall effect of the training F(1, 150) = 919.67, p < .001, ηP2 = .86, but an even stronger effect after reading the vignette without the label as indicated by a significant interaction of measuring time and label, F(1, 150) = 4.04, p = .023, ηP2 = .03.
The hypothesis of a negative label effect (Hypothesis 1b) was not supported for participants’ predictions of arithmetic performance. The predictions of the boy’s arithmetic test performance after the training did not differ significantly between the non-label vignette group (M = 19.32; SE = 0.57) and the vignette group with the dyscalculia label (M = 18.27; SE = 0.54), F(1, 150) = 1.77, p = .185, ηP2 = .01. Predicted grades before the training did not differ between the conditions, (label: M = 4.97; SE = 0.08; non-label: M = 5.06; SE = 0.07), F(1, 150) = 0.76, p = .386, ηP2 < .01. As with the reading and spelling vignettes, we found a strong main effect for the predicted improvement of grades from before to after the training, F(1, 150) = 1014.17, p < .001, ηP2 = .98. However, the interaction of time with presence of labels failed to reach significance, F(1, 150) = 1.80, p = .091, ηP2 = .01.
Discussion
Experiment 1 supported the prediction of a negative label effect for dyslexia (“problems in reading and spelling”, Hypothesis 1a), but no clear support was found for the dyscalculia label effect (“problems in arithmetic”, Hypothesis 1b). In both domains, participants demonstrated a general pedagogic optimism for the effects of the training described in the vignettes as indicated by the strong main effect of time on the boy’s grades. In the presence of this strong main effect, it might have been difficult to establish the predicted ordinal interaction effect with the presence of labels (Strube & Bobko, 1989). In sum, however, Experiment 1 suggests that negative label effects may differ between learning disorders.
Experiment 2
Method
Preregistration, Power Analysis, and Data Exclusion
Experiment 2 was fully preregistered at Open Science Framework (https://osf.io/te49j). Prior to data collection, we decided to sample 200 participants. A sensitivity analysis using G*Power for the expected 2 × 2 between-within interaction (α = .05, 1-β = .80) yielded an effect size of η2 = .0381. Thus, an experiment based on 200 participants was sufficiently powered to detect a small to medium effect.
A criterion for data exclusion was defined prior to data collection based on the minimum time participants needed to process the vignettes and questions. Assuming a reading speed of 400 words per minute, reading the shortest vignette and all related questions (265 words) would require at least 40 s. Assuming that answering each of the nine questions in fast speed takes about 0.5 s, we deemed a processing time of 45 s or more as necessary to read the vignette and answer the questions. Therefore, responses for a vignette were not regarded as valid and were discarded from the analysis if they were given in less than 45 s.
Participants
A total of 201 teacher students (studying to become elementary school teachers, middle/secondary school teachers, teachers at an academic-track high school, or special education teachers) voluntarily participated in Experiment 2. They were recruited from university courses on school related psychology topics. Based on the criteria for data exclusion, two participants were excluded, leaving 199 students (80% female) in the sample. Most of the participants (93%) were first-semester students.
Material
The first author adapted two critical vignettes from Ohan et al. (2011) and translated them into German. In the vignettes, a seven- and a nine-year-old student are described, both of which display typical ADHD behavior such as being constantly restless, not following instructions, getting distracted, and intruding on other children’s activities (see supplementary material). Depending on the group assignment, the student’s name was male (Eric/Alexander) or female (Erica/Alexandra). One type of vignette (Eric/Erica, 9 years old) always described the student without a diagnosis, whereas in the other type (Alexander/Alexandra, 7 years old), participants were given the additional information that the child was examined and diagnosed with ADHD. The four different vignettes were comparable in length (145–158 words). To disguise the research question and reduce carry-over effects, participants were presented with a filler vignette very similar to the one deployed in Experiment 1 (see supplementary material).
Moreover, we designed a short task to induce dissonance in the dissonance intervention group. The instruction was as follows (translated from German):
At first, we would like to ask you for your assistance: For the purpose of another study, we need some remarks about disadvantages of clinical diagnoses for class. Sometimes teachers have to deal with children that were diagnosed with certain disorders (e.g., “a specific reading and spelling disorder”). Please develop some arguments why diagnoses can have a negative impact on the teacher-student relationship and why teachers should not give too much weight to such diagnoses. Your arguments will be presented to teachers in another study in an anonymized form. Of course, you are free to follow this request or not. However, it would be very helpful to us if you developed some arguments.
Research suggests that people experience dissonance when they perceive their action as voluntary and when their action has the potential of impacting other people (Cooper, 2007). When people have the impression that they are forced into action by scientists or that their behavior does not really matter, they will unlikely experience dissonance. For this reason, participants were reminded that they were not required to do the task, if they did not want to, and they were told the cover story about other teachers being confronted with their arguments. Participants in the no intervention group were presented with an unrelated filler task. They were asked to list arguments why using computers in class can be beneficial for teaching. To keep the instructions similar to the dissonance task, participants were reminded that performing the task was voluntary and were told that teachers would be presented with their arguments in another study (see supplementary material).
Dependent Variables
Each of the three dependent variables (i.e., academic performance expectations, perceived stability, and perceived control) was measured using three items based on Likert-type ratings. Participants rated how much they agreed with specific statements on a 7-point scale (ranging from 1 = no support to 7 = full support). For example, one statement regarding future academic performance expectations was (translated from German): “[Child’s name] will experience difficulties following lessons in the future.” One statement about the stability of the child’s academic problems was: “[Child’s name]’s problems in school are stable by nature and difficult to change.” One statement regarding the child’s control over his problems was: “[Child’s name] has little influence on the extent of [his/her] problems” (see supplementary material for all statements). One of the three items about future expectations and about perceived stability and two items about perceived controllability were reverse coded. As a result, higher values from all scales indicated more negative evaluations. All nine statements were presented in a random order simultaneously with the related vignette.
Given that all items were designed specifically for this study, the quality of the deployed scales was unknown. We computed a factorial analyses and eliminated one item from further analyses because its factor loadings were contrary to theoretical expectations (see supplementary material). Cronbach’s alpha was computed separately for the three items that measured a given variable relating to the labeled case and for the three items that measured a given variable relating to the unlabeled case. The internal consistency of the scales on performance expectations was good (vignette with label: Cronbach’s α = .77; vignette without label: Cronbach’s α = .66), whereas the reliability of the scales about perceived control was just acceptable (vignette with label: Cronbach’s α = .56; vignette without label: Cronbach’s α = .61). The internal consistency of the perceived stability scales was rather poor (vignette with label: Cronbach’s α = .30; vignette without label: Cronbach’s α = .33).
Procedure
Participants were recruited in a manner similar to Experiment 1. At the beginning of the online survey, participants were randomly assigned to the dissonance intervention or the no intervention group. In the dissonance intervention group, participants started with the dissonance task, whereas no intervention participants started with the filler task. There was no time limit on these tasks. Next, all participants were informed that their task for the rest of the study was to evaluate fictitious stories about students. It was stressed that participants should always answer in accordance with their personal opinion.
Each participant saw one vignette about a labeled child and one vignette without a label. Order of presentation was counterbalanced. Each vignette and all related questions were always presented on one page. In both groups, the students in the vignettes were male for one half and female for the other half of the participants. Between both critical vignettes, participants processed the filler vignette.
After evaluating the vignettes, participants indicated their gender, their current semester, and the type of school for which they were studying. At the end, participants were thanked and provided with a short explanation of the study’s purpose.
Design and Data Analysis Strategy
Experiment 2 was based on a 2 (dissonance intervention: treatment vs. no treatment) × 2 (gender of depicted student: male vs. female) × 2 (presence of label: label vs. no label) mixed design, with the first two independent variables varied between participants and presence of label varied within participants. To examine the effects of intervention and presence of label, three separate ANOVAs based on a two-factorial 2 (dissonance intervention: treatment vs. no treatment) × 2 (label: present vs. absent) design were computed with performance expectations, perceived stability, and perceived control as the dependent variables. To address the additional exploratory research question on effects of the depicted student’s gender, three separate ANOVAs based on a three-factorial 2 (dissonance intervention: treatment vs. no treatment) × 2 (label: present vs. absent) × 2 (gender of depicted student: male vs. female) design were computed with performance expectations, perceived stability, and perceived control as the dependent variables. To facilitate possible future meta-analyses, effect sizes are presented also for nonsignificant effects, and full descriptive statistics are reported in the supplementary material.
Results
Effects of Label and Dissonance Intervention
Label Effect on Performance Expectations
We stated in Hypothesis 2 that performance expectations would be more negative for a labeled child compared to a child without a label. We found a significant main effect of label, F(1, 197) = 40.10, p < .001, ηp2 = .17. In contrast to the hypothesis, however, performance expectations were more negative regarding the unlabeled child (M = 4.67, SE = 0.06) compared to the labeled child (M = 4.28, SE = 0.07) (Fig. 1).

Performance expectations. Note: Ratings of performance expectations by presence of label and dissonance intervention vs. no intervention. Error bars show standard errors of the mean
Label Effect on Perceived Stability
Our prediction in Hypothesis 3 was that participants would judge the stability of a labeled child’s problems to be higher than the problem stability of an unlabeled peer. This hypothesis was supported by a significant main effect of label, F(1, 197) = 9.10, p = .003, ηp2 = .04. Participants perceived the stability of the child’s problems to be higher when the child was labeled (M = 3.03, SE = 0.07) compared to an unlabeled child (M = 2.84, SE = 0.07) (Fig. 2).
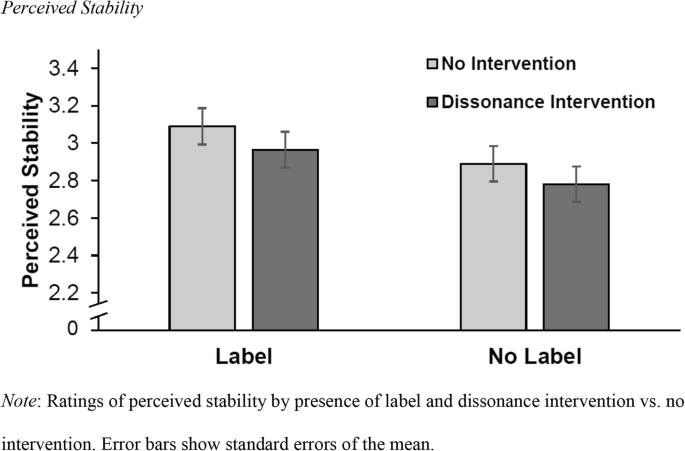
Perceived stability. Note: Ratings of perceived stability by presence of label and dissonance intervention vs. no intervention. Error bars show standard errors of the mean
Label Effect on Perceived Control
We predicted in Hypothesis 4 that perceived control would be lower for a labeled child than for an unlabeled child. This hypothesis received support from a significant main effect of label, F(1, 197) = 33.57, p < .001, ηp2 = .15. Participants rated the unlabeled child’s amount of control to be higher (M = 4.07, SE = 0.07) than the control of the labeled child (M = 4.48, SE = 0.07) (Fig. 3).
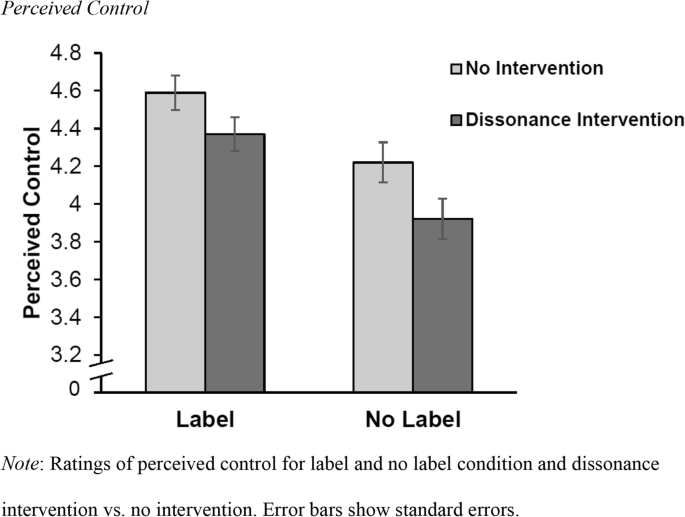
Perceived control. Note: Ratings of perceived control for label and no label condition and dissonance intervention vs. no intervention. Error bars show standard errors
Effect of Dissonance Intervention
In Hypothesis 5, we expected no label effects to occur in the group that received the dissonance intervention. We found no support for this hypothesis in our confirmatory analyses. No significant interaction was found for performance expectations, F(1, 197) = 1.52, p = .220, ηp2 < .01, and no significant main effect of the dissonance intervention, F(1, 197) = 0.38, p = .586, ηp2 < .01. Furthermore, no significant interaction F(1, 197) = 0.02, p = .895, ηp2 < .01, and no significant main effect of the dissonance intervention, F(1, 197) = 0.99, p = .322, ηp2 < .01, was found for perceived stability. Finally, no significant interaction was found for perceived control, F(1, 197) = 0.31, p = .578, ηp2 < .01. However, we found a small significant main effect of the dissonance intervention, F(1, 197) = 4.45, p = .036, ηp2 = .02. Participants in the group receiving no intervention judged the children to have lesser control over their problems (M = 4.40, SE = 0.09) than participants in the group receiving the dissonance intervention (M = 4.15, SE = 0.09).
To understand why there was no evidence for the effectiveness of the dissonance intervention we looked at the data more closely and found that a substantial amount of participants in both groups (no intervention n = 31, intervention n = 44) did not leave any comment in the control or dissonance task. Since it is highly unlikely that participants experienced dissonance without performing the initial task, we reran the ANOVAs with those participants only that followed instructions in the first task (no intervention group n = 68, intervention group n = 56). Again, there was no interaction for performance expectations, F(1, 122) < 0.01, p = .958, ηp2 < .01. However, we found a significant main effect of group, F(1, 122) = 5.51, p = .021, ηp2 = .04. Participants in the no intervention group (M = 4.60, SE = 0.09) had more negative performance expectations than participants in the intervention group (M = 4.27, SE = 0.10). For perceived stability, we found no significant interaction, F(1, 122) = 0.72, p = .399, ηp2 < .01, and no significant main effect of group F(1, 122) = 1.07, p = .303, ηp2 < .01. Participants’ ratings in the no intervention (M = 2.96, SE = 0.10) and in the intervention group (M = 2.81, SE = 0.11) were nearly identical with a slight descriptive tendency towards participants in the no intervention group perceiving the problem stability to be higher. For perceived control, we found no significant interaction, F(1, 122) = 0.36, p = .547, ηp2 < .01. However, there again was a significant main effect of group, F(1, 122) = 6.61, p = .011, ηp2 = .05. Participants’ ratings in the no intervention group (M = 4.46, SE = 0.10) were more negative than the ratings of participants in the intervention group (M = 4.09, SE = 0.11).
These exploratory results suggest that the intervention was indeed effective but that the effect did not depend on whether the ADHD label was mentioned or not. Participants in the dissonance intervention group evaluated students’ future performance and problem control more positive regardless of label.
Gender Effects
Performance Expectations
The analysis revealed no significant three-way interaction, F(1, 195) = 0.20, p = .648, ηp2 < .01, no significant interaction of label and gender, F(1, 195) = 0.99, p = .319, ηp2 < .01, no main effect of gender, F(1, 195) = 2.18, p = .142, ηp2 = .01, and no significant interaction of the dissonance intervention and gender, F(1, 195) = .78, p = .378, ηp2 < .01.
Perceived Stability
The three-way interaction was not significant, F(1, 195) = 1.00, p = .318, ηp2 < .01. Furthermore, the presence of a label did not interact significantly with the child’s gender, F(1, 195) = 1.94, p = .166, ηp2 = .01. The main effect of gender was not significant, F(1, 195) = .35, p = .555, ηp2 < .01. However, we found a significant group*gender interaction, F(1, 195) = 5.90, p = .016, ηp2 = .03 (boy control group M = 2.82, SE = 0.12, girl control group M = 3.17, SE = 0.12, boy dissonance group M = 3.00, SE = 0.12, girl dissonance group M = 2.77, SE = 0.12).
Perceived Control
The three-way interaction was not significant, F(1, 195) = 0.04, p = .847, ηp2 < .01. None of the two-way interactions were significant (interaction of label and gender: F(1, 195) = 0.43, p = .511, ηp2 < .01; interaction of dissonance intervention and gender: F(1, 195) = 2.01, p = .158, ηp2 = .01). Finally, we found no significant main effect of gender, F(1, 195) = 0.32, p = .859, ηp2 < .01.
Discussion
Experiment 2 yielded evidence contrary to the expected negative label effect (Hypothesis 2). The ADHD label did not lead to more negative performance expectations. Instead, participants had more negative expectations for the unlabeled child than the labeled child. However, our findings provided evidence for Hypotheses 3 and 4: Participants perceived the problems of a child with the ADHD label to be more stable and less under the child’s control than the problems of an unlabeled child. The results of Experiment 2 did not support Hypothesis 5. The effects of the ADHD label was not affected by a dissonance-based intervention. Finally, we found no evidence for an influence of the child’s gender on label effects.
In sum, Experiment 2 simultaneously provides evidence for positive and negative effects of the ADHD label. The finding that participants perceived a labeled student’s problems to be more stable and less under control is in line with the notion of negative attributional patterns triggered by diagnostic labels. However, participants unexpectedly had more positive performance expectations for a child with ADHD than for an unlabeled child, which suggests that the ADHD label can have a positive impact on teacher trainees. This result is in line with studies that found positive label effects (Fernald & Gettys, 1980; Jellison & Duke, 1994; Gibbs & Elliott, 2015; Nah & Tan, 2021; Ohan et al., 2011).
One speculative explanation for the positive label effect is that the ADHD label provides teachers with closure about the causes of their student’s problems and gives them hope for effective treatment. If teachers interpret the presence of the ADHD label as an indication that the child’s problems can be treated, they might expect better future performance by the child. This explanation is consistent with the finding of a negative impact of the label on evaluations of the child’s control. Teachers might conceive the labeled child’s problems as less under its control and simultaneously see the presence of a diagnostic label as a prospect for improvement. From this point of view, children with ADHD have less control over their problems because of the disorder, but the disorder will be treated therapeutically in the future. However, this explanation is difficult to reconcile with our finding that participants evaluated the labeled child’s problems as relatively stable.
The fact that the results supported Hypotheses 3 and 4 and no support was found for Hypothesis 5 in the confirmatory analyses can at first be interpreted as evidence against the effectiveness of dissonance-based interventions in changing negative label effects. These findings suggest that some of the processes triggered by diagnostic labels might not be altered by briefly raising awareness about potential problems of diagnostic labels for the teacher-student interaction. However, additional exploratory analyses of the data provided by those participants that actually followed instructions revealed that the dissonance intervention led to an overall more positive evaluation of students’ future academic performance and their problem control. Therefore, dissonance interventions might be effective but not in a label-dependent manner. Perhaps, participants resolve the cognitive dissonance raised by the intervention by paying less attention to students’ challenges no matter if a diagnostic label is present or not. Finally, the experiment provided no evidence for gender effects across all three dependent variables.
General Discussion
This study shows that diagnostic labels influence teachers’ evaluation of students in different ways. Experiment 1 yielded some support for Hypothesis 1, which stated that learning disorder labels lead to more negative performance expectations. Significant effects were found only for the dyslexia and not for the dyscalculia label. Perhaps German teacher trainees perceive dyslexia more as a “real” disorder than dyscalculia. This might be due to the fact that children with dyslexia often receive compensatory privileges in Germany (e.g., being allowed to spend more time with class exams), whereas these privileges are generally not given to students with dyscalculia.
Experiment 2 revealed negative as well as positive effects of the ADHD label. It is plausible that the ADHD label provides teachers with closure about their student’s challenges, which in turn can increase teacher’s optimism about effective interventions for the child. Thereby, the ADHD label raises the teachers’ academic expectations. Simultaneously the ADHD label leads to negative attributional patterns in teachers. The negative evaluation of the child’s problem stability and problem control triggered by the label is an adverse aspect of the categorical understanding of ADHD. Moreover, we found no unequivocal evidence for the effectiveness of the short dissonance intervention.
Taking into account that negative effects of the ADHD and the learning disorder label have been found in teachers who have evaluated their students in real world settings (e.g., Eisenberg & Schneider, 2007; Knight, 2021; Schwehr et al., 2014; Shifrer, 2013, 2016; Shifrer, Callahan, & Muller, 2013; Whitley, 2010), our results point to the urgency of developing effective interventions for counteracting negative label effects. For this purpose, more research into the specific cognitive processes triggered by diagnostic labels is needed. Understanding under which conditions a label triggers positive effects and under which conditions a label triggers negative effects is crucial. Identifying such boundary conditions could help in developing an intervention that mitigates negative label effects by emphasizing the positive aspects of a diagnostic label.
Limitations and Directions for Future Research
Our experiments are limited in several ways. First, only teacher trainees participated, and, therefore, results cannot be generalized to teachers in service or to other occupational groups.
Another limitation is the restricted quality of the scales used in Experiment 2. The measure of perceived stability had rather poor internal consistency and consisted of only two items, whereas the other two scales showed acceptable and good internal consistencies. Moreover, the scales have never been validated independently on a large-scale sample. Future research should design and validate a comprehensive questionnaire measuring teacher’s performance expectations, perceived stability, and perceived control of their students.
Using vignettes in studies inevitably creates an artificial situation for participants. Therefore, this study lacks ecological validity. Consequently, researchers should supplement experimental studies with ecologically valid studies in the future.
Furthermore, it is vital to note that the intervention deployed in Experiment 2 was rather short. Moreover, it seems possible that the dissonance intervention itself activated schematic knowledge associated with ADHD when participants encountered the vignette, leading to the unspecific positive effects of the intervention. A more comprehensive dissonance-based intervention that can avoid making the disorder salient might counter negative label effects in a more specific manner.
Finally, to our knowledge Experiment 2 is the first preregistered investigation of negative label effects on teacher’s evaluation of students. Since publications without preregistration on average report higher effects than registered publications (Schäfer & Schwarz, 2019), there is a need for more preregistered studies on label effects.
Conclusion
Our study shows that different labels can cause different label effects. These findings underscore the importance of addressing implicit personality theories, stereotypes, and label effects in teacher education to minimize biased teaching styles in the classroom. Furthermore, the study highlights the importance of further investigating differences in label effects in order to develop effective interventions to counteract negative label effects.
References
Allday, R. A., Duhon, G. J., Blackburn-Ellis, S., & van Dycke, J. L. (2011). The biasing effects of labels on direct observation by preservice teachers. Teacher Education and Special Education, 34(1), 52–58. https://doi.org/10.1177/0888406410380422.
Aloia, G. F., & MacMillan, D. L. (1983). Influence of the EMR label on initial expectations of regular-classroom teachers. American Journal of Mental Deficiency, 88(3), 255–262.
Aloia, G. F., Maxwell, J. A., & Aloia, S. (1981). Influence of a child’s race and the EMR label on initial impressions of regular-classroom teachers. American Journal of Mental Deficiency, 85(6), 619–623.
Batzle, C. S., Weyandt, L. L., Janusis, G. M., & DeVietti, T. L. (2010). Potential impact of ADHD with stimulant medication label on teacher expectations. Journal of Attention Disorders, 14(2), 157–166. https://doi.org/10.1177/1087054709347178.
Berryessa, C. M., & Wohlstetter, B. (2019). The psychopathic “label” and effects on punishment outcomes: A meta-analysis. Law and Human Behavior, 43(1), 9–25. https://doi.org/10.1037/lhb0000317.
Bianco, M. (2005). The effects of disability labels on special education and general education teachers’ referrals for gifted programs. Learning Disability Quarterly, 28(4), 285–293. https://doi.org/10.2307/4126967.
Bianco, M., & Leech, N. L. (2010). Twice-exceptional learners: Effects of teacher preparation and disability labels on gifted referrals. Teacher Education and Special Education: The Journal of the Teacher Education Division of the Council for Exceptional Children, 33(4), 319–334. https://doi.org/10.1177/0888406409356392.
Bromfield, R., Bromfield, D., & Weiss, B. (1988). Influence of the sexually abused label on perceptions of a child’s failure. Journal of Educational Research, 82(2), 96–98 https://search.proquest.com/docview/1290540048?accountid=15156.
Carrizosa-Moog, J., Salazar-Velasquez, L. V., Portillo-Benjumea, M., Rodriguez-Mejia, A., & Isaza-Jaramillo, S. (2019). Does public attitude change by labeling a person as epileptic, person with epilepsy or the acronym PWE? A systematic review. Seizure: European Journal of Epilepsy, 69, 273–278. https://doi.org/10.1016/j.seizure.2019.05.011.
Carroll, C. F., & Reppucci, N. D. (1978). Meanings that professionals attach to labels for children. Journal of Consulting and Clinical Psychology, 46(2), 372–374. https://doi.org/10.1037/0022-006X.46.2.372.
Clark, M. D. (1997). Teacher response to learning disability: A test of attributional principles. Journal of Learning Disabilities, 30(1), 69–79. https://doi.org/10.1177/002221949703000106.
Coghill, D., & Sonuga-Barke, E. J. S. (2012). Annual research review: Categories versus dimensions in the classification and conceptualisation of child and adolescent mental disorders – implications of recent empirical study. Journal of Child Psychology and Psychiatry, 53(5), 469–489. https://doi.org/10.1111/j.1469-7610.2011.02511.x.
Combs, R. H., & Harper, J. L. (1967). Effects of labels on attitudes of educators toward handicapped children. Exceptional Children, 33(6), 399–403. https://doi.org/10.1177/001440296703300607.
Cooper, J. (2007). Cognitive dissonance: Fifty years of a classic theory. SAGE Publications.
Cornett-Ruiz, S., & Hendricks, B. (1993). Effects of labeling and ADHD behaviors on peer and teacher judgments. The Journal of Educational Research, 86(6), 349–355. https://doi.org/10.1080/00220671.1993.9941228.
Corrigan, P. W. (2007). How clinical diagnosis might exacerbate the stigma of mental illness. Social Work, 52(1), 31–39. https://doi.org/10.1093/sw/52.1.31.
Corrigan, P. W., Morris, S. B., Michaels, P. J., Rafacz, J. D., & Rüsch, N. (2012). Challenging the public stigma of mental illness: A meta-analysis of outcome studies. Psychiatric Services, 63(10), 963–973. https://doi.org/10.1176/appi.ps.201100529.
Cuttler, C., & Ryckman, M. (2019). Don’t call me delusional: Stigmatizing effects of noun labels on people with mental disorders. Stigma and Health, 4(2), 118–125. https://doi.org/10.1037/sah0000132.
Dickerson, C. A., Thibodeau, R., Aronson, E., & Miller, D. (1992). Using cognitive dissonance to encourage water conservation. Journal of Applied Social Psychology, 22(11), 841–854. https://doi.org/10.1111/j.1559-1816.1992.tb00928.x.
Duke, J., & Prater, G. (1991). Preschool teachers’ expectations of preschoolers labeled developmentally delayed: A pilot study. (ERIC Document Reproduction Service No. ED 355047).
Dukes, M., & Saudargas, R. A. (1989). Teacher evaluation bias toward LD children: Attenuating effects of the classroom ecology. Learning Disability Quarterly, 12(2), 126–132. https://doi.org/10.2307/1510728.
Eisenberg, D., & Schneider, H. (2007). Perceptions of academic skills of children diagnosed with ADHD. Journal of Attention Disorders, 10(4), 390–397. https://doi.org/10.1177/1087054706292105.
Fernald, C. D., & Gettys, L. (1980). Diagnostic labels and perceptions of children’s behavior. Journal of Clinical Child Psychology, 9(3), 229–233. https://doi.org/10.1080/15374418009532996.
Fernald, C. D., Williams, R. A., & Droescher, S. D. (1985). Actions speak louder…: Effects of diagnostic labels and child behavior on perceptions of children. Professional Psychology: Research and Practice, 16(5), 648–660. https://doi.org/10.1037/0735-7028.16.5.648.
Festinger, L. (1957). A theory of cognitive dissonance. Stanford University Press.
Festinger, L., & Carslmith, J. M. (1959). Cognitive consequences of forced compliance. The Journal of Abnormal and Social Psychology, 58(2), 203–210. https://doi.org/10.1037/h0041593.
Fogel, L. S., & Nelson, R. O. (1983). The effects of special education labels on teachers’ behavioral observations, checklist scores, and grading of academic work. Journal of School Psychology, 21(3), 241–251. https://doi.org/10.1016/0022-4405(83)90019-5.
Foroni, F., & Rothbart, M. (2011). Category boundaries and category labels: When does a category name influence the perceived similarity of category members? Social Cognition, 29(5), 547–576. https://doi.org/10.1521/soco.2011.29.5.547.
Foroni, F., & Rothbart, M. (2013). Abandoning a label doesn’t make it disappear: The perseverance of labeling effects. Journal of Experimental Social Psychology, 49(1), 126–131. https://doi.org/10.1016/j.jesp.2012.08.002.
Foster, G., & Keech, V. (1977). Teacher reactions to the label of educable mentally retarded. Education and Training of the Mentally Retarded, 12(4), 307–311.
Foster, G., & Ysseldyke, J. (1976). Expectancy and halo effects as a result of artificially induced teacher bias. Contemporary Educational Psychology, 1(1), 37–45. https://doi.org/10.1016/0361-476X(76)90005-9.
Foster, G., Ysseldyke, J. E., & Reese, J. H. (1975). I wouldn’t have seen it if I hadn’t believed it. Exceptional Children, 41(7), 469–473. https://doi.org/10.1177/001440297504100701.
Foster, G., Schmidt, C. R., & Sabatino, D. (1976). Teacher expectancies and the label “Learning Disabilities”. Journal of Learning Disabilities, 9(2), 111–114. https://doi.org/10.1177/002221947600900209.
Foster, G., Algozzine, B., & Ysseldyke, J. (1980). Classroom teacher and teacher-in-training susceptibility to stereotypical bias. The Personnel and Guidance Journal, 59(1), 27–30. https://doi.org/10.1002/j.2164-4918.1980.tb00478.x.
Fox, J. D., & Stinnett, T. A. (1996). The effects of labeling bias on prognostic outlook for children as a function of diagnostic label and profession. Psychology in the Schools, 33(2), 143–152. https://doi.org/10.1002/(SICI)1520-6807(199604)33:2<143::AID-PITS7>3.0.CO;2-S.
Fox, A. B., Earnshaw, V. A., Taverna, E. C., & Vogt, D. (2018). Conceptualizing and measuring mental illness stigma: The mental illness stigma framework and critical review of measures. Stigma and Health, 3(4), 348–376. https://doi.org/10.1037/sah0000104.
Freijy, T., & Kothe, E. J. (2013). Dissonance-based interventions for health behaviour change: A systematic review. British Journal of Health Psychology, 18(2), 310–337. https://doi.org/10.1111/bjhp.12035.
Gibbs, S., & Elliott, J. (2015). The differential effects of labelling: How do ‘dyslexia’ and ‘reading difficulties’ affect teachers’ beliefs? European Journal of Special Needs Education, 30(3), 323–337. https://doi.org/10.1080/08856257.2015.1022999.
Gibbs, S., Beckmann, J. F., Elliott, J., Metsäpelto, R.-L., Vehkakoski, T., & Aro, M. (2020). What’s in a name: The effect of category labels on teachers’ beliefs. European Journal of Special Needs Education, 35(1), 115–127. https://doi.org/10.1080/08856257.2019.1652441.
Gillung, T. B., & Rucker, C. N. (1977). Labels and teacher expectations. Exceptional Children, 43(7), 464–465. https://doi.org/10.1177/001440297704300712.
Graham, S., & Dwyer, A. (1987). Effects of the learning disability label, quality of writing performance, and examiner’s level of expertise on the evaluation of written products. Journal of Learning Disabilities, 20(5), 317–318. https://doi.org/10.1177/002221948702000513.
Graham, S., & Leone, P. (1987). Effects of behavioral disability labels, writing performance, and examiner’s expertise on the evaluation of written products. The Journal of Experimental Education, 55(2), 89–94. https://doi.org/10.1080/00220973.1987.10806439.
Harvey, M. W., & Pellock, C. (2003). Influences of student educational labels, behaviors, and learning characteristics as perceived by Pennsylvania’s secondary career and technical educators. The Journal for Vocational Special Needs Education, 25(2), 30–41.
Heitland, K., & Bohner, G. (2010). Reducing prejudice via cognitive dissonance: Individual differences in preference for consistency moderate the effects of counter-attitudinal advocacy. Social Influence, 5(3), 164–181. https://doi.org/10.1080/15534510903332261.
Herr, D. E. (1975). Camp counseling with emotionally disturbed adolescents. Exceptional Children, 41(5), 331–332. https://doi.org/10.1177/001440297504100504.
Herr, D. E., Algozzine, B., & Eaves, R. C. (1976). Modification of biases held by teacher trainees toward the disturbingness of child behaviors. The Journal of Educational Research, 69(7), 261–264. https://doi.org/10.1080/00220671.1976.10884893.
Jacobs, W. R. (1978). The effect of the learning disability label on classroom teachers’ ability objectively to observe and interpret child behaviors. Learning Disability Quarterly, 1(1), 50–55. https://doi.org/10.2307/1510963.
Javel, M. E., & Greenspan, S. (1983). Influence of personal competence profiles on mainstreaming recommendations of school psychologists. Psychology in the Schools, 20(4), 495–465. https://doi.org/10.1002/1520-6807(198310)20:4<459::AID-PITS2310200413>3.0.CO;2-2.
Jellison, J. A., & Duke, R. A. (1994). The mental retardation label: Music teachers’ and prospective teachers’ expectations for children’s social and music behaviors. Journal of Music Therapy, 31(3), 166–185. https://doi.org/10.1093/jmt/31.3.166.
Johnson, L. J., & Blankenship, C. S. (1984). A comparison of label-induced expectancy bias in two preservice teacher education programs. Behavioral Disorders, 9(3), 167–174. https://doi.org/10.1177/019874298400900305.
Jussim, L., & Harber, K. D. (2005). Teacher expectations and self-fulfilling prophecies: Knowns and unknowns, resolved and unresolved controversies. Personality and Social Psychology Review, 9(2), 131–155. https://doi.org/10.1207/s15327957pspr0902_3.
Kedar-Voivodas, G., & Tannenbaum, A. J. (1979). Teachers’ attitudes toward young deviant children. Journal of Educational Psychology, 71(6), 800–808. https://doi.org/10.1037/0022-0663.71.6.800.
Kenworthy, J. B., Miller, N., Collins, B. E., Read, S. J., & Earleywine, M. (2011). A trans-paradigm theoretical synthesis of cognitive dissonance theory: Illuminating the nature of discomfort. European Review of Social Psychology, 22(1), 36–113. https://doi.org/10.1080/10463283.2011.580155.
Knight, C. (2021). The impact of the dyslexia label on academic outlook and aspirations: An analysis using propensity score matching. British Journal of Educational Psychology. Advance online publication. https://doi.org/10.1111/bjep.12408.
Kutcher, S., Wei, Y., Gilberds, H., Ubuguyu, O., Njau, T., Brown, A., Sabuni, N., Magimba, A., & Perkins, K. (2016). A school mental health literacy curriculum resource training approach: Effects on Tanzanian teachers’ mental health knowledge, stigma and help-seeking efficacy. International Journal of Mental Health Systems, 10(50), 1–9. https://doi.org/10.1186/s13033-016-0082-6.
Lee, K. W., Cheung, R. Y. M., & Chen, M. (2019). Preservice teachers’ self-efficacy in managing students with symptoms of attention deficit/hyperactivity disorder: The roles of diagnostic label and students’ gender. Psychology in the Schools, 56(4), 595–607. https://doi.org/10.1002/pits.22221.
Levin, J., Arluke, A., & Smith, M. (1982). The effects of labeling students upon teachers’ expectations and intentions. Journal of Social Psychology, 118(2), 207–212 https://search.proquest.com/docview/1290630374?accountid=15156.
Link, B. G., Cullen, F. T., Struening, E., Shrout, P. E., & Dohrenwend, B. P. (1989). A modified labeling theory approach to mental disorders: An empirical assessment. American Sociological Review, 54(3), 400. https://doi.org/10.2307/2095613.
Madle, R. A., Neisworth, J. T., & Kurtz, P. D. (1980). Biasing of hyperkinetic behavior ratings by diagnostic reports: Effects of observer training and assessment method. Journal of Learning Disabilities, 13(1), 35–38. https://doi.org/10.1177/002221948001300108.
Madon, S., Willard, J., Guyll, M., & Scherr, K. C. (2011). Self-fulfilling prophecies: Mechanisms, power, and links to social problems. Social and Personality Psychology Compass, 5(8), 578–590. https://doi.org/10.1111/j.1751-9004.2011.00375.x.
McGrath, A. (2017). Dealing with dissonance: A review of cognitive dissonance reduction. Social and Personality Psychology Compass, 11(12), 1–17. https://doi.org/10.1111/spc3.12362.
Minner, S. (1982). Expectations of vocational teachers for handicapped students. Exceptional Children, 48(5), 451–453. https://doi.org/10.1177/001440298204800509.
Minner, S. (1989). Initial referral recommendations of teachers toward gifted students with behavioral problems. Roeper Review, 12(2), 78–80. https://doi.org/10.1080/02783198909553240.
Minner, S. (1990). Teacher evaluations of case descriptions of LD gifted children. Gifted Child Quarterly, 34(1), 37–39. https://doi.org/10.1177/001698629003400108.
Minner, S., & Prater, G. (1984). College teachers’ expectations of LD students. Academic Therapy, 20(2), 225–229. https://doi.org/10.1177/105345128402000213.
Minner, S., Prater, G., Bloodworth, H., & Walker, S. (1987). Referral and placement recommendations of teachers toward gifted handicapped children. Roeper Review, 9(4), 247–249. https://doi.org/10.1080/02783198709553064.
Nah, Y., & Tan, J. W. (2021). The effect of diagnostic labels on teachers’ perceptions of behaviours of students with autism spectrum disorder. British Journal of Educational Psychology, 91(1), 315–327. https://doi.org/10.1111/bjep.12368.
O’Donohue, W., & O’Hare, E. (1997). How do teachers react to children labeled as sexually abused? Child Maltreatment, 2(1), 46–51. https://doi.org/10.1177/1077559597002001005.
Ohan, J. L., Cormier, N., Hepp, S. L., Visser, T. A. W., & Strain, M. C. (2008). Does knowledge about attention-deficit/hyperactivity disorder impact teachers’ reported behaviors and perceptions? School Psychology Quarterly, 23(3), 436–449. https://doi.org/10.1037/1045-3830.23.3.436.
Ohan, J. L., Visser, T. A. W., Strain, M. C., & Allen, L. (2011). Teachers’ and education students’ perceptions of and reactions to children with and without the diagnostic label “ADHD”. Journal of School Psychology, 49(1), 81–105. https://doi.org/10.1016/j.jsp.2010.10.001.
Osbaldiston, R., & Schott, J. P. (2012). Environmental sustainability and behavioral science. Environment and Behavior, 44(2), 257–299. https://doi.org/10.1177/0013916511402673.
Parish, T. S., Eads, G. M., Reece, N. H., & Piscitello, M. A. (1977). Assessment and attempted modification of future teachers’ attitudes toward handicapped children. Perceptual and Motor Skills, 44(2), 540–542. https://doi.org/10.2466/pms.1977.44.2.540.
Parish, T. S., Dyck, N., & Kappes, B. M. (1979). Stereotypes concerning normal and handicapped children. The Journal of Psychology, 102(1), 63–70. https://doi.org/10.1080/00223980.1979.9915095.
Pfeiffer, S. I. (1980). The influence of diagnostic labeling on special education placement decisions. Psychology in the Schools, 17(3), 346–350. https://doi.org/10.1002/1520-6807(198007)17:3<346::AID-PITS2310170311>3.0.CO;2-N.
Polanczyk, G., de Lima, M. S., Horta, B. L., Biederman, J., & Rohde, L. A. (2007). The worldwide prevalence of ADHD: A systematic review and metaregression analysis. The American Journal of Psychiatry, 164(6), 942–948. https://doi.org/10.1176/appi.ajp.164.6.942.
Polanczyk, G. V., Salum, G. A., Sugaya, L. S., Caye, A., & Rohde, L. A. (2015). Annual research review: A meta-analysis of the worldwide prevalence of mental disorders in children and adolescents. Journal of Child Psychology and Psychiatry, 56(3), 345–365. https://doi.org/10.1111/jcpp.12381.
Raudenbush, S. W. (1984). Magnitude of teacher expectancy effects on pupil IQ as a function of the credibility of expectancy induction: A synthesis of findings from 18 experiments. Journal of Educational Psychology, 76(1), 85–97. https://doi.org/10.1037/0022-0663.76.1.85.
Reschly, D. J., & Lamprecht, M. J. (1979). Expectancy effects of labels: Fact or artifact? Exceptional Children, 46(1), 55–58. https://doi.org/10.1177/001440297904600110.
Rolison, M. A., & Medway, F. J. (1985). Teachers’ expectations and attributions for student achievement: Effects of label, performance pattern, and special education intervention. American Educational Research Journal, 22(4), 561–573. https://doi.org/10.3102/00028312022004561.
Rüsch, N., Angermeyer, M. C., & Corrigan, P. W. (2005). Mental illness stigma: Concepts, consequences, and initiatives to reduce stigma. European Psychiatry: The Journal of the Association of European Psychiatrists, 20(8), 529–539. https://doi.org/10.1016/j.eurpsy.2005.04.004.
Salvia, J., Clark, G. M., & Ysseldyke, J. E. (1973). Teacher retention of stereotypes of exceptionality. Exceptional Children, 39(8), 651–652. https://doi.org/10.1177/001440297303900807.
Schäfer, T., & Schwarz, M. A. (2019). The meaningfulness of effect sizes in psychological research: Differences between sub-disciplines and the impact of potential biases. Frontiers in Psychology, 10, 813. https://doi.org/10.3389/fpsyg.2019.00813.
Schumacher, J. A., & Slep, A. M. S. (2004). Attitudes and dating aggression: A cognitive dissonance approach. Prevention Science: The Official Journal of the Society for Prevention Research, 5(4), 231–243. https://doi.org/10.1023/B:PREV.0000045357.19100.77.
Schwehr, E., Bocanegra, J. O., Kwon, K., & Sheridan, S. M. (2014). Impact of children’s identified disability status on parent and teacher behavior ratings. Contemporary School Psychology, 18(2), 133–142. https://doi.org/10.1007/s40688-014-0014-x.
Severence, L. J., & Gasstrom, L. L. (1977). Effects of the label “mentally retarded” on causal explanations for success and failure outcomes. American Journal of Mental Deficiency, 81(6), 547–555.
Shifrer, D. (2013). Stigma of a label: Educational expectations for high school students labeled with learning disabilities. Journal of Health and Social Behavior, 54(4), 462–480. https://doi.org/10.1177/0022146513503346.
Shifrer, D. (2016). Stigma and stratification limiting the math course progression of adolescents labeled with a learning disability. Learning and Instruction, 42, 47–57. https://doi.org/10.1016/j.learninstruc.2015.12.001.
Shifrer, D., Callahan, R. M., & Muller, C. (2013). Equity or marginalization? The high school course-taking of students labeled with a learning disability. American Educational Research Journal, 50(4), 656–682. https://doi.org/10.3102/0002831213479439.
Shuller, D. Y., & McNamara, J. R. (1976). Expectancy factors in behavioral observation. Behavior Therapy, 7(4), 519–527. https://doi.org/10.1016/S0005-7894(76)80172-4.
Stanley, M. A., & Comer, R. J. (1988). Reacting to mentally retarded persons: The impact of labels and observed behaviors. Journal of Social and Clinical Psychology, 6(3–4), 279–292. https://doi.org/10.1521/jscp.1988.6.3-4.279.
Stinnett, T. A., Crawford, S. A., Gillespie, M. D., Cruce, M. K., & Langford, C. A. (2001). Factors affecting treatment acceptability for psychostimulant medication versus psychoeducational intervention. Psychology in the Schools, 38(6), 585–591. https://doi.org/10.1002/pits.1045.
Stone, J., & Fernandez, C. (2008). To practice what we preach: The use of hypocrisy and cognitive dissonance to motivate behavior change. Social and Personality Psychology Compass, 2(2), 1024–1051. https://doi.org/10.1111/j.1751-9004.2008.00088.x.
Stone, J., Aronson, E., Crain, A. L., Winslow, M. P., & Fried, C. B. (1994). Inducing hypocrisy as a means of encouraging young adults to use condoms. Personality and Social Psychology Bulletin, 20(1), 116–128. https://doi.org/10.1177/0146167294201012.
Strube, M. J., & Bobko, P. (1989). Testing hypotheses about ordinal interactions: Simulations and further comments. Journal of Applied Psychology, 74(2), 247–252.
Thelen, R. L., Burns, M. K., & Christiansen, N. D. (2004). Effects of high-incidence disability labels on the expectations of teachers, peers, and college students. Ethical Human Sciences & Services, 5(3), 183–193 https://search.proquest.com/docview/620360579?accountid=15156.
Tournaki, N. (2003). Effect of student characteristics on teachers’ predictions of student success. The Journal of Educational Research, 96(5), 310–319. https://doi.org/10.1080/00220670309597643.
Toye, M. K., Wilson, C., & Wardle, G. A. (2019). Education professionals’ attitudes towards the inclusion of children with ADHD: The role of knowledge and stigma. Journal of Research in Special Educational Needs, 19(3), 184–196. https://doi.org/10.1111/1471-3802.12441.
Vlachou, A., Eleftheriadou, D., & Metallidou, P. (2014). Do learning difficulties differentiate elementary teachers’ attributional patterns for students’ academic failure? A comparison between Greek regular and special education teachers. European Journal of Special Needs Education, 29(1), 1–15. https://doi.org/10.1080/08856257.2013.830440.
Wang, H., & Hall, N. C. (2018). A systematic review of teachers’ causal attributions: Prevalence, correlates, and consequences. Frontiers in Psychology, 9, 2305. https://doi.org/10.3389/fpsyg.2018.02305.
Watson, H. J., Joyce, T., French, E., Willan, V., Kane, R. T., Tanner-Smith, E. E., McCormack, J., Dawkins, H., Hoiles, K. J., & Egan, S. J. (2016). Prevention of eating disorders: A systematic review of randomized, controlled trials. The International Journal of Eating Disorders, 49(9), 833–862. https://doi.org/10.1002/eat.22577.
Weisz, J. R. (1981). Effects of the “mentally retarded” label on adult judgments about child failure. Journal of Abnormal Psychology, 90(4), 371–374. https://doi.org/10.1037/0021-843X.90.4.371.
Whitley, J. (2010). Modelling the influence of teacher characteristics on student achievement for Canadian students with and without learning disabilities. International Journal of Special Education, 25(3), 88–97.
Woodcock, S. (2014). Attributional beliefs of Canadian trainee teachers toward students with a learning disability. Alberta Journal of Educational Research, 60(1), 119–134.
Woodcock, S., & Hitches, E. (2017). Potential or problem? An investigation of secondary school teachers’ attributions of the educational outcomes of students with specific learning difficulties. Annals of Dyslexia, 67(3), 299–317. https://doi.org/10.1007/s11881-017-0145-7.
Woodcock, S., & Moore, B. (2018). Inclusion and students with specific learning difficulties: The double-edged sword of stigma and teacher attributions. Educational Psychology, 88(5), 1–20. https://doi.org/10.1080/01443410.2018.1536257.
Woodcock, S., & Vialle, W. (2010). Attributional beliefs of students with learning disabilities. The International Journal of Learning, 17(7), 177–191.
Woodcock, S., & Vialle, W. (2011). Are we exacerbating students’ learning disabilities? An investigation of preservice teachers’ attributions of the educational outcomes of students with learning disabilities. Annals of Dyslexia, 61(2), 223–241. https://doi.org/10.1007/s11881-011-0058-9.
Woodcock, S., & Vialle, W. (2016). An examination of pre-service teachers’ attributions for students with specific learning difficulties. Learning and Individual Differences, 45, 252–259. https://doi.org/10.1016/j.lindif.2015.12.021.
Yoshida, R. K., & Meyers, C. E. (1975). Effects of labeling as educable mentally retarded on teachers’ expectancies for change in a student’s performance. Journal of Educational Psychology, 67(4), 521–527. https://doi.org/10.1037/h0077020.
Ysseldyke, J. E., & Foster, G. G. (1978). Bias in teachers’ observations of emotionally disturbed and learning disabled children. Exceptional Children, 44(8), 613–615. https://doi.org/10.1177/001440297804400806.
Availability of Data and Material
Materials and data for the reported experiments are available at the repository of the Open Science Framework (https://osf.io/rks5g/).
Code Availability
SPSS-Code underlying the analyses is available at the repository of the Open Science Framework (https://osf.io/rks5g/).
Funding
Open Access funding enabled and organized by Project DEAL. We received funding for this study from the Human Dynamics Center of the Faculty of Human Sciences at the University of Würzburg.
Author information
Authors and Affiliations
Corresponding author
Ethics declarations
Ethics Approval
In line with the ethical standards of the University of Würzburg and the German Psychological Society, no approval by any ethics committee was necessary for the conducted study.
Consent to Participate
All subjects participated on a voluntary basis. It was emphasized that all participants could withdraw their participation any time.
Consent for Publication
All subjects were informed that their data will be published in an anonymous form.
Conflicts of Interest/Competing Interests
We have no conflicts of interest to disclose.
Additional information
Publisher’s Note
Springer Nature remains neutral with regard to jurisdictional claims in published maps and institutional affiliations.
Rights and permissions
Open Access This article is licensed under a Creative Commons Attribution 4.0 International License, which permits use, sharing, adaptation, distribution and reproduction in any medium or format, as long as you give appropriate credit to the original author(s) and the source, provide a link to the Creative Commons licence, and indicate if changes were made. The images or other third party material in this article are included in the article's Creative Commons licence, unless indicated otherwise in a credit line to the material. If material is not included in the article's Creative Commons licence and your intended use is not permitted by statutory regulation or exceeds the permitted use, you will need to obtain permission directly from the copyright holder. To view a copy of this licence, visit http://creativecommons.org/licenses/by/4.0/.
About this article

Cite this article
Franz, D.J., Lenhard, W., Marx, P. et al. Here I sit, making men in my own image: how learning disorder labels affect teacher student’s expectancies. Curr Psychol 42, 9795–9809 (2023). https://doi.org/10.1007/s12144-021-02250-0
Accepted:
Published:
Issue Date:
DOI: https://doi.org/10.1007/s12144-021-02250-0