
Abstract
Biodiesel is an alternative renewable fuel which is produced by using biomass resources. Its physicochemical properties are close to those of the petroleum diesel fuel. This study highlights biodiesel production from safflower seed oil. The main aim of this experimental work is to optimize the process parameters, namely the methanol-to-oil molar ratio, catalyst concentration, reaction time and reaction temperature for biodiesel production. The Taguchi robust design approach was used with an L9 orthogonal array to analyze the influence of process factors on performance parameters. The results showed that the optimum yield of biodiesel was 93.8% with viscosity 5.60 cSt, with a methanol-to-oil molar ratio of 4:1, catalyst concentration of 1.5 wt%, reaction time of 90 min and reaction temperature of 60 °C. The catalyst concentration was found to be the most influencing parameter which contributed 51.1% and 50.8% of the total effect on the yield of biodiesel, Y 1, and viscosity of biodiesel, Y 2, respectively.
1 Introduction
Nowadays, biodiesel has become an important renewable fuel due to its eco-friendly nature. It is obtained from biomass resources (Murugesan et al. 2009). Vegetable oils are used as the main resource of biodiesel. Many studies on these crops are aimed to develop new species of fast-growing productive plants with high yield of oil. Some breeds of plants which produce non-edible vegetable oils are becoming the targets for biodiesel production. Biofuel projects have been launched in 200 districts of 18 states in India as per Planning Commission of India (Bijalwan et al. 2006; Subba 2005; Abdul Kalam 2005). Nowadays, fossil fuels like gasoline, natural gas and petroleum-based diesel are used for mainly fulfilling the energy demand of the world. Such resources of fossil fuels are gradually declining and will not meet future energy demands, rapid development of technologies as well as the growth of population (Isik et al. 2013). The forecast future reduction in the supply of fossil fuels has promoted efforts to motivate the implementation of renewable energy sources such as bio-based fuel resources. As replacements for fossil fuels, various types of bio-based fuel such as vegetable oils (raw, processed or used), methyl esters from oil and liquid fuels from biomass have been examined (Ahmad et al. 2007; Karabas 2014). In this century, various researchers have accelerated the study on alternative energy and renewable fuels. Biodiesel produced from vegetable oils and its derivatives has been identified to be a major substitute for petro-diesel fuel. Direct application of vegetable oils in engines creates some problems due to their high viscosity and low volatility. It has been proposed that the transesterification process is one of the promising methods to convert vegetable oil to fatty acid alkyl ester which can be used in existing diesel fuel-based engines (Puhan et al. 2005; Chang et al. 1996). The factors which affect the transesterification process are the methanol-to-oil molar ratio, catalyst concentration, reaction time, reaction temperature and free fatty acid contents (Balat 2008; Demirbas 2003). Transesterification pyrolysis of safflower bio-oil to produce biodiesel has been reported by Sensoz et al. (2008). It was observed that biofuels derived from vegetables are eco-friendly (Ilkilic et al. 2011). Although India is the largest safflower-producing country, only small amounts of safflower oil are exported from here. USA and Mexico are the biggest producers of safflower in terms of world trade followed by Australia and Argentina (Mittelbach and Remschmidt 2004).
Carthamustinctorius sp. is the scientific name of safflower, whose oil is colorless and odorless. It is one of the potential oilseed crops, and its seeds contain about 32%–40% oil (Weiss 1971). Safflower oil is used in medications and considered to be ideal for cosmetics (Weiss 1971; Smith 1996). It is preferred for varnishing in paint industries due to its specific properties like the absence of linolenic acid, the presence of high linoleic acid, low color values, low free fatty acid, unsaponifiability and the absence of wax, which make the quality of paints, alkyd resins and coatings beyond comparison (Smith 1996). However, due to the availability of cheaper petroleum products, the use of safflower oil has been reduced in paint and varnish industries (Singh and Nimbkar 2006). The objective of this paper is to optimize the process of production of biodiesel from safflower oil using the statistical Taguchi approach. This is an experimental design technique which helps to interpret the controlling factors, their effects and experimental orders from very few experiments (Kim et al. 2010). This study was done to observe the effects of methanol-to-oil molar ratio, catalyst concentration, reaction time and reaction temperature on the transesterification reaction.
2 Materials and methods
2.1 Materials
Safflower seed oil was purchased from Surajbala Export Pvt. Ltd, Delhi, India. All reagents such as methanol (GR grade, moisture <0.02%) and analytical-grade catalyst potassium hydroxide (KOH) were obtained from a local chemical store.
2.2 Alkaline transesterification process
The safflower oil was filtered using filter paper and was used for biodiesel production by the transesterification procedure (Fig. 1).

Schematic diagram of biodiesel production process
-
(1)
150 g of safflower oil was taken in a 250-mL glass vessel and preheated up to 105–110 °C to remove the moisture from the oil and then allowed to cool to 45–50 °C.
-
(2)
Now methyl alcohol (CH3OH) for methanol-to-oil molar ratios of 4:1, 6:1 and 8:1 and catalyst potassium hydroxide (KOH) at 0.5 wt% (weight percent), 1.0 and 1.5 w% of the oil were mixed together.
-
(3)
This homogeneous mixture of methyl alcohol and catalyst KOH was mixed with 150 g safflower oil.
-
(4)
The conical flask containing the mixture of oil, alcohol and catalyst was heated at a constant temperature of 50–60 °C (Patrascoiu et al. 2013; Meka et al. 2007; Duz et al. 2011) and stirred at the same time simultaneously inside a water bath shaker at about 700 rev/min for 60 min, 75 min and 90 min, respectively.
-
(5)
After completion of the reaction time, the products were poured into a separating funnel and kept 1–2 h for separation of phases (Ilkilic et al. 2011). In the separating funnel, the products separated into two layers. Due to higher specific weight, glycerol settled at the bottom and the upper layer was biodiesel (Fig. 2c). The glycerol was discarded.
Fig. 2 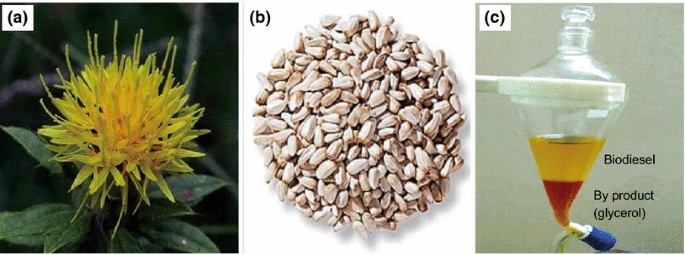
a Safflower, b safflower seed, c safflower biodiesel and glycerol
-
(6)
After separation, the biodiesel was washed with hot distilled water in order to remove remaining methyl alcohol, catalyst and impurities present.
-
(7)
Finally, the biodiesel was placed in a hot air oven and heated at 100 °C to remove excess water content.

2.3 Experimental design by the Taguchi approach
The Taguchi method is a statistical experimental design approach, which is based on specially designed orthogonal arrays to evaluate entire process parameters and their effect on the process. This approach gives the minimum number of experimental sets and provides with complete information about performance parameters influenced by factors. This technique has rarely been compared with other methods, whether analytically or experimentally (Ross 1989). The statistical technique was used in this method to analyze the process conditions. Taguchi method is favored over “single process factor at a time” experiments as it gives wide information about the interaction between the process parameters, and the optimized condition can be achieved with a limited number of experiments (Phadke 1995).
The Taguchi method provides much diminished variance of the experiment with appropriate settings of process parameters. For the optimization of performance parameters, the signal-to-noise ratio (S/N ratio) needs to be calculated for each experiment. Three types of S/N ratio were defined in the Taguchi method based upon the goal of an experiment which is shown in Table 1.
In the present study, three level designs have been done by using the Taguchi approach in Minitab 2016 software. Table 2 shows the chosen factors that affect the performance parameters which were the methanol-to-oil molar ratio (X 1), catalyst concentration (X 2), reaction time (X 3) and reaction temperature (X 4). Two performance parameters were considered in this experiment: (1) the percentage yield of biodiesel (Y 1) and (2) the viscosity of biodiesel at 40 °C in cSt (Y 2).
Nine experiments run using the Taguchi method were selected according to orthogonal array L9. The experimental design matrix and effect of factors on the performance parameters are shown in Table 3.
2.4 Analysis of variance (ANOVA)
Evaluation of experimental data was based on S/N ratio. It was carried out from the optimal design of process parameter combinations. In this study, “larger is better” S/N ratio was selected to attain maximum yield of biodiesel and based on the nature of performance parameters, “smaller is better” S/N ratio has been adopted for the viscosity of biodiesel. By using S/N ratio approach, it was feasible to get the optimum level of the individual process parameters and those optimum parameters providing the highest yield of biodiesel. However, to determine which factor has affected the product significantly and how much they contributed, statistical analysis of variance (ANOVA) of the response data can be used. The percentage of contribution of the factors was evaluated with the following equations (Kumar et al. 2015).
where S f is the sum of squares of fth factor and S T is the total sum of squares of all parameters.
3 Results and discussion
3.1 Statistical analysis: effect of factors
In the present work, maximum biodiesel yield and minimum viscosity were assigned as objectives. Therefore, larger S/N ratio was best for the performance parameter Y 1 and smaller S/N ratio for the performance parameter Y 2. The S/N ratio at each level for all four factors and their range and rank are tabulated in Table 4.
From Table 4 it can be seen that the rank of each process parameter was given along with their range. The range of each process parameter was calculated as the difference between largest and smallest S/N ratio. The higher value of range was designated as rank 1. As per rank of the process parameter, the parameter X 2 (catalyst concentration) has been recognized as the most effective parameter for both performance parameters Y 1 and Y 2.
The effects of each process parameter on the performance parameter at three different levels are shown in Figs. 3 and 4. The maximum value of S/N ratio in each plot of performance parameters describes the optimum level for a particular parameter. For maximum biodiesel yield and minimum viscosity, the optimum level of each parameter was X 1 (methanol-to-oil molar ratio) at level 0 (6:1), X 2 (catalyst concentration) at level 0 (1 wt%), X 3 (reaction time) at level 1 (90 min), X 4 (reaction temperature) at level 0 (55 °C) and X 1 (methanol-to-oil molar ratio) at level −1 (4:1), X 2 (catalyst concentration) at level 1 (1.5 wt%), X 3 (reaction time) at level −1 (60 min), X 4 (reaction temperature) at level 1 (60 °C), respectively.

S/N ratio graph for % yield (Y 1) of biodiesel

S/N ratio graph for viscosity (Y 2)
3.2 Analysis of variance (ANOVA)
The calculated sum of square (S f ) and percentage of contribution factors are shown in Table 5. From the contributions (Table 5), it can be concluded that the factor X 2 (concentration of catalyst) was the most influencing parameter for both performance parameters. The factor X 2 (concentration of catalyst) contributed 51.1% of the total effect of contribution, and among the rests, factors X 4 (reaction temperature), X 1 (methanol-to-oil molar ratio), X 3 (time of reaction) contributed 32.8%, 12.6% and 3.4%, respectively, for the performance parameter Y 1 (biodiesel yield). On the other hand, factors X 2, X 1, X 4 and X 3 were provided 50.8%, 22.0%, 18.0% and 9.1% contribution, respectively, for the performance parameter Y 2 (viscosity).
Regression analysis has been carried out by the obtained data of biodiesel yield (Y 1) and is specified as the equation given below.
Equation:
Figure 5 represents the 3D surface plot of the combination of process parameters (X 1 , X 2 ; X 2, X 3 ; X 3 , X 4 ; X 4 , X 1 vs. Y 1). The maximum yield of biodiesel was obtained with methanol-to-oil molar ratios of 4:1–8:1, catalyst concentrations of 0.5–1.5 wt%, reaction times of 60–90 min and reaction temperatures of 50–60 °C as shown in Fig. 5a–d.

3D surface plot of biodiesel yield (%) with respect to a methanol-to-oil molar ratio (X 1) and % catalyst concentration (X 2), b % catalyst concentration (X 2) and reaction time (X 3), c reaction time (X 3) and reaction temperature (X 4), d reaction temperature (X 4) and methanol-to-oil molar ratio (X 1)
From the statistical analysis of the observed data, it was found that the yield of biodiesel increases with catalyst concentration and reaction time and it was maximum at catalyst concentration of 1 wt% and reaction time of 90 min. Therefore, the optimum parameters for maximum biodiesel yield were found to be catalyst concentration of 0.5–1.0 wt%, reaction time of 75–90 min and reaction temperature of 55–60 °C. Beyond a catalyst concentration of 1.5 wt%, the biodiesel yield decreased due to incomplete reaction and soap formation. The presence of excessive catalyst was responsible for forming an emulsion which increases the viscosity of biodiesel and is difficult to separate.
3.3 Analysis of safflower oil (SO) and safflower oil methyl ester (SOME)
Table 6 represents the physicochemical properties of safflower oil and safflower methyl ester. The free fatty acid (FFA) content of safflower oil was found to be below 2.5%. So, there was no pretreatment required for biodiesel production, and direct transesterification with alkali catalyst was performed.
The fatty acid composition of the safflower oil (Table 7) and safflower oil methyl ester (Fig. 6) was analyzed by gas chromatography.

Gas chromatography of safflower oil methyl ester
4 Conclusions
The purpose of this experimental study was to optimize the process parameters which exert significant effect on the transesterification process. Three process parameters, the methanol-to-oil molar ratio, catalyst concentration and reaction time, have been taken into consideration for the optimization of biodiesel yield and its viscosity using the Taguchi approach.
-
(1)
It was found that the optimum conditions for enhancing the biodiesel production by transesterification were the methanol-to-oil molar ratio of 6:1, catalyst concentration of 1 wt%, reaction time of 90 min and reaction temperature of 55 °C.
-
(2)
As per the objective of performance parameter Y 2 (viscosity), the optimum conditions found from the graph of S/N ratio were methanol-to-oil molar ratio of 4:1, catalyst concentration of 1.5 wt%, reaction time of 60 min and reaction temperature of 60 °C.
-
(3)
The concentration of catalyst was found to be the most influencing factor for both performance parameters Y 1 and Y 2. The percentage of contribution of the concentration of catalyst for Y 1 and Y 2 was 51.1% and 50.8% of the total effect of contribution, respectively.
-
(4)
Kinematic viscosity is one of the most important properties of biodiesel. So, optimization of the transesterification process was based on the both performance parameters, i.e., biodiesel yield and viscosity. As per the design of experiments, the experimentally obtained maximum biodiesel yield was 95.5% with viscosity 7.14 cSt, whereas the minimum viscosity of biodiesel produced was 5.60 cSt for which the yield of the biodiesel was 93.8%. As the viscosity of the former sample was beyond the standard ASTM limit, the process parameters of the latter, which were methanol-to-oil molar ratio of 4:1, catalyst concentration of 1.5 wt%, reaction time of 90 min and reaction temperature of 60 °C, were considered as the optimized conditions for this transesterification reaction.
References
Abdul Kalam APJ. Dynamics of rural development. In: 93rd Indian Science Congress Annual Report. 2005; 2006: 34–40.
Ahmad S, Siwayanan P, Murad ZA, et al. Beyond biodiesel. Int News Fats Oils Relat Mater. 2007;18(4):216–20.
Balat M. Global trends on the processing of bio-fuels. Int J Green Energy. 2008;5(3):212–38. doi:10.1080/15435070802107322.
Bijalwan A, Sharma CM, Kediyal VK. Biodiesel revolution. Science Reporter. 2006; 14–7.
Chang DY, Van Gerpen JH, Lee I, et al. Fuel properties and emissions of soybean oil esters as diesel fuel. J Am Oil Chem Soc. 1996;73(11):1549–55. doi:10.1007/BF02523523.
Demirbas A. Biodiesel fuels from vegetable oils via catalytic and non-catalytic supercritical alcohol transesterifications and other methods: a survey. Energy Convers Manag. 2003;44(13):2093–109. doi:10.1016/S0196-8904(02),00234-0.
Duz MZ, Saydut A, Ozturk G. Alkali catalyzed transesterification of safflower seed oil assisted by microwave irradiation. Fuel Process Technol. 2011;92(3):308–13. doi:10.1016/j.fuproc.2010.09.020.
Ilkilic C, Aydın S, Behcet R, et al. Biodiesel from safflower oil and its application in a diesel engine. Fuel Process Technol. 2011;92(3):356–62. doi:10.1016/j.fuproc.2010.09.028.
Isik G, Leblebici S. Effects of different copper II chloride (CuCl2) concentrations on seed germination and seedling development of some carthamustinctorius L. (Compositae) varieties. J Selcuk Univ Nat Appl Sci. 2013;2(2):808–12.
Karabas H. Application of the Taguchi method for the optimization of effective parameters on the safflower seed oil methyl ester production. Int J Green Energy. 2014;11(9):1002–12. doi:10.1080/15435075.2013.829475.
Kim S, Yim B, Park Y. Application of Taguchi experimental design for the optimization of effective parameters on the rapeseed methyl ester production. Environ Eng Res. 2010;15(3):129–34. doi:10.4491/eer.2010.15.3.129.
Kumar RS, Sureshkumar K, Velraj R. Optimization of biodiesel production from Manilkara zapota (L.) seed oil using Taguchi method. Fuel. 2015;140:90–6. doi:10.1016/j.fuel.2014.09.103.
Meka PK, Tripathi V, Singh RP. Synthesis of biodiesel fuel from safflower oil using various reaction parameters. J Oleo Sci. 2007;56(1):9–12. doi:10.5650/jos.56.9.
Mittelbach M, Remschmidt C. Biodiesel: the comprehensive handbook. 2nd ed. Viena: Boesedruck; 2004.
Murugesan A, Umarani C, Chinnusamy TR, et al. Production and analysis of bio-diesel from non-edible oils—A review. Renew Sustain Energy Rev. 2009;13(4):825–34. doi:10.1016/j.rser.2008.02.003.
Patrascoiu M, Rathbauer J, Negrea M, et al. Perspectives of safflower oil as biodiesel source for South Eastern Europe (comparative study: Safflower, soybean and rapeseed). Fuel. 2013;111:114–9. doi:10.1016/j.fuel.2013.04.012.
Phadke MS. Quality engineering using robust design. Upper Saddle River: Prentice Hall PTR; 1995.
Puhan S, Vedaraman N, Ram BV, et al. Mahua oil (Madhuca Indica seed oil) methyl ester as biodiesel-preparation and emission characteristics. Biomass Bioenergy. 2005;28(1):87–93. doi:10.1016/j.biombioe.2004.06.002.
Ross PJ. Taguchi techniques for quality engineering. New York: McGraw-Hill Book Company; 1989.
Sensoz S, Angın D. Pyrolysis of safflower (Charthamus tinctorius L.) seed press cake in a fixed-bed reactor: Part 2. Structural characterization of pyrolysis bio-oils. Bioresour Technol. 2008;99(13):5498–504. doi:10.1016/j.biortech.2007.11.004.
Singh V, Nimbkar N. Safflower (Carthamus tinctorius L.). Chapter. 2006;6:167–94.
Smith JR. Safflower. Champaign, IL: AOCS Press; 1996. p. 624.
Subba IV. General president Indian science congress association. In: Presidential Address. 93rd Indian Science Congress Annual Report. 2005; 2006.
Weiss EA. Castor, sesame and safflower. London: Leonard Hill; 1971. p. 31.
Author information
Authors and Affiliations
Corresponding author
Additional information
Edited by Xiu-Qin Zhu
Rights and permissions
Open Access This article is distributed under the terms of the Creative Commons Attribution 4.0 International License (http://creativecommons.org/licenses/by/4.0/), which permits unrestricted use, distribution, and reproduction in any medium, provided you give appropriate credit to the original author(s) and the source, provide a link to the Creative Commons license, and indicate if changes were made.
About this article

Cite this article
Kumar, N., Mohapatra, S.K., Ragit, S.S. et al. Optimization of safflower oil transesterification using the Taguchi approach. Pet. Sci. 14, 798–805 (2017). https://doi.org/10.1007/s12182-017-0183-0
Received:
Published:
Issue Date:
DOI: https://doi.org/10.1007/s12182-017-0183-0