
Abstract
The application of functionalized/unfunctionalized (multi-walled) carbon nanotubes (CNT) was investigated in the context of formulating nano-based drilling fluids from water/oil-based fluid templates. CNT functionalization was attempted by applying hydrophilic functional groups onto the surface of the nanotubes via acid treatment. Experimental data were collected for thermal conductivity, viscosity/yield point, and filtrate amount in all samples. The time evolution of thermal conductivity was studied, as well as the effects of temperature and CNTs volume fraction on the parameter. Scanning electron microscopy (SEM) was used to monitor CNTs dispersion quality. The thermal conductivity results unveil considerable enhancements, by as much as 23.2 % (1 % vol. functionalized CNT) in CNT-water-based case at ambient temperature, with extended improvement of 31.8 % at an elevated temperature of 50 °C. Corresponding results for the CNT-oil-based case exhibit an improvement in thermal conductivity by 40.3 % (unfunctionalized) and 43.1 % (functionalized) and 1 % volume fraction of CNT. The rheological results follow an analogous improvement trend. For the CNT-oil-based case, the filtration tests conducted at 138 °C and 500 (psi) show a 16.67 % reduction in filtrate amount (1 % vol. CNT). The time evolution of thermal conductivity was found to nearly equalize (at an amount of 9.7 %) after 100 h of sample preparation in both functionalized and unfunctionalized CNT-oil-based cases.
Introduction
The success of a drilling operation depends heavily on the fate of the drilling fluid being used, to fulfill certain functional tasks. Presently, the industry is faced with a range of material-based challenges in designing high performance fluids to overcome the technical/environmental-related issues pertaining to petroleum drilling. Nonetheless, the available experience indicates that it is often impossible to address specific functional requirements (needed to challenge drilling environments) by merely using conventional macro-sized mud additives. Nano-sized entities, on the other hand, have shown to hold conspicuous characteristics to fill this gap.
In general, proximity to atomic scales may induce different governing laws for material behavior than the corresponding macro/micro-sized scales. An example of which is the drastically different behavior of carbon nanotubes (CNT) and fullerenes from those of corresponding (mother) graphite (Smalley and Yakobsonb 1998; Zhou et al. 2005). To some extent, such altered behavior is accounted by the extreme surface area to volume ratio of nano-materials (more than a million-time increase compared to the same mass in millimeters size). Such enormous ratio along with the predominant role of surface. Van der Waals, molecular/atomic forces in nano-scaled environments form the basis for a game-changing scenario for nano-materials enabling nanos to act effectively in fluid systems, in essentially tiny concentrations (<1 %).
For a drilling fluid to function in an effective manner, it must have the correct heat transfer and fluid flow characteristics. Furthermore, it must be environmentally benign. During the deep-hole and geothermal drilling operations, the temperature and pressure may reach excessively high values, in such a way that the heat transfer demands on the drilling fluid may seem impossible to meet. It is, therefore, industrially advantageous to explore ways to enhance the thermal properties of the drilling fluid.
The concept of preparing stable emulsions of nano-sized entities (i.e. nano-particles, CNT) in a base fluid (nanofluid) has evolved over the past decade. The experiments have unveiled improvements in the rheological (Aladag et al. 2012; Chen et al. 2011; Jyothirmayee Aravind et al. 2011; Lei et al. 2008; Murshed et al. 2008; Hobbie and Fry 2007; Vakili-nezhaad and Dorany 2009; Phuoc et al. 2011; Liu et al. 2005) as well as in the thermal (Ding et al. 2006; Hwang et al. 2006; Kalinina et al. 2011; Özerinç et al. 2010; Venkata Sastry et al. 2008; Xie and Chen 2009; Kleinstreuer and Feng 2011; Choi et al. 2001; Karthikeyan et al. 2008; Xie et al. 2002) properties of the nanofluid system, compared to its base fluid.
Recently, Amanullah et al. (2011) attempted formulating nano-based drilling fluids from three industrially available nano-particles. Their results indicated improved rheological stability/gelling property as well as favorably ultra-thin mud cake quality. They projected the possibility of spurt loss elimination (and subsequent formation damage reduction) by applying customized nano-based drilling fluids. Moreover, they estimated dramatic decrease in differential pipe sticking, based on their ultra-think mud cake results, enabling nano-based fluid to be applied to highly permeable formations. More recently, Nwaoji (2012) studied the application of Iron (III) hydroxide and calcium carbonate nano-particles in drilling fluid blends for wellbore strengthening by conducting hydraulic fracture tests on Roubidoux sandstone and concrete cores. Their results revealed an increase in core fracture breakdown pressure by as much as 70.31 and 36.39 % in water/oil-based cases, respectively.
The promising potential of nanos, to be used in drilling operations in specific, is conceivably due to a number of facts. First, their huge surface area provides them with increased interaction site/potential with the reactive shale to sort of resolving borehole problems. Second, the less kinetic energy impact of nano-particles brings about negligible abrasive effect, which alleviates down-hole equipment damage. Last, but not least, is their effectiveness in relatively low concentrations (<1 %), which will be advantageous in an environmental/industrial perspective.
The positive reported outcomes of the above-mentioned literature on effectiveness of CNTs in nanofluids served as our motivation to investigate the applicability of using CNTs in improving the thermal and rheological properties of drilling fluids. To our knowledge, there are no available data on the CNTs performance in water/oil-based drilling fluids, which may further signify the present analysis.
Sample preparation and research methodology
As mentioned previously, the present research was aimed at analyzing the effects of CNT presence on performance of water/oil-based drilling fluids. Therefore, two blends of nanofluids were prepared; namely, a nanofluid mixture comprised of CNT + water-based mud (MIX-1), and another nanofluid which was formed by CNT + oil-based mud (MIX-2). For MIX-1, deionized water (DW) and bentonite (which is conventionally used in the oil industry as the base fluid in water-based mud) and four kinds of carbon nanotubes were used. The carbon nanotubes were purchased from (Neutrino Co., Tehran, Iran). The CNTs had been synthesized using chemical vapor deposition method. Scanning electronic microscopy (SEM) images were acquired (Fig. 1), prior to their application, to ensure quality, based on which the average diameter and length of nanotubes were determined at 15 nm and 20 µm, respectively. The purity of CNTs was (>95 %) and their specific surface area was (>200 m2/gr), as received. For MIX-2, the technical specifications of the base fluid used in formulation are listed in Table 1.

SEM image of CNT sample used in formulating MIX-1/MIX-2 nanofluids
For MIX-1, the experimental procedure generally lies in the following main venues:
-
1.
Preparing 350 cm3 of the water-based mud with a concentration equivalent of 17 pounds of bentonite in a Barrel (17 lb/bbl).
-
2.
Agitating the fluid mixture for at least 15 min.
-
3.
Preparing four different kinds of CNT-formulated mud samples by adding various amounts of unfunctionalized (MIX-1-1)/ball-milled (MIX-1-2)/functionalized (MIX-1-3)/functionalized + ball-milled (MIX-1-4) CNTs (Fig. 2).
Fig. 2 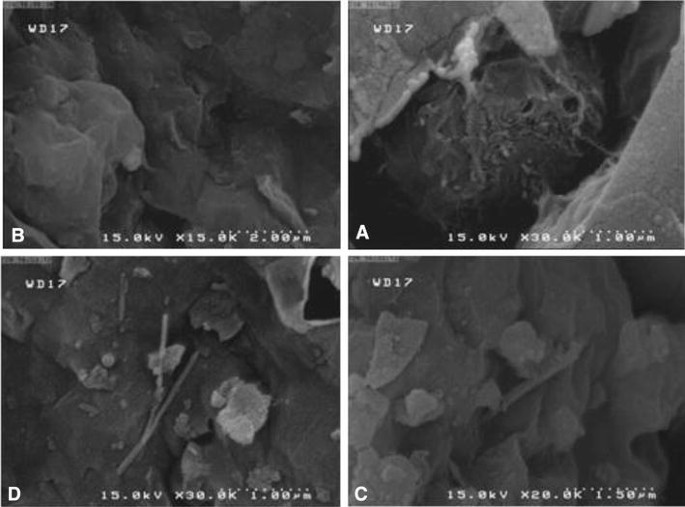
SEM images taken from different MIX-1 samples with 1 vol. % of CNT; (a) MIX-1-1, (b) MIX-1-2, (c) MIX-1-3, (d) MIX-1-4
-
4.
Agitating each nanofluid mixture sample with a high-speed mixer at 6,000 rpm for 5 min.

Owing to their hydrophobicity, CNTs are not readily dispersed in water; hence, we introduced hydrophilic functional groups onto the surface of CNTs by acid treatment (nitric acid 69 %). Typically, 1 g of CNT and 40 mL of acid were boiled and refluxed for 4 h. Then, the sample was diluted by DW, filtered, and washed repeatedly till the washings showed no acidity. The cleaned CNTs were collected and dried at oven for 12 h to remove accompanied water. We also applied milling to nanotubes (~12 h) in those samples which required ball-milling as mechanical dispersion, to investigate the effect of ball-milling on the thermal properties of CNT-formulated mud. CNT forms a more uniform dispersion in non-polar environments (such as oil-based systems), compared to the polar environments (such as water-based systems). Therefore, the ball-milling process was not implemented for sample preparation in MIX-2 for both unfunctionalized (MIX-2-1) and functionalized cases (MIX-2-2), as it does not seem to significantly enhance the dispersion quality of nanotubes (Fig. 3). The thermal conductivities of MIX-1/MIX-2 samples were measured using transient hot-wire (THW), with accuracy better than 2 %. The detailed underlying principles, as well as the apparatus set up, are described elsewhere (Kleinstreuer and Feng 2011).

SEM image of MIX-2 (with 1 % vol. CNT)
The present methodology involves analysis of CNT presence influence, by considering the effects of CNTs volume fraction/system temperature/time on thermal conductivity of MIX/1/MIX-2. Moreover, nano-contained samples were tested against any alteration in rheological behavior (viscosity, yield point), compared to the base fluid. API filtration tests were additionally implemented on MIX-1/MIX-2 to evaluate filtrate quantity, a parameter of typical interest in drilling operations.
Results and discussions
The experimental results presented in this section will mainly focus on the effects of CNT presence on important (drilling) fluid characteristics; namely, the thermal conductivity and shear stress. The results will initially be presented on CNTs influence on thermal conductivity, in which the change in volume fraction of CNTs on the parameter will be discussed. Later, the analysis is extended to study the time evolution of thermal conductivity, as well as the impact of system temperature on altering this parameter in nano-contained samples. The results on rheological measurements will next be presented. This will be ensued by our API filtration results, conducted under high temperature high pressure (HTHP) regime.
Effect of CNT on thermal conductivity
Effect of CNTs volume fraction on thermal conductivity
For CNT + DW system, aggregation and precipitation to the bottom takes place, if the nanotubes are functionalized. CNTs cannot be dispersed into polar liquids such as DW. Because of bentonite existence and gel-strengthening properties of the base fluid, CNT precipitation occurs slowly and the nanofluid in this case will be more stable.
Figure 4 shows the percentage of thermal conductivity increase as a function of CNTs volume fraction in nano-contained samples (MIX-1, MIX-2). THW measurements were applied to a set of fluid samples. The pool of fluid samples used in this respect included a base fluid (the classic water/oil-based mud formulation with 17 (lb/bbl) bentonite content) and different combinations of CNT-contained fluid samples (MIX-1-1, MIX-1-2, MIX-1-3, MIX-1-4, MIX-2-1, MIX-2-2), as detailed in previous section, which also incorporated the effects of ball-milling/functionalization. Once the samples were prepared in different proportions of CNTs, the thermal conductivity, K (W m−1 K−1), was measured via THW technique. In a nutshell, the THW technique relies on determining the thermal conductivity, from calculating the slope of linear portion of temperature rise (\(\varDelta T\)) vs. the natural logarithm of the time evolution (ln(t)). Assuming the temperature at any time (t) and distance (r) from a hot-wire probe as \(T (r ,t )\), the following relationship exists (Kleinstreuer and Feng 2011):

Percentage of thermal conductivity increase vs. the volume fraction of CNTs
where \(T_{ 0}\) is the initial temperature, \(q\) (W m−1) is the heat flux, \(\alpha\) (m2 s−1) is the thermal diffusivity, \(r\) is the radial distance (m), and \(\gamma = 0. 5 7 7 2\) is the Euler`s constant. Assuming the higher order terms in Eq. (1) to be negligible, the thermal conductivity can be approximated by (Kleinstreuer and Feng 2011):
Given temperature measurements over two different time intervals, the thermal conductivity is obtainable from Eq. (2). Having determined K, the increase is evaluated against the corresponding (mother) base fluid values, the results of which are given in Fig. 4. The experimental uncertainty concomitant with the data is approximated at ~2 %, which is based on the accuracy of the THW method employed. Nevertheless, the uncertainty was not reflected in the graphs, so as to preserve visual clarity.
In MIX-1 cases, the thermal conductivity shows an increasing trend with an increase in volume fraction of CNTs. The maximum thermal conductivity increase belonged to functionalized + ball-milled case (MIX-1-4), with an increase of 23.2 % (1 % CNT).
In the case of functionalized CNT, thermal conductivity increase has been more significant than simple and ball-milled CNTs. This phenomenon is due to introducing hydrophilic functional group onto the surface of nanotubes to disperse more efficiently in the water-based mud. This figure also shows that thermal conductivity enhancement for typical water-based mud is linear to some extent for volume fractions lower than 0.4 % and ball-milling is not crucial for increasing thermal conductivity for these samples. The comparison of the experimental data suggests that thermal conductivity of the base fluid, volume fraction of CNTs and dispersion, play a dominant role in the thermal conductivity enhancement in a water-based mud.
Due to strong van der Waals attractive forces, nearly all the CNTs are in the form of agglomerates with much larger dimensions than the primary particles, as shown in Fig. 3a. The degree of agglomeration changes for ball-milled MWCNTs, but still not dispersed effectively, Fig. 3b. By introducing hydrophilic functional group onto the surface of CNTs, it dispersed more effectively in the water-based mud and it seems that CNTs conduct heat more efficiently by passing through bentonite layers as it is shown in Fig. 3c, d.
In MIX-2 cases, both unfunctionalized and functionalized MWCNT systems seem to put a similar impact on thermal conductivity alteration in the region (with CNT vol. fraction <0.4 %). In the MIX-2-2 system, however, more increase is incurred to the thermal conductivity, as the CNT volume fraction is increased. This may be credited towards the better dispersion quality of functionalized CNTs in oil-based systems (with 27 % water presence). Improvements as much as 40.3 and 43.05 % in thermal conductivity have been measured (1 % CNT vol. fraction) for MIX-2-1/MIX-2-2 systems, respectively.
Effect of time on thermal conductivity of CNT-contained samples
The time evolution of thermal conductivity was studied. Figure 5 shows the percentage of reduction in thermal conductivity vs. logarithm of time (h) in MIX-1/MIX-2 samples. It can be seen that the thermal conductivity of all suspensions decreases with time; however, the various dispersion scenarios show different reduction rates. In general, such reduction in thermal conductivity, over all species, can be interpreted in favor of agglomeration and subsequent gradual precipitation of nanotubes. The MIX-1 profiles clearly show that the reduction rate is faster in unfunctionalized samples (MIX-1-1, MIX-1-2) than functionalized cases (MIX-1-3, MIX-1-4). The rate of reduction in K shows a lower slope, after a threshold time (\({\text{log(}}t )> 2. 1\)), which can be due to the gel-strengthening properties of the water-based mud.

Percentage of reduction in thermal conductivity vs. logarithm of time (h) in MIX-1 (a) and MIX-2 (b)
In MIX-2 cases, the K-reduction-percentage profile follows an analogous trend (as to MIX-1 situation) in the sense that K-reduction percentage recorded in the MIX-2-1 (unfunctionalized) system surpassed the MIX-2-2 (functionalized) system, typically in the first 10 h of sample preparation. Following this threshold time, the declining slope diminishes in both MIX-2 cases, and reaches comparably similar values of 9.79 and 9.73 %, for MIX-2-1/MIX-2-2 samples, respectively.
Effect of temperature on thermal conductivity of CNT-contained samples
For a thorough analysis, we tested the impact of variation in temperature on thermal conductivities of MIX-1/MIX-2 samples. Figure 6 depicts the percentage of thermal conductivity increase vs. temperature in MIX-1/MIX-2 samples. The comparison is made against the corresponding thermal conductivity values of the (mother) base fluids in the same temperature. In all tested samples in this section, the amount of CNTs volume fraction was preserved at 1 %. The figure illustrates the thermal conductivity values to behave in an increasing manner alongside the increase in temperature, in all MIX-1/MIX-2 samples, without considering the CNT dispersion scenario. The increasing rate was diminished after a threshold temperature of 35 °C (MIX-1) and 40 °C (MIX-2). This behavior, being more severe in functionalized cases, can be explained in terms of destruction of functional groups at high temperatures, which presumably declines the CNT dispersion quality and causes instability. In MIX-1, the percentage of increase in thermal conductivity was recorded by as much as 31.8 % for MIX-1-4 case at 50 °C. The effect of ball-milling on thermal conductivity alteration is found to be magnified at elevated temperatures. In MIX-2 case, the situation follows a similar route. The rate of increase percentage of thermal conductivities seems to level off at higher temperatures (>55 °C). The measurements at 60 °C establish increasing percentage values of 51.8 and 52.9 % for (unfunctionalized) MIX-2-1 and (functionalized) MIX-2-2 samples, respectively.

Percentage of thermal conductivity increase vs. temperature (comparison is made against the corresponding thermal conductivity values of the mother base fluids) for MIX-1 (a) and MIX-2 (b)
Effect of CNT on rheology
To assess rheological behavior of CNT-contained samples, both shear stress and yield point were measured using a Fann Viscometer. The measurements were conducted in accordance with the API standards (American Petroleum Institute 2003). The viscosity can be computed from the following relationship:
Here, \(\eta\) is the viscosity (dyne cm−2 sec−1), \(\gamma\) is the shear stress (dyne cm−2), and \(\tau\) is the shear rate (sec−1). Then, shear stress/rate can be obtained from the viscometer readings using the following equations:
where \(\zeta_{ 1}\) is the torsion constant (dyne cm degree−1), \(\zeta_{ 2}\) is the shear stress constant for effective bob surface (cm−3), \(\theta\) is the Fann viscometer dial reading (degree), \(\zeta_{ 3}\) is the shear rate constant (sec−1 rpm−1), and \(N\) is the rate of revolution of outer cylinder (rpm). The measurements were conducted over rotation speeds of 300 and 600 rpm. These two speeds of rotation are typically available in all viscometer instruments, and are considered as industry benchmarks. Subsequently, the plastic viscosity/yield point of fluid sample can be computed using the 300/600 rpm measurement values (Fann viscometer manual):
Here, \({\text{PV}}\) is the plastic viscosity (cP), \({\text{YP}}\) is the yield point (lb/100 ft2). Also, \(\theta_{600}\) and \(\theta_{300}\) represent the viscometer dial readings at 600 and 300 rpm rotation speeds, respectively (1°Fann ~1.065 lb/100 ft2). Alternatively, the effective viscosity (in cP) can be computed by the following equation in Fann Viscometer readings/speed:
Tables 2 and 3 list our experimental results for shear stress/yield point for MIX-1/MIX-2 at different rotational speeds.
The rheological parameters described can be interchangeably related to each other via the Bingham model (Eq. 9):
In spite of the fact that mixtures of water and bentonite generally exhibit a pseudo-plastic rheological behavior, we chose the Bingham model for the purpose. Our reason for the Bingham model choice was twofold. First, the direct-indicating rotational rheometer apparatus used is specifically designed to apply the Bingham plastic fluid model. Second, the Bingham model is widely used in drilling fluids industry to describe flow characteristics of many types of muds. The YP value, in this model, typically represents the ability of a mud to lift cuttings out of the annulus. Practically, YP should be high enough to carry cuttings out of the hole, but not large as to an extent to create excessive pump pressure. Moreover, a high YP implies non-Newtonian behavior of a fluid. Reversely, the PV in the model should be as low as possible to contribute to fast drilling. The rheological results indicate that adding functionalized CNTs to water-based mud increases the shear stress, and that the increase becomes larger at higher rotational speeds. This phenomenon could be explained in terms of improved CNT dispersion at high shear rates (i.e. 600 rpm). In MIX-1 case, the yield points have pointed to a larger value, compared to their classic mud counterparts. Consequently, greater pressure-lost values should be expected (by adding functionalized CNTs); especially in the portions of wellbore in which the flow regime is laminar. Also, as explained earlier, the larger YP values in CNT-contained samples convey the better cutting-removal characteristics of nanofluids for drilling operations. The CNT impact on rheological behavior follows a similar trend in MIX-2. The YP shows a substantial increase by 100 % in MIX-2-2, compared to the corresponding mother-fluid value. The plastic viscosity also gets a favorably decreased value, for instance, from a value of 28 (cP) in classic oil-based mud to a value of 24 (cP) in MIX-2-2 (~14 % reduction). Such decreased PV value should be interpreted in favor of better suitability of CNT-contained fluids for fast drilling operations.
Filtrate properties of CNT-contained samples
In this section, the effect of CNT presence on the quantity (amount) of filtrate was studied. Filtration of CNT-contained samples was made through standard filter presses, consisting of cylindrical mud cell having an inside diameter of 3.0 in. and a height of at least 2.5 in. The filtration area was 45 cm2. Below the support was a drain tube for discharging the filtrate into the graduated cylinder. The result of the experiments on MIX-1 case is shown in Fig. 7. The classic water-based mud (WBM) system was prepared by adding 24 g of bentonite to 350 cm3 of DW to form 24 lb/bbl of drilling fluid. The amount of filtrate for WBM system after 30 min (which is in accordance with the API filtration test) was 28.4 cm3, while this parameter becomes 26.3 cm3 after adding 1 vol. % functionalized CNTs to the sample. This means that the amount of filtrate decreases by 7.4 % after using CNTs. Moreover, the amount of spurt lost (at the beginning of the test) had decreased from a value of 0.57 cm3 to a value of 0.44 cm3, which emphasizes the fact the mud cake created by CNT-contained samples is fairly more uniform than base mud.

API filtration test results for classic water-based mud (WBM) and MIX-1-3 (with 1 % vol. functionalized CNT)
For MIX-2 case, the filtration test was conducted under HTHP conditions, owing to high viscosity of the oil-based mud considered (~49 cP). Hence, the results should further relate to actual wellbore conditions. The experimental temperature and pressure were set to 138 °C and 500 psi, respectively. The results unveil a 16.6 % reduction in filtrate amount from a typical value of 3.6 cm3 (OBM) to a value of 3 cm3 (MIX-2-2). This reduction in filtrate quantity should cause added convenience during a typical drilling operation.
Conclusions
CNT presence brought about favorable changes in nearly every corner of the drilling fluid characteristics studied. The thermal conductivity was increased in both MIX-1/MIX-2 cases, with maximum attained percentage increases of 31.8 and 40.3 %, respectively. The functionalizing + ball-milling process yielded the best results in terms of thermal conductivity enhancement of nanofluid. The evolution of time decreased the thermal conductivity of MIX-1/MIX-2, which was more conspicuous in water-based system. The time effect became nearly identical in MIX-2 cases, after a threshold time, with comparably similar values of 9.79 % (MIX-2-1) and 9.73 % (MIX-2-2) in thermal conductivity declining slope. The rise in temperature increased the thermal conductivity of CNT-contained samples. Yet, the increasing rate was diminished after a threshold temperature of 35 °C (MIX-1) and 40 °C (MIX-2). Rheological results point to increased values of shear stress/yield and lower plastic viscosity for MIX-1/MIX-2, compared to the corresponding base fluids. The filtrate quantity also showed decrease in MIX-1/MIX-2 samples, which was further found to sustain through HTHP conditions.
References
Aladag B, Halelfadl S, Donera N, Maré T, Duret S, Estellé P (2012) Experimental investigations of the viscosity of nanofluids at low temperatures. Appl Energ 97:876–880. doi:10.1016/j.apenergy.2011.12.101
Amanullah M, Al-Arfaj M.K, Al-Abdullatif Z (2011) Preliminary test results of nano-based drilling fluids for oil and gas field application. SPE/IADC drilling conference and exhibition. Amsterdam, The Netherlands. doi:10.2118/139534-MS
American Petroleum Institute (2003) Recommended practice for field testing of water-based drilling fluids, 3rd edn, pp 82
Chen L, Xie H, Yu W, Li Y (2011) Rheological behaviors of nanofluids containing multi-walled carbon nanotube. J Disper Sci Technol 32(4):550–554. doi:10.1080/01932691003757223
Choi SUS, Zhang ZG, Yu W, Lockwood FE, Grulke EA (2001) Anomalous thermal conductivity enhancement in nanotube suspensions. Appl Phys Lett 79(14):2252–2254. doi:10.1063/1.1408272
Ding Y, Alias H, Wen D, Williams RA (2006) Heat transfer of aqueous suspensions of carbon nanotubes (CNT nanofluids). Int J Heat Mass Tran 49(1–2):240–250. http://www.sciencedirect.com/science/article/pii/S0017931005004618
Hobbie EK, Fry DJ (2007) Rheology of concentrated carbon nanotube suspensions. J Chem Phys 126:124907–124914. doi:10.1063/1.2711176
Hwang YJ, Ahn YC, Shin HS, Lee CG, Kim GT, Park HS, Lee JK (2006) Investigation on characteristics of thermal conductivity enhancement of nanofluids. Curr Appl Phys 6(6):1068–1071. doi:10.1016/j.cap.2005.07.021
Jyothirmayee Aravind SS, Baskar P, Baby TT, Sabareesh RK, Das S, Ramaprabhu S (2011) Investigation of structural stability, dispersion, viscosity, and conductive heat transfer properties of functionalized carbon nanotube based nanofluids. J Phys Chem C 115(34):16737–16744. doi:10.1021/jp201672p
Kalinina I, Worsley K, Lugo C, Mandal S, Bekyarova E, Haddon RC (2011) Synthesis, dispersion, and viscosity of poly(ethylene glycol)-functionalized water-soluble single-walled carbon nanotubes. Chem Mater 23(5):1246–1253. doi:10.1021/cm103030s
Karthikeyan NR, Philip J, Raj B (2008) Effect of clustering on the thermal conductivity of nanofluids. Mater Chem Phys 109(1):50–55. doi:10.1016/j.matchemphys.2007.10.029
Kleinstreuer C, Feng Y (2011) Experimental and theoretical studies of nanofluid thermal conductivity enhancement: a review. Nanoscale Res Lett 6:229–242. doi:10.1186/1556-276X-6-229
Lei Y, Xiong C, Guo H, Yao J, Dong L, Su X (2008) Controlled viscoelastic carbon nanotube fluids. J Am Chem Soc 130(11):3256–3257. doi:10.1021/ja710014q
Liu MS, Lin MC, Huong IT, Wang CC (2005) Enhancement of thermal conductivity with carbon nanotube for nanofluids. Int Commun Heat Mass 32(9):1202–1210. doi:10.1016/j.icheatmasstransfer.2005.05.005
Murshed SMS, Leong KC, Yang C (2008) Investigations of thermal conductivity and viscosity of nanofluids. Int J Therm Sci 47(5):560–568. doi:10.1016/j.ijthermalsci.2007.05.004
Nwaoji CO (2012) Wellbore strengthening-nano-particle drilling fluid experimental design using hydraulic fracture apparatus. Thesis University of Calgary, Calgary
Özerinç S, Kakaç S, Yazıcıoğlu AG (2010) Enhanced thermal conductivity of nanofluids: a state-of-the-art review. Microfluid Nanofluid 8(2):145–170. doi:10.1007/s10404-009-0524-4
Phuoc T, Massoudi M, Chen R (2011) Viscosity and thermal conductivity of nanofluids containing multi-walled carbon nanotubes stabilized by Chitosan. Int J Therm Sci 50(1):12–18. doi:10.1016/j.ijthermalsci.2010.09.008
Smalley RE, Yakobsonb BI (1998) The future of fullerenes. Solid State Commun 107(11):597–606
Vakili-Nezhaad GR, Dorany A (2009) Investigation of the effect of multi-walled carbon nanotubes on the viscosity index of lube oil cuts. Chem Eng Comm 196:997–1007. doi:10.1080/00986440902797865
Venkata Sastry NN, Bhunia A, Sundararajan T, Das SK (2008) Predicting the effective thermal conductivity of carbon nanotube based nanofluids. Nanotechnology 19(5):055704. doi:10.1088/0957-4484/19/05/055704
Xie H, Chen L (2009) Adjustable thermal conductivity in carbon nanotube nanofluids. Phys Lett A 373(21):1861–1864. doi:10.1016/j.physleta.2009.03.037
Xie H, Wang J, Xi T, Liu Y (2002) Thermal conductivity of suspensions containing nanosized SiC particles. Int J Thermophys 23(2):571–580. doi:10.1023/A:1015121805842
Zhou W, Heiney PA, Fan H, Smalley RE, Fischer JE (2005) Single-walled carbon nanotube-templated crystallization of H2SO4: direct evidence for protonation. J Am Chem Soc 127:1640–1641. doi:10.1021/ja043131z
Author information
Authors and Affiliations
Corresponding author
Rights and permissions
Open Access This article is distributed under the terms of the Creative Commons Attribution License which permits any use, distribution, and reproduction in any medium, provided the original author(s) and the source are credited.
About this article

Cite this article
Fazelabdolabadi, B., Khodadadi, A.A. & Sedaghatzadeh, M. Thermal and rheological properties improvement of drilling fluids using functionalized carbon nanotubes. Appl Nanosci 5, 651–659 (2015). https://doi.org/10.1007/s13204-014-0359-5
Received:
Accepted:
Published:
Issue Date:
DOI: https://doi.org/10.1007/s13204-014-0359-5