
Abstract
COVID-19 is a novel virus, which has a fast spreading rate, and now it is seen all around the world. The case and death numbers are increasing day by day. Some tests have been used to determine the COVID-19. Chest X-ray and chest computerized tomography (CT) are two important imaging tools for determination and monitoring of COVID-19. And new methods have been searching for determination of the COVID-19. In this paper, the investigation of various multiresolution approaches in detection of COVID-19 is carried out. Chest X-ray images are used as input to the proposed approach. As recent trend in machine learning shifts toward the deep learning, we would like to show that the traditional methods such as multiresolution approaches are still effective. To this end, the well-known multiresolution approaches namely Wavelet, Shearlet and Contourlet transforms are used to decompose the chest X-ray images and the entropy and the normalized energy approaches are employed for feature extraction from the decomposed chest X-ray images. Entropy and energy features are generally accompanied with the multiresolution approaches in texture recognition applications. The extreme learning machines (ELM) classifier is considered in the classification stage of the proposed study. A dataset containing 361 different COVID-19 chest X-ray images and 200 normal (healthy) chest X-ray images are used in the experimental works. The performance evaluation is carried out by employing various metric namely accuracy, sensitivity, specificity and precision. As deep learning is mentioned, a comparison between proposed multiresolution approaches and deep learning approaches is also carried out. To this end, deep feature extraction and fine-tuning of pretrained convolutional neural networks (CNNs) are considered. For deep feature extraction, pretrained, ResNet50 model is employed. For classification of the deep features, the Support Vector Machines (SVM) classifier is used. The ResNet50 model is also used in the fine-tuning. The experimental works show that multiresolution approaches produced better performance than the deep learning approaches. Especially, Shearlet transform outperformed at all. 99.29% accuracy score is obtained by using Shearlet transform.
Introduction
COVID-19, which is an upper respiratory viral infection, is spreading too fast and now it is seen almost all around the world. The disease affects the airway and consequently the lungs of those infected [1]. Chest X-ray and chest CT images are useful in the follow-up testing of the effects that COVID-19 causes to the lungs [2]. In other words, the chest X-ray and chest CT images can be used in the detection of the COVID-19 disease.
In the literature, various image processing and machine learning-based approaches have been put forwards for chest X-ray image-based disease detection. Some of these diseases are tuberculosis, interstitial lung disease, pneumonia and lung cancer. Besides, pulmonary nodules detection in chest X-ray images, which are the early sign of lung cancer, is very important for the early diagnosis and treatment of lung cancer. The studies in the literature about the chest X-ray image based lung disease detection can be divided into two classes namely hand-crafted based approaches and deep learning based approaches. In the hand-crafted based approach class, authors have used traditional feature extraction methods for disease detection. For example, Wei et al. [3] proposed an approach for lung nodules detection in chest X-ray images. Authors initially extracted 210 hand-crafted features and then the optimal feature set of 210 features were determined by using a feature selection method. The selected features achieved good performance on lung nodule detection. Schiham et al. [4] proposed another hand-crafter features based approach for lung nodule detection in chest X-ray images. Authors extracted 109-dimensional feature vector and used k-Nearest Neighbor (k-NN) technique for classification of the features. The extracted features were composed of texture features, location features and nodule characterization features, respectively. Woźniak et al. [5] proposed an approach, which was based on momentum and probabilistic neural networks (PNN), for detection of lung carcinomas based on using chest X-ray images. The nodules in the chest X-ray images were initially segmented and the momentum of the contours of segmented nodules were then used as features. PNN was used in the classification of the nodules. Ho et al. [6] opted to use feature concatenation for the efficient classification of 14 thoracic diseases. In their study, four local texture descriptors, namely SIFT, GIST, LBP, and HOG, were concatenated. In the classification stage, GDA, k-NN, Naïve Bayes, SVM, Adaboost, Random forests, and ELM were used. Noor et al. [7] proposed statistics based approach for detection of the tuberculosis in chest X-ray images. Authors initially used the wavelet transform to the chest X-ray images and then 12 texture features were extracted from the wavelet coefficients. The principle component analysis was used for feature reduction. Finally, the probability of misclassification was predicted by using the probability ellipsoid and discriminant functions. Xu et al. [8] proposed an approach for classification of the tuberculosis cavities. In the proposed approach, texture and geometric features were combined. The texture features were extracted by using Gaussian model-based template matching, local binary patterns, and directional gradient histogram from chest X-ray images. SVM classifier was used to in classification stage of the proposed work. Plankis et al. [9] proposed a computer aided design for interstitial lung disease detection. The proposed approach was based on active contour method, which determined the region of interests on chest X-ray images. Authors then used wavelet transform for texture feature extraction. Kumar et al. [10] proposed an approach which was based on machine learning algorithm. Authors used texture analysis of chest X-rays for pulmonary edema detection. Gabor filters were used for texture feature extraction and SVM classifier was employed to distinguish normal chest and pulmonary edema.
As deep learning has been quite hot in the last decade, there has been various deep learning based approach for lung disease detection based on chest X-ray images. Kesim et al. [11] proposed a new CNN model for chest X-ray image classification. The authors developed a small-sized CNN architecture as pretrained CNN models can present difficulties in practical applications. A 12-classed chest X-ray image dataset was used, and an accuracy score of 86% was reported. Liu et al. [12] proposed a deep learning-based approach for tuberculosis detection. Authors developed a new CNN architecture for detection of the tuberculosis based on chest X-ray images. Shuffle sampling and transfer learning were employed in order to address the problem of an unbalanced dataset. An 85.68% accuracy score was obtained using the shuffle sampling method. Dong et al. [13] proposed CNN models for binary and multilevel classifications of the lung disease based on chest X-ray images. Transfer learning was applied to the dataset using pretrained AlexNet, ResNet, and VGG16 models. 82.2% and 91.3% accuracy scores were reported for binary classification and multilevel classification tasks, respectively. Xu et al. [13] proposed an approach for abnormality detection in chest X-ray images using a hierarchical-CNN model named CXNet-m1. The developed CNN models were shallower than the pretrained CNN models and authors proposed a new loss function. The optimization of the CNN kernels was also proposed in their work, and a 67.6% accuracy score was reported by the authors. Rajpurkar et al. [14] employed a 121-layered CNN model named CheXNeXt for the classification of 14 different pathologies based on chest X-ray images. The area-under-curve (AUC) measure was used in their performance measurements, and the proposed model produced AUC values between 0.704 and 0.944. Bhandary et al. [15] modified the AlexNet model for the detection of lung abnormalities based on chest X-ray images. More specifically, the authors used a deep learning approach for the detection of pneumonia. A new filter named a threshold filter was introduced, and a feature ensemble strategy was also defined. The obtained results showed a 96% classification accuracy. Recently, Ucar et al. [16] used the SqueezeNet for the COVID-19 detection. Authors used Bayesian optimization for fine-tuning the hyper parameters of the network. Data augmentation was applied for improving the performance of the proposed work. Authors mentioned satisfactory detection with their proposed method. Ozturk et al. [17] proposed a novel deep learning based approach for automatic detection of the COVID-19 based on chest X-ray images. In the proposed approach, both binary and multilevel disease detection were carried out.
Recently, due to COVID-19, there have been texture abnormalities on the lungs of positive cases, which are characterized by diffuse changes in the appearance and structure of the lung area. In the current study, due to the above fact, the multiresolution techniques, which are quite efficient in revealing of the texture characteristics, are considered to use in COVID-19 detection based on chest X-ray images. To this end, Wavelet, Shearlet and Contourlet transforms, which were widely used in texture-based applications, are used to decompose the chest X-ray images. As entropy and energy features are generally accompanied with the multiresolution approaches in texture recognition applications, we opted to use them for feature extraction. The Shannon entropy and the normalized energy techniques are used. The extreme learning machines (ELM) classifier, which has single hidden layer, is considered in the classification stage of the proposed study. A dataset containing 361 different COVID-19 chest X-ray images and 200 normal (healthy) chest X-ray images are used in the experimental works [18,19,20]. The performance evaluation is carried out by employing various metric namely accuracy, sensitivity, specificity and precision. The issues pertinent to data ethics were ensured during the data collection for the datasets, according to the information reported on the websites of the datasets used in this study.
As we aimed to show the effectiveness of the multiresolution approaches against deep learning approaches, a performance comparison is also carried out. To this end, deep feature classification and fine-tuning of pretrained CNN are considered as deep learning approaches. For deep feature extraction, and fine-tuning procedure, the pretrained ResNet50 model is considered. For classification of the deep features, SVM classifier is employed.
The remainder of this paper is ordered as follows. Section 2 details the materials and methods that were used in this work, including the Wavelet transform, Contourlet transform, Shearlet transform, entropy and energy features, and the ELM theories, and the methodology of the study is briefly introduced. Section 3 goes on to describe the experimental works and results, whilst Sect. 4 presents the conclusions of the study.
Materials and methods
The proposed method of the current study is illustrated in Fig. 1. As can be seen from Fig. 1, the chest X-ray images are used as the input to the proposed COVID-19 detection system. The size of the inputted chest X-ray images is 256 × 256 pixels. No image enhancement methods were applied on the inputted chest X-ray images. As previously mentioned, three multiresolution techniques namely, Wavelet, Contourlet and Shearlet transforms are used to decompose the chest X-ray images into coefficient images.

The illustration of the proposed methodology for COVID-19 detection
Two basic texture feature extractors namely entropy and normalized energy functions are used for feature extraction from the chest X-ray images, which characterizes the COVID-19 and healthy cases. Shannon entropy and normalized energy are considered for feature extraction. In the classification stage of the proposed work, the ELM is employed which is known as simple, fast and accurate classifier.
Wavelet transform
Wavelet transform, which is known as a mathematical function, is generally used to decompose a time domain signal or an image into their different scale components [21]. Wavelet transforms have been developed for alleviating the disadvantages of the Fourier transform. Moreover, the discrete wavelet transforms employ various low and high pass filters to decompose a given signal into its approximation and detail coefficients. These low and high pass filters cover different frequency bands with different resolutions.
For decomposing of an image into its approximation and detail coefficients, first, the low pass filter (h) is applied for each row of image and subsequently down sampled by 2, thereby getting the low frequency components of the row. Then, the high pass filter (g) is used for the same row of image, subsequently down sampled by a factor 2 to get high frequency components, and placed by the side of low pass components. This procedure is applied for all rows. Down sampling is employed to satisfy Nyquist’s sampling rule. This procedure is illustrated in Fig. 2. While the Fig. 2a shows the one level discrete wavelet transform, Fig. 2b shows the filter banks for one level decomposition.

Wavelet decomposition. a One level discrete wavelet transform. b Filter banks for one level decomposition
Contourlet transform
Contourlet transform, which was developed as an improved version of wavelet transform, is a useful tool for multiscale geometric analysis [22]. As it represents the images sparser, it has less redundancy and better approximation performance is obtained compared to other multiscale geometric analysis tools. This multiscale and directional decomposition method decomposes the input image into low pass sub band and several band pass directional sub bands. Figure 3 shows the illustration of the non-subsampled Contourlet transform.

Non-subsampled Contourlet transform
As seen in Fig. 3, Contourlet transform is carried out by using a double filter banks such as Laplacian pyramid and directional filter banks. The directional filter banks are employed to extract high frequency components while Laplacian pyramid detects the point discontinuities of the image. The simplified directional filter banks used for the Contourlet transform leads to 2i sub bands with wedge-shaped frequency partitioning, where i is level of decomposition.
Shearlet transform
Shearlet transform provides a typical structure in order to analyze and illustrate anisotropic information of input image at multiple scales [23]. This method is useful in identifying signal individuality i.e. edges, and locating them in images. Figure 4 shows the illustration of the non-subsampled Shearlet transform. As seen in Fig. 4, a two-stepped approach is applied to obtain the Shearlet coefficients. In the first step, the pyramidal decomposition is applied to the input image. Pyramidal decomposition produced low and high frequency components. In step 2, the direction decomposition is carried out. For directional decomposition, a non-subsampled shearing filter, which impose the 2-D convolution of the shearing filter is used.

Non-subsampled Shearlet transform
Feature extraction
As mentioned earlier, the normalized energy and the entropy measures are used for feature extraction from the decomposed chest X-ray images [24]. Normalized energy is defined as following;
where m and n shows the dimension of the coefficient image and coeffs shows the coefficient image after multiresolution decomposition.
Entropy is a widely used feature which measures the indeterminacy of a given data. The entropy of the coefficient image is calculated as;
where coeffs shows the 2-dimensional input data.
ELM
ELM is a neural network model that has a single hidden layer [25, 28]. It aims to handle a classification or prediction task with zero error. For obtaining the zero error, the hidden layer weights of the ELM model are calculated analytically. Thus, a learning activity is handled without using any optimization process.
The ELM formulation is defined as follows;
where \({o}_{i}\) and L show the output of ith node and the number of neurons in the hidden layer, respectively. \({\beta }_{j}={[{\beta }_{j1},{\beta }_{j2},2{\beta }_{jn}]}^{T}\) shows the output weight vector and \({b}_{j}\) shows the bias of the jth node. \(g(.)\) is the activation function, \({x}_{i}\) is the ith input data and \({a}_{j}={[{a}_{j1},{a}_{j2},\dots ,{a}_{jn}]}^{T}\) is the input weight vector and finally N shows the number of input samples.
Equation (3) is arranged as given in Eq. (4);
where \({t}_{i}\) shows the ground-truth output. Equation (2) can be arranged as given in Eq. (5);
where \(H={\{h}_{ij}\}=g({a}_{j},{b}_{j},{x}_{i})\) is the hidden-layer output matrix. The analytical calculation of the hidden layer weights is given as in Eq. (6).
where H+ is the Moore–Penrose generalized inverse of matrix H and T is the actual output vector.
Experimental works and results
The implementation of the proposed method was carried out using MATLAB software. NVIDIA Quadro M4000 GPU with 8 GB RAM was used in the running of the codes. The chest X-ray images were collected from different sources [2, 18,19,20]. The labeling of the chest X-ray images was controlled by specialist medical doctors. A total of 361 COVID-19 and 200 normal (healthy) chest X-ray images of a size of 256 × 256 were collected. In the current study’s experimentation, a tenfold cross-validation technique was considered in the performance evaluation of the proposed approach. Figure 5 presents some sample COVID-19 and normal chest X-ray images.

Chest X-ray images for COVID-19 and normal cases
For wavelet transformation, a 4-level decomposition was carried out with ‘db1’ wavelet function. The detail coefficients were kept for energy and entropy feature calculations. Thus, for each chest X-ray image, 24-dimensional feature vector was obtained. Figure 6 shows a two-level wavelet decomposition of a chest X-ray image by using ‘db1’ wavelet function.
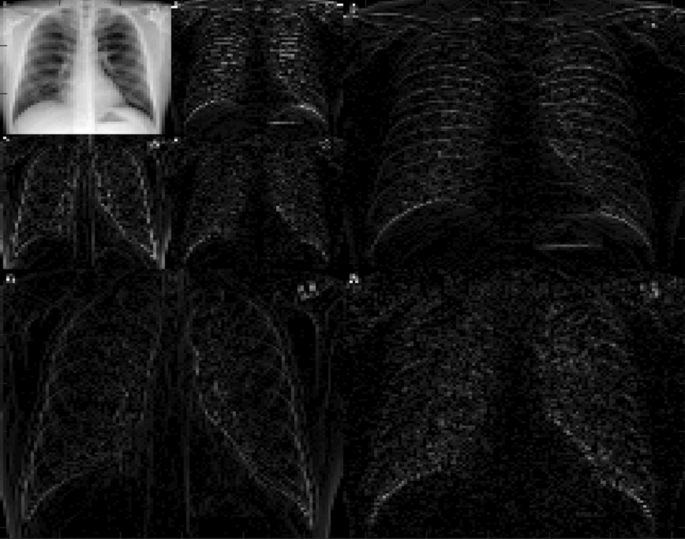
Two-level wavelet decomposition of a chest X-ray image by using ‘db1’ wavelet function
The Fast Finite Shearlet Transform was considered for Shearlet decomposition that was provided by Häuser and Steidl [26]. The Shearlet coefficients were obtained separately for decomposition levels of 1–5. The first level of the Shearlet transform was a low-pass filter that blocks the high-frequency content of the image. Eight coefficients were selected for the second and third levels, and 16 for the fourth and fifth levels. Figure 7 shows one level Shearlet decomposition of a chest X-ray image.
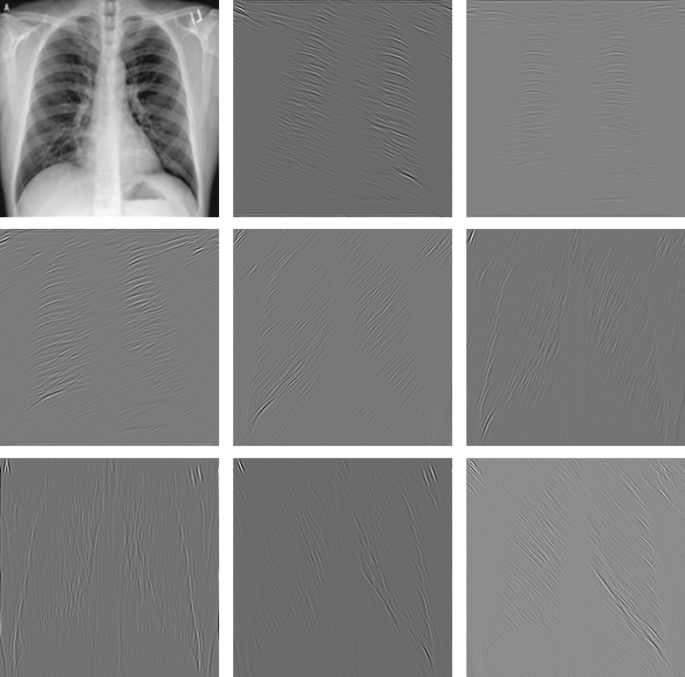
One level Shearlet decomposition of a chest X-ray image
Thus, a total of 49 complex coefficients were obtained. And for each chest X-ray image, 98-dimensional feature vector was produced. For Contourlet transform, both the Laplacian pyramid and the directional filters were selected as ‘pkva’ filters and decomposition layers were set to 1, 2 and 3, respectively. Thus, a one 32 × 32, a two 32 × 64, a four 64 × 64 and an eight 64 × 128 Contourlet coefficients were obtained. Figure 8 shows a three-level Contourlet decomposition of a chest X-ray image.
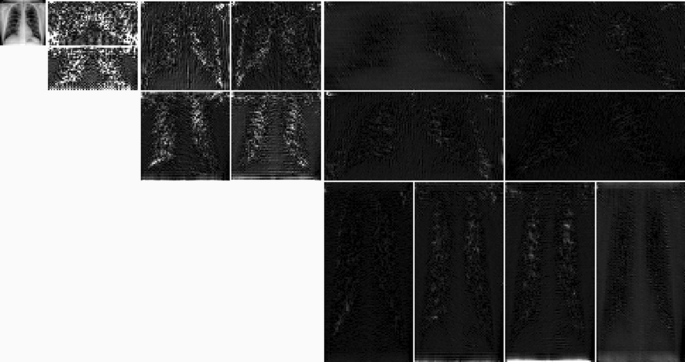
Three level contourlet decomposition of a chest X-ray image by using ‘pkva’ filter for both Laplacian pyramid and directional filters
After feature extraction, for each chest X-ray image, 30-dimensional feature vector was obtained. The calculated feature vectors with each multiresolution approach were normalized according to the zero mean and unit variance criteria. The parameters of ELM classifier such as the number of neurons and the activation function in the hidden layer and regularization parameter C were tuned during the experimental works. The best performances were obtained while the hidden layer neuron number was set to 1000, C value was set to 100 and activation function was used as ‘sigmoid’, respectively. Four performance evaluation metrics namely, accuracy, sensitivity, specificity and precision were used to measuring the achievement of each multiresolution approach [27]. Table 1 shows the obtained average accuracy, sensitivity, specificity and precision scores for all multiresolution approaches according to the tenfold cross-validation technique. As seen in Table 1, the wavelet method produced 96.07% accuracy, 96.39% sensitivity, 95.50% specificity and 97.50% precision scores, respectively. With Contourlet transform, 85.39% accuracy, 87.82% sensitivity, 81.00% specificity and 89.55% precision scores were obtained. Finally, 99.29% accuracy, 98.89% sensitivity, 100.00% specificity and 100.00% precision scores were obtained with Shearlet transform. As it was observed, Shearlet transform approach produced better evaluation scores than Wavelet and Contourlet transform approaches. Wavelet transform produced the second-best scores. The Contourlet transform produced the worse scores when compared with the Shearlet and Wavelet transforms.
Table 2 shows the obtained confusion matrixes for all multiresolution approaches. While the rows show true classes, the columns show the predicted classes, respectively. The first column of Table 2 shows the confusion matrix of the Wavelet transform. Only one COVID-19 (positive) case was classified as normal (negative) on average. For Contourlet transform, while 8 positive cases were classified as negative, 2 negative cases were classified as positive on average. And, the Shearlet transform correctly classified all cases. As it was mentioned earlier, the achievements of the multiresolution approaches were compared with the deep learning based approaches.
The results obtained from this additional experiment are as shown in Table 3. For ResNet50, all images were resized to 224 × 224 for being compatible with the CNN model [30]. As can be seen from Table 3, the “ResNet50 Features + SVM,” and “Fine-tuning ResNet50” approaches were considered in comparison [29]. For SVM classification, a Gaussian kernel function was used. The epsilon value of the SVM was set to 0.01. For fine-tuning, data augmentation was conducted by randomly rotating, shifting, and flipping the training images. The classification accuracy was considered for performance evaluation.
As observed in Table 3, the two of the multiresolution approaches namely Shearlet and Wavelet transforms produced higher accuracy scores than the deep learning approaches. Only the Contourlet transform produced a low accuracy score than the deep learning approaches. It is worth mentioning that Shearlet transform approached outperformed the use of deep learning approaches.
Conclusions
In this paper, a multiresolution based approach was proposed for COVID-19 detection based on chest X-ray images. To this end, Wavelet, Contourlet and Shearlet transforms were used for multiresolution image decomposition. Simple but efficient texture features namely entropy and normalized energy were used for characterization of the COVID-19 texture structure on chest X-ray images. ELM classifier was used in classification. The following conclusions are extracted from the proposed work;
-
1.
From the experimental work, it was observed that the proposed multiresolution based approach was quite efficient in COVID-19 detection. Especially, the Shearlet transform produced the state-of-the-art performance.
-
2.
It was quite surprising that the Contourlet transform produced worse performance than the wavelet transform. Because, the Contourlet transform was developed as the expansion of the wavelet transform.
-
3.
The comparisons showed that the multiresolution approaches were combating against the powerful deep learning approaches.
In the future works, additional COVID-19 chest X-ray images will be collected and other multiresolution approaches will be investigated for COVID-19 detection. Additionally, other lung diseases will be included in our future studies on this topic. Also, the COVID-19 disease has different stages of evolution, with each presenting different imagistic patterns; therefore, this will be considered in addition with our future works. A GUI will be also developed as part of our future research in this area.
References
World Health Organization. Coronavirus disease (COVID-19) pandemic (2020). https://www.who.int/emergencies/diseases/novel-coronavirus-2019.
Radiology Assistant. X-ray Chest images (2020). https://radiologyassistant.nl/chest/lk-jg-1. Accessed 23 Mar 2020.
Wei J, Hagihara Y, Shimizu A, Kobatake H. Optimal image feature set for detecting lung nodules on chest X-ray images. CARS 2002 computer assisted radiology and surgery. Berlin: Springer; 2002. p. 706–711.
Schilham AM, van Ginneken B, Loog M. A computer-aided diagnosis system for detection of lung nodules in chest radiographs with an evaluation on a public database. Med Image Anal. 2006;10(2):247–58.
Woźniak M, Połap D, Capizzi G, Sciuto GL, Kośmider L, Frankiewicz K. Small lung nodules detection based on local variance analysis and probabilistic neural network. Comput Methods Programs Biomed. 2018;161:173–80.
Ho TKK, Gwak J. Multiple feature integration for classification of thoracic disease in chest radiography. Appl Sci. 2019;9(19):4130.
Noor NM, Rijal OM, Yunus A, Mahayiddin AA, Peng GC, Abu-Bakar SAR. A statistical interpretation of the chest radiograph for the detection of pulmonary tuberculosis. In: 2010 IEEE EMBS conference on biomedical engineering and sciences (IECBES), Kuala Lumpur, Malaysia. IEEE. 2010. pp. 47–51. https://doi.org/10.1109/iecbes.2010.5742197.
Xu T, Cheng I, Long R, Mandal M. Novel coarse-to-fine dual scale technique for tuberculosis cavity detection in chest radiographs. EURASIP J Image Video Process. 2013;2013(1):3.
Plankis T, Juozapavicius A, Stasiene E, Usonis V. Computer-aided detection of interstitial lung diseases: a texture approach. Nonlinear Anal Model. 2017;22(3):404–11.
Kumar A, Yen-Yu W, Kai-Che L, Tsai IC, Ching-Chun H, Nguyen H. Distinguishing normal and pulmonary edema chest X-ray using Gabor filter and SVM. In: 2014 IEEE international symposium on bioelectronics and bioinformatics (IEEE ISBB 2014). IEEE, Chung Li, Taiwan, 2014. pp. 1–4. https://doi.org/10.1109/isbb.2014.68209.18.
Kesim E, Dokur Z, Olmez T. X-ray chest image classification by a small-sized convolutional neural network. In: 2019 scientific meeting on electrical-electronics & biomedical engineering and computer science (EBBT). IEEE (2019). https://doi.org/10.1109/EBBT.2019.8742050.
Liu C, Cao Y, Alcantara M, Liu B, Brunette M, Peinado J, Curioso W. TX-CNN: Detecting tuberculosis in chest X-ray images using convolutional neural network. In: 2017 IEEE international conference on image processing (ICIP), pp. 2314–2318. IEEE (2017).
Xu S, Wu H, Bie R. CXNet-m1: anomaly detection on chest X-rays with image-based deep learning. IEEE Access. 2018;7:4466–77.
Rajpurkar P, Irvin J, Ball RL, Zhu K, Yang B, et al. Deep learning for chest radiograph diagnosis: a retrospective comparison of the CheXNeXt algorithm to practicing radiologists. PLoS Med. 2018;15(11):e1002686.
Bhandary A, Prabhu GA, Rajinikanth V, Thanaraj KP, Satapathy SC, Robbins D, Raja E. Deep-learning framework to detect lung abnormality: a study with chest X-ray and lung CT scan images. Pattern Recogn Lett. 2020;129:271–8.
Ucar F, Korkmaz D. COVIDiagnosis-net: deep Bayes-Squeeze net based diagnostic of the coronavirus disease 2019 (COVID-19) from X-ray images. Med Hypoth. 2020;140:109761.
Ozturk T, Talo M, Yildirim EA, Baloglu UB, Yildirim O, Acharya UR. Automated detection of COVID-19 cases using deep neural networks with X-ray images. Comput Biol Med. 2020;121:103792.
GitHub. COVID-19. (2020). https://github.com/ieee8023/covid-chestxray-dataset/tree/master/images. Accessed 10 Mar 2020.
Kaggle. Covid-19 X-ray chest and CT. (2020a).https://www.kaggle.com/bachrr/covid-chest-xray. Accessed 20 Apr 2020.
Kaggle. X-ray chest. (2020b).https://www.kaggle.com/paultimothymooney/chest-xray-pneumonia. Accessed 10 Mar 2020.
Antonini M, Barlaud M, Mathieu P, Daubechies I. Image coding using wavelet transform. IEEE Trans Image Process. 1992;1(2):205–20.
Do MN, Vetterli M. The contourlet transform: an efficient directional multiresolution image representation. IEEE Trans Image Process. 2005;14(12):2091–106.
Easley G, Labate D, Lim WQ. Sparse directional image representations using the discrete shearlet transform. Appl Comput Harmon Anal. 2008;25(1):25–46.
Sengur A, Turkoglu I, Ince MC. Wavelet packet neural networks for texture classification. Expert Syst Appl. 2007;32(2):527–33.
Alcin OF, Sengur A, Ghofrani S, Ince MC. GA-SELM: Greedy algorithms for sparse extreme learning machine. Measurement. 2014;55:126–32.
Häuser S, Steidl G. Fast finite shearlet transform (2012). arXiv preprint arXiv:1202.1773.
Omar N, Sengur A, Al-Ali SGS. Cascaded deep learning-based efficient approach for license plate detection and recognition. Expert Syst Appl. 2020;149:113280.
Huang GB, Zhu QY, Siew CK. Extreme learning machine: theory and applications. Neurocomputing. 2006;70(1–3):489–501.
Deniz E, Şengür A, Kadiroğlu Z, Guo Y, Bajaj V, Budak Ü. Transfer learning based histopathologic image classification for breast cancer detection. Health Inform Sci Syst. 2018;6(1):18.
He K, Zhang X, Ren S, Sun J. Identity mappings in deep residual networks. European conference on computer vision. Cham: Springer; 2016. p. 630–645.
Author information
Authors and Affiliations
Corresponding authors
Rights and permissions
About this article

Cite this article
Ismael, A.M., Şengür, A. The investigation of multiresolution approaches for chest X-ray image based COVID-19 detection. Health Inf Sci Syst 8, 29 (2020). https://doi.org/10.1007/s13755-020-00116-6
Received:
Accepted:
Published:
DOI: https://doi.org/10.1007/s13755-020-00116-6