
Abstracts
Index of Oral Presentations
OP 01 Diabetes complications: new insights from cutting edge epidemiology
OP 02 News on the insulin secretion front
OP 03 Insulin sensitivity and biomarkers
OP 04 Central actions in diabetes
OP 05 Glucose-lowering therapies and the liver
OP 06 Uncomplicating the pathogenesis of diabetes complications in humans
OP 07 Smoke on the water: Is BAT still hot?
OP 08 Charting human beta cell failure in type 1 diabetes
OP 09 Novel agents in type 1 diabetes
OP 10 Developing better insulins
OP 11 From diagnostics to the end-stage of diabetic kidney disease
OP 12 NAFLD: Is it all about the liver?
OP 13 Diabetic retinopathy: see what's new?
OP 14 Taking the long view of diabetes
OP 15 Pregnancy in diabetes prediction and outcomes
OP 16 Signals and networks in beta cell failure
OP 17 Broken heart in diabetes
OP 18 Unlocking the potential of digital health
OP 19 Decoding the heritable basis of type 2 diabetes
OP 20 Feeding the pipeline: from drugs to surgery
OP 21 SGLT-2 inhibitors: at the heart of the matter
OP 22 New Treatments for NAFLD: Hope or Hype?
OP 23 Addressing potential new treatments of diabetic kidney disease
OP 24 Glucagon and hormones beyond
OP 25 Incretin based therapies
OP 26 Unusual forms of diabetes
OP 27 Macrovascular complications and beyond
OP 28 Linking inflammation to metabolism
OP 29 What's new in automated insulin delivery
OP 30 Understanding the mechanisms of diabetic kidney disease
OP 31 Novel aspects of diabetic neuropathy
OP 32 Reducing the burden of hypoglycaemia
OP 33 What exercise does
OP 34 Back to the future: risk markers in diabetes
OP 35 Diet: not only quantity matters
OP 36 On the road to human islet failure in type 2 diabetes
OP 37 A deep dive into the mechanisms of diabetes
OP 38 Triggers and drivers of beta cell failure in type 1 diabetes
OP 39 Gastro-entero pancreatic factors: organoids, mice and men
OP 40 New aspects of novel therapies
OP 41 Fatty matters
OP 42 Diabetes care is expensive
OP 43 Developing beta cells
OP 44 Modelling metabolism: lessons from animals
OP 45 Diabetic foot: new developments in wound healing
OP 46 Challenges in delivering diabetes care: new solutions
OP 47 Thinking about diabetes complications in the brain
OP 48 Insulin secretion in various subgroups
Index of Poster Sessions
PS 01 Diabetes and early death
PS 02 Living with chronic diabetes complications
PS 03 Micro- and macrovascular complications of diabetes
PS 04 Global view on diabetes complications
PS 05 Type 2 diabetes treatment IRL
PS 06 Unusual forms of diabetes
PS 07 Molecular insights into glucose abnormalities
PS 08 Pathophysiology of glucose homeostasis
PS 09 The inner workings of the pancreas
PS 10 Islets and antibodies in type 1 diabetes
PS 11 Markers and phenotypes of glucose traits
PS 12 Global aspects on the epidemiology of type 2 diabetes
PS 13 Risk factors for type 2 diabetes
PS 14 Prevalence of type 2 diabetes around the world
PS 15 Risk factors in type 1 diabetes
PS 16 Islet transplants revisited
PS 17 Islets in type 1 diabetes: new players
PS 18 Beta cells under stress
PS 19 To live and let die: a beta cell perspective
PS 20 Job description: insulin secretion
PS 21 Further down the road to human islet failure in type 2 diabetes
PS 22 Sitting and exercising does it all
PS 23 The ins and outs of carbohydrate metabolism
PS 24 Pregnancy: in vitro and in vivo studies
PS 25 Pregnancy: Epidemiology
PS 26 Pregnancy: Who is at risk?
PS 27 Incremental studies on gut hormones
PS 28 The fundamentals of insulin resistance
PS 29 Studies on insulin resistance
PS 30 Treatment of hyperglycaemia in pregnancy
PS 31 Pancreatic hormones
PS 32 Insulin secretion in mice and men
PS 33 Something more about obesity
PS 34 More about metabolism
PS 35 Inflammation in type 2 diabetes
PS 36 Models of prediabetes and diabetes
PS 37 Models of obesity and insulin resistance
PS 38 Lipid metabolism
PS 39 Adipokine signalling
PS 40 Drugs and environment in obesity
PS 41 Weight loss interventions
PS 42 Brain matters
PS 43 SGLT-2 inhibitors: clinical aspects
PS 44 Different aspects of SGLT-2 inhibitors
PS 45 Basic aspects of incretin-based therapies
PS 46 Clinical outcome of incretin-based therapies
PS 47 Glycaemic control and incretin-based therapies
PS 48 Various clinical aspects of incretin-based therapies
PS 49 Various aspects of nutrition and diet
PS 50 Oral therapies: metformin, sensitizers and other non-secretagogues
PS 51 Novel agents to treat diabetes and its consequences
PS 52 Novel glucose-lowering agents in type 2 diabetes
PS 53 Key issues in improving outcomes in people with diabetes, education and costs
PS 54 How to improve diabetes care
PS 55 The impact of new basal insulins
PS 56 Insulin therapy: real world studies
PS 57 Insulin therapy: fast acting insulin analogues
PS 58 The challenges of insulin therapy in type 2 diabetes
PS 59 Different aspects of insulin therapy
PS 60 The continued advance of continuous glucose monitoring
PS 61 Insulin pump therapy
PS 62 Automated insulin delivery
PS 63 The varied use of technologies in type 2 diabetes
PS 64 Novel applications of technology in diabetes
PS 65 Novel therapies to reduce hypoglycaemia
PS 66 Mechanisms and clinical consequences of hypoglycaemia in diabetes
PS 67 Emerging topics in hypoglycaemia
PS 68 Investigating diabetes distress and depression
PS 69 Aspects of quality of life and well being
PS 70 Digital health in type 2 diabetes
PS 71 Is telehealth the answer to improving care in diabetes?
PS 72 Predicting prognosis of diabetic kidney disease
PS 73 Clinical aspects of diabetic kidney disease
PS 74 The ROCK and role of experimental kidney disease
PS 75 New tools to view diabetic retinopathy
PS 76 Diabetic retinopathy: screening and intervention
PS 77 Focus on diabetic foot ulcers
PS 78 Hypertension and vascular disease
PS 79 Cure the pain of diabetic neuropathy
PS 80 Understanding clinical neuropathy
PS 81 From artificial intelligence to treatment of diabetic foot
PS 82 From biomarkers to genetics of diabetic kidney disease
PS 83 Treatment of NAFLD and diabetes: from food to pharmacology
PS 84 Mechanisms and prevalence of NAFLD
PS 85 Lipids everywhere: lipid metabolism in the liver and the heart
PS 86 All about coronary arteries and diabetes
PS 87 Lipids and glucose: not so good for the heart
PS 88 Cardiac complications: of mice, rats and cells
PS 89 Atherosclerotic complications: stemming from cells to the kidney
PS 90 Stiff arteries and how to avoid them
PS 91 Cardiac function and dysfunction
PS 92 Cardiovascular complications in humans through and through
PS 93 Diabetes and neoplasia
PS 94 Contemplating cognitive dysfunction in diabetes
PS 95 Endothelial cell, circulation and the heart
PS 96 Tradition? No! Non-traditional complications of diabetes
OP 01 Diabetes complications: new insights from cutting edge epidemiology
1
Circulating metabolites significantly improve the prediction of renal dysfunction in type 2 diabetes
M. Scarale1, S. De Cosmo1, C. Prehn2, F. Schena3, J. Adamski2, V. Trischitta4, C. Menzaghi1;
1Fondazione IRCCS “Casa Sollievo della Sofferenza”, San Giovanni Rotondo, Italy, 2Helmholtz Zentrum, München, Germany, 3University of Bari, Bari, Italy, 4Sapienza University, Roma, Italy.
Background and aims: Chronic kidney disease (CKD), mainly indicated by a reduced glomerular filtration rate (GFR) remains one of the leading causes of reduced lifespan in patients with type 2 diabetes (T2D). Discovering novel biomarkers able to predict low GFR will help identify high-risk patients to be targeted to more aggressive and burdensome preventive and treatment strategies.
Materials and methods: We measured 181 serum metabolites by AbsoluteIDQTM p180 Kit (BIOCRATES Life Sciences AG, Innsbruck, Austria) and investigated their association with eGFR (calculated with the CKD-EPI formula) in a discovery sample of 325 patients with T2D (116 cases and 209 controls with eGFR<60 and ≥70ml/min/1.73m2, respectively). A threshold p value of 2.8x10⁻⁴ (i.e. 0.05/181 following Bonferroni's rule) was used as statistical significance in a model comprising age, sex, smoking, BMI, HBA1c, diabetes duration, albumin-to-creatinine ratio (ACR) and ongoing treatments. Metabolites associated in the discovery sample were validated (threshold p value of 0.05/number of surviving validation metabolites) in a second cohort comprising 465 diabetic patients (166 cases and 299 controls for eGFR<60 or ≥70ml/min/1.73m2, respectively). Standardized values of each validated metabolites, weighted for the effect size (i.e. β) observed in the discovery sample, were then summed up in a metabolic score (MetScore) to be used as a GFR prediction tool. To this purpose, MetScore was used on top of an established clinical model (comprising sex, age, BMI, HbA1c and ACR) and then discrimination [∆ area under the Receiver operating characteristic (ROC) curve (AUC) and the relative integrated discrimination improvement (rIDI)] and reclassification [the category-free net reclassification index (cNRI)] measures were evaluated.
Results: Thirteen metabolites (six acylcarnitines, six biogenic amines and one amino acid) were independently associated to low eGFR [ORs range 2.2-5.1 for 1SD increase; p range 1.3x10⁻⁷ - 2.0x10⁻⁴] in the discovery sample. All of them but one (a biogenic amine) were validated in the replication sample [ORs range 1.7-3.6 for 1SD increase; p range 3.2x10⁻¹⁸ - 4.3x10⁻⁶, below the threshold of 0.05/12=4.2x10-3]. The AUC of the above-mentioned clinical model was 92.7%, 81.8% and 86.6% in the discovery, the replication and the pooled sample, respectively. The addition of MetScore on top of the clinical model improved both discrimination and reclassification measures in the discovery (Δ AUC=4%, p=1.4x10⁻³; rIDI=29%, p=2.0x10⁻¹¹; ½cNRI=54%, p=1.5x10⁻¹⁴), the replication (Δ AUC=3.9%, p=1.6x10⁻³; rIDI=28%, p=3.8x10⁻⁸; ½cNRI=30%, p=2.2x10⁻¹⁰) and the pooled samples (Δ AUC=3.9%, p=4.0x10⁻⁶ ; rIDI=29%, p=2.2x10⁻¹⁷; ½cNRI=35%, p=1.9x10⁻⁸).
Conclusion: We have discovered and validated 12 metabolites that are strongly associated with low eGFR in patients with T2D. A MetScore comprising these 12 metabolites improves an established clinical prediction model of low eGFR in terms of both discrimination and reclassification. Encouraged by these findings we are now investigating the ability of MetScore to improve prediction of GFR decline in prospective cohorts of T2D, with the aim of improving risk stratification and, therefore, refining prevention efforts of kidney dysfunction in diabetic patients.
Supported by: Italian Ministry of Health RF-2013-02356459
Disclosure: M. Scarale: None.
2
Association between insulin-like growth factor binding protein-2 and insulin sensitivity, metformin and mortality in patients with newly diagnosed type 2 diabetes
M.R. Kristiansen1,2, J.S. Nielsen1,2, I. Brandslund3, D.A. Olsen3, J.V. Stidsen2, S.K. Nicolaisen4, R. Hjortebjerg2,5, J. Frystyk5,6;
1Danish Centre for Strategic Research in Type 2 Diabetes (DD2), Odense, 2Steno Diabetes Center Odense, Odense, 3IRS, Lillebaelt Hospital, Biochemistry and Immunology, Vejle, 4Department of Clinical Epidemiology, Aarhus, 5Department of Clinical Research, University of Southern Denmark, Odense, 6Department of Endocrinology, Odense University Hospital, Odense, Denmark.
Background and aims: Insulin-like growth factor binding protein-2 (IGFBP-2) is engaged in metabolism. Circulating concentrations of IGFBP-2 are positively correlated to insulin sensitivity. Overexpression of IGFBP-2 protects against obesity and diabetes in mice, and metformin increases IGFBP-2 gene expression, indicating that IGFBP-2 is a target of metformin action. Interestingly, IGFBP-2 appears to predict mortality independently of insulin sensitivity. This study aimed to investigate the association between indices of insulin sensitivity, metformin treatment and mortality in patients with newly diagnosed type 2 diabetes (T2D).
Materials and methods: In this cross-sectional study, we included newly diagnosed patients with T2D enrolled in the Danish Centre for Strategic Research in Type 2 Diabetes (DD2) cohort. Patients were continuously enrolled from 2010 to 2018 throughout Denmark and followed using Danish healthcare registries. Unbound fractions of IGFBP-2 were determined in serum from fasting drug naïve (n=864) and metformin treated (≥ two prescriptions 6 months prior enrollment) patients (n=558) using an in-house assay developed on the Simoa platform. Values are given as medians (IQR). Association was analyzed using a Pearson’s regression/Cox regression. A multivariable model was used to adjust for age, BMI, and HOMA-S.
Results: A total of 1422 patients with median age of 64 (56;71), median BMI of 30 (27;34) and median diabetes duration of 0.9 (0.0;2.3) years were included. IGFBP-2 level was positively correlated with HOMA-S (R2=0.26 and p<0.005) and inversely correlated with c-peptide (R2=-0.18 and p<0.005). Both associations persisted following adjustments for age and BMI. The IGFBP-2 level in metformin treated patients was slightly lower (245 (174;406) ng/mL) than in drug naïve patients (274 (188;450) ng/mL) (p=0.026). A total of 460 patients suffered from one or more comorbidities from Charlson comorbidity index. Their IGFBP-2 levels were higher than patients with no comorbidity (321 (204;497) vs. 246 (173;394) ng/mL, p<0.001). During a median of 4.9 (3.9-5.9) years of follow-up, a total of 87 (6.12%) patients died. IGFBP-2 level was significantly higher at baseline in patients that died vs. not died (458 (259;665) vs. 254 (178;415) ng/mL, p<0.001). IGFBP-2 was associated with mortality with a hazard ratio(HR) (95% CI) per doubling in protein concentration of 2.0 (1.5;2.7), p<0.001. This association was not observed when analyzing patients without comorbidities but was significant in patients with other comorbidities (HR: 2.3 (1.7;3.3), p<0.001).
Conclusion: This is the first larger study to confirm that IGFBP-2 is associated with indices of insulin sensitivity but is not largely affected by metformin treatment. Interestingly, increased IGFBP-2 level is associated with high mortality rates, but the association was mainly driven by the presence of comorbidities at baseline.
Supported by: University of Southern Denmark and Region of Southern Denmark
Disclosure: M.R. Kristiansen: None.
3
Building clinical risk score systems for predicting all-cause and cardiovascular-specific mortality among type 2 diabetes patients
C.-S. Liu1, T.-C. Li2, C.-C. Lin1, C.-I. Li1;
1China Medical University Hospital, Taichung, 2China Medical University, Taichung, Taiwan.
Background and aims: No prior prediction model for mortality considered the effect of glycemic variability and blood pressure variability which have been broadly reported as the important clinical predictors of mortality, especially in diabetes patients. The aim of this study was to develop and validate risk score systems with considering the effects of glycemic and blood pressure variability on all-cause and cardiovascular-specific mortality in persons with type 2 DM.
Materials and methods: This is a retrospective cohort study consisting of 10,800 type 2 diabetic patients aged 30-85 years during 2003-2014. All participants were randomly allocated into two groups, derivation and validation sets in 2:1 ratio and were followed up until death, or August 2019. Cox proportional hazards regression were used to develop all-cause and cardiovascular-specific mortality prediction model. Prediction model performance was assessed by the area under the receiver operating characteristics curve (AUROC).
Results: Overall, 2,528 deaths were identified after a mean of 8.6 years of follow-up. The prediction accuracy, measured by AUROC, of 3-, 5-, 10- and 15-year all-cause mortality based on a model containing the identified traditional risk factor, biomarkers, and variability in fasting plasma glucose and HbA1c, and diastolic blood pressure variability were 0.79 (0.77-0.81), 0.79 (0.77-0.80), 0.81 (0.79-0.82) and 0.81 (0.80-0.82), respectively, in derivation set; and the corresponding values for cardiovascular-specific mortality were 0.86 (0.83-0.89), 0.83 (0.81-0.86), 0.82 (0.81-0.84) and 0.81 (0.80-0.83), respectively. The prediction accuracy in the validation set for all-cause mortality were 0.82 (0.78-0.85), 0.81 (0.79-0.83), 0.81 (0.80-0.83) and 0.81 (0.79-0.82), respectively, and for cardiovascular-specific mortality were 0.85 (0.80-0.89), 0.83 (0.79-0.86), 0.82 (0.80-0.85) and 0.81 (0.79-0.83), respectively.
Conclusion: Our prediction model considering glycemic and blood pressure variability had good accuracy of prediction of cardiovascular-specific and all-cause mortality in patients with type 2 diabetes.
Supported by: Ministry of Science and Technology of Taiwan
Disclosure: C. Liu: None.
4
Incident cardiovascular disease by clustering of favourable risk factors in type 1 diabetes. The EURODIAB Prospective Complications study
S. Soulimane1, Y.D. Vogtschmidt1,2, M. Toeller3, B. Balkau4, N. Chaturvedi5, J.H. Fuller6, S.S. Soedamah-Muthu1,2;
1Department of Medical and Clinical Psychology, Center of Research on Psychological and Somatic disorders (CoRPS), Tilburg University, Netherlands, 2Institute for Food, Nutrition and Health, University of Reading, Reading, UK, 3Heinrich-Heine-University Düsseldorf, Düsseldorf, Germany, 4Clinical Epidemiology, Université Paris-Saclay, UVSQ, Inserm, CESP, Villejuif, France, 5Institute of Cardiovascular Science University College of London, London, UK, 6Department of Epidemiology and Public Health, EURODIAB, London, UK.
Background and aims: The incidence of cardiovascular diseases (CVD) is up to eight times higher in people with type 1 diabetes (T1D). Greater clustering of adverse risk factors is thought to contribute to excess CVD risks in type 2 diabetes, though not explored in T1D. The aim of this study was to examine a) CVD risk reduction for those in the most favourable third of individual risk factors compared to the least favourable two thirds, and b) CVD risk reduction by clustering of favourable CVD risk factors.
Materials and methods: We analysed data of 2086 participants from the EURODIAB Prospective Complications study, a European T1D cohort, recruited in 16 countries, between 1989-91; 51% were men, with a mean age of 32±10 years. We studied seven CVD risk factors, namely HbA1c, smoking, BMI, combined systolic and diastolic BP, LDL cholesterol, physical activity (PA) and diet (Table). Cox Proportional Hazards analyses were used to calculate hazard ratios (HR [95%CI]) of incident CVD, for each CVD risk factor (adjusted for age, sex, retinopathy), comparing those in the most favourable tertiles with the least favourable two tertiles. We then scored each individual by the number of risk factors for which they occupied the most favourable tertiles.
Results: There were 147 incident CVD cases, after a mean follow-up of 7.2±1.3 years. Multivariable Cox models showed that participants with the most favourable HbA1c<5.7% [39mmol/mol] had a 54% significantly lower CVD risk HR [95%CI]: 0.46[0.28,0.77] than the least favourable two tertiles; non-significant inverse associations were found with favourable BMI: 0.92[0.60,1.43], PA: 0.77[0.52,1.16], diet score: 0.68[0.34,1.36] and BP: 0.80[0.46,1.39]. No associations were found with smoking or LDL-cholesterol. Greater clustering of favourable CVD risk factors was associated with a lower risk of CVD in univariate models, with a significant linear trend. In multivariate models, the results were partly attenuated, with the lowest HR of 0.52[0.29, 0.94] in people with clustering of 3 favourable CVD risk factors (Table).
Conclusion: Greater clustering of favourable CVD risk factors was associated with a lower risk of incident CVD in people with T1D, with a dose-response relationship. HbA1c remained the most protective factor against CVD in T1D. Targeting combined risk factors could be more effective in preventing CVD risk than targeting single risk factors.

Supported by: Welcome Trust, the European Community and Diabetes UK
Disclosure: S. Soulimane: None.
5
Bidirectional association between type 2 diabetes and obstructive sleep apnoea: a meta-epidemiological study
T. Karagiannis1, E. Athanasiadou1, A. Tsapas1,2, E. Bekiari1;
1Clinical Research and Evidence-Based Medicine Unit, Aristotle University of Thessaloniki, Thessaloniki, Greece, 2Harris Manchester College, University of Oxford, Oxford, UK.
Background and aims: Individual epidemiological studies suggest a complex relationship between type 2 diabetes and obstructive sleep apnea. We aimed to assess whether there is a bidirectional association between the two conditions by conducting a meta-analysis of longitudinal cohort studies.
Materials and methods: We included cohort studies that evaluated the association between type 2 diabetes and obstructive sleep apnea in either direction, published until January 2020. We pooled cohort-specific estimates by means of random and fixed effects meta-analyses and calculated odds ratios (ORs) with 95% confidence intervals (CIs), to measure the association of prevalent obstructive sleep apnea with incident type 2 diabetes and of prevalent type 2 diabetes with incident obstructive sleep apnea.
Results: Out of 1928 records identified through the search, 15 cohort studies were included in the meta-epidemiological analysis. Ten studies evaluated the association between prevalent obstructive sleep apnea and incident type 2 diabetes, one study assessed the association between prevalent type 2 diabetes and incident obstructive sleep apnea, while four studies evaluated a bidirectional association. Duration of study follow-up ranged between 2.7 and 22 years (median = 8 years). The random effects meta-analysis for prevalent obstructive sleep apnea and incident type 2 diabetes (335,056 patients) yielded an OR of 2.47 (95% CI, 2.05 to 2.97). Results were consistent in the fixed effects meta-analysis (Figure). Prevalent type 2 diabetes increased the odds of incident obstructive sleep apnea (409,707 patients), with an OR of 1.70 (95% CI, 1.15 to 2.53) and 1.85 (95% CI 1.76 to 1.95) for the random-effects and fixed-effects meta-analysis respectively. Meta-analyses of effect estimates adjusted for confounding factors were similar to those of the main analysis.
Conclusion: Pooled evidence from large cohort studies suggests that presence of obstructive sleep apnea at baseline is associated with increased risk for developing type 2 diabetes, while presence of type 2 diabetes is associated with increased risk for developing obstructive sleep apnea. Thus, effective management of either condition could prevent development of the other.
Figure. Odds ratio for developing type 2 diabetes in patients with obstructive sleep apnea versus those without obstructive sleep apnea

Supported by: Greece and the European Social Fund (ESF)
Disclosure: T. Karagiannis: None.
6
Glycated haemoglobin, type 2 diabetes and the links to dementia and its major sub types: findings from the Swedish National Diabetes Register
C. Celis-Morales1, S. Franzén2, A.-M. Svensson3, N. Sattar1, S. Gudbjornsdottir2;
1Institute of Cardiovascular and Medical Sciences, University of Glasgow, Glasgow, UK, 2Department of Molecular and Clinical Medicine, University of Gothenburg, Gothenburg, Sweden, 3Swedish National Diabetes Register, Gothenburg, Sweden.
Background and aims: Type 2 diabetes (T2D) has been associated with high dementia risk. However, the links to different dementia sub-types is unclear. We examined to what extent T2D associated with Alzheimer, vascular and non- vascular dementia incidence and whether such associations differed by glycaemic control.
Materials and methods: In this Swedish National Diabetes Register study, we included 378,299 patients with T2D and 1,886,022 matched controls. The outcomes were incidence of Alzheimer, vascular and non- vascular dementia. The association of T2D with dementia was stratified by baseline Glycated Haemoglobin (HbA1c) concentrations. Cox regression was used to study the excess risk of outcomes.
Results: The follow-up (median 6.8 years) 21,651 (5.7%) T2D patients and 98,723 (5.2%) controls developed dementia. The strongest association was observed for vascular dementia: here, patients with T2D had a HR of 1.36 [95% CI 1.03, 1.09] compared to controls. The association of T2D with non-vascular dementia was more modest (HR: 1.08 [95% CI 1.04, 1.12]). However, risk of Alzheimer was lower in T2D patients compared to controls (HR: 0.92 [95% CI 0.87, 0.98]). When the analyses were stratified by circulating concentrations of HbA1c a dose-response association was observed. Compare to patients with T2D with HbA1c <52 mmol/mol, those with HbA1c >87 mmol/mol had a higher risk of Alzheimer (HR: 1.34 [95% IC 1.03, 1.75]), vascular dementia (HR: 1.93 [95% IC 1.53, 2.42]) and non-vascular dementia (HR: 1.67 [95% IC 1.45, 1.91]). When a 3-years landmark analysis was conducted, the associations remained similar for vascular and non-vascular dementia but disappeared for Alzheimer’s diseases.
Conclusion: The association of T2D with neurodegenerative diseases differ by type of dementia. The strongest detrimental association was observed for vascular dementia. Moreover, T2D patients with poor glycaemic control have an increased risk of developing vascular and non-vascular dementia.
Disclosure: C. Celis-Morales: None.
OP 02 News on the insulin secretion front
7
What makes beta cells 1st responders, and are they temporally consistent?
V. Kravets, W.E. Schleicher, J.M. Dwulet, A.M. Davis, R.K.P. Benninger;
Bioengineering, University of Colorado, Aurora, USA.
Background and aims: Calcium (Ca2+) uptake drives glucose-stimulated insulin secretion from the pancreatic β-cells. Functional subpopulations of β-cells disproportionally control the oscillatory phase of Ca2+ uptake, which is disrupted with ageing and in diabetes. Less is known about β-cells which impact the 1st phase of Ca2+ uptake, disrupted in early diabetes. Here we determine whether “1st-responder” cells that lead the 1st phase of Ca2+ uptake are the same as “hub” cells that coordinate oscillatory Ca2+ (2nd) phase. We study what makes β-cell a 1st responder, and whether 1st responders are a transient state or a distinct temporally stable subpopulation.
Materials and methods: We used MIP-CreER GCaMP6s mouse model which expresses Ca2+-sensitive GFP specifically in β-cells. We performed simultaneous recording of Ca2+ dynamics and gap junction permeability in individual islets. We stimulated islets with glucose, Katp channel blocker glibenclamide, and KCl. Based on Ca2+ dynamics we defined the 10% of cells responding to the glucose stimulation sooner than the rest of the islet as “1st responders”, and the 10% of cells responding slower as “last responders”. We tested their temporal consistency over 1, 24, and 48 hours. We used laser ablation to remove specific cells from the islet. We performed computational modelling of the islet electrophysiology.
Results: We found that Ca2+ wave coordination of the 1st responders was not greater than the islet-average, and hence they are not overlapping with highly-coordinated “hub” cells. In fact, according to our gap junction permeability data, 1st responders had lower than average electrical coupling (p=0.0157). Furthermore, our computational model showed lower electrical coupling conductance in both 1st and last responders (p=0.0447, p=0.0279). This may be explained by our finding that 1st responders are located at the islet’s periphery (at 0.8 ± 0.1 of the islet’s radius). We found 1st responders to be consistent under glibenclamide stimulation: cells which respond first to the glucose remained in the 15th percentile of the time response distribution when stimulated with glibenclamide (SEM 10%). This is consistent with our computational results: 1st responders had lower Katp conductance (hence higher membrane depolarization probability) (p=0.0086). Glucose elevations with 1h period showed that 1st responders remained consistent: with reaction time within the 25% of the reaction time distribution for all cells. With an elevation period of 24 hours, their reaction time shifted to the second quartile of the distribution, and with 48 hours to the median. Unlike 1st responders, last responder cells were not consistent at any time interval. Ablation of the 1st responders dis-coordinated, but did not disrupt, the Ca2+ response of the islet. A different cell took over the role of the 1st responder post-ablation. This new 1st responder was a cell which originally, pre-ablation, was within a leading 7th percentile of the time response distribution (SEM 3%).
Conclusion: In conclusion, 1st responders are distinct from “hub” cell subpopulation, have higher membrane depolarization probability and are less strongly coupled to other cells. After the laser ablation of a 1st responder, new 1st responder taking on it’s role comes from a pool of original leading cells. While initially consistent over a short 1h period of time, 1st responders may be losing temporal consistency over longer time periods.
Supported by: NR01 DK102950, DK106412, JDRF 3-PDF-2019-741-A-N
Disclosure: V. Kravets: None.
8
Beta-arrestin 2 is absolutely required for the potentiation of insulin secretion by GIP
M.A. Ravier1, J. Obeid1, M. Leduc1, S. Costes1, P. Gilon2, S. Dalle1, G. Bertrand1;
1IGF, Univ. Montpellier, CNRS, INSERM, Montpellier, France, 2Université Catholique de Louvain, Brussels, Belgium.
Background and aims: The scaffold protein beta-arrestin2 (ARRB2) is known to uncouple G protein coupled receptors (GPCRs) from the G protein and to recruit new signaling pathways (such as the ERK1/2, PI3K, FAK⋯). In non beta cells, ARRB2 interacts with a wide range of GPCRs, but its interaction with the GIP receptor (GIPR) is still unclear. Our aim is to determine if ARRB2 is involved in the signaling of the GIPR in pancreatic beta cells.
Materials and methods: The experiments were carried out in beta cells from five-month-old Arrb2+/+ and Arrb2-/- male mice. cAMP production (CAMPS-EPAC), endogenous PKA (AKAR3) and ERK1/2 (EKAR) activations, [Ca2+] in the cytosol ([Ca2+]c ; Fura2-LR) and in the endoplasmic reticulum ([Ca2+]ER ; D4ER) were assessed by live cell imaging in mouse pancreatic beta cells. EPAC2 (EPAC2-GFP) recruitment beneath the plasma membrane was monitored by total internal reflection fluorescence microscopy. F-actin depolymerisation was evaluated by phalloidin staining (Alexa Fluor 488-conjugated phalloidin) and the phosphorylation of Focal Adhesion Kinase (FAK) by immunofluorescence.
Results: Insulin secretion from Arrb2-/- islets was reduced by 50% compared to Arrb2+/+ islets in response to GIP (100pM-10nM, p<0.01). When ARRB2 (ARRB2-GFP) was re-expressed in Arrb2-/- beta cells, insulin secretion in response to GIP was restored to a similar level than in Arrb2+/+ islets. Surprisingly, upon GIP stimulation (10pM-10nM), the cAMP production, PKA activation and EPAC2 recruitment were similar in Arrb2+/+and Arrb2-/- beta cells. Both [Ca2+]c and [Ca2+]ER remained comparable. Finally, the activation of ERK1/2 was also similar in Arrb2+/+ and Arrb2-/- beta cells. By contrast, the F-actin depolymerisation induced by 10nM GIP was significantly reduced (~25%, p<0.01) in Arrb2-/- beta cells. PI3Kγ and FAK have been reported to be involved in F-actin depolymerisation in response to GIP and glucose, respectively, and to be required for optimal insulin secretion. As expected, the PI3Kγ inhibitor (AS604850; 1μmol/l) reduced F-actin depolymerisation (~30%, p<0.01) by GIP stimulation in Arrb2+/+ beta cells, but no additional effect was observed in Arrb2-/- beta cells. Moreover, GIP-induced FAK activation was also reduced by 50% in Arrb2-/- beta cells.
Conclusion: Our study revealed that ARRB2 is required for the potentiation of insulin secretion by GIP, through F-actin depolymerisation probably via FAK activation and PI3Kγ recruitment, but independently from the canonical cAMP signalling (PKA and EPAC2) and the ERK1/2 pathway. Therefore, any variation in the expression of ARRB2, as observed in diabetic states, should functionally affect the incretin effect produced by GIP.
Supported by: Société Francophone du Diabete (SFD)
Disclosure: M.A. Ravier: None.
9
Pancreatic beta cell-selective deletion of the mitofusins 1 and 2 (Mfn1 and Mfn2) impairs glucose-stimulated insulin secretion in vitro and in vivo
G.A. Rutter1, E. Georgiadou1, T. Rodriguez2, C. Muralidharan3, M. Martinez3, P. Chabosseau1, A. Tomas1, G. Carrat1, A. Di Gregorio2, I. Leclerc1, A.K. Linnemann3;
1Cell Biology & Functional Genomics, Faculty of Medicine, Imperial College London, London, UK, 2National Heart and Lung Institute, Imperial College London, London, UK, 3Center for Diabetes and Metabolic Diseases, Indiana University School of Medicine, Indianapolis, USA.
Background and aims: Mitochondrial metabolism of glucose is essential for the initiation of insulin release from pancreatic beta cells. Although altered in subjects with type 2 diabetes, whether mitochondrial ultra-structure, and the proteins controlling the fission and fusion of these organelles, are important for glucose recognition, is unclear. Here, we generated mice with beta cell-selective, adult-restricted deletion of Mfn1 and Mfn2, essential for mitochondrial fusion, and studied the impact on insulin secretion and glucose homeostasis in vivo and in vitro.
Materials and methods: C57BL6 mice bearing Mfn1 and Mfn2 alleles with FloxP sites were crossed to transgenic animals carrying an inducible Cre recombinase under Pdx1 promoter control (PdxCreERT). Recombination was achieved by daily tamoxifen injections for one week. Islets were isolated and used for live beta cell fluorescence imaging of cytosolic (Cal520) or mitochondrial (R-GECO) free Ca2+ concentration and membrane potential (tetramethyl rhodamine methyl ester, TMRM) using spinning disc confocal microscopy (Nikon Ti2). Mitochondrial network characteristics were quantified using super resolution fluorescence (Zeiss LSM 780) and transmission electron microscopy. Intravital imaging was performed in mice injected with an adeno-associated virus to express the cytosolic Ca2+ sensor gCaMP6s selectively in beta cells under the control of the rat insulin promoter using multiphoton microscopy (Leica TCS SP8 DIVE). Blood flow through the islet was visualised simultaneously after injection of fluorescent albumin647.
Results: Mitochondrial length was sharply (to 77±0.9% of controls, p<0.0001) reduced in the Mfn1/2 KO mice and these animals displayed higher fasting glycaemia than control littermates at 11-12 weeks (8.6 vs 6.4 mmol/L, p>0.05) in vivo. An increase in circulating glucose levels was also observed (p<0.05 at 30 min and p<0.01 at 60 min) and was associated with a substantial (>five-fold) decrease in plasma insulin (5-15 min, p<0.0001) post-intraperitoneal glucose injection. Mitochondrial Ca2+ accumulation and membrane potential were significantly reduced (p<0.01) in response to high glucose in the KO animals. Examined by intravital imaging of the exteriorised pancreas, antiparallel changes in cytosolic Ca2+ and mitochondrial membrane potential, observed in control animals, were largely suppressed after Mfn1/2 deletion.
Conclusion: Mitochondrial fusion and fission cycles are essential in the beta cell to maintain normal mitochondrial bioenergetics and glucose sensing both in vitro and in the living mouse. Such cycles may be disrupted in some forms of diabetes to impair mitochondrial function and, consequently, insulin secretion.
Supported by: Wellcome; MRC; EU, Diabetes UK, NIH
Disclosure: G.A. Rutter: Employment/Consultancy; Sun Pharmaceuticals. Grants; Les Laboratoires Servier.
10
Unveiling the role of a mitochondrially-encoded tRNA-derived fragment in beta cell function
C. Jacovetti, V. Menoud, S. Gattesco, B. Bayazit, R. Regazzi;
Department of Neurosciences and Biomedical Sciences, University of Lausanne, Lausanne, Switzerland.
Background and aims: Mitochondria play essential roles in cellular energy production and contain their own genome that is transcribed to generate 11 mRNAs, 2 rRNAs and 22 tRNAs, all required for the synthesis of 13 protein subunits of the electron transport chain. Mutations in mitochondrially-encoded tRNAs strongly associate with diabetes. Interestingly, the cleavage of tRNAs has been recently shown to generate short non-coding RNA molecules with regulatory functions. Indeed, emerging evidence suggests that these tRNA-derived fragments (tRFs) are not by-products from random degradation, but functional molecules that modulate a number of cellular processes. However, very little is known about the role and the mode of action of tRFs. The aim of this project is to determine the role played by mitochondrially-encoded tRFs (mt-tRFs) in Beta-cell function.
Materials and methods: We used high throughput RNA-sequencing to search for mitochondrially-encoded pancreatic islet tRFs. Mitochondrial enrichment of mt-tRF relative to whole-cell lysate RNA preparations was confirmed by quantitative real-time PCR. The functional impact of selected mt-tRFs on mitochondrial function, insulin secretion, cell proliferation and survival was studied by modifying their expression in the insulin-secreting cell line INS832/13 and in dissociated rat islet cells. Real-time PCR was used to determine the signalling pathways controlled by the mt-tRFs.
Results: RNA-sequencing led to the identification of 3187 tRFs in primary islet cells of adult rats, two of which mitochondrially-encoded, mt-tRF-1 and mt-tRF-4. Mt-tRF1 is cleaved from tRNALeu(TAA), is 41 bp long and is enriched 2 times in the mitochondrial fraction (MF) of adult rat islets. Transfection of antisense oligonucleotides complementary to this fragment, reduced mt-tRF-1 level by about 90% in INS832/13 and dissociated rat islet cells. Inhibition of tRF-1 resulted in impaired insulin release in response to glucose but not to KCl without affecting cell survival in the presence or absence of proinflammatory cytokines. Interestingly, we found that mt-tRF1 is strongly down-regulated in the islets of newborn rats exposed to low-protein diet (LP) during foetal and postnatal life, a growth retardation model characterized by impaired insulin secretion, mitochondrial dysfunction and diabetes susceptibility at adulthood. Blockade of mt-tRF1 in rat islet cells resulted in an increase in the expression of the Uncoupling Protein 1 (Ucp1), which uncouples the mitochondrial proton gradient from ATP synthesis. In agreement with this finding, the level of Ucp1 and mt-tRF1 were found to be inversely correlated in the islets of LP newborn rats.
Conclusion: Blockade of mt-tRF1, a fragment derived from the mitochondrially-encoded tRNALeu(TAA), which is decreased in the islets of newborn rats kept on a low protein diet, suppresses glucose-induced insulin release, suggesting its potential contribution to Beta-cell dysfunction and diabetes susceptibility associated with neonatal deleterious environment. Our data could pave the way for the development of new small non-coding RNA-based strategies aiming at preserving an appropriate functional Beta-cell mass.
Supported by: SNF
Disclosure: C. Jacovetti: None.
11
Post-transcriptional co-regulation of insulin secretory granule proteins
J. Vasiljević1,2, D. Vasiljević3, C. Niehage4, C. Wegbrod1,2, K. Ganss1,2, A. Soenmez1,2, A. Friedrich1,2, B. Hoflack4, M. Selbach3,5, M. Solimena1,2;
1Paul Langerhans Institute Dresden (PLID) of the Helmholtz Center Munich at the University Hospital Carl Gustav Carus and Faculty of Medicine of the TU Dresden, Dresden, 2German Center for Diabetes Research (DZD e.V.), Neuherberg, 3Max Delbrück Center for Molecular Medicine (MDC), Berlin, 4Biotechnology Center, Dresden, Germany, 5Charité – Universitätsmedizin Berlin, Berlin, Germany.
Background and aims: Once glucose-stimulated beta cells release insulin, they immediately activate insulin production to adjust their insulin stores. Notably, glucose stimulation initially enhances insulin biosynthesis without affecting its mRNA levels. Thus, post-transcriptional mechanisms are essential to retain insulin stores and beta cell responsiveness. This adaptation relies on interactions of RNA-binding proteins (RBPs) with regulatory sequences in mRNA untranslated regions (UTRs). Moreover, functionally related mRNAs can be post-transcriptionally co-regulated through elements recognized by the same RBPs. Such elements are conserved in mammalian mRNAs for insulin and for other secretory granule cargoes, e.g. PC1/3, PC2 and ICA512/IA-2/PTPRN. We previously showed that these mRNAs are post-transcriptionally coordinated by RBPs, but an overview of the latter was missing.
Materials and methods: We combined in vitro RNA pull-downs and mass spectrometry to identify RBPs that bind to mouse Ins1, Ins2, spliced Ins2, PC2 and ICA512 mRNA 5’-UTRs in resting and glucose stimulated MIN6 cells. Mouse γ-tubulin mRNA 5’-UTR was used as a control.
Results: mRNAs for secretory granule cargoes share many RBPs that are enriched compared to the γ-tubulin mRNA. Notably, different sets of RBPs control these mRNAs in resting and stimulated cells. We discovered that heterogeneous ribonucleoprotein A2/B1 (hnRNP A2/B1) is a novel post-transcriptional regulator of insulin expression in MIN6 cells. Mouse, human and rat Insulin mRNAs include sequences homologous to hnRNP A2/B1 response elements (A2REs). hnRNP A2/B1 binding to the 5’-UTR of Ins1 mRNA harboring mutated A2REs was reduced. Hnrnpa2b1-/- MIN6 cells had lower Ins1 mRNA, insulin and proinsulin levels, and consequently lower insulin secretion. In resting MIN6 cells hnRNP A2/B1 was enriched in cytosolic punctae co-stained for Ins1 and Ins2 mRNAs and markers of stress granules, which store repressed transcripts. Upon stimulation the stress granules dissolved and hnRNP A2/B1 localized predominantly to the nucleus, while the Insulin mRNAs were dispersed in the cytoplasm. We are investigating if similar patterns occur in beta cells of healthy and diabetic patients.
Conclusion: We propose that in resting beta cells, specific RNA-protein interactions allow for the storage of mRNAs for insulin secretory cargoes into stress granules. Glucose stimulation remodels these interactions: stress granules dissolve, a different set of RBPs bind and coordinate mRNA translation, enabling a burst in insulin secretory granule production. To our knowledge this is the first report of stress granules in beta cells. Further experiments will expand on post-transcriptional mechanisms in beta cells and their potential perturbations in diabetes.
Supported by: German Center for Diabetes Research (DZD e.V.)
Disclosure: J. Vasiljević: None.
12
The mechanosensor Piezo1 mediates glucose sensing and insulin secretion in pancreatic beta cells
M. Barghouth1, Y. Ye1, Y. Wang2, C. Luan1, A. Karagiannopoulos1, L. Eliasson1, P. Rorsman3, E. Zhang1, E. Renström1;
1Lund University Diabetes Centre, Department of Clinical Sciences, Malmö, Sweden, 2Section for Surgery Lund University Department of Clinical Science, Malmö, Sweden, 3Oxford Centre for Diabetes, Endocrinology, and Metabolism, Radcliffe Department of Medicine, University of Oxford, Oxford, UK.
Background and aims: Defective insulin secretion in pancreatic β cells is a hallmark of all types of diabetes, resulting in chronically elevated blood glucose levels. The impact of blood flow and mechanotransduction in the regulation of insulin secretion are incompletely investigated. In vascular endothelial cells, mechanical shear forces induced by blood flow induce ATP release and trigger Ca2+ waves. Glucose elevation stimulates insulin secretion by the well-known triggering pathway but is also known to result in β cell swelling. These previous observations prompted us to investigate the role of mechanical forces for the physiological function of pancreatic β cells. Recently, Piezo1 was identified a mechanosensitive ion channel. Piezo1 activates and leads to an increasing inward membrane current partially carried by Ca2+. Whether this proportion of Ca2+ can trigger or accelerate glucose stimulated insulin secretion in human b-cell remains elusive. Here we investigated the role of PIEZO1 in β cells, especially its role in glucose-stimulated insulin secretion.
Materials and methods: RNA sequencing; Animal models (β-cell-specific Piezo1 knockout mice (RIP-Cre+Piezo1f/f)); In situ pancreas perfusion; IPGTT; Ca2+ imaging; Plasma Membrane Potential Measurement.
Results: We found PIEZO1 protein expressed in both α and β cells at comparable levels in both human and mouse islet cells. The glucose-induced increase of [Ca2+]i oscillations were reduced by 45% in RNA silencing (siPiezo1) INS-1 832/13 cells, but ineffective when glucose was replaced by the non-metabolizable sugar mannitol. Hypotonic swelling also elicited robust [Ca2+]i transients and membrane depolarization in normal INS-1 832/13 cells. By contrast, the elevation of [Ca2+]i and membrane depolarization were reduced markedly in the presence of the GsMTx4, (a Piezo1/ Piezo2 inhibitor), or in siPiezo1cells. Yoda1 (Piezo1 agonist) increased [Ca2+]i even under resting conditions (2.8 mM glucose) in INS-1 832/13 cells, rodent and human islets. In situ mouse pancreas perfusion showed that glucose stimulated insulin secretion almost 3-fold, while yoda1 increased it ~7-fold. By contrast, GsMTx4 reduced insulin release by >30%. β-cell-specific Piezo1 knockout mice exhibited impaired glucose tolerance and blood glucose post-IPGTT was significantly increased. Calcium imaging in β-cells from Piezo1 knockout mice revealed a more than 50% reduction in glucose-induced [Ca2+]i . In human β-cells inhibition of Piezo 1 by GsMTx4 reduced the amplitude of glucose-induced [Ca2+]i oscillations by ~80%. Yoda1 increased both [Ca2+]i and membrane depolarization under basal conditions in human β-cells. Percentage of secreted insulin was significantly suppressed by GsMTx4 at basal and stimulated conditions. RNA-seq analysis revealed that PIEZO1 gene expression was significantly increased in islets from donors with type-2 diabetes, suggesting a compensatory effect.
Conclusion: These results establish mechanotransduction as an important signaling modality in both rodent and human glucose-induced insulin secretion. Our data point to highlight the role of the mechanosensor Piezo1 channel as the molecular mediator of this effect.
Supported by: Swedish Research Council (2017-01090); Clinical research (ALF); Crafoord foundation. Grants;
Disclosure: M. Barghouth: None.
OP 03 Insulin sensitivity and biomarkers
13
Kinome profiling reveals impaired signalling in primary human skeletal muscle cells carrying a novel Finnish-specific AKT2 gene variant
N. Datta1,2, S. Mäkinen1,2, S. Rangarajan3, Y.H. Nyugen1,2, A. Latva-Rasku4, P. Nuutila4, M. Laakso5, H.A. Koistinen1,2;
1Minerva Foundation Institute For Medical Research, Helsinki, Finland, 2Department of Medicine, Helsinki University Central Hospital, University of Helsinki, Helsinki, Finland, 3PamGene International B.V., s-Hertogenbosch, Netherlands, 4Turku PET Centre, University of Turku, Turku, Finland, 5Institute of Clinical Medicine, University of Eastern Finland, Kuopio, Finland.
Background and aims: Abnormalities in kinase-mediated signalling are involved in the pathophysiology of metabolic disorders, including insulin resistance and type 2 diabetes (T2D). A novel partial loss-of function AKT2 coding variant (p. Pro50Thr) is highly specific for Finnish population and is associated with increased fasting insulin concentrations, reduced insulin-mediated glucose uptake in the whole body and in several insulin sensitive tissues, and predisposition to T2D. Here, we explore the hypothesis that kinase networks in skeletal muscle cells are dysregulated in the carriers of p.P50T/AKT2.
Materials and methods: Primary muscle cell cultures were established from vastus lateralis muscle biopsies of the carriers and non-carriers of the p.P50T/AKT2. Myoblasts were differentiated into myotubes. A comprehensive analysis of tyrosine (PTK) and serine-threonine (STK) kinase signalling was performed in insulin-stimulated myotubes from 9 carriers and 8 non-carriers using the PamChip® kinome profiling system. This technology is based on the detection of phosphorylation of peptides by PTK or STK kinases that are active in the muscle cell lysates.
Results: Kinase profile comparison (PTK and STK heatmaps) identified multiple differentially phosphorylated peptides between carriers and non-carriers of p.P50T/AKT2. Analysis of Volcano plots, as a result of T-tests, revealed more than thirty proteins, including several cell surface receptors, that were significantly less phosphorylated in the variant carriers (p < 0.05). Predictive kinase analysis using the Upstream Kinase PamApp tool further demonstrated a large-scale impairment of multiple tyrosine and serine-threonine kinase activities in carriers. As examples, signalling of the non-receptor Src-family kinases (SFK), calmodulin-modulated kinases (CaMK), and different isoforms of protein kinase C (PKCs) were downregulated in p.P50T/AKT2 carriers.
Conclusion: Kinome profiling revealed multiple differences in the intricate kinase networks in skeletal muscle cells from carriers of p.P50T/AKT2 variant. These core differences may contribute to development of insulin resistance in carriers of p.P50T/AKT2.
Supported by: Academy of Finland, Diabetes Wellness Sverige, Finnish Diabetes Research Foundation
Disclosure: N. Datta: None.
14
In vivo, up and down hepatic modulation of interactions between ER and mitochondria impacts hepatic insulin sensitivity and steatosis
A. Beaulant, J. Ji-Cao, N. Bendridi, M.-A. Berger, H. Vidal, J. Rieusset;
CarMeN laboratory INSERM U1060, Lyon, France.
Background and aims: Understanding the molecular mechanisms of insulin resistance (IR) is essential for proposing new preventive/therapeutic strategies against type 2 diabetes (T2D). Among newly identified mechanisms, the communication between endoplasmic reticulum (ER)-mitochondria, at contact sites called mitochondria-associated membranes (MAMs), recently emerged as a key regular of glucose homeostasis in multiple tissues. In the liver, our team identified MAMs as key regulators of insulin action and reported hepatic organelle miscommunication in different murine models of T2D. However, this topic is subjected to controversy, in part because strategies used to modulate organelle tethering target different endogenous MAM proteins with other cellular functions outside of MAMs. Therefore, it is now crucial to determine the causative role of MAMs in the development of hepatic IR, using non-endogenously expressed spacer and linker. The aim of the study is to clarify in vivo the causative role of ER-mitochondria interactions in the development of hepatic IR and steatosis through genetic up and down modulation of MAMs in the liver of mice.
Materials and methods: Using adenovirus, we modulated ER-mitochondria interactions in the liver of mice by overexpressing either a spacer called FATE1 (Fetal and Adult Testis Expressed 1, expressed only in the testis), or an artificial fluorescent linker (RFP fused to the outer mitochondrial membrane (OMM) and to ER membrane). Ad-GFP was used as a control of Ad-FATE1, whereas Ad-RFP targeted only to the OMM was used as a control of Ad-linker (107 pfu/mice). Adenovirus-mediated dampening of MAMs was performed in the liver of lean mice (2 weeks), whereas reinforcing of MAMs was performed before feeding mice with either a standard diet (SD) or a high-fat and high-sucrose diet (HFHSD) for 4 weeks. Repercussions on ER-mitochondria interactions (in situ proximity ligation assays and transmission electronic microscopy), hepatic insulin signalling and lipid accumulation (oil red o staining), and on whole-body glucose homeostasis (glucose and insulin tolerance tests) were measured in vivo, whereas ER-mitochondria calcium exchange (microscopy using the mitochondria-specific calcium probe, 4mtD3CPV) was measured on primary mouse hepatocytes.
Results: As expected, the overexpression of FATE1 in the liver of mice significantly disrupted hepatic ER-mitochondria interactions and calcium exchange, whereas the overexpression of the linker reinforced them. The FATE1-mediated disruption of MAMs induced glucose intolerance without modifying whole-body insulin sensitivity, pointing a specific hepatic IR. In agreement, hepatic insulin signalling is altered in the liver of Ad-FATE1 mice compared to Ad-GFP mice, and is associated with hepatic steatosis. Conversely, the linker-mediated reinforcement of MAMs prevented HFHSD-induced glucose intolerance and hepatic insulin resistance, whereas no effect was observed under SD. Effects on lipid accumulation are under analysis.
Conclusion: Altogether, our data demonstrate that the modulation of ER-mitochondria interactions in mice liver controls hepatic insulin sensitivity and lipid accumulation, supporting a causative role of disrupted MAMs in hepatic metabolic alterations. Targeting MAMs could be a new preventive/therapeutic approach to fight against T2D.
Disclosure: A. Beaulant: None.
15
GDF15 mediates the metabolic effects of PPARβ/δ by activating AMPK
D. Aguilar-Recarte1,2, J. Pizarro-Delgado1,2, L. Peña-Moreno1,2, X. Palomer1,2, S.-J. Lee3, M. Vázquez-Carrera1,2;
1Pharmacology, University of Barcelona, Barcelona, Spain, 2Spanish Biomedical Research Center in Diabetes and Associated Metabolic Diseases (CIBERDEM), Madrid, Spain, 3The Jackson Laboratory and University of Connecticut School of Medicine, Farmington, USA.
Background and aims: The antidiabetic effects of peroxisome proliferator-activated receptor (PPAR)β/δ agonists mostly rely on the activation of AMP-activated protein kinase (AMPK). Interestingly, many of the actions of PPARβ/δ are similar to those of growth differentiation factor (GDF)15, a stress-response cytokine that improves fatty acid oxidation, glucose tolerance and insulin sensitivity. The aim of this study was to examine whether the beneficial effects of PPARβ/δ agonists on lipid-induced endoplasmic reticulum (ER) stress, inflammation and insulin resistance were dependent on GDF15.
Materials and methods: A neutralizing antibody against GDF15 or IgG were injected 3 days before sacrifice to mice fed a control or a high-fat diet (HFD) and treated for 3 weeks with vehicle or a PPARβ/δ agonist. A similar study was conducted in WT and GDF15-KO fed with an HFD and treated with the PPARβ/δ agonist. A group of mice were also treated with vehicle or recombinant GDF15. Finally, C2C12 myotubes were treated with different compounds or small interfering (si)RNAs to examine the mechanisms by which PPARβ/δ agonists increase GDF15 levels.
Results: Injection of the neutralizing GDF15 antibody prevented the improvement in glucose tolerance caused by the administration of the PPARβ/δ agonist in mice fed an HFD without changes in food intake and body weight. The GDF15 neutralizing antibody also abolished most of the changes caused by the PPARβ/δ agonist treatment in the levels of genes and proteins involved in fatty acid metabolism, ER stress, inflammation and the insulin signalling pathway in skeletal muscle and liver. The experiment conducted in GDF15-KO mice showed a similar trend, where the PPARβ/δ agonist antidiabetic effects were abolished or attenuated compared to the WT mice, confirming the implication of GDF15 in PPARβ/δ actions. Studies conducted with inhibitors and siRNAS in cultured myotubes demonstrated the implication of AMPK and p53 in the increase of GDF15 levels caused by the treatment with PPARβ/δ agonists. Treatment with recombinant GDF15 caused an increase in the phosphorylation levels of AMPK protein in cultured myotubes and skeletal muscle of mice.
Conclusion: Overall, the findings of the present study demonstrate that the increase in GDF15 levels caused by PPARβ/δ activation through AMPK and p53 prolongs the increase in phospho-AMPK levels, contributing to the reduction of ER stress, inflammation and insulin resistance.
Supported by: SAF2015-64146-R, Ministerio de Ciencia, Innovación y Universidades de España
Disclosure: D. Aguilar-Recarte: Grants; FPI Spanish Government Grant.
16
Serum Fetuin-B is positively related to metabolic syndrome and insulin resistance
S. Xue1, L. Li1, G. Yang2;
1Key Laboratory of Diagnostic Medicine (Ministry of Education) and Department of Clinical Biochemistry, College of Laboratory Medicine, Chongqing Medical University, Chongqing, 2Department of Endocrinology, the Second Affiliated Hospital, Chongqing Medical University, Chongqing, China.
Background and aims: Fetuin-B, as a new hepatokine or adiponectin, has been reported to impair insulin action in myotubes and hepatocytes of mice with hepatic steatosis and regulate glucose and lipid metabolism in humans. Metabolic syndrome (MetS) represents a cluster of metabolically related symptoms that includes abdominal obesity, insulin resistance (IR), hypertension and dyslipidemia. The purpose of this study was to (1) compare serum Fetuin-B levels and the key components related to IR between patients with MetS and the control subjects, (2) set up multiple intervention experiments to further explore the relationship among serum Fetuin-B, MetS and IR.
Materials and methods: A total of 377 Chinese women (185 healthy controls and 192 MetS patients) were recruited in this cross-sectional study. Serum Fetuin-B levels were examined by ELISA kit. The anthropometric examination (weight, height, waist circumference, hip circumference, blood pressure, FAT%) and biochemical varies (fasting and 2h post-OGTT glucose, insulin, HbA1c, TG, TC, HDL, LDL, FFA) were detected and recorded by professional in all participants. The insulin sensitivity and glucose tolerance were evaluated by euglycemic-hyperinsulinemic clamp (EHC) and oral glucose tolerance test (OGTT), and the drug intervention experiment of Liraglutide was performed to explore the effect of serum Fetuin-B in MetS longitudinally.
Results: Serum Fetuin-B levels were significantly increased in MetS patients compared with the healthy women (p<0.001). Serum Fetuin-B were positively related to WHR, FAT%, TG, FBG, FIns, HOMA-IR, VAI, LAP (all p<0.001) and BMI, HbA1c%, 2h-BG, 2h-Ins (all p<0.01). We demonstrated that TG and WHR were independently connected with serum Fetuin-B levels. Further investigation found that serum Fetuin-B showed a linear trend and independently correlated with MetS. The levels of serum Fetuin-B increased with the number of components of MetS (p for trend < 0.05). In the ROC curve, the best threshold for serum Fetuin-B to distinguish MetS was 3.87 mg/L. Furthermore, serum Fetuin-B levels were markedly elevated after glucose loading in the healthy group (p <0.001) and significantly increased in MetS women during the EHC (p<0.05). After six months of Liraglutide intervention, serum Fetuin-B levels in women with MetS statistically decreased following improvement of IR.
Conclusion: Serum Fetuin-B levels are significantly associated with the key components of IR and MetS via regulating glucose and lipid metabolism. Serum Fetuin-B may be a potential biomarker for MetS to predict outcomes and therapeutic responses.

Clinical Trial Registration Number: ChiCTR-IIR-16007901
Supported by: NSFC(81873658)
Disclosure: S. Xue: None.
17
Carnitine supplementation improves insulin sensitivity and skeletal muscle acetylcarnitine formation in type 2 diabetes patients
Y.M.H. Bruls1, Y.J.M. op den Kamp2, P. Veeraiah1, E. Phielix2, B. Havekes3, J.E. Wildberger1, M.K.C. Hesselink2, P. Schrauwen2, V. Schrauwen1,2;
1Department of Radiology and Nuclear Medicine, Maastricht University Medical Center +, Maastricht, 2Department of Nutrition and Movement Sciences, Maastricht University Medical Center +, Maastricht, 3Department of Internal Medicine, Division of Endocrinology, Maastricht University Medical Center +, Maastricht, Netherlands.
Background and aims: Type 2 diabetes patients are characterized by decreased insulin sensitivity and concomitant disturbances in glucose homeostasis. Insulin sensitivity correlates positively with MR-based skeletal muscle acetylcarnitine concentration, indicating lower acetylcarnitine levels in insulin resistant individuals. Recent evidence suggests that low free carnitine availability may play a role in reduced acetylcarnitine formation. Therefore, we investigated if carnitine supplementation elevates skeletal muscle acetylcarnitine formation and thereby improves insulin sensitivity and glucose homeostasis in type 2 diabetes patients.
Materials and methods: 32 type 2 diabetes patients followed a 12 week L-carnitine treatment (2970 g/day). Plasma free carnitine concentrations were measured to check compliance. A 2-step hyperinsulinemic-euglycemic clamp (10 vs. 40 mU/m2/min) with D-[6,6-2H2]-glucose tracer infusion was performed to assess hepatic and peripheral insulin sensitivity. Skeletal muscle acetylcarnitine concentrations were measured in vivo in the vastus lateralis muscle using a combination of T1 editing and long echo time (TE=350ms) proton magnetic resonance spectroscopy (1H-MRS) in rest and post exercise (30 minutes at 70% Wmax) to stimulate near maximum as a parameter for free carnitine availability. Intrahepatic lipid content (IHL) was quantified using 1H-MRS. All measurements were performed before and repeated after carnitine supplementation.
Results: Plasma free carnitine levels increased upon carnitine supplementation (from 35.6±1.3 to 54.7±1.7 μmol/L, p=<0.01) indicating good compliance. Hepatic (endogenous glucose (EGP) suppression) as well as peripheral (Δ rate of disappearance, ΔRd) insulin sensitivity improved upon carnitine supplementation (EGP suppression: 31.9 ±2.9 vs. 39.9±3.2%, p=0.020 and ΔRd 10.53±1.85 vs. 13.83±2.02 μmol/kg/min, p=0.005). Resting and post-exercise skeletal muscle acetylcarnitine concentrations were both elevated after carnitine supplementation (1.18±0.13 vs 1.54±0.17 mmol/kgww, p=0.008 and 3.70±0.22 vs. 4.53±0.30 mmol/kgww, p<0.001, respectively). Finally, a trend towards reduced plasma glucose levels (from 8.1±0.3 to 7.7±0.3 mmol/L, p=0.083) and IHL (from 14.7±2.6 to 12.8±2.2 %, p=0.095) was found after carnitine supplementation.
Conclusion: The current study reveals very pronounced effects of carnitine supplementation on insulin sensitivity, intrahepatic lipid content and concomitant fasting plasma glucose levels in type 2 diabetes patients. We demonstrated that carnitine supplementation increases acetylcarnitine concentration in muscle in the resting state and the capacity to form acetylcarnitine with exercise, which may be underlying the beneficial effect on insulin sensitivity. We are currently investigating whether certain characteristics, such as baseline acetylcarnitine concentration, are predictive for the strength of the metabolic response to carnitine supplementation.
Clinical Trial Registration Number: NCT03230812
Supported by: Ministry of Economic Affairs by PPP Allowance of the Top Sector Life Sciences & Health
Disclosure: Y.M.H. Bruls: None.
18
Remission of type 2 diabetes with return of insulin secretory function restores normal pancreas morphology
R. Taylor1, K.G. Hollingsworth1, J.A.M. Shaw2, N. Sattar3, M.E.J. Lean4, A. Al-Mrabeh1;
1Translational and Clinical Research Institute, Magnetic Resonance Centre, Newcastle University, Newcastle upon Tyne, 2Translational and Clinical Research Institute, Regenerative Medicine, Newcastle University, Newcastle upon Tyne, 3Institute of Cardiovascular & Medical Sciences, Glasgow University, Glasgow, 4School of Medicine, Dentistry and Nursing, Glasgow University, Glasgow, UK.
Background and aims: Pancreas volume is subnormal and the shape of the organ is abnormal in type 2 diabetes. If these abnormalities resulted from rather than led to the disease state, return of β-cell function during remission of T2DM would be expected to correct the abnormalities.
Materials and methods: Participants (n=64) in the Diabetes Remission Clinical Trial were studied over 2 years and compared with matched non-diabetic controls. Those who achieved HbA1c <6.5% (48 mmol/mol) and fasting blood glucose <7.0 mmol/l off all anti-diabetes medication, were classified as ‘Responders’. Magnetic resonance techniques were employed to obtain anatomical and fat fraction images of the pancreas. Pancreas volume, intrapancreatic fat content, and the irregularity of the pancreas borders were quantified using custom MR techniques. Insulin secretion was measured using the Stepped Insulin Secretion Test with Arginine (SISTA).
Results: At baseline, pancreas volume was 63.8±1.8 vs. 79.8±2.9cm3 in non-diabetic controls, p<0.0001). Pancreas volume was unchanged from baseline at 5 months post weight loss irrespective of remission (responders: 63.0±2.8 to 64.0±2.8 cm3, p=0.10; non-responders: 59.0±3.5 to 60.0±3.7cm3, p=0.32). At 24 months, volume had increased by 12.6±1.5cm3 in responders compared with 4.5±1.3cm3 in non-responders (p<0.0001). The pancreas borders were more irregular in diabetes compared with non-diabetic controls at baseline (Fractal Dimension 1.116±0.013 vs1.097±0.005, p<0.0001), but normalised in responders at 24 months (1.097±0.008 vs. 1.097±0.005, p=0.92). At 5 months after weight loss, 1st phase insulin secretion increased only in responders (to 0.11 [0.060 to 0.157] nmol/ml/min, p<0.0001 vs. baseline), maintained at 24 months (0.12 [0.060 to 0.175] nmol/ml/min, p<0.0001 vs. baseline). Responders lost 1.56±0.3% of intrapancreatic fat compared to 0.51±0.4% for non-responders (p<0.05). Plasma GDF-15 decreased in responders only, but IGF-1 increased and FGF-21 levels decreased after weight loss irrespective of remission.
Conclusion: These data demonstrate for the first time the reversible nature of the abnormal pancreas morphology during remission of type 2 diabetes, and identify potential regulatory factors. The low pancreas volume and irregularity in shape are likely to be a consequence rather than a cause of the disease state, potentially related to deficiency of post-prandial insulin secretion. Fat removal from the pancreas is closely associated with restoration of β-cell function, which may lead to secondary restoration of exocrine tissue mass via trophic and anabolic effects of insulin.
Supported by: Diabetes UK
Disclosure: R. Taylor: Employment/Consultancy; Wilmington Healthcare. Grants; Diabetes UK. Lecture/other fees; Lilly and Novartis.
OP 04 Central actions in diabetes
19
Genetic deficiency of CRP confers resistance to obesity and enhances insulin and leptin sensitivity
S. Qiu1,2, L. Li1, G. Yang2;
1Department of Clinical Biochemistry, College of Laboratory Medicine,Chongqing Medical University, Chongqing, 2Department of Endocrinology, the Second Affiliated Hospital, Chongqing Medical University, Chongqing, China.
Background and aims: As a member of the pentaxin protein family, C-reactive protein (CRP) is mainly synthesized and secreted by the liver and released into circulation in response to inflammation. In addition to serving as a traditional inflammatory factor, CRP is closely associated with the development of obesity, diabetes, and cardiovascular diseases serving as a metabolic and inflammatory marker. We hypothesize that CRP protein was directly involved in the regulation of energy and glucose metabolism, rather than just a surrogate marker, and that genetic deficiency of CRP will lead to resistance to obesity and insulin resistance.
Materials and methods: Rat CRP gene deletion model was use to investigate the effect of CRP on energy and glucose metabolism. The CRP null mutant rat were placed on either a normal diet or a high-fat diet. The phenotypic changes in body weight, glucose metabolism, insulin sensitivity, energy expenditure, and inflammation conditions were examined. The central impact of CRP deficiency on leptin and insulin hypothalamic signaling as well as glucose homeostasis were examined via intracerebral ventricular delivery of leptin and CRP plus glucose clamp studies in the wild type or CRP deficient rats.
Results: Here, we revealed that CRP deficiency rendered rat resistance to obesity and high blood pressure development, elevated energy expenditure, and enhanced locomotor activity. Glucose clamp studies revealed that deletion of CRP enhanced hepatic insulin signaling and actions. Systematic CRP deficiency also promoted the effect of central leptin on hepatic and skeletal muscle glucose metabolism, and enhanced central leptin-stimulated STAT3/Akt signaling, particularly under HFD-induced obesity and IR conditions. In contrast, reinstatement of CRP into the hypothalamus of the knockout rats attenuated the effects of central leptin signaling on insulin sensitivity and peripheral glucose metabolism. CRP deficiency increased the hypothalamic expression of POMC following ICV leptin treatment and allowed prolonged and sustained anorexic and weight-reducing effects. Moreover, CRP regulateed body weight, energy expenditure, glucose metabolism, and blood pressure for at least 12 months.
Conclusion: This study represents the first line of genetic evidence that CRP is not merely a surrogate blood marker for inflammation and metabolic syndromes but directly regulates energy balance, body weight, insulin sensitivity, and glucose homeostasis through direct regulation of leptin’s central effect and hypothalamic signaling.
Supported by: NAFC(No.81630021)
Disclosure: S. Qiu: None.
20
Protein tyrosine phosphatase 1B deficiency enhances leptin action to improve glucose homeostasis in IDDM treatment with leptin
Y. Ito1, R. Banno2, R. Sun3, H. Yaginuma3, K. Taki3, M. Sugiyama3, T. Tsunekawa3, H. Takagi3, H. Arima3;
1CKD Initiatives International Medicine, Nagoya University Graduate School of Medicine, Nagoya, 2Research Center of Health, Physical Fitness and Sports, Nagoya University, Nagoya, 3Endocrinology and Diabetes, Nagoya University Graduate School of Medicine, Nagoya, Japan.
Background and aims: There are several lines of evidence that either intraarterially or intracerebroventricularly administration of leptin could normalize glucose metabolism in the rodent of insulin-dependent diabetes mellitus (IDDM) models. As the mechanisms, leptin has been reported to act on the hypothalamic neurons to suppress gluconeogenesis in the liver and enhance glucose uptake in brown adipose tissue and skeletal muscle, resulting in lowering blood glucose levels. On the other hand, peripheral administration of leptin is known to has only a limited effect on improving hyperglycemia. Protein tyrosine phosphatase 1B (PTP1B) is key enzyme that negatively regulates leptin receptor signaling. We have previously reported that in PTP1B deficient mice, peripheral administration of leptin enhances leptin receptor signaling in the hypothalamus compared to control mice. To investigate the role of PTP1B in leptin action for treating IDDM by using PTP1B deficient mice (KO) and PTP1B inhibitors.
Materials and methods: To generate IDDM mice, we injected wild-type (WT) mice and PTP1B deficient (KO) mice once intraperitoneally with streptozotocin (STZ) or vehicle. We evaluated glucose metabolism in IDDM WT and IDDM KO mice. Next, we evaluated glucose metabolism in mice received two kinds of treatment. One is the peripheral administration of a high dose of leptin or vehicle, and the other is the central administration of a low dose of leptin or vehicle. Finally, we evaluated whether if peripheral combination therapy of a high dose of leptin and PTP1B inhibitor in IDDM WT mice improved glucose metabolism or not. In addition, the mechanisms in which leptin treatment improved glucose metabolism under PTP1B deficiency were also examined.
Results: We found that (1) while blood glucose levels of IDDM group were higher than those of non-IDDM group, glucose metabolism in IDDM PTP1B deficient (KO) mice was significantly improved compared to IDDM wild-type (WT) mice, (2) peripheral administration of a high dose of leptin significantly improved glucose metabolism in IDDM KO mice compared to IDDM WT, (3) central administration of a low dose of leptin significantly improved glucose metabolism in KO mice compared to WT mice, and (4) peripheral combination therapy of leptin and PTP1B inhibitor in IDDM WT mice improved glucose metabolism to the same levels as control mice. We also found that the phosphorylation of stat3 in the arcuate nucleus of hypothalamus following peripheral leptin administration was enhanced under PTP1B deficiency, and those improvements of glucose metabolism are at least partly due to the action via β-adrenergic receptors signaling.
Conclusion: In IDDM treatment with leptin, PTP1B deficiency and PTP1B inhibitor enhanced leptin action in the brain to improve glucose metabolism.
Supported by: The Japanese Society for Promotion of Science (2618K16225) and the Japan IDDM Network
Disclosure: Y. Ito: Grants; Sanwa Kagaku Kenkyusho, Kowa Pharmaceutical, MSD K.K., Dainippon Sumitomo, Kyowa Kirin Co. Ltd., Chugai Pharmaceutical Co. Ltd., Boehringer Ingelheim, Nihon Medi-Physics Co. Ltd. Lecture/other fees; Astellas Pharma, Daiichi Sankyo, Ono Pharmaceutical Company.
21
Investigating the involvement of hypothalamic de novo ceramide synthesis in resistin/TLR4 induced neuronal inflammation and insulin resistance
J. Guitton, S. Al Rifai, C. Alexandre, M. Taouis, Y. Benomar, H. Le Stunff;
Institut des Neurosciences Paris Saclay (Neuro-PSI), UMR9197 CNRS, Orsay Cedex, France.
Background and aims: In the context of obesity, the excess supply of fatty acids (FA) and ectopic lipid accumulation in non-adipose tissues causes functional impairments in several metabolic pathways leading to a phenomenon, known as “lipotoxicity” that promotes peripheral inflammation and insulin resistance (IR). Recently, the hypothalamus, a brain area involved in energy homeostasis, has also been reported as a target of lipotoxicity. Interestingly, it has been shown that accumulation of reactive lipid species, such as ceramide, in the hypothalamus induces central IR and impaired glucose homeostasis. Beside, in an over-nutrition environment, the hypothalamus is also subjected to changes in circulating factors originated from adipose tissue and immune cells. Among these factors, resistin is described as a key mediator linking obesity to IR. Recently, we have reported that central resistin, through hypothalamic TLR4, induces whole body IR and promotes neuronal inflammation. Interestingly, growing evidence supports an important role for TLR4 in FA-induced ceramide biosynthesis and peripheral inflammation and IR. In this context, the present study aims to investigate the potential involvement of hypothalamic de novo ceramides synthesis in resistin-induced neuronal inflammation and insulin resistance.
Materials and methods: Using mouse hypothalamic (mHypoA) and human (SH-SY5Y) neuronal cells, we analyzed the impact of resistin overexposure on insulin signaling, and on the expression levels of proinflammatory mediators and key enzymes driving ceramide biosynthesis. This was assessed by western blotting and RTqPCR analyses. Intracellular ceramide contents were also quantified by lipidomic analysis. Two pharmacological inhibitors, myriocin and TAK-242, were used to evaluate the involvement of ceramide de novo synthesis pathways and TLR4 signaling pathways in resistin-induced neuronal inflammation and IR. Additionally, C57BL6J and TLR4-deficient mice were treated with or without resistin through ICV route to evaluate the impact of central resistin infusion on hypothalamic inflammation and reactive gliosis as well as on the hypothalamic expression of enzymes involved in ceramide biosynthesis.
Results: In neuronal cells, we show that resistin overexposure induces neuronal inflammation and IR as evidenced by increased expression of IL6 (89.93% p<0.05), and inhibition of insulin-dependent phosphorylation of Akt (40.6% p<0.02). In addition, resistin treatment increases ceramide contents and the expression levels of a key enzymes driving ceramide biosynthesis (SPT1/2, CerS4 and DES1). Interestingly, pharmacological inhibition of TLR4 signaling (using TAK-242) and ceramide de novo synthesis (using myriocin), prevents resistin-dependent neuronal inflammation and IR. Next, we validated the effects of resistin in mice, and showed that central resistin infusion for 3 days markedly increases hypothalamic inflammation and reactive gliosis, as well as the expression of enzymes driving ceramide de novo synthesis in a TLR4-dependent manner.
Conclusion: Taken together, these findings reveal resistin/TLR4/ceramide as a new regulatory pathway of neuronal inflammation and IR. Targeting this signaling pathway may constitute a significant breakthrough to overcome obesity-induced hypothalamic inflammation, IR and related metabolic dysfunctions.
Disclosure: J. Guitton: None.
22
Central nesfatin-1 attenuates hepatic steatosis by suppression of hypothalamic endoplasmic reticulum stress
M. Mokou1, L. Li1, G. Yang2;
1Key Laboratory of Diagnostic Medicine (Ministry of Education), College of Laboratory Medicine, Chongqing Medical University, Chongqing, 2Department of Endocrinology, the Second Affiliated Hospital, Chongqing Medical University, Chongqing, China.
Background and aims: It has been reported that central nesfatin-1 signaling regulates glucose metabolism and improves insulin resistance (IR) in the liver. However, its mechanism is poorly understood. Furthermore, it remains unresolved whether central nesfatin-1 can regulate liver lipid metabolism and its possible mechanism. The purpose of the present study is to investigate the effect of hypothalamic nesfatin-1 signaling on hepatosteatosis.
Materials and methods: Nesfatin-1 was infused into the intracerebroventricular (ICV) of NUCB2-/- rats for 14 days to explore the impact of central nesfatin-1 on energy expenditure and hepatic lipid metabolism. NUCB2-/- rats were infused tunicamycin and/or nesfatin-1 to assess the effects of pharmacological and genetic-induced ER stress in the hypothalamus on the activation of central nesfatin-1. The influence of up-regulation of TPTb1 on the central nesfatin-1 on hepatic lipid metabolism was evaluated. MK2206, a specific Akt inhibitor, was infused into NUCB2-/- rats to investigate whether Akt signaling is required for central nesfatin-1-regulated lipid metabolism. For investigating the effects of the vagus nerve and sympathetic nervous system on the central nesfatin-1 regulation of hepatic lipid metabolism, NUCB2-/- Rats were subjected to hepatic branch vagotomy (HVG) or sham surgery, or injected with saline or guanethidine.
Results: We found that nesfatin-1-infused NUCB2-/- rats had reduced food intake and increased energy expenditure compared to aCSF-infused NUCB2-/-rats. Chronic central treatment of nesfatin-1 inhibited the expression of genes related to fatty acid synthesis and ER stress and increased the phosphorylation level of Akt in the hypothalamus. Under a high fat diet, the co-infusion of ICV nesfatin-1 and Tunicamycin in NUCB2-/- rats increased hepatic TG content and the expression of genes regulating lipid metabolism, compared with ICV nesfatin-1 infusion alone. The overexpression of TPTb1 in the hypothalamus aggravates IR and counteracts the effect of central nesfatin-1, but does not lead to ES stress. Nesfatin-1-infused NUCB2-/- rats that underwent HVG attenuated the inhibition of central nesfatin-1 on liver lipid deposition, but there was no effect of guanethidine treatment. These data indicated that the vagus nerve mediated the role of ICV nesfatin-1 in hepatic lipid metabolism.
Conclusion: Our study reveals that central nesfatin-1 regulates hepatic lipid metabolism through a novel network including hypothalamic ER stress, PTP1B/Akt pathway, parasympathetic nervous system.
Supported by: NSFC(81670755)
Disclosure: M. Mokou: None.
23
Empagliflozin improves insulin sensitivity of the hypothalamus in humans with prediabetes
S. Kullmann1,2, R. Wagner3,2, J. Hummel1,2, C. Dannecker1,2, A. Vosseler3,2, L. Fritsche1,2, K. Kantartzis3,2, J. Machann3,2, H.-U. Haering2, A. Fritsche3,2, H. Preissl1,2, M. Heni3,2;
1Institute for Diabetes Research and Metabolic Diseases of the Helmholtz Centre Munich at the University of Tuebingen, Tuebingen, 2German Center for Diabetes Research, Neuherberg, 3University of Tuebingen, Tuebingen, Germany.
Background and aims: Insulin action in the human brain reduces food intake, improves whole-body insulin sensitivity, and modulates adiposity. In most cases of obesity and diabetes, the brain becomes insulin resistant with impaired brain-derived modulation of peripheral metabolism. As treatment with the SGLT2-inhibitor empagliflozin not only improves glucose metabolism but also reduces body weight and cardiovascular risk, we hypothesized that improved brain insulin sensitivity could be involved.
Materials and methods: In this double blind study, 40 participants with prediabetes (according to ADA’s OGTT criteria) were 1:1 randomized to receive 25 mg empagliflozin qd or placebo (mean ± SD: age: 60 ± 9 years; BMI: 31.5 ± 3.8 kg/m²). Before and after 8 weeks of treatment, brain insulin sensitivity was assessed by functional MRI combined with the intranasal administration of insulin to the brain.
Results: In healthy persons, intranasal insulin administration significantly decreases cerebral blood flow in the hypothalamus. In the current study, volunteers with prediabetes were unresponsive to this, as insulin could not induce hypothalamic inhibition prior treatment. We identified a significant interaction between treatment and the hypothalamic response to insulin (p<0.05, corrected for multiple comparisons). Post hoc analyses showed that only participants on empagliflozin showed a significant insulin-induced decrease in hypothalamic blood flow after treatment. The group receiving placebo showed no such improvement.
Conclusion: Our current results corroborate insulin resistance of the human hypothalamus in humans with prediabetes. Treatment with empagliflozin for 8 weeks was able to restore hypothalamic insulin sensitivity; a favorable response that could contribute to the positive effects of SGLT2 inhibitors. These findings reveal that brain insulin resistance is treatable by pharmacological interventions with potential benefits for cognition, adiposity, and whole-body metabolism.
Clinical Trial Registration Number: NCT03227484
Supported by: BMBF to DZD
Disclosure: S. Kullmann: Lecture/other fees; Novo Nordisk. Other; The Study was supported by Boehringer Ingelheim through and independent Research Grant.
24
Brain insulin sensitivity is modulated by menstrual cycle
J. Hummel1,2, C. Benkendorff1,3, A. Vosseler1,3, L. Fritsche1,2, S. Kullmann1,2, A.L. Birkenfeld1,3, H. Preissl1,2, H.-U. Häring1,3, A. Fritsche1,3, A. Peter1,4, R. Wagner1,3, M. Heni1,3;
1Institute for Diabetes Research and Metabolic Diseases (IDM), Helmholtz Center Munich at the University of Tübingen, Tübingen, 2German Center for Diabetes Research (DZD e.V.), Neuherberg, 3Department of Internal Medicine, Division of Endocrinology, Diabetology and Nephrology, University Hospital, Eberhard-Karls-University Tübingen, Tübingen, 4Institute for Clinical Chemistry and Pathobiochemistry,Department for Diagnostic Laboratory Medicine, University Hospital, Eberhard-Karls-University Tübingen, Tübingen, Germany.
Background and aims: Insulin action in the human brain modulates whole-body metabolism by increasing peripheral insulin sensitivity and suppressing endogenous glucose production. In brain insulin resistance, this modulatory function of the brain is impaired. Experimental evidence from rodents and first observations in humans suggest major differences in brain insulin action between women and men. We therefore investigated effects of brain insulin delivery on peripheral metabolism in the follicular and luteal phase of the menstrual cycle.
Materials and methods: Eleven natural cycling women (age: 19-29 years, BMI: 17.8 - 23.8 kg/m²) underwent four hyperinsulinemic-euglycemic clamps. On two days during both the follicular and the luteal cycle phase, participants received intranasal insulin spray and placebo 90 min after initiation of the 210 min clamp in randomized, blinded order. Insulin spillover into the blood was mimicked by an appropriate iv insulin bolus on placebo days.
Results: The phase of the menstrual cycle interacted with the type of spray on the subsequent change of glucose infusion rates (GIR) (p=0.01). During the follicular phase, more glucose had to be infused after insulin delivery to the brain as nasal spray compared to placebo administration (p<0.0001; β=0.40±0.06). This difference remained significant after adjustment for plasma glucose and insulin concentrations (p<0.0001). During the luteal phase, GIR were only transiently higher after nasal insulin (p=0.005; β=0.16±0.06), but this depended on the circulating glucose and insulin levels as the difference was no longer present after respective adjustments (p=0.1).
Conclusion: In the follicular phase of the menstrual cycle, insulin delivery to the brain improves peripheral insulin sensitivity in lean women, comparable to what has previously been described in lean men. However, this response was not detected in the luteal phase, suggesting brain insulin resistance. Brain insulin resistance could therefore contribute to the long known peripheral insulin resistance in the luteal phase of the menstrual cycle.
Clinical Trial Registration Number: NCT03929419
Supported by: BMBF to DZD
Disclosure: J. Hummel: None.
OP 05 Glucose-lowering therapies and the liver
25
Role of bile acids on glucose-lowering by metformin in type 2 diabetes
D.J. Sansome, S. Veedfald, C. Xie, M. Bound, J. Grivell, K.L. Jones, M. Horowitz, C.K. Rayner, T. Wu;
Adelaide Health and Medical Sciences (AHMS) building, The University of Adelaide, Adelaide, Australia.
Background and aims: Emerging evidence indicates a key role of the gastrointestinal tract in the glucose-lowering action of metformin. We recently reported that glucose-lowering by metformin is associated with greater plasma concentrations of glucagon-like peptide-1 (GLP-1), and stimulation of GLP-1 secretion appears integral to glucose-lowering by small intestinal administration of bile acids. Given that metformin inhibits intestinal bile acid reabsorption, we examined whether the glucose-lowering effect of metformin was attenuated when endogenous bile acids were excluded (by balloon occlusion and aspiration), or potentiated by intrajejunal infusion of taurocholic acid (TCA), in type 2 diabetes (T2DM).
Materials and methods: Thirteen diet-controlled participants with T2DM (12 male; 59.9 ± 3.0 years; BMI 30.4 ± 1.1 kg/m2; HbA1c 6.2 ± 0.2%; duration of known diabetes 3.6 ± 0.8 years) were each studied on four occasions in a randomised order, following an overnight fast. On each day, a multilumen catheter was inserted transnasally and positioned so that an occlusive balloon and aspiration channel were located in the distal duodenum, and an infusion channel in the proximal jejunum. Subsequently, the balloon was inflated (for exclusion and aspiration of endogenous bile) on two days, or left deflated. At t=-60 min, metformin (1 g in 50mL water) or placebo (0.9% saline) was infused into the jejunum over 5 min. Then TCA (4 g TCA in 240 mL 0.9% saline), or 0.9% saline (240mL) alone, was infused into the jejunum (120mL between t=-30-0 min, then 120 mL between t=0-120 min), with concurrent intrajejunal glucose infusion (2kcal/min) between t=0-120 min. “Arterialised” venous blood was sampled every 30 min between t=-60-180 min for measurement of plasma glucose. Data are means ± SEM. One-factor ANOVA with Bonferroni’s correction for post hoc comparisons was used for statistical analysis.
Results: Fasting plasma glucose did not differ between study days. Following intrajejunal glucose infusion, there was an overall treatment effect on the incremental area under the plasma glucose curve (iAUC) between 0-180 min (P < 0.0001). When endogenous bile was excluded, metformin reduced the plasma glucose iAUC compared to placebo (506 ± 39 vs 343 ± 51 mol/L.min; P = 0.014). When endogenous bile was included, supplementation with TCA had no effect on the plasma glucose response to metformin (iAUC 568 ± 38 vs 516 ± 46 mmol/L.min; P = 0.076). During metformin treatment, plasma glucose was lower when endogenous bile was excluded than when included (iAUC 343 ± 51 vs 516 ± 46 mmol/L.min; P=0.007).
Conclusion: Contrary to the hypothesis, endogenous bile was not required for glucose-lowering by metformin, nor did supplementation with exogenous bile acids augment the effect of metformin on plasma glucose, during small intestinal glucose infusion in T2DM.

Clinical Trial Registration Number: ACTRN12619000299101
Supported by: Diabetes Australia and THRF Mid-Career Fellowship
Disclosure: D.J. Sansome: None.
26
Metformin acutely elevates lactate in the portal vein of humans
N. Rittig1, E. Sundelin2, H. Grønbæk3, N.K. Aagaard3, T. Sandahl3, G. Villadsen3, K. Brøsen4, N. Jessen1;
1Steno Diabetes Center Aarhus, Aarhus University Hospital, Aarhus N, 2Department of Diabetes and Hormone Diseases, Aarhus University Hospital, Aarhus N, 3Department of Gastro- and Hepatology, Aarhus University Hospital, Aarhus N, 4Department of Clinical Biochemistry and Pharmacology, Odense University Hospital, Odense, Denmark.
Background and aims: Metformin is widely used worldwide, but its underlying mechanisms of action remain debated. Studies in rodents indicate that Metformin increases intestinal lactate concentrations. We aimed to investigate whether this also translates into humans.
Materials and methods: We included eight cirrhotic participants with a portosystemic shunt system that allowed us to place intravenous catheters in the portal vein. Venous blood from the portal vein and peripheral arterialized blood was obtained simultaneously before and consecutively 90 minutes following oral consumption of 1000 mg Metformin.
Results: Lactate concentrations increased with 23% {CI95%: 6 to 40%} in the portal vein and 2% {CI95%: -15 to 19%} in arterialized blood 90 minutes following Metformin treatment (see figure, two-way repeated measure ANOVA, sampling site x time interaction, p= 0.001). Serum and plasma concentrations of glucose, insulin, and C-peptide all decreased during the 90 minutes (main effect of time, p<0.05) with no difference between sampling sites.
Conclusion: Metformin increases lactate concentrations in the gut of humans. These results emphasize and support the notion that Metformin exert important effects in the intestinal tract that warrants further investigations.

Clinical Trial Registration Number: EudraCT ID 2017-001132-19
Supported by: We thank the Aase and Ejnar Danielsen Foundation for their support (10-002192)
Disclosure: N. Rittig: None.
27
Metformin increases GDF15 independent of plasma metformin exposure and its proposed action in the liver
K.J. Kolnes1, P.M. Møller1, R. Kruse1,2, M.M.H. Christensen3, A. Handberg4,5, K. Højlund1,2;
1Steno Diabetes Center Odense, Odense University Hospital, Odense, 2Department of Clinical Research, University of Southern Denmark, Odense, 3Department of Clinical Biochemistry and Pharmacology, Odense University Hospital, Odense, 4Department of Clinical Biochemistry, Aalborg University Hospital, Aalborg, 5Department of Clinical Medicine, Aalborg University, Aalborg, Denmark.
Background and aims: The antidiabetic drug metformin increases plasma GDF15, and this may explain its ability to lower body weight in humans. The glucose-lowering effect of metformin has been suggested to involve inhibition of the mitochondrial respiratory complex I in liver cells. Although mitochondrial dysfunction induces both GDF15 and FGF21 by activation of the integrated stress response (IRS), the tissue responsible for the metformin-induced increase in plasma GDF15 and whether this includes increased secretion of FGF21 remain to be investigated. Here, we examined the effect of metformin on circulating GDF15 and FGF21 levels in the glycogen-depleted state of a prolonged fasting in vivo, and on the expression of GDF15 and FGF21 in human hepatocytes in vitro.
Materials and methods: In a randomized, crossover trial, 34 healthy individuals completed a 42-h fast twice, either with or without prior treatment with 1 g metformin twice daily for a week. Glucose metabolism was assessed for 6-hours using [3-3H]-glucose and indirect calorimetry, and blood samples were analyzed for serum GDF15 and FGF21 at the end of the tracer study, and for plasma metformin for additional 6 hours. Moreover, we tested the in vitro effects of metformin (2 mM) for up to 24-h on the expression of GDF15 and FGF21 in human hepatocytes (HepG2).
Results: Metformin increased glucose disposal (P < 8 x 10-13) due to increased glycolytic flux (P < 2 x 10-11). This was accompanied by increased hepatic glucose production (P < 3 x 10-13) caused by increased counter regulatory hormones (P < 0.05). Under these conditions, metformin increased serum GDF15 (607 ± 89 vs 1004±61 ng/mL; P<0.001), whereas serum FGF21 (146 ± 30 vs 156 ± 29 ng/mL; P=0.65) was unaltered. The change in serum GDF15 was not related to the maximal or area under the curve (AUC) concentrations of plasma metformin or changes in measures of glucose metabolism (see above). In contrast to the absent effect of metformin treatment on serum FGF21 in vivo, metformin treatment in vitro markedly increased mRNA levels of both GDF15 (4-fold; P<0.001) and FGF21 (12-fold; P<0.001) in human hepatocytes.
Conclusion: We demonstrate that the metformin-induced increase in serum GDF15 is dissociated from plasma metformin exposure and its proposed inhibitory action on hepatic glucose production. Moreover, the lack of a metfomin-induced increase in serum FGF21 in vivo despite metformin’s ability to increase expression of both GDF15 and FGF21 in human liver cells in vitro, support recent work indicating that the liver may not be the primary site of metformin action on GDF15 release.
Clinical Trial Registration Number: NCT01400191
Supported by: Novo Nordisk Foundation
Disclosure: K.J. Kolnes: None.
28
Acute effects of dapagliflozin on hepatic lipid- and glucose metabolism in humans
P. Wolf1, P. Fellinger1, H. Beiglböck1, L. Pfleger1, P. Krumpolec1, C. Barbieri2, A. Gastaldelli2, R. Marculescu1, S. Trattnig1, A. Kautzky-Willer1, M. Krssak1, M. Krebs1;
1Medical University of Vienna, Vienna, Austria, 2Cardiometabolic Risk Unit, Institute of Clinical Physiology, Pisa, Italy.
Background and aims: Recent studies indicate that administration of SGLT-2 inhibitors paradoxically increases endogenous glucose production (EGP), potentially counteracting the glucose lowering potency of these drugs. So far acute effects of SGLT-2 inhibition on hepatic glycogen, lipid and energy metabolism are unknown. Therefore we aim to investigate the impact of a single dose of dapagliflozin (D) or placebo (P) on hepatic glycogenolysis, lipid content (HCL) and mitochondrial activity (kATP).
Materials and methods: 10 healthy volunteers (CON:age30±3years;BMI24±1kg/m2; HbA1c5.2±0.1%) and 6 patients with type 2 diabetes mellitus (T2DM:age63±4years; BMI28±1.5kg/m2,HbA1c 6.1±0.5%) were investigated on two study days (CON-PvsCON-D/ T2DM-PvsT2DM-D) in a double blinded randomized controlled setting. 1H/13C/31P magnetic resonance spectroscopy was performed before (-120-30min), 90-180min and 300-390 min after administration of 10mg dapagliflozin or placebo. EGP was assessed by tracer dilution techniques.
Results: EGP was 25% higher following administration of dapagliflozin (p<0.001) and strongly correlated with glucosuria (P=0.867; p<0.01).Hepatic glycogen concentrations were comparable at baseline in CON (CON-P:227±20 mM vs CON-D:212±18 mM; p=n.s.) and T2DM (T2DM-P:200±10mM vs T2DM-D:196±9 mM; p=n.s). The observed decrease in glycogen was about five times higher in CON-P vs T2DM-P (-30±0.06% vs -6±0.02%;p<0.001) and non-significantly higher in CON-D vs T2DM-D (-20±0.06% vs -10±0.02%;p=0.591). Dapagliflozin had no impact on glycogenolysis in both groups. HCL and kATP were significantly higher in T2DM at baseline. HCL increased by 20% non-significantly in CON-D and T2DM-D. No significantly different changes in kATP between were observed during the study days.
Conclusion: The rise in EGP following SGLT-2 inhibition is mainly due to increased gluconeogenesis, but not due to accelerated glycogen breakdown. HCL and kATP are not affected by a single dose of dapagliflozin.
Clinical Trial Registration Number: NCT02558270
Supported by: Unrestricted research grant by AstraZeneca
Disclosure: P. Wolf: None.
29
Pleiotropic effects of sodium-glucose cotransporter 2 inhibitor versus sulfonylurea in patients with type 2 diabetes and non-alcoholic fatty liver disease
Y. Takeshita, Y. Kita, T. Takamura;
Department of Endocrinology and Metabolism, Kanazawa University Graduate School of Medical Sciences, Kanazawa, Japan.
Background and aims: We previously investigated the histological course of serial liver biopsy samples of patients with NAFLD in a real-world clinical setting. The clinicopathological analyses revealed that a reduction in HbA1c and the use of insulin independently contribute to the reduction in liver fibrosis scores during the course of nonalcoholic fatty liver disease (NAFLD) development (Diabetes Care 2010). These findings led us to hypothesize that glycemic control and insulin therapy ameliorate or protect against the histological progression of liver fibrosis in patients with NAFLD. To test this hypothesis, we aim to compare the effects of sodium-glucose cotransporter 2 (SGLT2) inhibitors and sulfonylureas, which lower glucose levels with decreases and increases in circulating levels of insulin, respectively, in patients with type 2 diabetes.
Materials and methods: This study is a 48-week, one-center, open-label, randomized, parallel trial. Patients who satisfied the eligibility criteria were randomly assigned (1:1) to receive once-daily 20 mg tofogliflozin or 0.5 mg glimepiride. The sample size was calculated to be 14 in each group with a significance level of 0.05 and a power of 0.90. The design required 40 evaluable patients in this study. The primary endpoint of this study will be the improvement in liver histology between liver biopsies at baseline and after 48 weeks of treatment. I will announce the interim analysis (N=20) in this meeting. The study is being conducted with the approval of the Certified Review Board, in accordance with the guidelines of the Declaration of Helsinki.
Results: Recruitment into this study started in November 2015 and will end in September 2020, with 40 patients randomized into the two groups. The 20 study patients (mean age 55.3 ± 14.0 years, mean HbA1c 8.2 ± 0.7%, mean body weight 80.0 ± 18.0 kg, mean AST 52.8 ± 43.4 IU/L, mean ALT 74.3 ± 70.4 IU/L) included and randomized. After 48 weeks, the changes in steatosis score (from 2.0 ± 0.7 to 1.2 ± 0.4, P=0.008), grade score (from 1.7 ± 0.9 to 0.9 ± 0.8, P=0.004) and stage score (from 1.6 ± 1.1 to 1.1 ± 1.3, P=0.035) were significantly improved in the tofogliflozin group compared with the glimepiride group. HbA1c was significantly decreased in both groups (tofogliflozin: from 8.0 ± 0.5 to 6.9 ± 1.2 %, P=0.029;glimepiride from 8.4 ± 0.9 to 7.5 ± 0.6%, P=0.020). Bodyweight and liver enzymes were significantly decreased in the tofogliflozin group (BW from 78.7 ± 17.7 to 73.3 ± 18.3 kg, P=0.001, AST from 55.4 ± 41.8 to 27.2 ± 22.4 IU/L, P=0.006, ALT from 72.2 ± 60.5 to 33.1 ± 31.5 IU/L, P=0.013), but not in the glimepiride group (BW from 81.3 ± 19.2 to 81.9 ± 21.1 kg, AST from 49.7 ± 46.8 to 52.3 ± 37.6 IU/L, ALT from 76.4 ± 77.8 to 78.9 ± 68.7 IU/L). The lipid profile was not changed in both groups.
Conclusion: Both groups (tofogliflozin and glimepiride) equally lower the HbA1c levels. However, tofogliflozin not glimepiride significantly lower the body weight, liver enzymes, and histology scores.
Clinical Trial Registration Number: jRCTs 041180132, NCT02649465
Disclosure: Y. Takeshita: None.
30
A dietary intervention to alter insulin sensitivity, intramyocellular and hepatocellular lipids, postprandial metabolism, and body weight: a 16-week randomised trial
H. Kahleova1, K.F. Petersen2, G.I. Shulman2,3, J. Alwarith1, E. Rembert1, A. Tura4, M. Hill5, R. Holubkov6, N.D. Barnard1;
1PCRM, Washington, USA, 2Yale School of Medicine, New Haven, USA, 3Department of Cellular and Molecular Physiology, Yale School of Medicine, New Haven, USA, 4CNR Institute of Neuroscience, Padova, Italy, 5Institute of Endocrinology, Prague, Czech Republic, 6School of Medicine, University of Utah, Salt Lake City, USA.
Background and aims: Excess body weight and insulin resistance lead to type 2 diabetes and other major health problems. There is an urgent need for dietary interventions to address these conditions and for greater clarity in how dietary interventions work.
Materials and methods: Participants (n=244) were randomly assigned to an intervention group (n=122), which was asked to follow a low-fat vegan diet for 16 weeks or to a control group (n=122) making no diet changes for 16 weeks. Before and after the intervention period, body composition and visceral fat were measured by dual X-ray absorptiometry. Insulin resistance was assessed with the Homeostasis Model Assessment (HOMA-IR) index and predicted insulin sensitivity index (PREDIM). Thermic effect of food was measured by indirect calorimetry. In a subset of participants (n=44), hepatocellular and intramyocellular lipids were quantified by 1H magnetic resonance spectroscopy. Repeated measure ANOVA was used for statistical analysis.
Results: Body weight decreased by 6.4 kg in the intervention group and 0.5 kg in the control group (-5.9 kg [95% CI -6.7 to -5.0]; p<0.001). Thermic effect of food increased in the intervention group by 14.1% ([95% CI +6.5 to +20.4]; p<0.001). HOMA-IR index decreased (-1.3 [95% CI -2.2 to -0.3]; p<0.001), and PREDIM increased (+0.9 [95% CI +0.5 to +1.2]; p<0.001) in the intervention group. Hepatocellular and intramyocellular lipids decreased by 34.4% and 10.4% in the intervention group (p=0.002; and p=0.03, respectively). None of these variables changed significantly in the control group. The change in PREDIM correlated negatively with the change in body weight (r=-0.43; p<0.001). Changes in hepatocellular lipid and intramyocellular lipid correlated strongly with changes in insulin resistance (both r=+0.51; p=0.01). In both groups combined, changes in intramyocellular lipids correlated with fat mass changes (r=+0.51; p<0.05) and HOMA-IR (r=+0.52; p<0.05).
Conclusion: A low-fat plant-based dietary intervention reduces body weight by reducing energy intake and increasing postprandial metabolism, apparently due to increased insulin sensitivity resulting from reduced hepatocellular and intramyocellular fat.
Clinical Trial Registration Number: NCT02939638
Supported by: Yale Diabetes Center P30 DK-045735 and R01 DK-113984
Disclosure: H. Kahleova: None.
OP 06 Uncomplicating the pathogenesis of diabetes complications in humans
31
Small RNA-seq reveals a specific circulating miRNA signature linked to the type 2 diabetes complications
A. Abukiwan1, T. Fleming1, R. Thiele2, S. Kopf1, P. Nawroth1;
1Department of Endocrinology and Metabolism, Heidelberg University Hospital, Heidelberg, 2Heidelberg University, Heidelberg, Germany.
Background and aims: MicroRNAs (miRNAs) have been shown to play an important role in the pathogenesis of type 2 diabetes (T2D), and their circulating levels have appeared as potential biomarkers for the development and progression of the disease. However, few studies have examined whether a microRNA signature exists between the different diabetic complications and their multiple mechanisms including inflammatory response, cellular senescence, and glucose metabolism. The objective of this study was to identify whether such a signature exists.
Materials and methods: We used small RNA-sequencing analysis to identify differential plasma miRNAs in patients with type 2 diabetes (n=23), patients with type 2 diabetes with complications (n= 93), (nephropathy, neuropathy, liver fibrosis, and lung fibrosis), and healthy controls (n=31).
Results: RNA-seq analysis identified 20 differential circulating miRNAs between the healthy andT2D patients, more than 54 miRNAs significantly deregulated between T2D and those with complications, and miRNA panel consisting of miR-200c-3p, miR-378c, miR-22-3p, let-7c-3p, miR-181d, miR-148a, miR-215-3p and, miR-9-5p had a distinct expression signature between T2D complications subgroups. GO analysis revealed that 50 cellular processes and pathways were significantly enriched by genes targeted by these 8 miRNAs. The reactive oxygen process was enriched (P < 0.0007) by more than 40 genes targeted by all 8 miRNAs. In addition, four other pathways, TGFß signaling, AGE-RAGE signaling pathway, cell cycle, and cellular senescence signaling, were also strongly enriched in significant nuclear processes including DNA damage, RNA transcription, and binding.
Conclusion: Our study identified a 8 miRNA signature capable of discriminating between all T2D complications and diabetes. Aberrant regulation of this miRNA signature, which is associated with underlying pathophysiology mechanisms, may contribute to the development of complications which arise in the T2D state.
Supported by: BMBF and SFB1118-A04
Disclosure: A. Abukiwan: Grants; BMPF and SFB1118-A04.
32
Downregulation of spingosine 1-phosphate receptor might be protective against vascular complications in people with long-term type 1 diabetes
T. Özgümüs1, T.J. Berg2, V. Lyssenko1;
1Department of Clinical Science, University of Bergen, Bergen, 2Institute of Clinical Medicine, University of Oslo, Oslo, Norway.
Background and aims: Individuals with long-term type 1 diabetes (T1D) who have remained largely free from vascular complications represent an important population for investigation of natural mechanisms protecting tissues and organs in the diabetic environment. The protective factors in these patients may provide insight for further improvement of current treatments or even prevention. In this study we investigated the underlying differences between people with long-standing T1D with and without vascular complications and age-matched non-diabetic individuals.
Materials and methods: The Dialong cohort included people with long-term T1D (n=62) and non-diabetic controls (n=34). We investigated differences in blood transcriptomic profiles using RNA sequencing method. The T1D patients were classified into non-progressors (NP, n=34) who have duration longer than 30 years without developing any complications and rapid-progressors (RP, n=28) who developed vascular complications (retinopathy, nephropathy or cardiovascular diseases) within 25 years of disease duration. RNA content of whole blood samples from patients were sequenced. The alignment of the transcripts and differential expression analysis were done using Kallisto 0.43.1 and DESeq2 1.24.0, respectively. P values were corrected for multiple testing using FDR method.
Results: In age-adjusted analysis, there were 22 genes found to be significantly differentially expressed between NP and RP groups. The downregulated genes in NP group consist of immune factors such as islet cell autoantigen (ICA1), RNASE3, CD33 and the receptor for sphingosine-1-phosphate (S1PR3). Between NPs and controls, there were about 600 genes found to be differentially expressed, of which 91% were downregulated in NPs. These genes were enriched in GO-BP term of regulation of transcription (padj = 4.3E-05). More than 1000 genes were found to be differentially expressed between RPs and controls, the downregulated genes (~71%) were enriched in same GO-BP term similar to NP vs controls (padj = 1E-11) while the upregulated genes (29%) were enriched in glycospingolipid metabolic process (padj=0.04). In a previous study of another cohort (PROLONG), we observed slightly reduced oxidative phosphorylation (OXPHOS) in the non-progressors compared with rapid progressors, which might have a protective effect via reduced mitochondrial function and reduced DNA damage. In the current study we found that the log-fold-changes of OXPHOS genes for the same comparison group are correlated with log-fold-changes in the previous study (cor=0.64, p<0.0001).
Conclusion: The overexpression of immune factors is associated with and may contribute to increased risk of vascular complications, while downregulation of spingosine 1-phosphate receptor might have protective effects against vascular complications in people with long-term T1D.
Supported by: UiB, VK, TMS, NN
Disclosure: T. Özgümüs: None.
33
The glycolytic by-product methylglyoxal is present in immune cells and may affect their recruitment
X. Zhang1, N. Hanssen1, A. Bektić1, M. van Oeteren1, J. Scheijen1, M. Streeter2, J. van de Gaar1, D. Spiegel2, K. Wouters1, C. Schalkwijk1;
1Department of Internal Medicine, Maastricht University, Maastricht, Netherlands, 2Department of Chemistry, Yale University, New Haven, USA.
Background and aims: The reactive dicarbonyl compound methylglyoxal (MGO), is mainly formed as a byproduct of glycolysis and is increased in diabetes. The formation and accumulation of MGO are linked to multiple cardiometabolic diseases. Immune cell activation is involved in cardiometabolic disease development and leads to a switch to glycolysis for their energy demand. Hence, immune cell activation may lead to formation of MGO. We investigated whether MGO is formed in immune cells and whether MGO affects immune cell function.
Materials and methods: MGO was measured in human blood fractions and circulating immune cell fractions using ultra-performance liquid chromatography-tandem mass spectrometry. Oral glucose tolerance tests (OGTT) were performed in 20 abdominal obese individuals, and a fluorescent probe was used to track MGO in immune cells using flow cytometry. In mice, we injected an iv bolus of 25μg highly purified MGO in 10 minutes, 24h or 72h prior to sacrifice. Immune cell numbers were studied in blood and tissues using flow cytometry and immunohistochemistry, respectively.
Results: In human, about 50% of whole blood MGO content (3.61±1.04 μM) was confined to leukocytes (2.02±0.7 μM), whereas MGO levels in plasma (0.12±0.03 μM) and platelets (0.007±0.004 μM) were very low. Purified leukocyte subsets showed a very high cellular MGO concentrations in lymphocytes (4409±1095μM) followed by monocytes (2804±2455μM) and granulocytes (1683±437μM). An increased glucose load during OGTT resulted in increased MGO levels in these immune cell fractions. In mice, injection of highly purified MGO resulted in a 7-fold increase of circulating neutrophils after 10 min compared to PBS injection, which normalized after 24h. We observed similar results in the liver with fast 9-fold increase of hepatic neutrophils 10 min post injection. CD11b expression (as a marker for neutrophils and macrophages) in the aorta showed a sharp decrease (19.9 fold) after 10 min, which normalized after 24h, suggesting a rapid release of the neutrophils adhered to the endothelium, or marginated neutrophil pool. MGO spiking also decreased circulating Ly6chi monocytes after 72h (- 40%), while macrophage numbers in the liver were increased (35.7±6.5 vs 24.2±6.8 macrophages per microscopic view).
Conclusion: MGO is present in a high concentration in lymphocytes, granulocytes, and monocytes, is further increased during an OGTT and may affect immune cell recruitment, possibly via vascular release of the marginated neutrophil pool.
Disclosure: X. Zhang: None.
34
Role of circulating Wnt1 inducible signalling pathway protein 1 (WISP1) in liver and adipose tissue fibrosis
O. Pivovarova-Ramich1,2, J. Loske1, S. Hornemann1, M. Markova1,2, N. Seebeck1,3, A. Rosenthal4, J. Raila3, R. Buschow5, V. Lange6, A.F.H. Pfeiffer1,7, N. Rudovich1,8, M. Ouwens2,9;
1German Institute of Human Nutrition, Nuthetal, Germany, 2German Center for Diabetes Research (DZD), Munich-Neuherberg, Germany, 3University of Potsdam, Institute of Nutritional Science, Nuthetal, Germany, 4Clinic for Nutritional Medicine, Berlin, Germany, 5Max Planck Institute for Molecular Genetics, Berlin, Germany, 6Helios Klinikum Berlin-Buch, Berlin, Germany, 7Charité-Universitätsmedizin Berlin, Berlin, Germany, 8Spital Bülach, Bülach, Switzerland, 9German Diabetes Center, Duesseldorf, Germany.
Background and aims: We recently identified Wnt1 inducible signaling pathway protein 1 (WISP1) as a novel proinflammatory adipokine that was associated with visceral obesity and insulin resistance in humans. Wnt signaling plays an active role in determining tissue fibrosis and remodeling in different pathological conditions. A role of WISP1 in the development of fibrosis was demonstrated in mouse lung and kidney, but whether it has an effect in liver and adipose tissue fibrosis associated with obesity and T2DM is unknown. The aim of present study was to investigate the role of WISP1 in liver and adipose tissue fibrosis in severe obesity.
Materials and methods: Human liver, visceral (VAT) and subcutaneous (SAT) adipose tissue collected from 35 severely obese humans (BMI 42.5 ± 0.7 kg/m2, age 46.7 ± 1.8 y) during bariatric surgery were examined for WISP1, fibrosis and inflammation markers by quantitative real time PCR and histological image analysis. Plasma samples were analyzed by commercial ELISA assays. Hepatic stellate LX-2 cells were treated with human recombinant WISP1 (10, 100, 500 ng/ml) alone or in combination with 1 ng/ml LPS or 1 ng/ml transforming growth factor beta (TGF-β) for 24h.
Results: In the liver, WISP1 mRNA expression positively correlated with BMI and with the expression of fibrosis markers COL1A1 (r = 0.652; p<0.001), COL3A1 (r = 0.579; p<0.001), COL6A1 (r = 0.645; p<0.001), alpha-SMA (r = 0.380; p=0.029), TGFB1 (r=0.500, p=0.003), as well as TIMP1 (r = 0.554; p<0.001) and MMP9 (r = 0.526; p<0.001), two key enzymes in the regulation of extracellular matrix turnover. In adipose tissue, WISP1 expression was strongly correlated with TIMP1 expression in SAT and VAT (r=0.607, p<0.001 and r=0.343, p=0.043, respectively) and with α-SMA in SAT (r=0.406, p=0.015). Circulating WISP1 levels showed no association with BMI and no differences between subjects with or without NASH and between subjects with different NAFLD activity score as determined histologically. In LX-2 cells, exposure to WISP1 caused a dose-dependent induction of MMP-9 and MCP-1. WISP1 potentiated the TGF-β-mediated induction of COL3A1, TIMP1 and MCP-1 and showed no interaction with LPS treatment.
Conclusion: Our results showed a contribution of WISP1 in the development of obesity-associated fibrosis and inflammation in the liver and adipose tissue and thus characterized WISP1 as a potential target in obesity and diabetes therapy.
Clinical Trial Registration Number: DRKS00009509
Supported by: DZD OP-R, MO; EFSD NR; DDG OP-R
Disclosure: O. Pivovarova-Ramich: None.
35
Insulin resistance and altered fibrin clot properties in overweight individuals with type 1 diabetes: A potential mechanism for increased vascular complications?
N. Kietsiriroje, S.M. Pearson, R.A.S. Ariëns, R.A. Ajjan;
Leeds Institute of Cardiovascular and Metabolic Medicine, University of Leeds, Leeds, UK.
Background and aims: Overweight individuals with Type 1 diabetes (T1D) have a higher risk of vascular complications by mechanisms that remain unclear. Given that fibrin clot characteristics can determine vascular risk, we investigated fibrin network formation and lysis in those with different degree of insulin resistance, measured as estimated glucose disposal rate (eGDR).
Materials and methods: A validated turbidimetric assay and confocal microscopy were employed to study plasma-derived fibrin clot properties in 41 patients with T1D. Fibrinogen concentration in all plasma samples was measured by Clauss technique. HbA1c, body mass index and presence of hypertension were used to calculate eGDR using the following formula: eGDR = 19.02 - [0.22 x BMI(kg/m2) - [3.26 x presence of hypertension(1=yes, 0=no)] - [0.61 x HbA1c(%)]. Patients were catergorised into 3 tertiles by eGDR values for the comparisons of clot maximum turbidity, clot lysis time and fibrinogen levels. To investigate the effects of quantitative and qualitative changes in fibrinogen on the fibrin network, plasma levels of the protein were measured, and clots were also made from plasma-purified fibrinogen of the individuals studied.
Results: Clot maximum absorbance, a measure of clot density, was highest in the low eGDR tertile compared to the middle (T2) and high tertiles (T3) (0.21±0.07, 0.17±0.05 and 0.16±0.05 AU, respectively; p = 0.02, T1 vs T3). Similarly, clot lysis time, an indicator of fibrinolysis potential, was longest in low eGDR tertile compared with middle and high (1016±398, 726±374 and 680±190 sec, respectively; p=0.01, T1 vs T3). Plasma fibrinogen levels were similar in the three tertiles of eGDR, however, clots made from concentrated fibrinogen purified from pooled plasma of patients with eGDR<7 were denser than those with eGDR>8 (17.3±1.8 vs 12.9±2.0 fibers/100μm; p=0.01).
Conclusion: Insulin resistance is associated with prothrombotic changes in fibrin clot phenotype in individuals with T1D, related, at least in part, to qualitative changes in the fibrinogen molecule. Altered fibrin clot properties may be one mechanism for the increased risk of complications in overweight individuals with T1D.

Supported by: Faculty of Medicine, Prince of Songkla University, Thailand
Disclosure: N. Kietsiriroje: None.
36
Chronic complications versus glycaemic variability, time in range and HbA1c in people with type 1 diabetes: sub study of the RESCUE-trial
A. El Malahi1, M. Van Elsen1, S. Charleer2, F. De Ridder1,3, K. Ledeganck3, B. Keymeulen4, L. Crenier5, R. Radermecker6, B. Lapauw7, C. Vercammen8, F. Nobels9, C. Mathieu2, P. Gillard2, C. De Block1,3;
1Endocrinology-Diabetology, University Hospital Antwerp, Edegem, 2Endocrinology, University Hospitals Leuven - KU Leuven, Leuven, 3Laboratory of experimental medicine and paediatrics, University of Antwerp, Antwerp, 4Diabetology, University Hospital Brussels, Brussels, 5Endocrinology, Université Libre de Bruxelles – Hôpital Erasme, Brussels, 6Diabetes, Nutrition and Metabolic disorders, CHU Liège, Liège, 7Endocrinology, Ghent University Hospital, Ghent, 8Endocrinology, Imelda Hospital, Bonheiden, Belgium, 9Endocrinology, OLV Hospital Aalst, Aalst, Belgium.
Background and aims: So far, HbA1c is the only metric of glucose control showing a strong association with chronic complications. However, it does not reflect short-term glycemic variability nor provides guidance in decreasing risk of hypoglycemia. More widespread use of continuous glucose monitoring (CGM) has changed the way people with type 1 diabetes (T1D) manage their glycemia by providing information about glycemic variability and time spent in different glucose ranges.
Materials and methods: Parameters that could have a link with diabetes complications were analyzed of 515 adults with T1D who entered the Belgian reimbursement system for real-time CGM (rtCGM): HbA1c, standard deviation (SD), coefficient of variation (%CV), time in range (TIR, 70-180 mg/dL), age, diabetes duration, BMI, and gender. Association between glucometrics from the first 2 weeks of rtCGM use and presence of the following diabetes complications at start were investigated with multiple logistic regression: composite microvascular complications (defined as presence of at least 1 of the following: peripheral or autonomic neuropathy, retinopathy, nephropathy), macrovascular complications, and hospitalization for hypoglycemia and ketoacidosis.
Results: Diabetes duration (OR=1.12, P<0.001) and TIR (OR=0.97, P=0.005) were independently correlated with composite microvascular complications. For nephropathy, diabetes duration (OR=1.08, P<0.001) and HbA1c (OR=1.65, P=0.012) were independently associated. For retinopathy it were diabetes duration (OR=1.14, P<0.001) and TIR (OR=0.96, P<0.001). For peripheral and autonomic neuropathy it were diabetes duration (OR=1.09, P<0.001; OR=1.08, P<0.001) and SD (OR=1.03, P=0.026; OR=1.035, P=0.015). Age (OR=1.08, P=0.003) and HbA1c (OR=1.80, P=0.044) were independently correlated with macrovascular complications. Only TIR (OR=0.97, P=0.021) was independently associated with hospitalization for hypoglycemia or ketoacidosis.
Conclusion: Shorter TIR was associated with the presence of composite microvascular complications, and with retinopathy in particular. A higher SD was linked to peripheral and autonomic neuropathy. For hospitalization due to hypoglycemia or ketoacidosis, TIR was the most important factor.

Clinical Trial Registration Number: NCT02601729
Disclosure: A. El Malahi: None.
OP 07 Smoke on the water: Is BAT still hot?
37
Blocking endothelial ROCK2 promotes fat browning and improves metabolic dysfunction
Y. Takeda1, K. Matoba1, D. Kawanami2, Y. Nagai1, Y. Kanazawa1, T. Yokota1, K. Ustunomiya3, R. Nishimura1;
1Division of Diabetes, Endocrinology, and Metabolism Department of Internal Medicine, The Jikei University School of Medicine, 3-25-8, Nishishinbashi, Minato-ku, 2Department of Endocrinology and Diabetes Mellitus, Fukuoka University, 8-19-1 Nanakuma, Jonan-ku Fukuoka, 3Center for Preventive Medicine, The Jikei University School of Medicine, 3-25-8, Nishishinbashi, Minato-ku, Japan.
Background and aims: Intraperitoneal fat accumulation is considered an important risk factor for the impaired glucose tolerance, dyslipidemia, and coronary heart diseases. However, underlying mechanisms the excess lipid storage are not fully understood. The small GTPase Rho and its downstream effector, Rho-kinase (ROCK), regulate various cellular functions, including organization of the actin cytoskeleton, cell adhesion and gene expression. Studies have shown that Rho/ROCK signaling is implicated in the pathogenesis of diabetic vascular complications. ROCK has two isoforms, ROCK1 and ROCK2. Systemic gene deletion studies in mice suggest that these isoforms have distinctive roles in regulating cellular function. In this study, we investigated specific roles of endothelial ROCK2 in the progression of obesity.
Materials and methods: To examine the in vivo role of endothelial ROCK2, we generated endothelial-ROCK2 knockout mice (ER2KO) by breeding ROCK2 floxed mice with mice expressing VE-cadherin-cre recombinase.
Results: ER2KO mice are resistant to both weight gain and glucose intolerance induced by high fat diet. White adipose tissue (WAT) weight was lower in ER2KO mice compared with wild-type mice. Histological analysis revealed that adipose droplets were smaller in ER2KO than wild-type mice. Browning, the conversion of WAT to a beige phenotype, activates thermogenic function, suppresses obesity and improves glucose and lipid metabolism. Interestingly, we observed an increase of mRNA expression of browning marker including PPARα, CIDEA, PRDM16, UCP1, and specific markers of M2 macrophages in WAT obtained from ER2KO mice, regardless of whether they had been fed a normal chow or high fat diet.
Conclusion: Endothelial ROCK2 regulates glucose and lipid metabolism by suppressing browning of WAT. ROCK2 could be an important therapeutic target against obesity and diabetes mellitus.
Disclosure: Y. Takeda: Grants; a Grant-in-Aid for Scientific Research from Japan Society for the Promotion of Science (to Keiichiro Matoba and Rimei Nishimura), the MSD Life Science Foundation (to Keiichiro Matoba), the Takeda Science Foundation (to Keiichiro Matoba), the Suzuken Memorial Foundation (to Keiichiro Matoba). Other; Keiichiro Matoba has received research support from Sanofi KK, Tanabe Pharma, and Takeda Pharmaceutical., Kazunori Utsunomiya has received research support from Terumo, Novo Nordisk Pharma, Taisho Pharmaceutical, Böehringer Ingelheim, Kyowa Hakko Kirin, Sumitomo Dainippon Pharma, and Ono Pharmaceutical as, Rimei Nishimura has received speaker honoraria from Astellas Pharma, Nippon Boehringer Ingelheim, Eli Lilly Japan KK, Kissei Pharmaceutical, Medtronic Japan, MSD, Novartis Pharma KK, Novo Nordisk Phar.
38
The essential role of the α4 for insulin signalling in metabolic regulation and maintenance of brown adipocyte
M. Sakaguchi, S. Okagawa, Y. Okubo, M. Igata, T. Kondo, E. Araki;
Department of Metabolic Medicine, Faculty of Life Sciences, Kumamoto University, Kumamoto, Japan.
Background and aims: Current studies demonstrated that insulin sensitivity of adipose tissues is essential for the maintenance of the systemic metabolic state. We created the experimental system to investigate the role of insulin and IGF-1 signaling in the adult adipose tissues by an inducible adipocyte-specific gene targeting of IR and IGF1R in mice. The IR/IGF1R knockout specifically in adipocytes caused a severe metabolic disease state. Here, we searched the essential downstream targets of insulin signaling for the maintenance of adipose tissues.
Materials and methods: We used the adipocyte-specific inducible IR/IGF1R gene-knockout in the adult mice. We obtained the RNAs from the adipocytes of both white fat tissues (WAT) and brown fat tissues (BAT) before and after the metabolic disease state. To identify new components of IR/IGF1R signaling, we compared gene expression patterns in WAT and BAT, and identified the mRNAs markedly altered after the metabolic disease state. Among the mRNAs, α4, a protein phosphatase protector which regulates phosphorylation state of various target molecules, is decreased significantly after the deficit of IR/IGF1R signaling in BAT. Thus, we have created inducible adipocyte-specific α4 KO (Ai-α4 KO) mice with tamoxifen-inducible Cre-ERT2 transgene and investigated the role of α4 in the IR-mediated signaling for the maintenance of BAT.
Results: ShRNA mediated α4 knockdown (KD) altered insulin-stimulated phosphorylation status in BAT, decreased IRβ (Y1162/1163), IRS1 (Y612), and Akt (S473), with a mild change in ERK1/2 (T202/Y204) but increased ribosomal S6 protein (S235/236), indicating that α4 reduces S6 phosphorylation state. Once induced α4 KO in adipocytes, the mice revealed extensive losses of adipocytes in SC-WAT and BAT depots. Ai-α4 KO mice showed severe diabetes, with ectopic lipid accumulation in the liver and pancreatic islet hyperplasia. RNA-seq of adipose tissues showed a marked reduction of genes associated with mitochondrial fatty acid oxidation and increases with inflammatory cytokine pathways in Ai-α4 KO SC-WAT and BAT. The histological analysis showed a significant increase in stromovascular cells with an elevation of F4/80, TNF-α, and IL-6 and a rapid development of an apoptotic process with increased TUNEL and cleaved caspase-3. Ai-α4KO showed a marked reduction of BAT-associated functional genes as UCP1, PRDM16, Tfam, and PGC1α mRNA compared to the control. Consistent with the changes in mRNAs and the decrease in BAT mass, Ai-α4 KO mice showed the marked cold intolerance and impaired energy expenditure.
Conclusion: The results demonstrated that α4 is an essential component for insulin signaling to regulate the maintenance of the brown adipocytes.
Supported by: JSPS, MSD foundation, Takeda foundation, Astellas foundation
Disclosure: M. Sakaguchi: None.
39
Proof-of-concept for CRISPR/Cas9 gene editing in human primary preadipocytes: deletion of FKBP5 and PPARG and effects on adipogenesis and metabolism
P.G. Kamble1, S. Hetty1, M. Vranic1, K. Almby1, C. Castillejo-López2, X.M. Abalo1, M.J. Pereira1, J.W. Eriksson1;
1Medical Sciences, Uppsala University, Uppsala, 2Immunology, Genetics and Pathology, Uppsala University, Uppsala, Sweden.
Background and aims: The clustered regularly interspaced short palindromic repeats/CRISPR-associated nuclease 9 (CRISPR/Cas9) technology has advanced the field of genome engineering. Yet, its applications to human adipose tissue are scarce. We aimed to establish the CRISPR/Cas9 method for gene knockout (KO) studies in isolated human primary preadipocytes. As a proof-of-concept, we deleted the glucocorticoid receptor modulating gene FKBP5 (FKBP51, a resultant protein) in preadipocytes and explored its role in adipogenesis and the context of glucocorticoid effects on insulin resistance in human adipocytes. As a method validation, we also knocked out the PPARG gene, a master regulator of adipogenesis.
Materials and methods: Subcutaneous adipose tissue was obtained from 8 non-diabetic women (age: 20-71 years; BMI: 24.2-43.1 kg/m2). After tissue digestion, isolated preadipocytes were used to knockout FKBP5 and PPARG genes with CRISPR/Cas9. The CRISPR components were delivered into cells as a ribonucleoprotein complex using electroporation. For each target gene, three different sgRNA were used. A non-coding sgRNA was used as a negative control. The results are presented for the sgRNA with the highest KO efficiency. The KO efficiency was checked by DNA sequencing, mRNA and protein levels. The effect of FKBP51 loss on adipogenesis was studied. Differentiated adipocytes from wild type (WT) and FKBP51 KO cultures were treated with dexamethasone (0.3 μM/24 h) to assess its effect on adipocyte glucose uptake and downstream transcriptional activity of glucocorticoid receptors.
Results: The mutation efficiency for top-performing sgRNA against the FKBP5 and PPARG genes was 91% and 63%, respectively. At the protein level, we found between 90-100% loss of FKBP51 and PPARG in the KO cultures than WT cultures. This was achieved without clonal isolation. The loss of FKBP51 did not affect adipocyte differentiation compared to WT. In contrast, the loss of PPARG prevented adipogenesis, which also served as a positive control. As expected, in WT cultures, dexamethasone treatment significantly reduced basal and insulin-stimulated (1000 μU/ml) glucose uptake by ~50% compared to untreated cultures (p<0.05, n=6). In contrast to WT cultures, the inhibitory effect of dexamethasone was abrogated in FKBP51 KO cultures (p=NS). The expression of a glucocorticoid target gene, CNR1 in response to dexamethasone was higher by ~50% in FKBP51 KO cultures than WT (p<0.05, n=6).
Conclusion: We report proof-of-concept for CRISPR/Cas9 gene editing in human primary preadipocytes by knocking out FKBP51, a chaperone protein modulating glucocorticoid receptor activity, as well as PPARG, being a good control for adipogenesis. Our data suggest that FKBP51 does not affect adipogenesis in humans in contrast to what has been shown in rodent models. Instead, it may affect glucocorticoid effects on adipocyte glucose metabolism and transcriptional activity of glucocorticoid receptors. This has potential implications for the glucocorticoid-induced insulin resistance and type 2 diabetes. Our method is simple, easy to adapt and enables the use of human primary preadipocytes over animal adipose cell models to assess the role of key genes and their products in development and metabolism of adipose cells.
Supported by: SDF, EXODIAB, EF, SSMR, UU ALF grants.
Disclosure: P.G. Kamble: None.
40
Understanding Mig-6 functions of brown adipose tissue in adaptive thermogenesis and systemic energy homeostasis
S. Choung1,2, J. Kim2, K. Joung2, H. Kim2, B. Ku1,2;
1Research Institute for Medical Sciences, Chungnam National University, Daejeon, 2Internal Medicine, Chungnam National University, Daejeon, Republic of Korea.
Background and aims: Obesity is a major risk factor for metabolic syndrome such as type 2 diabetes mellitus, dyslipidemia, non-alcoholic fatty liver, cardiovascular disease, and even some cancers. In contrast to white adipose tissue, well known to store energy, brown adipose tissue (BAT) governs thermogenic energy expenditure. Due to special ability to dissipate energy as heat, BAT has a therapeutic potential to combat obesity, diabetes and metabolic syndrome. Mitogen-inducible gene 6 (Mig-6) is a negative regulator of the epidermal growth factor receptor (EGFR) signal. Deletion of the Mig-6 hyper-activate EGFR signaling, leading to spontaneous tumor formation in skin, lung and other tissues. Because Mig-6 is as tumor-suppressor gene, most studies focus on cancer. Recently, we characterized that Mig-6 has an important role in the regulation of cholesterol homeostasis and bile acid synthesis in the liver. In previous study, we demonstrated the association between EGFR signaling and metabolic disorder such as NAFLD. However, the roles of Mig-6 in BAT remain poorly understood. In the present study, we investigated the metabolic role of Mig-6 in BAT.
Materials and methods: Immortalize brown adipocytes were transfected siRNA targeting Mig-6 after differentiation. We generated mice specifically enhancing Mig-6 in BAT using a genetic strategy based on the Cre-ROSA recombination. We fed normal chow or high fat to KI mice for 12 weeks. Body weights and food intake were measured weekly. We conducted GTT and ITT. KI mice were measured energy expenditure by using indirect calorimetry system. Tissues staining was performed. The measurement of biochemical parameters was performed using mice serum. Western blot and quantitative polymerase chain reaction (Q-PCR) performed to analyze related genes.
Results: Here we showed that the inhibition of Mig-6 decreases the expression of thermogenesis relative genes, UCP1 and Elovl3, in the BAT cell. Mig-6 KI mice showed better metabolic phenotypes, including improved glucose tolerance and reduction of body weight. In the accelerated obese condition, transgenic mice induced the improvement of glucose tolerance, fasting glucose level and lipid levels. Importantly, Mig-6 upregulated the expression of thermogenesis relative genes (UPC1, Pgclα, Cieda, PPARα, Elovl3), consistent with the increased UCP1 in the BAT of mice. Mig-6 KI mice on HFD improved insulin sensitivity, glucose tolerance and energy metabolism.
Conclusion: These results together suggest that Mig-6 controls systemic energy homeostasis by regulating UCP1 based adaptive thermogenesis.
Disclosure: S. Choung: None.
41
Oncostatin M inhibits browning of white adipose tissue via gp130 signalling
P.P. van Krieken1,2, T.S. Odermatt1,2, M. Blüher3, S. Wueest1,2, D. Konrad1,2;
1Pediatric Endocrinology and Diabetology, University Children's Hospital Zurich, Zurich, Switzerland, 2Children's Research Center, University Children's Hospital Zurich, Zurich, Switzerland, 3Helmholtz Institute for Metabolic, Obesity and Vascular Research (HI-MAG) of the Helmholtz Zentrum München at the University of Leipzig and University Hospital Leipzig, Leipzig, Germany.
Background and aims: Obesity is associated with low grade adipose tissue inflammation and locally elevated levels of oncostatin M (OSM), a member of the glycoprotein 130 (gp130) cytokine family. It was recently shown that OSM can impair the thermogenic function of brown adipose tissue (BAT), suggesting OSM contributes to the positive energy balance that underlies obesity. However, when we blocked OSM signalling using adipocyte-specific gp130 knockout mice (gp130Δadipo), levels of the main thermogenic marker uncoupling protein 1 (UCP1) were unchanged in BAT. To consolidate these results we aimed to further study the role of OSM in thermogenesis and white adipose tissue (WAT) browning.
Materials and methods: Protein and gene expression levels of UCP1 and other thermogenic markers were assessed in extracts from a subcutaneous adipocyte cell line, adipose tissue depots from control (gp130F/F) or gp130Δadipo mice fed either chow or a high fat diet (HFD), or subcutaneous WAT biopsies from a human cohort of lean and obese subjects. WAT browning was modelled in vitro by exposing mature adipocytes to isoproterenol subsequent to stimulation with various concentrations of OSM.
Results: In line with mouse data, OSM gene expression in human WAT positively correlated with BMI (r=0.156, p=0.043, n=170) and negatively with UCP1 expression (r=-0.295, p=0.012, n=71). Similar to our previous findings in BAT, Ucp1 expression remained unchanged in the epididymal WAT of HFD-fed gp130Δadipo compared to gp130F/F mice. However, inguinal WAT of gp130Δadipo mice exhibited significantly elevated levels of Ucp1 and other browning markers such as Cidea and Pgc-1α. In vitro, OSM treatment lowered isoproterenol-induced UCP1 protein and gene expression levels in subcutaneous white adipocytes in a dose-dependent manner. Mechanistically, preliminary data indicate that OSM inhibits UCP1 expression ERK-dependently in white adipocytes.
Conclusion: Our data support the notion that OSM negatively regulates thermogenesis in adipose tissue, albeit in a fat depot dependent manner. Lowering OSM expression in (white) adipose tissue may be a beneficial strategy to treat obesity.
Supported by: SNSF grant no. 179344 and the Hartmann Müller-Stiftung (University of Zurich)
Disclosure: P.P. van Krieken: None.
42
Involvement of the Notch pathway and its ligand DNER in obesity-mediated inflammation of adipose tissues
J. Pestel, M. Robert, H. Vidal, A. Eljaafari;
CarMeN INSERM U-1060, Lyon, France.
Background and aims: During obesity adipose tissues (AT) are progressively infiltrated by inflammatory immune cells, leading to insulin resistance. Among them Th17 lymphocytes propagate inflammation, through secretion of IL-17A/F cytokines which bind to ubiquitously expressed receptors, and activate pro-inflammatory secretion by surrounding cells. Using a co-culture model with adipose-derived stem cells harvested from obese individuals (obASCs) and activated mononuclear cells (MNCs), we have demonstrated that obASCs are involved in Th17 cell polarization and subsequent inhibition of adipogenesis and insulin response. Because the Notch pathway is known to regulate helper T cell differentiation, and DNER a non-canonical NOTCH ligand, to regulate adipogenesis, this led us to investigate the role of NOTCH and DNER in obASCs-mediated inflammation.
Materials and methods: With this aim, DAPT (an inhibitor of the Notch pathway) was added or not to phytohemagglutinin A (PHA)-activated co-cultures of human obASCs and MNCs. In addition, siRNA targeting Dner (siDner) were transfected in ob-ASC, or not. Cytokine expression and secretion, were measured by RT-qPCR and ELISA, respectively. Finally, wild type (WT) and DNER knockout mice (DNERKO) were fed with a hypercaloric or chow diet for 16 weeks. BMI and glycaemia were monitored, and AT were harvested to measure pro-inflammatory cytokine expression by RT-qPCR.
Results: As expected, PHA-activated co-cultures of human ob-ASCs with MNCs enhanced IL-17A, but reduced TNFα secretion. DAPT significantly inhibited IL-17A secretion, and restored TNFα production, demonstrating thus the role of the NOTCH pathway in the polarization of T cells towards the Th17 cell subset. DNER expression increased upon inflammatory conditions in obASCs, i.e. when obASCs were co-cultured with activated MNCs. ob-ASC transfected with siDNER partially inhibited IL-17A secretion by human T lymphocytes. In the N Tac mouse model, DNER expression positively correlated with body weight and glycemia (p<0.05)and increased in subcutaneous and visceral AT of obese mice, as compared with lean mice. Finally, in N Tac mice fed with a hypercaloric diet, IL-17A did not increase in AT, but AT inflammation was assessed by increase of TNFα, IL-6, and IFNγ expression in both visceral and sub-cutaneous AT. Interestingly, DnerKO-mice demonstrated lower TNFα, IFNγ and IL6 expression in subcutaneous AT (p=0.0132; 0.0449 ; 0.0311, respectively), and lower IFNγ expression in visceral AT ( p=0.062), as compared with WT mice.
Conclusion: Our results demonstrate the involvement of the Notch pathway and its ligand DNER in human obASCs-mediated Th17 cell polarization, in vitro. In our experimental mouse model, we observed an involvement of DNER in obesity-mediated inflammation of adipose tissues, and a link between DNER expression and glycemia. Therefore, altogether our results suggest a role for DNER and NOTCH in obesity-mediated AT inflammation and metabolic alterations.
Disclosure: J. Pestel: None.
OP 08 Charting human beta cell failure in type 1 diabetes
43
111 In-exendin spect imaging suggests presence of residual beta cells in patients with longstanding type 1 diabetes
M. Boss1, I. Kusmartseva2, W. Woliner- van der Weg1, L. Joosten1, M. Brom1, M. Béhe3, C.J. Tack4, O.C. Boerman1, M.J.R. Janssen1, M. Atkinson5, M. Gotthardt1;
1Radiology, Nuclear Medicine and Anatomy, Radboudumc, Nijmegen, Netherlands, 2Pathology, Immunology and Laboratory Medicine, University of Florida, Gainesville, USA, 3Paul Scherrer institute, Villingen, Switzerland, 4Internal Medicine, Radboudumc, Nijmegen, Netherlands, 5University of Florida, Gainesville, USA.
Background and aims: There is increasing evidence for the presence of residual, dysfunctional beta cells in patients with type 1 diabetes (T1D). Confirming the existence of such non-functioning beta cells in living subjects has been hampered by the lack of methods capable of quantifying beta cell mass (BCM) in vivo in humans. Pancreatic uptake of 111In-exendin (targeting the GLP-1 receptor), quantified by single photon emission computed tomography (SPECT) provides such a method. We hypothesized that T1D patients have considerable remaining BCM and therefore, should have detectable 111In-exendin uptake in the pancreas, even without or only low insulin secretion.
Materials and methods: 10 T1D patients and 10 matched healthy controls underwent quantitative SPECT following injection of 111In-exendin after which pancreatic tracer uptake was determined. In addition, immunohistochemical analysis of human pancreatic sections from organ donors with longstanding T1D was performed to assess GLP-1R expression as well as presence of insulin and glucagon.
Results: Pancreatic uptake of 111In-exendin was above background levels in 6/10 individuals with T1D. Strikingly, in 5 T1D patients, pancreatic tracer uptake was comparable to uptake levels in healthy controls. Pancreatic uptake of 111In-exendin was independent of stimulated C-peptide levels (<0.03 nmol/L in 8/10 T1D patients). In some individuals with long type 1 diabetes duration and undetectable C-peptide level, immunohistochemistry demonstrated the presence of extremely limited number of islets with residual insulin positive beta cells, some of which were GLP-1R positive. GLP-1R expression was also detected in insulin and glucagon negative islet cells.
Conclusion: Multiple individuals with T1D show measurable uptake of 111In-exendin. These data were corroborated by immunohistochemistry demonstrating the presence of GLP-1R-positive/insulin-positive as well as GLP-1R-positive/ insulin-negative/glucagon-negative islet cells in pancreas samples of longstanding T1D patients. The detected radiotracer uptake could indicate the presence of residual dysfunctional beta cells or, alternatively, GLP-1R expression on other endocrine cell types transdifferentiating into a beta cell-like type. Additional data are needed to clarify the origin of the radiotracer signal. The presence of a residual pool of dysfunctional beta cells has important implications for treatment of T1D, since these cells have the potential for functional restoration. In sum, exendin imaging could provide a valuable tool to further elucidate the complex pathophysiology of diabetes.

Clinical Trial Registration Number: 2013-004268-76
Supported by: INNODIA (IMI2-JU, grant agreement 115797)
Disclosure: M. Boss: None.
44
Comparative analysis of human pancreatic islets after type 1 diabetes, LADA and type 2 diabetes manifestation
A. Joerns1, S. Lenzen1,2;
1Hannover Medical School, Hannover, 2Institute of Experimental Diabetes Research, Hannover Medical School, Hannover, Germany.
Background and aims: During diabetes manifestation pancreatic islets show changes in beta cells and changes in cytokine expression of the immune cell infiltrate. Therefore a comparative analysis was performed between islets from T1DM, LADA, T2DM patients, and age-matched, non-diabetic subjects.
Materials and methods: By double immunofluorescence staining the immune cell types and beta cells stained by insulin or other glucose recognition markers were determined. The gene expressions of different cytokines in the islet infiltrate and caspase 3 as well as PCNA in the beta cells of human non-diabetic and the different diabetic (T1DM, LADA, T2DM) human pancreases were performed by in situ PCR analysis. Gene expression of the parameters was quantified in the infiltrating immune cells and beta cells with a computer-assisted method.
Results: The non-diabetic control islets of human subjects showed only few macrophages with a slight increase in islets of pancreases from T2DM patients. The islet immune cell infiltrate was mainly composed in the T1DM and LADA by CD4 and CD8 T cells as well as CD68 macrophages. In the infiltrated islets of the LADA pancreas there was a more pronounced increase of CD68 macrophages in relation to CD8 T cells as compared to the T1DM situation. Compared to the overall immune cell islet infiltration in the T1DM pancreas a heterogeneous infiltration pattern was observed in the LADA pancreas. Around one third of the analysed LADA pancreatic areas showed any signs of infiltration. Immune cells in the islet infiltrate of T1DM and LADA pancreases expressed all main pro-inflammatory cytokines, especially IL-1β and TNF-α with a threefold shift of the ratio between IL-1β and TNF-α in the infiltrated area of the human LADA pancreases. At the same time, the anti-inflammatory cytokine IL-10 showed a higher gene expression in the immune cell infiltrate of the LADA as compared to T1DM pancreases. All analysed pro- and anti-inflammatory cytokines revealed no gene expression in the few immune cells in the T2DM and non-diabetic situation. Caspase 3 expression was more increased in human T1DM than in LADA pancreases when compared to the beta-cells in the control islets or islets from non-diabetic and T2DM pancreases. The gene expression of the proliferation marker PCNA increased more in islets of LADA than of T1DM pancreases.
Conclusion: It can be concluded therefore, that LADA is a milder form of autoimmune diabetes in patients of an advanced age. The functional implications of these studies for developing prevention therapy strategies in T1DM including LADA are to eliminate the activated immune cell infiltration pattern with their specific pro-inflammatory cytokine profile in the islets to allow survival and regeneration of intact beta cells.
Supported by: DFG Jo395/2-2
Disclosure: A. Joerns: None.
45
Differential expression of inflammation-related genes in the pancreases of patients with two distinct endotypes of type 1 diabetes
F. Torabi1, P. Leete2, R. Wyatt2, J. Vadakekolathu3, D. Boocock3, M.D. Turner3, S.J. Richardson2, N.G. Morgan2, M.R. Christie1;
1School of Life Sciences, University of Lincoln, Lincoln, 2Institute of Biomedical and Clinical Sciences, University of Exeter, Exeter, 3School of Science & Technology, Nottingham Trent University, Nottingham, UK.
Background and aims: Autoimmune responses in Type 1 Diabetes (T1D) commonly appear within the first five years of life, but the age at which disease develops varies greatly from early childhood to late adulthood suggestive of different rates of disease progression. Morphological studies on pancreas samples from young people with T1D have revealed different patterns of immune cell infiltration between patients diagnosed <7 years and those developing disease at an older age (>13y) suggesting a link between phenotype of inflammatory responses and age at onset. The cellular composition of the islet infiltrate differs primarily according to the number of CD20+ B-cells infiltrating the islet, and patients may be categorised as either T1D endotype 1 (T1DE1) or 2 (T1DE2), with the former having an earlier age at onset and greater CD20+ cell infiltration. We hypothesised that islet infiltrating B-cells, by acting as antigen presenting cells, drive the specificity and phenotype of T-cells within the islet inflammation and thereby intensity of beta cell destruction. The objective of this study was to investigate whether islet CD20+ B-cell infiltration in T1D is associated with differences in immune cell activation consistent with a more proinflammatory phenotype in T1DE1 than in T1DE2. This was achieved by applying state-of-the art gene expression technologies to identify differences in immunophenotypic markers in the pancreases of patients with each endotype.
Materials and methods: Numbers of CD20+ cells in individual islets on sections of fixed pancreas from T1D cases in the Exeter Archival Diabetes Biobank were quantified by immunohistochemistry and samples categorised as T1DE1 (mean >3 CD20+ cells per islet) or T1DE2. RNA was extracted from each section and RNA concentration and fragmentation were evaluated using a Bioanalyser. Samples where >40% of RNA fragments exceeded 300 nucleotides in length were analysed for the expression of a panel of 750 autoimmunity-related genes and 20 housekeeping genes using nCounter gene expression technology. Expression levels were normalised and differentially expressed genes between disease endotypes were identified using nSolver software.
Results: RNA samples from 8 T1DE1 and 7 T1DE2 cases were subjected to nCounter analysis and the expression of between 460 and 710 autoimmunity-related genes were above the limit of detection across these samples. Differential expression analysis identified a single gene, SERPINA1 which was dramatically over-expressed in cases with T1DE2 vs T1DE1. This gene encodes a protein with known cytoprotective and anti-inflammatory properties. By contrast, more than 50 genes were significantly over-expressed in T1DE1 vs T1DE2 samples including selected chemokines (CCL19, CCL21), receptors (CXCR4, IL7R) and genes related to antigen presentation and lymphocyte activation, including HLA-F, PTPRC and CD22.
Conclusion: These data support the proposal that the inflammatory milieu differs markedly in the islets of subjects with T1DE1 and T1DE2. They suggest that detailed analysis of inflammatory gene expression profiles will provide additional insights into the aetiopathological events leading to beta-cell loss in these two disease endotypes.
Supported by: JDRF
Disclosure: F. Torabi: None.
46
Defects in proinsulin processing vary during disease progression in type 1 diabetes
P. Leete, M.A. Russell, C. Ziller, S.J. Richardson, N.G. Morgan;
RILD Level 4, University of Exeter, Exeter, UK.
Background and aims: Evidence for beta cell heterogeneity is emerging and it is increasingly proposed that individual islets may be composed of specific sub-populations of phenotypically distinct beta cells. These have been defined principally by transcriptional analysis but, as expected, there is also evidence for heterogeneity of protein expression. Recently, such heterogeneity was reported during the analysis of proinsulin expression in islets of people with recent-onset (RO) type 1 diabetes, where the variation correlated with the extent of beta cell destruction, phenotype of islet inflammation and age at diagnosis. On this basis, two discrete endotypes of type 1 diabetes were proposed (known as T1DE1 and T1DE2). In the present study, we have investigated whether the differences in proinsulin processing seen close to the onset T1D in the two disease endotypes, also persist in the islets of subjects with longer duration (LD) disease.
Materials and methods: The distribution of proinsulin and mature insulin were examined by immunofluorescence techniques in 4um sections of pancreas from a total of 41 individuals (8 control subjects, 20 RO T1D (<1y); 13 LD T1D (>5y disease)). Staining was visualised via high pixel rate confocal microscopy, and samples were analysed in a blinded manner. The extent of co-localisation of proinsulin and insulin was estimated by measurement of the Manders Overlap Coefficient (MOC) using ImageJ software. The proportion of beta cells having aberrant proinsulin processing was estimated according to the staining profiles achieved. These were then compared between individuals with RO vs LD disease (both in T1DE1 and T1DE2) and controls.
Results: In control subjects, most beta cells displayed a pattern in which proinsulin was localised primarily in the peri-nuclear region, and this was independent of age (between 2-41y). By contrast, among children with RO T1DE1, proinsulin was distributed throughout the cytoplasm in most beta cells in >90% of residual insulin-containing islets. Surprisingly, however, this feature was not seen in subjects with >5y disease when the few remaining beta cells displayed little evidence of defective proinsulin processing. Subjects with RO T1DE2 contained two distinct sub-populations of islets. A minority (<30%) displayed a proinsulin processing pattern similar to that seen in the islets of children with RO T1DE1. However, in the second, larger, sub-population (~70% of the total) proinsulin was retained preferentially in the peri-nuclear region suggesting that the prohormone was processed correctly in most beta cells. Similar to the findings in T1DE1 at >5y duration, those with >5y T1DE2 disease also showed little evidence of aberrant proinsulin processing. More strikingly still, among these subjects, only a single population of islets was retained, in which proinsulin was restricted to the peri-nuclear region in all beta cells. Thus, unlike the situation in people with RO T1D (whether T1DE1 or T1DE2) the residual beta cells found in longer duration (>5y) disease appear to process insulin normally.
Conclusion: Taken together, these data imply that beta cells having aberrant proinsulin processing may be targetted selectively during the early phase of the autoimmune attack in human T1D. The sub-population of beta cells surviving beyond this period appear to process proinsulin efficiently, implying that the ability to process proinsulin may influence the susceptibility of individual beta cells to immune attack during the progression of type 1 diabetes.
Supported by: DUK/JDRF
Disclosure: P. Leete: None.
47
Inhibition of serpinB13 stimulates beta cell development via Notch signalling pathway and delays progression to insulin-dependent diabetes
J. Czyzyk, Y. Kryvalap;
University of Minnesota, Minneapolis, USA.
Background and aims: Methods for repopulating the pancreas with new insulin-producing cells have strong potential for therapy in diabetes. Recently, we have found that inhibition of serpinB13 - a protease inhibitor of cathepsin L (catL) - with mAb in mouse embryos leads to a robust increase in the number of pancreatic Ngn3+ progenitor cells, significant expansion of islet mass, and improved resistance to severe diabetes in adulthood. To unveil the molecular mechanism of the augmented Ngn3+ cell response following inhibition of serpinB13 during gestation, we focused on the Notch communication system - a critical signaling pathway for pancreatic development.
Materials and methods: We used a mAb to serpinB13 or IgG isotype control to stimulate mouse embryonic pancreas explants (E12.5), and examined Notch and Ngn3 expression in these in vitro cultures by flow cytometry and Western blotting. The human autoantibodies to serpinB13 in subjects previously enrolled in a DPT-1 clinical trials were measured using Luminex methodology.
Results: We found that serpinB13 is expressed and secreted by epithelial cells in murine embryonic pancreases. Moreover, inhibition of serpinB13 during embryogenesis caused protease-dependent cleavage of the extracellular domain of Notch1 receptor in the pancreas (p<0.0001). On the other hand, embryonic pancreases of mice with genetic deficiency of catL had significantly fewer Ngn3+ cells compared with wild type controls. The partial loss of the extracellular Notch was followed by decreased presence of active Notch intracellular domain (aNICD), a fragment of Notch that is critical for restraining endocrine cell development. Finally, our screening of children enrolled in DPT-1, for serpin B13 autoantibody (AA) revealed an inverse correlation of this AA with risk level for type 1 diabetes (T1D), as well as a positive association with longer diabetes-free interval. Importantly dialyzed sera from serpinB13 AA-positive subjects stimulated the output of Ngn3+ cells in the pancreas suggesting that this AA is functional. This effect was dependent on serpinB13AA rather than other serum factors as positive serum samples immunodepleted of this AA were no longer able to stimulate development of additional Ngn3+ cells.
Conclusion: Our data point to a novel function of serpinB13 in maintaining Notch receptor-mediated repression of pancreatic endocrine progenitors. Consequently, the perturbation of this effect of serpinB13 enables protease activity to partially dismantle Notch signaling, thereby allowing for more efficient development of Ngn3+ progenitors cells and a subsequent increase in islet mass. Our data also demonstrate that blocking serpinB13 has the potential to partially prevent, or at least slow down, the development of T1D both in the mouse and human.
Supported by: JDRF, ADA, NIH
Disclosure: J. Czyzyk: None.
48
Efficacy and safety of anti-interleukin (IL)-21 in combination with liraglutide in adults recently diagnosed with type 1 diabetes
C. Mathieu1, M. von Herrath2, S.C. Bain3, B. Bode4, J.O. Clausen5, K. Coppieters6, L. Gaysina7, J. Gumprecht8, T. Krarup Hansen9, C. Morales Portillo10, O. Mosenzon11, S. Segel12, G. Tsoukas13, T.R. Pieber14;
1Clinical and Experimental Endocrinology, UZ Gasthuisberg, University of Leuven, Leuven, Belgium, 2Novo Nordisk Inc., Seattle, USA, 3Swansea University Medical School, Swansea, UK, 4Atlanta Diabetes Associates and Emory University School of Medicine, Atlanta, USA, 5Novo Nordisk A/S, Søborg, Denmark, 6Novo Nordisk A/S, Måløv, Denmark, 7Kazan Federal University, Kazan, Russian Federation, 8Medical University of Silesia, Katowice, Poland, 9Steno Diabetes Center Aarhus, Aarhus University Hospital, Aarhus, Denmark, 10Endocrinology and Nutrition, Virgen Macarena Hospital, Seville, Spain, 11Diabetes Unit, Hadassah Hebrew University Hospital, Jerusalem, Israel, 12Novo Nordisk A/S, Aalborg, Denmark, 13Medicine, McGill University, Montreal, Canada, 14Medical University of Graz, Graz, Austria.
Background and aims: To evaluate the effect of anti-IL-21 and liraglutide, alone and in combination, compared to placebo, on preservation of β-cell function after 54 weeks of treatment in adults with recently diagnosed type 1 diabetes.
Materials and methods: This was a multicentre, double-dummy, double-blind, efficacy, safety and pharmacokinetic randomised control trial in adults recently diagnosed with type 1 diabetes and non-fasting C-peptide peak ≥0.2 nmol/L, comprising a 54-week treatment period followed by a 26-week observation period. Primary endpoint: area under the curve (AUC)0-4h for meal-stimulated C-peptide at week 54 relative to baseline.
Results: At week 54, combination treatment was associated with a significant improvement of 48% in meal-stimulated C-peptide secretion vs placebo (Table). The insulin requirement was significantly lowered by 0.13 U/kg, corresponding to 32% reduction. Trends for better glycaemic control and lower risk of hypoglycaemic episodes at 54 weeks compared to placebo were also observed. No safety concerns were identified. Treatment benefits were not sustained at 26 weeks after end of treatment.
Conclusion: Treatment with anti-IL-21 and liraglutide for 54 weeks was safe and resulted in sustained insulin secretion and lower insulin dose. Trends for improved glucose control and fewer hypoglycaemic episodes compared to placebo were observed.

Clinical Trial Registration Number: NCT02443155
Supported by: Novo Nordisk A/S
Disclosure: C. Mathieu: Non-financial support; Abstract supported by Novo Nordisk.4
OP 09 Novel agents in type 1 diabetes
49
Innodia master protocol for the evaluation of investigational medicinal products in children, adolescents and adults with newly diagnosed type 1 diabetes
D.B. Dunger1, S.F.A. Bruggraber1, A.P. Mander2, T. Tree3, P. Jaroslaw Chmura4, M.J. Knip5, A.M. Schulte6, C. Mathieu7;
1Box 116 Level 8, University of Cambridge, Cambridge, UK, 2Cardiff University, Cardiff, UK, 3King's College London, London, UK, 4University of Copenhagen, Copenhagen, Denmark, 5University of Helsinki, Helsinki, Finland, 6Sanofi Deutschland GmbH, Frankfurt, Germany, 7KU Leuven, Leuven, Belgium.
Background and aims: Currently Phase 2 drug development for T1D may be slowed by lack of information to inform drug dosage and mechanistic data to understand variable responses to an investigational medical product. Trials would also benefit from identification of biomarkers to permit more robust stratification of participants at baseline. The INNODIA consortium has established a European infrastructure to evaluate prospectively clinical data from people with new onset T1D combined with centralised analysis of clinical samples to determine rates of decline in beta cell function and identify novel predictive biomarkers. Built on the backbone of this study we have developed a Master Protocol (MP) to accelerate the delivery of Phase 2 studies.
Materials and methods: The protocol of the existing INNODIA study includes formal assessment of beta-cell function by mixed meal tolerance tests and home dried blood spot measurement of C-peptide, standardised sample collections for centralised assessment of immune function and a range of measurements of disease activity (beta-cell death, microRNAs) and samples for genomics, metabolomics, proteomics and lipidomics biomarker discovery. Pseudo anonymised clinical data collected through an eCRF and all of the laboratory data are stored in a central data warehouse allowing integrated data analysis.
Results: The INNODIA MP uses the same inclusion criteria, visit schedule, duration, sample collection for standardised efficacy and mechanistic studies. The inclusion criteria can be adapted to the requirements of specific interventions, but the clinical and mechanistic evaluations remain largely unchanged providing the potential to explore more detailed analysis of variability in response. Additional sample collection can permit essential study of toxicology and PK/PD. The MP is suited for adaptive trial design such as dose finding, dropping study arms, inclusion of additional treatments, options to share controls and potentially inclusion of data from the natural history cohort. The MP was submitted to the EMA Scientific Advice Working Party (SAWP) of the Committee for Medicinal Products for Human Use (CHMP) for Qualifications advice for novel methodologies in clinical drug development. The EMA SAWP supported the intended context of use and endorsed strategies going forward for planned clinical trials within INNODIA’s infrastructure.
Conclusion: We believe the INNODIA MP will improve the standardisation of Phase 2 studies and accelerate the evaluation of established, novel and re-purposed IMP’s alone or in combination with the aim of halting or reversing the decline in beta cell function in people with newly diagnosed T1D.

Clinical Trial Registration Number: NCT03936634
Supported by: IMI2 H2020
Disclosure: D.B. Dunger: None.
50
The Simplici-T1 trial: activation of glucokinase by TTP399 improves glycaemic control in patients with type 1 diabetes
C. Valcarce1,1, J.L.R. Freeman1, I. Dunn1, C. Dvergsten1, K.R. Klein2, J. Buse2;
1vTv therapeutics, High Point, 2UNC Chapel Hill, Chapel Hill, USA.
Background and aims: Identification of adjunctive, oral pharmacotherapies to treat type 1 diabetes (T1D) has been limited by hypoglycemia and ketoacidosis. TTP399 is a liver-selective oral glucokinase activator. In type 2 diabetes (n=190), TTP399 was shown to reduce A1C vs placebo (PBO) −0.9% (P < 0.01).
Materials and methods: The Simplici-T1 trial is an adaptive, Phase 1b/2 Proof of Concept study designed to explore the safety and efficacy of TTP399 versus placebo in patients with T1DM. Safety, pharmacokinetics, and pharmacodynamics were established in a sentinel phase (n=5). In Part 1 (n=19) patients on insulin pump therapy and continuous glucose monitoring were randomized (1:1) to receive 800mg TTP399 or PBO once daily for 12 weeks. In Part 2 (n=85), TTP399 effect was examined in a broader T1D population. Insulin dose was optimized prior to randomization and throughout the 12 wk double-blind treatment period with specified pre- and post-meal targets (fasting plasma glucose: ~80-130mg/dL; post meal glucose: <180-200 mg/dL). Treat to target continued throughout the study.
Results: Safety, pharmacokinetics, and pharmacodynamics were established in a sentinel phase (n=5). In Part 1 (n=19), TTP399 reduced A1C (-0.7%, p=0.03), improved TIR 70-180 (12%, p=0.04), and reduced bolus insulin vs PBO in patients on insulin pump therapy and continuous glucose monitoring. In Part 2 A1C at randomization was 7.6% (SD 0.6). TTP399 significantly reduced A1C (trial product estimand: -0.32%, 95%CI -0.50, -0.13, p<0.01; ITT: -0.20, 95%CI -0.38,-0.02, p=0.03). A responder analysis (improved A1C; without severe hypoglycemia or increase in insulin dose; nor abnormal betahydroxybutyrate or lactic acid) revealed 42% TTP399 responders vs 12% PL (ITT: p=0.001, hierarchically controlled [HC]). Daytime TIR improved (ITT: 8%, 95%CI 1,15, p<0.01, HC). Treatment-emergent adverse events were numerically lower with TTP399. No safety signals were identified.
Conclusion: These data suggest that further development of TTP399 as adjunctive therapy in T1D is warranted.
Clinical Trial Registration Number: NCT03335371
Supported by: JDRF
Disclosure: C. Valcarce: Employment/Consultancy; vTv therapeutics employee.
51
Mechanism matter: preliminary evidence that activation of glucokinase by TTP399 does not increase plasma or urine ketones in type 1 diabetes
J.L.R. Freeman, I. Dunn, C. Valcarce;
vTv therapeutics, High Point, USA.
Background and aims: Attempts to develop new oral adjunctive type 1 diabetes (T1D) treatments to achieve tighter blood glucose levels have been hampered by an increased risk of hypoglycemia and DKA. TTP399 is an oral liver-selective glucokinase activator (GKA). TTP399’s mechanism of action is insulin-independent and thus may be suitable as an adjunctive treatment for T1D. In contrast to observations with SGLT inhibition, non-clinical and clinical data to date suggest that activation of GK by TTP399 should not significantly affect parameters linked to the increase in risk of DKA (ex: decrease in nocturnal glycemia and basal insulin or increases in glucagon.)
Materials and methods: The Simplici-T1 trial is an adaptive, Phase 1b/2 Proof of Concept study designed to explore the safety and efficacy of TTP399 versus placebo (PBO) in patients with T1DM. Safety, pharmacokinetics, and pharmacodynamics were established in a sentinel phase (n=5). In Part 1 (n=19) patients on insulin pump therapy and continuous glucose monitoring were randomized (1:1) to receive 800mg TTP399 or PBO once daily for 12 weeks. In Part 2 (n=85), TTP399 effect was examined in a broader T1D population (device use not required). Insulin dose was optimized prior to randomization and throughout the 12 wk double-blind treatment period with specified pre- and post-meal targets (fasting plasma glucose: ~80-130mg/dL; post meal glucose: <180-200 mg/dL). Treat to target continued throughout the study.
Results: After 12 weeks, TTP399 significantly reduced HbA1c (-0.3%, 95%CI [-0.5, -0.01], p<0.001 trial product estimand; -0.2%, 95%CI [-0.38, -0.01], p=0.03 ITT), and improved TIR (8%, 95%CI [0.78, 14.72] p=0.03). No incidents of severe hypoglycemia occurred in the TTP399-treated group and no DKA events were reported in the study. Moreover, no significant or clinically relevant increases in plasma β-hydroxybutyrate (BOHB) or urine ketones were observed in the TTP399-treated group compared to placebo (Figure 1) independent of significant reductions in insulin.
Conclusion: These results, support the hypothesis that activation of GK by TTP399 should not increase the risk of DKA and are consistent with results from a non-clinical minipig model of T1D in which dosing of a liver-selective GKA, while reducing/eliminating insulin, did not increase ketones and protected from DKA. Further mechanistic studies and studies of longer duration are needed to confirm these observations.

Clinical Trial Registration Number: NCT03335371
Supported by: JDRF
Disclosure: J.L.R. Freeman: Employment/Consultancy; vTv therapeutics employee.
52
Long-term follow-up study of type 1 diabetes patients previously treated with IMCY-0098 or placebo in young adults with recent-onset type 1 diabetes
N. Bovy1, C. Boitard2, P. Achenbach3, R.D. Leslie4, C. Dayan5, B. Keymeulen6,7, K.R. Owen8, V. Carlier1, M. Van Mechelen1, J. Van Rampelbergh1;
1Imcyse SA, Liège, Belgium, 2Institut Cochin, Paris, France, 3Helmholtz Zentrum München, München, Germany, 4Queen Mary University of London, London, UK, 5Cardiff University, Cardiff, UK, 6UZ Brussel, Brussels, Belgium, 7Belgian Diabetes Registry, Brussels, Belgium, 8University of Oxford, Oxford, UK.
Background and aims: Type 1 diabetes (T1D) is an auto immune disease for which no curative treatment currently exists. IMCY-0098 (human T1D-peptide) is an innovative immunotherapeutic technology consisting of a synthetic peptide containing an MHC class II epitope of proinsulin linked to a thioredox motif. It is an antigen-specific therapy leading to the generation of cytolytic memory CD4 T cells targeting the pathogenic auto-immune response whilst preserving overall immune competence of diabetic patients. The safety, clinical efficiency and immune responses induced by IMCY-0098 treatment were evaluated in the IMCY-T1D-001, a phase 1b double-blind, placebo-controlled, multi-centre study in young adults with recent-onset T1D. Herein, we present the results of a long-term follow-up (LTFU) study on these patients.
Materials and methods: This study involved a follow-up of 6 months after the end of the initial participation. At week 24 of the IMCY-T1D-001 study, patients were offered to participate to this LTFU study including additional assessments at week 36 and week 48 after the first administration of IMCY-0098. Mixed meal tolerance tests (MMTT) were performed at week 36 and week 48 and the daily doses of insulin treatment were recorded. PBMCs were also collected at week 48 to measure IMCY-0098 specific cytolytic CD4 response and beta-cells antigen specific effector T cell responses by flow cytometry. Data were analysed using a datamining approach with artificial intelligence-based Knowledge Extraction and Management (KEM) technology.
Results: 30 out of 41 patients were re-consented. All received 4 injections of IMCY-0098 or placebo during the main study. 11 patients refused participation or were lost to follow-up. Overall, the study provided evidence of long term (up to 48 weeks) safety and tolerability of the study drug. The safety analysis identified 24 TEAEs that were mild or moderate in intensity and not related to IMCY-0098, except for 1 event of hypoglycaemia that was judged as possibly related and resolved by the end of the study. The positive early clinical and immunological trends observed in the main study up to 6 months, were not confirmed at 48 weeks after start of the treatment or were less prominent. However, due to the low number of observations and in-group variability, the study was explorative and was not designed or powered to demonstrate efficacy.
Conclusion: Results of this LTFU clinical trial have confirmed the excellent safety profile of IMCY-0098 observed in the IMCY-T1D-001 study, reaching the primary study objective. The positive trend in clinical and immunological parameters improvement detected in the main study was not observed in the LTFU. The current data suggest that the right dosage or regimen (number and timing of injections of IMCY-0098) to elicit a significant and long-term effect is yet to be identified. Overall, the results of the main study and the LTFU are very encouraging and informative. Further exploration is needed in a next clinical trial already in preparation under the master protocol and the support of the European Consortium INNODIA.
Clinical Trial Registration Number: NCT04190693
Supported by: EU FP7 // DG06 Walloon Region
Disclosure: N. Bovy: None.
53
Golimumab preserves beta cell function and reduces insulin use and hypoglycaemia in youth with recently diagnosed type 1 diabetes: the phase 2 T1GER study
T. Quattrin1, M.J. Haller2, A.K. Steck3, E. Felner4, Y. Li5, Y. Xia5, J.H. Leu5, M.R. Rigby6, R. Zoka6, J.A. Hedrick6, F. Vercruysse7;
1Jacobs School of Medicine and Biomedical Sciences, University at Buffalo and JR Oishei Children’s Hospital Diabetes Center, Buffalo, USA, 2Department of Pediatrics, University of Florida, Gainesville, USA, 3Barbara Davis Center for Childhood Diabetes, University of Colorado Anschutz Medical Campus, Aurora, USA, 4Division of Pediatric Endocrinology, Emory University School of Medicine, Atlanta, USA, 5Janssen Research & Development, LLC, Spring House, USA, 6Janssen Research & Development, LLC, Horsham, USA, 7Janssen Research & Development, Beerse, Belgium.
Background and aims: Type 1 diabetes (T1D) is an autoimmune disease characterized by progressive loss of pancreatic β cells. Golimumab is a human IgG1κ monoclonal antibody specific for tumor necrosis factor α. This study assessed whether golimumab preserves β-cell function in children and young adults with newly diagnosed stage 3 T1D.
Materials and methods: This Phase 2a, double-blind, placebo-controlled study randomized participants aged 6-21 years with newly diagnosed stage 3 T1D to receive subcutaneous golimumab (BSA-based dose if <45 kg; fixed dose if ≥45 kg) or placebo (2:1) for 52 weeks. The primary endpoint was C-peptide area under the curve (AUC) at Week 52 after a 4-hour mixed-meal tolerance test. Insulin use, HbA1c, hypoglycemia rates, and proinsulin/C-peptide ratios were assessed.
Results: 84 participants were enrolled (golimumab, n = 56; placebo, n = 28). The study was positive as mean (SD) 4-hour C-peptide AUC at Week 52 was 0.64 (0.423) and 0.43 (0.388) pmol/mL with golimumab and placebo, respectively (P<0.001; Figure). Golimumab-treated participants had lower insulin use, hypoglycemia rates, and proinsulin/C-peptide ratios versus placebo. Both groups maintained good glycemic control. Golimumab was well tolerated, without any new safety signals.
Conclusion: In this study, golimumab demonstrated the ability to preserve endogenous insulin production and improve clinical and metabolic parameters in children and young adults with newly diagnosed stage 3 T1D.

Clinical Trial Registration Number: NCT02846545
Supported by: Janssen Research & Development, LLC
Disclosure: T. Quattrin: Employment/Consultancy; Janssen Research & Development. Other; Clinical Trial, Principal investigator of the Buffalo site: Janssen, Provention Bio, Inc, OPKO Biologics Ltd, Clinical Trial, Co-Investigator Buffalo site: Novo Nordisk, Boehringer Ingelheim Pharmaceutical, Eli Lilly and Company, AbbVie Incorporated, Rhythm Pharmaceuticals Incorporated, Sanofi Pharmaceutical.
54
Development of novel modulators of the GABAA receptor for diabetes therapy
J. Eckel1, B. Hasse2, B. Belgardt3, M. Hecht4, R. Wördenweber5, A. Piechot6, M. Roden7;
1KomIT - Center of Competence for Innovative Diabetes Therapy, Duesseldorf, 2Algiax Pharmaceuticals, Erkrath, 3Institute for Vascular and Islet Cell Biology, German Diabetes Center, Duesseldorf, 4vivo Science, Gronau, 5A&M Labor für Analytik, Bergheim, 6Taros Chemicals, Dortmund, 7Institute for Clinical Diabetology, German Diabetes Center, Duesseldorf, Germany.
Background and aims: Accumulating data suggest that the GABAergic system may play a key role in beta-cell survival and regeneration in both type 1 and type 2 diabetes. Therefore, the development of new positive allosteric modulators of the GABAA receptors (GABAA-Rs) provides an interesting strategy for an anti-diabetic therapy, although central nervous system side effects mediated by α1-GABAA-Rs are a potential concern. Here we synthesized and functionally analyzed a series of low molecular weight thioacrylamides (ThAcs), designed to both positively modulate GABAA-R signalling and show low blood brain barrier penetration.
Materials and methods: Beta-cell proliferation was monitored using EdU incorporation in a rat beta-cell line (INS-1E). Radio ligand competition assays and functional patch clamp experiments were conducted to study the interaction between ThAcs and GABAA-Rs.
Results: Beta-cell proliferation was increased by several ThAcs at nanomolar concentrations (i.e. ~82% increased EdU incorporation after 24 hours treatment with ThAc HK-4 at 100 nM). The most effective candidate, HK-4, was further characterized. In competition assays, we observed a dose-dependent affinity of HK-4 for GABAA-Rs in rat cortical neuron membranes. In electrophysiological patch clamp assays, we determined the modulating activity of HK-4 to individual human GABAA-Rs using HEK293 cells stably expressing different subunit combinations. HK-4 induced very strong potentiation of the current elicited by the natural ligand GABA on GABAA receptors containing combinations of α2β3γ2 (current ~300% of GABA alone), α3β3γ2 (~770%) and on α1β3γ2 (~580%) subunits, respectively. Minimal blood brain barrier penetration of HK-4 was verified by mass spectrometry-based analyses of brain and plasma samples of rats. Additionally, HK-4 shows no major toxicological effects as determined in a 90-day toxicity study with daily dosing, has a favorable pharmacokinetic profile and demonstrates good oral bioavailability.
Conclusion: Our data reveal the potential of HK-4 and other ThAcs for further development into anti-diabetic drugs.
Supported by: EU and EFRE.NRW
Disclosure: J. Eckel: None.
OP 10 Developing better insulins
55
Phase I study investigating the PD, PK and safety of AT247 in comparison to insulin aspart and fast insulin aspart
E. Svehlikova1, T. Augustin2, F. Lawrence3, D. Gerring3, S. Howell3, J. Jezek3, L. Zakrzewski3, C. Magnes2, T.R. Pieber1,2;
1Medical University of Graz, Graz, Austria, 2Joanneum Research, Graz, Austria, 3Arecor Limited, Cambridge, UK.
Background and aims: AT247, an ultra-rapid acting formulation of insulin aspart designed for faster absorption following s.c. injection, will lead to better postprandial glycaemic control and is key to the development of closed-loop pump systems.
Materials and methods: Plasma glucose and serum insulin concentrations were measured in 19 adult male participants with T1DM following a single s.c. dose (0.3 U/Kg) of insulin in a randomised, double-blind, cross over euglycaemic clamp study.
Results: Data presented as median; range. AT247 had a faster onset of glucose lowering effect than insulin aspart (IAsp) and fast insulin aspart (fast IAsp) (onset of action: 17; 12-30 vs. 37; 20-88 vs. 23;16-50 mins). The early glucose lowering effect was greater for AT247 than IAsp and fast IAsp (AUCGIR 0-60min: 212; 63-465 vs. 49; 0-303 vs. 91; 11-300 mg/kg; GIR=glucose infusion rate) (Fig 1A). Similarly, greater initial insulin exposure was seen for AT247 compared to IAsp and fast IAsp (AUC Insulin 0-60min: 111; 48-205 vs. 41; 12-147 vs. 66; 25-188 mU*h/L). In addition, offset of exposure occurred earlier for AT247 than IAsp and fast IAsp (time to late 50% Cmax Insulin: 173; 89-414 vs. 212; 106-389 vs. 221;106-441 mins). (Fig 1B). Comparisons are statistically significant with p<0.05. No safety signals were detected for AT247.
Conclusion: AT247 has a superior (left-shifted) time-action and time-concentration profile as compared to both IAsp and fast IAsp.

Clinical Trial Registration Number: EudraCT: 2018-003934-34
Disclosure: E. Svehlikova: None.
56
Once-weekly basal insulin icodec offers comparable efficacy and safety vs once-daily insulin glargine U100 in insulin naive patients with type 2 diabetes inadequately controlled on OADs
J. Rosenstock1, M. Kjærsgaard2, D. Møller2, M. Hansen2, R. Goldenberg3;
1Dallas Diabetes Research Center at Medical City, Dallas, USA, 2Novo Nordisk A/S, Bagsværd, Denmark, 3LMC Diabetes & Endocrinology, Thornhill, Canada.
Background and aims: Reducing the number of insulin injections may mitigate the burden of insulin therapy in patients with diabetes and facilitate adherence. Insulin icodec* (icodec) is a novel insulin analogue with a terminal half-life of ~196 hours in development as the first once-weekly basal insulin.
Materials and methods: This 26-week, randomized, double-blind, double-dummy, treat-to-target, phase 2 trial investigated the efficacy and safety of once-weekly icodec vs once-daily insulin glargine U100 (IGlar U100) in insulin-naïve patients with type 2 diabetes (T2D) inadequately controlled (HbA1c 7.0-9.5%) with metformin ± dipeptidyl peptidase-4 inhibitors (DPP4i). Starting doses were 70 U weekly and 10 U daily, respectively, with weekly titration to a pre-breakfast self-measured blood glucose target of 3.9-6.0 mmol/L (70-108 mg/dL). Primary endpoint was change in HbA1c from baseline to week 26. Secondary endpoints included change in fasting plasma glucose (FPG) from baseline to week 26, weekly insulin dose during the last two weeks of treatment and hypoglycaemic episodes during the on-treatment period.
Results: Participants (n = 247) were randomized 1:1 to icodec (n = 125) or IGlar U100 (n = 122). Baseline characteristics appeared similar in both groups; mean age was 59.6 years, diabetes duration 9.7 years, BMI 31.3 kg/m2 and FPG 10.0 mmol/L. Mean baseline HbA1c was 8.1% and 8.0% for the icodec and IGlar U100 groups, respectively. At week 26, estimated mean HbA1c was 6.7% for icodec and 6.9% for IGlar U100. The estimated mean change from baseline was -1.33%-points for icodec and -1.15%-points for IGlar U100 (Figure). There was no statistically significant treatment difference for change in HbA1c from baseline to week 26 (estimated treatment difference [ETD] [95% CI]: -0.18% [-0.38; 0.02]). Estimated mean FPG at week 26 was 6.84 mmol/L (icodec) and 7.05 mmol/L (IGlar U100) (ETD [95% CI]:-0.22 mmol/L [-0.66; 0.23]). The estimated mean weekly insulin dose during the last two weeks of treatment was 229 U/week for icodec and 284 U/week for IGlar U100 (estimated treatment ratio [95% CI]: 0.81 [0.69; 0.94]). During the on-treatment period, observed rates of combined level 2 (<3.0 mmol/L or <54 mg/dL) and 3 (severe) hypoglycaemia were low (53 and 46 events per 100 patient years of exposure for icodec and IGlar U100, respectively) and were not statistically significantly different (p = 0.85). There were no unexpected safety findings.
Conclusion: Icodec is the first once-weekly insulin with similar glucose-lowering effects and safety profile to once-daily IGlar U100. Insulin icodec has the potential to improve treatment acceptance and facilitate T2D management in patients needing basal insulin.

Clinical Trial Registration Number: NCT03751657
Disclosure: J. Rosenstock: Employment/Consultancy; Novo Nordisk. Grants; Novo Nordisk. Lecture/other fees; Novo Nordisk.
57
Incidence of significant changes in pulmonary function during a 2-year study with inhaled technosphere insulin
N.S. Zaveri1, M.C. Jones1, J.A. Krueger1, B.J. Hoogwerf2, A.L. Hoogwerf1, P.M. Morey1, D.M. Kendall1;
1MannKind Corporation, Westlake Village, 2Endocrinology and Metabolism (Emeritus), Cleveland Clinic, Cleveland, USA.
Background and aims: The impact of inhaled Technosphere Insulin (TI) on measures of pulmonary function remain an important component of clinical use. TI is an ultra rapid-acting prandial insulin delivered via deep pulmonary inhalation allowing for prompt absorption in the alveoli. Prior studies have demonstrated that, on average, changes in pulmonary function testing (PFT) are limited to small changes (~1%) in forced expiratory volume in 1 second (FEV1).
Materials and methods: This comprehensive post-hoc analysis examined the incidence of significant decline in FEV1 over two years in subjects with type 1 and type 2 diabetes treated with TI. Subjects were included if they had at least five FEV1 measurements (including baseline and month 24). FEV1 must have been ≥70% of predicted at baseline. At each time point, subjects were classified as having a significant change in FEV1 if there was a ≥15% decline from baseline.
Results: Of the 377 subjects, 331 (87.8%) had no measure with ≥15% decline in FEV1 at any time point. Of subjects who had at least one measure with a decline of ≥15%, the majority (n=38) experienced this decline on a transient basis (defined as occurring at two or fewer time points). Eight individuals (2.1%) demonstrated a persistent decline in FEV1 (occurring at three or more time points). Four subjects in the comparator arm (0.7%, n=586) had persistent decline.
Conclusion: In conclusion, persistent significant decline in FEV1 during the use of TI was uncommon.

Disclosure: N.S. Zaveri: Stock/Shareholding; MannKind Corporation.
58
Improved postprandial glucose control with Ultra Rapid Lispro (URLi) versus Lispro with continuous subcutaneous insulin infusion in type 1 diabetes
M. Warren1, J. Cho2, R. Liu2, J. Tobian2, D. Ignaut2;
1Physicians East Professional Association, Greenville, 2Eli Lilly and Company, Indianapolis, USA.
Background and aims: Ultra rapid lispro (URLi) is a novel insulin lispro formulation developed to more closely match physiological insulin secretion. With multiple daily injections, it has shown superior postprandial glucose (PPG) control and non-inferior HbA1c reduction compared to Lispro. The efficacy and safety of URLi vs. Lispro were evaluated in this phase 3, 16-week, treat-to-target study, in adults with type 1 diabetes on continuous subcutaneous insulin infusion (CSII). Primary endpoint was HbA1c change from baseline, with multiplicity adjusted objectives for 1- and 2-hour PPG control after a test meal, and time spent in target range 3.9 - 10.0 mmol/L (70 - 180 mg/dL) (TIR).
Materials and methods: After a 2-week lead-in on Lispro, patients were randomised to double-blind URLi (N=215) or Lispro (N=217). Two-week blinded continuous glucose monitoring (CGM) sessions were conducted prior to randomisation, and at weeks 8 and 16. In addition, a standardised meal test was performed at randomisation and at week 16 to evaluate PPG control.
Results: Non-inferiority of URLi to Lispro on the change from baseline to week 16 in HbA1c was confirmed: least squares mean (LSM) difference 0.3 mmol/mol (0.02%) with 95% CI of -0.6 to +1.2 mmol/mol (-0.06 to +0.11%). Mean change in HbA1c was -0.7 mmol/mol (-0.06%) URLi and -1.0 mmol/mol (-0.09%) Lispro, with mean HbA1c at week 16 of 58.3 mmol/mol (7.48%) URLi and 58.0 mmol/mol (7.46%) Lispro (p=0.565). URLi was superior to Lispro in controlling 1- and 2-h PPG levels during the meal test (Figure). Compared to Lispro, URLi resulted in significantly less percent time in hypoglycaemia (<3.0 mmol/L [54 mg/dL]) over the nighttime and 24-hour period: LSM difference -0.97% and -0.52% respectively, both p<0.05. TIR and time spent in hyperglycaemia (>10.0 and >13.9 mmol/L [180 and 250 mg/dL]) were similar between groups. The incidence of treatment-emergent adverse events was higher with URLi (60.5% vs. 44.7%), primarily driven by infusion site reaction and infusion site pain. Infusion-site-related events were primarily reported as mild or moderate in severity and resolved during the study; however, 3.3% of URLi-treated patients discontinued treatment due to these events. The rate and incidence of severe hypoglycaemia and diabetic ketoacidosis was similar between groups.
Conclusion: URLi was efficacious, providing superior PPG control and an acceptable safety profile compared to Lispro when administered by CSII in patients with type 1 diabetes.

Clinical Trial Registration Number: NCT03830281
Supported by: Eli Lilly and Company
Disclosure: M. Warren: Grants; Novo Nordisk, Eli Lilly and Company, Sanofi-Aventis, Gan and Lee, AstraZeneca, Amgen. Lecture/other fees; Novo Nordisk, Eli Lilly and Company, Sanofi-Aventis, AstraZeneca, Amgen. Non-financial support; Eli Lilly and Company.
59
Long-term safety and efficacy of intraperitoneal insulin infusion by implanted pumps in a large series of patients with type 1 diabetes and initial high glucose variability
N. Jeandidier1, B. Guerci2, E. Renard3, on behalf of EVADIAC study group;
1Endocrinology Diabetes and Nutrition, University Hospital, Strasbourg, 2Endocrinology Diabetes and Nutrition, University Hospital, Nancy, 3Endocrinology Diabetes and Nutrition, University Hospital, Montpellier, France.
Background and aims: Intra-peritoneal (IP) delivery is an alternative route for insulin therapy in patients with type 1 diabetes (T1D) presenting high glucose variability under subcutaneous insulin treatment. We assessed using a post authorization safety study data the long-term safety and efficacy of IP insulin therapy.
Materials and methods: Two hundred and sixty- two patients followed in 12 French and 1 Belgian university hospitals have been enrolled in a multinational, multicenter, observational, prospective cohort study of patients with T1D, treated with Insuman Implantable 400 IU/mL in Medtronic MiniMed implantable pumps. Visits occurred according to routine clinical practice for the use of an implantable pump; refill visits every 40-45 days and ad hoc visits related to complications of the insulin treatment regimen or pump. The primary objective of the study was to better characterize identified risks of severe hypoglycemia, hyperglycemia (HG) due to insulin underdelivery, pump jamming, pump dysfunction or catheter occlusion, pump pocket infection, abnormal healing at the surgical incision site after device implantation, and skin erosion. Data after a follow-up of 2.6±0.7 years have been analyzed, representing a cumulated experience of 837.7 patient-years (PY).
Results: The cohort includes 249 (800.8PY) long term (>6 months IP treatment at study entry) and 13 (36.8PY) short term users. Patient characteristics at inclusion were: 156F/106M, age: 56.5±11.1, BMI: 25.7±4.3, T1D duration: 35.3±12.0 years, HbA1c: 7.7±1.0% (61±8.6 mmol/mol). IP insulin was motivated by brittle diabetes in 67.9%, and frequent severe hypoglycemia in 27.9%. At study entry, comorbidities included: hyperlipidemia (64.5%), hypertension (58.0%), cardiovascular diseases (27.1%).and diabetic complications were reported in 72.9% of patients. Premature discontinuation occurred in 46 cases (17.6%): 7 (2.7%) directly due to AEs, 8 deaths (3.1%) none being directly linked to pump or insulin use, 15 (5.7%) due to pump unavailability after pump explant and 16 (6.1%) due to switch to another type of treatment. Incidences of severe hypoglycemia, HG due to insulin underdelivery, pump pocket infection and skin erosion were 9.3, 21, 1.3 and 0.5 per 100 PY, respectively. Among the cases of HG due to insulin underdelivery, one ketoacidosis was reported and surgical outcomes included 8 temporary and 5 definitive explants, and 40 catheter replacements Longer duration of IP experience was significantly associated with lower risk of hyperglycemic events.
Conclusion: Our study shows sustained efficacy of IP insulin on glucose control with a low incidence of severe hypoglycemia in these patients with multiple comorbidities and initial high glucose variability. Hyperglycemic episodes related to underdelivery events were limited and solved in most cases with no surgical intervention. This data supports the utility of IP insulin delivery from implanted pumps in T1D patients with major glucose control issues.
Clinical Trial Registration Number: ENCEPP/SDPP/10872
Disclosure: N. Jeandidier: None.
60
Evening oral insulin (ORMD-0801) glycaemic effects in uncontrolled type 2 diabetes patients
R. Eldor1, A. Fleming2, J. Neutel3, K. Homer4, M. Kidron5, J. Rosenstock6;
1Tel Aviv Sourasky Medical Center, Tel Aviv, Israel, 2Kinexum, Harpers Ferry, USA, 3Orange County Heart Institute and Research Center, Tustin, USA, 4Integrium, LLC, Tustin, USA, 5Oramed Pharmaceuticals, Jerusalem, Israel, 6Dallas Diabetes Research Center, Dallas, USA.
Background and aims: Oral insulin formulations are being actively pursued, given their projected benefits in the forms of more physiological responses, and improved acceptance and adherence. ORMD-0801 is a novel oral human insulin formulated to increase hepatic insulin exposure, and subsequently reduce hepatic glucose production and improve glycemic control, with minimal hypoglycemia risk. This study aimed to assess the impact of ORMD-0801 on glucose homeostasis in type 2 diabetes (T2DM) patients treated for 12 consecutive weeks.
Materials and methods: In this randomized, placebo-controlled, multicenter, phase 2b, 12-week study, 354 subjects with T2DM uncontrolled by metformin mono/combination therapy and with HbA1c levels ≥7.5%, received placebo or 8 mg, 16 mg or 32 mg (2x16 mg capsules) ORMD-0801, once daily (QD) at bedtime, or two (BID) or three times (TID) daily. Masked continuous glucose monitoring was performed during a 14-day run-in period and over the last 14 days of treatment.
Results: By the end of the treatment period, HbA1c levels had improved from baseline for most active treatment regimens, with largest improvements recorded in the 8 mg QD and BID cohorts. Glucose AUC improved from baseline following 8 mg or 32 mg QD and following BID treatments at all tested doses, and was most pronounced in patients receiving 8 mg QD at bedtime. No hypoglycemia events were reported in the 8 mg QD and 16 mg BID cohorts, while all other cohorts, had hypoglycemia rates significantly lower or similar to the placebo arm. Body weight remained stable in all treatment arms and frequency of drug-related adverse events in active cohorts was similar (TID: n=9) or significantly lower (QD cohorts: n=0-6 events; BID cohorts: n=0-3 events) than in the placebo cohort (n=7 events).
Conclusion: ORMD-0801 elicited clinically significant HbA1c reductions in poorly controlled T2DM patients on standard therapies and with mean HbA1c levels >8%, without increasing hypoglycemia rate or weight. The 8 mg QD regimen appeared most effective, warranting further studies to confirm the efficacy of this once daily evening dose.

Clinical Trial Registration Number: NCT02954601
Disclosure: R. Eldor: None.
OP 11 From diagnostics to the end-stage of diabetic kidney disease
61
Evaluation of the diagnostic performance of four creatinine-based glomerular filtration rate estimation equations in people with diabetes
N. Zafari1, M. Lotfaliany2, L. Churilov1, N. Torkamani1, R.J. MacIsaac1, E.I. Ekinci1;
1Melbourne Medical School, University of Melbourne, Melbourne, 2Deakin Institute for Mental and Physical Health and Clinical Translation, Geelong, Australia.
Background and aims: Accurate diagnosis and early intervention may help reduce diabetic kidney disease progression. Gold standard methods of assessing GFR are resource-intensive and invasive. Therefore, GFR estimation equations using serum creatinine, age, and sex are used in clinical practice as a surrogate of kidney function. However, studies of the performance of these equations in estimating kidney function in people with diabetes show contradictory results. We aimed to assess the diagnostic performance of four GFR equations (chronic kidney disease epidemiology collaboration (CKD-EPI), full age spectrum (FAS), revised Lund-Malmo (rLM), and modification of diet in renal disease (MDRD)) in people with diabetes.
Materials and methods: People diagnosed with type 1 or type 2 diabetes with at least one measured GFR (mGFR) by 99m diethylenetriamine-pentaacetic acid (DTPA) and one measured serum creatinine in Austin Hospital, Melbourne, Australia, were included in this observational study (1487 participants, 2703 measurements).
Results: Diagnostic performance of four GFR estimation equations were compared with DTPA mGFR corrected for sex and Brøchner-Mortensen coefficient using concordance correlation coefficient (CCC), the reduced major axis regression (RMAR) slope and intercept, the Bland-Altman mean difference and 95% limit of agreement (LOA), bias, precision, and accuracy (P10, P30 and P50). Among participants, 591 were women (40%), 1189 had type 2 diabetes (86%), mean age (standard deviation, SD) was 62 (14) years, mean (SD) creatinine level was 94.8 (43.1) μmol/l, and mean (SD) of mGFR corrected for sex and Brøchner-Mortensen coefficient was 65.7 (25.4) ml/min/1.73m2. The CCC was highest in rLM equation (CCC=0.83) followed by the FAS, CKD-EPI and MDRD (CCC=0.81, 0.78, 0.76, respectively). The RMAR (slope, intercept) was 1, 6.4 in MDRD, 1.03, 3.0 in FAS, 0.96, 10.9 in CKD-EPI and 0.84, 11.3 in rLM. The Bland-Altman mean difference was lowest in rLM (1.0 ml/min/1.73m2), while being more than 5-folds higher in FAS, MDRD, and CKD-EPI (5.2, 6.3, and 8.2, respectively). The Bland-Altman 95% LOA was the narrowest in rLM (54.1 ml/min/1.73m2) and widest in MDRD (65.8 ml/min/1.73m2). Bias, defined as the median difference between eGFR and mGFR was the lowest in rLM (1.4ml/min/1.73m2) and highest in CKD-EPI (8.1ml/min/1.73m2). Precision, defined as interquartile range of bias was highest in rLM (16.2 ml/min/1.73m2) and lowest in MDRD (18.1 ml/min/1.73m2). The rLM equation showed the highest accuracy (P10=39%, P30=83%, P50=96%) while MDRD with a P10= 32% and CKD-EPI with P30=73%, P50=90% ranked last in the row.
Conclusion: In people with diabetes, performance of estimation equations differed depending on the assessment criterion with the revised Lund-Malmo outperforming other equations on most criteria.

Supported by: The study was funded by the University of Melbourne
Disclosure: N. Zafari: None.
62
Waist-height ratio and waist circumference are the best estimators of visceral fat in type 1 diabetes independently of diabetic nephropathy
S. Mutter1,2, E.B. Parente1,2, V. Harjutsalo1,3, A.J. Ahola1,2, C. Forsblom1,4, P.-H. Groop2,4, FinnDiane Study Group;
1Folkhälsan Research Center, Helsinki, 2Research Program for Clinical and Molecular Metabolism, University of Helsinki, Helsinki, 3National Institute for Health and Welfare, Helsinki, 4Abdominal Center, Nephrology, University of Helsinki and Helsinki University Hospital, Helsinki, Finland.
Background and aims: Rising rates of obesity in type 1 diabetes (T1D) further aggravate the already high risk of cardiovascular disease. Furthermore, obesity has also been causally linked to diabetic nephropathy (DN). Therefore, understanding the body fat distribution and its clinical implications are important. Although body composition can be analyzed by Dual-energy-X-Ray-Absorptiometry (DXA) scans, in clinical practice, there is a need for a simple and accessible tool such as anthropometric measures to estimate body composition. This study is the first to investigate body composition of individuals with T1D with regards to DN and to assess the ability of anthropometric measures to estimate visceral fat in this population.
Materials and methods: In this cross-sectional study from the nationwide Finnish Diabetic Nephropathy Study (FinnDiane), we analysed the body composition from 603 DXA scans of adults with T1D and visceral fat was measured by CoreScan. Individuals with end-stage renal disease were excluded. Linear regressions were separately performed for men (n=246) and women (n=357) with measures of body composition as the dependent and BMI, waist circumference (WC), waist-hip ratio (WHR) and waist-height ratio (WHtR) as the independent variables. The relevance ranking for each anthropometric measure was based on the z-statistics. DN was defined as an AER ≥ 20 μg/min or ≥ 30 mg/24h (albuminuria) in at least two out of three urine collections. In sub-group analyses, individuals with normal AER (171 men, 284 women) or albuminuria (75 men, 73 women) were analysed separately. Median group differences were assessed with permutation tests with 10,000 permutations.
Results: In our cohort, men were older than women (46.6 vs. 41.8 years, p=0.0008), had a higher systolic BP (140 vs. 127 mmHg, p<0.0001), but the same median BMI (25.9 kg/m2, p=0.87). The percentage of visceral fat mass to total body weight (VFM%) was higher in men (1.20 vs. 0.58%, p<0.0001). Women with albuminuria had higher WHtR (0.54 vs 0.49, p=0.0007), higher BMI (27.2 vs. 25.4 kg/m2, p=0.05) and higher VFM% (0.9 vs. 0.5%, p=0. 017) compared to those without albuminuria. Men with albuminuria had also a higher WHtR (0.55 vs. 0.50, p=0.0002), higher VFM% (1.5 vs. 1.0%, p=0.0013), but no differences in BMI (26.5 vs. 25.5 kg/m2, p=0.09). In men, overall, WHtR estimated VFM% best (z-statistics=21.4), followed by WC (z=19.3), WHR (z=15.6) and BMI (z=12.5). In women, WC (z=29.4) was the best estimator, closely followed by WHtR (z=28.0), BMI (z=19.5) and WHR (z=13.5). In both men and women, the anthropometric measures were ranked in the same order when the analyses were conducted separately in those individuals with and without albuminuria.
Conclusion: Individuals with T1D and DN, regardless of sex, have greater VFM%. Independently of DN and sex, WHtR and WC are the two best measures for VFM% estimation. From a clinical perspective, this study supports the routine measurement of the sex-independent WHtR in adults with T1D.
Supported by: Folkhälsan, Academy of Finland, Stockmann, Liv och Hälsa Soc., Novo Nordisk Fdn., Diabetes Res. Fdn.
Disclosure: S. Mutter: Grants; Folkhälsan Research Foundation, Academy of Finland (316664), Wilhelm and Else Stockmann Foundation, Liv och Hälsa Society, Novo Nordisk Foundation (NNF OC0013659) and The Diabetes Research Foundation.
63
Genetics of kidney complications in diabetes subtypes
D. Mansour Aly1, T. Tuomi2,3, L. Groop1, E. Ahlqvist1;
1Department of Clinical Sciences, Lund University Diabetes Centre, Malmö, Sweden, 2Finnish Institute for Molecular Medicine, Helsinki, Finland, 3Abdominal Center, Endocrinology, Helsinki University Central Hospital, Helsinki, Finland.
Background and aims: Diabetes is a major risk factors for diabetic kidney disease (DKD). High glucose levels are generally considered the most important risk factor. However, in a recent study where we clustered diabetes into five subtypes based on six clinical variables, the subtype with the highest insulin resistance, so called Severe Insulin Resistant Diabetes (SIRD), had the highest risk of developing DKD in spite of relatively low HbA1c. Our objective was to identify genetic variants associated with DKD and compare genetic associations in the subtypes to determine if the underlying mechanisms differ.
Materials and methods: Genome wide association analysis (GWAS) of the last eGFR during follow-up was performed using HRC imputed data from the Swedish ANDIS (All New Diabetics in Scania) cohort (N=9367) in all T2D individuals and within the SIRD subtype (N=1116). A genetic risk score (GRS) was calculated for CKD-specific SNPs and analysed by logistic regression using non-diabetic controls from the MDC study (N=2744).
Results: eFGR was strongly associated with the A allele of rs77924615 in the well-established UMOD-PDILT locus (BETA= 0.126, p=6.605x10⁻¹³) in T2d but not in SIRD (BETA=0.063, p=0.246). ). Instead, in SIRD eGFR was associated with the C allele of rs3770382 in the CTNNA2 gene (BETA=-0.218572, p= 5.5x10⁻⁸) which was not associated in all T2D. GRS analysis showed that CKD-GRSs were not associated with risk of developing SIRD (OR=1.026, p=0.47)
Conclusion: The results provide a first support for different genetic backgrounds of DKD in diabetes subtypes. . The reason could be that DKD is more dependent on insulin resistance in SIRD, whereas glucose is a main driver of disease in other subtypes. The lack of association between the CKD-GRS and SIRD supports that CKD is secondary to insulin resistance.
Disclosure: D. Mansour Aly: None.
64
Diabetic kidney disease phenotypes, mortality and incidence of vascular outcomes in a single-centre cohort with type 2 diabetes: a 13-year follow-up observational study
G. Penno1, M. Garofolo1, E. Gualdani2, D. Lucchesi1, R. Miccoli1, F. Campi1, P. Falcetta1, P. Francesconi2, S. Del Prato1;
1Department of Clinical and Experimental Medicine, University of Pisa, Pisa, 2Epidemiology Unit, Regional Health Agency, Florence, Italy.
Background and aims: Diabetic kidney disease (DKD) is a frequent and costly complication of diabetes and a leading cause of renal failure. Additionally, DKD is associated with a substantially increased burden of cardiovascular (CV) disease. In particular, non-albuminuric DKD has become the prevailing phenotype (PH) in patients with type 2 diabetes (T2D). However, it remains unclear whether its prognosis is poorer than that of other DKD PHs. We evaluated the relationship between different DKD PHs and incidence of major vascular events and all-cause mortality in subjects with T2D.
Materials and methods: This observational prospective cohort study enrolled 986 individuals with T2D in 2002-2004; subjects were followed-up for 12.9±2.7 years. Based on UACR and eGFR (CKD-EPI), each subject was classified as: no DKD (Alb-/eGFR-), albuminuria alone (Alb+/eGFR-), reduced eGFR alone (Alb-/eGFR+), or both (Alb+/eGFR+). Vital status was retrieved for all individuals on December 31, 2017 by interrogating the Italian Health Card Database; data for vascular events were available for 972 participants (98.6%), and were obtained, to the same date, in collaboration with the Regional Health Agency of Tuscany Region through hospital discharge registers (ICD-9-CM). Subsequently to the Kaplan-Meier (K-M) analyses, hazard ratios (HRs, 95% CI) for different outcomes associated with each DKD PH were assessed by unadjusted and adjusted Cox regressions.
Results: Out of 986 T2D, 779 (79.0%) had no-DKD, 144 had DKD1-2 (14.6%), 33 (3.3%) Alb-DKD and 30 (3.0%) Alb+DKD; thus, Alb-DKD accounts for 15.9% of all DKD and for 52.4% of all DKD stages ≥3. A gradually heavier CV risk profile in terms of traditional and non-traditional risk factors is distributed through the DKD PHs. Death from all-causes occurred in 230 individuals (23.3%, 18.0 x 1000 patient/years, PYs): 19.1% no-DKD, 33.3% DKD1-2, 36.4% Alb-DKD and 70.0% Alb+DKD (K-M log-rank 77.97, p<0.0001). After adjustments, HRs for death were 1.47 (95% CI 1.04-2.07) for DKD1-2, 1.22 (0.66-2.25) for Alb-DKD and 2.43 (1.46-4.06) for Alb+DKD. Major CV events occurred in 276 out of 972 subjects (28.4%, 25.2 x 1000 PYs): 25.3, 38.5, 43.8 and 43.3% through DKD PHs (K-M, p<0.0001); HRs were 1.37 (1.00-1.89) in DKD1-2, 1.73 (0.98-3.03) in Alb-DKD, to decrease to 1.11 (0.61-2.03) in Alb+DKD, due to competition with all-cause mortality. Coronary events occurred in 184 subjects (18.9%, 16.0 x 1000 PYs): 16.7, 25.9, 31.3, and 30.0% through DKD PHs (K-M, p<0.0001); HRs were 1.41 (0.96-2.07) in DKD1-2, 2.18 (1.11-4.30) in Alb-DKD, to decrease to 1.31 (0.46-3.70) in Alb+DKD. Hospitalization for heart failure occurred in 84 subjects (8.6%, 6.8 x 1000 PYs): 6.8, 14.7, 21.9 and 13.3% through DKD PHs (p<0.0001): HRs 1.91 (1.14-3.19) in DKD1-2, 2.40 (1.07-5.38) in Alb-DKD, and 1.31 (0.46-3.70) in Alb+DKD. ESRD occurred in 71 individuals (7.3%, 5.7 x 1000 PYs): 5.7, 10.5, 9.4 and 30.0% through DKD PHs (p<0.0001): HRs 1.79 (0.99-3.26) in DKD1-2, 1.28 (0.39-4.23) in Alb-DKD and 5.37 (2.46-11.72) in Alb+DKD.
Conclusion: In our cohort with a very long follow-up, the Alb-DKD PH does not have a higher risk of mortality, has a significant risk of CVD events, mainly coronary events, has the highest risk of hospitalization for heart failure, but a low risk of renal function decline to ESRD.
Disclosure: G. Penno: None.
65
Temporal trends in renal replacement therapy in people with and without type 2 diabetes: the Fremantle Diabetes study
W.A. Davis, T.M.E. Davis;
Medical School, University of Western Australia, Fremantle, Australia.
Background and aims: Most studies that have examined the relationship between diabetes and renal replacement therapy (RRT) have utilized administrative databases and/or have had limited/incomplete data. The aim of this study was to determine i) the incidence of RRT in two well-characterized community-based cohorts of people with type 2 diabetes (T2D) studied 15 years apart compared with matched cohorts without diabetes, and ii) whether incidence rate ratios (IRRs) for RRT by diabetes status have changed over time.
Materials and methods: The Fremantle Diabetes Study (FDS) Phase I (FDS1) and Phase II (FDS2) T2D cohorts and four randomly-selected, de-identified, age-, sex- and postcode-matched people without diabetes per FDS participant were followed from entry (FDS1 1993-1996, FDS2 2008-2011) until first occurrence of RRT or death or census at 5 years, whichever came first, through the validated Western Australian Data Linkage System. Five-year incidence rates (IRs) and IR ratios (IRRs) were calculated. Cox and competing risk regression models were generated to ascertain the cause-specific (cs) and subdistribution hazard ratios (HR) for incident RRT by type 2 diabetes status and FDS phase.
Results: The 13,995 participants had a mean±SD age of 64.8±11.5 years and 50.4% were males. Thirty-one (0.2%) required RRT before study entry and were excluded from analyses. During 66,120 person-years of follow-up of the remainder, 30 commenced RRT (Figure). For the T2D cohorts, the IRR (95% CI) for FDS2 compared with FDS1 was 2.85 (1.01-9.87). For the cohorts without diabetes the corresponding IRR was 5.98 (0.77-269). The IRRs for T2D versus no diabetes were lower in FDS2 than FDS1 (9.74 (3.84, 27.8) versus 20.5 (2.29, 968); P=0.54 by Breslow-Day test). In the Cox model which included adjustment for age as the timeline and with the FDS2 no diabetes cohort as reference, the highest csHRs (95% CIs) for RRT were in FDS2 participants with T2D (10.1 (4.20, 24.5)), followed by FDS1 T2D participants (3.17 (1.01, 10.0)) and FDS 1 no diabetes (0.16 (0.02, 1.28). Further adjustment for sex, Charlson Comorbidity Index and time from start of the respective phase reduced these to 7.17 (2.09, 17.7), 2.22 (0.69, 7.27) and 0.16 (0.02, 1.32), respectively, with modest modification after adjusting for the competing risk of death. The mean age when RRT commenced showed no statistically significant difference by FDS Phase or T2D status (Bonferroni-corrected P>0.05), but the oldest age at commencement was 69.9 years for FDS1 and 85.4 years for FDS2.
Conclusion: The use of RRT is infrequent but has increased over time in community-based Australians, especially in those with T2D, probably reflecting changes in eligibility criteria including age.

Supported by: Raine Foundation, University of Western Australia; Australian NHMRC Project Grants
Disclosure: W.A. Davis: None.
66
Long-term mortality among kidney transplant recipients with vs without diabetes: a nationwide cohort study in the United States
J.L. Harding1, M.E. Pavkov2, Z. Wang1, S.R. Benoit2, N.R. Burrows2, G. Imperatore2, A. Albright2, R.E. Patzer1;
1Department of Surgery, Emory University, Atlanta, 2Division of Diabetes Translation, Centers for Disease Control and Prevention, Atlanta, USA.
Background and aims: Diabetes is the leading cause of end-stage kidney disease (ESKD). Once diagnosed with ESKD, the preferred treatment is kidney transplantation. However, little is documented about the role the two main types of diabetes (type 1 and type 2 diabetes (T1D and T2D)) play in modifying prognosis among transplant recipients. Therefore, in this study we compare long-term mortality among US kidney transplant recipients with T1D, T2D, and non-diabetic (ND) causes of ESKD.
Materials and methods: Between Jan 2000 and Aug 2018, we included 254,188 first-time single kidney transplant recipients aged ≥18 years identified from the US Renal Data System, a national registry of all US citizens treated for ESKD. Transplant recipients were followed from transplant date until 10 Aug 2018 or death date, whichever occurred first. Diabetes status was defined using ICD-9-CM and ICD-10 codes as indicated on form CMS2728. Mortality status was obtained from the Social Security Administration mortality register. Cox regression models computed risk of death associated with T1D and T2D relative to ND. Models were adjusted for age, sex, race, pre-ESKD nephrology care, ESKD duration, donor factors (type (living or deceased), age, race and sex), transplant failure, and comorbidities. Standardized mortality ratios (SMR) compared death rates between the transplant population (by diabetes status) and the year (2000-2017) and age-matched general US population, obtained from the National Center for Health Statistics. Trends in SMRs over time were assessed using Joinpoint regression and annual percent changes (APC).
Results: During the study period, a total of 72,197 (28.4%) deaths occurred over a median follow-up of 6.3 (IQR: 2.9-10.5) years. In adjusted models, relative mortality risk was highest among people with T1D (Hazard Ratio: 1.74, (95%CI: 1.65-1.83)) and then T2D (1.50 (1.45-1.54)), as compared to ND. Between 2000 and 2017, SMRs significantly declined for ND, T1D and T2D groups, Figure 1. However, in 2017 SMRs were 2.38 (2.31-2.45), 6.55 (6.07-7.06), and 3.82 (3.68-3.98), for ND, T1D, and T2D, respectively, indicating continued excess mortality risk among transplant recipients as compared with the general population.
Conclusion: In the US, mortality among people receiving a kidney transplant has declined since 2000 but remains approximately 2 to 7-fold higher compared to the general population with highest rates among diabetes-related ESKD. Additional research is needed to identify effective interventions to further reduce mortality in those with diabetes who receive a kidney transplant, especially those with T1D.

Disclosure: J.L. Harding: None.
OP 12 NAFLD: Is it all about the liver?
67
Fatty liver, irrespective of ethnicity, is associated with reduced insulin clearance and hepatic insulin resistance in obese youths
D. Trico1,2, A. Galderisi3, A. Mari4, N. Santoro5, S. Caprio5;
1University of Pisa, Pisa, Italy, 2Sant’Anna School of Advanced Studies, Pisa, Italy, 3University of Padova, Padova, Italy, 4National Research Council, Padova, Italy, 5Yale School of Medicine, New Haven, USA.
Background and aims: Non-Alcoholic Fatty Liver (NAFL) is the most common chronic liver disease in Western countries and identifies people at high risk to develop metabolic and cardiovascular disease. Fatty liver has been associated with reduced endogenous insulin clearance (EIC) and with hepatic insulin resistance (HIRI), which are early features of type 2 diabetes. These relationships, however, might be differentially affected by the ethnic background, as populations of African ancestry typically have reduced intrahepatic fat content (HFF%) but impaired EIC. Therefore, the aim of this study was to evaluate whether intrahepatic fat accumulation contributes to impaired EIC and HIRI to the same extent in the three most prevalent racial and ethnic groups in the United States.
Materials and methods: We analyzed cross-sectional and longitudinal data from a large and well-characterized multi-ethnic cohort of overweight and obese adolescents (266 boys and 366 girls, age 13.4 ± 3.1 years, BMI z-score 2.1 ± 0.7). The HFF% was quantified by a validated magnetic resonance imaging (MRI) method at baseline and after a median follow-up of 2 years. Insulin secretion rate (ISR), EIC and HIRI were assessed during 3-hour, 9-point oral glucose tolerance tests (OGTTs) by modelling glucose, insulin, and C-peptide data.
Results: African Americans (n=172) exhibited the lowest HFF% (A) and a prevalence of NAFL less than half of Caucasians (n=229) and one-third of Hispanics (n=231) (B). Furthermore, African Americans had lower EIC (C) and glucose-stimulated ISR, but similar HIRI (F) and plasma insulin levels. EIC and HIRI declined across group-specific HFF% tertiles (D, G) and were markedly lower in individuals with NAFL (E, H) in all ethnic groups. Consistently, the HFF% correlated with EIC (std. β= -0.13, p=0.0003) and HIRI (std. β=0.17, p<0.0001), irrespective of the ethnic background, after adjustment for age, sex, ethnicity, adiposity, pubertal status, and plasma glucose levels. African Americans showed lower susceptibility to intrahepatic fat accumulation at follow-up. In fact, the prevalence of adolescents whose HFF% remained stable (change < ±1%) was two-fold higher in African Americans (52%) than in Caucasians (28%) and Hispanics (20%) (p=0.036). Nevertheless, changes in HFF% over time were associated with changes in EIC (r= -0.25, p=0.02) and HIRI (r=0.22, p=0.04) across all groups, without ethnic differences.
Conclusion: This study demonstrates that intrahepatic fat accumulation is associated with reduced EIC and HIRI in obese youths, irrespective of their ethnic background. Our data dissect the metabolic characteristics of populations of African ancestry and provide novel evidence about the pathogenetic role of liver steatosis in the development of hepatic metabolic abnormalities contributing to the etiology of type 2 diabetes.

Clinical Trial Registration Number: NCT01966627
Supported by: EFSD Future Leaders Mentorship Programme, EFSD Rising Star Fellowship
Disclosure: D. Trico: None.
68
Prevalence of non-alcoholic steatohepatitis in a cohort of subjects undergoing bariatric surgery
E. Lembo, M.F. Russo, G. Mingrone;
Università Cattolica del Sacro Cuore - Sede di Roma, Rome, Italy.
Background and aims: Non-alcoholic steatohepatitis (NASH) represents one of the stages of fatty liver disease (NAFLD) with a very high risk to evolve in cirrhosis and hepatocellular-carcinoma. Currently, the only diagnostic method is a liver biopsy which, for economic reasons and for the risks associated with the procedure, is not always performed. Our aim is to find a non-invasive predictor that helps us to identify high-risk patients in whom to perform a liver biopsy.
Materials and methods: We evaluated a cohort of 309 subjects, aged between 19 and 69 years, with an average BMI of 49.23±8.63 kg/m2, who underwent liver biopsy during bariatric surgery. 31.8% of the subjects had type 2 diabetes mellitus (DM2) with an average HbA1c of 57±7 mmol/mol.Liver biopsy was classified according to Kleiner's NAFLD Activity Score (NAS) that has a range from 0 to 8: NAS≥ 3 is indicative of NASH. The most common non-invasive liver damage tests were calculated: NAFLD Fibrosis Score (NFS), AST/ALT ratio, AST to Platelet ratio (APRI), fibrosis 4 score (FIB4). Spearman's correlation analysis between the above-mentioned scores and NAS was performed. We also run a neural network analysis (ANN) to identify the predictors of NASH with the following variables: presence of DM2, HbA1c, HOMA IR index, OGIS, NFS, AST/ALT, APRI, FIB4.
Results: The prevalence of NASH in the 309 liver biopsies was 69.2%: 58.7% with NAS between 3 and 4, 10.5% with NAS between 5 and 6. No NAS ≥7 was found. In the sample of patients with DM2 the prevalence of NASH was 82.1%: 68.4% with NAS between 3 and 4 and 13.7% with NAS between 5 and 6. Spearman's correlation analysis on the whole sample between the non-invasive tests and the NAS shows rs equal to 0.302 with P<0.01 for APRI; rs equal to -0.205 with P<0.01 for AST/ALT; rs equal to 0.143 with P<0.05 for FIB-4. The ANN highlighted specificity >70% in excluding NASH (NAS 0-1 and 2). The specificity was 54% for NAS=3; 79% for NAS=4; 61% for NAS=5 and 90% for NAS=6.
Conclusion: DM2 remains an important risk factor for NASH independently of the severity of this latter. None of the non-invasive tests currently used, including NAFLD Fibrosis Score, shows a good correlation with the histological stages of NASH. Our statistical model well predicts the absence of NASH, but it is unable to discriminate among severity stages, apart for NAS 5.

Disclosure: E. Lembo: None.
69
Hepatic fibrosis but not steatosis is independently associated with diabetic kidney disease in non-obese patients with type 2 diabetes
D. Seo1, Y.-H. Lee2, S. Seo1, Y. Cho1, S. Ahn1, S. Hong1, Y. Choi3, B. Huh3, S. Kim1;
1Inha University School of Medicine, Incheon, 2Yonsei University College of Medicine, Seoul, 3Huh's Diabetes Center, Seoul, Republic of Korea.
Background and aims: Recent studies investigated the association between nonalcoholic fatty liver disease (NAFLD) and diabetic kidney disease (DKD) in patients with type 2 diabetes mellitus (T2DM) but the results are inconclusive. Here we aimed to investigate the association between NAFLD and DKD in a large cohort of participants with T2DM.
Materials and methods: In this cross-sectional study, a total of 3,439 patients (1,710 men and 1,729 women) with T2DM were recruited from the Seoul Metabolic Syndrome cohort between 2003 and 2016. NAFLD was defined by ultrasonographic detection of steatosis in the absence of other liver diseases and advanced fibrosis was defined as FIB4 index < 1.45. DKD was defined as an estimated glomerular filtration rate (eGFR) of ≤60 mL/min/1.73 m2.
Results: Among the entire population (mean age 57.4 ± 10.3 years and duration of diabetes 7.7 ± 7.1 years), 1869 (54.3%) subjects had NAFLD and 754 (40.3%) subjects had advanced fibrosis among those with NAFLD. The prevalence of DKD was higher in those with advanced fibrosis than those with no NAFLD and liver steatosis (no NAFLD vs. liver steatosis vs. advanced fibrosis: 7.0% vs. 4.5% vs. 11.9%, p <0.001). After adjustment for potential confounders including age, gender, duration of diabetes, smoking, waist circumference, blood pressures, medications, Kitt, HgbA1c, triglyceride and HDL cholesterol, advanced fibrosis, but not liver steatosis, was associated with increased risk of DKD (odds ratio [OR] 1.75; 95% confidence interval [CI] 1.08-2.86; p = 0.034) in patients with body mass index (BMI) < 25 kg/m2, but no association was found in those with BMI ≥ 25 kg/m2.
Conclusion: This study suggests that advanced liver fibrosis, a severe form of NAFLD, was independently associated with increased risk of DKD in patients with T2DM and BMI < 25 kg/m2.
Disclosure: D. Seo: None.
70
Diagnosing at-risk NASH: NIS4 performances in patients with escalating number of metabolic risk factors
R. Hanf1, V. Ratziu2, S.A. Harrison3, S. Francque4, Q.M. Anstee5, N. Dam1, Y. Hajji1, A. Roudot1, J. Brozek1, B. Staels6, D.W. Hum7, P. Birman1, S. Hosmane7, P. Chaumat1, A.J. Sanyal8;
1GENFIT SA, Loos, France, 2Hôpital Pitié-Salpêtrière, Paris, France, 3Summit Clinical Research, San Antonio, USA, 4Department of Gastroenterology and Hepatology, Antwerp University Hospital, Antwerp, Belgium, 5Newcastle University, Freeman Hospital, Newcastle Upon Tyne, UK, 6Université de Lille, INSERM, Pasteur, Lille, France, 7GENFIT CORP, Cambridge, USA, 8Virginia Commonwealth University, Richmond, USA.
Background and aims: Metabolic risk factors or features of metabolic syndrome (MetS) are important risk factors associated with NASH. The aim was: i) to assess the association of metabolic risk factors and prevalence of at-risk NASH (i.e. NAFLD activity score ≥4 and Fibrosis stage ≥2) and ii) to assess overall diagnostic performance of NIS4, a recently developed non-invasive test for detection of at-risk NASH, in patients with escalating numbers of metabolic risk factors.
Materials and methods: Patients (N=2363) screened for the NASH RESOLVE-IT trial with centrally-read liver biopsy were scored for histological activity (NAS) and fibrosis. Data on metabolic risk factors as defined by the IDF were collected: central obesity, dyslipidemia, raised blood pressure and raised fasting plasma glucose or diagnosed type 2 diabetes (T2D). Chi2 test was used to compare prevalence of at-risk NASH in patients with ≥3 vs <3 metabolic risk factors and in patients with increasing numbers of metabolic risk factors. Univariate logistic regressions were performed for ranking of metabolic risk factors as predictors for at-risk NASH. Diagnostic performance of NIS4 to detect at-risk NASH (AUROC) in subpopulations was compared using DeLong test.
Results: Presence of ≥3 metabolic risk factors (N=1666) was significantly associated with higher prevalence of at-risk NASH as compared to patients with <3 risk factors (N=697) (59% vs 38%; OR=2.4 [2.01-2.88]; p<0.0001). Prevalence of at-risk NASH increased with the number of risk factors: 13% in patients without (4/32; comparator), 34% in patients with 1 (57/167; p<0.05), 41% in patients with 2 (202/498; p<0.01), 51% in patients with 3 (419/827; p<0.0001) and 68% in patients with 4 metabolic risk factors (569/839; p<0.0001). Univariate logistic regressions ranked raised FPG or diagnosed T2D as the metabolic risk factor most strongly associated with prevalence of at-risk NASH by p-value (OR=2.5 [2.12-2.96]; p<10-26), followed by raised blood pressure (OR=1.96 [1.6-2.39]; p<10-10), dyslipidemia (OR=1.73 [1.45-2.07]; p<10-8) and finally central obesity (OR=2.0 [1.35-2.96]; p<0.001). Among patients with NIS4 data (N=469), performance of NIS4 to identify at-risk NASH was comparable in patients with ≥3 (AUC=0.81) or <3 risk factors (AUC=0.85; p=0.29) and in patients with 1 (18/32; AUC=0.89), 2 (40/78; AUC=0.83), 3 (98/169; AUC=0.81) or 4 (99/184; AUC=0.79) metabolic risk factors (p>0.05 for all comparisons).
Conclusion: The prevalence of at-risk NASH increases with the number of metabolic risk factors. Impaired FPG or diagnosed T2D is the strongest predictors for at-risk NASH. NIS4 showed high diagnostic accuracy for at-risk NASH regardless of number of metabolic features, supporting the use of NIS4 to screen individuals with metabolic risk factors for at-risk NASH identification.
Clinical Trial Registration Number: NTC02704403
Disclosure: R. Hanf: Employment/Consultancy; GENFIT SA. Stock/Shareholding; GENFIT SA.
71
Role of patatin-like phospholipase domain-containing 3 gene for hepatocellular lipid content in the severe insulin-resistant diabetes cluster
O.P. Zaharia1,2, K. Strassburger1,2, B. Knebel1,2, Y. Kupriyanova1,2, Y. Karusheva1,2, M. Wolkersdorfer3, K. Bódis1,4, D. Markgraf1, V. Burkart1,2, J.-H. Hwang1,2, J. Kotzka1,2, H. Al-Hasani1,2, J. Szendroedi1,4, M. Roden1,4, GDS Group;
1German Diabetes Center, Düsseldorf, Germany, 2German Center for Diabetes Research (DZD), München-Neuherberg, Germany, 3Landesapotheke Salzburg, Salzburg, Austria, 4Division of Endocrinology and Diabetology, Medical Faculty, Heinrich Heine University, Düsseldorf, Germany.
Background and aims: The rs738409(G) single-nucleotide polymorphism (SNP) in the patatin-like phospholipase domain-containing 3 (PNPLA3) gene associates with increased risk of nonalcoholic fatty liver disease (NAFLD) and its progression. As one of the recently-described diabetes subgroups (clusters) specifically relates to NAFLD, this study examined whether this SNP differently associates with hepatic lipid content (HCL) and tissue-specific insulin sensitivity in patients with recent-onset diabetes mellitus.
Materials and methods: A total of 917 participants of the German Diabetes Study (GDS) underwent genotyping, hyperinsulinemic-euglycemic clamp tests with stable isotopic tracer dilution and 1H magnetic resonance spectroscopy. Cluster analyses using age, BMI, glycemia and homeostasis model estimates (HOMA-IR, -B) and diabetes-related autoantibodies identified distinct diabetes subgroups.
Results: Across the study population, the G allele associated with increased HCL (β=0.36, p=0.01) and increased peripheral insulin sensitivity (β=0.06, p=0.03), independent of age, sex and BMI. The severe insulin resistant diabetes (SIRD) cluster had the lowest whole-body insulin sensitivity compared to severe insulin deficient (SIDD), moderate obesity-related (MOD), moderate age-related (MARD) and severe autoimmune diabetes clusters (SAID; all p<0.001). Interestingly, SIRD presented with higher prevalence of the rs738409(G) SNP compared to the other diabetes clusters and the glucose-tolerant control group (p<0.05). Also, HCL was higher in SIRD [13.6 (5.8;19.1)%] compared to MOD [6.4 (2.1;12.4)%, p=0.028], MARD [3.0 (1.0;7.9)%, p<0.001], SAID [0.4 (0.0;1.5)%, p<0.001] and the glucose tolerant group [0.9 (0.4;4.9)%, p<0.001]. Although the PNPLA3 polymorphism did not directly associate with whole-body insulin sensitivity or HCL in SIRD, the G allele carriers had higher circulating free fatty acid concentrations and greater adipose-tissue insulin resistance compared to non-carriers (both p<0.001).
Conclusion: Patients of the severe insulin resistant diabetes cluster are more frequently carriers of the rs738409(G) variant. The associated adipose tissue insulin resistance and excessive lipolysis likely accelerate NAFLD and diabetes progression in this cluster.
Clinical Trial Registration Number: NCT01055093
Supported by: BMBF, DZD
Disclosure: O.P. Zaharia: None.
72
Evaluation of determinants of hepatic insulin clearance: a Mendelian randomisation study
A. Lamprinou1, J. Machann2, F. Schick2, S.S. Eckstein3, C. Dalla Man4, R. Visentin4, N. Stefan1, A.L. Birkenfeld1, A. Peter5, H.-U. Häring6, A. Fritsche1, M. Heni1, R. Wagner1;
1Internal medicine IV-Endocrinology, Diabetology and Nephrology, University Hospital of Tuebingen, Tuebingen, Germany, 2Section on Experimental Radiology, Department of Diagnostic and Interventional Radiology, University Hospital of Tuebingen, Tuebingen, Germany, 3Institute for Diabetes Research and Metabolic Diseases of the Helmolz Centre Munich, University Hospital of Tuebingen, Tuebingen, Germany, 4Department of Information Engineering, University of Padua, Padua, Italy, 5Diagnostic Laboratory Medicine, Institut of Clinical Chemistry and Pathobiochemistry, University Hospital of Tuebingen, Tuebingen, Germany, 6Institute for Diabetes Research and Metabolic Diseases of the Helmolz Centre Munich h, University Hospital of Tuebingen, Tuebingen, Germany.
Background and aims: Besides insulin resistance, type 2 diabetes associates with decreased insulin clearance. Most insulin degradation occurs in the liver. The magnitude of this effect is closely related to systemic insulin sensitivity. As insulin resistance is often accompanied by fatty liver, we investigated whether there is a causal link between liver fat accumulation and hepatic insulin clearance (HIC). We also investigated the causal connection between features of the metabolic syndrome and HIC.
Materials and methods: We computed HIC using data from oral glucose tolerance tests in 3391 non-diabetic individuals and the “Oral C-peptide and Insulin Minimal Models”. Liver fat was quantified by 1H-MR-spectroscopy in 1211 participants. We performed Mendelian randomization analyses (MR-Egger) to test for causal determination of HIC by liver fat and potentially related traits using established single nucleotide polymorphisms (SNPs; 115 for liver fat, 155 alanine-aminotransferase, 37 insulin sensitivity, 38 insulin secretion, 72 fasting insulin, 5285 Body mass index, 270 waist circumference, 442 triglycerides, 620 HDL-Cholesterol, 193 C-reactive protein).
Results: HIC associated inversely with liver fat content (β=-0.1±0.03, p<0.003) and insulin sensitivity (β=0.6±0.03, p < 0.0001). Both liver fat content and HIC were independently associated with insulin sensitivity (β=-0.2±0.03 and β=0.1±0.02 respectively, both p < 0.0001). Neither liver fat content nor alanine-aminotransferase were causally linked to HIC (p=0.6 and 0.2, respectively), as indicated by the Mendelian randomization. BMI-related SNPs were causally associated with HIC (β=-0.2±0.02, p<0.001) but not waist circumference SNPs (β=-0.1±0.08, p=0.06). Both, genetically determined insulin sensitivity and fasting insulin were causally related to HIC (β=0.3±0.1, p=0.04 and β=-0.4±0.1, p=0.005 respectively). C-reactive protein and HDL levels were causally associated with HIC in the MR-Egger analysis, but in a direction opposite to the trait’s association with HIC (β=0.1±0.07, p=0.03 and β=-0.09±0.03, p=0.01 respectively).
Conclusion: Hepatic steatosis does not causally influence hepatic insulin extraction. Other components of the metabolic syndrome such as inflammation and low HDL cholesterol seem to compensate peripheral hyperinsulinemia by increasing hepatic insulin extraction.
Disclosure: A. Lamprinou: None.
OP 13 Diabetic retinopathy: see what's new?
73
Assessing retinopathy screening frequency in adolescents with type 1 diabetes using Markov model
A.S. Januszewski1, V. Velayutham2,3, P. Benitez-Aguirre2,3, M. Craig2,3, G. Liew2,4, Y. Cho2,3, A.J. Jenkins1, K. Donaghue2,3;
1University of Sydney, Camperdown, 2The Children’s Hospital at Westmead, Westmead, 3University of Sydney, Sydney, 4University of Sydney, Westmead, Australia.
Background and aims: Current ISPAD guidelines recommend diabetic retinopathy (DR) screening to start at age 11 yrs with Type 1 diabetes (T1D) duration of 2 to 5 yrs at 1-2 year intervals. There is a growing body of evidence suggesting that the DR screening in T1D can be performed less frequently.
Materials and methods: The time-course of DR progression was assessed by analysis of repeated retinal images from 2,169 adolescents (baseline (mean±SD): age 13.1±2.1 yrs, HbA1c 8.5±1.4%, T1D duration 5.4±2.9 yrs, follow-up time 5.3±3.6 yrs) with at least two assessments by seven-field stereoscopic retinal photography between 1990 and 2018. DR was graded using the Early Treatment Diabetic Retinopathy Study (ETDRS) scale. As DR screening results represent observations of a continuous-time process at arbitrary / nonregular intervals we have used Markov model to calculate probabilities of DR stage change over time, for age, duration and decade of diabetes diagnosis, sojourn time for each stage and hazard ratio (HR) of DR stage transition per 1% of HbA1c increase.
Results: DR progressed to severe non-proliferative (SNP) DR or worse in 11 of 2,169 adolescents (0.5%). Probability of transition from no DR to severe NPDR or above over 5 yrs was 0.1% and over 15 yrs 1.2%. Probability of transition from moderate NPDR to severe NPDR or above was respectively 16.1% and 40.9%. Sojourn time in no DR stage was 4.9yrs (2.9yrs with HbA1c>9.5% and 7.8yrs with HbA1c≤7.5%). HRs for transition per 1% HbA1c increase were: 1.25 (1.18-1.33) from no DR to minimal NPDR, 1.13 (1.05-1.23) from minimal to mild NPDR, 1.38 (1.20-1.59) from mild to moderate NPDR and 1.30 (0.95-1.78) from moderate to severe NPDR or above. Progression was greater for higher HbA1c, older age and longer duration at first screening and earlier calendar year of diabetes diagnosis (Table 1).
Conclusion: Our data supports the approach of less frequent DR screening in this group of adolescents with T1D, especially without any DR at initial screening, younger age and shorter duration, and lower HbA1c. Although progression of DR to advanced stages is rather slow in adolescents, impaired glycaemic control dramatically increases it.

Disclosure: A.S. Januszewski: None.
74
One-point HbA1c value does not always reflect current retinopathy while ΣexcessA1C, an index of total glycaemic exposure, does in type 1 diabetes: a DCCT/EDIC subgroup analysis
A. Hirose1,2, Y. Maeda1,3, M. Minami3, A. Goto4, K. H Sonoda5, S. Kitano2, Y. Uchigata6;
1Minami Diabetes Clinical Research Center, Fukuoka, 2Diabetes Ophthalmology, Diabetes Center, Tokyo Women's Medical University, Tokyo, 3Clinic Masae Minami, Fukuoka, 4Graduate School of Data Science, Yokohama City University, Yokohama, 5Ophthalmology, Graduate School of Medical Sciences, Kyushu University, Fukuoka, 6Medicine, Diabetes Center, Tokyo Women's Medical University, Tokyo, Japan.
Background and aims: Why do some diabetic patients with high HbA1c values (A1Cs) measured at given time points (one-point A1Cs) have no retinopathy, while others with low values do have it? It seems that one-point A1C does not always reflect current retinopathy. Previously we demonstrated that ΣexcessA1C, an index of total excess glycemic exposure, could substantially predict retinopathy in type 1 diabetes. To show this, it was crucial to study only patients with A1C data for the entire period after the onset of diabetes to exclude the unknown disturbing effect of metabolic memory. To compare the prediction capability for retinopathy development of one-point A1C with that of ΣexcessA1C, we performed subgroup analyses of the DCCT/Epidemiology of Diabetes Interventions and Complications (EDIC) database.
Materials and methods: We employed a window of one year for A1C and retinopathy data (target date +-0.5 year). A given time point at the end of X years after the onset of diabetes was denoted “yearX”. To examine only selected cases, namely those who had A1C data for the entire period of hyperglycemia, we studied patients of primary prevention with the shortest diabetes duration at DCCT baseline (≤14 months). We included only patients who had no missing data of retinopathy in all three periods (year5, year9 and year13). Retinopathy was evaluated by steps on the severity scale of the final Early Treatment Diabetic Retinopathy Study, and it was defined as development positive (DR+) if a patient was step 2 or higher; otherwise it was considered negative. ƩexcessA1C was calculated by adding all the values of each yearly A1C - 6.5 (%; = 48 mmol/mol) from year1 to a given year. To compare the prediction capabilities of A1C and ΣexcessA1C at year5, year9 and year13 for DR+, AUCs of the receiver-operating characteristic curves were calculated, and those of A1C and ΣexcessA1C were compared by the DeLong test. Two-sided P value<0.05 was considered significant. The timepoints of patients when they moved from DCCT into EDIC were examined.
Results: The 70 cases that fulfilled the criteria (mean duration: 12.2 months at year1) showed 33, 45 and 54 DR+ at year5, year9 and year13, respectively. At year5, both A1C and ΣexcessA1C showed moderate capabilities of prediction for DR+ at a similar level (AUC=0.6704 vs 0.7019, respectively; P=0.3493 for difference). But at year9, A1C showed little capability for prediction while ΣexcessA1C showed a substantial one, significantly better than A1C’s (AUC=0.5480 vs 0.7333, respectively; P=0.0001 for difference). The same was true at year13 (AUC=0.5816 vs 0.7830, respectively; P=0.0012 for difference). Most patients moved from DCCT into EDIC between year5 and year9, which was thought to be related to the changes in their glycemic controls.
Conclusion: One-point A1C does not always reflect current retinopathy, especially after the changes in glycemic control, while ΣexcessA1C does, even after these changes, since retinopathy results from long-term glycemic exposure after the onset of type 1 diabetes.
Disclosure: A. Hirose: Grants; Novartis Pharma K.K.
75
Cerebral small-vessel disease is associated with the severity of diabetic retinopathy in type 1 diabetes
M.I. Eriksson1,2, P. Summanen1,3, D. Gordin1,2, C. Forsblom1,2, S. Shams4,5, R. Liebkind6, T. Tatlisumak6,7, J. Putaala6, P.-H. Groop1,2, J. Martola4,8, L.M. Thorn1,2;
1Folkhälsan Research Center, Helsinki, Finland, 2Department of Nephrology, University of Helsinki and Helsinki University Hospital Abdominal Center, Helsinki, Finland, 3Department of Ophthalmology, University of Helsinki and Helsinki University Hospital, Helsinki, Finland, 4Department of Radiology, Karolinska University Hospital and Karolinska institute, Stockholm, Sweden, 5Department of Radiology, Stanford University Hospital, Stanford, USA, 6Department of Neurology, Helsinki University Hospital, Helsinki, Finland, 7Department of Neurology, University of Gothenburg and Sahlgrenska University Hospital, Gothenburg, Sweden, 8Department of Radiology, Helsinki University Hospital, Helsinki, Finland.
Background and aims: Cerebral small-vessel disease (SVD) is a common finding in neurologically asymptomatic individuals with type 1 diabetes. The retinal vasculature is thought to mirror the vasculature of the brain, but there are limited data on this association in type 1 diabetes. Our aim was to further study associations between severity of diabetic retinopathy (DR) and cerebral SVD in type 1 diabetes.
Materials and methods: We enrolled 191 participants with type 1 diabetes and 30 healthy age- and sex-matched control subjects (median age 40 [33-45] years; 53% female; mean HbA1c 66±12 mmol/mol, duration 22 [18-31] years) as part of the Finnish Diabetic Nephropathy Study. All participants underwent a clinical investigation, brain MRI, and fundus imaging, which were evaluated according to the diabetic retinopathy (DR) severity scale (ETDRS). Brain MRIs were assessed for signs of SVD (white-matter hyperintensities, cerebral microbleeds [CMBs], and lacunar infarctions) and analyzed in relation to DR severity.
Results: We observed SVD in 67 (35%), CMB in 45 (24%), white-matter hyperintensities in 44 (23%), and lacunes in 4 (2%) participants with type 1 diabetes. Of the controls, only three had SVD and none of them had signs of retinopathy. In type 1 diabetes, the participants with cerebral SVD had higher median ETDRS scores and a higher prevalence of proliferative DR than those without SVD (35 [20-61] vs 20 [20-35], p=0.035 and 34 vs 9%, p=0.002). Proliferative DR remained significant after adjustment for age, systolic BP, and albuminuria (OR 2.65 [95% CI 1.08-6.49]), however ETDRS was no more significant in the adjusted analyses. Participants with ETDRS score >35 had higher prevalence (40 vs. 17%, p=0.001) and number (p<0.001) of CMBs than those with ETDRS score ≤35, while no association was observed for white-matter hyperintensities or lacunes. Participants with CMBs had a higher median ETDRS score (35 [20-64] vs 20 [20-35], p=0.042) and higher prevalence of proliferative DR (29 vs 10%, p=0.002). The ETDRS scores increased by number of CMBs and was 20 (20-35) in participants with 0 CMB, 20 (20-45) in those with 1-2 CMBs, and 64 (43-70) in those with >2 CMBs (p=<0.001). An independent association with >2 CMBs was found for both the ETDRS score (OR 1.05 [95% CI 1.01-1.08], p=0.005) and proliferative DR (OR 8.81 [95% CI 2.01-38.5], p=0.004) in separate analyses adjusted for age, albuminuria, and systolic BP.
Conclusion: Presence of cerebral SVD on brain MRI, particularly CMBs, is associated with the severity of DR. Fundus imaging may serve as a mirror into the brain for assessment of SVD and may specifically reflect the burden of CMBs.
Supported by: Folkhälsan Research Foundation, Academy of Finland, Stockmann Foundation, EVO governmental grants
Disclosure: M.I. Eriksson: Grants; Medical Society of Finland.
76
Molecular and functional effects of methylglyoxal on human microvascular retinal cells
M. Aprile1, A. Leone2, F. Scognamiglio1, C. Nigro2, A. Nicolò2, C. Perfetto1, S. Cataldi1, V. Costa1, C. Miele2, A. Ciccodicola1;
1National Research Council (CNR), IGB-ABT, Naples, 2National Research Council (CNR), URT GDD IEOS, Naples, Italy.
Background and aims: One of the primary events of diabetic retinopathy (DR) is the functional impairment of microvascular cells. Methylglyoxal (MGO) - reactive glycolysis by-product - mediates hyperglycemia-induced alterations in macrovascular endothelial cells, but its effects on retinal microvascular cells have not yet been clarified. We evaluated MGO effect on human retinal endothelial cells (hRECs) in terms of cell viability, angiogenic-capacity and transcriptomic identity, aiming to define miRNA/mRNA networks and molecular determinants mediating MGO-induced glucotoxicity in DR.
Materials and methods: Commercially available primary hRECs were exposed to increasing doses of MGO at different times and cell viability was assessed by MTT assay. Migration ability (transwell assay) and angiogenic capacity (tube formation assay) were analysed in hRECs exposed to 500μM MGO for 72h. Transcriptome and miRNome of MGO-exposed hRECs were analyzed (in triplicate) by RNA-Seq (~60M paired-end reads/sample) and smallRNA-Seq (10M single-end reads/sample). TopHat v2 and RNA-SeqGUI were used for mapping and secondary analysis; KEGG, DAVID and Panther databases to infer biological significance. Small-RNAseq data were analyzed by iMir package and miRPathDB 2.0. Enrichment for transcription factors (TFs) binding sites in differentially expressed (DE) genes was inferred using public ENCODE ChIP-Seq data.
Results: hRECs exposure to 500μM MGO for 72h does not compromise cell viability but impairs both cell migration and tube formation capacity by ~30% (p≤0.05) and ~70% (p≤0.05), respectively. Transcriptome analysis revealed that MGO exposure increases expression of ~1200 genes encoding mainly transcriptional regulators (~25%, p=9.1e-46) and apoptosis-related genes (~7%, p=3.6e-6). Conversely, MGO exposure causes downregulation of ~500 genes encoding membrane glycoproteins (~36.5%, p=4.2e-12), cell cycle control factors (~13%, p=1.1e-19) and cell adhesion molecules (~11%, p=2.2e-9), including integrins (~5%, p=1.5e-6). Furthermore, enrichment of TF binding in promoters of DE genes indicated a robust network of structural proteins regulated by a small subset of TFs deranged in hRECs upon MGO exposure, such as such as Nrsf, Ctcf and Znf263. MiRNome analysis revealed ~70 DE miRNAs following MGO treatment. Interestingly, most of the DE genes involved in cell cycle, insulin, PI3K-Akt, FOXO, P53 (~60%) are predicted targets of DE miRNAs that potentially represent putative mediators of MGO-induced transcriptional perturbation. Experimental assays to address whether selected protein-coding genes and miRNAs mediate MGO-induced glucotoxicity in hRECs are in progress
Conclusion: Our work reveals for the first time MGO as mediator of hyperglycemia-induced damage in microvascular retinal cells by reduction of cell motility and angiogenic capacity, as well as by extensive perturbation of cell transcriptional program. MGO directly promotes the expression of transcriptional regulators, whereas suppressing factors involved in cell cycle and cell-cell interactions. Aiming to attenuate the pathogenic impact of MGO on DR progression we are also exploiting the possibility of targeting candidate mRNAs/miRNAs to restrain MGO-induced detrimental effects on hRECs.
Supported by: EFSD/Boehringer Ingelheim European Research Programme in Microvascular Complications of Diabetes
Disclosure: M. Aprile: None.
77
The role of AMPK in the mechanism of ischaemic retinopathy: an in vitro study
M.N. Dátilo, G.P. Formigari, J.B. Lopes de Faria, J.M. Lopes de Faria;
Faculty of Medical Sciences, State University of Campinas, Campinas, Brazil.
Background and aims: Ischemic proliferative retinopathy is the late stage of retinopathies caused by different diseases, such as diabetes and retinopathy of prematurity. Retinal proliferative retinopathy is characterized by abnormal neovascularization induced by hypoxia and may lead to irreversible blindness, and a better understanding of how to control neovascularization remains an unmet medical need. AMP-activated protein kinase (AMPK) -a cellular energy sensor- is involved in intracellular homeostasis. Recent studies have demonstrated the role of AMPK in tumor progression and cerebral angiogenesis after ischemia via hypoxia-inducible factor-1α (HIF-1α) modulation. Polyunsaturated fatty acids, such as docosahexaenoic acid (DHA), are a structural component of the retina. Previous studies showed that DHA is implicated in the amelioration of diabetic retinopathy by inhibiting inflammation of retinal endothelial cells. Recent evidence has shown that DHA activates AMPK in several tissues, leading to an increase in glucose uptake and control of energy metabolism, thus preventing ischemic injury. The aim of this study is to investigate whether AMPK is involved in the early changes in endothelial retinal cells that are exposed to hypoxic conditions and the possible beneficial effects of AMPK activator compounds.
Materials and methods: Primary human retinal microvascular endothelial cells (ACBRI-181) (passage 6 to 8) were cultured in endothelial growth media with 10% of FBS. At 70% of confluence, the cells were exposed for 24h to dimethyloxalylglycine (DMOG, 400 μM)—a prolyl-hydroxylase inhibitor used as a chemical model of hypoxia—both with and without the presence of 5-aminoimidazole-4-carboxamide ribonucleotide (AICAR) (0.5mM) or DHA (50μM). Markers of hypoxia (HIF-1α, HIF-2α, and vascular endothelial growth factor [VEGF]), tight junction integrity (Zonula Occludens-1 [ZO-1]), and endothelial mesenchymal transition (vimentin) were evaluated by immunofluorescence. Cell migration assay was performed to assess endothelial cell function. AMPK activity was assessed by western blot.
Results: Cells exposed to DMOG treatment displayed increased expression of HIF-1α, VEGF, and nuclear translocation of HIF-2α (p<0.002 vs control group [CT]). DMOG promoted disruption of the tight junction ZO-1, upregulated vimentin expression, and increased cellular migration compared to CT (p<0.0001). Supplementation with either DHA or AICAR fully prevented the above abnormalities (p<0.0001). AMPK expression showed a reduction in Thr172 phosphorylation accompanied by a reduction in phospho-ACC (Ser79), indicating a decrease in AMPK activity under DMOG treatment compared to the CT group (p<0.04).
Conclusion: This set of experiments indicates that hypoxia decreases AMPK activity in retinal endothelial cells. Treatment with AMPK activators restores cellular homeostasis. Further translational studies are being conducted to evaluate the effects of AMPK activators in ischemic proliferative retinopathy.

Supported by: FAPESP (14/22687-0) (18/07398-3) (16/16655-4)
Disclosure: M.N. Dátilo: None.
78
Effects of topical administration (eye drops) of semaglutide on retinal neuroinflammation and vascular leakage in experimental diabetes
R. Simó1,2, P. Bogdanov1,2, H. Ramos1,2, J. Huerta1, C. Hernández1,2;
1Diabetes and Metabolism Research Unit, Vall d'Hebron Research Institute, Barcelona, 2CIBERDEM, Madrid, Spain.
Background and aims: The beneficial effects of semaglutide (a long-acting GLP-1 analogue) on cardiovascular events were clearly shown in the SUSTAIN-6 clinical trial. However, a significantly increase in the rate of severe diabetic retinopathy (DR) complications was observed. Although this effect was attributed to a rapid decrease in blood glucose levels, a direct deleterious effect of semaglutide on the retina could not be ruled out. In order to address this issue we have performed an experimental study aimed at testing the direct effect of semaglutide on the early stages of DR by using eye drops. The rationale for using topical administration (eye-drops) of semaglutide is because with this route we have previously shown that GLP-1 analogues reach the retina without modifying blood glucose levels. Therefore, with this approach we can examine the direct action of semaglutide on the retina independently of glycemic values. On this basis, the aim of the present study was to evaluate the effect of semaglutide administered by eye drops on retinal neuroinflammation and early microvascular abnormalities in a db/db mouse model.
Materials and methods: Semaglutide (0.33 mg/ml; 5 μl twice/daily) (n=10) or vehicle (PBS; 5 μl twice/daily) (n=10) eye drops were administered directly onto the superior corneal surface of each eye using a micropipette in 10 week-old db/db mice. Ten non-diabetic mice (db/+) matched by age served as the control group. The treatment (semaglutide or vehicle) was administered twice daily for 15 days. Retinal analyses were performed by RT-PCR, Western blot, and immunohistochemistry. In addition, vascular leakage was examined by the Evans blue method.
Results: We found that semaglutide significantly reduced glial activation, as well as the retinal expression of NFKB, proinflammatory cytokines (IL-1β, IL-6, IL-18) and ICAM-1. In addition, semaglutide prevented the apoptosis of cells from the retinal ganglion layer and activated the AKT pathway, which is essential for the survival of retinal neurons. The effect of semaglutide in abrogating the diabetes-induced downregulation of the ratio phospho-Akt/total AKT suggests the activation of GLP-1R. Finally, semaglutide prevented the disruption of the blood-retinal barrier, thus significantly reducing vascular leakage.
Conclusion: Our results suggest that the topical administration of semaglutide is effective in preventing retinal neuroinflammation and early microvascular impairment induced by diabetes. These experimental findings point to a beneficial rather than a deleterious effect of semaglutide on the retina of subjects with diabetes.
Disclosure: R. Simó: None.
OP 14 Taking the long view of diabetes
79
Mapping polypharmacy and it's association with adverse health outcomes in the Scottish population with type 1 diabetes
A. Höhn, A. Jeyam, T. Caparrotta, S. McGurnaghan, J. O'Reilly, H. Colhoun, & on behalf of SDRN-Epi;
Institute of Genetics and Molecular Medicine, Diabetes Medical Informatics & Epidemiology Group, Edinburgh, UK.
Background and aims: The prevalence of polypharmacy has been rapidly increasing in most general populations, including the general population of Scotland. The association of polypharmacy with adverse health outcomes are well explored for general populations and particular disease groups, such type 2 diabetes (T2DM). However, little is known about the prevalence of polypharmacy and potential adverse clinical outcomes among individuals with type 1 diabetes (T1DM). We map polypharmacy over age, gender, and socioeconomic status, measured by the Scottish Index of Multiple Deprivation (SIMD), and examine the association of polypharmacy with falls, diabetic ketoacidosis (DKA), and hypoglycemia in the total Scottish population with T1DM.
Materials and methods: This study utilizes data from the Scottish Care Information-Diabetes (SCI-Diabetes) collaboration database, the comprehensive, national diabetes register for Scotland. These data were linked with information on hospital admissions provided by the Information Services Division (ISD) of the National Health Service (NHS) in Scotland. Using summary statistics, we describe the prevalence of major diabetic complications and the number of prescribed drugs by age, gender and SIMD at 2017 − 01 − 01 (baseline). To obtain the number of drugs for each individual at baseline, we counted all prescribed, different drugs according to the 5th level of the WHO ATC classification (level of chemical substances), not counting insulin and glucose. Using multivariate cox proportional hazards models, we examined how the number of drugs were associated with the first hospital admission for falls, DKA, and hypoglycemia within the subsequent 12-month period.
Results: We studied 28245 individuals alive and observable with T1DM in Scotland at baseline, of which 15731 were men and 12514 were women. The mean age of the study population was 42.31 years (sd : 18.32 years) and the mean diabetes duration was 20.64 years (sd : 13.87 years). On average, individuals were prescribed 4.07 (sd : 4.36) drugs. The proportion of individuals taking 5 or more drugs at baseline consistently increased with age, from 2.37% (95% CI: 1.91% - 2.85%) among individuals aged 0-19, to 28.88% (27.44% - 30.36%) among individuals aged 40-49, and 76.53% (68.22% - 85.09%) among individuals aged 80+. Controlling for gender, age, diabetes duration, SIMD, and health status, each additional drug was associated with a significant increase in the risk of hospitalization for falls, DKA, and hypoglycemia (Hazard Ratio (HR) for each additional drug: falls - HR: 1.056, p-value: < 0.001)/ DKA - HR: 1.049, p-value: < 0.001) / hypoglycemia - HR: 1.079, p-value: < 0.001)
Conclusion: Polypharmacy is common among the Scottish population with T1DM. The prevalence of polypharmacy rapidly increases with age as the incidence of diabetic complications and other major noncommunicable diseases increases. Evaluating potential benefits and harms of medication regimes is of substantial importance as each additional drug increases the potential risk of adverse clinical outcomes.
Supported by: Diabetes UK (17/0005627)
Disclosure: A. Höhn: None.
80
Insulin resistance at type 2 diabetes diagnosis, not impaired beta cell function, is associated with total mortality
J. Otten, B. Tavelin, S. Söderberg, O. Rolandsson;
Umeå University, Umeå, Sweden.
Background and aims: We investigated the separate effects of insulin resistance and beta cell function at the diagnosis of type 2 diabetes on the development of mortality and diabetes complications.
Materials and methods: This cohort study included 864 individuals with type 2 diabetes (median age 60 years) in whom fasting glucose and fasting C-peptide were measured at diabetes diagnosis. Insulin resistance was estimated by HOMA-%S and beta cell function by HOMA-%B. Four groups were created based on the median HOMA-%S and HOMA-%B values: group 1, high insulin resistance and preserved beta cell function; group 2, high insulin resistance and impaired beta cell function; group 3, low insulin resistance and preserved beta cell function; group 4, low insulin resistance and impaired beta cell function (reference group). Mortality and diabetes complications were registered with a follow-up of 15 years. The associations between the four groups and mortality/complications were estimated by Cox regression adjusted for gender and age at diabetes diagnosis in model 1, and also for smoking, hypertension, BMI, and total cholesterol in model 2. In the figure a Kaplan-Meier plot is displayed not including adjustments for confounding factors.
Results: Total mortality in the four groups is displayed in the figure. Both groups with high insulin resistance had higher total mortality (group 1: HR 1.58, 95% CI 1.06−2.36; group 2: HR 1.85, 95% CI 1.20-2.84) than group 4. Fasting C-peptide, as a continuous variable, was independently associated with total mortality (HR 1.29, 95% CI 1.11−1.49) and cancer mortality (HR 1.42, 95% CI 1.09−1.84).
Conclusion: Insulin resistance was an independent risk factor for total mortality. Thus, treatment of type 2 diabetes should focus not only on normalizing blood glucose levels, but also reducing insulin resistance.

Supported by: Västerbotten County Council, Umeå University, Uman Genomics Ltd
Disclosure: J. Otten: None.
81
Mortality in community-based adults with type 1 diabetes and matched people without diabetes: the Fremantle Diabetes Study Phase I
T.M.E. Davis, W.A. Davis;
University of Western Australia, Fremantle, Australia.
Background and aims: There are few long-term comparative mortality data for community-based people with type 1 diabetes (T1D). The aim of this study was to analyse deaths and their causes in participants in the longitudinal observational Fremantle Diabetes Study Phase I (FDS1) and in matched people without known diabetes from the same urban Australian population of 120,000.
Materials and methods: Each member of the FDS1 T1D cohort was matched on age, sex and postcode with 4 randomly-selected, de-identified people without diabetes who were randomly selected from the electoral role. Participants in both groups were followed from the time of FDS1 entry or equivalent between 1993 and 1996 to the end of 2017 through the validated Western Australian Data Linkage System. All deaths were ascertained and their causes adjudicated based on UK Prospective Diabetes Study categories. Mortality rates (MRs) and MR ratios (MRRs) were calculated. Unadjusted and adjusted Cox regression models were generated to ascertain the hazard ratio (HR) for all-cause mortality by T1D status.
Results: The mean±SD age of the pooled T1D and no diabetes cohorts (n=605) at study entry was 43.1±15.3 years and 59% were male . The 121 participants with T1D had a median [IQR] diabetes duration of 12 [3-21] years and they were aged 29.5±11.6 years at diagnosis. During a total 12,541 person-years (mean 20.7±5.7 years) of follow-up, 55 (45.5%) of the T1D cohort and 88 (18.2%) of the cohort without diabetes died. The respective MRs (95% confidence interval [CI]) were 25.7 (19.4, 33.5) and 8.5 (6.8, 10.4) /1,000 person-years. The crude MRR (95% CI) was 3.04 (2.13, 4.31) (P<0.001). The 10-year age-specific MRRs are shown in the Figure. In the <35 years age-group, there were no deaths in T1D participants and 3 in the matched controls (suicide or drug misuse). The 35-44 years age group had the highest MRR (>20) with a declining trend to a non-significant two-fold increased risk for those aged 75-94 years. T1D was associated with a significant HR (95% CI) for all-cause mortality of 3.44 (2.45, 4.83) (P<0.001). With adjustment for age, sex and the Charlson Co-morbidity Index (excluding diabetes and its complications), the HR was modestly attenuated to 3.15 (2.20, 4.51) (P<0.001). The mean age (95% CI) at death was 6.6 (2.0, 11.2) years younger in those with T1D versus those without diabetes. The main cause of death was cardiovascular disease (CVD) in T1D (45.5% versus 32.7% in those without diabetes).
Conclusion: During a mean of over 2 decades of follow-up, community-based Australian adults with T1D died an average of 7 years before their matched counterparts without diabetes. Approaching half of the deaths in T1D were from CVD versus only one third in people without diabetes. These data highlight the risk of premature death and the need for optimal CVD risk reduction in people with T1D.

Supported by: TMED
Disclosure: T.M.E. Davis: Grants; Raine Foundation/University of Western Australia.
82
Forty-year mortality among patients with first-time hospital-diagnosed overweight or obesity
S.B. Gribsholt1, D.K. Farkas2, R.W. Thomsen2, B. Richelsen1, H.T. Sørensen2;
1Aarhus University Hospital, Aarhus N, 2Aarhus University, Aarhus N, Denmark.
Background and aims: Obesity is a risk factor for chronic diseases that confer an elevated mortality risk compared to the general population. Data on the impact of hospital-diagnosed obesity on long-term mortality are limited. We investigated 40-year mortality among patients with hospital-diagnosed overweight or obesity.
Materials and methods: We used national registries covering the entire Danish population of 8,846,452 residents and all Danish general hospitals between 1979 and 2018. We identified all Danes with a first incident hospital-based overweight or obesity diagnosis (median age 45 years), and constructed an age-, gender-, and index date-matched general population comparison cohort. We computed mortality risk and mortality rate ratios (MRRs) with 95% confidence intervals (CIs), using Cox regression.
Results: We observed 68,506 deaths among 322,130 persons (2,987,320 person years) with a hospital diagnosis of overweight or obesity, and 253,897 deaths among 1,610,596 persons (16,316,670 person years) in the comparison cohort, corresponding to an all-time MRR of 2.02 (95% CI: 2.01-2.04). The mortality risk for patients with overweight or obesity was greatly increased in the first year following the first diagnosis code (2.5% versus 0.4% in comparisons, MRR=6.58 (95% CI: 6.37-6.79)) of follow up. Mortality risk then remained approximately doubled throughout follow-up (1-10y MRR=1.80 (95% CI: 1.78-1.82); 11-20y MRR=1.92 (95% CI: 1.89-1.96); 21-30y MRR=2.05 (95% CI: 2.00-2.11), and 31-40y MRR=2.12 (95% CI: 2.00-2.24)). Patients with overweight or obesity had markedly higher all-time mortality due to diabetes and other endocrine diseases (MRR=4.99 (95% CI: 4.80-5.19)) and cardiovascular diseases (MRR=2.67 (95% CI: 2.63-2.72)), but also due to respiratory diseases (MRR=2.30 (95% CI: 2.24-2.36)), infectious diseases (MRR=1.83 (95% CI: 1.79-1.88), and cancer (MRR=1.48 (95% CI: 1.44-1.53)). The 1-10-year MRR associated with overweight or obesity decreased over calendar time: from 2.02 (95% CI; 1.98-2.06) in 1977-1989 to 1.63 (95% CI; 1.59-1.68) in 2010-2018.
Conclusion: Patients with hospital-diagnosed overweight or obesity had a two-fold increased 40-year mortality, compared with the general population. We found evidence for a modestly decreasing excess mortality in patients with hospital-diagnosed overweight or obesity over the last decades.
Supported by: The Danish Council for Independent Research, The Novo Nordisk Foundation, The Central Denmark Regio
Disclosure: S.B. Gribsholt: None.
83
Time trends in deaths before 50 years of age in people with type 1 diabetes: a nationwide analysis from Scotland (2004-17)
J.E. O'Reilly, A. Jeyam, T.M. Caparrotta, S. McGurnaghan, P.M. McKeigue, H.M. Colhoun;
University of Edinburgh, Edinburgh, UK.
Background and aims: To examine whether rates of crude mortality, and mortality relative to the general population below 50 years of age have improved in recent years in those with type 1 diabetes.
Materials and methods: Individuals with type 1 diabetes and age < 50 years at any time during the period 2004-2017 in Scotland were identified using the national register (n= 27,935). Death data were obtained by linkage to General Registrar data. Indirect standardisation was used to calculate standardised mortality ratios (SMRs). Poisson regression was used to test for calendar time effects as incident rate ratios (IRR).
Results: There was a significant decline in mortality rate over time (IRR for calendar year adjusted for age, diabetes duration, level of social deprivation and sex = 0.983, 95% CI = 0.967-0.998, p=0.03) but the SMR remained approximately stable at 3.1 and 3.6 in men and 4.09 and 4.16 in women for 2004 and 2017 respectively. Diabetic ketoacidosis or coma (DKAoC) accounted for 20.8 % of deaths and the rate did not decline significantly during the study period (IRR=0.975, 95% CI 0.94-1.011, p=0.168); 79.3 % of DKAoC deaths occurred out of hospital. Circulatory diseases accounted for 27.6 % of deaths and did decline significantly (IRR=0.946, (95% CI 0.914-0.979, p=0.002).
Conclusion: Absolute mortality has fallen but the relative impact of type 1 diabetes on mortality below age 50 has not improved in fourteen years and remains high, particularly in women. Strategies to both improve the prediction and prevention of out of hospital acute diabetes deaths and to improve circulatory disease prevention are still needed.
Supported by: This study was supported by funding from the Diabetes UK (17/0005627)
Disclosure: J.E. O'Reilly: None.
84
Mortality in first- and second- generation immigrants to Sweden diagnosed with type 2 diabetes
L. Bennet1, R. Udumyan2, C. Östgren3, O. Rolandsson4, S. Jansson2, P. Wändell5;
1Lund University, Malmo, 2Örebro University, Örebro, 3Linköping University, Linköping, 4Umeå University, Umeå, 5Karolinska Institute, Stockholm, Sweden.
Background and aims: Non-western immigrants to Europe are at high risk for type 2 diabetes (T2D). In this nationwide study including incident cases of T2D, the aim was to compare mortality in first- and second generation immigrants with native Swedes.
Materials and methods: Patients living in Sweden diagnosed with a new-onset pharmacologically treated T2D between 2006 to 2012 were identified through the Swedish Prescription Drug Register. Patients were followed until December 31, 2016 for all-cause mortality (ACM) and until December 31, 2012 for cause-specific mortality (CSM). Analyses were adjusted for age at diagnosis, sex, year of diagnosis, socioeconomy, education, treatment and region. Comparisons were assessed using cox-regression analysis.
Results: In total, 169 300 individuals (129 533 (76.3%) native Swedes; 31 988 (18.9%) first-generation immigrants, and 7 799 (4.8%) second-generation immigrants with either one or both parents born outside Sweden) were diagnosed with T2D between 2006 and 2012 and fulfilled inclusion criteria. First-generation immigrants had lower ACM rate [hazard ratio (HR): 0.85, 95% CI 0.82 to 0.89] compared with native Swedes.The mortality was particularly low in persons born in the Middle East [0.45,0.40 to 0.51], Asia [0.56, 0.46 to 0.68], and Africa [0.88. 0.82 to 0.95]. Mortality rates decreased with older age at migration and shorter stay in Sweden, with the lowest rate in those originating from the Middle East living in Sweden <25 years [0.40, 0.34 to 0.46]. First-generation immigrants born in the Middle East (0.43; 0.30-0.62), and Asia (0.38; 0.19- 0.77) had lower cardiovascular disease related mortality rates compared with native Swedes. Middle Eastern immigrants further displayed lower cancer related mortality rate (0.59, 0.42 to 0.84) compared with native Swedes. Second generation immigrants displayed similar survival rates as native Swedes.
Conclusion: Our data indicate that in T2D patients, exposure to the Swedish environment seems to have a larger impact on mortality risk than region of origin. This study indicates protecting mechanisms on mortality related to the non-western environment.

Supported by: Lund University (ALF Grants); VR (EXODIAB Linné grants); UHCR Örebro; Västerbotten County Council
Disclosure: L. Bennet: None.
OP 15 Pregnancy in diabetes prediction and outcomes
85
Risk of major congenital malformations, perinatal or neonatal death with insulin detemir vs other basal insulins in pregnant women with pre-existing diabetes: EVOLVE study
E. Mathiesen1, A.C. Alibegovic2, L. Husemoen2, P. Kelkar2, D.R. McCance3, H.W. de Valk4, P. Damm1, on behalf of the EVOLVE study group;
1University of Copenhagen, Rigshospitalet, Copenhagen, Denmark, 2Novo Nordisk A/S, Søborg, Denmark, 3Metabolic Unit, Royal Victoria Hospital, Belfast, UK, 4University Medical Centre Utrecht, Utrecht, Netherlands.
Background and aims: The EVOLVE study examined the risk of major congenital malformations and perinatal or neonatal deaths when using insulin detemir (IDet) versus other basal insulins in pregnant women with pre-existing diabetes.
Materials and methods: A prospective, non-interventional, multinational study in pregnant women with type 1 or type 2 diabetes treated with IDet or other insulin treatment. In the present analysis, 727 women using IDet during pregnancy were compared with 730 women using other basal insulin, mainly insulin glargine. The primary endpoint was the number of women completing ≥22 weeks of gestation without any of the following events: major congenital malformations, perinatal or neonatal deaths.
Results: At enrolment 86% of subjects had type 1 diabetes (mean age: 31 years; BMI: 26 kg/m2) and mean HbA1c was 7.1%. There was no difference between treatment groups in crude or adjusted risk difference for pregnancies without major congenital malformations, perinatal or neonatal deaths (Table).
Conclusion: In pregnant women with pre-existing diabetes, IDet was not associated with excess risk of major congenital malformations, perinatal or neonatal deaths vs other basal insulin.

Clinical Trial Registration Number: NCT01892319
Supported by: Novo Nordisk
Disclosure: E. Mathiesen: Honorarium; Novo Nordisk; Lilly; Sanofi-Aventis.
86
Maternal obesity is associated with beta cell dysfunction and impaired insulin action already during early pregnancy
D. Eppel1, I. Rosicky1, J. Blätter1, G. Yerlikaya-Schatten1, C. Schatten1, P. Husslein1, W. Eppel1, A. Tura2, C.S. Göbl1;
1Department of Obstetrics and Feto-Maternal Medicine, Medical University of Vienna, Vienna, Austria, 2CNR Institute of Neuroscience, Padova, Italy.
Background and aims: Gestational diabetes mellitus (GDM) is widely accepted as a major reason for fetal overgrowth and metabolic disorders in newborns later life. However, in addition to these long-known effects of hyperglycemia, there is increasing evidence suggesting that the impact of maternal obesity on pregnancy may be of additional or even more importance. One possible explanation is that obesity can influence maternal and fetal metabolism already at the start of pregnancy even before GDM is diagnosed (i.e., between 24 and 28 weeks of gestation). There is sparse information available with the focus to elucidate the complex interaction between glucose homeostasis and the degree of maternal obesity during early stage pregnancy.
Materials and methods: In this cohort study, we prospectively included 40 pregnant women (17 normal weight, 16 overweight and 7 obese). A detailed metabolic evaluation was performed at the initial contact (between 12+0 and 15+6 gestational weeks) including a frequently sampled intravenous glucose tolerance test over 60 minutes to estimate parameters of insulin sensitivity and β-cell function such as the calculated insulin sensitivity index (CSI), acute insulin response to glucose (dAIRG) and the disposition index (DI), respectively. The amount of hepatic insulin action was additionally assessed by the quantitative insulin sensitivity check index (QUICKI) from static measurements of glucose and insulin concentrations.
Results: Maternal overweight and especially obesity were associated with significantly reduced hepatic and whole-body insulin action (median CSI: 7.5 vs. 5.19 vs. 1.33 10-4 min-1 [μU/ml]-1 for normal weight vs. overweight vs. obese mothers). As visualized in Figure 1, the acute insulin response after intravenous glucose administration was comparable between the groups (poverall = 0.825), suggesting that insulin secretion was inadequate to compensate for the higher amount of insulin resistance in obese mothers. As a consequence, the disposition index (CSI × dAIRG) was significantly lower in obese mothers, compared to normal weight mothers (p=0.001).
Conclusion: Obese mothers suffer from pronounced insulin resistance in early pregnancy. The reduced level of insulin action, however, is inadequately compensated by increased insulin release from the pancreatic β-cells, suggesting that subtle hyperglycemia is still present in high-risk patients already before GDM is diagnosed. Therefore, early alterations in glucose homeostasis could contribute to the impaired pregnancy outcome observed in obese mothers.

Disclosure: D. Eppel: None.
87
Risk prediction of gestational diabetes by low-invasive prediction models at early pregnancy
G. Kotzaeridi1, J. Blätter1, D. Eppel1, I. Rosicky1, M. Mittlböck2, G. Yerlikaya-Schatten1, C. Schatten1, P. Husslein1, W. Eppel1, A. Tura3, C.S. Göbl1;
1Department of Obstetrics and Gynecology, Medical University of Vienna, Vienna, Austria, 2Center of Medical Statistics, Informatics and Intelligent Systems, Section for Clinical Biometrics, Medical University of Vienna, Vienna, Austria, 3Metabolic Unit, CNR Institute of Neuroscience, Padova, Italy.
Background and aims: Sensitivity and specificity of risk factors for the prediction of gestational diabetes mellitus (GDM) can be considerably improved by use of clinical prediction models consisting of a statistical combination of several risk indicators (e.g. maternal age or history of GDM). Several prediction models for GDM are provided in the literature, however their clinical significance, as of yet, has not been thoroughly evaluated, especially with regard to application at early gestation. This study aims to assess the predictive accuracy of published low-invasive risk estimation models for the later development of GDM at early gestation.
Materials and methods: In this cohort study 1132 pregnant women (<16+0 weeks of gestation) underwent a broad risk evaluation and a routine laboratory examination at fasting condition. GDM status was assessed by use of a 75g OGTT at late second and early third trimester according to the IADPSG diagnostic criteria. Nine clinical prediction models were calculated according to the published literature.
Results: GDM was diagnosed in 239 cases i.e. 21.1% of the study participants. Although the analysed clinical prediction models were developed according to different diagnostic criteria for GDM, they showed a similar predictive accuracy with an area under the receiver operating characteristic curve (ROC-AUC) ranging between 64.5% and 72.9% (Figure 1). This corresponds to a moderate to fair predictive power, whereby most models showed a better predictive accuracy as compared to maternal age (ROC-AUC: 56.6%, 95%CI: 52.6 - 60.7) or pregestational BMI (ROC-AUC: 66.0%, 95%CI: 62.1 - 69.9). Unbiased recursive partitioning revealed that history of GDM and fasting plasma glucose had higher variable importance as compared to other variables used in the respective risk prediction models. As a result, the risk assessment tools containing those variables showed improved predictive performance. Of note, all analysed risk assessment tools could be significantly improved by including a static index quantifying the amount of insulin action, such as the homeostatic model assessment of insulin resistance (HOMA-IR) or the quantitative insulin sensitivity check index (QUICKI).
Conclusion: Established low-invasive risk assessment tools showed modest to fair accuracy to predict the later development of GDM. However, the studied prediction models showed better predictive accuracy as compared to traditional risk factors such as age and BMI. We observed the highest variable importance for fasting plasma glucose and history of GDM suggesting that these variables in addition to static measurements of insulin resistance should be included in future models.

Disclosure: G. Kotzaeridi: None.
88
GLP-1 hypersecretion in gestational diabetes
L. Fritsche1,2, M. Heni3,2, S.S. Eckstein1,2, M.J. Winzenried3, J. Hummel1,2, A.L. Birkenfeld3,2, H. Preissl1,2, H.-U. Häring1, A. Peter1, A. Fritsche3,2, R. Wagner3,2;
1Institute for Diabetes Research and Metabolic Diseases, Helmholtz Zentrum Muenchen, Tuebingen, 2Deutsches Zentrum für Diabetesforschung (DZD), München, 3Medizinische Klinik Abt IV, Universitätsklinikum Tübingen, Tuebingen, Germany.
Background and aims: Incretins are crucial for an adequate insulin secretion in response to ingestions of nutrients. In patients with diabetes, prediabetes or a specific genetic background, this incretin effect is blunted. Data on incretin secretion and action during pregnancy are scarce. Here we investigated the incretin response during an oral glucose tolerance test (OGTT) in pregnant women with and without gestational diabetes.
Materials and methods: Pregnant women from the ongoing PREG study underwent 5-point OGTT with 75 g glucose. We measured plasma glucose, insulin and C-peptide at all time points and total GLP-1 at minute 0, 30 and 120. Indices of insulin secretion and GLP-1 increase were calculated from the difference at min 0 and 30. We used linear regression to analyze the relation of GLP-1 and glucose with insulin secretion.
Results: We examined 163 women during gestational week 26.8 (±2.0 SD), GDM was present in 30 (18.4%) women. Insulin secretion was significantly lower in women with GDM (p=0.04, adjusted for BMI, age, week of gestation, insulin sensitivity). GLP-1 levels increased after glucose intake with a peak at 30 min. GLP-1 levels at minute 30 and AUCGLP-1 was significantly higher in women with GDM (by ~20%, both p=0.03, adjusted for age, BMI and week of gestation). The GLP-1 increase was associated with insulin secretion only in GDM, but not in women with normal glucose tolerance. This association remained significant even after adjustment for increase of glucose and basal insulin levels (GDM group: p<0.001, non GDM: p=0.69).
Conclusion: Women with GDM had lower insulin secretion despite increased GLP-1 levels during OGTT. The more pronounced GLP-1 increase in women with GDM could be part of a compensatory mechanism counteracting GLP-1 resistance. In addition to incretin resistance, this phenomenon suggests a dysfunction of glucose stimulated insulin secretion.
Supported by: BMBF grant 01GI0925 to the German Center for Diabetes Research (DZD)
Disclosure: L. Fritsche: None.
89
Comparison of IADPSG with NICE criteria for diagnosis of gestational diabetes
H. Sagili, S. Todi;
Obstetrics and Gynaecology, JIPMER, Puducherry, India.
Background and aims: Different screening procedures and diagnostic criteria are being followed in the same as well as in different countries with no single standard criteria established for diagnosis of Gestational Diabetes Mellitus (GDM). So far, there are no studies in the Indian population comparing International Association of Pregnancy and Study Groups (IAPDSG) with National Institute for Health and Care Excellence (NICE) criteria. This study was carried out to compare IADPSG with NICE criteria for diagnosis of GDM and its influence on maternal and perinatal outcomes.
Materials and methods: This prospective observational study was conducted in the Department of Obstetrics and Gynaecology of a tertiary care institute in South India from March 2017 to October 2018. Six hundred eighty women with or without risk factors for GDM were recruited in the study and screened for GDM in first /second trimester. Women with preexisting diabetes mellitus or with fasting plasma glucose >126 mg/dl were excluded. All women underwent 75 gm Oral Glucose Tolerance Test and Glucose values were interpreted according to IADPSG and NICE criteria. The study subjects were then stratified into four groups namely Normal glucose tolerance, GDM by IADPSG positive NICE negative, GDM by IADPSG negative NICE positive and GDM by both IADPSG and NICE positive criteria. The participants were followed till delivery and maternal and perinatal outcomes were noted. The percentage agreement and discordance between the two criteria were calculated using kappa-statistics. The categorical data were compared using x2 or Fisher’s exact test and p value <0.05 was considered statistically significant.
Results: The overall prevalence of GDM in our study was 27.2 % by either IADPSG/ NICE criteria. 25.1 % and 11.6 % women were diagnosed as GDM using IADPSG and NICE criteria respectively. The level of agreement between the two diagnostic criteria was found to be poor in our study and was statistically significant (kappa value= 0.429; p value <0.001). Women testing IADPSG positive NICE negative had a higher risk of abortions, gestational hypertension, premature rupture of membranes, preterm delivery, caesarean section, congenital anomalies, meconium stained liquor and low Apgar score at one minute when compared to non GDM group. In addition, except for preterm delivery, women diagnosed as GDM by both IADPSG and NICE criteria had adverse outcomes such as preeclampsia, urinary tract infection and polyhydramnios. Women diagnosed as GDM by IADPSG negative NICE positive criteria had no significant adverse maternal or perinatal outcomes.
Conclusion: There was a higher pick up rate of GDM using IADPSG criteria when compared to NICE criteria. Women diagnosed as GDM with IADPSG positive NICE negative criteria had significantly higher incidence of adverse maternal and perinatal outcomes in contrast to women diagnosed as GDM by IADPSG negative NICE positive criteria. Hence, a higher fasting plasma glucose cut off value as proposed by NICE for diagnosis of GDM would lead to misidentification of some of the high risk pregnancies and thus depriving them of timely care and management. Women with substantial risk of maternal and perinatal outcomes are better identified by IADPSG criteria and would have been missed if NICE criteria had been used.Thus IADPSG criteria appears to be more robust than NICE criteria for diagnosis of GDM and its influence on adverse maternal and perinatal outcomes. Further large cohort studies with longer follow up are needed for agreement on adoption of either of the criteria.
Disclosure: H. Sagili: None.
90
Offspring of women with gestational diabetes: a 5 year follow-up
V. Bartakova1, B. Baratova1, K. Chalasova1, P. Janku2, K. Kankova1;
1Masaryk University, Brno, 2University Hospital Brno, Brno, Czech Republic.
Background and aims: Gestational diabetes mellitus (GDM) represents a risk factor for both mother and her offspring in short-term (perinatal morbidity) as well as long-term horizon (postpartum diabetes or foetal programming). A lot of studies focused at peri/postnatal complications and selected parameters of GDM mother’s offspring, however relatively few were designed as prospective. No such study focused on this topic in Czech Republic so far. The aim of our study was to ascertain possible anthropometric and developmental abnormalities and/or morbidity in offspring of GDM mothers compare to controls in a 5-year follow-up.
Materials and methods: The prospective study comprised 89 offspring-mother pairs, of those 26 with GDM and 63 controls. Following offspring parameters were evaluated: weight, length/high, blood pressure, resting heart rate, psychomotor development, morbidity, need for regular drug therapy, need for regular specialist doctor observation, status of vaccination, duration of breastfeeding. Following perinatal data were available: offspring weight (macrosomia), length of delivery, necessity of necessity of delivery induction, necessity of instrument usage, necessity of Caesarean section, Apgar score, Base excess, cord blood PH
Results: At the age of 12 and 18 months, offspring of GDM mothers had significantly worse speech abilities (didn’t say any word at 12 months of age and didn´t link words in 18 months of age, P=0.015 and P=0.009 resp., Chi-square test). Psychomotor development and school readiness test was borderline worse in GDM group at 5 years of age (P=0.048 for both, Chi-square test). Offspring of GDM mothers were more ill in their first 5 years of age and need hospitalisation (P=0.022, Chi-square test). Adverse perinatal outcomes had no significant influence on offspring psychomotor development or morbidity up to 5 years in both groups. Offspring of obese mothers had significantly worse speech abilities in 18months of age (P=0.034, chi-square test), a higher percentile weight-for-high as in 3 years (P=NS), as in 5 years (P=0.04, Mann-Whitney test).
Conclusion: This is unique prospective study focused on psychomotor development in a cohort of offspring of GDM mothers, comprised perinatal outcomes. Pilot results indicate certain differences in selected parameters in offspring of GDM mothers, especially in speech abilities and total morbidity. Moreover, were found a significant link of mother’s obesity and offspring adverse outcomes (increased adiposity and worse verbal language), however, validity is diminished by small number of obese respondents.
Supported by: Ministry of Health of the Czech Republic, grant nr. NV18-01-00046
Disclosure: V. Bartakova: None.
OP 16 Signals and networks in beta cell failure
91
Impact of hepatic or pancreatic tissue selective PCSK9-deficiency on pancreas morphology, insulin release and glucose metabolism
C. Perego1, A. Marku1, L. Da Dalt1, A. Galli1, A.L. Catapano1, D.G. Norata2,3;
1Università degli Studi di Milano, Milan, 2Dept of Pharmacological and Biomolecular Sciences (DiSFeB),Center for the Study of Atherosclerosis, Bassini Hospital, Cinisello B, Milan, 3Center for the Study of Atherosclerosis, Bassini Hospital, Cinisello B, Milan, Italy.
Background and aims: The proprotein convertase subtilisin/kexin type 9 (PCSK9) is crucially involved in regulating plasma cholesterol levels by controlling LDL-R expression. Loss of function genetic variants are associated with lower LDL cholesterol, but higher plasma glucose levels and increased risk of T2D. Although the liver is the main contributor to circulating PCSK9, also the endocrine pancreas produces PCSK9, pointing to a possible direct role of this protein in this tissue. Pcsk9-KO mice show impaired glucose tolerance, which appears to be the consequence of decreased insulin secretion rather that insulin resistance. Aim of this work was to understand the contribution of selective liver and pancreatic PCSK9 production on beta cell physiology and glucose homeostasis.
Materials and methods: Conditioned liver (AlbCre/Pcsk9LoxP/LoxP) and endocrine pancreas (Pdx1Cre/Pcsk9fl/fl) Pcsk9-KO mice were generated and 20 weeks after, they were characterized for islet morphology, insulin release and glucose tolerance. Clonal beta cells (INS1E, βTC1 and RIN-5F) and human islets of Langerhans were used to verify the PCSK9 localization and impact on insulin content and release.
Results: Liver-specific Pcsk9-KO mice, as expected, lack detectable circulating PCSK9 protein, but express PCSK9 in the islets. They showed GTT curves and plasma glucose levels following fast and refeeding experiments similar to control littermates, paralleled by pancreatic islets comparable in size, organization and insulin content to those of littermates. Pancreas specific Pcsk9-KO mice present normal PCSK9 circulating levels but lack PCSK9 expression in pancreatic delta cells. The analysis of pancreas morphology revealed islets comparable in size to littermates but with a decreased insulin content. In line with these findings, insulin levels following fast and refeeding experiments were significantly lower than in littermates. While little or non-detectable amount of PCSK9 is found in beta cells of human isolated islets, a variable amount of PCSK9 expression is observed in rat and mouse beta cell lines. Immunostaining of human pancreas tissue sections confirmed the results and revealed a prevalent PCSK9 localization in delta cells. Studies are in progress to understand the role of pancreatic PCSK9 on insulin synthesis and secretion.
Conclusion: These data, suggest that pancreatic and not circulating (liver produced) PCSK9 plays a prevalent role in beta cell physiology. Ongoing studies are directed to shed light on the mechanisms connecting PCSK9 with beta cell dysfunction in diabetes but also to address the safety of anti-PCSK9 therapies which have been proposed to patients with severe hypercholesterolemia and/or very high cardiovascular risk.
Disclosure: C. Perego: None.
92
Multiple CRISPR/Cas9 genome editing reveals novel regulators of insulin secretion identified by single cell RNAseq
A. Lopez-Pascual1, A. Lindqvist1, J. Martínez-López2, N. Wierup1;
1Lund University Diabetes Centre, Lund University, Malmö, 2Medical Biochemistry and Biophysics, Karolinska Institutet, Stockholm, Sweden.
Background and aims: Perturbed islet function is a culprit in Type 2 Diabetes (T2D) and islet research is on the verge of taking a major leap forward thanks to cell type specific information on gene expression using single-cell RNA sequencing (scRNAseq). In a comprehensive analysis of which biological processes are affected in T2D, we identified T2D-affected Gene Regulatory Networks (GRNs) in beta cells. The GRNs contain node genes that we anticipate play important regulatory roles in beta cell function. Here we aimed to test the function of node genes, without a previously known function in beta cells, in a GRN of exocytosis genes.
Materials and methods: CRISPR/Cas9 gene editing was used to simultaneously mutate five node genes (Atraid, Atp6ap1, Epcam, Krtcap2and Tusc3). A plasmid carrying five guide RNAs, high fidelity spCas9 and GFP fluorescent marker, was transfected into INS-1 832/13 cells using Lipofectamine 3000. Cell were FACS-sorted five days post-transfection to obtain GFP+ cells. Single-cell colonies were plated and grown to obtain KO clonal lines. Gene expression of the five target genes was measured by qPCR as a quality control to confirm the efficiency of our protocol to generate KO genes. In parallel, GFP+ cells were plated to obtain pooled KO cell cultures. Gene expression of the five node genes, insulin (Ins1and Ins2) gene expression and glucose-stimulated insulin secretion were measured in pooled KO cells, KO clones and after siRNA-mediated silencing.
Results: GFP positive cells (5% of all viable cells) were grown for three months through clonal expansion. Of those, 30% were grown in single-cell colonies and divided to analyze gene expression of the five node genes. Gene expression analysis showed that, on average, 58% of all clone colonies were homozygous KO, 28% heterozygous KO and 14% wild-type for one of the genes. Thus, 6% of clones could have all five node genes mutated in both alleles (10 clones considering the number of colony-growing clones). After 5 months of cell culture post-transfection we obtained 15 KO clones growing at the same rate as wild-type cells. Pooled CRISPR-KO cells showed decreased expression of the five targeted genes (32-74%) and Ins1(43%), but had unaffected insulin protein content. Furthermore, pooled CRISPR-KO cells showed increased insulin secretion at basal glucose conditions (2.8 mM) with and without K+compared with wild-type cells. This effect was, however, not observed at 16.7 mM glucose. Single-gene siRNA silencing of Atraid, Epcamand Krtcap2 resulted in increased insulin expression (Ins1and Ins2). Conversely, Tusc3 KD decreased Ins1gene expression. At 16.7 mM glucose Atraidand Krtcap2KD produced increased insulin secretion and at 16.7 mM glucose with IBMX (100 uM) the single-gene KD of all genes caused an increase in insulin secretion.
Conclusion: Our data suggest that Atraid, Atp6ap1, Epcam, Krtcap2and Tusc3are novel regulators of beta cell exocytosis, as well as insulin expression and secretion. Further studies are needed to elucidate the mechanistic background for these effects.
Supported by: EFSD/AstraZeneca Cellular Plasticity Programme, Novo Nordisk, SSR, DW Sverige, Fisiograf. Sällsk. Lund, Påhlsson
Disclosure: A. Lopez-Pascual: None.
93
Cask promotes the plasma membrane targeting of insulin granules via interaction with apba1, stxbp1 and npsh1
K. Zhang, Y. Wang;
Department of Endocrinology, Southeast University, Nanjing, China.
Background and aims: In our previous study, we demonstrated that knockdown of Calcium/calmodulin-dependent serine protein kinase (CASK) reduced the anchoring of insulin vesicles to cell membranes. In the current study, we re-evaluated the role of CASK and explored its interactions with other proteins involved in regulating insulin granule exocytosis.
Materials and methods: The endogenous CASK interactome in INS-1 cells during insulin secretion were measured by co-immunoprecipitation (Co-IP) and liquid chromatography-mass spectrometry (LC-MS/MS). GO analysis and Ingenuity Pathway Analysis (IPA) were carried out to explore the bioinformatic implication. CASK-specific small interfering RNA (siRNA), pEGFP-N2-Cask and pEGFP-IJ-Apba1-ΔCI plasmids were transiently transfected in INS-1 cells using the Lipofectamine 2000 reagent. Mice with conditionally CASK deleted in islets were constructed by Cre-loxp recombination system. During insulin secretion, the interaction and localization of CASK and CASK-interacting proteins in INS-1 cells or in islet of conditional CASK knockout mice were examined by Co-IP, confocal microscopy and subcellular fractionation analysis. Besides, we established lipotoxicity or glucotoxicity damage cell model and C57BL/6J diabetic mouse model to explore the correlation between diabetes and CASK as well as CASK-interacting proteins.
Results: According to the results of LC-MS/MS, 154 proteins with intensity ratio of IP/IgG>2 and/or IgG=0, IP>0 were considered as CASK-interacting proteins. We conducted bioinformatic analysis of these 154 proteins and finally focused APBA1 (Adapter protein X11 alpha), STXBP1 (Syntaxin binding protein 1) and NPHS1 (Nephrosis 1 congenital finnish type) for further analysis. The results of Co-IP confirmed that CASK, APBA1, STXBP1 could form a tripartite complex during insulin secretion. Silence or knockout of Cask decrease the interaction between APBA1 and STXBP1 and may thereby cause insulin release defects. In addition, CASK could bind to NPHS1, which is expressed on the surface of insulin vesicles. Besides, in INS-1 cells stimulated with high potassium, the fluorescence intensities of CASK, STXBP1 and NPHS1 in cell membranes were significantly enhanced. Subcellular fractionation analysis revealed that CASK and CASK-interacting proteins moved from the cytoplasm to the plasma membrane in INS1-1 cells during insulin secretion. Moreover, insulin secretion and expression of CASK and CASK-interacting proteins were significantly declined in islet isolated from high fat diet-induced diabetic mouse and in INS-1 cells treated with high glucose or palmitic acid or. Overexpression of Cask in INS-1 cells could increase the binding of CASK to APBA1, STXBP1 and NPHS1, and may thereby rescue the abnormal decrease of insulin secretion.
Conclusion: Above all, CASK promotes the plasma membrane targeting of insulin granules via interaction with APBA1, STXBP1 and NPHS1. Under pathological conditions of diabetes, the abnormal decrease of CASK and CASK-interacting proteins may result in insulin secretion defects.
Supported by: National Natural Science Foundation of China (No. 81570734 to Y.W.)
Disclosure: K. Zhang: None.
94
No evidence for intra-islet paracrine hormone actions of GIP or GLP-1 to support glucose-stimulated insulin secretion from rat islets
O. Cabrera1, J. Ficorilli1, J.L. Shaw1, F. Echeverri2, O.G. Chepurny3, C.A. Leech3, F. Schwede4, G.G. Holz3;
1Diabetes and Complications Research, Eli Lilly and Company, Indianapolis, USA, 2Biorep Technologies, Inc., Miami Lakes, USA, 3SUNY Upstate Medical University, Syracuse, USA, 4BIOLOG Life Sci. Inst., Bremen, Germany.
Background and aims: Although GIP and GLP-1 are secreted from intestinal K-cells and L-cells in response to nutrient ingestion, controversy exists concerning whether both of these incretin hormones circulate at concentrations high enough to directly stimulate pancreatic insulin secretion. It is also uncertain whether GIP and/or GLP-1 act as intra-islet paracrine hormones so that their release from islet alpha-cells leads to increased insulin secretion due to the stimulation of GIP receptors (GIPR) and GLP-1 receptors (GLP-1R) located on islet beta-cells. The aim of the present study was to investigate the relative importance of GIP and GLP-1 to these multiple processes of regulated insulin secretion.
Materials and methods: Perifusion studies of SD rat islets were performed in which glucose-stimulated insulin secretion (GSIS) was initiated and terminated by a step-wise change of the glucose concentration (G) from 2.8 to 16.7 to 2.8 mM. Perifusion assays were also performed by imposing a linear gradient of increasing concentrations of glucose (3 to 30 mM). For all such assays, test peptides in 2.8G were administered 20 min prior to and then during exposure to elevated concentrations of glucose. Insulin release was quantified by ELISA relative to islet DNA content.
Results: Rat islets perifused at 2.8G exhibited 1st and 2nd phase GSIS in response to 16.7G. Administered GIP and GLP-1 potentiated both phases of GSIS, whereas neither was effective after treatment with a cAMP antagonist (Rp-8-Br-cAMPS-pAB). Synthetic cAMP analogs that selectively activate PKA (6-Bnz-cAMP-AM) or Epac (8-pCPT-2'-O-Me-cAMP-AM) also potentiated 1st and 2nd phase GSIS. Both GIP and GLP-1 enabled cAMP-dependent insulin secretion to occur during 2nd phase GSIS, whereas 2nd phase insulin secretion stimulated by glucose alone was largely cAMP-independent. Contrary to prior reports, inhibitors of PLC, PKC, and PKD acted on their own to stimulate insulin secretion rather than inhibiting the action of GLP-1 to potentiate GSIS. In side-by-side comparisons using step-wise or gradient assays of GSIS, GIP was at least 3-fold more potent than GLP-1 to potentiate GSIS. Low concentrations of GIP (10-100 pM) potentiated GSIS, whereas no such effect of GLP-1 was detected. Insulin secretion in response to glucose alone was not reduced by the GIPR antagonist GIP(3-30) or the GLP-1R antagonist Ex(9-39). However, these antagonists blocked the actions of administered GIP and GLP-1 to potentiate GSIS.
Conclusion: GIP at concentrations approximating that found in the circulation after a meal (10-100 pM) is more effective than GLP-1 to potentiate GSIS from rat islets. Intra-islet actions of endogenous GIP or GLP-1 to support GSIS were not detectable using GIPR and GLP-1R antagonists. Thus, levels of bioactive GIP and GLP-1 within rat islets appear to be too low to allow for their paracrine hormone regulation of GSIS in vitro.
Disclosure: O. Cabrera: Other; Over Cabrera, Janice Shaw, and James Ficorilli are employees of Eli Lilly and Company.
95
The circadian clock nuclear receptor Rev-erbα is implicated in autophagy alteration and beta cell deficit under diabetogenic conditions
S. Costes1, D. Laouteouet1, M. Ravier1, M. Delobel1, G. Bertrand1, O. Villard2, C. Broca2, J. Mathieu2, A. Wojtusciszyn2, S. Dalle1, A. Matveyenko3;
1Institute for Functional Genomics, Montpellier, France, 2Institute for Regenerative Medicine and Biotherapy, Montpellier, France, 3Mayo Clinic, Rochester, USA.
Background and aims: Type 2 diabetes (T2D) is characterized by hyperglycemia secondary to pancreatic beta-cell deficit. Circadian disruption is considered as a risk factor for T2D. At the molecular level, circadian rhythms are controlled by Clock-Bmal1 with nuclear receptor Rev-erbα as a repressor. In contrast to Clock and Bmal1, Rev-erbα has received little attention in beta-cells. Importantly, in addition to its circadian function, Rev-erbα is a repressor of the autophagy degradation pathway, the latter being crucial for beta-cell health. Nevertheless, little is known about the clock genes/autophagy interplay that may contribute to beta-cell failure in T2D. Therefore, in the present study, we set out to address whether Rev-erbα-mediated inhibition of autophagy caused by diabetogenic stress is involved in beta-cell deficit. The objectives are: 1) To evaluate the impact of Rev-erbα overexpression on beta-cell integrity and autophagy. 2) To investigate whether the negative modulation of Rev-erbα could protect beta-cells from diabetogenic stressors.
Materials and methods: Experiments were performed with pancreatic beta-cell lines (rat INS-1E, human EndoC-βH1) and human islets. Rev-erbα protein levels were evaluated by western blot analysis. Levels of LC3-II (marker of autophagosome number) and p62 (also known as sequestosome-1) were used to monitor autophagic degradation and evaluated by western blot. Since p62-positive inclusions are an additional marker for defective autophagy, p62 was also detected by immunofluorescence. Apoptosis was evidenced by cleaved caspase-3 emergence. Glucose-induced insulin secretion was assessed by Homogeneous Time Resolved Fluorescence (HTRF) technology.
Results: Exposure of INS-1E cells to either glucotoxicity (30 mM glucose for 48h) or cytokines (mix of IL-1β, TNFα and IFNγ for 24h) resulted in robust induction of Rev-erbα expression (1.5-2 fold, p<0.05) and corresponded with impaired autophagy flux characterized by increased protein levels of p62 (1.5-2 fold, p<0.05). Consistent with these data, exposure of beta-cells and human islets to a Rev-erbα agonist (SR9009) was characterized by impaired autophagy/lysosomal degradation as shown by increased LC3-II and p62 levels (p<0.05). Importantly, p62-positive inclusions were almost exclusively detected in SR9009-treated dispersed human beta-cells. As a consequence, defective glucose-stimulated insulin secretion (70 % decrease, p<0.05) and increased beta-cell apoptosis (increased cleaved caspase-3, p<0.01 vs vehicle) were detected in SR9009-treated INS-1E cells and human islets. In contrast, pharmacological inhibition of Rev-erbα (antagonist SR8278) or its knock-down by siRNA protected beta-cells from deleterious effects of glucotoxicity (INS-1E and EndoC-βH1) or cytokines-induced inflammation (INS-1E and human islets) by attenuating beta-cell apoptosis (~30%, p<0.05).
Conclusion: Taken together, these data reveal for the first time an underexplored link between the core circadian clock nuclear receptor Rev-erbα, autophagy and beta-cell failure under diabetogenic conditions. These data also suggest a therapeutic potential of elaborating new Rev-erbα-based strategies to preserve a functional beta-cell mass in T2D.
Disclosure: S. Costes: None.
96
The bidirectional regulation of the Hippo pathway and autophagy in pancreatic beta cells
K. Annamalai1, S. Naik1, T. Yuan1, B. Lupse1, D.-S. Lim2, K. Maedler1, A. Ardestani1;
1University of Bremen, Bremen, Germany, 2Department of Biological Sciences, KAIST, Daejeon, Republic of Korea.
Background and aims: A hallmark of beta-cell failure is the impairment in autophagy, an intracellular self-degradative catabolic process, which plays an important role in the recycling of cellular components, cell viability, stress response, and homeostasis. Understanding the molecular mechanisms, which lead to defective autophagy and beta-cell failure is urgently needed for beta cell protection and repair. LATS2, the central kinase of the Hippo pathway, is hyper-activated in beta cells under diabetic conditions and its overexpression induced beta-cell death and dysfunction. Conversely, LATS2 deficiency in beta cells and primary isolated human islets as well as beta-cell specific LATS2 ablation in mice improves beta-cell viability, insulin secretion, and beta-cell mass and ameliorated diabetes development. Mechanisms of LATS induced beta cell destruction are rarely understood; here, we unravel the mutual regulation of LATS2 and autophagy in beta cells.
Materials and methods: Firstly, the effect of LATS2 in modulating autophagic flux was analyzed by overexpression and genetic inhibition of LATS2 in the presence or absence of late-stage chemical inhibitors of autophagy in both INS-1E cells and isolated human islets. Secondly, to investigate whether autophagy reciprocally regulates the endogenous protein level of LATS2, we used three different autophagy inhibitors, namely, the combination of leupeptin/NH4Cl, Chloroquine, and BafilomycinA1. To provide direct evidence for the autophagic degradation of LATS2, intact lysosomes were isolated from LATS2 overexpressing beta cells, and subsequent LATS2 localization was analyzed. Thirdly, in order to identify the specific type of autophagy pathway that may be involved in the degradation of LATS2, we selectively targeted ATG7 and LAMP2A proteins, major essential components of canonical macroautophagy and CMA, respectively. Lastly, autophagosomes were isolated from LATS2-overexpressing GFP-LC3 expressing beta cells to detect LATS2 localization in autophagosomes; furthermore, we investigated the direct interaction of LATS2 and LC3, a key component of the autophagosome membrane.
Results: LATS2 overexpression exacerbated beta-cell apoptosis and further impaired autophagic flux, as represented by the strong accumulation of autophagy markers LC3-II and P62 in both INS-1E cells and human islets, treated with autophagy inhibitors. Conversely, LATS2 silencing reduced beta-cell apoptosis and restored the defective autophagic flux. This indicates that LATS2 regulates defective autophagy induced apoptosis and autophagic flux. Reciprocally, autophagy inhibition robustly upregulated endogenous LATS2 protein levels demonstrating that LATS2 acts as a potential substrate for autophagy-mediated protein degradation. In support of this, LATS2 protein levels were highly enriched in isolated intact lysosomes. Moreover, we observed that selective inhibition of macroautophagy but not CMA induced LATS2 upregulation, that isolated autophagosomes showed strong accumulation of LATS2 protein levels and that LATS2 and LC3 directly interact.
Conclusion: This unravels the novel bidirectional role of the Hippo kinase LATS2 and autophagy in the regulation of beta-cell survival.
Supported by: JDRF
Disclosure: K. Annamalai: None.
OP 17 Broken heart in diabetes
97
Clustering of patients with type 2 diabetes and established CV disease for prediction of disease progression and MACE (SAVOR-TIMI 53 trial)
Y. Aoki1, B. Hamrén1, L.E. Clegg2, C. Stahre3, D.L. Bhatt4,5, I. Raz6, B.M. Scirica4,5, J. Oscarsson3, B. Carlsson7;
1Clinical & Quantitative Pharmacology, AstraZeneca, Gothenburg, Sweden, 2Clinical & Quantitative Pharmacology, AstraZeneca, Gaithersburg, USA, 3Late CVRM, BioParmaceutical R&D, AstraZeneca, Gothenburg, Sweden, 4Brigham and Women’s Hospital Heart & Vascular Center, Boston, USA, 5Harvard Medical School, Boston, USA, 6Hadassah University Hospital, Jerusalem, Israel, 7Research and Early Development, CVRM, BioParmaceutical R&D, AstraZeneca, Gothenburg, Sweden.
Background and aims: Ahlqvist et al. proposed to apply k-means clustering of five essential glycemic control-related variables to subgroup patients with adult onset diabetes. Others have reported similar results indicating that this methodology is robust in terms of identifying diabetes subgroups. We aimed to investigate if clustering of diabetes essentially according to the method Ahlqvist et al. can be applied to a patient cohort with type 2 diabetes and established CV disease to investigate the clinical utility of the clustering to predict risk for disease progression and MACE.
Materials and methods: We have used a subset of SAVOR (Saxagliptin cardiovascular safety Phase-IV clinical trial) dataset that was approved for the secondary use of data, including both active and placebo arms. SAVOR included patients with type 2 diabetes. Type 1 diabetes was an exclusion criterion and patients on insulin therapy were excluded to be able to calculate HOMA2. We focused on the patient subpopulation who have established CV disease at baseline. As a result, 4644 patients with a mean follow up of 2.1 years and mean diabetes duration of 8.69 years were included. We clustered the cohort essentially according to Ahlqvist et al. into four subgroups using k-means clustering with the following five covariates: HOMA2-IR, HOMA2-B, HbA1c, age at diagnosis, and BMI. Disease progression was determined as addition of new diabetic medications and cardiovascular event as the composite six-point MACE (cardiovascular death, myocardial infarction, Stroke, Hospitalization for heart failure, Hospitalization for unstable angina, coronary revascularization). The multivariate Cox proportional hazard model was used to quantify the relative risk of each endpoint for the clusters.
Results: Patients from the SAVOR trial were successfully clustered into four groups: severe insulin-deficient diabetes (SIDD) 17%, severe insulin-resistant diabetes (SIRD) 17%, mild obesity-related diabetes (MOD) 27%, mild age-related diabetes (MARD) 38%, replicating the overall patterns of the baseline covariate values as presented by Ahlqvist et al. The age and sex adjusted hazard ratios for the diabetes progression for SIDD, SIRD, MOD as compared to MARD were 2.68 (95% confidence interval, 2.29-3.13), 1.45 (1.23-1.70), 1.41 (1.20-1.65), respectively. Similarly, the age and sex adjusted hazard ratios for the six-point MACE were 1.34 (1.04-1.74), 1.33 (1.05-1.69), and 1.13 (0.89-1.43), respectively.
Conclusion: We show that diabetes subgroups defined by Ahlqvist et al. can be reproduced in a randomized controlled trial dataset of patients with type 2 diabetes with established CV disease. Diabetes progression was predicted by the clustering but there were no major differences with respect to MACE. Thus, we believe a more efficient algorithm to segment diabetes population with established CV disease is desirable in order to optimize the clinical care for the secondary prevention of MACE in patients with diabetes.
Disclosure: Y. Aoki: Employment/Consultancy; AstraZeneca. Stock/Shareholding; AstraZeneca.
98
Association of incident myocardial infarction with insulin resistance and liver fibrosis
C. Möser1,2, O.P. Zaharia1,2, M. Rothe1,2, J.-H. Hwang1,2, P. Bobrov3,2, V. Burkart1,2, F. Bönner4, C. Jung4, M. Kelm4, M. Roden1,5, J. Szendrödi1,5;
1Institute for Clinical Diabetology, German Diabetes Center, Düsseldorf, 2German Center for Diabetes Research (DZD), München-Neuherberg, 3Institute for Biometrics and Epidemiology, German Diabetes Center, Düsseldorf, 4Division of Cardiology, Pulmonary Disease and Vascular Medicine, Medical Faculty, Heinrich-Heine-University, Düsseldorf, 5Division of Endocrinology and Diabetology, Medical Faculty, Heinrich-Heine-University, Düsseldorf, Germany.
Background and aims: Insulin resistance and non-alcoholic fatty liver disease associate with increased risk of cardiovascular disease and predict a worse outcome. The mechanisms underlying the link between the two disease disorders are yet unclear. We hypothesized that individuals suffering from their first acute myocardial infarction (MI) already feature not only lower whole-body insulin sensitivity (M-value) and myocardial ejection fraction (EF), but also higher hepatocellular lipids (HCL) and liver fibrosis estimates (MRE) than matched individuals without MI.
Materials and methods: We compared participants of the DISTEMI (DIabetes and ST-Elevation MI) Study at 6-12 weeks after MI (MI+; n=21, 81% male, 29% type 2 diabetes, age 61±8 years, BMI 26.8±2.8 kg/m2, HbA1c 5.8±1.0 %) with humans without MI (MI-; n=34, 71% male, 32% type 2 diabetes, age 57±8 years, BMI 27.8±3.1 kg/m2, HbA1c 5.5±0.6 %). Participants were matched for sex, age, HbA1c and BMI. Participants underwent a 75-g OGTT and a hyperinsulinemic-euglycemic clamp test to measure insulin sensitivity. The respiratory quotient (RQ) was measured by indirect calorimetry. HCL, MRE, EF, infarct size and microvascular obstruction (MVO) were measured with magnetic resonance spectroscopy (1H), elastography and imaging, respectively.
Results: MI+ had a lower whole-body insulin sensitivity compared to MI- (M-value: 7.3±2.0 vs. 9.0±3.1 mg*kg-1*min-1, p<0.05). HCL was comparable (2.9±2.8% vs. 5.7±6.7%) between groups, while MRE was higher in MI+ compared to MI- (2.5±0.4 kPa vs. 2.1±0.4 kPa, p<0.05). EF was lower in MI+ than in MI- (53±16% vs. 65±7%, p<0.05). In MI+, EF correlated negatively with infarct size (r=-0.91) and MVO (r=-0.82) as well as with HbA1c (r=-0.61), fasting blood glucose (r=-0.61) and urinary albumin (r=-0.67, all p<0.05). Furthermore, MI+ featured a positive correlation of EF with RQ under fasted conditions (r=0.73) and HDL cholesterol (r=0.68, both p<0.05).
Conclusion: Individuals with incident MI have lower whole-body insulin sensitivity, reduced ejection fraction and higher liver fibrosis estimates than humans without MI, which relate to worse glucose metabolic control and may contribute to increased risk of heart failure and re-infarction after the first MI.
Supported by: SFB 1116
Disclosure: C. Möser: None.
99
Ketone bodies acutely affect cardiac autonomic function in patients with type 2 diabetes
N.J. Jensen1, M. Nilsson1, N. Møller2, A. Sajadieh3, P. Kumarathurai3, J. Rungby1,4;
1Department of Endocrinology, Bispebjerg University Hospital, Copenhagen, 2Department of Endocrinology, Aarhus University Hospital, Aarhus, 3Department of Cardiology, Bispebjerg University Hospital, Copenhagen, 4Copenhagen Center for Translational Research, Copenhagen University Hospital, Bispebjerg and Frederiksberg, Copenhagen, Denmark.
Background and aims: Ketone bodies are important alternative fuels for the diabetic heart and improve left ventricular function in heart failure by increasing both stroke volume and pulse rate with little or no change in blood pressure. Further, ketone bodies may have beneficial effects in other organ systems in persons with diabetes. Increased cardiovascular mortality, often related to diabetes, is associated with cardiac autonomic dysfunction. Since ketone bodies may be part of our future therapeutic armamentarium, we aimed to investigate if a ketone body infusion acutely affects cardiac autonomic function, in particular heart rate variability (HRV), in patients with type 2 diabetes.
Materials and methods: In this randomised cross-over study, 17 patients with type 2 diabetes received i.v. ketone body (beta-hydroxybutyrate) and placebo (saline) infusion in a randomised order on two separate occasions. On both visit days blood glucose was clamped at 7.5 mmol/L and short term HRV (measuring sympatho-vagal balance) was assessed before treatment (Pre treat), during rest (REST), and during mental assignments (STRESS). Measures of HRV were SD of beat-to-beat (NN) intervals (SDNN), root mean square of successive differences in NN intervals (RMSSD), and power in high-frequency (HF) and low-frequency (LF) range.
Results: Beta-hydroxybutyrate levels increased during the ketone infusion (2.4 ± 0.6 mM vs. 0.1 ± 0.6 mM during placebo). Compared to placebo, ketone infusion increased heart rate by 13.7 ± 1.2 bpm (p <0.001) and decreased both vagally derived HRV (RMSSD and HF), and mixed sympathetic-parasympathetic derived HRV (SDNN and LF), p<0.001 for all. However, LF/HF ratio did not change significantly. The changes in HRV remained significant after adjusting for heart rate (p<0.05). Blood pressure did not differ between the two treatments.
Conclusion: Increasing beta-hydroxybutyrate levels by infusion during rest and stress from mental assignments, significantly increases heart rate and decreases all measures of HRV except LF/HF ratio indicating an acutely reduced vagal activity and likely also an increased sympathetic activity.

Clinical Trial Registration Number: NCT03657537
Disclosure: N.J. Jensen: None.
100
High urinary dimethylamine and low urinary citrate are associated with coronary artery disease in individuals with type 1 diabetes
A. Antikainen1,2, S. Mutter1,2, N. Sandholm1,2, C. Forsblom1,3, P. Würtz4, V. Harjutsalo1,5, P.-H. Groop2,3;
1Folkhälsan Institute of Genetics, Folkhälsan Research Center, Helsinki, 2Research Program for Clinical and Molecular Metabolism, Faculty of Medicine, University of Helsinki, Helsinki, 3Abdominal Center, Nephrology University of Helsinki and Helsinki University Hospital, Helsinki, 4Nightingale Health Ltd, Helsinki, 5National Institute for Health and Welfare, Chronic Disease Prevention Unit, Helsinki, Finland.
Background and aims: Individuals with type 1 diabetes (T1D) have an increased risk of coronary artery disease (CAD) compared to the general population. Metabolomics of urine and blood may provide new insights into the disease mechanisms and tools for early identification of high-risk individuals. We therefore investigated whether urinary metabolites are associated with CAD in individuals with T1D.
Materials and methods: The study included 3,387 individuals with T1D (385 CAD cases) from the Finnish Diabetic Nephropathy Study. Individuals with end-stage renal disease or a CAD event prior to the baseline visit were excluded. Baseline urine samples were analyzed with nuclear magnetic resonance (1H NMR) and the measured metabolite concentrations were normalized by urine creatinine, log-transformed and standardized. All individuals were followed up until the first CAD event or the end of 2017 (mean of 14.1±5.0 years). Associations of 31 metabolites with CAD were evaluated with Cox proportional hazard models adjusted for sex, diabetes onset calendar year and presence of diabetic nephropathy. A Bonferroni corrected p-value of 0.0016 was considered significant. We also analyzed metabolite interaction differences between the cases and controls with correlation-based networks and assessed the statistical significances with network permutations.
Results: Dimethylamine (HR per SD of 1.19 [1.08-1.31], p=0.00039) and citrate (0.88 [0.81-0.95], p=0.00058) were significantly associated with CAD. In addition, we observed nominal associations for 3-hydroxyisobutyrate (0.84 [0.76-0.94], p=0.0029), pseudouridine (1.16 [1.04-1.29], p=0.0068), 3-hydroxyisovalerate (0.86 [0.78-0.96], p=0.0079) and xanthosine (1.13 [1.02-1.26], p=0.026). Correlation network analysis suggested rather similar between-metabolite correlation structures for those with and without CAD. However, dimethylamine and xanthosine were stronger correlated with each other in cases than in controls (rcases/controls: 0.40/0.13, p=0.0039), while the negative correlation between dimethylamine and creatinine was stronger for cases (rcases/controls: -0.40/-0.17, p=0.0065). Citrate was more strongly correlated with 1-methylnicotinamide among individuals with CAD (rcases/controls: 0.22/0.037, p=0.0051).
Conclusion: Urinary dimethylamine and citrate are associated with CAD in individuals with T1D. Urinary dimethylamine is a degradation product of asymmetric dimethylarginine, and thus linked to the nitric oxide pathway. Urinary citrate has been associated with calcium reabsorption from the proximal tubule and with arterial calcification. Finally, the correlation-network analysis provides links between CAD and kidney disease as metabolites in the dimethylamine sub-network (xanthosine, creatine, urea and 4-hydroxyhippurate) are related to kidney disease and uremia.
Supported by: Folkhälsan Research-, Wilhelm and Else Stockmann- and Liv och Hälsa Foundations, HUS Research Funds
Disclosure: A. Antikainen: None.
101
Liraglutide and vascular inflammation in type 2 diabetes as assessed by FDG-PET/CT: the LiraFlame study
R. Ripa1, E.H. Zobel2, B.J. von Scholten2, L.J. Diaz2, J.K. Jensen1, V.R. Curovic2, T.W. Hansen2, P. Rossing2,3, A. Kjaer1;
1Dept of Clinical Physiology, Nuclear Medicine & PET and Cluster for Molecular Imaging, Rigshospitalet and University of Copenhagen, Copenhagen, 2Steno Diabetes Center Copenhagen, Copenhagen, 3University of Copenhagen, Copenhagen, Denmark.
Background and aims: The mechanism behind the cardiovascular protection in type 2 diabetes (T2D) observed with human glucagon-like peptide-1 receptor agonists (GLP-1 RA) is unknown. We hypothesized that treatment with the GLP-1 RA liraglutide, had a positive effect on vascular inflammation.
Materials and methods: In a double-blind trial, we randomly assigned 102 persons with T2D to liraglutide up to 1.8 mg or placebo once daily for 26 weeks. The primary outcome was 18F-fluorodeoxyglucose (18F-FDG) PET/CT assessment of change in vascular inflammation. Carotid and aortic FDG uptake was quantified as target to background ratio (TBR) using venous blood uptake as background. Active segment analysis including only vascular segments with TBR>1.6 was the prespecified primary endpoint and most diseased segment analysis was a secondary endpoint.
Results: Mean age was 66.4 (SD 8.2) years and 16% were women; median [IQR] diabetes duration was 10.9 [5.7; 18.2] years and mean HbA1c was 58.4 (10.1) mmol/mol; 17% reported a history of cardiovascular disease (CVD). Ninety-eight participants (96%) underwent PET/CT at both baseline and week 26. Baseline characteristics were balanced between the two groups. Liraglutide significantly reduced HbA1c [mean change liraglutide vs. placebo (95% CI): -5.1 (-8.0; -2.0) vs. -0.1 (-1.9; 1.7) mmol/mol, (p=0.006)] and weight [-3.7 (-4.8;-2.6) vs -0.2 (-0.8; 0.4) kg, (p<0.001)]. LDL-cholesterol and systolic blood pressure were unchanged (p≥0.40). Vascular inflammation was unchanged in the carotid arteries and aorta combined (Figure) [mean TBR change liraglutide vs. placebo (95% CI): -0.04 (-0.17; 0.08) vs -0.09 (-0.19; 0.01) in active segment (p=0.53) and -0.22 (-0.40;0.03) vs -0.24 (-0.44;0.04) in most diseased segment (p=0.87) analysis; analyses restricted to the carotid arteries showed similar results in active segment (p=0.96) and in most diseased segment (p=0.62). The exploratory analysis compared change in carotid inflammation in participants with (n=17) and without (n=81) a history of CVD (Figure). In the liraglutide group participants with CVD had a larger decrease in inflammation compared to participants without [-0.59 (-1.23; 0.05) vs -0.13 (-0.30; 0.04), p=0.04] in most diseased segment analysis. A similar difference was not seen in the placebo group [-0.17 (-1.17; 0.84) vs -0.30 (-0.49; -0.12), p=0.62]. Moreover, a borderline significant interaction (p=0.06) between treatment group and history of CVD was demonstrated for predicting change in carotid inflammation.
Conclusion: In this low to moderate risk population with T2D, liraglutide did not change vascular inflammation compared to placebo, however, data indicated a decrease in vascular inflammation in the carotid arteries in persons with CVD.

Clinical Trial Registration Number: NCT03449654
Disclosure: R. Ripa: Employment/Consultancy; Novo Nordisk. Grants; Novo Nordisk.
102
Estimating CVD-free life-years with the addition of semaglutide in people with type 2 diabetes using pooled data from SUSTAIN 6 and PIONEER 6
J. Westerink1, K. Sommer Matthiessen2, S. Nuhoho2, U. Fainberg2, M. Lyng Wolden2, F. Visseren1, N. Sattar3;
1University Medical Center, Utrecht, Netherlands, 2Novo Nordisk A/S, Søborg, Denmark, 3Institute of Cardiovascular and Medical Sciences, University of Glasgow, Glasgow, UK.
Background and aims: CVD is the leading cause of disability and death in people with type 2 diabetes (T2D). In a post hoc analysis of pooled data (POOLED cohort) from two phase 3, randomized cardiovascular outcomes trials, SUSTAIN 6 and PIONEER 6, the addition of the glucagon-like peptide-1 analogue semaglutide to standard of care (SoC) in people with T2D at high risk of CVD significantly reduced the risk of major adverse CVD events (3-point MACE: CV death, non-fatal stroke, non-fatal myocardial infarction). The purpose of this study was to estimate the effect of adding semaglutide to SoC on CVD-free life-years and 10-year CVD risk in patients with T2D by predicting individual patient-level risk of CVD events in the POOLED cohort using the Diabetes Lifetime-perspective prediction (DIAL) CVD risk model.
Materials and methods: The 3-point MACE hazard ratio from the POOLED cohort (N = 6480; HR = 0.76 [95% CI: 0.62-0.92]) was applied to the patient-level lifetime risk of CVD events derived from the DIAL model. CVD-free life-years and 10-year CVD risk were then calculated based on the age-specific risks of CVD events and non-vascular mortality, using standard actuarial methods. Both new and recurrent CVD events were considered. The DIAL model was validated by comparing the predicted and observed number of CVD events after 1 year. The DIAL model was previously developed using data from people with T2D in the Swedish National Diabetes Registry and validated across geographical regions.
Results: The DIAL model was considered valid for use in the POOLED cohort because the predicted number of CVD events at 1 year was within 5% of the number observed. Adding semaglutide to SoC was associated with a mean reduction in 10-year CVD risk of 20.0% (95% CI: 6.4-32.6%) and a mean increase of 1.72 (95% CI: 0.52-2.96) CVD-free life-years. The number of mean CVD-free life-years gained ranged from 0.62 to 2.91 years between age groups (Table). For a 60-year-old male with baseline characteristics matched to the average male from the POOLED cohort, adding semaglutide to SoC reduced 10-year CVD risk by 20.8% and provided 2.53 additional CVD-free life-years. The number of CVD-free life-years decreased when baseline age was increased.
Conclusion: The addition of semaglutide to SoC was associated with a gain in CVD-free life-years. This analysis helps to contextualize the results of cardiovascular (CV) outcomes trials and may help to inform clinical decision-making. Note: Data submitted for presentation at the European Society of Cardiology Congress, 29 August-2 September 2020, Amsterdam, Netherlands.
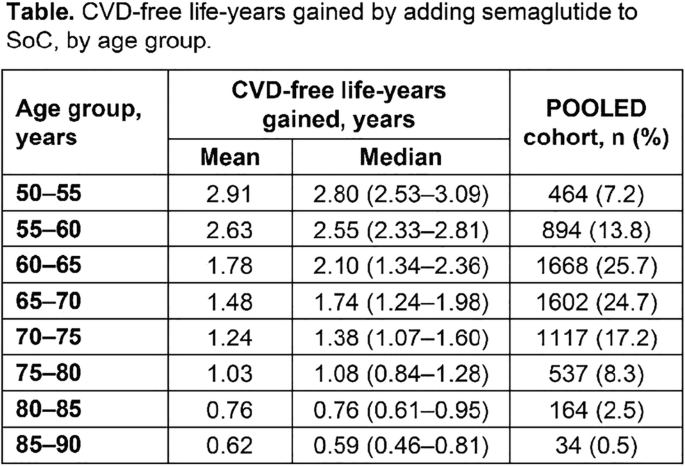
Clinical Trial Registration Number: SUSTAIN 6 (NCT01720446) and PIONEER 6 (NCT02692716)
Supported by: Funded by Novo Nordisk A/S
Disclosure: J. Westerink: None.
OP 18 Unlocking the potential of digital health
103
Mobile health application usage shows long-term improvement on blood glucose control
V. Eichinger, J. Kober, R. Biven, L. Schuster, J. Wrede;
Medical & Research, mySugr GmbH, Vienna, Austria.
Background and aims: Self-managing a chronic illness can be challenging for patients. On average, people with diabetes make up to 180 extra decisions on diabetes management per day. Therefore, the continuous usage of mobile health (mHealth) applications might help users control their blood glucose (BG) more efficiently. Previous real world data (RWD) analysis showed significant improvement in blood glucose control with the use of an mHealth application for people with type 1 diabetes (T1D) after six months. New RWD analyses were conducted to look at a potential sustainable, clinically relevant effect on diabetes self-management in engaged users after six and twelve months. Subpopulation analyses were conducted to compare impact on users with T1D and T2D, as well as different therapy types.
Materials and methods: This retrospective study applied the following inclusion criteria to users of an mHealth app: mean blood glucose (mean BG) ≥183mg/dl, representing an estimated HbA1c (eHbA1c) ≥8% at baseline, engaged logging behaviour ( ≥2 logs/day on ≥14 days per 30 days) and recurring app usage of at least 12 months. Changes in BG control (mean, standard deviation (SD) and eHbA1c) were analysed in the selected user group as well as in its subpopulations, focusing on diabetes and therapy types. Monthly data from the first log (t0) up to 6 months (t1) and 12 months (t2) was analysed.
Results: 5,751 users met the inclusion criteria; 50.11% with T1D, 45.30% with T2D and 4.59% with other or unknown diabetes types. Baseline mean BG was 218.56 ± 74.37mg/dl (eHbA1c 9.24%) at t0, dropping to 190.20 ± 63.66 mg/dl (eHbA1c 8.25%) at t1. At t2 a sustained effect with a mean BG of 189.64 ± 63.69mg/dl (eHbA1c 8.23%) could be shown. Data analysis showed clinically relevant decreases of mean BG / eHbA1c in all distinct subgroups, regardless of diabetes or therapy type, respectively. At t2 the mean BG decreased from 216.85 ± 88.09mg/dl (eHbA1c 9.18%) to 200.60 ± 81.87mg/dl (eHbA1c 8.62%) for people with T1D. For people with T2D the mean BG decreased from 219.99 ± 59.88mg/dl (eHbA1c 9.29%) at t0 to 180.24 ± 45.91 mg/dl (eHbA1c 7.91%) at t2. Further analysis of the T2D user group showed a decrease in mean BG from 220.20 ± 62.25mg/dl (eHbA1c 9.30%) at t0 to 186.81 ± 50.33mg/dl (eHbA1c 8.14%) at t2 for insulin-dependent pen-users. In comparison, the 643 users that belong to the subgroup of insulin-independent users, had the largest decrease in mean BG, from 219.55 ± 52.72mg/dl (eHbA1c 9.28%) at t0 to 157.46 ± 29.53mg/dl (eHbA1c 7.11%) at t2.
Conclusion: Our RWD shows sustainable improvement in the quality of blood glucose control of high risk populations (eHbA1c ≥8% at baseline) with T1D as well as T2D over twelve months. A clinically relevant decrease in eHbA1c (≥ 0.3% according to EMA guidelines) by 1.01% at twelve months of mHealth application usage is shown. In comparison, the improvement of eHbA1c (1.38%) in T2D is more than twice as strong as in T1D (0.57%). Moreover, we see different positive effects in the distinct subgroups of diabetes as well as therapy types. The analysed data indicate that insulin-independent people with T2D might benefit the most from using the self-management diabetes app. Their mean BG was shown to decrease by 28.28% and SD by 44.00%. Our calculation shows an average reduction in eHbA1c of 2.16%. Although this work indicates a strong positive impact of the usage of mHealth applications in diabetes therapy, further prospective studies are necessary to verify our findings.
Disclosure: V. Eichinger: None.
104
Glycaemic control among people with type 1 diabetes during lockdown against the SARS-CoV-2 outbreak in Italy
F. Boscari, B.M. Bonora, A. Avogaro, D. Bruttomesso, G.P. Fadini;
Department of Medicine, Unit of Metabolic Disease, University of Padova, Padova, Italy.
Background and aims: In late February 2020, due to the spread of severe acute respiratory syndrome coronavirus-2 (SARS-CoV-2), the Italian Government closed educational and sport activities. In March, several areas underwent an almost complete lockdown. We report the impact of these restrictions on glucose control among people with type 1 diabetes (T1D).
Materials and methods: We included data on 33 individuals with T1D who were using the flash glucose monitoring (FGM) system and were remotely connected to the diabetes clinic. We retrieved information on average glucose, standard deviation, and percent time in hypoglycemia (<70 mg/dl), glucose range (70-180 mg/dl) and hyperglycemia (>180 mg/dl). We compared glycemic measures collected during lockdown to those collected before SARS-CoV-2 epidemic, and the periods immediately before lockdown.
Results: In 20 patients who stopped working, overall glycemic control improved during the first 7 days of lockdown as compared to the weeks before SARS-CoV-2 spread. Average glucose declined from 177±45 mg/dl (week before) to 160±40 mg/dl (lockdown; p=0.005) and standard deviation improved significantly. Time in range increased from 54.4% to 65.2% (p=0.010) and time in hyperglycemia decreased from 42.3% to 31.6% (p=0.016). The number of scans per day remained unchanged. In 13 patients who continued working, none of the measures of glycemic control improved during lockdown.
Conclusion: Despite limited possibility to exercise and incumbent psychologic stress, glycemic control improved during lockdown in patients with T1D who stopped working. Thus, slowing routine daily activities can have beneficial effects on T1D management, at least in the short term.
Disclosure: F. Boscari: None.
105
Real-time CGM usage and estimates of glycaemic control among individuals with type 1 or type 2 diabetes
R. Dowd, G. Norman, J.B. Welsh, T. Walker, A. Parker;
Dexcom, Inc., San Diego, USA.
Background and aims: Demographics and comorbidities are substantially different for individuals with type 1 diabetes (T1D) and type 2 diabetes (T2D), as is the prevalence of continuous glucose monitoring (CGM) utilization. Because CGM lowers the risk of iatrogenic hypoglycemia, it is often reserved for people using antihyperglycemic drugs such as insulin and sulfonamides. CGM-related behaviors and glycemic parameters of people with T2D who use CGM are therefore of interest. We aimed to quantify and compare individuals with T1D and T2D with respect to their usage of CGM features and glycemic control.
Materials and methods: Data were from anonymized, US-based users of the Dexcom G6 CGM System (Dexcom, Inc., San Diego, CA) who had uploaded in the 2019 calendar year and were associated with a valid ICD-10 code indicating a diagnosis as either T1D (E10.X) or T2D (E11.X). Time in range (TIR) was defined as the percentage of sensor glucose values (SGVs) 70-180 mg/dL (3.9-10 mmol/L). Usage of CLARITY, a system for retrospective review of CGM data, was defined as logging in at least once in 2019. The G6 System includes a discretionary "Urgent Low Soon" (ULS) predictive alert that is enabled by default. Persistence was defined as the percentage of observed days in which ≥ 1 SGV was uploaded. "Followers" were individuals with real-time remote access to the CGM users' data. Rebound hyperglycemia was defined as any series of SGVs >180 mg/dL starting within 2 hours of an SGV <70 mg/dL; iatrogenic hypoglycemia was defined as any series of SGVs <70 mg/dL starting within 2 hours of an SGV >180 mg/dL.
Results: Data from 3,790 individuals with T2D and 5,426 individuals with T1D were available for analysis. Compared to individuals with T1D, individuals with T2D were older (51.6 vs. 33.2 years), had generally better control as gauged by TIR (62.0% vs. 57.4%) and the percentage of SGVs <70 mg/dL (1.1% vs. 2.5%), and less glycemic variability as gauged by coefficient of variation of CGM values (30% vs. 36%). Persistence was high, with ~88% of observed days including ≥1 uploaded SGV in both groups, as was the proportion of users who engaged with CLARITY (~90% in both groups) and enablement of the ULS feature (~96% in both groups). The proportion of people with at least one Follower was higher among those with T1D than among those with T2D (63.1% vs. 40.4%, respectively). Episodes of rebound hyperglycemia and iatrogenic hypoglycemia were more prevalent, more frequent, more durable, and more severe (as judged by area under the curve, AUC) among those with T1D than those with T2D (Table).
Conclusion: These data suggest that patients with T2D can benefit from real-time awareness of their glucose levels and from using CGM features to help manage their diabetes. The adequacy of glycemic control for CGM users with T2D was comparable to or better than that for CGM users with T1D.

Disclosure: R. Dowd: Employment/Consultancy; Dexcom, Inc.
106
Beyond BG testing: digital health and intelligent monitoring
D. Shearer1, K. Snow2, A. Iyer3, M. Peeples3;
1Lifescan, Malvern, 2Aetna/CVS Health, Boston, 3Welldoc, Columbia, USA.
Background and aims: Health apps empower people to manage their health while enabling healthcare professionals to monitor patient progress and make informed treatment decisions. The OneTouch Reveal Plus® app (Powered by BlueStar®) syncs blood glucose readings from the Verio Flex®(VF) meter and analyzes the data to provide real-time guidance to the user and clinical decision support to HCPs. This prospective study evaluated the adoption of OTRP. Aims: Evaluate the impact of the OTRP app on BG control through a pre-post study of A1C, average BG, incidence of hypoglycemia and hyperglycemia, medication adherence, health care utilization and cost. Additional analysis included participant characteristics and engagement.
Materials and methods: Aetna members with Type 2 diabetes, with an A1C of ≥ 7.5%, on any diabetes medication, were contacted electronically. Interested participants completed an on-line consent form and were offered OTRP app, and the VF meter for 6 months. 291 subjects activated OTRP. Participants used the VF meter per their provider and received usual care. They used OTRP guided by the in-app, AI-generated coaching. No face-face interactions occurred as per study design. Participants could contact customer care for technology support.
Results: In 67 completed participants, a paired analysis of Aetna data on those who completed 6 months with an A1C, demonstrated a positive trend toward a lower A1C compared to baseline. Of note was the reduction in users with an A1C greater than 8 from 25% to 13%; with an increase in those in the 7-8 category (increased from 28% to 42%). At month 6, a statistically significant drop in maximum and average BG values was noted (n= 8,779 BG) - Max BG from 311 mg/ dL at month 1 to 246 mg/dL at month 6 (p= 0.034). A decrease in fasting BG was noted at 6 months (p=0.030) - from 162 mg/ dL to 152 mg/dL. The proportion of non-insulin users stayed relatively flat from baseline to follow up indicating that improvement in A1C and average BG was probably not driven by changes in medication but rather by factors attributed to OTRP. Average engagement in OTRP was 30 times/wk/person, totaling 31,663 suggesting an effective mechanism to improve self-management. Ratio of Daily Active Users (DAU) to Monthly Active Users (MAU) was 0.5. Strong engagement was demonstrated by 64% of members with a ‘guided journey’ and almost half of participants engaged with in-app curriculum. Members on differing medication regimens demonstrated a balanced engagement with management of BG, food, medications, activity, sleep and education. A statistically significant drop in average (p=0.034) BG values was observed over this time period (n= 8,779 BG values) as was average fasting BG (p=0.030; n=2,443 BG values) which correlated with a positive trend towards lower A1c. Diabetes related and all-cause ER visits and costs decreased from baseline to follow-up by 55% (p-value=0.0231).
Conclusion: Use of OTRP was associated with significant improvements in glycemic control after 3 and 6 months. This study suggests that real-time availability of patient data can assist users and HCPs to improve glycemic control and shift from scheduled care to data-driven care. Leveraging technology for intelligent monitoring - beyond glucose testing to include lifestyle and psychosocial monitoring provides robust data for treatment. The higher frequency and breadth of engagement may be the “active ingredient” to influence outcomes and bend the cost curve especially as in-person interactions with HCPs are challenged by global pandemics.
Disclosure: D. Shearer: None.
107
Change in HbA1c with and without intermittent use of continuous glucose monitoring in adults with type 2 diabetes participating in a virtual diabetes clinic
J.E. Layne1, H. Zisser2, R.M. Bergenstal3,4, R.A. Gabbay5,6, N.A. Barleen1, A. Armento Lee2, R.F. Dixon1;
1Onduo LLC, Newton, 2Verily Life Sciences, South San Francisco, 3International Diabetes Center at Park Nicollet, Minneapolis, 4HealthPartners Institute, Minneapolis, 5Joslin Diabetes Center, Boston,
6Harvard Medical School, Boston, USA.
Background and aims: The Onduo Virtual Diabetes Clinic (VDC) for people with type 2 diabetes (T2D) combines a mobile app, remote personalized lifestyle coaching, connected devices and live video consultations with board-certified endocrinologists for medication management and prescription of real-time continuous glucose monitoring (rtCGM) devices for intermittent use. This retrospective analysis examined change in HbA1c in VDC participants who used rtCGM intermittently compared to those who did not use CGM.
Materials and methods: Adults ≥18 years of age with T2D who enrolled in the VDC program from February 2018 through April 2019 with baseline and follow-up HbA1c values at 6 months were included. The rtCGM group was required to have used CGM ≥30 days prior to the follow-up HbA1c measurement. Outcomes included within group change in mean HbA1c with and without rtCGM use. Between group comparisons for change in HbA1c stratified by baseline categories of >9.0%, 8.0 to 9.0%, 7.0 to <8.0%, <7.0% and by <8.0% and ≥8.0% were evaluated by a two-sample t-test.
Results: Overall, participants (n=612) were (mean±SD): 53.5±8.7 years of age, 61.1% female and 26.5% lived in a rural geography. Baseline HbA1c was 7.8%±1.7, 33.0% were on insulin and 23.5% on a sulfonylurea. Characteristics of rtCGM group (n=213) and the no CGM group (n=399) were similar. HbA1c decreased significantly in the rtCGM group and in the no CGM group by 0.9%±1.7 and 0.4%±1.3, respectively (both p<0.001). Between group changes in HbA1c stratified by CGM use and baseline HbA1c categories are presented in the Table. There was an approximately two-fold greater improvement in HbA1c with intermittent rtCGM use in participants not meeting ADA HbA1c treatment targets compared to those with no CGM use. When stratified by a baseline HbA1c ≥8.0%, a significant greater proportion of the rtCGM group compared to the no CGM group had a follow-up HbA1c that meet the Healthcare Effectiveness Data and Information Set (HEDIS) treatment target of HbA1c <8.0%, 73.6% vs 47.5%, respectively (p<0.001).
Conclusion: The results indicate that participation in the VDC for 6 months was associated with significant improvement in HbA1c in all participants with greater benefit observed in rtCGM users. In conclusion, the VDC has potential to support people with T2D and their clinicians between office visits by increasing access to specialist care and advanced diabetes technology including rtCGM for intermittent use.

Disclosure: J.E. Layne: Employment/Consultancy; Employee of Onduo, LLC, the study Sponsor.
108
Evaluation of the one year efficiency of the EDUC@DOM telemonitoring and tele-education programme for type 2 diabetic patients
N. Costa1,2, M. Mounié1,2, J. Martini3, C. Latorre1, J.-C. Buisson4, M.-C. Chauchard3, J. Delaunay3, S. Schiir-Bonnans3, S. Taoui3, B. Lepage5,2, H. Colineaux5,2, P. Gourdy3, L. Molinier1,6, H. Hanaire3, M.-C. Turnin3;
1Health Economic Unit - Medical Information Department, University Hospital of Toulouse, Toulouse, 2Umr 1027, National Institute for Health and Medical Research (INSERM) - Toulouse III University, Toulouse, 3Department of Endocrinology, University Hospital of Toulouse, Toulouse, 4National School of Electrical Engineering, Electronics, Computer Science, Hydraulics and Telecommunications, Toulouse, 5Department of Epidemiology and Public Health, University Hospital of Toulouse, Toulouse, 6Umr 1027, National Institute for Health and Medical Research, Toulouse, France.
Background and aims: Due to its high prevalence and cost of care, estimated at 19 billion euros in France in 2018, diabetes is a major public health issue. A glycemic imbalance generates chronic complications responsible for a significant costs increase. The objective of this study is to assess the efficiency at one year, in France, of the EDUC@DOM telemonitoring and tele-education program for type II diabetic patients.
Materials and methods: Clinical data are from a randomized controlled interventional trial. The costs of treatment were estimated from the French National Health Data System (SNDS). Health insurance perspective was taken into account. Direct costs and those resulting from absences from the workplace were included. The efficacy endpoint was a decrease in the level of glycated hemoglobin (HbA1c). Missing data were imputed using the multiple imputation method. Costs and efficiency were adjusted from a multi-level model. The incremental cost-effectiveness and the confidence ellipse were then estimated from predicted values and bootstrap samples.
Results: Two hundred and fifty-six patients were included in the analyzes. Health care costs and indirect costs were estimated at € 10,989 for the remote-monitored group and € 13,120 for the control group, resulting from a difference of around 20%. The average HbA1c level was 7.49 and 7.67, respectively. Once adjusted, and according to the confidence ellipse presented in figure 1, the remote monitoring procedure was estimated to be "cost saving".
Conclusion: The EDUC@DOM telemonitoring and tele-education program is cost-saving and allow the optimization of type 2 diabetic patient’s care and in particular their glycemic balance. This program could help prevent complications and decrease associated costs. Additional data will be required to obtain results over a longer time horizon to confirm these results.

Clinical Trial Registration Number: NCT01955031
Disclosure: N. Costa: Grants; French Ministry of Health.
OP 19 Decoding the heritable basis of type 2 diabetes
109
The expression quantitative trait (eQTL) landscape of type 2 diabetes in 404 human islet samples
A. Piron1,2, L. Alonso3, I. Morán3, M. Defrance2, M. Guindo3, S. Bonàs4, J. Ferrer5, A.L. Gloyn6, J.L.S. Esguerra7, L. Marselli8, P. Marchetti8, D.L. Eizirik1, D. Torrents3, M. Cnop1, J. Mercader9;
1ULB Center for Diabetes Research, Université Libre de Bruxelles, Bruxelles, Belgium, 2Interuniversity Institute of Bioinformatics in Brussels (IB2), Université Libre de Bruxelles, Brussels, Belgium, 3Barcelona Supercomputing Center (BSC), Barcelona, Spain, 4Centre for Genomic Regulation (CRG), The Barcelona Institute of Science and Technology, Barcelona, Spain, 5Section of Epigenomics and Disease, Department of Medicine, Imperial College London, London, UK, 6Wellcome Centre for Human Genetics, Nuffield Department of Medicine, University of Oxford, Oxford, UK, 7Lund University Diabetes Centre, Lund University, Malmö, Sweden, 8Department of Clinical and Experimental Medicine, University of Pisa, Pisa, Italy, 9Broad Institute of Harvard and MIT, Cambridge, USA.
Background and aims: Type 2 diabetes (T2D) results from progressive pancreatic beta cell failure, caused by genetic and environmental factors. How genetic variants lead to beta cell failure remains poorly understood. Here, we performed a cis-expression quantitative trait loci (eQTL) analysis of human islets to establish the link between genetic variants and gene expression. We leveraged existing and novel genome wide association studies (GWAS) to guide the selection of eQTLs implicated in T2D.
Materials and methods: eQTL analysis was performed on 404 human islet transcriptomes, genomes and metadata, brought together in the Translational human pancreatic Islet Genotype tissue-Expression Resource (TIGER, created in the H2020 project T2DSystems). The genomic data was imputed with four panels (1000 Genomes, GoNL, HRC and UK10K), and the results were integrated to increase the number of high quality imputed variants to be analyzed, improving the coverage of low-frequency variants and indels. RNA-sequencing data were analyzed per cohort with RSEM for quantification and normalization, PEER for hidden confounding factors and fastQTL for the eQTL analysis. The by-cohort eQTL results were meta-analyzed, limiting batch effects while increasing statistical power. Co-localization analyses with the DIAMANTE T2D GWAS meta-analysis was done with the coloc R package.
Results: Thousands of cis-acting eQTLs were mapped, including novel low minor allele frequency (MAF) variants. Notably, the large sample size and quality of imputation enabled us to identify for the first time an eQTL for the low frequency variant (MAF 0.02) nearby CCND2 that is associated with 50% reduced risk for T2D. The intersection of the eQTL data with GWAS results showed significant eQTLs in human islets for more than 80 of the previously described T2D lead variants. Among these, at least 39 were confirmed by co-localization. Of particular interest, we found co-localization for an eQTL and GWAS locus near IGF2BP2. This T2D risk allele is associated with lower IGF2BP2 expression in human islets; the association seems islet-specific as, according to GTEx, it is absent in other tissues except thyroid. The summarized transcriptomes, genetic variants and eQTL results are available on the open access TIGER portal (http://tiger.bsc.es).
Conclusion: We present the largest regulatory variation study in human islet that results in the identification of 39 cis-acting eQTLs, including novel variants, co-localizing with T2D GWAS results. These genetic variants and associated dysfunctional genes expressed in human islets are an invaluable asset to understand the genetics of T2D.
Supported by: T2DSystems. EU Horizon 2020, No 667191.
Disclosure: A. Piron: None.
110
Polygenic risk score in type 2 diabetes risk prediction: genomics to healthcare
H. Marjonen1, T. Paajanen1, K. Auro2, A. Haukkala3, H. Kääriäinen1, K. Kristiansson1, M. Perola1,3;
1Finnish institute for health and welfare, Helsinki, 2Negen Ltd, Helsinki, 3University of Helsinki, Helsinki, Finland.
Background and aims: Utilization of genomic data in the personalized risk assessment and prevention of common chronic diseases such as type 2 diabetes creates a unique opportunity for the modern personalized health care, enabling more targeted and cost-effective use of the limited health care resources. Nevertheless, implementation of genomic medicine in the current health care operational environment is still a challenge due to the small number of proof-of-concept studies on the validity of such approaches as well as due to lack of targeted professional training. To successfully implement genomic medicine in the everyday healthcare, evidence-based and well-defined strategies are urgently needed. Genomics to Healthcare (P6), coordinated by the National Institute for Health and Welfare (THL), is a large-scale national initiative aiming to prepare the Finnish health care system for the clinical utilization of genetic risk information.
Materials and methods: In our P5 FinHealth pilot study, we provided personalized information on the individual T2D disease risk for 3.400 volunteering Finnish participants. We used a polygenic risk score (PRS) containing up to 7 million genomic regions and validated it in whole genome genotyped population based FINRISK cohorts (N=20.000) using Cox regression models.
Results: Our validation process showed that T2D PRS significantly associates with future T2D disease risk (HR:1.5 per 1 SD PRS, p-value:<2*10-16). The top 8% of the FINRISK population who had the highest PRS had fourfold increased risk for T2D compared to those in the lowest 8% with onefold risk. Moreover, almost 30% of the individuals with BMI >35 and the highest PRS were diagnosed with T2D during ten-year follow-up. T2D incidents in BMI >30 group occurred at a younger age concurrently with higher PRS, and there was a seven-year difference in the onset of T2D between the highest and lowest PRS group.
Conclusion: Our pilot project indicated that PRS could be used in preventive health care of type 2 diabetes. We have now initiated a ‘Genomics to Healthcare’ project which expands the pilot by recruiting 100 000 Finnish participants for a study of selected preventable or treatable common diseases. We form PRSes for the disease endpoints, and validate the PRSs for prediction of future disease in a large Finnish prospective population sample collection. We then return the genetic risk information on given diseases to participants via a secure online portal and enroll high-risk individuals to randomized intervention studies. Follow-up of the health behavior and morbidity of the participants collects data through surveys and national health care registers. We participate in coordinated set of activities in development of required infrastructures and technological solutions as well as training and communications. Our large project provides valuable scientific evidence and evaluates the health-economic impact of utilizing genetic risk information in healthcare.
Clinical Trial Registration Number: NCT03650127
Supported by: Diabetes Research Foundation, Yrjö Jahnsson, Sydäntutkimussäätiö, Sitra
Disclosure: H. Marjonen: None.
111
Characterisation of the genetic discordance between body mass index and type 2 diabetes: a phenome-wide analysis
D.E. Coral Candelo, J. Fernández-Tajes, N. Tsereteli, P.W. Franks;
GAME Unit, Lund University, Malmö, Sweden.
Background and aims: Obesity is on the rise globally, and is a leading risk factor for T2D. However, it is very heterogeneous, with varying degrees of T2D risk within the same levels of BMI. Better classification may lead to improve outcomes of current preventive and therapeutic strategies. Moreover, by elucidating the mechanisms uncoupling obesity from T2D risk, new possible therapeutic targets may emerge. Leveraging the vast amount of genetic data produced to date may contribute to reach these goals while overcoming the obstacles imposed by common assumptions, biases and confounders present in observational studies. Our aim is to compare the phenome-wide association patterns of BMI-increasing genetic profiles that either concordantly increase or discordantly decrease T2D risk.
Materials and methods: Highly concordant and highly discordant SNPs between BMI and T2D were obtained from the latest GWAS for both conditions. Their standardized effect sizes (SES) across multiple traits in the phenome, metabolome, proteinome and transcriptome were retrieved from the online genomic repositories. After alignment to the BMI-increasing allele, these effects were organized into a SNP x Trait matrix. A hierarchical clustering technique, combining PCA and Random Forest algorithms was applied, retrieving the optimal number of clusters of traits, organized in order of importance, useful to distinguish a discordant from a concordant SNP. Posterior probabilities of colocalization with T2D were calculated for each gene using transcriptome results. Tissue, biological process, molecular mechanism and cellular component enrichments were evaluated. The predictive potential of GRSs informed by these findings were assessed in the UK Biobank dataset.
Results: 121 SNPs were found to be significantly associated with BMI and T2D. 18 were discordant and 104 concordant. A total of 1372 variables were included in the analyses (Phenome = 546, Metabolome = 233, Proteinome = 593). The most important difference between discordant and concordant SNPs in the phenome matrix was found in a cluster of traits led by hypertension (Mean discordant SES = -1.59, Mean concordant SES = 2.56), highly correlated with two clusters led by coronary heart disease and overall health status, respectively. The second most important cluster was led by physical activity-adjusted WHR (Mean discordant SES = -2.69, Mean concordant SES = 0.24). The model obtained from the phenome matrix had the highest classification performance (Matthews Correlation Coefficient, MCC = 0.79). Metabolome results showed differences in polyunsaturated fatty acids and lipid contents in VLDL, but with lower performance (MCC = 0.67). The model from the proteinome matrix was unable to correctly classify SNPs (MCC = -0.03). Two genes (CCDC92 and DNAH10) showed the strongest association within the discordant set in adipose tissue, both involved in cilia formation. A GRS of these 121 SNPs with weights derived from the clusters with high classification performance was highly associated with T2D in both the general and obese populations in UK Biobank (p < 1x10¹⁶).
Conclusion: The main difference between BMI-increasing genetic profiles that either discordantly decrease or concordantly increase T2D risk is found in hypertension risk and physical activity-adjusted WHR. These traits can be used to inform GRSs to better classify T2D risk in obesity. Molecular mechanisms behind the discordant profile appear to involve cilia formation in the adipose tissue.
Disclosure: D.E. Coral Candelo: None.
112
Polygenic scores, diet quality, and type 2 diabetes risk
J. Merino1,2, M. Guasch-Ferre3, J. Li3,4, W. Chung4,5, B. Ma4, L. Liang4,5, F.B. Hu3,4, J.C. Florez1,2;
1Diabetes Unit and Center for Genomic Medicine, Massachusetts General Hospital, Boston, 2Department of Medicine, Harvard Medical School, Boston, 3Department of Nutrition, Harvard TH Chan School of Public Health, Boston, 4Department of Epidemiology, Harvard TH Chan School of Public Health, Boston, 5Department of Biostatistics, Harvard TH Chan School of Public Health, Boston, USA.
Background and aims: The burden of type 2 diabetes (T2D) is not equally arrayed, as susceptibility to diabetogenic lifestyle factors varies between populations and within individuals. The extent to which genetic profiles can be leveraged to identify individuals more likely to benefit from targeted dietary recommendations is unclear. Here we tested the hypothesis that the generation of novel polygenic scores for T2D can identify individuals more likely to benefit from following a healthy diet.
Materials and methods: We included a total of 35,759 participants in the Nurses’ Health Study and the Health’s Professional Follow-up Study for whom genotype and dietary data were available T2D genetic profile was quantified using either a global polygenic score comprising ~1 million variants, or pathway-specific polygenic scores denoting different T2D pathophysiologic processes including beta-cell dysfunction, pro-insulin secretion, liver dysfunction, obesity, and lipodystrophy. Diet quality was assessed by the Alternate Healthy Eating Index 2010 (AHEI-2010). Cox proportional-hazards models were used to calculate hazard ratios (HR) and 95% confidence intervals (95% CI) for T2D risk in each cohort after adjusting for demographic, clinical, and lifestyle characteristics.
Results: Over 891,746 person-years of follow-up, 4,433 participants developed T2D. The relative risk of incident T2D was 29% higher (95% CI, 1.25 to 1.33; P<0.001) per 1SD increase in global polygenic score after adjusting for confounders. Similar associations were found for all five pathway-specific polygenic scores (P<0.001). The relative risk of T2D was 11% higher per each 10 units decrease in AHEI-2010 (95% CI, 1.08 to 1.14; P<0.001). We observed a significant interaction between diet quality and liver dysfunction polygenic score on T2D risk that was consistent across all three cohorts (pooled Pinteraction<0.001). No additional interactions were observed for other polygenic scores (Pinteraction>0.008; 0.05/6 scores). Compared with individuals at low genetic risk for liver dysfunction and high diet quality, low diet quality was associated with a 20% increased relative risk of T2D among those at low genetic risk (95% CI, 1.04 to 1.39) and a 58% increased relative risk among those at high genetic risk (95% CI, 1.38 to 1.81).
Conclusion: These data indicate that genetic risk and low diet quality are each associated with the risk of T2D, and that the diabetogenic effect of an unhealthy diet is more pronounced among individuals at high genetic risk for liver dysfunction. Our findings have the potential to deliver clinical and public health benefit through enhanced capacity to predict response to behavioral recommendations.
Supported by: H2020-MSCA-IF- 2015-703787
Disclosure: J. Merino: None.
113
Body mass index and kidney function: a two-sample Mendelian randomisation analysis
A.D. Kjaergaard1, D.R. Witte2, A. Teumer3, C. Ellervik4;
1Steno Diabetes Center Aarhus, Aarhus University Hospital, Aarhus, Denmark, 2Department of Public Health, Aarhus University, Aarhus, Denmark, 3Institute for Community Medicine, Greifswald Medical School, Greifswald, Germany, 4Department of Pathology, Harvard Medical School, Boston, Boston, USA.
Background and aims: A recent meta-analysis in more than 5 million individuals showed that elevated body mass index (BMI) was independently associated with estimated glomerular filtration rate (eGFR) decline. Because observational studies are prone to confounding and reverse causation, we employed a two-sample bidirectional Mendelian randomization (MR) approach to assess causality and directionality of this association.
Materials and methods: We used publicly available summary statistics from published genome wide association studies. Genetic instruments included 97 SNPs for BMI and 147 SNPs for eGFR. Outcomes were baseline eGFR, eGFR decline over time, blood urea nitrogen (BUN), chronic kidney disease (CKD), microalbuminuria (MA) and urinary albumin-to-creatinine ratio (UACR) from the CKD Genetics (CKDGen) Consortium (up to 765,348 participants) and BMI from the Genetic Investigation of ANthropometric Traits (GIANT) consortium (up to 806,834 participants). As main analysis, the inverse variance weighting method was applied. Sensitivity analyses included weighted median, penalized median, weighted modal and MR Egger regression analyses.
Results: Genetically instrumented BMI was not associated with baseline eGFR levels. However, a one standard deviation (SD≈4.7 kg/m2) higher BMI was associated with eGFR decline (β=0.18 (0.05-0.31) ml/min/1.73m2/year), increased BUN (β=0.03(0.03-0.04) mg/dl), and increased risks of CKD (OR=1.21 (1.13-1.30)) and microalbuminuria (OR=1.17(1.10-1.24)). Interestingly, higher BMI was associated with increased UACR (β=0.15(0.10-0.21)) only in individuals with diabetes, but not in the general population. Genetically instrumented eGFR was not associated with BMI in sex-stratified or sex- combined analyses.
Conclusion: This study suggests that higher BMI is a cause of decreased kidney function, but not vice versa.
Supported by: Novo Nordisk unrestricted grant
Disclosure: A.D. Kjaergaard: None.
114
Hedgehog signalling as a determinant of human fat expansion and distribution
A.D. van Dam1, E.M. Toledo2, N.Y. Loh1, M.J. Neville1,3, K.E. Pinnick1, M. Todorčević1, R. Dumbill4, L.B.L. Wittemans5,1, C. Langenberg5, F. Karpe1,3, C. Christodoulides1;
1University of Oxford, Oxford, 2Novo Nordisk Research Centre Oxford, Oxford, 3Oxford NIHR Biomedical Research Centre, Oxford, 4Oxford University Hospitals NHS Foundation Trust, Oxford, 5University of Cambridge, Cambridge, UK.
Background and aims: The role of developmental pathways in the regulation of human fat distribution is still poorly characterised. This project explores the role of hedgehog signalling using a single-cell RNA sequencing approach in combination with large-scale genetics and adipocyte biology. To do this, we focused on single nucleotide variants within the hedgehog interacting protein (HHIP) locus (rs1812175, rs13146972), that are strongly associated with hip circumference adjusted for BMI (HIPadjBMI).
Materials and methods: Single-cell RNA sequencing was performed on stromovascular fractions from paired abdominal and gluteal adipose tissue of healthy volunteers from the Oxford Biobank. The GWAS association (rs1812175, near HHIP, for HIPadjBMI) was confirmed in a large cohort with DXA-quantified regional fat measurements (n=17,212, Oxford Biobank, Fenland and EPIC-Norfolk). Functional studies of HHIP promoter activity and HHIP knockdown were performed in immortalised and primary human abdominal and gluteal pre-adipocytes.
Results: Single-cell RNAseq detected robust HHIP expression predominantly in the pre-adipocyte cluster and limited expression in endothelial cells. We therefore pursued functional studies using human pre-adipocyte models. The rs1812175 HIPadjBMI-increasing allele was associated with increased gluteal fat mass (β=0.08, p=1.37-06, n=17,212). Carriers of the HIPadjBMI-increasing allele had larger adipocytes in both the abdominal and gluteal depots compared to BMI- and age-matched controls.Comparison of single-cell RNAseq data from carriers of the HIPadjBMI-increasing allele and controls recruited from the Oxford Biobank (n=30 subjects) will provide further insight into the signalling pathways that mediate the association between the HHIP locus and fat distribution, and will define the cell types in which HHIP expression quantitative trait loci (eQTLs) exist.The association signal denominated by rs1812175 comprises nine variants in high linkage disequilibrium (r2>0.6), all of which are located in non-coding DNA regions. Two of these variants, rs1355603 and rs13106087, lie within the HHIP promoter. In HHIP promoter reporter assays the rs1355603 HIPadjBMI-increasing allele displayed lower activity than the major allele. We therefore pursued knockdown of HHIP in primary gluteal pre-adipocytes, which led to enhanced adipogenesis.
Conclusion: This study provides genetic and functional data demonstrating that HHIP plays an important role in the regulation of human adipogenesis and regional adiposity. Reduction in HHIP signalling has the potential to affect human fat distribution in a metabolically favourable pattern.
Supported by: Novo Nordisk Postdoctoral Fellowship, CVON-GENIUS Postdoc Grant
Disclosure: A.D. van Dam: Grants; Novo Nordisk Postdoctoral Fellowship.
OP 20 Feeding the pipeline: from drugs to surgery
115
Multiple mechanisms of a novel long-acting glucagon analogue, HM15136, on weight loss in animal models of obesity
J. Lee, S. Lee, J. Kim, J. Lee, S. Lee, S. Bae, D. Kim, Y. Kim, I. Choi;
Hanmi Phaarm. Co., Ltd, Hwaseong-si, Republic of Korea.
Background and aims: Although many anti-obesity drugs have been utilized, their weight loss efficacy is still marginal compared with bariatric surgery. Several studies have demonstrated that glucagon plays an essential role in body weight management both via increase of energy expenditure and suppression of appetite, suggesting its potential application as an anti-obesity medication. In line with this, we previously observed that chronic treatment of the novel long-acting glucagon analog, HM15136, led to efficient body weight loss (BWL) in diet-induced obesity (DIO) mice. To further investigate the potential benefits of HM15136 in obesity, the present study compared the BWL effect with available GLP-1R agonists (GLP-1RAs), and investigated the underlying mechanism for efficient BWL by HM15136.
Materials and methods: For a BWL efficacy comparison between HM15136 and GLP-1RAs, either HM15136 or available GLP-1RAs (liraglutide, dulaglutide or semaglutide) were subcutaneously administered into DIO mice for 4 weeks. The human equivalent doses tested were HM15136 2.0 nmol/kg, and 3.9 nmol/kg once every 2 days (Q2D); liraglutide 50 nmol/kg twice-daily (BID); dulaglutide 2.7 nmol/kg Q2D; semaglutide 20.5 nmol/kg Q2D. To assess the appetite regulation-independent BWL, the BW change by HM15136 treatment was compared with liraglutide under pair-fed controlled condition in DIO mice. At the end of the treatment, white adipose tissue (WAT) samples were prepared and the expression levels of thermogenic markers were examined. To measure energy expenditure and respiratory exchange ratio (RER), each DIO mice was subjected to indirect calorimetry, followed by VO2 and VCO2 monitoring. To explore an additional mechanism for BWL by HM15136, oral lipid tolerance test (oLTT) was performed after single administration of HM15136 in normal mice.
Results: In DIO mice, chronic treatment of HM15136 showed greater BWL (-38.5% vs. vehicle) than GLP-1RAs such as liraglutide, dulaglutide, and semaglutide (-16.8, -2.5, and -11.0% vs. vehicle). Of note, unlike liraglutide, HM15136 treatment was associated with more BWL compared to cognate pair-feed group, indicating the appetite regulation-independent BWL by HM15136. As to the responsible mechanism, HM15136 not only significantly increased the expression of PGC-1α and UCP-1 in WAT, but also enhanced energy expenditure. However, this was not the case when liraglutide treated. Together with the reduced RER, these results suggest that HM15136 could induce WAT browning through which fat utilization and energy expenditure increases. In respect to additional BWL mechanism, blood triglyceride level during oLTT was significantly decreased by HM15136 treatment compared to vehicle group, which coincided with decreased blood bile acid and ApoB48. These results suggest that the inhibition of lipid absorption is involved, at least in part, in efficient BWL by HM15136.
Conclusion: Based on these results, HM15136 could be a potential therapeutic option for the management of obesity via favorable regulation of energy expenditure and lipid absorption in addition to appetite inhibition. Efficacy study of HM15136 in obese patients is ongoing to assess the clinical relevance of these findings.
Disclosure: J. Lee: None.
116
Tirzepatide, a dual GIP/GLP-1 receptor agonist, interrupts metabolic adaptation to dietary restriction
T. Coskun, W.C. Roell, L.S. O'Farrell, E.C. Beebe, A. Regmi, P.J. Emmerson, Z. Milicevic, A. Haupt;
Diabetes and Complications, Eli Lilly and Company, Indianapolis, USA.
Background and aims: Body weight management via dietary restriction (DR) and exercise has limited success in prevention of weight gain after the intervention ceases. Rapid weight loss is accompanied by reduction in metabolic rate as a compensatory mechanism to counter reduced caloric intake, hindering overall success—a phenomenon known as metabolic adaptation. Tirzepatide has demonstrated profound weight loss in clinical trials, and in preclinical studies it significantly increased energy expenditure, unlike selective GLP-1 receptor (GLP-1R) agonist, and reduced ad libidum food intake. In the studies presented here, we aimed to investigate metabolic regulation by tirzepatide and semaglutide in diet-induced obese (DIO) mice.
Materials and methods: We created a mouse model of DR, in which DIO mice were placed under scheduled feeding with each mouse initially receiving food equal to the observed ad libidum daily food intake (~3 g). After monitoring for a week in indirect calorimetry chambers (Phenomaster, TSE) mice were switched to 50% DR (~1.5 g). Vehicle, tirzepatide or semaglutide at 3 nmol/kg daily administration (QD) was initiated with DR for 14 days with a pair-fed group matched to tirzepatide group. Daily body weight and food intake was measured along with constant respiratory exchange rate (RER) and energy expenditure throughout the study. In a follow up study, tirzepatide-treated mice at 3 nmol/kg QD were also treated with a long-acting GIP (glucose-dependent insulinotropic polypeptide) receptor antagonist at a dose of 1000 nmol/kg QD to pharmacologically block tirzepatide treatment effect.
Results: Tirzepatide treated mice demonstrated the highest degree of weight loss compared with semaglutide, pair fed, and vehicle treated groups during DR (22.4±1.3%, 19.9±1.3%, 17.0±0.7%, 15.2±1.2% respectively). Metabolic adaptation was observed during DR demonstrated by reduction in energy expenditure (~14%) observed in the vehicle, semaglutide, and pair fed groups. However, energy expenditure in the tirzepatide group was maintained similar to levels prior to DR suggesting an interruption of metabolic adaptation. Additionally, only tirzepatide treatment increased fat utilization more than 30%, compared with vehicle during DR. The increased fat utilization observed with tirzepatide was reversed during DR by GIPR antagonist suggesting a key function of GIPR agonism.
Conclusion: These studies demonstrate tirzepatide uniquely maintains metabolic rate during caloric restriction, potentially via increased lipid oxidation. Tirzepatide may indeed interrupt metabolic adaptation, potentially improving both magnitude and durability of weight loss. While further studies are ongoing to identify molecular mechanisms driving these results, the findings presented here are helping to better elucidate key metabolic mechanisms by which tirzepatide exerts its profound reduction in body weight and the potential benefits of GIP/GLP-1 dual agonism.
Disclosure: T. Coskun: Employment/Consultancy; Eli Lilly and Company.
117
Safe and efficient delivery of liraglutide and FGF-21 using NH2-HPSNs nanoparticles in vivo and in vitro
S. Yang1,2, L. Li1, G. Yang2;
1Key Laboratory of Diagnostic Medicine (Ministry of Education), College of Laboratory Medicine, Chongqing Medical University, Chongqing, 2Department of Endocrinology, the Second Affiliated Hospital, Chongqing Medical University, Chongqing, China.
Background and aims: Nanomaterials have attracted great attention because of their low toxicity and high carrying capacity. However, in the field of metabolic diseases, nanomaterials are rarely used as a treatment. Liraglutide (Lira) and Fibroblast growth factor 21 (FGF-21) have an improvement effect on insulin resistance and type 2 diabetes, however, there have been no reports of studies carrying both at the same time. The current study was designed to investigate the the effect of mesoporous silica nanoparticles (NH2-HPSNs) carry both peptide drugs and plasmids on metabolic diseases in vivo and in vitro.
Materials and methods: We first detected the ability of NH2-HPSNs to carry liraglutide and plasmid of FGF-21 (pFGF-21) using agarose gel electrophoresis. Next, the cytotoxicity of NH2-HPSNs and Lira was assessed by the cell count kit-8 colorimetric (CCK-8) assays in vitro. We then compared the transfection efficiency of NH2-HPSNs/pFGF-21 with that of lipofectamine 2000/pFGF-21 in Hepa1-6 cells in vitro. To evaluated the transfection efficiency of NH2-HPSNs/pFGF-21 in vivo, male C57BL/6J mice were injected with saline, NH2-HPSNs, pFGF-21, pFGF-21 with hydrodynamic delivery, and NH2-HPSNs/pFGF-21 via a tail vein. The biological efficiency of NH2-HPSNs transfection was tested by PCR and Western Blotting. Subsequently, Lira, pFGF-21, Lira+pFGF-21, NH2-HPSNs, NH2-HPSN/Lira, NH2-HPSNs/pFGF-21 and NH2-HPSNs/pFGF-21+Lira were separately injected into HFD-fed mice, an insulin resistance (IR) animal model, via a tail vein. At the same time, metabolic parameters and energy expenditure of each group was measured. We then performed glucose tolerance test and insulin tolerance test. Finally, we examined the expression of key gluconeogenesis and insulin signaling molecules in the liver of each group.
Results: We found that NH2-HPSNs can carry both liraglutide and pFGF-21 and about 90% of the cells were survived after incubated at 300μg/ml of NH2-HPSNs for 48 hours. The transfection efficiency of NH2- HPSN/pFGF-21 was higher than that of lipofectamine 2000/pFGF-21 in vitro. The mRNA and protein expression of FGF-21 in mice transfected by NH2-HPSNs/pFGF-21 was higher than those with the hydrodynamic delivery of pFGF-21. Importantly, HFD-fed mice treated with NH2-HPSNs/pFGF-21+Lira significantly reduced food intake, body weight and blood glucose, improved energy metabolism, and improved insulin resistance compared with other group. Futhermore, NH2-HPSNs/pFGF-21+Lira also reduced the expression of phosphoenolpyruvate carboxykinase (PEPCK) and up-regulated the phosphorylation levels of protein kinase B (AKT) and insulin receptor (InsR) in the liver of HFD-fed mice.
Conclusion: Our study showed that, compared with Lira +pFGF-21-treated HFD-fed mice, NH2-HPSNs/pFGF-21+Lira-treated HFD-fed mice significantly improved glucose tolerance, inhibited PEPCK activity, and promoted the phosphorylation of InsR and Akt.
Supported by: NAFC
Disclosure: S. Yang: None.
118
The impact of bariatric surgery on microvascular complications in patients with type 2 diabetes: a matched controlled population-based cohort study
P. Singh1,2, N. Adderley1, A. Subramanian1, K. Gokhale1, K.A. Toulis1, R. Singhal2, S. Bellary3,2, A. Tahrani1,2, K. Nirantharakumar1,2;
1University of Birmingham, Birmingham, 2University hospital Birmingham NHS trust, Birmingham, 3Aston University, Birmingham, UK.
Background and aims: Bariatric surgery in patients with Type 2 diabetes (T2DM) is associated with significant improvements in glycaemic control and vascular risk factors but data regarding the impact of bariatric surgery on the development of diabetes-related microvascular complications is limited. The aim of our study was to assess the impact of bariatric surgery on microvascular complications defined as diabetes-related foot disease (DFD), sight threatening diabetic retinopathy (STDR) and chronic kidney disease (CKD) in patients with T2DM and obesity
Materials and methods: A retrospective matched, controlled population-based cohort study of adults with T2DM between 1/1/1990 and 31/1/2018 using The Health Improvement Network (THIN), a database of primary care electronic records. Each exposed (had bariatric surgery) patient was matched on index date for age, sex and body mass index (BMI) to 2 controls (did not have bariatric surgery). DFD was defined as a composite of either foot ulcer, gangrene, deformity, amputation, moderate foot risk, high foot risk, peripheral vascular disease or peripheral neuropathy (DPN). STDR was defined as either pre-proliferative or proliferative retinopathy or maculopathy or retinopathy treatment or vision loss. CKD was defined as eGFR <60 ml/min/1.73m2 or albuminuria (ACR ≥3mg/mmol). We conducted Cox regression to analyse the time to event using STATA version15.
Results: 1126 exposed and 2219 control participants were included. Exposed and control group were very similar in baseline characteristics. For the whole cohort, mean (SD) age was 50 (9) years, 2261 (68%) were women, mean BMI was 46 (7.6) kg/m2. The median follow-up was 3.9 years (IQR 1.8-6.4). After adjusting for age, gender, baseline BMI, smoking, social deprivation (Townsend score), ethnicity, hypertension, T2DM duration, baseline HbA1c and medications (ACE inhibitors, lipid-lowering drugs and insulin), bariatric surgery was associated with reduction in incident combined microvascular complications (adjusted HR 0.63, 95% CI 0.51-0.78, p<0.001), DFD (adjusted HR 0.612, 95% CI 0.497-0.753, p<0.001), STDR (adjusted HR 0.66, 95% CI 0.44-1.00, p<0.001), and CKD (adjusted HR 0.63, 95% CI 0.51-0.78, p<0.001) . Examining separately, bariatric surgery was associated with reduction in incident DPN (adjusted HR 0.717, 95% CI 0.524-0.98, p= 0.037)
Conclusion: Bariatric surgery was associated with a significant reduction in incident diabetes-related microvascular complications, including foot disease, sight threatening retinopathy, neuropathy and nephropathy. Improved access to bariatric surgery may reduce the health and economic burden of T2DM.

Disclosure: P. Singh: None.
119
Improvement in plasma metabolomic profile and hepatic insulin resistance 7 years after Roux-en-Y Gastric Bypass (RYGB)
C. Barbieri1,2, F. Carli1, M. Gaggini1, S. Pezzica1, B. Astiarraga3,4, M. Palumbo4, E. Ferrannini1, S. Camastra4, A. Gastaldelli1;
1National Research Council, Pisa, Italy, 2Department of Biotechnology, Chemistry and Pharmacy, University of Siena, Siena, Italy, 3University Hospital Joan XXIII, Tarragona, Spain, 4Department of Clinical and Experimental Medicine, University of Pisa, Pisa, Italy.
Background and aims: Roux-en-Y Gastric Bypass (RYGB) leads to significant weight loss and improvement in glycaemic control, insulin resistance (IR), beta cell function, and in many cases, to the remission of type 2 diabetes (T2D). The aim of this study was to evaluate the long term effects of RYGB on plasma aminoacid (AA) and lipid composition and the relationship with changes in IR.
Materials and methods: The cohort comprised 30 patients (15 diabetic, T2D and 15 non diabetic, ND before RYGB) for which we had measurement of insulin resistance (IR), AA and lipid composition at baseline and 7 years after RYGB.
We measured IR indexes, i.e., hepatic (Hep-IR=(endogens glucose production (EGP)xIns)) and adipose tissue (Lipo-IR=(RaGlycerolxIns) by the infusion of stable isotope tracers of [6,6-2H]-glucose and [2H5]-glycerol. AA composition and the index of liver damage [GSG=Glu/(Ser+Gly)] were measured by GC-MS and TAG profile by LC-MS QTOF. The percent of unsaturated fatty acid (FA) in TAG was determined by the number double bonds, (db) in each fatty acyl chain (degree of saturation TAG(0-2db)/TAG(3-6db)).
Results: We observed long term (7 ys) effects of BS in both ND and T2D including diabetes remission in all T2D patient. BMI (kg/m2) decreased from 50.5±1.4 to 35.7±1.5 kg/m2 (p<0.0001). After RYGB n=9 had a BMI< 30 kg/m2 (4T2D/5ND), n=11 had a BMI 30-40 kg/m2 (7T2D/6ND), n=8 had a BMI>40 kg/m2 (4T2D/4ND).BMI at 7ys correlated to TAG concentrations (p=0.02; rho=0.43) and to the degree of TAG saturation (p=0.002; rho=0.71). Degree of TAG saturation increased with BMI at 7ys and with previous history of T2D (figure). Patients ND with BMI<30 had lower saturation compare to T2D.Hep-IR decreased from 144.9±20.7 to 46.3±5.1 μmol/kg/min*mU/l (p=0.001), although it tended to increase with residual BMI. The degree of TAG saturation (ie TAG(0-2db)/TAG(3-6db)) correlated with Hep-IR (p=0.037; rho=0.43), fatty liver index (FLI; p=0.0012; rho=0.69) but not Lipo-IR.The concentrations of the aromatic AA Phe and Tyr that are mainly metabolized in the liver, were decreased after RYGB (Phe: 71.5±4.9 vs 55.1±2.7; Tyr 91.2±6.2 vs 64.5±4.1 μM; p<0.01). The concentrations of the branched chain AA (Val, Leu, Iso) decreased after RYGB (440.3±41.4 vs 302.9±17.7 μM; p<0.01) and also the GSG index of liver damage was decreased after RYGB (1.3±0.1 vs 0.3±0.0; p<0.01).
Conclusion: RYGB not only dramatically reduces body weight but also improves hepatic IR, lipid composition, and AA, especially hepatic metabolites. Saturation of fatty acid in TAG is a discriminant value in relation to BMI and previous presence of T2D.

Supported by: Finalizzata
Disclosure: C. Barbieri: Grants; #RF-2011-02348446.
120
Predictors of type 2 diabetes remission after bariatric surgery: findings from 10 years follow up study
D. Moriconi1, S. Guerrini1, A. Di Carlo1, M. Anselmino2, E. Ferrannini3, S. Taddei1, M. Nannipieri1;
1Department of Clinical and Experimental Medicine, University of Pisa, Pisa, 2Unit of Bariatric Surgery, AOUP, Pisa, 3CNR Institute of Clinical Physiology, Pisa, Italy.
Background and aims: There are few prospective studies with long-term follow-up evaluating the remission of type 2 diabetes (T2D) in morbidly obese patients underwent bariatric surgery. AIMS: To evaluate the impact of bariatric surgery on T2D at 10 years of follow-up and the predictive factors of remission.
Materials and methods: Prospective observational study started in 2006; 85 obese patients, 65 women, with T2D, 20 of whom underwent sleeve gastrectomy (SLG) and 65 underwent gastric bypass (RYGB). Patients were evaluated every 6-12 months with clinical examination and blood tests during a follow-up period of 10 years. T2D remission was defined on the basis of the ADA criteria (2017).
Results: Based on fasting blood glucose (<100 mg/dl) and HbA1c (<5.7%), a complete remission (CR) was found in 40% of pts, a partial remission (PR) in 31% while T2D persisted in 23% of patients 1-year after surgery. At the end of the 10-years follow-up, CR was present in 23% of patients, PR in 32% and T2D in 45%. Baseline BMI was similar between the 3 groups, while 1-year after surgery there was a lower reduction of BMI in patients in which T2D persisted (-10.0 vs -14.6 vs -15.1 kg / m ^ 2, in T2D, PR and CR, respectively, p = 0.0005). Between 1 and 10 years after surgery, however, no significant BMI variation was observed between groups. Dividing the patients according to the duration of diabetes (DD) it was observed that in pts with DD <5 years, CR was achieved in 58%, PR in 38% while 4% of patients had persistence of T2D 1-year after surgery. At the end of 10-years follow-up, in the same group of patients, RC of 38%, RP of 45% and only 17% of T2D were observed. In the group with DD ≥5 years, CR was achieved only in 12%, PR in 33% and persistence of T2D was present in more than half of the pts (55%) already at 1-year after surgery. At the end of 10-years follow-up, no patient was in CR, PR was 12% while 88% of patients had T2D. In a logistic regression analysis, adjusting for all the main covariates (age, sex, diabetes duration, baseline therapy, type of surgery, and d-BMI), diabetes duration and insulin therapy before surgery were the only predictors of long-term diabetes remission.
Conclusion: The short duration of T2D (<5 years) and the absence of insulin therapy before surgery are the predictors of long-term T2D remission. Weight loss was associated with T2D remission 1 year after surgery, but it had no impact on the long-term relapse of diabetes.
Disclosure: D. Moriconi: None.
OP 21 SGLT-2 inhibitors: at the heart of the matter
121
Cardiovascular outcomes of patients with type 2 diabetes treated with SGLT-2 inhibitors versus GLP-1 receptor agonists in real life
G. Fadini1, E. Longato2, B. Di Camillo2, G. Sparacino2, L. Gubian3, A. Avogaro1;
1Department of Medicine, University of Padova, Padova, 2Department of Information Engineering, University of Padova, Padova, 3Azienda Zero, Regione Veneto, Padova, Italy.
Background and aims: Sodium glucose cotransporter-2 inhibitors (SGLT2i) and glucagon-like peptide-1 receptor agonists (GLP-1RA) protect patients with type 2 diabetic (T2D) from cardiovascular events, but no trial has directly compared their cardiovascular effects. We aimed to address this gap using real-world data.
Materials and methods: We performed a retrospective real-world study on a population of ~5 million inhabitants from a region in North-East Italy. We identified T2D patients who received new prescription of SGLT2i or GLP-1RA from 2014 to 2018. SGLT2i and GLP-1RA initiators were matched 1:1 by propensity scores. The primary outcome was a composite of all-cause death, myocardial infarction, and stroke (3-point major adverse cardiovascular events [MACE]). Secondary endpoints were each component of the primary endpoint, hospitalization for heart failure, revascularization, hospitalization for cardiovascular causes, and adverse events.
Results: From a population of 330,193 diabetic patients, we followed 8596 SGLT2i and GLP-1RA matched initiators for a median of 13 months. Patients in both groups were on average 63 years old, 63% males, and 18% had pre-existing cardiovascular disease. T2D patients treated with SGLT2i versus GLP-1RA, experienced a lower rate of 3P-MACE (HR 0.68; 95% C.I. 0.61-0.99; p=0.043), myocardial infarction (HR 0.72; 95% C.I. 0.53-0.98; p=0.035), hospitalization for heart failure (HR 0.59; 95% C.I. 0.35-0.99; p=0.048), and hospitalization for cardiovascular causes (HR 0.82; 95% C.I. 0.69-0.99; p=0.037). Adverse events were not significantly different between the two groups.
Conclusion: In the absence of dedicated trials, this observational study suggests that SGLT2i may be more effective than GLP-1RA in improving cardiovascular outcomes of T2D.
Clinical Trial Registration Number: NCT04184947
Disclosure: G. Fadini: None.
122
The effects of canagliflozin on heart failure and cardiovascular death by baseline participant characteristics: analysis of the CREDENCE trial
D. de Zeeuw1, C. Arnott2, J.-W. Li2, C.P. Cannon3, B.L. Neuen2, H.J.L. Heerspink1,2, B. Neal2,4, D.M. Charytan5, G. Bakris6, T.-H. Chang7, N. Rosenthal8, B. Zinman9, V. Perkovic2,10, M.J. Jardine2,11, K.W. Mahaffey7;
1Department of Clinical Pharmacy and Pharmacology, University of Groningen, University Medical Center Groningen, Groningen, Netherlands, 2The George Institute for Global Health, UNSW Sydney, Sydney, Australia, 3Cardiovascular Division, Brigham & Women’s Hospital and Baim Institute for Clinical Research, Boston, USA, 4The Charles Perkins Centre, University of Sydney, Sydney, Australia and Imperial College London, London, UK, 5Nephrology Division, NYU School of Medicine and NYU Langone Medical Center, New York, USA, 6Department of Medicine, University of Chicago Medicine, Chicago, USA, 7Stanford Center for Clinical Research, Department of Medicine, Stanford University School of Medicine, Stanford, USA, 8Janssen Research & Development, LLC, Raritan, USA, 9Lunenfeld-Tanenbaum Research Institute, Mt Sinai Hospital, University of Toronto, Toronto, Canada, 10The Royal North Shore Hospital, Sydney, Australia, 11Concord Repatriation General Hospital, Sydney, Australia.
Background and aims: Individuals with type 2 diabetes mellitus (T2DM) and chronic kidney disease (CKD) are at high risk for hospitalized heart failure (HHF) and these events are reduced by canagliflozin (CANA). We investigated whether the effect of CANA on HHF or cardiovascular (CV) death differs by key participant characteristics.
Materials and methods: CREDENCE randomized participants with T2DM and CKD to CANA or matching placebo. In this analysis, we assessed the effect of CANA on the prespecified secondary outcome of HHF/CV death by baseline characteristics. Hazard ratios (HRs) and 95% CIs were estimated with Cox regression models, with subgroup by treatment interaction terms added to test for heterogeneity.
Results: Of 4401 trial participants, 432 experienced a HHF/CV death event over a median follow-up of 2.6 years. Participants at higher risk included those with a history of CV disease or HF, lower eGFR, higher UACR and baseline use of loop diuretics. CANA reduced the risk of HHF/CV death by 31% in the overall population (HR 0.69, 95% CI 0.57, 0.83), with consistent effect across a broad range of participant subgroups including those at high risk (all Pinteraction>0.246; Figure). The effect of CANA on HHF alone (HR 0.61, 95% CI 0.47-0.80) was also similar across most key participant subgroups (all Pinteraction>0.10).
Conclusion: CANA consistently reduces the risk of HHF/CV death and of HHF in T2DM and CKD across a broad range of participant subgroups, including those with and without prior HF.

Clinical Trial Registration Number: NCT02065791
Supported by: Janssen Research & Development, LLC
Disclosure: D. de Zeeuw: Employment/Consultancy; AbbVie, Bayer, Boehringer Ingelheim, Fresenius, Janssen, Mitsubishi-Tanabe, Mundipharma.
123
Empagliflozin reduces myocardial glucose uptake in persons with type 2 diabetes: a randomised double-blind, placebo-controlled crossover study
K.M. Lauritsen1,2, L.C. Gormsen3, T.K. Hansen1,2, B.R.R. Nielsen4, M. Johannsen5, J. Hansen5, H. Wiggers4, H.E. Bøtker4, L.P. Tolbod3, N. Møller1,2, E. Søndergaard1,2;
1Department of Internal medicine and Endocrinology, Aarhus University Hospital, Aarhus, 2Steno Diabetes Center Aarhus, Aarhus University Hospital, Aarhus, 3Department of Nuclear Medicine and PET center, Aarhus University Hospital, Aarhus, 4Department of Cardiology, Aarhus University Hospital, Aarhus, 5Department of Forensic Medicine, Aarhus University Hospital, Aarhus, Denmark.
Background and aims: Sodium-glucose cotransporter 2 (SGLT2) inhibition reduces cardiovascular morbidity and mortality. SGLT2 inhibition increases ketogenesis, which may contribute to the beneficial effects by serving as a cardioprotective oxygen-sparing fuel (“the thrifty substrate hypothesis”). To test this hypothesis, we investigated the effect of empagliflozin (EMPA) on cardiac glucose and free fatty acid (FFA) utilization and oxygen consumption.
Materials and methods: 13 individuals with type 2 diabetes (3 women; HbA1c: 57±6 mmol/mol; age: 62 (53-70) years) were treated for four weeks with EMPA or placebo in a randomized double-blind, placebo-controlled crossover study. At the end of each treatment period, 24-hour blood pressure (n=13) and 48-hour continuous blood glucose (n=13) were recorded. Cardiac glucose uptake and cardiac palmitate uptake, oxidation and esterification were measured in the postabsorptive state after an overnight fast with 18F-FDG (n=11) and 11C-Palmitate PET/CT (n=10), respectively. Myocardial oxygen consumption and myocardial external energy efficiency were measured with 11C-acetate PET/CT (n=10).
Results: EMPA reduced 48-hour mean blood glucose (8.0 ± 0.9 vs. 9.4 ± 2.2, p<0.01) and 24-hour mean arterial pressure (88±5 vs. 92±8 mmHg (p<0.05)). EMPA increased circulating FFA (1.0±0.4 vs. 0.8±3 mmol/L (p=0.02)) and 3-hydroxybutyrate (130 ± 17 vs. 65 ± 8 μmol/L (p<0.01)) concentrations. EMPA reduced myocardial glucose uptake (MGU) (0.6±0.6 vs. 1.4±0.6 μmol/100g/min (p<0.001) (figure 1)). EMPA did not affect myocardial FFA oxidation rate (7.2±3.1 vs. 8.0±3.1 μmol/100g/min (p=0.56)), FFA esterification rate (1.3±0.7 vs. 1.1±0.6 μmol/100g/min (p=0.34)) or total FFA uptake rate (8.4±3.6 vs. 9.1±3.2 μmol/100g/min (p=0.76). EMPA did not change myocardial external energy efficiency (29.5±7.3 vs. 27.7±4.5 % (p=0.22)) or myocardial oxygen consumption (8.97 ± 1.11 vs. 9.77 ± 1.34 ml/100g/min (p=0.12)).
Conclusion: EMPA reduces postabsorptive myocardial glucose uptake by 57% but does not affect myocardial FFA utilization despite significantly increased levels of substrate in the form of circulating FFAs. EMPA treatment therefore appears to selectively channel myocardial substrate utilization from glucose towards other sources such as ketone bodies. However, this shift in myocardial substrate utilization does not appear to improve either myocardial external energy efficiency or myocardial oxygen consumption.

Clinical Trial Registration Number: EudraCT-number 2017-001779-22
Supported by: NN Foundation, HRF of Central DK Region, DC for Independent Region, DDA, RM
Disclosure: K.M. Lauritsen: None.
124
Effects of 6 weeks of treatment with dapagliflozin, a sodium-glucose co-transporter 2 inhibitor, on myocardial function and metabolism in patients with type 2 diabetes
J. Oldgren1, S. Laurila2,3, A. Åkerblom1, A. Latva-Rasku3, E. Rebelos3, H. Isackson1, M. Saarenhovi3, O. Eriksson4, K. Heurling4, E. Johansson4, U. Wilderäng5, C. Karlsson5, E. Ferrannini6, J. Oscarsson5, P. Nuutila3;
1Uppsala Clinical Research Center and Department of Medical Sciences, Uppsala University, Uppsala, Sweden, 2Heart Center, Turku University Hospital, Turku, Finland, 3Turku PET Centre, University of Turku and Turku University Hospital, Turku, Finland, 4Antaros Medical AB, Mölndal, Sweden, 5BioPharmaceuticals R&D, AstraZeneca, Gothenburg, Sweden, 6Institute of Clinical Physiology, National Research Council, Pisa, Italy.
Background and aims: We aimed to explore early effects of dapagliflozin (DAPA) on myocardial function and metabolism in patients with type 2 diabetes (T2D) without heart failure (HF), which could help explain the reduced risk for HF hospitalization observed within a few months in sodium-glucose co-transporter 2 (SGLT2) inhibitor outcome trials.
Materials and methods: T2D patients with BMI ≥25 kg/m2, with left ventricular (LV) ejection fraction >50% and without HF, on stable metformin, and no other antidiabetic treatment, were randomized to placebo (n=26) or 10 mg/day DAPA (n=27) in a 6-week parallel group, double-blind study. Investigations at baseline and at 6 weeks included cardiac MRI, [11C]-acetate positron emission tomography (PET) (oxygen consumption and perfusion) of the heart and [18F]-FTHA PET (fatty acid uptake) of the heart and liver, and analyses of circulating biomarker levels. Placebo-adjusted changes in the per-protocol analysis set were analyzed by ANCOVA as least square means with 95% confidence intervals.
Results: Evaluable patients (placebo: n=24, DAPA: n=25; 53% males) had a mean (SD) age of 64.4 (7.2) years, BMI of 30.1 (3.7) kg/m2, HbA1c of 6.7 (0.6) %. Hypertension (75.5%) and dyslipidemia (57.1%) were common, while few patients had a prior cardiovascular event. At 6 weeks, body weight and HbA1c were decreased in the DAPA group vs placebo. Myocardial efficiency was not affected, but external LV work, total LV energy consumption and myocardial perfusion were reduced from baseline in the DAPA group, but not significantly vs placebo. No significant effects on LV sizes or volumes were observed, whereas left atrial volume was reduced in patients randomized to DAPA. Global radial strain decreased vs placebo, while global longitudinal and circumferential strain tended to increase by DAPA treatment. Myocardial fatty acid uptake was not affected, but hepatic uptake of fatty acids was increased by DAPA vs placebo. Plasma N-terminal pro-B-type natriuretic peptide (NT-proBNP) levels were unaffected. No adverse events leading to study treatment discontinuation were reported.
Conclusion: This exploratory study in patients with well-controlled T2D without HF showed limited effects on myocardial fatty acid uptake, function and efficiency, but results indicate reduced heart work after 6 weeks of treatment with dapagliflozin.
Clinical Trial Registration Number: NCT03387683
Supported by: The study was funded by AstraZeneca.
Disclosure: J. Oldgren: Other; AstraZeneca, Bayer, Bristol-Myers Squibb, Boehringer Ingelheim, Daiichi Sankyo, Pfizer, Roche Diagnostics, Sanofi.
125
Direct and acute metabolic effects of empagliflozin in diabetic mouse hearts: reduced lactate generation mediated through NHE-1 inhibition
C.J. Zuurbier1, L. Uthman1, D. Bakker1, S. Sari1, M.W. Hollmann1, N.C. Weber1, S.M. Houten2, H. Zhang1, R. Coronel3, M. van Weeghel4;
1LEICA, Anesthesiology, Amsterdam UMC, UvA, Amsterdam, Netherlands, 2Icahn Institute for Data Science and Genomic Technology, New York, USA, 3Experimental Cardiology, Amsterdam UMC, UvA, Amsterdam, Netherlands, 4Clinical Chemistry, Amsterdam UMC, UvA, Amsterdam, Netherlands.
Background and aims: Changes in cardiac metabolism and ion homeostasis precede and drive cardiac remodeling and heart failure development upon hemodynamic or metabolic overload. We previously demonstrated that SGLT2i’s have direct cardiac effects on ion homeostasis through inhibition of the sodium/hydrogen exchanger (NHE-1). Here we investigate whether the SGLT2i Empagliflozin (Empa) 1) possesses direct and acute cardiac effects on metabolism of the intact isolated diabetic heart, and 2) mediates cardiometabolic effects through inhibition of NHE-1 activity. Purpose: To study direct and acute metabolic effects of Empa in isolated diabetic mouse hearts and its dependency on NHE-1 activity.
Materials and methods: 11-14 wks db/db male hearts were Langendorff-perfused at constant flow for 35 min with (in mM) 5.5 glucose, 1.0 lactate, 0.1 pyruvate, 0.5 glutamine, 0.4 palmitate, 0.5 L-carnitine, 100 mU/L insulin and 5 nM epinephrine. A balloon was positioned in the left ventricle to monitor mechanical function of the heart. Three different series were examined: 1: 13C glucose perfusions (n=16); 2: 13C glucose + 10 μM Cariporide (specific NHE-1 inhibitor) perfusions (n=17), and 3: 13C palmitate perfusions (n=13). Within each series, Empa treated hearts (1 μM Empa) were compared with vehicle-treated hearts (0.02% DMSO). At end experiment, hearts were immediately frozen and lysed for stable isotope analysis and metabolomics using LC-MS techniques. Hearts were also analyzed for phosphorylation status of AKT, STAT3, AMPK, ERK, and eNOS (n=8 per group).
Results: At baseline, before treatment, end-diastolic pressure (3 ±1 mmHg), Rate-Pressure-Product (49.697±6.573 mmHg.beats/min), +dp/dt (5607±858 mmHg/s), -dp/dt (4726±732 mmHg/s) and oxygen consumption (51±12 μmol/min/gram dry weight) were similar between control and Empa group, and were not differentially affected by 35 min Empa treatment. Empa treatment was also without effect on protein phosphorylation status. 35 min perfusion of Empa significantly decreased lactate labeling in the 13C glucose perfusions (13C labeling of lactate: 58 ± 2% vs 50 ± 3%, for vehicle and Empa, respectively; p=0.02) and trended to lower the total content of unlabeled and labeled glucose-6-phosphate (G6P 5.2 ± 0.8 AU vs 3.3 ± 0.4 AU, for vehicle and Empa, respectively; p=0.052), without changes in other glucose metabolic pathways. Cariporide mitigated Empa effects on lactate labeling and G6P. Empa was without effect on fatty acid oxidation, except for an increased labeling in α-ketoglutarate (13C labeling of α-KG: 79 ± 1% vs 86 ± 1% for vehicle and Empa, respectively; p=0.002).
Conclusion: The present study shows for the first time that the SGLT2 inhibitor Empagliflozin directly and acutely decreases cardiac lactate generation in diabetic hearts, with a trend for lower G6P, through an NHE-1 dependent fashion. Less lactate generation, indicating an improved energy status heart, and lower G6P content, which reduces the activation of cardiac growth programs, may contribute to the beneficial effects of SGLT2i’s on cardiac remodeling, hypertrophy and heart failure development.
Supported by: EFSD/Novo Nordisk Programme
Disclosure: C.J. Zuurbier: Grants; EFSD.
126
Effect of empagliflozin on the fibrosis biomarkers and left ventricular haemodynamics in patients with type 2 diabetes and chronic heart failure
D. Lebedev, A. Babenko;
Almazov national medical research centre, Saint Petersburg, Russian Federation.
Background and aims: Sodium glucose co-transporter 2 inhibitor, a widely used class of antihyperglycemic medications acting on inhibiting glucose reabsorption, is shown beneficial in reduction of heart failure hospitalization and cardiovascular mortality. However the mechanisms remain unclear. Aim of the study: To investigate the impact of empagliflozin on fibrosis biomarkers and left ventricular parameters in patients with type 2 diabetes mellitus (T2DM) and chronic heart failure with preserved ejection fraction (HFpEF).
Materials and methods: Thirty five patients with T2DM and HFpEF were enrolled in the study. Inclusion criteria were: females or males aged 40 to 75 years, glycated hemoglobin (HbA1c) 7.5-10.0%, stable antihyperglycemic therapy at least for 12 weeks. Exclusion criteria were: acute illness or infection, a cardiovascular event during the past 6 months, chronic heart failure NYHA III-IV, chronic kidney disease (estimated glomerular filtration rate (eGFR), according to CKD-EPI (eGFR < 45 mL/min/1.73 m2). Patients were received empagliflozin 10 mg during 24 weeks. Transthoracic echocardiography and laboratory tests such as glycated hemoglobin (HbA1c), creatinine, galectin-3, tissue inhibitor of metalloproteinase-1 inhibitor (TIMP-1), procollagen type I carboxy-terminal propeptide (P1CP), matrix metalloproteinase-9 (MMP-9), N-terminal fragment brain natriuretic peptides (NT-pro-BNP), ST-2 were done.
Results: No significant difference was observed in galectin-3, P1CP, MMP-9, ST-2 concentrations between the baseline and the end of treatment. There was an increase in TIMP-1 concentration after 24 weeks of treatment compared with baseline (215 ng/ml (186,5-234) versus 177 ng/ml (118,25-202,5), respectively, p=0,006). Left ventricular mass index (LVMI) significantly decreased from 126 g/m2 (95,5-154) to 111,1 g/m2 (94,8-150,0), (p = 0.043). However, after applying of Holm-Bonferroni correction this difference has become nonsignificant. There was no significant difference in end-diastolic volume (EDV), end-systolic volume (ESV) and end-diastolic volume index (EDVI). Positive correlation was observed between galectin-3 concentrations and EDV after 24 weeks of treatment (-0,532, р=0,002).
Conclusion: Empagliflozin in patients with T2DM and HFpEF did not affect left ventricular function, measured by echocardiography. Furthermore, empagliflozin treatment did not lead to significant changes in fibrosis biomarkers, except TIMP-1. Further research is needed to clarify obtained results.
Supported by: RSF № 17-75-30052
Disclosure: D. Lebedev: Grants; Russian Scientific Fund: grant number 17-75-30052.
OP 22 New Treatments for NAFLD: Hope or Hype?
127
Therapeutic effect of a novel long-acting GLP-1/GIP/Glucagon triple agonist (HM15211) in CDHFD-induced NASH and fibrosis mice
J. Choi, H. Jo, J. Kim, H. Kwon, J. Lee, S. Bae, D. Kim, S. Lee, I. Choi;
Hanmi Pharm.Co.,Ltd., Hwaseong-si, Gyeonggi-do, Republic of Korea.
Background and aims: Nonalcoholic steatohepatitis (NASH) is a progressive liver disease characterized by steatosis and inflammation, which eventually results in fibrosis. In particular, advanced fibrosis due to NASH is associated with a high risk of liver-related mortality, becoming one of the main causes for liver transplantation. To date, there are, however, no pharmacological therapy approved. One major hurdle for the drug development is limited pathologic features of current animal models, in terms of clinical relevance. The choline-deficient and high fat diet (CDHFD) mice develop multiple aspects of NASH and fibrosis similarly with those in human, being increasingly recognized as a feasible disease model for the evaluation of NASH drug candidates. HM15211 is a novel long-acting GLP-1/GIP/Glucagon triple agonist, and developed for the treatment of NASH and fibrosis. Previously, HM15211 treatment reduced hepatic fat contents and fibrosis in various animal models of NASH and fibrosis. Here, we further explored its therapeutic efficacy in CDHFD mice.
Materials and methods: To induce NASH and fibrosis, the mice were fed with choline-deficient and high fat diet (CDHFD) for 14 weeks, and HM15211 was subcutaneously administered during last 6 weeks. Cilofexor (CIL, FXR agonist) was used as comparative control. At the end of treatment, the liver tissue samples were prepared, and the degree of hepatic steatosis and fibrosis was determined by measuring hepatic triglyceride (TG) and hydroxyproline contents, respectively. Additional liver tissue samples were subjected to H&E and Sirius red staining, followed by histological grading. Quantitative PCR analysis was performed to determine the hepatic fibrosis marker gene expression, and the blood levels of fibrosis surrogate markers were measured by ELISA. To further evaluate the potential therapeutic effect of HM15211 on advanced fibrosis, CDHFD mice were established with an extended induction period (up to 24 weeks).
Results: In CDHFD mice, HM15211 treatment significantly reduced hepatic TG (2.6 and -51.0% vs. vehicle for CIL and HM15211) and TBARS (oxidative stress marker) (11.0 and -81.4% for CIL and HM15211). In addition, HM15211 treated group was associated with more reduction in hepatic pro-inflammatory marker gene expression such as F4/80 (-1.6 and -30.2% vs. vehicle for CIL and HM15211) and IL-1β (-37.5 and -68.8% for CIL and HM15211). Histological analysis further demonstrated the more benefits of HM15211 in steatosis and inflammation improvement, resulting in greater reduction in NAFLD activity score (NAS) than CIL. For efficacy in fibrosis, HM15211 treatment consistently showed more reduction in hepatic hydroxyproline (-13.7 and -37.7% for CIL and HM15211) and marker gene expression such as collagen-1α1 (-37.5 and -72.3% vs. vehicle for CIL and HM15211). To further confirm the therapeutic benefits, CDHFD mice with an extended induction period (24 weeks) was administered with HM15211, and same beneficial effects on NASH and fibrosis improvement were also confirmed.
Conclusion: Based on these results, we propose that HM15211 might be a novel therapeutic option for NASH and fibrosis. Hence, more efficacy than FXR agonist in CDHFD mice further highlight the potential benefits of multi-targeting approaches of HM15211. Clinical studies in biopsy proven NASH patients are ongoing to assess the clinical relevance of these findings.
Disclosure: J. Choi: None.
128
The selective PPAR gamma modulator CHS-131 improves liver histopathology and metabolism in a biopsy-confirmed mouse model of non-alcoholic steatohepatitis and obesity
N. Perakakis1, A. Joshi1, N. Peradze1, K. Stefanakis1, G. Li2, M. Feigh3, G. Rosen2, M. Fleming2, C.S. Mantzoros1;
1Internal Medicine, Boston VA Healthcare system and Beth Israel Deaconess Medical Center, Harvard Medical School, Boston, USA, 2Coherus Biosciences, San Francisco, USA, 3Gubra, Horsholm, Denmark.
Background and aims: CHS-131 is a selective peroxisome proliferator-activated receptor gamma (PPARγ) modulator that demonstrates dose-dependent antidiabetic effects with less side effects (i.e. fluid retention and weight gain) compared to thiazolidinediones in phase II clinical trials. The aim of this study was to investigate the effects of CHS-131 on metabolic parameters and liver histopathology in a diet-induced obese (DIO) and biopsy-confirmed mouse model of non-alcoholic steatohepatitis (NASH).
Materials and methods: Male C57BL/6JRj mice were fed AMLN diet (40% fat with trans-fat, 20% fructose and 2% cholesterol) for 33 weeks prior to liver biopsy procedure. Only animals with biopsy-confirmed steatosis (score ≥2) and fibrosis (stage ≥F1) were included and stratified into treatment groups (n=12-13) to receive for the next 12 weeks: 1) vehicle, 2) Low dose CHS-131 (10 mg/kg), 3) High dose CHS-131 (30 mg/kg). Metabolic parameters related to body composition and glucose homeostasis, liver histopathology, markers of liver function and liver, subcutaneous and visceral adipose tissue gene expression profiles were assessed.
Results: CHS-131 has no substantive effect on body weight, body composition (fat, lean or water mass) and energy intake in DIO-NASH mice with fibrosis. CHS-131, both in low and high dose, improved fasting insulin levels and insulin sensitivity in intraperitoneal insulin tolerance test. CHS-131 (high dose) resulted in 37% lower plasma levels of alanine transaminase, 29% of aspartate transaminase and 20% of total cholesterol. Both low and high doses of CHS-131 increased robustly plasma adiponectin levels (by 114% and 137% of mean levels respectively). Urea levels, as a marker of hydration, were not affected by CHS-131 treatment. CHS-131 (high dose) improved NAFLD liver histology activity score with impacts on lobular inflammation and hepatocellular ballooning. Additionally, CHS-131 exhibited trends to decreased markers of hepatic fibrosis (-28% for hydroxyproline, -24% for Col1a1, -21% for a-SMA, -18% for Galectin-3). DIO-NASH mice treated with CHS-131 demonstrated a shift to diacyl- and triacylglycerols with shorter chains in the liver and a partial restoration of the reduced levels of hepatic amino acids. Additionally, CHS-131 increased the expression of genes stimulating mitochondrial function (PGC-1a), fatty acid oxidation (Acox1) and browning (Ucp1, Elovl3) and decreased expression of genes promoting fatty acid synthesis (Fasn), triglyceride synthesis (Mlxipl) and inflammation (F4/80, Ccl2) in adipose tissue.
Conclusion: CHS-131 can be an effective treatment in NASH by improving hepatic lipid composition, reducing lobular inflammation and hepatocyte ballooning and decreasing markers of hepatic fibrosis. The beneficial effects of CHS-131 on NASH are most probably achieved indirectly by changes in visceral and subcutaneous adipose tissue function, elevated adiponectin levels and systemic improvement of insulin sensitivity. Treatment with CHS-131 was not associated with common side effects observed in full PPARγ activators, such as water retention and weight gain.
Supported by: NiP was funded by DFG, Number 389891681 (PE2431/2-1). CSM and MF were funded by Coherus Biosciences
Disclosure: N. Perakakis: Employment/Consultancy; CSM is consultant for Coherus Biosciences. Grants; Deutsche Forschungsgemeinschaft (DFG, German Research Foundation) –389891681 (PE 2431/2-1) provided funding to NiP, Coherus Biosciences provided funding to CSM and MF. Stock/Shareholding; CSM is shareholder of Coherus Biosciences.
129
A direct AMPK activator reduces liver steatosis in a mouse model of NASH
K.M. Mather1, M.L. Boland1, E.L. Rivers2, A. Srivastava2, M. Schimpl2, P. Hemsley2, J. Robinson2, P.T. Wan2, J.L. Hansen1, J. Trevaskis1, D.M. Smith2;
1CVRM, AstraZeneca, Gaithersburg, USA, 2AstraZeneca, Cambridge, UK.
Background and aims: Non-alcoholic fatty liver disease (NAFLD) is estimated to affect 25% of adults and is highly associated with metabolic disease. NAFLD often progresses to non-alcoholic steatohepatitis (NASH), which has no cure or treatment, and can lead to cirrhosis and hepatocellular carcinoma. AMPK (5’AMP-activated protein kinase) activators have shown potential for treating NAFLD/NASH due to their effects on fatty acid inhibition and cholesterol synthesis. After evaluating and characterizing several AMPK activators, we selected a compound, herein referred to as C455, to evaluate this potential in a preclinical NASH study.
Materials and methods: X-ray crystallography demonstrated the binding of AMPK α2β1γ1 protein by C455 at the ADaM site. Pharmacokinetic studies were performed by oral and IV administration in C57LB/6 and CD-1 mice. HepG2 cells were used to measure activation by ACC phosphorylation with an EC50 of 81nM. Selectivity was determined testing 1uM, or a dose response curve of C455 against panels from Eurofins and Thermo Fisher of over 470 targets. After 14 weeks on a high fructose / high cholesterol (Amylin -NASH) diet, or low-fat control (LFD) male ob/ob mice were randomized into groups based on liver fibrosis (determined by biopsy 3 weeks prior), body weight (BW), plasma ALT, and body composition. Mice were dosed via oral gavage with vehicle or C455 at 3 or 30mg/kg daily for 6 weeks. On day 28 a fasting glucose tolerance test was preformed using 1.5g/kg glucose bolus. On Day 42 mice were euthanized. Blood, liver, and heart were collected for histological, biochemical, and gene expression measurements.
Results: C455 demonstrated selective activation of AMPK and was equally potent with both beta-isoforms α1β1γ1 7.8 nM +0.2 SEM n=10; and α1β2γ1 7.2 nM +0.1 SEM n=5. Pharmacokinetics determined a bioavailability of 45% and half-life of 3h. Overall the compound showed good permeability 26 (1x10⁻⁶ cm/s), low protein binding 2.6% free, and low hepatic metabolism < 3 μl/min/106, but moderate solubility 8.0μM, making it a good candidate for our study. After 6 weeks of treatment, plasma ALT and terminal liver weight were decreased 32% + 7.9% p=0.0257 and 22% + 3.3%p=0.0003 respectively in mice treated with 30mg/kg C455 vs. vehicle. This dose also decreased liver lipid from 33% to 23% + 1.8 p<0.0001, which was below levels seen in the LFD group. Liver fibrosis via collagen staining did not improve with treatment, but significant decreases in mRNA transcripts for Col1a1 61% + 4.2% p<0.0001, Col1a2 59% + 2.9 p<0.001, Col4a1 55% + 3.9 p<0.0001, and Timp1 55% + 3.1% p<0.0001, were seen. There was a dose dependent increase in heart weight relative to body weight 13.3% + 3.9% p=0.008, and increased expression of genes associated with cardiac hypertrophy at 30mg/kg, including Ankrd1 48.2% +10.2% p=.0099. Mice given 30mg/kg C455 also increased their cardiac glycogen storage by 394% + 123% p = 0.012 compared to vehicle treated mice.
Conclusion: Our results show systemic activation of AMPK in a diet-induced mouse model of NASH reduces plasma ALT, decreases liver lipid, and suppressed hepatic collagen gene expression but shows no histological improvement in fibrosis. Coupled with increased heart weight and glycogen storage, our data suggests that current small molecule activators of AMPK may not be viable therapies for the treatment of NASH-related fibrotic disease.
Disclosure: K.M. Mather: None.
130
Empagliflozin ameliorates obesity associated fatty liver disease by regulating Sestrin2-mediated AMPK-mTOR signalling pathway in obese mice
X. Sun1, N. Hou1, F. Han2, Y. Liu1, N. Huang1;
1Department of Endocrinology, Affiliated Hospital of Weifang Medical University, Weifang, Shandong, 2Department of Pathology, Affiliated Hospital of Weifang Medical University, Weifang, Shandong, China.
Background and aims: Obesity is linked to an increased risk of nonalcoholic fatty liver disease, which is also called obesity associated fatty liver disease (OAFLD). Sodium glucose co-transporter-2 (SGLT2) inhibitors may be effective for improving OAFLD by improving metabolic profiles. Sestrin2, a novel stress-inducible protein that lacks kinase activity, has been shown to maintain hepatic energy homeostasis by AMPK/mTOR. However, whether sestrin2-mediated AMPK/mTOR is involved in the protective effects of SGLT2 inhibitor on OAFLD remains elusive. Therefore, the aim of this study was to determine whether empagliflozin, an SGLT2 inhibitor,could improve OAFLD by upregulating sestrin2-mediated AMPK/mTOR in high fat diet (HFD) induced obese mice.
Materials and methods: C57BL/6 and Sestrin2 knockout mice were fed with a normal-chow diet or an HFD with 12 weeks and then were treated with or without empagliflozin (10mg/kg) for another 8 weeks. Liver injury was evaluated by liver function test, histopathology, oil red o staining and masson's trichrome. Mitochondrial superoxide production was detected by MitoSOX probe. Sestrin2-AMPK/mTOR signaling pathways were determined by western blot.
Results: HFD mice showed significant increased body weight, fat mass, NEFA, and triglyceride levels and impaired glucose tolerance and insulin sensitivity (body weight, 49.5 ± 2.8 g vs. 33.8 ± 1.9 g; fat mass 17.6 ± 3.4 g vs.5.5 ± 0.8 g; AUC glucose 19194± 610 vs. 38739± 1750; AUC insulin 9617± 242 vs.5407± 326; P < 0.05). Treatment of HFD mice with empagliflozin reduced body weight, body fat mass, improved glucose tolerance and insulin sensitivity without improving lipid levels (body weight, 41.2 ± 1.5 g vs. 49.5 ± 2.8 g; fat mass 10.7 ± 2.6 g vs.17.6 ± 3.4 g; AUC glucose 27714 ± 1052 vs. 38739± 1750; AUC insulin 6263 ± 337 vs.9617± 242; P<0.05). HFD mice showed significant hepatic injury, lipid accumulation, fibrosis and mitochondria injury. Treatment of HFD mice with empagliflozin treatment significantly improved hepatic injury, lipid accumulation and fibrosis (P<0.05). Additionally, empagliflozin ameliorated mitochondrial superoxide production and mitochondria injury (P<0.05). Empagliflozin treatment significantly enhanced proteins of sestrin2 and phosphorylation of AMPK, but inhibited phosphorylation of mTOR (P < 0.05). These beneficial effects were partially attenuated in HFD-fed Sestrin2 knockout mice when treated with empagliflozin.
Conclusion: Our study indicates that empagliflozin improves OAFLD via regulating Sestrin2-mediated AMPK/mTOR signaling pathway from HFD induced obese mice. These findings provide a novel mechanism for hepatic protection of SGLT2 inhibitor on OAFLD.
Supported by: National Natural Science Foundation of China (81870593, 81600688)
Disclosure: X. Sun: None.
131
Effects of biliopancreatic diversion on non-alcoholic steatohepatitis: 5 years follow up
M.F. Russo1, E. Lembo1, A. Mari2, G. Mingrone1;
1Università Cattolica Del Sacro Cuore- Sede di Roma, Rome, 2Institute of Neuroscience - National Research Council, Padova, Italy.
Background and aims: Over the past 40 years, biliopancreatic diversion (BPD) has been widely used both as an effective treatment for morbid obesity and for the resolution/remission of its associated metabolic comorbidities. Our study aims to investigate the evolution of NAFLD and NASH after BPD intervention.
Materials and methods: 46 patients who underwent BPD between 2008 and 2013 with concomitant preoperative and postoperative liver biopsy were included in our study. Liver biopsy was classified according to the Steatosis-Activity-Fibrosis score (SAF score) proposed by Bedossa et al., and the NAFLD activity score (NAS) proposed by Kleiner. The SAF score evaluates steatosis from 0 to 3, the activity grade namely the unweighted addition of hepatocyte ballooning (0-2) and lobular inflammation (0-2) and fibrosis in stages from 0-4. The NAS score has a range from 0 to 8: NAS ≥ 3 is indicative of NASH. The most common non-invasive liver damage tests were calculated: NAFLD Fibrosis Score (NFS), AST/ALT ratio, AST to Platelet ratio (APRI), fibrosis 4 score (FIB4). The β-cell function was assessed from OGTT using a model describing the relationship between insulin secretion and glucose concentration as the sum of two components as demonstrated by Mari et al. Insulin resistance was measured by oral insulin sensitivity (OGIS), homeostasis model assessment of insulin resistance (HOMA-IR index) and quantitative insulin sensitivity check index (QUICKI). Biological, histological and clinical data were collected before and 5 years after surgery. P values were calculated from Wilcoxon signed-rank test analysis.
Results: At baseline patients age was 43(±9) years, with a BMI of 49.9(±6.6) kg/m2; 16 of them had type 2 diabetes mellitus (T2DM) with an average HbA1c of 50(±4) mmol/mol. After 5 years BMI was 31.9(±6.4) kg/m2 and only two subjects had still diabetes with an average HbA1c of 34(±14) mmol/mol. Insulin sensitivity indexes showed a significantly improvement after BPD; in particular HOMA-IR from 4.3(±2.5) to 2.7(±1.8) with P=0.011; OGIS from 360.3(±95.6) to 448.6(±69.8) with P=0.002. Total insulin secretion did not show a statistically significant difference after BPD. Also fasting insulin and fasting plasma glucose decreased significantly (P=0.023 and P=0.000 respectively). Regarding the predictive indices of NAFLD, we found a reduction of the NAFLD fibrosis score (pre-BPD -0.482±1.54/post-BPD -2.04±1.41 with P=0.000). We found also a statistically significant improvement of total cholesterol, HDL and LDL cholesterol and triglycerides.
Conclusion: Biliopancreatic diversion is a valuable treatment for NASH ameliorating the main metabolic, anthropometric and insulin sensitivity related variables. In fact, liver biopsies obtained before and at 5 years after surgery showed a clear improvement of NASH features.

Disclosure: M.F. Russo: None.
132
Triple therapy with pioglitazone/exenatide/metformin prevents hepatic fibrosis and steatosis in type 2 diabetes
O. Lavrynenko, M. Abdul-Ghani, M. Alatrach, C. Puckett, J. Adams, E. Cersosimo, N. Alkhouri, R.A. DeFronzo;
UTHSCSA, San Antonio, USA.
Background and aims: Patients with NAFLD and T2DM are at high risk of liver fibrosis. Pioglitazone and GLP1 RAs have shown efficacy against NAFLD. The EDICT trial compared the efficacy of Triple (Pioglitazone/ Exenatide/ Metformin) vs Conventional (Metformin/Glipizide/Insulin) Therapy in T2DM. The aim of the present study was to evaluate the effect of these two approaches on liver fibrosis scores (AST/ALT ratio, APRI, FIB-4, NFS) and hepatic fibrosis and steatosis using the FibroScan
Materials and methods: 144 newly diagnosed T2DM were randomized to receive Triple or Conventional Therapy to maintain HbA1c <6.5%. After 2 years baseline measurements and liver fibrosis scores were repeated; we also performed FibroScan to quantitate hepatic fibrosis and steatosis
Results: At baseline patients were well matched for age, BMI, HbA1c (8.8%) and LFTs. Neither therapy reduced any liver fibrosis score. Triple, but not Conventional, Therapy reduced the AST and ALT (p<0.001). The greatest AST and ALT reductions with Triple Therapy occurred in subjects in the highest AST and ALT tertiles at baseline. After 2 years, only 1 subject receiving Triple Therapy had a fibrosis score > 0, while 43% of Conventional Therapy subjects had a fibrosis score of F3/F4 (p<0.00001) (See Table). 87% of Conventional Therapy subjects had a steatosis score of S2/S3 vs 38% of Triple Therapy subjects (p<0.001) (See Table)
Conclusion: Both Triple (6.0%) and Conventional Therapy (6.7%) markedly reduced the HbA1c after 2 years, but only Triple Therapy (Pioglitazone/Exenetide/Metformin) reduced the AST and ALT. Liver fibrosis scores did not change in either group and were not useful in predicting response to therapy. Triple Therapy completely prevented fibrosis and reduced steatosis by >50 % vs Conventional Therapy.

Clinical Trial Registration Number: NCT01107717
Disclosure: O. Lavrynenko: None.
OP 23 Addressing potential new treatments of diabetic kidney disease
133
Once-weekly exenatide effects on EGFR slope and UACR as a function of baseline UACR: an EXSCEL trial post-hoc analysis
A.B. van der Aart1, L.E. Clegg2, R.C. Penland3, D.W. Boulton2, D. Sjöström4, R.J. Mentz5, R. Holman6, H.J.L. Heerspink1;
1Clinical Pharmacy and Pharmacology, University of Groningen, Groningen, Netherlands, 2Clinical Pharmacology & Quantitative Pharmacology, R&D, AstraZeneca, Gaithersburg, USA, 3Clinical Pharmacology & Quantitative Pharmacology, R&D, AstraZeneca, Boston, USA, 4Late-stage Development CVRM, BioPharmaceuticals R&D, AstraZeneca, Gothenburg, Sweden, 5Duke University and Duke Clinical Research Institute, Duke University School of Medicine, Durham, USA, 6Diabetes Trials Unit, University of Oxford, Oxford, UK.
Background and aims: GLP-1 RA effects on major kidney outcomes in unselected T2D patients at high cardiovascular (CV) risk are modest or neutral. However, GLP-1 RA may provide renal benefits in those at high risk of worsening kidney disease. We examined once-weekly exenatide (EQW) effects on eGFR slope and UACR change, as a function of baseline UACR, in a subset of EXSCEL participants.
Materials and methods: Of 14752 EXSCEL participants, eGFR slope was assessed in those with baseline UACR and ≥1 post-baseline eGFR (n=3503 [23.7%]) via mixed model repeated measures (MMRM) analysis (median follow-up 3.3 years). UACR percent change from baseline to first post-baseline measurement (median time 8.9 months) was assessed in those with baseline and ≥1 follow-up UACR (n=2828 [19.2%]) via ANCOVA of log-transformed UACR, with baseline UACR as a covariate.
Results: Participants with baseline UACR measurements were generally similar to the overall EXSCEL population, and balanced across treatment arms. EQW improved eGFR slope, compared with placebo, in patients with baseline UACR>100mg/g (+0.79 mL/min/1.73m2/year [95% CI 0.24-1.34]) and UACR>200mg/g (+1.32 mL/min/1.73m2/year 95% CI [0.57-2.06], but not at lower UACR thresholds (Figure A). No difference in EQW effect on eGFR was observed as a function of baseline eGFR, CV disease history, RAAS inhibitor use, or SBP. EQW, compared with placebo, reduced UACR by 28.2% in patients with baseline UACR>30 mg/g. This effect was consistent in subgroups with higher baseline UACR (baseline UACR>100 mg 22.5%; baseline UACR>200 mg 34.5%) (Figure B).
Conclusion: This post-hoc EXSCEL analysis suggests that EQW reduces UACR, with improvement in eGFR slope specifically in participants with elevated baseline UACR.

Supported by: This analysis was funded by AstraZeneca
Disclosure: A.B. van der Aart: None.
134
Renoprotection with semaglutide and liraglutide: Direct or indirect effects?
J.F.E. Mann1, J.B. Buse2, T. Idorn3, L.A. Leiter4, R. Pratley5, S. Rasmussen3, T. Vilsbøll6, B. Wolthers3, V. Perkovic7;
1Friedrich Alexander University of Erlangen, Erlangen, Germany, 2University of North Carolina School of Medicine, Chapel Hill, USA, 3Novo Nordisk A/S, Søborg, Denmark, 4Li Ka Shing Knowledge Institute, St. Michael’s Hospital, University of Toronto, Toronto, Canada, 5AdventHealth Translational Research Institute, Orlando, USA, 6Steno Diabetes Center Copenhagen and University of Copenhagen, Copenhagen, Denmark, 7The George Institute, UNSW, Sydney, Australia.
Background and aims: The SUSTAIN 6 and LEADER cardiovascular (CV) outcome trials indicated that the glucagon-like peptide-1 analogues semaglutide and liraglutide may provide renal as well as CV benefits. This post hoc analysis investigated the degree to which the observed renoprotective effects could be mediated by HbA1c, systolic BP (SBP) and body weight (BW).
Materials and methods: SUSTAIN 6 (N=3297) and LEADER (N=9340) assessed CV, renal and safety outcomes for semaglutide and liraglutide vs placebo in patients with type 2 diabetes and high CV risk. A prespecified secondary outcome in these trials was a renal composite of new‑onset persistent macroalbuminuria, persistent doubling of serum creatinine, need for continuous renal-replacement therapy or death due to renal disease. We performed counterfactual mediation analyses of HbA1c, SBP and BW using absolute values at each trial visit. The direct contribution of semaglutide/liraglutide to time to first renal event was estimated assuming that the mediator values changed to those observed in the placebo group (from baseline to 2 and 3 years in SUSTAIN 6 and LEADER, respectively). In the adjusted model for HbA1c, both SBP alone and in combination with BW were included as confounders. Due to the limited number of events in SUSTAIN 6, 95% CIs could not be calculated.
Results: In SUSTAIN 6 and LEADER, the rate of a renal event was reduced by 36% (95% CI 12%,54%; p=0.005) and 22% (95% CI 8%,33%; p=0.003) in the semaglutide and liraglutide groups, respectively, versus placebo. HbA1c was estimated to mediate 26% and 25% (95% CI 7.1,67.3) of the benefits of semaglutide and liraglutide, respectively, whereas the contributions of SBP (22% and 9% [95% CI 2.8,22.7]) and BW (-8% and 9% [95% CI -7.9,35.5]) were smaller. In adjusted analyses, the contribution of HbA1c increased to 36% (SBP as confounder) and 30% (95% CI -4.5,81.1; SBP and BW as confounders) in the semaglutide and liraglutide groups, respectively.
Conclusion: The renal benefits of semaglutide and liraglutide appear mediated to a modest extent by changes in HbA1c, SBP and BW, and are therefore likely to be also driven by other, potentially direct, mechanisms.
Clinical Trial Registration Number: SUSTAIN 6 (NCT01720446) and LEADER (NCT01179048)
Supported by: Novo Nordisk A/S
Disclosure: J.F.E. Mann: Non-financial support; Abstract supported by Novo Nordisk.
135
Liraglutide improves obese-induced renal injury by alleviating uncoupling of glomerular VEGF-NO axis in obese mice
Y. Ma1, K. Li2, N. Hou1, F. Han3, X. Han1, X. Sun1;
1Department of Endocrinology, Affiliated Hospital of Weifang Medical University, Weifang, 2Department of Nephrology, Affiliated Hospital of Weifang Medical University, Weifang, 3Department of Pathology, Affiliated Hospital of Weifang Medical UniversityD, Weifang, China.
Background and aims: The uncoupling of glomerular vascular endothelial growth factor (VEGF) - nitric oxide (NO) axis is considered to be an important mechanism of obesity-related renal disease. We aimed to determine whether liraglutide, glucagon-like peptide-1 agonist, reduced urinary albumin excretion through improving uncoupling of glomerular VEGF-NO axis in diet-induced obese mice.
Materials and methods: Six-week male C57BL/6J mice were fed a normal-chow diet or a high-fat diet (HFD) for 24 weeks with or without liraglutide (200 μg/kg/d) by intraperitoneal injections for another 8 weeks. Blood biochemical and urinary albumin excretion were measured. The cortical tissue of the kidney and glomeruli were collected by using the sieving technique. Glomeruli VEGF and AMPK-eNOS pathway were determined by Western-blot. Glomeruli NO, renal heme oxygenase-1 activity and malondialdehyde were determined.
Results: Treatment of HFD mice with liraglutide reduced body weight gains (45.55±1.07g vs. 54.65±0.95g, p < 0.05), visceral fat (8.91±0.57g vs. 14.54±0.61, p < 0.05), perirenal fat (2.85±0.20g vs. 5.41±0.34g, p < 0.05) and significantly reduced FFA levels (1.02 ± 0.08 mmol/L vs. 1.71 ± 0.12 mmol/L, p < 0.05). Liraglutide significantly improved glucose tolerance and increased insulin sensitivity, which were impaired in HFD mice. The HFD mice had a higher 24h urinary albumin excretion levels compared to the control mice (45.72 ± 3.44 ug vs. 15.11± 1.09 ug, P < 05), which was reduced by 45.9% after liraglutide treatment (24.73 ± 2.12 ug vs. 45.72 ± 3.44 ug, P < 0.05). No significant difference in serum creatinine was found among the groups (P>0.05). Additionally, liraglutide significantly reduced glomerular VEGF levels and increased glomerular NO production (P< 0.05), indicating that the restoring of glomerular VEGF-NO axis. Treatment HFD mice with liraglutide reduced the glomerular hypertrophy and partly improved the increased proliferation of endothelial cells in glomeruli. Liraglutide treatment also enhanced glomerular AMPK and eNOS phosphorylation (P <0.05). HFD mice showed reduced heme oxygenase-1 activity and increased malondialdehyde levels, indicating the excessive oxidative stress (P < 0.05). However, liraglutide significantly enhanced renal heme oxygenase-1 activity and reduced malondialdehyde levels, recovering the oxidative-antioxidative balance (P < 0.05).
Conclusion: Liraglutide could reduce urinary albumin excretion and ameliorate renal injury by rectify uncoupling of the glomerular VEGF-NO axis and reduced abnormal proliferation of endothelial cells in HFD-induced obese mice. These findings provide a novel mechanism for protective effects of liraglutide on kidney in obesity.
Supported by: NSFC 81870593, 81600688, 81400829
Disclosure: Y. Ma: None.
136
Empagliflozin, either alone or in combination with linagliptin, restores autophagy and apoptosis regulators in the kidney in db/db diabetic mice
A. Korbut1, N. Muraleva2, Y. Taskaeva1, N. Bgatova1, V. Klimontov1;
1Research Institute of Clinical and Experimental Lymphology – Branch of the Institute of Cytology and Genetics, Siberian Branch of Russian Academy of Sciences, Novosibirsk, 2Institute of Cytology and Genetics, Novosibirsk, Russian Federation.
Background and aims: Recent data indicate emerging role of autophagy and apoptosis in diabetic kidney disease. Therefore, these could be the therapeutic target in diabetes. Inhibitors of sodium-glucose cotransporter-2 (SGLT2) and dipeptidyl peptidase-4 (DPP4) are considered as promising agents in diabetic nephropathy, but little is known about the mechanisms of their protective activity. Thus, our study assessed the effects of SGLT2 inhibitor empagliflozin, either alone or in combination with DPP4 inhibitor linagliptin, on renal expression of autophagy and apoptosis regulators in a model of type 2 diabetes.
Materials and methods: Male 8-week-old db/db mice (BKS.Cg-Dock7m+/+Leprdb/J) were treated by vehicle, empagliflozin (10 mg/kg) or combination of empagliflozin and linagliptin (10 mg/kg of each) for 8 weeks. Non-diabetic heterozygous db/+ mice were acted as control. Plasma glucose, fructosamine, glycated albumin, insulin, leptin, creatinine, urinary albumin to creatinine ratio (UACR) and body composition were assessed at Week 0 and 8 of experiment. Renal structural changes were analyzed quantitatively from the light and transmission electron microscopy (TEM). LAMP-1, an autophagy marker, caspase-3 and Bcl-2, the apoptotic markers, were evaluated in renal cortex by western blot. To estimate glomerular autophagy, immunohistochemistry for beclin-1 and LAMP-1 was performed. Podocyte autophagy was assessed by counting the volume density (Vv) of autophagosomes, lysosomes and autolysosomes in TEM images.
Results: The db/db mice were obese and hyperglycemic and demonstrated substantially elevated plasma leptin and insulin and increased fat mass (all p<0.0001). Plasma glucose, fructosamine, glycated albumin, and UACR remained elevated throughout the experiment in the vehicle group, but decreased in empagliflozin and empagliflozin-linagliptin-treated animals (all p<0.05). Empagliflozin, either alone or in combination with linagliptin, attenuated mesangial expansion, thickening of glomerular basement membrane and effacement of podocyte foot processes. Vehicle-treated db/db mice demonstrated higher renal expression of caspase-3 and decreased LAMP-1 and Bcl-2 as compared to db/+ mice. Weaker glomerular staining for beclin-1 and LAMP-1, and lower Vv of autophagosomes, autolysosomes and lysosomes in podocytes was revealed (all p<0.05). There was increase in Vv of podocyte autophagosomes, autolysosomes and lysosomes and areas of glomerular beclin-1 and LAMP-1 under empagliflozin and empagliflozin-linagliptin treatment (all p<0.05 vs. vehicle). Renal Bcl-2 was restored in actively treated animals (all p<0.05). Besides, LAMP-1 expression was enhanced in empagliflozin group (p=0.03). The protein content of caspase-3 was decreased significantly in the combination group only (p=0.008).
Conclusion: The data demonstrate that empagliflozin, either alone or in combination with linagliptin, restores autophagy and suppresses apoptosis in the kidney in a model of type 2 diabetes. These effects could contribute to preservation of glomerular structure and mitigation of podocyte injury. The data provide further explanation of renal protective effect of SGLT-2 and DPP-4 inhibitors in diabetes.
Supported by: RFMEFI62119X0023
Disclosure: A. Korbut: None.
137
Inhibition of lysine63 ubiquitination prevents in vitro and in vivo the progression of renal fibrosis in diabetic nephropathy
P. Pontrelli1, R. Menghini2, F. Conserva1, V. Casagrande2, M. Rossini1, A. Stasi1, C. Divella1, C. Cinefra1, S. Simone1, G. Pertosa1, A. Gallone3, M. Federici2, L. Gesualdo1;
1Department of Emergency and Organ Transplantation, University of Bari Aldo Moro, Bari, 2Department of Systems Medicine, University of Rome Tor Vergata, Rome, 3Dept. of Basic Medical Sciences, Neurosciences and Sense Organs, University of Bari Aldo Moro, Bari, Italy.
Background and aims: Our group previously demonstrated that in Diabetic Nephropathy (DN) an accumulation of lysine63 (K63)-ubiquitinated proteins at tubular level is involved in the progression of renal damage, in particular renal fibrosis (PMID: 27881486; 29806072; 31388051). Current treatments do not provide complete renoprotection and targeted therapies that completely prevent fibrosis or delay its progression are still lacking. Aim of the present study was to evaluate the renoprotective effect of specific drugs and their combinations, including an inhibitor of K63 ubiquitination (K63Ub) and/or an anti-hypertensive agent, in vitro and in vivo in a murine model of DN.
Materials and methods: All in vitro experiments were performed on immortalized Proximal Tubule Epithelial Cells (HK2) pre-incubated with a specific inhibitor of K63Ub and/or with the ACE-inhibitor Ramipril. All in vivo experiments were performed on streptozotocin (STZ)-treated DBA/2J mice. Accumulation of K63 ubiquitinated proteins along with α-sma expression, as indicator of epithelial-to-mesenchymal transition (EMT), were analyzed through immunofluorescence and western blotting. In mice, K63Ub was evaluated by IHC, while renal fibrosis was evaluated by Sirius red and Collagen III expression. Urinary albuminuria was measured by ELISA.
Results: Both the K63Ub inhibitor alone and the association of the specific K63Ub inhibitor with Ramipril were able to block hyperglycemia-induced EMT in HK2 cells by significantly reducing α-sma expression (p<0.05) when compared with ramipril alone. To demonstrate the efficacy of these drug alone and/or in combinations in reducing the progression of renal damage in vivo we firstly confirmed the increased accumulation of K63 Ub proteins in DBA/2J STZ-treated mice (p=0.01). Interestingly, increased K63Ub in diabetic mice was also associated to increased tubular-interstitial fibrosis (p<0.05). Treatment of STZ-mice with the specific K63Ub inhibitor was able to reduce both K63Ub proteins accumulation and renal fibrosis, evaluated on kidney samples by IHC against Collagen III (p≤0.05) and by Sirius Red staining (p≤0.05) when compared to both untreated mice and mice treated with Ramipril alone. However, treatment with the K63Ub inhibitor alone did not reduce albuminuria (STZ-mice: 561.29±390.56; STZ+K63Ubinhibitor: 724.25±690.89; p=n.s.), while the drug combination including the specific K63Ub inhibitor and Ramipril, significantly reduced both K63Ub-related fibrosis (p≤0.05) and albuminuria (p=0.01), demonstrating an addictive and synergic effect of these molecules when used in combination.
Conclusion: We proposed and patented a novel combination of drugs that ameliorates both fibrosis and proteinuria in a model of DN. Novel treatment regimens could represent an important goal for reducing the incidence of ESRD related to diabetes complication.
Supported by: H2020-BEAtDKD-IMI2-2015-05-02
Disclosure: P. Pontrelli: None.
138
Nox5 enhances the progression of diabetic kidney disease independent of renox (Nox4)
J.C. Jha1, S. Urner2, A. Dai1, M. Cooper1, K. Jandeleit-Dahm2;
1Monash University, Melbourne, Australia, 2German Diabetes Center, Leibniz Center for Diabetes Research, Düsseldorf, Germany.
Background and aims: Renal oxidative stress plays an important role in the pathogenesis of diabetic kidney disease (DKD). Evidences suggest pathogenic roles for pro-oxidant enzymes Nox4 and Nox5 in animal models of DKD. Nox5 is present in mans but not in mice/rats and it appears that Nox5 could be a main culprit in the context of human DKD. Therefore, we aimed to examine the roles of Nox5 versus Nox4 and their relative contribution to renal pathology in DKD.
Materials and methods: We examined the expression of Nox5 and Nox4 as well as their interaction and ROS production in human kidney biopsies. In vitro, certain human renal cells were knockdown for Nox4 and Nox5 and were exposed to high glucose. In vivo, we examined the effect of Nox5 in the absence of Nox4 expression in STZ- diabetic mouse model. We developed rabbit models of DKD and Nox5KO rabbits.
Results: Increased expression of Nox5 and enhanced level of ROS was seen in human diabetic kidney biopsies compared to non-diabetic kidney. Nox5 shows the highest upregulation in human renal cells exposed to high glucose in comparison to other Nox isoforms. Silencing of Nox5 attenuated high glucose induced increased expression of markers of fibrosis, inflammation and putative elements via reduction in ROS formation. Nox5 appears to be upstream of Nox4 and that Nox5 inhibition downregulates Nox4, but not vice versa. In vivo, cell specific expression of Nox5 in both Nox4 KO and GKT137831 (a renal Nox4 inhibitor) treated diabetic mice demonstrated a 30-40% increase in albuminuria, mesangial expansion, renal fibrosis and inflammation as well as enhanced ROS production in comparison to diabetic mice not expressing Nox5. In addition, both high fat feeding and alloxan induced diabetic rabbits showed increased renal Nox5 expression in association with increased renal injury along with upregulation of CTGF, fibronectin and MCP-1 as well as enhanced renal ROS production.
Conclusion: These findings provide evidence that Nox5 plays a superior pathogenic role in DKD in comparison to Nox4. Therefore, targeting Nox5 may represent a better approach to treat and prevent DKD in human.
Supported by: NHMRC
Disclosure: J.C. Jha: None.
OP 24 Glucagon and hormones beyond
139
Identification of a gut-derived LEAP2 fragment as a novel insulin secretagogue
C.A. Hagemann1,2, C. Zhang2, T. Jorsal1, K.T. Rigbolt2, M. Falkenhahn3, S. Theis3, M. Christensen1,4, T. Vilsbøll1,5, N. Vrang2, J. Jelsing2, F.K. Knop1,5;
1Center for Clinical Metabolic Research, Gentofte Hospital, Hellerup, Denmark, 2Gubra ApS, Hørsholm, Denmark, 3Sanofi-Aventis, Frankfurt, Germany, 4Department of Clinical Pharmacology, Bispebjerg Hospital, Bispebjerg, Denmark, 5Steno Diabetes Center Copenhagen, Gentofte, Denmark.
Background and aims: Roux-en-Y gastric bypass (RYGB) surgery often leads to rapid remission of type 2 diabetes along with large and sustained body weight reduction. Unknown peptides with anorexigenic and/or anti-diabetic effects may contribute to these beneficial effects. In the present study, liver-enriched antimicrobial peptide 2 (LEAP2) was identified as a novel putative anti-diabetic therapeutic target by analysing gene expression in human enteroendocrine cells sampled before and after RYGB.
Materials and methods: Twenty morbidly obese individuals underwent upper enteroscopy with gut mucosal biopsy retrieval three months before and after RYGB in addition to a perioperative gut biopsy. Enteroendocrine cells were immunohistochemically identified by chromogranin A, isolated by laser capture microdissection and processed using next-generation RNA sequencing. The distribution of LEAP2 mRNA and peptide expression in mucosal biopsies were investigated using in situ hybridization and immunohistochemistry. Finally, the effect of LEAP2 on glucose-stimulated insulin secretion (GSIS) was evaluated in isolated human pancreatic islets and during a graded glucose infusion in a double-blinded crossover study in healthy individuals.
Results: LEAP2 mRNA expression in enteroendocrine cells was significantly upregulated in obese individuals after RYGB. In situ hybridization revealed that LEAP2 mRNA was expressed in the epithelial lining, whereas immunohistochemistry demonstrated a distinct labelling of enteroendocrine cells in the gut mucosa. Interestingly, an endogenous LEAP2 fragment significantly increased GSIS in human pancreatic islets, but in the chosen dose, it did not affect insulin secretion during a graded glucose infusion in healthy individuals.
Conclusion: We conclude that LEAP2 is significantly upregulated in human enteroendocrine cells after RYGB and that an endogenous LEAP2 fragment increases GSIS in human pancreatic islets. This suggest that gut-derived LEAP2 may contribute to the beneficial metabolic effects of RYGB.
Clinical Trial Registration Number: NCT03093298
Supported by: Innovation Foundation Denmark, Sanofi, Gubra
Disclosure: C.A. Hagemann: Employment/Consultancy; Christoffer A Hagemann is employed as an industrial PhD student in a joint venture between Gentofte Hospital, University of Copenhagen and Gubra. Grants; Sanofi, Gubra, Innovation Foundation Denmark. Lecture/other fees; Gubra and Sanofi (Filip K Knop). Stock/Shareholding; Niels Vrang and Jacob Jelsing are owners of Gubra.
140
Regulation of substrate choice contributes to the regulation of glucagon secretion from alpha cells in response to glucose
S.L. Armour1, M.V. Chibalina2, B. Davies3, P. Rorsman2, J.G. Knudsen1;
1Department of Biology, Univiersity of Copenhagen, Copenhagen, Denmark, 2Radcliffe department of Medicine, OCDEM, Oxford, UK, 3Wellcome centre for human genetics, University of Oxford, Oxford, UK.
Background and aims: Type 2 diabetes is a metabolic disorder resulting in dysregulation of both insulin and glucagon secretion. Whilst the metabolic control of insulin secretion from pancreatic β-cells is fairly well established, the regulation of glucagon secretion from α-cells remains debated. α-cells rely on fatty acid oxidation for ATP production when glucose is low, and oxidise only 15-20% of utilised glucose irrespective of extracellular concentrations. β-oxidation in α-cells is decreased in response to increased glucose concentrations. Unlike β-cells, α-cells express high levels of pyruvate dehydrogenase (PDH) kinase 4 (PDK4). PDK4 acts by phosphorylating PDH and this favours β-oxidation over glucose metabolism. Here we investigate the role of PDK4 and substrate choice in the regulation of glucagon secretion.
Materials and methods: Islets were isolated from wild type C57BL/6J (WT), α-ell specific PDK4 overexpressing mice (αPDK4KI) or littermate Controls carrying either Pdk4, Cre or neither inserts (Con). Live-cell imaging was used to measure α-cell specific ATP/ADP ratios in intact islets using viral infection with the fluorescent sensor PercevalHR under the control of the preproglucagon promoter. Mice expressing the calcium probe Gcamp3 specifically in α-cells was used to study calcium oscillations in α-cells from intact islets. Lastly, glucagon secretion was investigated. All experiments were performed in a physiological Krebs ringer buffer with the addition of glucose and/or a physiological relevant mix of fatty acids (FA) corresponding to the circulating concentrations of lineoleate, palmitate and oleate in WT mice.
Results: Increasing glucose concentration from 1 to 5mM glucose in the presence of 0.35mM FA in WT islets reduced intracellular ATP/ADP in α-cells by 12.7% (100±4.21% vs 87.29±4.09%; p<0.0001). This was associated with reduced frequency of calcium oscillations (1.99±0.19 vs 1.09±0.21 spikes/min; p= 0.0002) and glucagon secretion (0.41±0.074 vs 0.17±0.026% content; p=0.0017). When islets were exposed to FA, calcium oscillations increased by 27% relative to what was observed in the presence of glucose alone (1.56±0.21 vs 1.98±0.19 spikes/min; p= 0.0247). This effect did not correlate with an increase in glucagon secretion. To understand if entry of pyruvate into the TCA cycle was required for the observed effect of glucose on α-cell ATP production, we investigated dynamic changes in the ATP/ADP in αPDK4KI mice. Con islets responded in a similar way to WT islets, whereby increasing glucose from 1 mM to 5 mM in the presence of FA reduced intracellular ATP/ADP by 14.7% (100±4.21% vs 85.31±4.74%; p<0.0047). No such decrease was observed in α-cells from αPDK4KI islets (100±2.60% vs 97.34±3.97%; p=0.98). In addition, glucagon secretion was reduced by 30% when glucose was elevated from 1 to 5mM glucose in Con islets (1.52±0.47 vs 1.01±0.22% content; p=0.034) but not in αPDK4KI mice (1.60±0.50 vs 1.43±0.58 % content; p=0.092).
Conclusion: These data suggest that α-cells generate much of their ATP under hypoglycaemic conditions by β-oxidation of FA and that increasing glucose inhibits ATP production by inhibiting endogenous fatty acid oxidation. This highlights PDK4 and PDH as key regulators of glucagon secretion through regulation of substrate choice in the α-cell.
Supported by: Novo Nordisk Fonden
Disclosure: S.L. Armour: None.
141
12-hour glucagon infusion stimulates adipocyte lipolysis and inflammation in vivo in humans
X. Chen, L. Norton, R. DeFronzo, D. Tripathy;
The University of Texas Health Science Center at San Antonio, San Antonio, USA.
Background and aims: Combined glucagon and GLP-1 agonists are being proposed as new therapeutic agents for the treatment of obesity and diabetes. However, the long-term effect of hyperglucagonemia on adipose tissue metabolism and glucose homeostasis in vivo in humans is unclear. The aim of the present study was to evaluate the effect of 12-hour glucagon infusion on hepatic glucose production (HGP) and adipocyte metabolism in healthy individuals.
Materials and methods: Eight subjects with normal glucose tolerance (NGT, 5M/3F, age=35±5, BMI = 24±1) participated in 2-hour (75 gram) OGTT. Subsequently, subjects returned for visit 2 when they received a 12-hour (6 PM to 6 AM) glucagon infusion (6 ng/kg/min) with 3-3H-glucose and 14-C glycerol infusion followed by subcutaneous adipose tissue biopsy at 6 AM. Within 4-8 weeks of visit 2, subjects returned for a repeat study with infusion (6 PM to 6 AM) of normal saline.
Results: Plasma glucagon increased from 57±3 to 219±21 pg/ml. Plasma glucose increased transiently after the start of glucagon and declined to baseline levels at 6 AM. Plasma insulin levels increased significantly following glucagon compared to normal saline (20±7 vs 8±3 mU/L, p<0.05) and remained elevated at 6 AM. Basal HGP (3.2±0.1 vs 2.9±0.1 mg/kg/min, p<0.01) and fasting plasma FFA concentrations (0.70±0.1 vs 0.39±0.1 mM, p<0.01) were increased after 12-hour glucagon infusion despite increased plasma insulin levels, indicating severe hepatic and adipocyte insulin resistance. Lipolysis-related genes expression in adipose tissue biopsy were upregulated following 12-hour glucagon infusion (ATGL, 1.14±0.07 vs 0.77±0.03; HSL, 1.17±0.03 vs 0.9±0.13; MGL, 1.2±0.04 vs 0.82±0.2, all p<0.05). Plasma concentration of inflammatory markers were also increased after 12-hour glucagon infusion compared to normal saline (IL-1β, 0.65±0.05 vs 0.49±0.05 pg/mL; TNF-α, 2.03±0.23 vs 1.75±0.17 pg/mL, both p<0.05).
Conclusion: Collectively, these findings indicate that prolonged (12-hour) physiologic hyperglucagonemia causes marked hepatic and adipocyte insulin resistances, stimulates lipolysis and increases plasma FFA, and induces adipocyte and systemic inflammation.
Disclosure: X. Chen: None.
142
Hepatic steatosis and glucagon resistance develope in parallel resulting in hyperglucagonaemia and hyperaminoacidaemia
M. Winther-Sørensen1,2, K.D. Galsgaard1,2, A. Santos3, J. Pedersen1, A.S. Hassing2, M. Dall2, J.T. Treebak2, S.A.S. Kjeldsen1,2, F.K. Knop4, M.P. Werge5, P.L. Eriksen6, H. Vilstrup6, L. Gluud5, J.J. Holst1,2, N.J. Wewer Albrechtsen1,3;
1Department of Biomedical Sciences, University of Copenhagen, Copenhagen, 2Center for Basic Metabolic Research, University of Copenhagen, Copenhagen, 3Center for Protein Research, University of Copenhagen, Copenhagen, 4Center for Clinical Metabolic Research, University of Copenhagen, Hellerup, 5Gastrounit, University of Copenhagen, Hvidovre, 6Department of Hepatology and Gastroenterology, Aarhus University Hospital, Aarhus, Denmark.
Background and aims: Glucagon regulates hepatic glucose production, and increased glucagon signalling contributes to type 2 diabetes. In the liver-α cell axis, plasma levels of amino acids (AA) are regulated by glucagon-dependent ureagenesis, while AA stimulate glucagon secretion from the α cells. We hypothesised that non-alcoholic fatty liver disease (NAFLD) may impair hepatic glucagon actions, resulting in decreased ureagenesis and hyperaminoacidaemia and subsequent hyperglucagonaemia.
Materials and methods: We measured plasma concentrations of alanine and glucagon in 9 healthy controls and 35 patients with biopsy-verified NAFLD (steatosis: n=18; non-alcoholic steatohepatitis (NASH): n=17). We also evaluated urea formation in primary hepatocytes from ob/ob mice (n=3) and AA clearance in vivo in mice with hepatic steatosis (n=9-12), mice treated with a glucagon receptor antagonist (GRA, 25-2648, 100 mg/kg, n=14), and transgenic mice with 95% reduction in α cells (n=15). Finally, we performed RNA sequencing on livers from mice with hepatic steatosis (n=3) and glucagon receptor knock-out (Gcgr-/-) mice (n=5). Results are presented as mean±SEM.
Results: The glucagon-alanine index (the product of fasting levels of glucagon and alanine) was increased in patients with steatosis (3.8±0.5 pmol/l×mmol/l, p=0.02) and NASH (4.1±0.3 pmol/l×pmol/l, p=0.001) compared to controls (1.6±0.3 pmol/l×mmol/l, one-way ANOVA). Cultured ob/ob hepatocytes produced less urea upon stimulation with mixed AA compared to control hepatocytes (AUC0-120 min: 35.5±4.0 vs. 51.5±2.8 nmol/μg protein×min, one-way ANOVA, p=0.04). Upon i.p. administration of mixed AA, AA clearance (reflected by incremental AUC (iAUC)), tended to be lower in mice with hepatic steatosis (iAUC0-20 min: 6.8±0.7 vs. 5.5±0.3 min×mmol/l, unpaired t-test, p=0.1). AA clearance was reduced in GRA vs. vehicle-treated mice (iAUC0-20 min: 33.1±2.8 vs. 27.2±2.1 min×mmol/l, one-way ANOVA, p=0.1) concomitantly with reduced production of urea (iAUC0-20 min: 25.3±3.7 vs. 39.8±3.9 min×mmol/l, one-way ANOVA, p=0.04). Likewise, mice lacking endogenous glucagon (loss of α cells) had reduced AA clearance (iAUC0-20 min: 46.9±4.2 vs. 39.4±5.0 min×mmol/l, one-way ANOVA, p=0.1) and lower plasma levels of urea (iAUC0-20 min: 23.6±5.4 vs. 37.5±2.5 min×mmol/l, one-way ANOVA, p=0.04). Transcriptomic comparison of mice with hepatic lipid accumulation and Gcgr-/- mice revealed an overlap of several down-regulated genes responsible for AA catabolism (Cps1, Slc7a2, and Slc38a2) (FDR-corrected multiple t-tests, p<0.05 for all).
Conclusion: Our study suggests that hepatic steatosis and glucagon resistance develop in parallel resulting in hyperglucagonaemia and hyperaminoacidaemia. Disruption of the liver-α cell axis leading to hyperglucagonaemia may therefore link NAFLD to type 2 diabetes.
Supported by: NNF Tandem Program, NNF Project Endocrinology and Metabolism, NNF Excellence Emerging Investigator
Disclosure: M. Winther-Sørensen: None.
143
Inappropriate glucagon response is associated with early-postprandial glucose excursions in Japanese patients with type 1 diabetes
A. Ito, I. Horie, N. Abiru, A. Kawakami;
Endocrinology and Metabolism, Nagasaki University Hospital, Nagasaki, Japan.
Background and aims: Some of the patients with type 1 diabetes (T1D) develop severe glycemic variability leading to brittle diabetes which is associated with significant mortality and poor quality of life. The variability is believed to be tied with the duration of diabetes resulting in a complete depletion of endogenous insulin secretion. Recent studies indicates that α-cells might be potentially effect to the instability of glucose, however, little is known about the influence of α-cell on postprandial hyperglycemia. The study aimed to evaluate whether the glucagon response after meals could influence the postprandial glucose levels in the patients with T1D.
Materials and methods: We enrolled 34 patients with T1D, and 23 patients with type 2 diabetes (T2D) as a control. All participants underwent to a liquid a mixed meal tolerance test (MMTT) after an overnight fasting. Blood samples were drawn measuring plasma glucose, C-peptide and glucagon before and 30, 60, and 120min after the meal. T1D patients were treated with two-thirds of the dose of bolus insulin calculated using their insulin-to-carbohydrate ratio for the meal while all participants received basal insulin as per usual.
Results: Inappropriate glucagon secretions with a paradoxical increase after meals were observed in both T1D and T2D and glucagon levels elevated peaking 30min during MMTT. The glucagon levels (pg/mL) at 30min in T1D were significantly lower than those in T2D (48±32 vs. 65±45, p=0.015). In T1D, the changes in glucose levels from fasting to 30min were positively correlated with those in glucagon (ρ=0.4, p=0.019), but not with those in C-peptide. By contrast, the changes in glucose levels from fasting to 120min were negatively correlated with those in C-peptide, but not with those in glucagon. There were no significant differences in the glucagon concentrations at each time-point between the three respective divisions; sex (female or male), fasting C-peptide levels (<0.1 or ≥0.1 ng/mL), and duration from clinical onset of T1D (<5 or ≥5 years).
Conclusion: The early-phase postprandial hyperglucagonemia was observed in T1D and associated with postprandial glucose excursions, regardless of residual β-cell function and diabetes duration.
Clinical Trial Registration Number: UMIN-CTR000020156
Disclosure: A. Ito: None.
144
Neprilysin inhibition increases plasma glucagon concentrations in humans with possible implications for hepatic amino acid metabolism
S.A.S. Kjeldsen1, S. Zraika2, S. Mongovin3, L.H. Hansen4, D. Terzic5, P.D. Mark5, P. Plomgaard5, J.P. Gøtze5, The Liver-Alpha-Cell Axis Group, J.E. Hunt1, M.M. Rosenkilde1, G.H. Goossens6, E.E. Blaak6, J.J. Holst1, N.J. Wewer Albrechtsen1;
1Department of Biomedical Sciences, Copenhagen University, Copenhagen, Denmark, 2Division of Metabolism, Endocrinology and Nutrition, University of Washington, Seattle, USA, 3Medical Research Service of the Veterans Affairs Puget Sound Health Care Center, University of Washington, Seattle, USA, 4Copenhagen University, Copenhagen, Denmark, 5Department of Clinical Biochemistry, Copenhagen University, Copenhagen, Denmark, 6Department of Human Biology, Maastricht University, Maastricht, Netherlands.
Background and aims: Glucagon (gcg) regulates hepatic glucose and amino acid (AA) metabolism, and increased plasma gcg levels (hyperglucagonemia) contribute to diabetic hyperglycemia. Studies in pigs have suggested neprilysin (NEP), a metalloprotease, to metabolize exogenous gcg. We hypothesized that NEP contributes to gcg degradation.
Materials and methods: Healthy males were investigated during a mixed meal after a single dose of a NEP-inhibitor/angiotensin II receptor blocker (194 mg sacubitril / 206 mg valsartan), a DPP-4 inhibitor (sitagliptin, 2x100mg), these combined, or the meal alone (n=9 or 10). Long-term effects of sacubitril/valsartan were investigated in obese individuals (n=7) receiving sacubitril/valsartan for 8 weeks (194 mg sacubitril / 206 mg valsartan per day). To test whether NEP degrades gcg and diminishes its signaling, we performed mass-spectrometry and assessed gcg degradation products in cells transfected with the gcg receptor (gcgr). Finally, we investigated different mouse strains to evaluate mechanisms responsible for the changes in amino acid metabolism upon NEP inhibition (sacubitril, 0.7 nmol/g).
Results: In healthy males, sacubitril/valsartan increased postprandial gcg levels 2.7-fold (iAUC0-240 min, paired t-test, P=0.005) and this was not altered by the addition of sitagliptin (iAUC0-240 min, unpaired t-test, P=0.28). Sacubitril/valsartan lowered postprandial AA levels (tAUC0-240 min, paired t-test, P=0.01). In obese individuals, 8 weeks sacubitril/valsartan treatment increased fasting gcg levels (paired t-test, P=0.02) with no difference in fasting AA levels (paired t-test, P=0.63). NEP induced gcg degradation identified by mass spectrometry showed that NEP cleaves gcg in the C-terminus and that the resulting gcg fragments were unable to activate the gcgr. In non-sedated C57BL/6JRj female mice (n=9) NEP inhibition increased gcg levels (mixed effects analysis, t=10 min, P=0.02) and tended to increase AA disappearance (mixed effects analysis, t=15 min, P=0.08) and urea formation (iAUC0-180 min, unpaired t-test, P=0.08) after an AA challenge. A gcgr antagonist (Novo Nordisk; 25-2648, 100 mg/kg) abolished the increase in urea formation observed with sacubitril alone (iAUC0-180 min, unpaired t-test, P=0.01). Sacubitril increased exogenous gcg levels 1.9-fold (iAUC0-60 min, unpaired t-test, P<0.002, n=10) after a single injection of gcg (96 ng/g). In NEP deficient mice (n=10), fasting plasma urea (unpaired t-test, P=0.003) but not fasting gcg levels (unpaired t-test, P=0.57) were increased compared to controls.
Conclusion: NEP degrades gcg and thus inhibitors of NEP may result in hyperglucagonemia with potential metabolic perturbations on hepatic AA metabolism.
Clinical Trial Registration Number: 31074791 and 27542885
Supported by: Novo Nordisk Foundation
Disclosure: S.A.S. Kjeldsen: None.
OP 25 Incretin based therapies
145
Six-day subcutaneous GIP infusion increases glycaemic time in range in patients with type 1 diabetes
S.M.N. Heimbürger1,2, B. Hoe2,3, C.N. Nielsen2, N.C. Bergmann2, B. Hartmann4,4, J.J. Holst4,3, J. Størling5,6, T. Vilsbøll5,2, T.F. Dejgaard2, M.B. Christensen7,8, F.K. Knop2,5;
1Type 1 Diabetes, Steno Diabetes Center Copenhagen, Gentofte, 2Gentofte Hospital, University of Copenhagen, Hellerup, 3Department of Clinical Medicine, Faculty of Health and Medical Sciences, University of Copenhagen, Copenhagen, 4University of Copenhagen, Copenhagen, 5Steno Diabetes Center Copenhagen, Gentofte, 6Department of Biomedical Sciences, Faculty of Health and Medical Sciences, University of Copenhagen, Copenhagen, 7Gentofte Hospital, University of Copenhagen, Gentofte, 8Department of Clinical Pharmacology, Bispebjerg Hospital, University of Copenhagen, Copenhagen, Denmark.
Background and aims: We have previously reported a glucagonotropic effect of glucose-dependent insulinotropic polypeptide (GIP) during insulin-induced hypoglycaemia in patients with type 1 diabetes (T1D). This prompted us to investigate the effect of a 6-day s.c. GIP infusion on glycaemic levels in patients with T1D
Materials and methods: In a randomised, placebo-controlled, double-blinded, crossover study, 20 men with T1D (age [mean ± SD] 26 ± 8 years, BMI 23.8 ± 1.8 kg/m2, HbA1c 51 ± 10 mmol/mol), diabetes duration 9.1 ± 3.9 years, plasma C-peptide < 200 pmol/l, underwent double-blinded continuous glucose monitoring (CGM) and 2 × 6 days with continuous s.c. GIP (6 pmol/kg/min) and placebo (saline) infusion, respectively, with an interposed 7-day washout period.
Results: GIP significantly increased daytime (06:00-23:59) time in range (3.9-7.8 mmol/l) by [mean ± SEM] 160 ± 74 min/day (p = 0.04). There were no significant differences in daytime time below range (<3.9 mmol/l, p = 0.8), time above range (>10 mmol/l, p = 0.19) (Figure), mean glucose or hypoglycaemic events (assessed by CGM). Compared to placebo, GIP increased hepatic fat content by 12.6 ± 4.2 percentage points (assessed by FibroScan®) (p = 0.007) , decreased 24-hour systolic and diastolic blood pressure by 5.8 ± 2.6 (p = 0.04) and 3.1 ± 1.3 mmHg (p = 0.03), respectively, and increased heart rate by 4.4 ± 2.0 beats per minute (p = 0.04) (Figure).
Conclusion: Compared to placebo, a 6-day continuous s.c. GIP infusion in patients with T1D increased glucose daytime time in range, hepatic fat content and heart rate, while decreasing blood pressure.

Clinical Trial Registration Number: NCT03734718
Supported by: The Leona M. and Harry B. Helmsley Charitable Trust; #2018PG-T1D037
Disclosure: S.M.N. Heimbürger: Lecture/other fees; AstraZeneca.
146
Effects of tirzepatide, a novel dual GIP and GLP-1 receptor agonist, on metabolic profile in patients with type 2 diabetes
V. Pirro1, J.A. Willency1, J.M. Wilson1, K.D. Roth1, Y. Lin1, K.A.L. Collins1, G. Ruotolo1, A. Haupt1, C.B. Newgard2, K.L. Duffin1;
1Eli Lilly and Company, Indianapolis, 2Duke Molecular Physiology Institute, Durham, USA.
Background and aims: In a Phase 2 trial, tirzepatide (TZP) dose-dependently reduced HbA1c, body weight, and improved markers of insulin sensitivity in patients with type 2 diabetes. Branched chain amino acids (BCAA) are emerging biomarkers of obesity and insulin resistant state suggested to promote the accumulation of hepatic and muscle lipids and cardiac hypertrophy. To understand changes in fasting BCAAs levels and related metabolites with TZP, metabolomics profiling was conducted.
Materials and methods: Patients (N=316) were randomised to receive weekly subcutaneous TZP (1, 5, 10, 15 mg), dulaglutide 1.5 mg (DU), or placebo for 26 weeks. Fasted serum collected at baseline, 4, 12 and 26 weeks was extracted, diluted, and analysed by targeted metabolomics using a Sciex Triple Quadrupole 6500 mass spectrometer. Targeted metabolites were separated over 30 minutes by HILIC chromatography and detected by multiple reaction monitoring. Data were analysed using a mixed-model repeated measure statistical approach.
Results: At 26 weeks, a total of 45 metabolites, including acylcarnitines, amino acids and related metabolites, were significantly modulated by TZP 15 mg treatment compared to baseline, while 125 metabolites remained largely unchanged. TZP 15 mg also caused a temporary increase in acetylcarnitine (adjusted p=0.04 at week 12), but levels returned to baseline at 26 weeks. BCAAs, isovalerylcarnitine (a byproduct of leucine catabolism), glutamate, glycine, alanine and 2-hydroxybutarate (2-HB) levels were affected by TZP dose-dependently (Table). Leucine, isoleucine and valine significantly reduced from baseline with TZP 15 mg compared with placebo (fold change of -1.27, -1.23, and -1.16; adjusted p<0.01) and compared with DU (fold change of -1.22, -1.21, and -1.16; adjusted p<0.05). BCAA levels positively correlated with HOMA-IR for isoleucine (Spearman Correlation coefficient of 0.58; p=0.0011), leucine (0.49; p=0.009) and valine (0.46; p=0.015).
Conclusion: Our data reinforce previous observations that a dual GIP and GLP-1 receptor agonist has a greater impact on insulin sensitivity than a selective GLP-1 receptor agonist, thus helping to explain the superior effect on overall glycaemia. Future studies are needed to better understand the impact of BCAAs and related metabolites on cardiometabolic diseases and how TZP-driven changes compare to other forms of weight loss intervention such as bariatric surgery.

Clinical Trial Registration Number: NCT03131687
Supported by: Eli Lilly and Company
Disclosure: V. Pirro: Employment/Consultancy; Eli Lilly and Company. Stock/Shareholding; Eli Lilly and Company.
147
Reduction of cardiovascular events by GLP-1 receptor agonists is explained by HbA1c reduction
M. Roosimaa1,2, A. Jõgis2;
1Endocrinology unit, North Estonia Medical Centre Foundation, Tallinn, 2University of Tartu, Tartu, Estonia.
Background and aims: Since FDA issued guidance for the assessment of cardiovascular (CV) safety of new antidiabetic medications, multiple cardiovascular outcome trials (CVOT) with sodium-glucose transport protein 2 inhibitors (SGLT2i) and glucagon-like peptide-1 receptor agonists (GLP-1RA) have provided an unexpected reduction in CV risk. Both medication classes have reduced HbA1c level compared to the use of placebo, differentiating them from trials with other agents such as dipeptidyl peptidase-4 inhibitors (DPP4i) where glycemic equipoise and no risk reduction was observed. Even though in DCCT and UKPDS trials better glycemic control did result in a lower rate of CV complications after prolonged follow-up, this finding has not been confirmed in ADVANCE, ACCORD and VADT trials where older patients with already established CV risk factors, a population more similar to patients in current CVOTs, was included. Therefore, the importance of glycemic control as a mediator of risk reduction in CVOTs has been questioned. While there is convincing data that better glycemic control is not mediating risk reduction with SGLT2i, it is not confirmed nor rebutted for GLP-1RA. This meta-analysis tries to assess whether better glycemic control can explain decreased CV risk seen with GLP-1RA.
Materials and methods: Absolute risk of primary outcome, HbA1c and number of patients at risk was extracted for both GLP-1RA and placebo groups at multiple time points from each published GLP-1RA trial (ELIXA, LEADER, SUSTAIN-6, PIONEER 6, Harmony Outcomes, EXSCEL, REWIND). The relationship between risk and glycemic control was assessed by two methods: 1) Cumulative glycemic exposure was calculated separately for placebo and GLP-1RA groups for each trial and correlated with observed absolute CV risk. 2) Differential glycemic exposure between GLP-1RA and placebo group was calculated for each trial and correlated with a published hazard ratio (HR).
Results: There was a clear linear correlation between increasing HbA1c exposure and CV risk both with GLP-1RA and placebo. Placebo group appeared to have a lower absolute risk with the same glycemic exposure, but this difference was lost after correction for patient age. The difference in glycemic exposure between GLP-1RA and placebo group had a strong correlation (R2=0,75) with reported hazard ratio and 95% confidence intervals of HR-s from all trials included risk reduction expected from HbA1c difference. Lowering of HbA1c by 1% decreased CV risk by 30% and this relationship was consistent within placebo groups, GLP-1RA groups and between groups.
Conclusion: The reduction of CV events in CVOTs with GLP-1RA can be explained by a reduction in HbA1c.

Disclosure: M. Roosimaa: Lecture/other fees; Sanofi, Novo Nordisk, Boehringer Ingelheim, AstraZeneca.
148
Exploring potential mediators of the cardiovascular benefit of dulaglutide in REWIND
H. Gerstein1, H. Colhoun2, M. Riddle3, K. Branch4, M. Konig5, C. Atisso5, M. Lakshmanan5, R. Mody5, C. Hasenour5;
1McMaster University, Hamilton, Canada, 2University of Edinburgh, Edinburgh, UK, 3Oregon Health & Science University, Portland, USA, 4University of Washington, Seattle, USA, 5Eli Lilly and Company, Indianapolis, USA.
Background and aims: The REWIND trial showed that relative to placebo (PL), once weekly dulaglutide (DU) 1.5 mg reduced the incidence of a major adverse cardiovascular event (MACE-3; nonfatal myocardial infarction, nonfatal stroke, or cardiovascular (CV) death) in patients with type 2 diabetes with and without established cardiovascular (CV) disease (hazard ratio [HR] 0.88, 95% CI [0.79, 0.99]; p=0.026). DU also significantly reduced A1C, body weight (BW), and systolic blood pressure (SBP). In this post-hoc assessment, a mediation analysis was used to estimate the degree to which the effect of DU on these risk factors could statistically account for its effect on MACE-3.
Materials and methods: Data were analysed from 9,901 patients who had 1,257 first MACE-3 over 5.4 median years of observation. Those risk factors for which the updated mean on follow-up was significantly related to cardiovascular events were added to a separate Cox model that included DU allocation, the baseline value of the measurement and the updated mean of the variable as time dependent covariates.
Results: Only A1C satisfied this condition (Table), suggesting that BW and SBP did not mediate the effect of DU on MACE in this study population. The effect size of DU on the MACE outcome was attenuated by 36.1% after accounting for its effect on A1C (Table).
Conclusion: The results suggest most of the CV benefits of dulaglutide on MACE is not attributable to the A1C, BW, or SBP-lowering effects of dulaglutide.

Clinical Trial Registration Number: NCT01394952
Disclosure: H. Gerstein: Employment/Consultancy; Abbott, AstraZeneca, Boehringer Ingelheim, Eli Lilly and Company, Merck, Novo Nordisk, Janssen, Sanofi, Kowa. Grants; Eli Lilly and Company, AstraZeneca, Merck, Novo Nordisk, Sanofi. Honorarium; AstraZeneca, Boehringer Ingelheim, Eli Lilly and Company, Novo Nordisk, Sanofi.
149
Cardiovascular (CV) and hypoglycaemia outcomes across age groups in people with type 2 diabetes in the CAROLINA trial
M.A. Espeland1, R.E. Pratley2, J. Rosenstock3,4, T. Kadowaki5,6, Y. Seino7,8, B. Zinman9, N. Marx10, D.K. McGuire4, K.R. Andersen11, M. Mattheus12, A. Keller12, O.E. Johansen11, on behalf of the CAROLINA investigators;
1Department of Biostatistics and Data Science, Wake Forest School of Medicine, Winston-Salem, USA, 2Translational Research Institute for Metabolism and Diabetes, Orlando, USA, 3Dallas Diabetes Research Center at Medical City, Dallas, USA, 4University of Texas Southwestern Medical Center, Dallas, USA, 5Department of Prevention of Diabetes and Lifestyle-Related Diseases, Graduate School of Medicine, University of Tokyo, Tokyo, Japan, 6Department of Metabolism and Nutrition, Mizonokuchi Hospital, Faculty of Medicine, Teikyo University, Kanagawa, Japan, 7Kansai Electric Power Medical Research Institute, Kobe, Japan, 8Kansai Electric Power Hospital, Osaka, Japan, 9Lunenfeld-Tanenbaum Research Institute, Mount Sinai Hospital, University of Toronto, Toronto, Canada, 10Department of Internal Medicine I, University Hospital Aachen, RWTH Aachen University, Aachen, Germany, 11Boehringer Ingelheim Norway KS, Asker, Norway, 12Boehringer Ingelheim Pharma GmbH & Co. KG, Ingelheim, Germany.
Background and aims: Older people with T2D have a high prevalence of comorbidities, frailty and polypharmacy. We investigated the effects of linagliptin 5 mg versus glimepiride 1-4 mg once daily across age groups in the CARdiovascular Outcome Study of LINAgliptin Versus Glimepiride in T2D (CAROLINA).
Materials and methods: CAROLINA recruited adults with relatively early T2D, HbA1c 6.5-8.5%, and elevated CV risk. Its primary outcome was CV death, non-fatal myocardial infarction, or non-fatal stroke (3P-MACE), with secondary outcomes including mortality and changes from baseline in HbA1c, weight and hypoglycaemia.
Results: Of 6033 patients (median age 64 [range 36-85]) years, 846 (14.0%) were ≥75 years. During median follow-up of 6.3 years, CV and mortality outcome rates did not differ between treatment groups, overall and across age categories (interaction p-values >0.05). After some initial differences, there was no meaningful difference in HbA1c between linagliptin vs glimepiride, overall and across age groups, but hypoglycaemia rates (Figure) were significantly lower and weight losses were significantly greater with linagliptin vs glimepiride, regardless of age group.
Conclusion: Results for CV and mortality outcomes were consistent across age subgroups, but linagliptin has a modest benefit in weight and a significantly lower hypoglycaemia burden than glimepiride, which are important safety considerations when selecting therapy for the elderly.

Clinical Trial Registration Number: NCT01243424
Supported by: Boehringer Ingelheim & Eli Lilly and Company Diabetes Alliance
Disclosure: M.A. Espeland: Employment/Consultancy; Boehringer Ingelheim.
150
Glucagon-like peptide-1 receptor agonists reduce cerebral and cardiovascular events: real world analysis using the National Database of Japan
M. Koshizaka1, R. Ishibashi2, T. Ishikawa3, K. Goda4, J. Sato4, M. Kitsuregawa4, K. Yokote5, N. Mitsutake3;
1Department of Diabetes, Metabolism and Endocrinology, Chiba University Hospital, Chiba, 2Department of Endocrinology and Metabolism, Kimitsu Central Hospital, Kisarazu, 3Institute for Health Economics and Policy, Tokyo, 4Institute of Industrial Science, The University of Tokyo, Tokyo, 5Department of Endocrinology, Hematology, and Gerontology, Chiba University Graduate School of Medicine, Chiba, Japan.
Background and aims: Although several clinical trials have shown the pleiotropic effects of glucagon-like peptide-1 receptor agonists (GLP-1RAs), similar evidence for Asian patients in real medical settings is limited. Using the National Database of Health Insurance Claims and Specific Health Checkups of Japan, we compared the effect of GLP-1RAs on cerebral and cardiovascular events with that of other diabetes drugs.
Materials and methods: The type 2 diabetes (T2D) patients who were prescribed GLP-1RAs from 2011 to 2014 were included in the GLP-1RA group (group=Positive), and those prescribed other diabetes drugs were included in the control group (group=Negative).The outcome was the onset of cerebrovascular events (stroke, cerebral bleeding) or cardiovascular events (acute myocardial infarction, angina, heart failure) that continued for >3 months. Patient history included age, sex, duration of diabetes treatment, use of drugs at the start of treatment (other antidiabetic, antihypertensive, lipid-lowering, antiplatelet, and anticoagulant drugs), and cerebrovascular, cardiovascular and diabetes-related complications. These were used as explanatory variables in the logistic regression analysis. Propensity score matching was performed using nearest neighbor matching without replacement. Caliper was defined as standard deviation of propensity score * 0.25. Matching was done in order of propensity score close to median. The period from the prescription of new medication to the outcome was calculated and analyzed using the Cox proportional hazard model.
Results: Among 9,180,887 T2D patients, 34,399 and 46,326 patients in group=Positive reported cardiovascular and cerebrovascular events, respectively. In group=Negative, 877,523 and 742,776 patients reported cerebrovascular and cardiovascular events, respectively. After propensity score matching, 38,424 and 29,370 patients from both groups were analyzed for cerebrovascular and cardiovascular events, respectively. There were 2,248 (5.9 %) and 2,559 (6.7 %) cerebrovascular events were reported in group=Positive and Negative, respectively (HR 0.76, 95% CI 0.72-0.80, P < 0.0001), moreover 3,931 (13.4 %) and 4,024 (13.7 %) cardiovascular events reported in groups=Positive and Negative, respectively (HR 0.83, 95% CI 0.79-0.87, P < 0.0001, Figure).
Conclusion: Japanese patients treated with GLP-1RAs had significantly fewer cerebral and cardiovascular events than those not treated with GLP-1RAs.

Disclosure: M. Koshizaka: None.
OP 26 Unusual forms of diabetes
151
Young-onset type 2 diabetes in White Caucasians and African Americans in the USA: multi-morbidity trend at diagnosis and atherosclerotic cardiovascular disease risk
S. Paul, D. Koye, O. Montvida;
University of Melbourne, Melbourne, Australia.
Background and aims: The multi-morbidity at Type 2 Diabetes (T2DM) diagnosis and long-term Atherosclerotic Cardiovascular Disease (ASCVD) risk in young-onset T2DM among White Caucasian (WC) and African American (AA) are not well studied. The aims were to evaluate the temporal patterns of multi-morbidity at diagnosis and ASCVD risk by age groups in WC and AA.
Materials and methods: Using US diabetes population representative Centricity Electronic Medical Records, 505,336 WC and 101,104 AA incident T2DM patients within age groups 18-39 years, 40-49 years, 50-59 years and 60-70 years from 2000 to 2018 were identified, with mean 5 years follow-up. The prevalence trend of multi-morbidity (at least 2 of: ASCVD, micro-vascular disease, cancer, chronic kidney disease, BMI ≥ 35 kg/m2 ) at diagnosis was explored. Among those without ASCVD at diagnosis, the risk of ASCVD and MACE-3 (myocardial infarction, heart failure or stroke) were compared between AA and WC by age groups at diagnosis adjusting for appropriate confounders including age, sex, smoking status, BMI, non-macrovascular comorbidities, and stratifying by insulin use.
Results: The multi-morbidity prevalence trend has consistently increased from 11% to 20% over last 17 years in all age groups, with no difference between ethnicity. AA had significantly higher mean HbA1c (8.2%), BMI (39.5 kg/m2, 64% Grade 2+ Obese) in the youngest age group compared to older groups, while WC had similar risk factor distribution across all age groups at T2DM diagnosis. AA had higher systolic blood pressure (SBP) across all age groups compared to WC, overall SBP > 130 mmHg in AA / WC: 55% / 49%, but similar lipid distribution between ethnicity across age groups.Compared to WC, adjusted HR (95% CI) of ASCVD for AA in 18-39 years, 40-49 years, 50-59 years and 60-70 years groups were 1.17 (1.02, 1.34), 1.04 (0.96, 1.12), 0.96 (0.91, 1.00), 0.94 (0.90, 1.00) respectively. However, AA had significantly higher adjusted MACE-3 risk by 9-55% across all age groups.
Conclusion: The multi-morbidity has been significantly increasing among White Caucasians and African Americans across all age groups at T2DM diagnosis. While among those with T2DM diagnosed at 40+ years age there was no difference in ASCVD risk between ethnicity, the African Americans diagnosed at 18-39 years had higher ASCVD risk compared to White Caucasians. African Americans had higher 3-point MACE risk compared to White Caucasians across age groups.

Disclosure: S. Paul: None.
152
Identification and mechanistic studies of a novel form of neonatal diabetes caused by YIPF5 mutations leading to pancreatic beta cell endoplasmic reticulum stress
F. Fantuzzi1,2, C. Demarez1, E. De Franco3, H. Ibrahim4, Y. Cai1, T. Sawatani1, H. Shakeri1, N. Pachera1, M. Lytrivi1, K. Patel3, M. Yildiz5, D.L. Eizirik1, T. Otonkoski4, A.T. Hattersley3, M. Cnop1;
1ULB Center for Diabetes Research, Université Libre de Bruxelles, Brussels, Belgium, 2Medicine and Surgery, University of Parma, Parma, Italy, 3University of Exeter Medical School, Exeter, UK, 4Stem cells and Metabolism Research Program, University of Helsinki, Helsinki, Finland, 5Kanuni Sultan Suleyman Training and Research Hospital, Istanbul, Turkey.
Background and aims: We recently identified 6 patients from 5 families with neonatal/early-onset diabetes, microcephaly and epilepsy, caused by homozygous mutations in YIPF5 (4 different missense mutations and 1 in-frame deletion). YIPF5 is involved in endoplasmic reticulum (ER)-to-Golgi trafficking and is highly expressed in pancreatic islets. We presently used pluripotent stem cell (iPSC)-derived β-cells from patients, corrected isogenic controls or healthy controls to study the mechanisms leading to the disease.
Materials and methods: Peripheral blood mononuclear cells from 2 p(Ile98Ser) YIPF5-diabetic siblings and a healthy control were reprogrammed into iPSCs using Sendai virus vectors. Corrected isogenic iPSCs were generated by CRISPR-Cas9. iPSCs were differentiated into β-cells using a 7-step protocol. β-cell markers and function were assessed by immunocytochemistry, qPCR and ELISA. Apoptosis and ER stress markers were measured in β-cell organoids exposed for 48h to the ER stressors thapsigargin (1 μM) or tunicamycin (5 μg/ml).
Results: Control or corrected (iPSC-β) and YIPF5 mutant iPSC-derived β-cells (YIPF5-β) followed a proper developmental pathway as determined by SOX9, NGN3, PDX1 and NKX6.1 mRNA expression across the differentiation process. The yield of insulin-positive β-cells tended to be slightly lower in YIPF5-β than in iPSC-β (46±2% vs 38±2%, n=10). There was no difference in insulin secretion in response to high glucose (16.7 mM) or high glucose plus forskolin (10 μM). YIPF5-β had higher basal cell death than iPSC-β (18±3% vs 6±2%, p<0.05, n=8) and greater sensitivity to tunicamycin (25±3% vs 15±3% apoptosis, p<0.05). Tunicamycin and thapsigargin induced greater mRNA expression of the ER stress markers CHOP and BiP (respectively, 8-to-9-fold and 5-fold in YIPF5-β, p<0.05), and induced the pro-apoptotic Bcl-2 proteins DP5 and PUMA.
Conclusion: YIPF5 mutations cause a novel genetic subtype of diabetes resulting in impaired ER-to-Golgi trafficking. Using patients’ iPSC-derived β-cells, we show that the YIPF5 mutation compromises neither β-cell differentiation nor function, but sensitizes β-cells to basal and ER stress-induced apoptosis. This furthers our understanding of β-cell failure caused by YIPF5 mutations and will allow testing β-cell protective therapies.
Supported by: IMI INNODIA
Disclosure: F. Fantuzzi: None.
153
Prevalence and BMI of early-onset adult type 2 diabetes in a multiethnic population
J.D. Ranchagoda1, D. Johnston1, A. Majeed2, J. Valabhji3, E. Gregg2, S. Misra1;
1Department of Medicine, Imperial College London, London, 2School of Public Heath, Imperial College London, London, 3Imperial College Healthcare NHS Trust, London, UK.
Background and aims: The incidence of type 2 diabetes in young adults has increased rapidly in the U.K. These individuals have a higher and accelerated risk of diabetes complications and mortality. Paediatric studies of type 2 diabetes show that non-white ethnicities are disproportionately affected, and early onset is associated with more obesity than those at older ages. However, population studies of early adult-onset type 2 diabetes in diverse ethnic groups are lacking. We studied early-onset adult type 2 diabetes in white, South Asian (SA) and African-Caribbean (AC) individuals.
Materials and methods: In this cross-sectional study, cases with type 2 diabetes were accessed from an anonymised population dataset of 1,407,990 individuals, derived from general practice records in North West London. All cases coded with type 2 diabetes were included if their last clinical encounter occurred between April 2015 - December 2019. Early adult-onset type 2 diabetes was defined as an age at diagnosis of 18-45 yrs, irrespective of current age. We calculated: 1) proportion of cases of type 2 diabetes by decade of onset within each ethnicity and 2) mean BMI by ethnicity, comparing those currently aged 18-45 to those aged 55-79 yrs, with duration <5 yrs.
Results: Overall prevalence of type 2 diabetes among persons aged 9-99 in the sample was 6.5% (n=93.635); non-white ethnicities had higher prevalence; 3.4% (23,418 /688,568) of white, 10.1% (58,661/580,878) SA and 8.3% (11,556/138,544) of AC individuals. Analysis 1: The proportion of cases by decade of onset varied significantly by ethnicity (table); in white people, 3.7% of cases were diagnosed at age 18-34yrs, 12% at 35-44, 25.6% at 45-54 with a peak 28.8% at age 55-64 yrs. SA individuals had higher proportions of earlier diagnoses, with 8.2% of all cases diagnosed 18-34 yrs, 22.5% 35-44 with the highest, 31.2%, at 45-54. AC individuals also had higher proportions of earlier diagnoses; 7.2% 18-34 yrs, 18.6% 35-44, with the highest proportion (30.7%) aged 45-54. Analysis 2: The Mean BMI was significantly higher across all ethnicities in those currently aged 18-44 versus 55-79 yrs with <5 yrs duration of type 2 diabetes: in white individuals currently aged 18-45(n=563), BMI was 34.8kg/m2 vs 31.8 for 55-79 yrs (n=3921). SA people had significantly lower BMI than white, but similar trends; BMI 30.3 kg/m2 (18-45, n=3806) vs 28.6 (55-79, n=8090). In AC individuals, BMI was 33.7 (18-45, n=475) and 31.0 age (55-79, n=1595).
Conclusion: Early adult-onset type 2 diabetes disproportionately affects SA and AC ethnicities; it is twice as high in SA and 10% higher in AC ethnicities as white. In all ethnicities studied, mean BMI in those with early-onset type 2 diabetes, is significantly higher than older onset diabetes and for SA individuals the trend of developing type 2 diabetes at lower BMI than other ethnic groups, is maintained for those specifically presenting early in adulthood.

Supported by: EFSD Future Leaders Mentorship Programme
Disclosure: J.D. Ranchagoda: None.
154
Islet cell autoantibodies status in patients with MODY phenotype
E. Romanenkova1, N. Zubkova1, A. Timofeev2, D. Laptev1;
1Endocrinology Research Centre, Moscow, 2Pirogov Russian National Research Medical University, Moscow, Russian Federation.
Background and aims: Autoimmune damage to pancreatic beta cells are important markers of type 1 diabetes. However, autoantibodies are present in other types of diabetes. It's known, the screening of monogenic forms of diabetes is based on the evaluation of clinical data included in MODY calculator and determine islet autoantibody status.We tested for the presence of islet autoantibodies in a subgroup of patients with high probability MODY followed by a screening for mutations in MODY-candidate genes.
Materials and methods: The autoantibodies (GADA, ZnT8, IA2) were measured in a cohort of 124 patients with MODY phenotype (clinical prediction model to determine the probability of MODY have given a >75% positive predictive value).‘Diabetes panel’ genes were sequenced using a custom Ion Ampliseq gene panel and PGM semiconductor sequencer (Ion Torrent). Interpretation of the sequencing results and assessment of the pathogenicity of sequence variants were performed according to the ACMG guidelines (2015).
Results: 8 patients (6.5%) were autoantibody positive (one or more autoantibodies): GADA (n=1) 4,3 ME/ml (normal range <1,0 ME/ml); IA-2 (n=5) 28-71 ME/ml (normal range <15,0 ME/ml); ZnT8 (n=3) 20-20,4 U/ml (normal range <15,0 U/ml). The median age at onset of hyperglycemia was 11.2 years [6.46-15.7]. The length of the disease at the time of the examination was 13.4 years [7.3-17.3]. The average level of glycated hemoglobin during the manifestation of the disease was 6.7% [5.9-7.3%]. All participants showed positive family history of diabetes with affected first-degree relatives at least in two generations.Using NGS, 8 pathogenic and probably pathogenic mutations were identified in the GCK (n=7) and HNF4A (n=1) genes. For missense variants in GCK gene have been described before (p.F150Y, p.V182M, p.G261R, p.R191Q) and 3 (p.G295V, p.I225T, p.Y273N) were novel. Heterozygous missense variants p.R290H in HNF4A gene was previously reported and ranked as pathogenic.All GCK-MODY2 patients were asymptomatic. Their clinical data were the following: mean age 10.6 year [6.5-14.4], SDS BMI -0.7 [-3.7-1.2], mean fasting plasma glucose 6.5 mmol/l 6.6 [5.9-7.7], and mean HbA1c 6.7% [5.9-7]. 5 subjects met criteria of diabetes and 2 patients met criteria of IGT (ISPAD, 2019). The patients with GCK gene mutations were successfully treated with low-carbohydrate diets.A 15-year-old patient with HNF4A mutation was almost asymptomatic. The OGTT results done due to his obesity were consistent with diabetes. HbA1c was 11.7%. The boy responded well to low doses of sulfonylureas.
Conclusion: In our study, islet autoantibody positivity was associated with MODY phenotype in 6.3% cases. Detectable levels of islet cell autoantibodies in patients with MODY phenotype challenges the use of autoantibodies as a universal negative marker of MODY.
Disclosure: E. Romanenkova: None.
155
Linagliptin as add-on treatment to glimepiride in patients with HNF1A-diabetes (MODY3): a randomised, double-blinded, placebo-controlled, crossover trial
A.S. Christensen1,2, S. Hædersdal1,2, J. Støy3, H. Storgaard1,2, U. Kampmann3, M. Seghieri1,4, J.J. Holst5,6, T. Hansen6, F.K. Knop1,2, T. Vilsbøll1,2;
1Steno Diabetes Center Copenhagen, Hellerup, Denmark, 2Center for Clinical Metabolic Research, Gentofte Hospital, University of Copenhagen, Hellerup, Denmark, 3Steno Diabetes Center Aarhus, Aarhus, Denmark, 4Diabetes Unit, USL Toscana Centro, Florence, Denmark, 5Department of Biomedical Sciences, Faculty of Health and Medical Sciences, University of Copenhagen, Copenhagen, Denmark, 6Novo Nordisk Foundation Center for Basic Metabolic Research, The Faculty of Health and Medical Sciences, University of Copenhagen, Copenhagen, Denmark, Copenhagen, Denmark.
Background and aims: First-line treatment of hepatocyte nuclear factor 1-alpha HNF1A-diabetes (MODY3) is sulfonylurea. Sulfonylurea has limitations with respect to providing sustained glycaemic control and risk of hypoglycaemia. We hypothesised that a low dose of sulfonylurea in combination with the dipeptidyl peptidase 4 inhibitor linagliptin provides a more efficacious treatment with less glycaemic variability and hypoglycaemia in patients with HNF1A-diabetes compared to sulfonylurea monotherapy.
Materials and methods: In a randomised, double-blinded, cross-over trial, patients with HNF1A-diabetes (n=20, [mean ± SD]; age: 43 ± 14 years; BMI 24.3 ± 2.8 kg/m2; HbA1c 57.1 ± 7.3 mmol/mol) were randomly assigned to treatment with glimepiride+ 5mg linagliptin (16 weeks), wash-out (4 weeks) and treatment with glimepiride+placebo (16 weeks). Glimepiride was titrated in a treat-to-target manner aiming for fasting plasma glucose of 4.5-6.0 mmol/l without hypoglycaemia. Treatments were evaluated by continuous glucose monitoring (CGM), HbA1c and a mixed-meal test at baseline and at the end of each treatment period. The primary endpoint was difference between treatments in mean amplitude of glycaemic excursions (MAGE) and secondary endpoints included differences between treatments in coefficient of variation (CV) on CGM, HbA1c and hypoglycaemia.
Results: The glimepiride dose was significantly reduced ([mean difference, 95% CI] -0.7 [1.2 to 0.2] mg/day) with glimepiride + linagliptin compared with glimepiride + placebo. Compared to glimepiride + placebo, glimepiride + linagliptin showed an insignificant reduction in MAGE (-0.7 [-1.9 to 0.4] mmol/l) and significant improvements in CV (-3.7 [-7.1 to -0.3] %), HbA1c (-5.6 [-9.3 to -1.8] mmol/mol), body weight (-1.0 [-2.0 to -0.1] kg) and beta cell function (assessed by baseline-subtracted AUC for C-peptide:glucose during meal test (4.3 [0.6 to 7.9] nmol/l×mmol/l-1×min-1)). Incidence of hypoglycaemia (assessed by patient-reported episodes and CGM) was similar in the two treatment periods.
Conclusion: Linagliptin as add-on treatment to glimepiride in patients with HNF1A-diabetes improved glycaemic variability, control and reduced the daily glimepiride dose without increasing the risk of hypoglycaemia.

Clinical Trial Registration Number: EudraCT No. 2017-000204-15
Supported by: Unrestricted grant from Boehringer Ingelheim
Disclosure: A.S. Christensen: None.
156
Investigating the contribution of the HNF-1αG319S gene variant to childhood-onset type 2 diabetes using beta cell and mouse models
C.A. Doucette1, T.S. Morriseau2, K. Hunt1, M. Fonseca2, C. Nian3, V.W. Dolinsky2, F.C. Lynn3;
1Physiology and Pathophysiology, University of Manitoba, Winnipeg, 2Pharmacology and Therapeutics, University of Manitoba, Winnipeg, 3Surgery, University of British Columbia, Vancouver, Canada.
Background and aims: Type 2 diabetes (T2D) in children continues to increase in Canada, with Indigenous youth in the province of Manitoba carrying the highest burden. The annual incidence of childhood-onset T2D is 25 per 100,000 children/year in Manitoba, ~20-fold higher than the national average. 40% of the youth who have T2D in the affected Indigenous communities harbor a private single nucleotide variant in the hepatocyte nuclear factor-1α (HNF-1α) gene that changes a glycine at codon 319 to a serine (“G319S”). Clinical observations describe reduced fasting insulin and less obesity in children with T2D who carry the G319S variant, suggesting that the variant drives early beta cell dysfunction; however, the mechanistic impact of this variant on beta cell function is difficult to explore in human populations; animal and cell models are needed.
Materials and methods: CRISPR/Cas9 gene editing was used to knock-in the g>a.955 nucleotide substitution into MIN6 clonal β-cells (“G319S-MIN6”) and C57/BL6 mice. Heterozygous mice were bred to yield littermates with different doses of the variant “S allele”, namely GG (wild type), GS (heterozygous) and SS (homozygous for the variant). In vitro studies included glucose-stimulated insulin secretion (GSIS) assays, gene expression analyses and assessment of mitochondrial fuel oxidation. In vivo studies included glucose and insulin tolerance test, pyruvate tolerance tests and measurements of plasma hormone levels.
Results: Surprisingly, under standard conditions, the G319S variant did not affect GSIS in MIN6 β-cells; however, basal insulin secretion (at 2.8mM glucose) decreased 3.2-fold relative to control cells (p<0.01). Under chronic lipotoxic stress (48hr palmitate exposure), unlike control cells, G319S-MIN6 cells maintained 15-fold GSIS (p<0.01), accompanied by a 2-fold increase in carnitine palmitoyltransferase-1A (Cpt1A) expression (p<0.05) and a doubling in the rate of fatty acid oxidation. 6-month-old G319S-expressing female mice fed a chow diet revealed glucose intolerance (p<0.05) and elevated hepatic glucose production (p<0.05), despite no changes in body weight or insulin sensitivity. 6-month old male mice maintained normal glucose tolerance.
Conclusion: The HNF-1αG319S variant appears to shift β-cell metabolism to promote fatty acid oxidation and may confer protection to a high-fat dietary intake, which was abundant in traditional Indigenous food sources. While it appears maladaptive in the modern environment, the reduced basal insulin secretion from G319S-expressing beta cells may promote improvement in the metabolic response to fasting in this population by enhancing the mobilization of fuels, i.e. via enhanced hepatic gluconeogenesis; however, in modern times, drastically altered lifestyles as a result of colonization may trigger early hyperglycemia development, particularly as a result of excessive carbohydrate consumption. Future studies will address whether low-carbohydrate, high-fat diets are protective in G319S-expressing mice and will assess the effectiveness of dietary interventions in this population of people.
Supported by: CIHR PJT-159633
Disclosure: C.A. Doucette: None.
OP 27 Macrovascular complications and beyond
157
Aortic stiffness, peripheral and central haemodynamics in patients with screen-detected type 2 diabetes: the ADDITION-Denmark study
E. Laugesen1, L. Bjerg2,3, S.T. Andersen2,4, A. Sandbæk2,3, M. Charles3,5, M.E. Jørgensen6,7, D. Witte2,3;
1Aarhus Universitetshospital, Aarhus N, 2Department of Public Health, Aarhus University, Aarhus C, 3Steno Diabetes Center Aarhus, Aarhus N, 4Danish Pain Research Center, Department of Clinical Medicine, Aarhus University, Aarhus C, 5Research Unit of General Practice, Aarhus University, Aarhus C, 6Clinical Epidemiology, Steno Diabetes Center Copenhagen, Copenhagen, 7National Institute of Public Health, University of Southern Denmark, Odense, Denmark.
Background and aims: Intensive multifactorial treatment has an impact on aortic stiffness in type 2 diabetes as we have shown in the five year follow-up in the ADDITION study. However, the long-term impact of multifactorial treatment on the hemodynamic system is not well understood. We studied the 5 year post-intervention (10 years post-randomization) effect of intensive multifactorial treatment compared with routine care on hemodynamic parameters among individuals in the Danish arm of the ADDITION-Europe trial.
Materials and methods: The ADDITION-trial is a population-based screening and intervention study conducted in patients with screen-detected type 2 diabetes aged 40-69 years. General practitioners were randomized to provide intensive multifactorial treatment (IT) or routine care (RC). An unselected subsample of 411 patients underwent central hemodynamic assessments including carotid-femoral pulse wave velocity (cfPWV) by applanation tonometry in 2016-2017 approximately 5 years after the intervention finished (10 years post-randomization). We did an intention-to-treat analysis using linear regression models. All models were adjusted for sex, age and heart rate. The effect of additional adjustment for mean arterial pressure on cfpWV was also evaluated.
Results: In total, 242 patients from the IT and 169 patients from the RC underwent assessment by applanation tonometry. The median cfPWV was 10.2 m/s in the RC and 9.6 m/s in the IT (Table 1). cfPWV was 0.51 m/s lower (95% CI −0.97 to −0.05) in the IT compared with RC. With further adjustment by mean arterial pressure the positive effect by IT was attenuated to 0.4 m/s (95% CI -0.90 to 0.08). The peripheral systolic blood pressure was 3.7 mmHg lower (95% CI -7.2 to −0.3) while the peripheral diastolic blood pressure was 2.0 mmHg lower (95% CI -3.9 to −0.2) in the IT. There was no difference in other hemodynamic measures.
Conclusion: Intensive multifactorial treatment of patients with screen-detected type 2 diabetes in general practice showed a prolonged positive effect on aortic stiffness. Differences previously observed at the end of the intervention period were maintained 5 years after the end of the intervention period (10 years post-randomization). The intervention effect could be mediated by effects on mean arterial pressure.
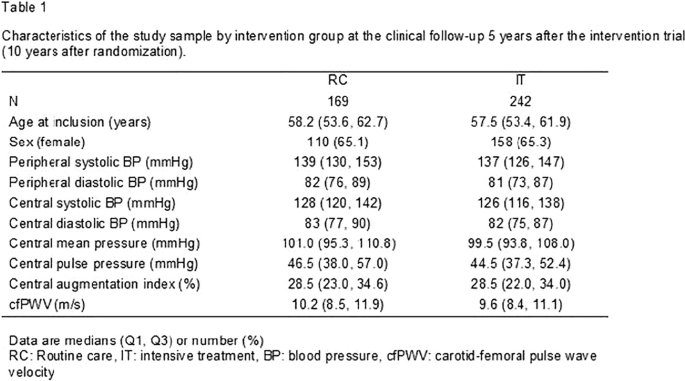
Clinical Trial Registration Number: 20000183 and 1-10-72-63-15
Supported by: IDNC research programme, Steno Research & Innovation Fund 2015
Disclosure: E. Laugesen: Grants; dd.
158
CAPTURE: a cross-sectional study of the contemporary (2019) prevalence of cardiovascular disease in adults with type 2 diabetes across 13 countries
O. Mosenzon1, A. Alguwaihes2, J.L. Arenas Leon3, F. Bayram4, P. Darmon5, T. Davis6, G. Dieuzeide7, K.T. Eriksen8, T. Hong9, C. Lengyel10, N.A. Rhee11, G.T. Russo12, S. Shirabe13, K. Urbancova14, S. Vencio15;
1Hadassah Medical Center, Hebrew University of Jerusalem, Jerusalem, Israel, 2King Saud University Medical City, Riyadh, Saudi Arabia, 3Centro de Atención e Investigación Cardiovascular del Potosí, San Luis Potosí, Mexico, 4Erciyes University, Kayseri, Turkey, 5Hôpital de la Conception, Marseille, France, 6University of Western Australia, Fremantle Hospital, Fremantle, Australia, 7Centro de Atención Integral en Diabetes, Endocrinologia y Metabolismo, Chacabuco, Argentina, 8Novo Nordisk A/S, Søborg, Denmark, 9Peking University Third Hospital, Beijing, China, 10University of Szeged, Szeged, Hungary, 11Novo Nordisk Health Care AG, Zurich, Switzerland, 12University of Messina, Messina, Italy, 13H. E. C Science Clinic, Yokohama, Japan, 14Diabetologická Interní Ambulance s.r.o, Ostrava, Czech Republic, 15Instituto de Ciencias Farmaceuticas, Goiás, Brazil.
Background and aims: There is a paucity of global and country-specific data on the prevalence of cardiovascular disease (CVD) in people with type 2 diabetes (T2D). The primary objective of CAPTURE was to estimate the contemporary (2019) prevalence of established CVD in people with T2D across 13 countries from five continents.
Materials and methods: CAPTURE was a multinational, cross-sectional, non-interventional study. Detailed, standardised demographic and clinical data were collected from adults aged ≥18 years with T2D attending a single routine healthcare visit in primary or specialist care between Dec 2018 and Sept 2019. Overall CVD prevalence estimates (across all 13 countries) were weighted to account for the size of the T2D population of each country. Data were analysed descriptively.
Results: In total, 9823 adults with T2D (primary care: 4502; specialist care: 5321) participated, with the following median (interquartile range, IQR) characteristics: age 64.0 years (56.0-71.0), diabetes duration 10.7 years (5.6-17.9) and HbA1c 7.3% (6.6-8.4) [56 mmol/mol (49-68)]; 45.5% were female. Overall CVD prevalence was 34.8% [32.7; 36.8]95% CI), with most (85.8%) categorised as atherosclerotic CVD (31.8% [29.7; 33.8]95% CI) (Table). Overall CHD prevalence was 17.7% [16.2; 19.3]95% CI, carotid artery disease was 8.4% [7.0; 9.7]95% CI and cerebrovascular disease was 7.2% [5.9; 8.4]95% CI. The overall prevalence of heart failure was 2.4% [2.1; 2.7]95% CI, driven by a relatively low prevalence in China (0.2% [0.0; 0.9]95% CI). Prevalence estimates were similar across primary and specialist care settings.
Conclusion: CAPTURE is the first multinational, cross-sectional study to estimate CVD prevalence in adults with T2D using standardised methodology. Our findings demonstrate that, in 2019, approximately one in three adults with T2D attending a primary or specialist healthcare visit had established CVD.

Clinical Trial Registration Number: NCT03811288; NCT03786406
Supported by: Novo Nordisk
Disclosure: O. Mosenzon: Non-financial support; Abstract supported by Novo Nordisk.
159
Derived time-in-range is associated with MACE in type 2 diabetes: data from the DEVOTE trial
R. Bergenstal1, E. Hachmann-Nielsen2, K. Kvist2, J.B. Buse3;
1International Diabetes Center, Minneapolis, USA, 2Novo Nordisk A/S, Copenhagen, Denmark, 3University of North Carolina School of Medicine, Chapel Hill, USA.
Background and aims: There is a need to validate time-in-range (TIR; percentage of time with plasma glucose between 3.9 and 10.0 mmol/L (70-180 mg/dL) as a surrogate endpoint for long-term clinical outcomes.
Materials and methods: We used data from patients with 8-point glucose profiles (8pp) from the double-blind cardiovascular outcomes trial, DEVOTE. In total, 7637 patients with T2D and either established CVD or at high risk for CVD were included in the trial. The primary endpoint in DEVOTE was time to first MACE. The 8pp were collected at 1 year, 2 years and end-of-trial. Median length of follow-up was 2 years. For 5644 patients, 8pps with at least 7 points existed. Among the 681 major adverse cardiovascular events (MACEs) in DEVOTE, 360 were among patients with 8pps. Individual TIR was derived as the proportion of the 8pp within range. A Cox model was used to estimate the association between derived TIR and time to first MACE. Hazard ratios (HR) were estimated for patients with TIR>70% vs TIR≤70%, and for TIR>70% and TIR 50−70% vs TIR≤50%.
Results: Derived TIR was >70% for 65% of the patients. Estimated rate of first MACE was lower for TIR >70% and TIR 50-70% vs TIR≤50% (Figure) and for TIR>70% vs TIR≤70% (HR: 0.74 [0.60;0.91]95% CI; p<0.01). The associations were maintained when analyses were adjusted for baseline characteristics.
Conclusion: Derived TIR was associated with rate of first MACE for T2D patients in DEVOTE.

Clinical Trial Registration Number: NCT01959529
Supported by: Novo Nordisk
Disclosure: R. Bergenstal: Employment/Consultancy; Novo Nordisk, Abbott Diabetes Care, Calibra, Eli Lilly, Hygieia, Roche, Sanofi, DexCom, Medtronic, United HealthCare, Onduo. Grants; Novo Nordisk, Abbott Diabetes Care, AtraZeneca, Calibra, Eli Lilly, Hygieia, Medtronic, Sanofi, Takeda, DexCom. Honorarium; Novo Nordisk, Abbott Diabetes Care, Boehringer Ingelheim, AstraZeneca, Calibra, Eli Lilly, Hygieia, Roche, Sanofi, Takeda, DexCom. Non-financial support; Novo Nordisk. Stock/Shareholding; Merck.
160
Genetic risk for coronary artery disease is comparable to the risk imposed by traditional risk factors in individuals with type 1 diabetes
R. Lithovius1,2, A. Antikainen1,3, S. Mutter1,3, E. Valo1,3, C. Forsblom1,2, N. Sandholm1,3, P.-H. Groop2,3;
1Folkhälsan Institute of Genetics, Helsinki, 2University of Helsinki and Helsinki University Hospital, Helsinki, 3Research Program for Clinical and Molecular Metabolism, University of Helsinki, Helsinki, Finland.
Background and aims: Individuals with type 1 diabetes have a higher risk of coronary artery disease (CAD) than the general population. In order to improve the risk prediction in the general population, genetic risk scores (GRS) have been suggested to complement the traditional risk factors for the identification of high-risk individuals, and thus enabling earlier interventions. Whether the same GRS are able to identify individuals with high risk of CAD in type 1 diabetes (T1D) is not known. Therefore, we investigated the potential of such GRS in individuals with T1D, combined with traditional risk factors, and also the impact of pharmaceutical treatment.
Materials and methods: GRSs were calculated from 156 known CAD susceptibility variants from the general population for 2736 genotyped individuals with T1D in the Finnish Diabetic Nephropathy Study (cases/controls=408/2328). Sex, age, diabetes onset year, systolic and diastolic BP, total cholesterol, HDL-cholesterol, triacylglycerol, smoking status, HbA1c, BMI, WHR, eGFR and presence of albuminuria were recorded. Cox regression analyses were performed with the standardized clinical variables and the GRS. Individuals were also stratified into the highest and lowest score decile groups (10th and 90th percentiles) and into quintiles (20th and 80th percentiles). Hazard ratios (HR) for CAD were evaluated with Cox regression between the lowest and highest score groups adjusted for age, sex and diabetes onset year. Finally, analyses were repeated in those with (cases/controls=323/917) antihypertensive or lipid-lowering medication at baseline based on the Drug Prescription Register.
Results: In Cox regression, GRS (HR=1.30 [1.18-1.45], p=4.37x10⁻⁷), presence of albuminuria (HR=1.48 [1.30-1.68], p=1.33x10⁻⁹), HbA1c (HR 1.22 [1.10-1.36], p=0.0002) and systolic BP (HR=1.21 [1.08-1.36], p=0.0008), were strongly associated with risk of CAD. The highest decile GRS group had a significantly higher risk of CAD in comparison with the lowest decile (HR=2.77 [1.77-4.33], p=7.51×10⁻⁶). The risk-increase was more modest for the quintile groups comparison (HR=2.16 [1.56-2.98], p=3.18×10⁻⁶). In those taking medication at baseline, the HRs between top versus bottom decile GRS groups were slightly reduced but remained substantial (HR 2.51 [1.50-4.21], p=0.0005). The HR between the quintile groups showed a similar trend (HR 2.12 [1.46-3.06] p=6.68 ×10⁻⁶).
Conclusion: GRS for CAD based on the general population successfully identified individuals with high risk of CAD in T1D, especially in those with the highest genetic risk. Importantly, the genetic risk of CAD is comparable to the risk imposed by the traditional risk factors, suggesting that genetic risk is an important life-long risk factor and should be considered in individuals with T1D in clinical practice. The results also suggested that in those with the highest genetic risk antihypertensive or lipid-lowering medication seemed to attenuate the risk of CAD.
Supported by: Finnish Heart Foundation, Diabetes Research Foundation
Disclosure: R. Lithovius: None.
161
Prognosis in patients with atrial fibrillation and type 1 diabetes, type 2 diabetes and severe hypoglycaemia: a nationwide report
S. Karayiannides1, A. Norhammar2, L. Landstedt-Hallin3, L. Friberg3, P. Lundman4;
1Academic Specialist Center, Center for Diabetes, Karolinska Institutet, Stockholm, 2Department of Clinical Physiology, Capio St Görans Hospital, Karolinska Institutet, Stockholm, 3Department of Clinical Sciences, Karolinska Institutet, Stockholm, 4Department of Cardiology, Danderyd Hospital, Karolinska Institutet, Stockholm, Sweden.
Background and aims: Atrial fibrillation (AF), diabetes mellitus (DM) and severe hypoglycaemia are all associated with an increased risk for mortality, cardiovascular complications and impaired cognition. Few studies have compared the risk for adverse events between type 1 DM (T1DM) and type 2 DM (T2DM). The aim of this nationwide study in patients with AF was to describe the prognostic differences between T1DM, T2DM and in DM with documented severe hypoglycaemia.
Materials and methods: We included all 309 611 adult patients in Sweden who received a non-valvular AF diagnosis between 1 January 2013 and 31 December 2014. Patients were followed for all-cause mortality until 27 March 2017 and for incident heart failure, myocardial infarction, ischaemic stroke and incident dementia until 31 December 2015. Information on comorbidities, events and medication was collected from nationwide registries. Cox proportional hazard regression was used to calculate HRs adjusted for age, sex, comorbidities, and medications.
Results: DM was present in 60 294 (19.5%) patients, of whom 2 221 (3.7%) had T1DM and 58 073 (96.3%) had T2DM. Severe hypoglycaemia was documented in 1 560 patients (12.2% of T1DM and 2.2% of T2DM patients). Patients with T1DM were generally younger (71.2 vs. 76.0 years), more frequently had previous myocardial infarction (31.6% vs. 26.4%), peripheral artery disease (19.8% vs. 11.0%) and chronic kidney disease (21.5% vs. 9.6%) and less frequently had heart failure (34.9% vs. 38.6%) than those with T2DM. Adjusted HRs (95% CI) for all-cause mortality in patients with T1DM and T2DM compared with patients w/o diabetes were 1.43 (1.31-1.56) and 1.24 (1.21-1.28), for myocardial infarction 1.85 (1.58-2.17) and 1.20 (1.12-1.28) and for ischaemic stroke 1.29 (1.07-1.55) and 1.06 (0.99-1.12), respectively. Presence of severe hypoglycaemia was independently associated with increased risk for incident dementia [1.84 (1.08-3.14) in T1DM, 1.48 (1.16-1.89) in T2DM] and all-cause mortality [1.60 (1.32-1.95) in T1DM, 1.48 (1.37-1.62) in T2DM] compared with patients w/o diabetes (figure).
Conclusion: In a nationwide population with AF, T1DM was associated with a more pronounced increase in risk for all-cause mortality and myocardial infarction than T2DM. Severe hypoglycaemia in both T1DM and T2DM was associated with a higher risk for incident dementia and all-cause mortality. Our results highlight the importance of risk factor optimization in patients with DM, regardless of type, to avoid cardiovascular complications and that the treatment goal of reducing severe hypoglycaemia is also essential in patients with AF and DM.

Disclosure: S. Karayiannides: None.
162
Cardiovascular risk prediction equations for patients with type 2 diabetes derived in a population with comprehensive diabetes screening
R. Pylypchuk1, P. Drury2, B. Wu1, S. Wells1, R. Jackson1;
1Epidemiology and Biostatistics, University of Auckland, Auckland, 2Ministry of Health NZ, Wellington, New Zealand.
Background and aims: Patients with longstanding diabetes may have similar cardiovascular risk to patients with pre-existing vascular disease, however the increasing numbers of screen-detected patients over recent years are likely to be at lower cardiovascular risk. For such patients, cardiovascular risk management should be informed by predicted risk, yet most prediction equations have been derived in patients with longstanding diabetes and will thus tend to overestimate risk. We derived new equations in a contemporary cohort of diabetes patients in New Zealand, where widespread diabetes screening was introduced in 2012.
Materials and methods: The PREDICT cohort study enrols participants when general practitioners use PREDICT software to assess patients’ cardiovascular risk in routine practice. The analyses were restricted to patients from the PREDICT cohort with known diabetes but no known prior vascular disease (diabetes sub-cohort), recruited between 2004 and 2016; 53% after 2010. Patient risk profiles were linked to national ICD-coded hospitalisations and deaths. New equations were developed including 18 pre-specified variables and predicting 5-year cardiovascular event rates using Cox proportional hazard models. Calibration and discrimination performance of the new equations was assessed and compared with two other New Zealand equations; one derived from the diabetes-only New Zealand Diabetes Cohort Study (NZDCS), and the other from the general population PREDICT cohort study, combining people with and without diabetes.
Results: The PREDICT diabetes sub-cohort recruited 46,652 participants (49% women) aged 30 to 74 years. Over a mean of 5.2 years follow-up (244,840 person-years) they experienced 4,114 first cardiovascular disease events (9% fatal) during follow-up (mean 5.2 years, 244,840 person-years). The new diabetes-specific equations included additional clinically relevant predictors not present in the comparison equations. Discrimination performance of the new equations (e.g. Harrell’s C for women = 0.73 [95% CI:0.72, 0.74]) was significantly better than equations derived from the NZDCS (0.69 [0.67, 0.70]) and from the general population PREDICT cohort study (0.68 [0.67, 0.70]). NZDCS equations overestimated CVD risk by 75-100% when applied to the PREDICT diabetes sub-cohort, whereas PREDICT general population equations were well calibrated.
Conclusion: Widespread screening identifies many patients with short-duration diabetes at low cardiovascular risk so that equations derived in a diabetes-specific cohort only a few years before widespread screening now overestimate risk by up to 2-fold. Moreover, the new equations, which include additional diabetes-specific and renal predictors, had significantly better discrimination than either the older NZDCS equations or the contemporary general population (non-diabetic) PREDICT equations derived from the same study. As population diabetes screening is introduced worldwide, clinicians will require new equations derived from contemporary diabetes-only cohorts with additional diabetes-specific predictors. Without more accurate equations, informed shared decisions on cardiovascular risk management in this important and increasingly heterogeneous patient population will not be possible.
Supported by: This study was funded by the Health Research Council of New Zealand
Disclosure: R. Pylypchuk: Grants; Health Research Council of New Zealand, Programme Grant.
OP 28 Linking inflammation to metabolism
163
Netrin-1 mediates adipose immune equilibrium and insulin resistance in type 2 diabetes via UNC5h2 receptor
H. Shi, M. Liu, Y. Qu, C. Li;
Chinese Academy of Medical Sciences & Peking Union Medical College, Tianjin, China.
Background and aims: Netrin-1 is a neuron guidance molecule with reported pro-angiogenic and anti-inflammatory properties. We have previously reported a dual effect of Netrin-1 on pancreatic islet insulin secretion and immune modulation in high fat diet (HFD)/streptozotocin-induced diabetic mice. However, controversial studies have observed that administration of Netrin-1 promotes adipose macrophage retention and insulin resistance in HFD-induced obese mice via UNC5h2 receptor. In order to elucidate the exact impact of Netrin-1 in type 2 diabetes, we have used db/db mice to assess the role of Netrin-1 on insulin resistance and adipose tissue metabolism.
Materials and methods: Osmotic minipumps that release Netrin-1 (500 ng/day) or Netrin-1 with UNC5h2 Fc (1 μg/day), which blocks UNC5h2 receptor, for 4 weeks were implanted subcutaneously in male db/db mice (4 week-old, n=10). Fasting plasma glucose levels were measured weekly. Intraperitoneal glucose/insulin tolerance tests were performed before minipump implantation and after removal. RNA-seq was employed to examine changes of gene expression in visceral fat extracted from all groups of mice. Expressions of insulin receptor signalling components in visceral fat were assessed by western blotting. Serum levels of pro-inflammatory cytokines were quantified by ELISA.
Results: We observed decreased fasting plasma glucose levels from db/db mice treated with Netrin-1 (AUC: 77±6% over db/db control, p<0.05; 66±5% over Netrin-1+UNC5h2 Fc, p<0.05). This hypoglycaemic effect of Netrin-1 was abolished by UNC5h2 receptor inhibition since no change was shown in mice treated with Netrin-1+UNC5h2 Fc (AUC: 118±16% over control, p>0.1). Glucose tolerance was also significantly improved in mice administrated with Netrin-1 (AUC: 84±3% over control, p<0.05; 81±3% over Netrin-1+UNC5h2 Fc, p<0.05), which is dependent on UNC5h2 signalling, as mice treated with Netrin-1+UNC5h2 Fc were glucose intolerant (AUC: 103±4% over control, p>0.1). Similarly, Netrin-1-induced amelioration of insulin resistance was likely also mediated by UNC5h2 in db/db mice, as inhibition of UNC5h2 led to exacerbated insulin resistance (76±8% over control, p<0.05; 71±8% over Netrin-1+UNC5h2 Fc, p<0.05). However, Netrin-1-UNC5h2-regulated improvement of insulin resistance is independent of the insulin receptor-mediated signalling cascade, demonstrated by unaltered phosphorylation status of AKT and ERK in visceral fat obtained from Netrin-1 and Netrin-1+UNC5h2 Fc treated mice. RNA-seq analysis further revealed significant differences of mRNA expression profile in visceral fat from Netrin-1-treated animals when compared to control and Netrin-1+UNC5h2 Fc groups. Interestingly, the majority of genes with the most profound expression changes were those that mediate NF-κB signalling, chemokine signalling and cytokine signalling. Furthermore, though local and serum levels of pro-inflammatory cytokines TNFα and IL-1β were reduced in Netrin-1-treated mice compared to the other treatment groups, local and serum levels of chemokines MCP-1 and RANTES were both elevated, implicating more complex immunological regulations of Netrin-1 in visceral fat.
Conclusion: Our results indicate that Netrin-1 ameliorates insulin resistance via UNC5h2 receptor-mediated signalling activities. The Netrin-1-UNC5h2 signalling is likely to regulate adipose metabolism via its impact on visceral fat immune equilibrium modulation in type 2 diabetes.
Supported by: NSFC
Disclosure: H. Shi: None.
164
Hyperglycaemia epigenetically propels CD34+ hematopoietic stem cell differentiation toward more pro-inflammatory monocyte subpopulation
V. Vigorelli, S. Genovese, G. Pompilio, M. Vinci;
IRCCS Centro Cardiologico Monzino, Milan, Italy.
Background and aims: Diabetes mellitus (DM) is characterized by enhanced inflammatory state that promote and/or accelerate the molecular and cellular processes involved in the development of atherosclerosis. To this regard, clinical studies described abnormal elevation of intermediate (CD14++CD16+) inflammatory monocytes and alteration in macrophage polarization in DM individuals. Recent evidence suggests that hyperglycemia might preprogram CD34+ hematopoietic stem cells (HSCs) differentiation into more inflammatory cell populations. On these basis, the goals of our study were: i) to assess the in vitro effects of high glucose (HG) exposure on HSC phenotype and myeloid differentiation; ii) to determine if similar alterations might be at work in HSCs isolated from bone marrow (BM) of type 2 DM (T2DM) patients.
Materials and methods: CD34+ HSCs were magnetically sorted from cord blood (CB) of healthy subjects and BM sternal biopsies of T2DM patients ± coronary artery disease (CAD). CB-HSCs were expanded in normal-glucose (NG; with 30 mM mannitol) or HG (30 mM) serum-free medium plus cytokines and counted after 10, 20 and 30 days. The expression of p27, p21, IL6, TNFα, RELA/p65, KAT2B/PCAF genes and telomere length were assessed by qPCR; secreted cytokines by ELISA. Western Blot was used to evaluate acetylation of NFkB-p65 at lysine-310. H3K9me3 and RNA polymerase II recruitment to the RELA/p65 gene promoter were evaluated by ChIP-qPCR assay. NFkB-p65 nuclear translocation was evaluated by ImageStream whereas ROS and monocyte subpopulations were evaluated by flow cytometry after CellRox and CD14/CD16 staining respectively.
Results: In vitro HG exposure induced significant cell proliferation lowering, ROS production (n=4; p≤0.05), telomere shortening (n=4; p≤0.05) and up-regulation of p21 (n=8; p≤0.05) and p27 (n=7; p≤0.05) gene expression in CB-HSC. Interestingly, this senescent phenotype coincided with enhanced expression and secretion of inflammatory TNFα, IL6 cytokines (n=6; p≤0.01) and upregulation of NFkB-p65 transcription factor (n=10; p≤0.01). The analysis of the mechanisms involved in the regulation of NFkB-p65 expression and activation revealed the reduction of repressive epigenetic mark H3K9me3 at promoter level (n=6; p≤0.001) that correlated with increased RNA polymerase II recruitment. At the same time, the up-regulation of KAT2B/PCAF gene (n=10; p≤0.05), a histone acetyltransferase implicated in NFkB-p65 acetylation and activation, was associated with increased acetylation at lysine-310 (n=3; p≤0.05) and nuclear translocation of the transcription factor. Finally, once HG-HSCs were differentiated in vitro into myeloid lineage generated higher level of intermediate (CD14++CD16+) monocytes when compared to NG cells. Notably, BM-HSCs from T2DM-CAD patients displayed a similar senescent/inflammatory phenotype with significant higher expression of p27, NFkB-p65 and TNFα genes (n=8; p≤0.05) when compared to the control subjects. In addition, these cells, when differentiated in vitro into myeloid lineage, generated abnormal output of intermediate (CD14++CD16+) monocytes (n=4; p≤0.05)
Conclusion: Overall, our data show that hyperglycemia elicits intrinsic HSC alterations potentially responsible for the abnormal differentiation towards highly inflammatory monocyte subpopulations.
Supported by: Ministry of Health PE-2011-02348537; RC2019
Disclosure: V. Vigorelli: None.
165
Importance of tissue CCL5/CCR5 signalling on monocytic-MDSCs-derived macrophage polarisation and inflammation in epididymal fat of high fat diet-induced obese mice
P.-C. Chan, P.-S. Hsieh;
Department of Physiology & Biophysics, National Defense Medical Center, Taipei, Taiwan.
Background and aims: Obesity is characterized by chronic low-grade systemic inflammation, where myeloid cells play a critical role. Monocytic-MDSCs (M-MDSCs) have a CD11b+Ly6G-Ly6C+ phenotype, which are more similar to monocytes. CD11b+Ly6G-Ly6Chi cells (inflammatory monocytes) and CD11b+Ly6G-Ly6Clow cells (reparative monocytes) were recruited into the adipose tissue following proinflammatory state in adipose tissues and to insulin resistance. However, it remains unclear whether the augmented CCL5/CCR5 signal is important for the recruitment of M-MDSCs and monocyte subsets distribution in adipose tissue in the development of high fat diet (HFD)-induced obesity.
Materials and methods: Six-week-old male C57BL/6J wild-type (WT), CCL5-/- (CCL5-KO) and CCL5/CCR5-double KO (DKO) mice were fed a regular diet or an HFD (45% fat) for 20 weeks. Diet-induced pathophysiology was examined in mice after 20 weeks by quantitative real-time PCR, ELISA and flow cytometry. Co-cultures of bone marrow-derived MDSCs with condition medium (CM) from epididymal fat explant were performed.
Results: In the present result, the HFD feeding for 20 wks significantly increases body weight, HOMA-IR value, plasma and adipose tissue inflammatory cytokine levels and the increase in M1/M2 macrophage ratio along with the increases of CCL5 and CCR5 gene and protein expression in epididymal fat of wild type (WT) mice, which were attenuated in mice with CCL5 gene deletion (CCL5-KO). CCL5-KO mice exhibited decreased CD11b+Ly6G-Ly6Chi inflammatory monocytes and increased CD11b+Ly6G-Ly6Clow reparative monocytes in epididymal fat compared with WT mice. We performed intravenous injections of lentiviral vectors to deliver full-length CCL5 and CCR5 constructs to the epididymal fat. Notably, we observed a highly significant increase in CD11b+Ly6G-Ly6Chi inflammatory monocytes and decrease in CD11b+Ly6G-Ly6Clow reparative monocytes in CCL5 and CCR5-injected mice compared to empty vector controls. A similar trend was obtained in M1-like/ M2-like ratio. The results indicated that the CCL5/CCR5-dependent monocytic-MDSCs subsets distribute might involve into the pathogenesis of adipose tissue inflammation. To further determine the role of adipose tissue CCL5-mediated signaling in trans-differentiation of peripheral blood MDSCs into adipose tissue M1 or M2 macrophages, the condition medium (CM) using epididymal fat explant incubated for 24 hrs from HFD-fed WT and CCL5/CCR5-double KO (DKO) mice were cultured with isolated BM-derived MDSCs from WT mice. Our data showed that the co-incubation with CM from fat explant of HFD fed mice and isolated MDSCs significantly increased the ratio of MDSCs transformation into M1 macrophages, which failed to changes in those of CCL5/CCR5-DKO mice. In contrast, the number of the trans-differentiation of M2 macrophage from M-MDSCs were remarkably increased in CCL5/CCR5-DKO mice in comparison to WT mice.
Conclusion: It is suggested that that local CCL5/CCR5 signal pathway is crucial for the recruitment and transformation of blood M-MDSC into adipose tissue macrophages and subsequent inflammation reaction, which might further contribute to the development of obesity associated adipose tissue dysfunction and insulin resistance.
Supported by: MOST 108-2320-B-016-001
Disclosure: P. Chan: None.
166
Differences in biomarkers of inflammation between novel subgroups of patients with recent-onset diabetes
H. Maalmi1,2, C. Herder1,2, K. Strassburger1,2, O.-P. Zaharia1,2, J. Ratter1,2, Y. Karusheva1,2, K. Bódis1,3, W. Rathmann1,2, D. Markgraf1,2, V. Burkart1,2, J. Szendroedi1,3, M. Roden1,3;
1German Diabetes Center (DDZ), Düsseldorf, 2German Center for Diabetes Research (DZD), München-Neuherberg, 3Medical Faculty, Heinrich Heine University, Düsseldorf, Germany.
Background and aims: A novel clustering approach identified five diabetes subgroups (clusters) in individuals with adult-onset diabetes. These subgroups have distinct progression trajectories of diabetes-related complications which may be explained by their different clinical profiles. Since inflammation is an established risk factor for diabetes-related complications, we aimed to characterize potential differences in biomarkers of inflammation between these diabetes subgroups.
Materials and methods: Serum levels of 74 protein biomarkers of inflammation were measured using proximity extension assay technology in 414 individuals with recent adult-onset diabetes from the German Diabetes Study (GDS) who were classified in five clusters based on data-driven analysis of six variables (age at diagnosis, body mass index, HbA1c, homeostasis model assessment of β-cell function and insulin resistance based on C-peptide, and glutamic acid decarboxylase antibodies). Pairwise differences between means of biomarkers of inflammation across the clusters were compared with generalised linear models before (model 1) and after adjustment (model 2) for the aforementioned variables used for the definition of the clusters. For both models, we used Tukey-Kramer and Bonferroni corrections (α=0.05/74=0.0007) to account for both pairwise and total multiple comparisons between clusters.
Results: The study participants were assigned to five clusters: mild age-related diabetes (MARD, 35%), mild obesity-related diabetes (MOD, 32%), severe autoimmune diabetes (SAID, 21%), severe insulin-resistant diabetes (SIRD, 9%) and severe insulin-deficient diabetes (SIDD, 3%). After adjustment for multiple testing, 23 biomarkers of inflammation had at least one pairwise cluster difference in model 1 (all p<0.0007). Biomarker levels were highest in the SIRD and lowest in the SIDD cluster. All biomarkers correlated with at least one of the variables used for the definition of the clusters (all p<0.05). After additional adjustment for these variables (model 2), 6 biomarkers (CASP-8, CCL20, CD5, EN-RAGE, IL-6, IL-17C) showed at least one pairwise difference between clusters (e.g. higher CASP8, CD5, EN-RAGE and IL-6 in SIRD compared to SIDD, all p<0.0007).
Conclusion: Novel diabetes subgroups show multiple differences in circulating levels of biomarkers of inflammation. Our data suggest a prominent role of inflammatory pathways in particular in the SIRD cluster.
Clinical Trial Registration Number: NCT01055093
Supported by: DZD
Disclosure: H. Maalmi: None.
167
Role of serum uteroglobin as new indicator for obesity and insulin resistance
K. Joung1, J. Kim1, S. Choung2, S. Kang3, H. Kim1,2, B. Ku1,2;
1Internal Medicine, Chungnam National University School of Medicine, Daejeon, 2Medical Science, Chungnam National University School of Medicine, Daejeon, 3Internal Medicine, Inje University Busan Paik Hospital, Busan, Republic of Korea.
Background and aims: Uteroglobin (UG), also called as secretoglobin family 1A member 1 (SCGB1A1), is known to be a multifunctional protein with anti-inflammatory properties. Although low-grade persistent inflammation is one of most important pathophysiology in type 2 diabetes mellitus (T2D), the role of UG in progression of T2D remains unknown. This study aims to investigate the relationship between serum UG levels and metabolic parameters in subjects with normal and abnormal glucose tolerance.
Materials and methods: A total of 240 subjects were enrolled in this study, and they were divided into three groups [80 with T2D, 80 with prediabetes (preDM) and 80 with normal glucose tolerance (NGT)]. Blood collection and 75-g oral glucose tolerance test were performed in the morning after an overnight fast > 8 hours. Fasting serum UG levels were measured using a quantitative sandwich enzyme immunoassay technique with an enzyme-linked immunosorbent assay kit (R&D systems, Inc., MN, USA). Demographic findings and serum UG were compared between three groups using ANOVA. And we investigated correlation between serum UG and clinical factors using linear regression analysis. We additionally recruited 20 subjects with T2D to evaluate whether serum UG levels are changed by metformin treatment
Results: Serum UG levels in T2D and preDM group was significantly lower than those of NGT group (p=0.013). In linear correlation analysis, serum UG was significantly correlated with age (r = 0.196, p = 0.002), BMI (r = -0.164, p = 0.030), HOMA-IR (r = -0.181, p = 0.005), HOMA-beta (r = -0.153, p = 0.019) and eGFR (r = 0.265, p < 0.001). A total of 20 subjects with T2DM were additionally enrolled and treated with metformin monotherapy. Serum UG levels before (14.43±0.97 ng/mL) and after 12 months (16.47±1.33 ng/mL) of treatment show significant difference (p = 0.043).
Conclusion: This study demonstrated the association between serum UG and various metabolic parameters in human. Serum UG are significantly related to insulin resistance and renal function, and metformin treatment in T2D patients restored serum UG levels to that of NGT subjects, possibly due to improved insulin resistance.
Clinical Trial Registration Number: 201509042
Disclosure: K. Joung: None.
168
Characterisation of natural killer cell subsets in adipose tissue of morbidly obese subjects associated with type 2 diabetes
M.E. Haugstøyl1,2, M. Cornillet3, N. Stiglund3, K. Strand1,2, G. Mellgren1,2, N. Björkström3, J. Fernø1,2;
1Department of Clinical Science, University of Bergen, Bergen, Norway, 2Hormone Laboratory, Haukeland University Hospital, Bergen, Norway, 3Center for Infectious Medicine, Department of Medicine Huddinge, Karolinska Institutet, Stockholm, Sweden.
Background and aims: Systemic low-grade chronic inflammation represents a likely mechanistic link between obesity and type 2 diabetes (T2D). Inflammatory signaling in the adipose tissue (AT) seems to be of particular importance and several recent studies in mice have revealed natural killer (NK) cells as important players in the initial inflammatory events that take place. NK cells express a range of activating and inhibitory receptors that determine NK cell function, and the tissue environment of NK cells is also thought to give rise to their diversity. While tissue-resident NK cells have been identified in the liver, uterus and skin, much is still unknown about the identity of NK cell subsets in different human AT depots and how their composition associate with T2D. In this study, we have performed a deep phenotyping of NK cells in AT of morbidly obese subjects.
Materials and methods: Matched subcutaneous (SAT) and visceral (VAT) adipose tissue biopsies from patients undergoing bariatric surgery were enzymatically digested to isolate the immune cells and further analyzed using 27-color flow cytometry. The antibody panel included surface receptors to distinguish between circulating (CD56dimCD16+) and tissue-resident (CD56brightCD16-) NK cells and to determine NK cell function. Additionally, seven receptors identified through a broad surface proteome screening were included as novel AT-resident NK cell markers.
Results: We observed that tissue-resident NK cells from both SAT and VAT retained a maturation profile and effector phenotype similar to other peripheral tissues, with lower expression of perforin, granzyme B, and KIRs and with higher expression of NKG2A compared to circulating NK cells. Moreover, the AT-resident NK cells displayed a higher expression of CD26 (DPP4) and a lower expression of CD38 (cyclic ADP ribose hydrolase) compared to circulating NK cells, possibly reflecting an imbalance of the metabolism capacity. Interestingly, some markers revealed specific imprints of SAT and VAT on resident NK cells, with CCR5 being more expressed in VAT and Sialyl Lewis X more expressed in SAT, suggesting specific adaptions to the particular depots.
Conclusion: In this study, we have identified tissue-resident NK cell subsets in adipose tissue depots of morbidly obese subjects. Our findings suggest that the developmental process leading to the formation of a pool of resident NK cells in peripheral organs might be shared. However, it seems like the cells residing in SAT and VAT might face different nutritional and functional exposures that pressure them to adapt and metabolically reprogram. Use of clinical data has been approved by all patients and we are currently in the process of extracting these from the journals in order to investigate the relationship between NK cell subsets and T2D status. These data will be presented at the conference.
Supported by: Helse-Vest RHF
Disclosure: M.E. Haugstøyl: None.
OP 29 What's new in automated insulin delivery
169
Glycaemic outcomes and the importance of active insulin time in the Pivotal trial of the MiniMedTM Advanced Hybrid Closed-Loop (AHCL) system
A. Carlson1, B. Bode2, M. Christiansen3, S. Garg4, K. Kaiserman5, M. Kipnes6, D. Liljenquist7, A. Philis-Tsimikas8, R. Pop-Busui9, J. Reed10, J. Sherr11, D. Shulman12, R. Slover4, J. Thrasher13, AHCL Study Group;
1Park Nicollet International Diabetes Center, Minneapolis, 2Atlanta Diabetes Associates, Atlanta, 3Diablo Clinical Research, Walnut Creek, 4Barbara Davis Center for Childhood Diabetes, Aurora, 5SoCal Diabetes, Torrance, 6Diabetes and Glandular Disease Clinic, San Antonio, 7Rocky Mountain Diabetes and Osteoporosis Center, Idaho Fall, 8Scripps Whittier Diabetes Institute, San Diego, 9University of Michigan Health System, Ann Arbor, 10Endocrine Research Solutions, Roswell, 11Yale School of Medicine, New Haven, 12University of South Florida, Tampa, 13Medical Investigations Inc., Little Rock, USA.
Background and aims: The MiniMedTM AHCL system offers a 100 or 120mg/dL target set point (SP), autocorrect to 120mg/dL every 5 mins and have fewer Auto Mode exits, was evaluated in adults and adolescents with T1D.
Materials and methods: The 16-site, single-arm, in-home AHCL system trial enrolled 39 adolescents (14-21yrs) and 118 adults (≥22yrs) with T1D. After a 14-day baseline period using sensor-integrated pump, HCL feature or predictive low glucose feature, the AHCL feature was enabled with a 100 or 120mg/dL SP for ~45 days and then the other SP for ~45 days. The initial AIT at study start was 3-4 hours and adjusted per investigator discretion. Endpoints included safety events, changes in A1C, sensor glucose (SG), and percentage of time in (%TIR), below (%TBR) and above (%TAR) target range (70-180mg/dL; 3.9-10mmol/L).
Results: Auto Mode was used ≥95% of the time and autocorrection was 22% of daily bolus. Outcomes for the overall group and each age group at baseline and study period (100 and 120mg/dL SP), as well as during 100mg/dL SP use, are shown (Table). At the 100mg/dL SP, the AIT was shortened/lengthened/unchanged in 12%/1.4%/86.6% of participants, respectively. The %TIR at the 100mg/dL SP and AIT durations of ≤2, >2 to ≤3, >3 to ≤4 and >4 hours was 78.8±5.5% (n=29), 75.6±7.8% (n=76), 73.9±6.7% (n=65), and 70.6±7.9% (n=4), respectively. The %TIR at the 120mg/dL SP was 75.0±7.0% (n=26), 74.4±7.8% (n=76), 72.3±7.9% (n=74), and 68.1±10.7% (n=2), respectively. The %TBR (<70mg/dL; <3.9mmol/L) at the 100mg/dL SP was 2.6±2.0% (n=29), 2.9±2.3% (n=76), 2.8±2.3% (n=65), and 4.8±3.2% (n=4), respectively. The %TBR at the 120mg/dL SP was 1.9±1.9% (n=26), 2.0±1.6% (n=76), 1.7±1.3% (n=74), and 1.4±0.4% (n=2), respectively. The best results (SG of 141±8.8mg/dL, %TIR of 78.8±5.5% and %TBR of 2.6±2.0%; N=29) were in a subset using a 100 mg/dL SP and an AIT of 2 hrs. No DKA or severe hypoglycemia episodes occurred in the study period.
Conclusion: These data demonstrate that AHCL is safe, that it significantly improved A1C and SG, and that glycemic control can be optimized with target SP and AIT settings. Specifically, shortening the AIT improves %TIR without increasing %TBR.

Clinical Trial Registration Number: NCT03959423
Disclosure: A. Carlson: None.
170
Increased time in range and sustained Auto Mode use in 670G hybrid closed-loop system users: real world experience in DIABETER
D. Mul1, A. Arrieta2, P. Dekker1, E. Birnie3, T.C.J. Sas1, H.-J. Aanstoot1, H.J. Veeze1;
1Diabeter, Rotterdam, 2Medtronic, Maastricht, 3UMCG, Groningen, Netherlands.
Background and aims: Current outcomes in type 1 diabetes require more automated systems that not only improve glucose regulation, but also reduce burden by reducing the need for constant focus on pump handling for patients. Time in Auto Mode (automated basal insulin delivery, based on CGM data) is a crucial factor for success of the Medtronic 670G hybrid closed-loop (HCL) system. In a recent study the time in Auto Mode of the 670G HCL system decreased from 74% to 35% over 12 months. DIABETER, a treatment and research centre for people with diabetes, introduced the 670G HCL system with a comprehensive and structured education and an extended support and follow-up program. The aims of this real-word data analysis were 1) to assess if our introduction program helps patients to maintain the appropriate percentage of time spent in Auto Mode and 2) to assess glucose metrics after start on the 670G system.
Materials and methods: We included 77 people with type 1 diabetes on pump or MDI (with or without glucose sensor monitoring) who switched to the 670G HCL system for clinical reasons and/or patient preference. We analysed data from 1-OCT-2018 until 13-MAR-2020 of patients who provided consent for use of their pump and CGM data for research purposes and who had at least 10 days of sensor data available at any time point of evaluation. The percentage time in Auto Mode was calculated at 1, 3, 6, 9 and 12 months after start on the 670G HCL system by dividing time in Auto Mode by total pump time. Glucose metrics (time below range [TBR: <3.9 mmol/L], time in range [TIR: 3.9 - 10 mmol/L] and time above range [TAR: >10 mmol/L]) were also calculated.
Results: Patient characteristics: mean (SD) age, 20.1 (10.2) years; mean (SD) diabetes duration, 11.8 (8.4) years; gender (% male), 49.4%. HbA1c was available for 73/77 patients. Mean (SD) HbA1c was 7.0 (0.7)%. Median percentage time in Auto Mode remained relatively stable over time at 84-95% (figure). Compared to the pre-Auto Mode phase, TIR increased (+11%) and remained stable while using Auto Mode. This was also reflected by decreases in TBR and TAR (-0.5%, -11%)(figure).
Conclusion: After starting on the 670G HCL system, the percentage time in Auto Mode is sufficiently high and remained high over time in the observed DIABETER patients, as opposed to previous reports. In addition, this results in a sustained improvement of glucose metrics, compared with the pre-Auto Mode situation, and is in line with ranges specified by international guidelines. Although further analysis is needed, our comprehensive education and extended support and follow-up program seems to help patients to stay in the Auto mode and thus facilitates optimal use of the 670G HCL system.

Disclosure: D. Mul: None.
171
Automated insulin delivery in free-life shows better glucose control when used 24/7 vs evening and night in pre-pubertal children with type 1 diabetes: The Free-life Kid AP Study
E. Renard1,2, N. Tubiana-Rufi3, E. Bonnemaison4, R. Coutant5, F. Dalla-Vale6, E. Bismuth3, N. Faure4, N. Bouhours-Nouet5, A. Farret1,2, J. Place2, M. Breton7, Free-life Kid AP Study Group;
1Dept. of Endocrinology, Diabetes, CHU Montpellier, Montpellier, France, 2Institute of Functional Genomics, University of Montpellier, Montpellier, France, 3Dept. of Pediatric Endocrinology and Diabetology, APHP, Robert Debré Hospital, Paris, France, 4Dept. of Pediatric Medicine, CHU Tours, Tours, France, 5Dept. of Pediatric Endocrinology and Diabetology, CHU Angers, Angers, France, 6Dept. of Pediatrics, CHU Montpellier, Montpellier, France, 7Center of Diabetes Technology, University of Virginia, Charlottesville, USA.
Background and aims: Control of type 1 diabetes (T1D) is a daily challenge in children because of highly variable insulin needs. We assessed the safety and efficacy of automated insulin delivery (AID) in free-life in pre-pubertal T1D children while used 24/7 vs. evening & night (EN).
Materials and methods: One hundred and twenty-two pre-pubertal T1D children treated by insulin pumps (CSII) were enrolled in a multicenter prospective open label randomized control trial comparing glucose control with 24/7 or EN use of the hybrid Tandem t:slim X2 with Control-IQ AID system for 18 weeks. After a 3-week run-in phase for Tandem X2 pump and Dexcom G6 CGM training, AID was activated 24/7 or EN according to randomization. Primary outcome is %time spent in 70-180 mg/dl target range (%TIR); secondary outcomes include average CGM, %time below and above target range (%TBR and %TAR, respectively), and the same metrics during day-time and overnight.
Results: Patient characteristics at inclusion were: 49F/73M, age: 8.6±1.6, T1D duration: 5.2±2.3 years, CSII use: 4.6±2.5 years, HbA1c: 7.7±0.7% (61±5.3 mmol/mol). Except for 3 early drop-outs, 119 completed the trial. AID was effective for 93.6 and 50.9% of time on 24/7 and EN modes, respectively. The increase of %TIR was significantly larger on 24/7 vs. EN mode: 52.9±9.5 to 67.5±5.6 (+14.5%, CI: 12.4-16.7%) vs. 55.2±10.8 to 64.7±7.0 (+9.5%, CI: 7.4-11.6%), p<0.001. While mean %TBR was similarly reduced: 4.4 to 2.6 (24/7) and 4.6 to 2.7 (EN), mean %TAR decreased significantly more on 24/7 vs. EN mode: 42.9 to 29.8 (-12.2%, 95CI: 9.7-14.6%) vs. 39.7 to 32.3 (-7.4%, 95CI: 5.0-9.9%), p=0.008. Increased %TIR was superior on 24/7 vs. EN mode during daytime: 54.3±10.1 to 62.6±6.2 vs. 55.7±11 to 58.4±7.6, p=0.001, and reached 77.2% on average overnight on both modes. CGM levels (mg/dl) more significantly decreased on 24/7 vs. EN mode: 171.9±20.3 to 158.1±10.6 vs. 168.9±20.8 to 162.6±12.1, p=0.02, while % of patients with HbA1c level<7% (53 mmol/mol) moved from 14 to 36 (24/7) vs. 13 to 22 (EN), from baseline to week 18. SD of CGM levels (mg/dl) was also reduced significantly more on 24/7 vs. EN mode: 69.6±9.8 to 61.5±8.0 vs. 69.8±11.3 to 66.7±10.0, p=0.0001. %TIR was increased through the whole range of baseline HbA1c and %TIR levels and always more with 24/7 use. No ketoacidosis or severe hypoglycemia occurred during the study.
Conclusion: Our study demonstrates the safety and efficacy on glucose control of Tandem Control-IQ AID system used in free-life in pre-pubertal T1D children for both 24/7 and EN use. 24/7 use shows better performance than EN use, with 14.5% more time in range, or more than 3.6h/day, with no safety issue. The post-study extension for 18 weeks will assess the sustainability of 24/7 use of AID in the full study cohort.
Clinical Trial Registration Number: NCT03739099
Supported by: French MoH
Disclosure: E. Renard: Grants; French Ministry of Health. Non-financial support; Tandem, Dexcom.
172
Individual response of automated glycaemic control with the iLet bionic pancreas in the insulin-only vs bihormonal configuration with a stable glucagon analogue, dasiglucagon
J.S. Sherwood1, C.A. Balliro1, R.Z. Jafri1, L.E. Castellanos1, M. Hillard1, M. Sullivan1, R. Selagamsetty2, E. Greaux1, H. Zheng3, F. El-Khatib2, E.R. Damiano2, S.J. Russell1;
1Diabetes Research Center, Massachusetts General Hospital, Boston, 2Department of Biomedical Engineering, Boston University, Boston, 3Biostatistics Center, Massachusetts General Hospital, Boston, USA.
Background and aims: Reductions in plasma glucose are often achieved at the expense of increased hypoglycemia in patients with type 1 diabetes. We assessed the efficacy of the iLet™ bionic pancreas system in the bihormonal configuration delivering insulin and dasiglucagon versus the insulin-only configuration in adults with type 1 diabetes.
Materials and methods: We performed an outpatient, home-use, random-order, controlled trial we compared automated glycemic control with the iLet bionic pancreas in the insulin-only (IOBP) vs. the bihormonal (BHBP) configurations for one week each in adult subjects (n=10) with type 1 diabetes. Subjects used their typical insulin analog (lispro or aspart) during both arms of the study. During the BHBP period the iLet delivered micro-doses of dasiglucagon, a glucagon analog stable in aqueous solution (Zealand Pharma). The insulin control algorithm was identical in both configurations, was initiated solely based on each subjects’ body mass without any information regarding patients’ baseline insulin needs, and used a glucose target of 110 mg/dl. We used an autoregressive time series model to determine statistical significance for differences between arms for each individual subject.
Results: The group mean CGM glucose was lower in the BHBP arm vs. the IOBP arm (139±11 vs. 149±13 mg/dl, p=0.004) while the % of time with CGMG <54 mg/dl was nominally reduced (0.2%, IQR 0-0.4 vs. 0.6%, IQR 0.2-1.1%, p=0.11). Eight subjects had a significantly lower mean CGMG during the BHBP arm (p<0.05, mean improvement 12±7 mg/dl), while in the remaining two subjects there was no significant difference (nominal absolute difference 2±1 mg/dl). Eight of the ten subjects had a nominal reduction of the % of time <54 mg/dL in the BHBP arm (mean nominal difference -0.5%, range -0.1 to -1.0%), none of which were statistically significant.
Conclusion: In a trial comparing the BHBP and IOBP configurations of the iLet we found a significant benefit of adding dasiglucagon in eight of ten subjects, allowing each of them to achieve a lower mean glucose without increased rates of hypoglycemia.
Clinical Trial Registration Number: NCT 03840278
Supported by: Study was funded by Beta Bionics and Zealand Pharma donated the study drug, dasiglucagon
Disclosure: J.S. Sherwood: None.
173
First home evaluation of the Omnipod Horizon™ automated glucose control system in children with type 1 diabetes
G.P. Forlenza1, B.A. Buckingham2, A. Criego3, S.A. Brown4, B.W. Bode5, C.J. Levy6, T.T. Ly7, Omnipod Horizon Study Group;
1Barbara Davis Center for Diabetes, University of Colorado School of Medicine, Aurora, 2Department of Pediatrics, Division of Pediatric Endocrinology, Stanford University, Stanford, 3Department of Pediatric Endocrinology, Park Nicollet Clinic, International Diabetes Center at Park Nicollet, Minneapolis, 4Division of Endocrinology and Medicine, University of Virginia, Charlottesville, 5Atlanta Diabetes Associates, Atlanta, 6Icahn School of Medicine at Mount Sinai, New York, 7Insulet Corporation, Acton, USA.
Background and aims: The Omnipod Horizon™ System is a hybrid closed-loop (HCL) system consisting of a tubeless insulin pump with a control algorithm linked to a Dexcom G6 sensor. The system provides automated insulin delivery with customizable glucose targets from 110-150mg/dL, adjustable by time of day to allow therapy personalization. This study is the first outpatient safety and effectiveness evaluation of the system, including use at the higher targets of 130-150mg/dL.
Materials and methods: Participants aged 6-13.9y with T1D>6mo and A1C<10.0% used the HCL system at home for 14 days over the winter holidays with unrestricted eating and exercise (8 participants spent first 2 days in a hotel). Participants set protocol-determined higher targets of 130, 140, and 150mg/dL for 3 days each, then could freely choose their targets from 110-150mg/dL for the last 5 days. Primary outcomes were safety measures and percent time 70-180mg/dL for the 5 days of HCL use with free choice of target, as well as for the first 9 days of HCL use stratified by target glucose.
Results: Participants thus far (n=15) had a mean±SD age of 11±2y, T1D duration 5±3y, and A1C 7.7±0.9%. Glycemic outcomes are shown in the Table. During the free choice period, participants primarily chose the 110mg/dL (69% of study time), 120mg/dL (10%), and 130mg/dL (21%) targets. For 72 patient-days of HCL use during the free choice period, percent time from 70-180mg/dL was 64.1±10.0%. Percent time <70mg/dL was low: 0.9±1.2% overall and 0.5±0.5% overnight. At the 130, 140, and 150mg/dL targets, percent time from 70-180mg/dL was 63.4±7.9%, 64.2±11.6%, and 52.1±11.7%, respectively. Percent time <54 and <70mg/dL was low and tended to decrease with increased target. There were no severe adverse events.
Conclusion: The HCL system was safe and performed well in children with T1D when used at home for 5 days with free choice of target glucose, as well as when used with higher glucose targets. Participants were invited to continue in a 3mo outpatient study of the system, which is currently underway.

Clinical Trial Registration Number: NCT04176731
Supported by: Insulet Corporation
Disclosure: G.P. Forlenza: Employment/Consultancy; Insulet, Medtronic, Tandem, Dexcom, Lilly. Grants; Insulet, Medtronic, Tandem, Dexcom, Lilly, Abbott.
174
Novel fully automated fiasp-plus-pramlintide artificial pancreas for type 1 diabetes: randomised controlled trial
M. Tsoukas1, D. Majdpour2, J. Rutkowski3, A. El Fathi3, J.-F. Yale1, N. Garfield1, L. Legault4, A. Haidar3;
1Medicine, Division of Endocrinology and Metabolism, McGill University, Montreal, 2Biomedical Engineering, McGill University, Montréal, 3Biomedical Engineering, McGill University, Montreal, 4Pediatrics, Division of Endocrinology, McGill University, Montreal, Canada.
Background and aims: Current artificial pancreas systems improve glycemic control in type 1 diabetes but still require manual entry of meal carbohydrate content, which is a burdensome, error-prone task. We aimed to alleviate this burden by developing a novel fully automated fiasp-plus-pramlintide artificial pancreas.
Materials and methods: We conducted a randomized crossover non-inferiority trial comparing (i) a fully automated fiasp-and-pramlintide artificial pancreas and (ii) fiasp-alone hybrid artificial pancreas with carbohydrate-matched meal boluses, in 23 adults with type 1 diabetes (age 35±15 years, HbA1c 8.1±1.4%). Fiasp and pramlintide were delivered using a novel dosing algorithm at a fixed ratio (10 μg/u) to mimic a co-formulation. Each participant completed two 24-hour inpatient interventions in which participants ate a self-selected snack (31g±8g), breakfast (51g±21g), lunch (74g±21g), and dinner (77g±22g). Half of the participants in the afternoon completed 40 minutes of moderate exercise. The primary outcome was time in target 3.9-10.0 mmol/L.
Results: The fully automated system achieved similar time in target (71%) compared to fiasp-alone hybrid system (75%, p=0.47), but with less insulin delivery (53u, 64u, p=0.0034) and less time <3.9 mmol/L (median 0%, 1.4%, p=0.039). The fully automated system achieved comparable time >10 mmol/L compared to the fiasp-alone hybrid system (27%, 22%, respectively; p=0.29), as well as comparable >13.9 mmol/L (6.5%, 5.7%, respectively; p=0.80) and time >16.7 mmol/L (1.8, 2.3, respectively; p=0.81). During the day, the fully automated system had a slightly higher time above >10 mmol/L compared to hybrid fiasp-alone system (5 hours, 3.6 hours; p=0.099) but similar time >13.9 mmol/L (1.3 hours, 1 hours; p=0.62) and similar time >16.7 mmol/L (0.48 hours, 0.36 hours; p=0.76). Non-mild nausea was reported by 3 participants (13%) with the fully automated system compared to 0 with the fiasp-alone system.
Conclusion: Our novel fiasp-and-pramlintide artificial pancreas is fully automated and non-inferior to the first-generation fiasp-alone hybrid artificial pancreas that requires carbohydrate counting

Clinical Trial Registration Number: NCT03800875
Supported by: Diabetes Canada
Disclosure: M. Tsoukas: Grants; Eli Lilly and Company. Lecture/other fees; Novo Nordisk.
OP 30 Understanding the mechanisms of diabetic kidney disease
175
The protective effect of bone marrow mesenchymal stem cells on diabetic nephropathy modulated by macrophage polarisation
S. Wang, J. Xie, X. Yu;
Department of Endocrinology, Tongji Hospital, Huazhong University of Science & Technology, Wuhan, China.
Background and aims: The accumulation of M1 macrophages in kidney tissues plays an important role in the development of diabetic nephropathy (DN), while mesenchymal stem cells (MSCs) have been found to exert immune-modulatory characteristics. We aim to identify that MSCs may ameliorate DN by converting M1 macrophages to M2 macrophages in kidney, and further to explore the mechanism of MSCs on modulating macrophage polarization.
Materials and methods: C57BL/6J mice were used to induce DN models with a combination of high-fat diet and low-dose streptozotocin. The mice were treated with MSCs (5×10⁵, once every two weeks for six times) or saline via tail vein. Blood and urine were measured. Periodic acid-Schiff staining (PAS) and immunostaining of renal tissues was performed. The gene expressions of pro-inflammatory and pro-fibrosis factors in renal tissues were determined by real-time reverse transcription-polymerase chain reaction (RT-PCR). In vitro study we explored whether MSCs and MSCs conditioned medium (MSC-CM) could modulate the macrophage polarization under inflammatory condition using flow cytometric analysis, RT-PCR, as well as Western Blot.
Results: Serum creatinine and urinary microalbumin to creatinine ratio were significantly reduced in DN group with MSCs treatment (p < 0.05). The PAS indicated that the glomerulosclerosis was dramatically attenuated (p < 0.05). The gene expression of inflammatory factors including fibronectin (FN) and transforming growth factor-β1 (TGF-β1) , interleukin (IL)-1β, tumor necrosis factor-α (TNF-α) and inducible nitric oxide synthase (iNOS) were reduced (p < 0.05). Interestingly, immuohistochemtry showed the expression of CD163, an M2 maker, was extremely increased in kidney (p < 0.01). However, the expression of iNOS, an M1 marker, were significantly decreased (p < 0.001). In vitro study, the M2 makers such as arginase-1 (Arg1) and CD206 gene expression were markedly increased in MSCs and MSC-CM treatment group (p < 0.05). In contrast, the M1 makers such as TNF-α and iNOS gene expression were extremely decreased (p < 0.05). In addition, the protein expression of phosphorylation of p65 and inhibitor of nuclear factor kappa-B kinase-α (IKK-α) were significantly decreased in macrophage treated with MSCs and MSC-CM under inflammatory condition (p < 0.001).
Conclusion: Our results found that MSCs had the protective effect on DN by switching the macrophages phenotype from M1 to M2. MSCs could ameliorate the renal inflammation and fibrosis by inducing macrophage polarization via NF-κB signal pathway.
Supported by: NSFC
Disclosure: S. Wang: None.
176
Activation of the adiponectin receptor ameliorates glomerular inflammation and injury
S.H. Lindfors1, Z. Polianskyte-Prause1, E. Lehtonen2, J. Tienari3, H. Nisen4, T. Mirtti3,5, S.H. Lehtonen1,2;
1Research Program for Clinical and Molecular Metabolism, Faculty of Medicine, University of Helsinki, Helsinki, 2Department of Pathology, University of Helsinki, Helsinki, 3Department of Pathology, University of Helsinki and Helsinki University Hospital, Helsinki, 4Department of Urology, Helsinki University Hospital, Helsinki, 5Research Program in Systems Oncology, Faculty of Medicine, University of Helsinki, Helsinki, Finland.
Background and aims: Chronic low-grade inflammation contributes to the pathogenesis of diabetic kidney disease. One of the diabetes-related factors inducing chronic inflammation is increased serum levels of bacterial lipopolysaccharides (LPSs). Type 2 diabetes (T2D) associates with lowered serum levels of adipose tissue-derived adiponectin. As adiponectin has anti-inflammatory properties, its deficiency may support chronic inflammation and predispose to the development of glomerular injury. Thus, we investigated whether activating the adiponectin receptor with a specific agonist, AdipoRon, ameliorates glomerular inflammation in a mouse model of T2D, and studied in podocytes in vitro and in human glomeruli ex vivo whether AdipoRon protects against LPS-induced inflammation and injury.
Materials and methods: Mouse study: DBA/2J mice were fed with low fat diet (LFD), high fat diet (HFD), or HFD supplemented with AdipoRon, for 9 weeks. In vitro study: Differentiated human podocytes (AB8/13) were pre-treated with AdipoRon for 2 hours and exposed to Escherichia coli LPS for additional 1, 24 or 48 hours. Protein expression was studied by immunoblotting and TNFα secretion by ELISA. Apoptosis was studied by AnnexinV/7-AAD staining followed by flow cytometry and cell migration by a scratch assay. Ex vivo study: Human glomeruli were isolated from non-cancerous parts of surgical nephrectomies from 5 subjects without T2D and 4 patients with T2D, resuspended in culture media and treated with LPS or LPS and AdipoRon for 24 hours. Secreted cytokines were measured by multiplex ELISA.
Results: AdipoRon treatment reduced HFD-induced weight gain in mice. HFD-fed mice had elevated blood glucose and serum LPS levels while HFD-fed mice receiving AdipoRon did not differ from LFD-fed mice. HFD alone and with AdipoRon supplementation induced a mild increase in albuminuria, whereas AdipoRon treatment reduced HFD-induced glomerular hypertrophy. Immunohistochemical analyses showed that AdipoRon reduced HFD-induced glomerular expression of TGFβ, fibronectin, phospho-NFκB and F4/80, indicating downregulation of inflammation and fibrosis. Transmission electron microscopy analysis of mouse renal tissue revealed that AdipoRon reduced the thickness of glomerular basement membrane and effacement of podocyte foot processes. In cultured podocytes, AdipoRon prevented LPS-induced upregulation of phospho-NFκB, phospho-JNK and phospho-p38 expression, secretion of TNFα, migration and apoptosis. In isolated human glomeruli, LPS increased and AdipoRon reduced the secretion of inflammatory cytokines IL-1β, IL-6, IL-8, IL-10, IL-18, TNFα and VEGF-A.
Conclusion: AdipoRon ameliorated inflammation and injury in the glomeruli of HFD-fed mice and in cultured podocytes and isolated human glomeruli stimulated with LPS. Our findings suggest that activating the adiponectin receptor by AdipoRon is a potent strategy to lower glomerular inflammation and thereby prevent inflammation-related renal injury in obesity and T2D.
Supported by: Finnish Cultural Foundation, Finnish Kidney Foundation, Finnish-Norwegian Medical Foundation
Disclosure: S.H. Lindfors: Grants; Finnish Cultural Foundation; Päivikki and Sakari Sohlberg Foundation, Finnish-Norwegian Medical Research Foundation; Finnish Kindey Foundation.
177
Long non-coding RNA MALAT1 mediates endothelial-to-mesenchymal transition and kidney fibrosis
R. Bijkerk1, A. Lafzi2, Y.W. Au1, W. Stam1, J.M.G. Duijs1, A. Koudijs1, E. Lievers1, T.J. Rabelink1, H. Kazan2, A.J. van Zonneveld1;
1Leiden University Medical Center, Leiden, Netherlands, 2Antalya International University, Antalya, Turkey.
Background and aims: Diabetic nephropathy (DN) associates with the development of renal interstitial fibrosis characterized by a loss of the microvasculature and myofibroblast formation. Endothelial cells (ECs) are important for maintaining a healthy microvasculature while ECs also provide a potential source for myofibroblasts through endothelial-to-mesenchymal transition (EndoMT). Here, we aimed to identify a role for long non-coding RNAs (lncRNAs), novel central post-transcriptional regulators, in ECs in the development of kidney fibrosis.
Materials and methods: We used VE-cadherin-ERT2;tdTomato mice to label and trace endothelial cells. We applied both the ischemia-reperfusion injury (IRI) and unilateral urethral obstruction (UUO) models followed by FACS sorting of the tomato-positive cells from healthy and diseased kidneys. Subsequently, we isolated RNA from these cells and profiled for lncRNAs, which identified the conserved MALAT1 as a potential key mediator of kidney fibrosis. Functional in vitro and in vivo studies were performed to assess the role of MALAT1 in EC function and kidney fibrosis.
Results: Upon kidney injury, we observed substantial co-localization of VE-cadherin-derived tomato positive signal with a-SMA staining, indicating that a significant portion (~15-20%) of myofibroblasts originated from ECs. We confirmed that ECs acquired a myofibroblast phenotype by using qPCR on FACS sorted tomato-positive cells showing reduced expression of EC markers CD31 and VE-cadherin while myofibroblast markers α-SMA and col1α1 increased. In UUO and IRI, we found 586 and 416 lncRNAs to be differentially expressed (>2-fold, p<0.05) in the VE-cadherin-derived tomato-positive cells, respectively. Using bioinformatics analyses to determine transcription factor motif-enrichment amongst differentially expressed lncRNAs we found strong enrichment for HMGA1 binding sites. Using ChIP-seq, we confirmed this enrichment of HMGA1 binding sites in the promoters of differentially regulated lncRNA, including MALAT1. In vitro, we demonstrated that MALAT1 disrupts EC homeostasis, as silencing MALAT1 resulted in increased barrier function, less leakage and less EndoMT. In vivo, we found that gapmer-mediated knockdown of MALAT1 abrogated kidney fibrosis. Lastly, we found both renal and circulating MALAT1 levels to be increased in DN patients compared to healthy controls.
Conclusion: We demonstrated that MALAT1 is important for endothelial cell function and may provide novel strategies to counteract the development of diabetic nephropathy.
Supported by: EFSD/Boehringer Ingelheim Clinical European Diabetes Research Programme and Dutch Kidney Foundation
Disclosure: R. Bijkerk: Grants; European foundation for the study of diabetes, Dutch Kidney Foundation (Kolff grant).
178
Rock1/ampk axis regulates the development of diabetic kidney disease via modulation of fatty acid utilisation
Y. Nagai, K. Matoba, Y. Takeda, T. Akamine, Y. Kanazawa, T. Yokota, K. Utsunomiya, R. Nishimura;
Division of Diabetes, Metabolism, and Endocrinology, Department of Internal Medicine, The Jikei University School of Medicine, Tokyo, Japan.
Background and aims: The small GTPase Rho and its effector Rho-kinase are involved in the pathogenesis of diabetic glomerulosclerosis. Accumulating evidence shows that renal dysfunction in diabetic patient is associated with abnormal fatty acid oxidation in the kidney. However, the interaction of Rho-kinase and fatty acid oxidation in diabetic kidney remain unclear. In this study, we aimed to investigate the contribution of Rho-kinase to fatty acid utilization in mesangial cells.
Materials and methods: 8-weeks-old mice were divided into the following groups: nondiabetic db/m mice, diabetic db/db mice, and db/db mice treated with the Rho-kinase inhibitor, fasudil. Fasudil was administered in drinking water (100 mg/kg/day). Fasudil treatment was continued for 16 weeks. Mice were euthanized at 24 weeks of age.
Results: Glomeruli isolated from type 2 diabetic db/db mice demonstrated decreased gene expression of fatty acid oxidation mediators such as peroxisome proliferator-activated receptor gamma coactivator 1-alpha (PGC-1α), CD36, carnitine palmitoyltransferase 1A (CPT1A). Chemical inhibition of Rho-kinase restored expression of fatty acid oxidation-related genes in both isolated glomeruli and cultured mesangial cells. An investigation of mechanisms underlying this observation revealed that Rho-kinase mediates phosphorylation of AMPK and thus increases the expression of PGC-1α. Extracellular flux analyzer demonstrated that Rho-kinase inhibition improves TGF-β-induced mitochondrial dysfunction. Furthermore, Rho-kinase inhibitor suppresses ROS production as a result of mitochondrial damage due to abnormal fatty acid metabolism. Knockdown by small interfering RNA against each Rho-kinase isoform, ROCK1 or ROCK2, showed that ROCK1 but not ROCK2 controls this metabolic machinery. Consistent with this result, mesangial cells isolated from ROCK1 deficient mice were protected from TGF-β-mediated downregulation of fatty acid metabolism. These observations indicate that ROCK1 is a key player in the development of diabetic renal injury.
Conclusion: Glomerular ROCK1 may be a potential therapeutic target for the treatment of diabetic kidney disease.
Disclosure: Y. Nagai: None.
179
The role of the Irisin-AMPK axis in the improvement of diabetic nephropathy in exercised rats
G.P. Formigari, M.N. Dátilo, J.M. Lopes de Faria, J.B. Lopes de Faria;
Faculty of Medical Sciences, State University of Campinas, Campinas, Brazil.
Background and aims: Several studies suggest that a reduction in AMP kinase (AMPK) activity in diabetes could contribute to the development and progression of diabetic nephropathy (DN). Clinical and experimental studies also suggest that physical activity can improve the markers of DN. Moreover, physical activity activates AMPK in skeletal muscle to promote glucose uptake and stimulate the secretion of some hormones (i.e., miokynes), such as irisin. Various animal models of chronic kidney disease have recently shown that elevation in irisin could reduce kidney fibrosis. However, the mechanism by which physical activity improves DN is not well understood. Therefore, this study aims to investigate the contribution of the irisin-AMPK axis to the amelioration of DN in diabetic rats that were submitted to an exercise program.
Materials and methods: Wistar rats (eight weeks of age) were rendered diabetic through an intravenous injection of streptozotocin. Rats were allocated to three groups: control (CT, non-diabetic), sedentary diabetic (DM) and diabetic animals submitted to an exercise training protocol on a treadmill (DM+Exe) for eight weeks. At the end of the experimental period, the renal cortex and muscle (gastrocnemius) were harvested to assess kidney inflammation and fibrotic parameters, the activity of the AMPK and the expression of the irisin using Western blot and immunohistochemistry (IHQ) techniques. The AMP and ATP levels were determined using HPLC.
Results: The DM rats showed a decrease in body weight compared with the CT rats (p < 0.05). The fasting blood glucose (78 ± 10 mg/dL vs. 497 ± 68 mg/dL) and albuminuria (2.4 ± 0.3 mg/g vs. 3.3 ± 0.6 mg/g) were higher (P < 0.05) in the DM rats compared with the CT rats. Exercise did not modify the body weight or blood glucose levels. However, the DM+Exe rats displayed a decrease in albuminuria (3.3 ± 0.6 mg/g vs. 2.5 ± 0.7 mg/g, P = 0.04) and systolic blood pressure (161 ± 18 mmHg vs. 141 ± 18 mmHg, P = 0.03) compared with the DM rats. The kidney weight, glomerular volume and renal expression of the fibronectin and collagen type IV were higher in the DM rats compared with the CT rats (P < 0.05). Exercise training reduced the glomerular volume and kidney expression of the fibronectin and collagen type IV compared with the DM rats (P < 0.05). The exercised rats also showed a reduction in the following kidney inflammation parameters: the acetylation of NF-κB (p65), the expression of TNF-α, renal macrophage infiltration (IHQ for F4/80) and cleavage of caspase-1 when compared with the DM rats (P<0.05). Furthermore, exercise increased kidney phosphorylation of threonine 172 AMPKα (p-T172AMPK), the expression of sirtuin 1 (SiRT1) and the association of SiRT1 with NF-κB (p65) (P < 0.05). In the gastrocnemius, the DM rats showed a decrease in phosphorylation of serine79 ACC (p-S79ACC), in a marker of mitochondrial biogenesis (PGC1-α) and irisin compared with CT rats (P < 0.05). The exercised rats showed an increase in muscle AMPK activity, as assed by the p-T172AMPK and p-S79ACC, which is associated with an elevation in the AMP/ATP ratio and the expression of PGC1-α and irisin, compared with DM rats (P < 0.05).
Conclusion: These results indicate that exercise can attenuate markers of DN and kidney inflammation in diabetic rats, which may be mediated by cross-talk between the muscle and the kidney and is promoted by an elevation in irisin and the activity of AMPK.
Supported by: FAPESP (14/22687-0) and CAPES
Disclosure: G.P. Formigari: None.
180
Erasing metabolic alteration in proximal tubular cells under hyperglycaemic condition using inducible CRISPR/Cas9 PGC1a hESC-derived 3D kidney organoids
C. Hurtado del Pozo1, P. Prado1, A. Gavalda-Navarro2, E. Garreta1, N. Montserrat1;
1Institute for Bioengineering of Catalonia, IBEC, Barcelona, 2Universidad de Barcelona, Barcelona, Spain.
Background and aims: There are about 60 million people with diabetes in the European Region. Among all the complications, Diabetic Nephropathy (DN) is the leading cause of end stage renal disease and it can explain most excess mortality associated with diabetes. From all the kidney cells type, proximal tubular renal cells (PTC) represent one of the most vulnerable cell types in DN due to its high-energy demand. Due to the increasing evidences which suggest that the metabolic state of a cell contributes to disease development we hypothesize that diabetic nephropathy (DN) is promoted by the metabolic alterations (hyperglycaemia) occurring during kidney development mainly in PTCs. We propose that these metabolic alterations can be erased modifying the intracellular metabolic profile of the kidney cells in a mitochondrial metabolism-dependent manner.
Materials and methods: Kidney organoid differentiation: Differentiation protocol was developed in our lab. Isolation of tubular epithelial cells from organoids was performed by flow cytometry. Purification of Total RNA and Quantitative RT-PCR was performed using Tri-Reagent following manufacturer’s recommendations. cDNAs (25 ng/well) were used to quantify gene expression by Quantitative RT-PCR. Seahorse Cell Mito Stress Test was performed to measure Oxygen Consumption rate (OCR) in Kidney organoids and tubular renal cells .
Results: To check if hyperglycaemia has an effect in the development of PTC in kidney organoids, we cultured them under oscillatory glucose levels versus constant normal glucose for 7 days at day 16 of differentiation. Preliminary results showed that kidney organoids treated under oscillatory glucose had lower expression of PTC makers and lower number of PTCs than control kidney organoids analysed by RT-PCR and flow cytometry analysis, respectively. In order, to characterize PTCs from oscillatory glucose versus control kidney organoids, we isolated and cultured them in renal epithelial cell growth medium (normal glucose concentration) for a month. PTC isolated from diabetogenic kidney organoids showed higher oxygen consumption rate than PTC from control group. No changes were found in mitochondria copy number neither in oxidative phosphorylation (OXPHOS) complexes expression by western blot. However, we found lower expression of the mitochondrial master regulator PGC1a in PTC from diabetogenic organoids by RT-PCR and immunofluorescence.Into the light of the results we generated an inducible CRISPR/Cas9 engineered line for PGC1α. Overexpression of PGC1a during kidney organoid development showed higher expression of tubular markers such as SLC3A1 and AQ1 analysed by RT-PCR however we did not find differences at PTCs number by flow cytometry. To study deeply the effect of PGC1a under hyperglycaemic condition. PTC from PGC1a inducible CRISPR/Cas9 kidney organoids cultured under diabetogenic condition rescued the expression of PGC1a and the oxygen consumption rate of the PTC.
Conclusion: In conclusion, this preliminary work showed: 1) metabolic programming plays a role in the development of PTC from kidney organoids, in the context of hyperglycaemia 2) PGC1a inducible CRISPR/Cas9 kidney organoids could have a protective role under diabetogenic condition rescuing the PGC1a expression and the oxygen consumption rate of the PTC.
Supported by: Marie Skłodowska-Curie Individual Fellowships (IF) grant agreement no. 796590
Disclosure: C. Hurtado del Pozo: None.
OP 31 Novel aspects of diabetic neuropathy
181
Altered mitochondrial activity in the thalamus and somatosensory cortex in painful diabetic peripheral neuropathy
G. Sloan1, A. Anton2, D. Selvarajah3, I. Wilkinson2, S. Tesfaye1;
1Sheffield Teaching Hospitals, Sheffield, 2Academic Unit of Radiology, Sheffield, 3Department of Oncology and Human Metabolism, Sheffield, UK.
Background and aims: Painful diabetic peripheral neuropathy (pDPN) is common and often causes unremitting, distressing painful neuropathic symptoms. Unfortunately, current management of the disorder is inadequate because the disease mechanisms are not fully understood. We assessed cerebral cellular bioenergetics using phosphorus magnetic resonance spectroscopy (31P-MRS) to determine whether high energy phosphate metabolite levels are altered in the pain processing regions of the brain in pDPN.
Materials and methods: A total of 56 subjects, 44 with type 2 diabetes (12 no-DPN, 13 painless-DPN and 19 pDPN) and 12 healthy volunteers, underwent detailed clinical and neurophysiological assessments, and 31P-MRS brain imaging at 3-Tesla (Ingenia, Phillips Healthcare) with voxels placed over the right somatosensory cortex and the thalamus (TR 4s, TE 0.26ms, Voxel size 25 x 25 x 40mm3). The AMARES method, in jMRUI software was employed to calculate ATP to phosphocreatine (PCr) and inorganic phosphate (Pi) ratios (ATP:PCr & ATP:Pi), reflecting cellular bioenergetics (mitochondrial function).
Results: There was a significant group effect in the ATP:PCr ratio at the thalamus (p=0.039) and somatosensory cortex (p=0.024). The ATP:PCr at the thalamus was significantly higher in the pDPN group (0.50±0.06) compared to HV (0.44±0.04, p=0.022) and no-DPN (0.42±0.07 p=0.014). Moreover, the ATP:PCr ratio at the somatosensory cortex was significantly higher in pDPN (0.48 ±0.1) compared to HV (0.38 ±0.1, p=0.011). In addition, the ratio correlated with the Neuropathic Pain Symptom Inventory score at both brain regions.
Conclusion: Despite considerable research into the mechanisms of pDPN, our understanding remains limited. This study is the first to use 31P-MRS to analyse cerebral energetics in human-DPN and peripheral painful neuropathies. We demonstrated significantly higher ATP:PCr ratios in patients with pDPN in the somatosensory cortex and thalamus, which correlated with neuropathic pain symptom intensity. This could be indicative of increased cellular energy usage in pain processing regions of the brain as a result of continuous nociceptive inputs. Altered cerebral phosphorus metabolite ratios may serve as a biomarker of neuropathic pain in diabetes.
Disclosure: G. Sloan: None.
182
Symptoms of peripheral neuropathy early in type 2 diabetes are associated with higher risk of subsequent cardiovascular disease
L. Bjerg1,2, D.H. Christensen3, S.K. Nicolaisen3, J.S. Nielsen4,5, S.T. Andersen2,6, M.E. Jørgensen7,8, T.S. Jensen6,9, A. Sandbæk1,2, H. Andersen9, H. Bech-Nielsen4,5, H.T. Sørensen3, D.R. Witte1,2, R.W. Thomsen3, M. Charles1,10;
1Steno Diabetes Center Aarhus, Aarhus, 2Department of Public Health, Aarhus University, Aarhus, 3Department of Clinical Epidemiology, Aarhus University Hospital, Aarhus, 4DD2, Steno Diabetes Center Odense, Odense, 5Department of Endocrinology, Odense University Hospital, Odense, 6Department of Clinical Medicine, Danish Pain Research Center, Aarhus C, 7Clinical Epidemiology, Steno Diabetes Center Copenhagen, Gentofte, 8National Institute of Public Health, University of Southern Denmark, Odense, 9Department of Neurology, Aarhus University Hospital, Aarhus, 10Research Unit of General Practice, Aarhus C, Denmark.
Background and aims: Diabetic peripheral neuropathy (DPN) may be a determinant of subsequent cardiovascular disease (CVD) and mortality. We examined whether symptoms of DPN early in type 2 diabetes may act as a marker of later CVD and all-cause mortality.
Materials and methods: This cohort study linked clinical data from two Danish type 2 diabetes cohorts, the ADDITION-DK (inclusion period 2001-2006) and the DD2 (inclusion period 2009-2016), with data from Danish national registers. DPN was assessed at a median diabetes duration of 0 years in ADDITION-DK (=screen-detected diabetes) and at 4.6 years in DD2, using the Michigan Neuropathy Screening Instrument questionnaire (MNSIq) with a score ≥ 4 indicative of DPN. Using Poisson regression models, we compared the incidence of CVD and all-cause mortality during follow-up, according to initial DPN status. Analyses were adjusted for well-known CVD risk factors at baseline and fixed-effect meta-analyses were used to estimate combined results from the two cohorts.
Results: In total, 6,476 individuals were included in the analysis (NADDITION-DK = 1,448 and NDD2 = 5,028). At baseline, 189 (13.1%) individuals in ADDITION-DK and 818 (16.2%) in DD2 had DPN. The median follow-up was 11.4 years and 2.2 years, respectively. In ADDITION-DK, a total of 394 individuals experienced a CVD event (IRMNSIq<4: 27.4/1000 person-years (PY), IRMNSIq≥4: 50.9/1000 PY) and 253 died (MRMNSIq<4: 16.4/1000 PY, MRMNSIq≥4: 17.1/1000 PY). The corresponding numbers in the DD2 cohort were 480 (IRMNSIq<4: 41.1/1000 PY, IRMNSIq≥4: 77.2/1000 PY) and 127 (MRMNSIq<4: 11.4/1000 PY, MRMNSIq≥4: 13.7/1000 PY), respectively. After confounder adjustment, the combined estimate for excess CVD risk with DPN was 65% (IRR=1.65, 95% CI: 1.39-1.95) and for mortality 11% (MRR= 1.11, 95% CI: (0.82-1.49), compared to those without DPN (Table 1).
Conclusion: Symptoms indicating DPN early in type 2 diabetes are associated with a clearly elevated risk of subsequent CVD, beyond the risk carried by well-known CVD risk factors. DPN may act as a marker for undetected determinants of CVD and may contribute to early identification of type 2 diabetes individuals with high CVD risk.

Clinical Trial Registration Number: 20000183 and 1-10-72-63-15
Supported by: NNF, IDNC Research program
Disclosure: L. Bjerg: None.
183
Associations of cardiac autonomic dysfunction with higher plasma lipid metabolites in recent-onset type 2 diabetes
G.J. Bönhof1,2, A. Strom1,3, K. Straßburger4,3, B. Knebel5,3, J. Kotzka5,3, J. Szendroedi1,2, M. Roden1,2, D. Ziegler1,2;
1Institute for Clinical Diabetology, German Diabetes Center (DDZ), Leibniz Center for Diabetes Research at Heinrich Heine University, Düsseldorf, 2Division of Endocrinology and Diabetology, Medical Faculty, Heinrich Heine University, Düsseldorf, 3German Center for Diabetes Research (DZD), Munich-Neuherberg, 4Institute for Biometrics and Epidemiology, German Diabetes Center (DDZ), Leibniz Center for Diabetes Research at Heinrich Heine University, Düsseldorf, 5Institute for Clinical Biochemistry and Pathobiochemistry, German Diabetes Center (DDZ), Leibniz Center for Diabetes Research at Heinrich Heine University, Düsseldorf, Germany.
Background and aims: Emerging evidence suggests that obesity and insulin resistance play a role in the development of diabetic cardiac autonomic neuropathy (CAN) characterized by reduced heart rate variability (HRV). We hypothesized that specific lipid metabolites are associated with diminished HRV in recent-onset type 2 diabetes rather than type 1 diabetes.
Materials and methods: We assessed the relationship of 127 biomarkers of lipid metabolism (11 acylcarnitines, 39 free fatty acids, 12 sphingomyelins, 56 phosphatidylcholines, and 9 lysophosphatidylcholines) in plasma using mass spectrometry with HRV indices in individuals with recent-onset type 1 (T1D) or type 2 diabetes (T2D) from the baseline cohort (known diabetes duration (DD) ≤1 year) of the German Diabetes Study (GDS; T1D/T2D [mean±SD]: n=100/206; age: 34.5±13.0/53.5±10.9 years; BMI: 24.6±4.2/31.8±6.0 kg/m²; DD: 204±95/195±88 days; HbA1c: 6.8±1.4/6.5±0.9 %). Four time domain and three frequency domain HRV indices were derived from NN intervals recorded during a 3-h hyperinsulinemic-euglycemic clamp.
Results: After adjustment for age, sex, BMI, smoking status, antihypertensive drugs, and lipid lowering drugs as well as Bonferroni correction including seven HRV parameters and the number of metabolites of the corresponding lipid class, standard deviation of all NN intervals (SDNN) was inversely associated with higher levels of three free fatty acids (myristic acid: r=-0.262, p=0.0002; palmitic acid: r=-0.278, p<0.0001; palmitoleic acid: r=-0.271, p<0.0001), six phosphatidylcholines (e.g. phosphatidylcholine diacyl (PC aa) C32:0: r=-0.345, p<0.0001; phosphatidylcholine acyl-alkyl C36:0 r=-0.286, p<0.0001), and two sphingomyelins (sphingomyelin C16:0: r=-0.242, p=0.0005; sphingomyelin C16:1: r=-0.302, p<0.0001), while standard deviation of adjacent NN invervals (SD) was inversely associated with six phosphatidylcholines (e.g. PC aa C30:0: r=-0.266, p=0.0001; PC ae C36:0: r=-0.271; p<0.0001) and one sphingomyelin (sphingomyelin C16:1: r=-0.292, p<0.0001) in recent-onset T2D. Among the frequency domain HRV indices, very low frequency (VLF), high frequency (HF), and low frequency (LF) power were associated with five (e.g. PC aa C32:0: r=-0.349), two (e.g. PC ae C36:0: r=-0.260), and one (PC aa C32:0: r=-0.295) phosphatidylcholines, respectively, in recent-onset T2D (all P<0.05). In contrast, no associations of lipid metabolites with HRV measures were noted recent-onset T1D.
Conclusion: Higher plasma levels of specific lipid metabolites are closely linked to cardiac autonomic dysfunction in recent-onset type 2 as opposed to type 1 diabetes, suggesting a role for perturbed lipid metabolism in the early development of CAN in type 2 diabetes.
Disclosure: G.J. Bönhof: None.
184
Effects of intensive risk factor management on cardiovascular autonomic neuropathy in type 2 diabetes: findings from the ACCORD clinical trial
R. Pop-Busui1, Y. Tang2, H. Shaw2, C.R. Bueno2, X. Sun2, J. Mitri2, M. Sambataro3, L. Sambado3, H.C. Gerstein4, V. Fonseca5, A. Doria2;
1Endocrinology & Diabetes, University of Michigan, Ann Arbor, USA, 2Joslin Diabetes Center, Boston, USA, 3Maria of Ca’ Foncello Hospital, Treviso, Italy, 4Endocrinology & Diabetes, McMaster University, Hamilton, Canada, 5Endocrinology & Diabetes, Tulane University, New Orleans, USA.
Background and aims: Cardiovascular autonomic neuropathy (CAN) is a common complication that independently predicts cardiovascular (CV) morbidity and mortality in persons with type 2 diabetes (T2D). The effects of preventive interventions on CAN remain unclear. We examined the effect of intensively targeting traditional risk factors for CAN, including hyperglycemia, hypertension, and dyslipidemia, in persons with T2D and high CV risk participating in the Action to Control Cardiovascular Risk in Diabetes (ACCORD) trial
Materials and methods: CAN was defined as heart rate variability indices below the 5th percentile of the normal distribution (standard deviation of all normal-to-normal R-R intervals [SDNN] <8.2 ms and root mean square of successive differences between normal-to-normal R-R intervals [rMSSD] <8.0 ms). Of the 10,250 ACCORD participants, 71% (n=7,275) had valid CAN evaluations at study entry and at least once after randomization. The effects of intensive interventions on CAN were tested among these subjects by means of generalized linear mixed models.
Results: As compared to standard treatment, the intensive glycemia intervention significantly reduced CAN risk during the entire duration of the study (OR=0.84, 95% CI 0.75 - 0.94, p=0.003). This effect was present among individuals with no cardiovascular disease (CVD) history (OR= 0.73, 95%CI 0.63 - 0.85, p<0.0001) but not among those with a positive CVD history (OR=1.10, 95% CI 0.91 - 1.34, p=0.34) (p for interaction=0.001). Intensive BP therapy also decreased the odds of CAN (OR=0.75, 95% CI 0.63 - 0.89, p=0.001), with no evidence of heterogeneity based on CVD history or other clinical characteristics. Fenofibrate did not have a significant impact on CAN outcome (OR=0.91, 95%CI 0.78 - 1.07, p=0.26). No significant interactions were observed between treatment strategies
Conclusion: Our data confirm the beneficial effect of intensive glycemic therapy anddemonstrate, for the first time, a similar benefit of intensive BP control on CAN in T2D. They also suggest that a negative CVD history could be used as a criterion to select those T2D patients who would most benefit from intensive glycemic control for CAN prevention, whereas BP control is effective regardless of CVD history.
Clinical Trial Registration Number: NCT00000620
Supported by: NIHLBI, NIDDK
Disclosure: R. Pop-Busui: None.
185
Statin therapy and risk of polyneuropathy in type 2 diabetes: a population-based cohort study
D.H. Christensen1,2, F.P. Kristensen1,2, B.C. Callaghan2,3, S.T. Knudsen4, S.H. Sindrup2,5, E.L. Feldman2,3, L. Østergaard2,6, H. Andersen2,7, T.S. Jensen2,7, H.T. Sørensen1, R.W. Thomsen1;
1Department of Clinical Epidemiology, Aarhus University, Aarhus, Denmark, 2The International Diabetic Neuropathy Consortium, Aarhus University, Aarhus, Denmark, 3Department of Neurology, University of Michigan, Ann Arbor, USA, 4Steno Diabetes Center Aarhus, Aarhus University Hospital, Aarhus, Denmark, 5Department of Neurology, Odense University Hospital, Odensen, Denmark, 6Department of Neuroradiology, Aarhus University Hospital, Aarhus, Denmark, 7Department of Neurology, Aarhus University Hospital, Aarhus, Denmark.
Background and aims: Statins may potentially reduce the risk of diabetic polyneuropathy (DPN) due to anti-inflammatory and lipid-lowering effects. Statins have also been reported to be neurotoxic. We examined whether statin therapy had impact on the risk of DPN in individuals with type 2 diabetes.
Materials and methods: Using Danish medical databases we conducted a population-based cohort study. We identified all Danish incident diabetes patients during 2002-2016. We then excluded those aged below 30 years at the time of their first diabetes record, as they were possible type 1 diabetes patients. New statin users were defined as filling their first statin prescription in an exposure window extending from 180 days before to 180 days after their first diabetes record. Prevalent statin users were defined as filling statin prescriptions both during and before that period. DPN was identified using previously validated hospital discharge diagnosis codes. Follow-up started 180 days after the first diabetes record. Cox proportional hazard analysis was used to compute adjusted hazard ratios (aHRs) for DPN.
Results: The study cohort comprised 59,255 (23%) statin new users, 75,528 (29%) statin prevalent users, and 124,842 (48%) statin non-users; median follow-up time was 6.2 years [interquartile range (IQR) 3.4-9.6]. The incidence rate of DPN per 1000 person-years was almost similar in new users [4.0 events (95% confidence interval (CI): 3.8-4.2)], prevalent users [3.8 events (95% CI: 3.6-3.9)] and non-users [3.8 events (95% CI: 3.7-4.0)]. The aHR for DPN was 1.05 (95% CI: 0.98-1.11) in new users, and 0.97 (95% CI: 0.91-1.04) in prevalent users, compared with statin non-users. The null association persisted in on-treatment and propensity score-matched analyses, and in the subgroup analysis with additional adjustment for pre-treatment blood lipid levels. Stratification of the follow-up period revealed an increased DPN risk in new users during the first year of follow-up (aHR 1.31, 95% CI: 1.12-1.53). This vanished after ≥2 years of follow-up and may represent either a potential acute neurotoxic effect or a protopathic bias (i.e., early symptoms of yet undiagnosed DPN that trigger statin initiation).
Conclusion: This large cohort study suggested that among newly diagnosed type 2 diabetes patients, statin therapy was not associated with DPN risk. A small acute harmful effect cannot be excluded. This is outweighed by the substantial clinical effect of statins in cardiovascular disease prevention.
Supported by: Novo Nordisk Foundation Challenge Programme
Disclosure: D.H. Christensen: Grants; Novo Nordisk Foundation Challenge Programme.
186
Neuromodulation for treatment of painful diabetic neuropathy: a multicentre randomised controlled trial
E. Petersen, SENZA-PDN Investigators;
Neurosurgery, University of Arkansas for Medical Sciences, Little Rock, USA.
Background and aims: The World Health Organization (WHO) estimates there are 422 million people globally living with diabetes, resulting in US$1.7 trillion in direct and indirect costs. Approximately 20% of persons with diabetes will develop painful diabetic neuropathy (PDN), a chronic pain condition significantly impacting health-related quality of life (HRQoL). Current treatment options are ineffective for many patients; however, preliminary data suggest 10 kHz spinal cord stimulation (SCS) relieves pain and may improve sensation in refractory PDN patients.
Materials and methods: A prospective, multicenter, randomized, controlled trial (SENZA-PDN) with 216 subjects assigned 1:1 to 10 kHz SCS (Nevro Corp.) combined with conventional medical management (CMM) or CMM alone. Key inclusion criteria: PDN symptoms ≥12 months, lower limb pain ≥5cm (on 0-10cm visual analog scale [VAS]), and appropriate candidate for SCS. Key exclusion criteria: hemoglobin A1c >10%, daily opioid dosage >120mg morphine equivalents, and upper limb pain ≥3cm. Outcomes include pain, neurological function, HRQoL, sleep, satisfaction, and cost-effectiveness. Follow-up will last 24 months.
Results: Enrollment was completed from 2017 to 2019 with 430 candidates screened to randomize 113 subjects to 10 kHz SCS+CMM and 103 to CMM alone. The treatment arms were well matched across a variety of baseline characteristics, including age, sex, race, duration of diabetes and peripheral neuropathy, and hemoglobin A1c. There were no reported study-related adverse events (AEs) for the CMM group and 19 study-related AEs reported in the 10 kHz SCS+CMM group up to 3 months. Two AEs were categorized as serious: an infection resolved with conservative care and a wound dehiscence requiring explant. There were 2 procedure-related infections in the 10 kHz SCS+CMM group (1.8%). Per-protocol analysis revealed 5% of CMM (5/96) and 86% of 10 kHz SCS+CMM subjects (76/88) met the primary endpoint (p<0.001). At 3-month follow-up, there were differences in lower limb pain scores (Table 1), with 89% of 10 kHz SCS+CMM subjects deemed responders (≥50% pain relief) compared to just 7% of CMM subjects. Investigator-assessed sensory improvements were observed for 72% of 10 kHz SCS+CMM subjects versus 7% of CMM subjects. In addition, differences between treatment groups were observed across several HRQoL measures, such as impact of pain on sleep and patient global impression of change (Table 1).
Conclusion: SENZA-PDN is the largest RCT to-date of SCS management in PDN and will inform the treatment continuum. The primary endpoint was met with a significant proportion of subjects responding to 10 kHz SCS. These early results are promising for PDN patients who are refractory to conventional care. Study participant follow-up will continue for a total of 24 months with planned analyses for healthcare related costs and long-term clinical utility.

Clinical Trial Registration Number: NCT03228420
Supported by: Nevro
Disclosure: E. Petersen: Grants; Nevro.
OP 32 Reducing the burden of hypoglycaemia
187
Nasal glucagon was efficacious in reversing insulin-induced hypoglycaemia without increasing risk of secondary hyperglycaemia
M. Giménez1, Y. Yan2, Q. Wang2, C. Child2, M. Zhang2;
1Hospital Clínic i Universitari, Barcelona, Spain, 2Eli Lilly and Company, Indianapolis, USA.
Background and aims: Nasal glucagon, a ready-to-use therapy for treatment of severe hypoglycaemia, contains 3-mg glucagon dry powder absorbed passively through nasal mucosa. We evaluated efficacy, pharmacodynamics, and safety of nasal glucagon compared to injectable glucagon in reversing insulin-induced hypoglycaemia in Caucasian and Japanese adults with type 1 diabetes (T1D) or type 2 diabetes (T2D).
Materials and methods: Post hoc analyses used data from 2 randomised, cross-over studies. Treatment success was defined as an increase in blood glucose to ≥3.9 mmol/L or an increase of ≥1.1 mmol/L from nadir blood glucose within 15 minutes of receiving glucagon. Blood glucose was measured every 5 minutes for the first 30 minutes, every 10 minutes up to 60 minutes, and at varied extended time intervals thereafter. Time to treatment success does not include reconstitution and preparation time for injectable glucagon in the control group. Pharmacodynamic data, including area under the curve above 7.8 mmol/L (∆7.8 AUC [1-4 hr]), were used to evaluate the risk of secondary hyperglycaemia. Tolerability was assessed with treatment-emergent adverse events and a nasal symptom questionnaire.
Results: A similar proportion of nasal glucagon (97.8% [131/134)] and injectable glucagon patients (97.0% [130/134]) achieved treatment success. Mean time to treatment success (for blood glucose increase) was 11.7 minutes for nasal glucagon and 10.4 minutes for injectable glucagon (p<0.001). The median time for both nasal and injectable glucagon was 10 minutes. Geometric least square mean maximal blood glucose (BGMAX) for nasal glucagon and injectable glucagon were 10.8 and 11.4 mmol/L (p<0.001), respectively. Blood glucose concentrations over time for nasal glucagon and injectable glucagon are presented in the figure. Nasal glucagon had significantly lower ∆7.8 AUC (1-4 hr) (p<0.001), with 42% reduction compared to injectable glucagon. Nasal glucagon had similar rates of nausea (19.1%) and vomiting (8.5%) versus injectable glucagon (28.8% and 11.5%, respectively), with higher rates of side effects related to nasal administration (headache [7.8% nasal glucagon, 5.8% injectable glucagon], upper respiratory tract irritation [6.4% nasal glucagon, 0.7% injectable glucagon]). Separate T1D and T2D analyses showed similar results as the T1D+T2D groups combined.
Conclusion: Nasal glucagon was efficacious and well tolerated in reversing insulin-induced hypoglycaemia in adults with T1D or T2D and did not increase the risk of secondary hyperglycaemia compared to injectable glucagon.

Clinical Trial Registration Number: NCT03421379, NCT03339453
Supported by: Eli Lilly and Company
Disclosure: M. Giménez: None.
188
Counterregulatory responses to hypoglycaemia in totally pancreatectomised patients
M. Baekdal1,2, A. Lund1, M.P.A. Baldassare1,3, K. Rose1, J. Egholk1, M.B. Christensen1,4, C.P. Hansen5, J.H. Storkholm5, J. Faber6, B. Hartmann7,8, J.J. Holst7,8, T. Villsbøll1, F.K. Knop1;
1Center for Clinical Metabolic Research, Gentofte Hospital, Hellerup, Denmark, 2Department of Clinical Medicine, University of Copenhagen, Copenhagen, Denmark, 3Department of Medicine and Ageing Sciences, D’Annunzio University, Cheti, Italy, 4Department of Clinical Pharmacology, Bispebjerg Hospital, Copenhagen, Denmark, 5Department of Surgery, Rigshospitalet, Copenhagen, Denmark, 6Department of Endocrinology, Herlev Hospital, Herlev, Denmark, 7Department of Biomedical Sciences, University of Copenhagen, Copenhagen, Denmark, 8Novo Nordisk Foundation Center for Basic Metabolic Research, University of Copenhagen, Copenhagen, Denmark.
Background and aims: We have previously shown that totally pancreatectomised (PX) patients secrete substantial amounts of glucagon (most likely from enteroendocrine cells) during an OGTT whereas these patients suppress circulating glucagon concentrations during i.v. glucose infusions. Here, we investigated the effect of insulin-induced hypoglycaemia on extrapancreatic glucagon secretion and other counterregulatory factors in PX patients and in healthy controls (CTRLs).
Materials and methods: On two separate days, 12 PX patients (age 65.5±5.5 [mean±SD] years; BMI: 23.8±3.6 kg/m2; HbA1c 65.1±8.3 mmol/mol (10.6±1.5%)) and 12 matched, healthy CTRLs (age 64.8±6.5 years; BMI: 24.5±2.9 kg/m2; HbA1c 34.9±2.8 mmol/mol (5.8±0.5%)) underwent 1) a 50-g OGTT with 1.5 g paracetamol (for assessment of gastric emptying) and 2) an insulin-induced hypoglycaemic clamp followed by a 30-minute recovery period and a subsequent 50-g OGTT with paracetamol. Blood was intermittently sampled throughout both experimental days.
Results: Plasma glucagon responses to OGTT (as assessed by baseline-subtracted AUC) were greater in PX patients compared to CTRLs (386±150 vs -340±50 min×pmol/l [mean±SEM], p=0.0001). During the hypoglycaemic clamp, PX patients did not increase plasma glucagon concentrations and, thus, glucagon responses to hypoglycaemia were higher in CTRLs (903±104 vs -21±16 min×pmol/l, p<0.001). Hypoglycaemia-induced responses of catecholamines, growth hormone and cortisol were similar in the two groups. Gastric emptying was unaffected by hypoglycaemia in CTRLs but was decelerated by hypoglycaemia in PX patients.
Conclusion: We show that insulin-induced hypoglycaemia, which powerfully stimulates glucagon secretion in controls, does not stimulate extrapancreatic glucagon secretion in PX patients. Counterregulatory responses of catecholamines, growth hormone and cortisol were intact in PX patients, but hypoglycaemia decelerated gastric emptying in these patients. Our results provide a mechanistic insight into the high risk of hypoglycaemia in PX patients.
Clinical Trial Registration Number: H-17014216
Disclosure: M. Baekdal: None.
189
Amp-activated protein kinase (AMPK) activator R481 amplifies the glucagon response to hypoglycaemia without worsening hyperglycaemia in diabetic rats
C. Beall1, A.M. Cruz1, P.G. Weightman Potter1, J.M. Vlachaki Walker1, Y. Malekizadeh1, K.R. Pye1, S.J. Shaw2, K.L.J. Ellacott1;
1University of Exeter Medical School, RILD Building, University of Exeter, Exeter, UK, 2Rigel Pharmaceuticals Inc., South San Francisco, USA.
Background and aims: Hypoglycaemia is still a frequent concern for people with Type 1 and advanced insulin-treated Type 2 Diabetes. Frequent episodes of hypoglycaemia leads to impaired awareness of and defective hormonal responses to subsequent hypoglycaemia. Activation of brain AMPK may be a therapeutic strategy to improve glucose counterregulation and prevent future hypoglycaemia.
Materials and methods: Glucose tolerance tests (2 g/kg ; intraperitoneally) were performed on male Sprague-Dawley rats with indirect (metformin-like) AMPK activators R481 (brain permeable) and R419 (non brain permeable ; 5-20 mg/kg ; i.p) ± autonomic nervous system (ANS) blocker hexamethonium (50 mg/kg ; i.p.) or AMPK inhibitor SBI-0206965 (3 mg/kg ; i.p.). A second and third cohort were examined for hypoglycaemia glucose counterregulation and insulin sensitivity using hyperinsulinaemic-hypoglycaemic and euglycaemic clamps, respectively. The effect of R481 on blood glucose levels in rats with streptozotocin (STZ ; 60-125 mg/kg)-induced diabetes was also examined.
Results: During glucose tolerance tests, R481 (5-20 mg/kg) acutely raised peak glucose levels without impairing glucose clearance. This was completely blocked by hexamethonium, indicating that R481 activates to autonomic nervous system, which did not occur with R419. AMPK inhibitor SBI-0206965 also significantly attenuated the effect of R481 on glycaemia. During hyperinsulinaemic-euglycaemic clamps, R481 did not alter the glucose infusion rate. C-peptide levels declined with hyperinsulinaemia but this was not altered by R481. During the hypoglycaemic clamps, R481 treated animals had a lower glucose infusion rate, mediated by significantly elevated plasma glucagon levels, without any change to the adrenaline response. In STZ diabetic rats, R481 did not worsen fasting hyperglycaemia.
Conclusion: These data indicate that central AMPK activation raises glycaemia by activating the autonomic nervous system. This was not mediated by reduced insulin sensitivity. During hypoglycaemia, R481 augmented the glucagon response to hypoglycaemia without altering the adrenaline response. Importantly, R481 did not worsen hyperglycaemia suggesting this intervention could be taken before the possible onset of hypoglycaemia i.e. in the postprandial period. Moreover, these data suggest that when augmenting whole body AMPK activity, central AMPK activation supercedes peripheral AMPK activation to raise blood glucose levels for use by the brain. Our data suggests this only occurs when glucose levels are low, i.e. during hypoglycaemia and not during hyperglycaemia.

Supported by: JDRF, Diabetes UK, University of Exeter Medical School
Disclosure: C. Beall: None.
190
Limited impact of impaired awareness of hypoglycaemia and severe hypoglycaemia on inflammatory profile in people with type 1 diabetes
N. Ali, A.W.M. Janssen, B.E. De Galan, C.J. Tack, M. Jaeger, L. Van de Wijer, W. van der Heijden, R. ter Horst, P. Vart, A. van Gool, L.A.B. Joosten, M.G. Netea, R. Stienstra;
Radboud UMC, Nijmegen, Netherlands.
Background and aims: In people with type 1 diabetes, severe hypoglycemia (SH) is independently associated with an increased risk of cardiovascular events. Pro-inflammatory changes with pro-atherogenic capacity may explain this association. We investigated whether a history of SH or the associated presence of impaired awareness of hypoglycemia (IAH) was characterized by a pro-inflammatory profile in type 1 diabetes.
Materials and methods: We measured circulating inflammatory markers and pro-and anti-inflammatory cytokines production after ex vivo stimulation of peripheral blood mononuclear cells (PBMCs) in a well-characterized cohort of individuals with type1 diabetes(n=239) and in people without diabetes(n=56). Data were corrected for confounders by using multivariate linear regression models.
Results: People with type1 diabetes had higher circulating concentrations of hs-CRP (0.91 [0.36-2.25] vs 0.52 [0.20-0.98] pg/ml, p<0.001 and IL-18BP (1746 [1304-2112] vs 1381 [1191-1807] pg/ml, p=0.001) than those without diabetes. In multivariate analysis, only the higher hs-CRP persisted. Neither circulating immune cells nor ex vivo cytokine levels produced by PBMCs in response to an extensive panel of stimuli differed in groups defined by awareness state or a history of SH, apart from elevated IL-18BP in people with compared to those without a history of SH (1524 (1227-1903) vs 1913 (1459-2408) pg/ml, p<0.001).
Conclusion: IAH or a history of SH in people with type 1 diabetes was not associated with altered inflammatory profiles, arguing against chronically elevated inflammatory activity mediating the increased cardiovascular risk associated with hypoglycemia. The finding of higher circulating concentrations of IL-18BP in individuals with a history of SH requires further investigation.
Clinical Trial Registration Number: NL54214.091.15, 2015-1930 and NL42561.091.12, 2012-550
Supported by: NWO, EFSD/AstraZeneca Macrovascular Programme 2015, Hypo-RESOLVE, JU, SGF
Disclosure: N. Ali: None.
191
Early response to hypoglycaemia in type 1 diabetes is dependent on profound brain connectivity changes in response to falling glucose levels
P. Jacob, M. Nwokolo, F. Zelaya, S.A. Amiel, O. O'Daly, P. Choudhary;
King’s College London, London, UK.
Background and aims: Resting state networks (RSNs) are networks of neurons that can be detected with neuroimaging as synchronous low frequency blood oxygen-level dependent (BOLD) signal oscillations at rest. We investigated connectivity in three RSNs in people without diabetes (ND) and people with type 1 diabetes (T1D) with either normal awareness of hypoglycaemia (NAH) or impaired awareness of hypoglycaemia (IAH).
Materials and methods: Fourteen ND, 15 NAH and 22 IAH participants, age, sex and gender matched, underwent a hyperinsulinaemic glucose clamp during which we studied changes in connectivity in 3 RSNs (default mode network (DMN), salience network (SN) and central executive networks (CEN)) between euglycaemia (5.0mmol/L) and onset of hypoglycaemia (2.6mmol/L) using BOLD fMRI. BOLD sequences were preprocessed and analysed in the CONN toolbox and regression analyses performed in SPM12. A p-value of <0.05 was considered significant and this was Bonferroni corrected with FDR for neuroimaging analyses.
Results: At this early timepoint ND symptom scores rose modestly (8.9 ± 4.2 to 13.4 ± 6.5, p = 0.057) despite a significant rise in adrenaline concentration (0.15 ± 0. 10 to 2.15 ± 2.05 nmol/L, p < 0.001). NAH had an early significant symptomatic response (11.3 ± 6.3 to 18.8 ± 9.3, p = 0.029) despite a reduced adrenaline response (0.19 ± 0.12 to 1.01 ± 0.79 nmol/L, p < 0.001). Our IAH group had no symptom response (10.3 ± 5.3 to 9.9 ± 5.3, p = 0.700) associated with a statistically significant but low magnitude adrenaline response (0.17 ± 0.10 to 0.43 ± 0.28 nmol/L, p < 0.001). In ND hypoglycaemia did not alter connectivity of the DMN at hypoglycaemia. However, there was increased connectivity of the SN with basal ganglia nuclei and the reduced connectivity of the CEN with the precuneus, a core node of the DMN.
In NAH, hypoglycaemia reduced connectivity of the DMN with parts of the sensory cortex, increased connectivity of the SN with the operculum and reduced connectivity of CEN with the calcarine cortex. There were no connectivity changes in any of the networks studied in IAH related to hypoglycaemia. Due to the heterogeneity of symptomatic responses in the NAH group we performed a regression analysis to identify regions of connectivity changes that correlated with the degree of adrenergic symptom responses. In response to hypoglycaemia adrenergic symptoms significantly correlated with connectivity between the DMN and the right anterior insula, the dominant node of the SN (p = 0.048). The adrenergic response was also correlated with SN connectivity to the sensory cortex (p = 0.042).
Conclusion: There were significant changes to connectivity of the DMN, SN and CEN in early hypoglycaemia in NAH and ND but not IAH. In people with NAH, adrinergic symptoms were associated with changes from resting (DMN) to the active SN allowing it to ascribe importance to sensory cortex signals. It is possible that prior hypoglycaemic exposure triggers changes in connectivity in early hypoglycaemia that underlie awareness. These changes in connectivity may be crucial for early hypoglycaemia behavioural responses in T1D and are lost in IAH.
Supported by: JDRF
Disclosure: P. Jacob: Grants; This project was funded by JDRF.
192
Hyperinsulinaemic-hypoglycaemic glucose clamps in human research: a systematic review of the literature
T. Wilbek Fabricius1, C. Verhulst2, B.E. de Galan2,3, U. Pedersen-Bjergaard1,4;
1Department of Endocrinology and Nephrology, Nordsjaellands Hospital, Hillerød, Denmark, 2Department of Internal Medicine, Radboud University Medical Centre, Nijmegen, Netherlands, 3Department of Internal Medicine, Maastricht University Medical Centre, Maastricht, Netherlands, 4Department of Clinical Medicine, Faculty of Health and Medical Sciences, University of Copenhagen, Copenhagen, Denmark.
Background and aims: The hyperinsulinaemic-hypoglycaemia glucose clamp technique has been developed to assess effects of and responses to hypoglycaemia under standardized conditions. Whether the methodology of clamp studies has been standardized is unclear. This systematic review examines how hyperinsulinaemic-hypoglycaemic clamps are performed and elucidates potential important differences.
Materials and methods: A literature search in PubMed and EMBASE was conducted. Articles in English published from 1980-2018, involving adults with or without diabetes were included. This systematic review is registered in PROSPERO.
Results: We included 354 papers. A single-step clamp was performed in 224 (63%) papers, with a mean duration of 79±61 minutes (range 5-660). We found a glucose nadir of 2.8±0.4 mmol/L (range 2.2-4.3). Divided according to IHSG's hypoglycaemia definition, we found that 71% had a nadir <3.0 mmol/L (mean 2.6±0.2 mmol/L, range 2.2-2.9), and 29% had a nadir >3.0mmol/L (mean 3.2±0.2 mmol/L, range 3.0-4.3). A stepped clamp, involving multiple consecutive levels of hypoglycaemia, was conducted in 127 (36%) papers, with the most frequent number of steps used being 4. The duration of the steps depended on the number of steps and ranged from 20-90 minutes, with a glucose nadir of 2.6±0.3 mmol/L (range 1.8-3.3). Eighty-three percent had a nadir <3.0 mmol/L (mean 2.4±0.2, range 2.2-2.9), and 17% had a nadir >3.0 mmol/L (mean 3.2±0.1, range 3.0-3.3). The remaining 3 articles reported single and stepped clamps on two consecutive days. There was considerable variation in insulin infusion rates in the studies, ranging from 0.25 to 12.0 mU·kg-1·min-1 or 15 to 160 mU·m-²·min-1, respectively. This corresponds to a 49-fold difference between the lowest and the highest rate used, when normalized to a person of average posture. Information about the glucose infusion rate was only given in 24% of the articles, with vastly different ways of reporting it. Twenty-nine percent of the articles reported glucose levels from whole blood. In 71% of the studies, a dorsal hand vein was used for glucose measurement, applying some form of hand warming to arterialize venous blood in 80% of these studies, but with the use of a heated box in only 66% of the studies.
Conclusion: Although the hyperinsulinaemic-hypoglycaemic clamp technique is considered to be the gold standard for experimental studies on hypoglycaemia, there is no uniform standard on how to perform these experiments. Methodological differences should be considered when comparing results between hypoglycaemic clamp studies.
Supported by: The Hypo-RESOLVE project
Disclosure: T. Wilbek Fabricius: Grants; The Hypo-RESOLVE project.
OP 33 What exercise does
193
Exercise changes neuronal processing of food cues in sedentary overweight and obese adults
L. Wagner1, S. Kullmann1,2, R. Veit1, P. Schneeweiss3, A. Nieß3, H. Preissl1,2, A.L. Birkenfeld1,2, A. Peter1,4, H.-U. Häring1,2, A. Fritsche1,2, A. Böhm1,2, C. Weigert1,4, M. Heni1,2;
1Institute for Diabetes Research and Metabolic Diseases of the Helmholtz Center Munich at the University of Tübingen, Tübingen, 2Department of Internal Medicine IV, University of Tübingen, Tübingen, 3Department of Sports Medicine, University of Tübingen, Tübingen, 4Institute for Clinical Chemistry and Pathobiochemistry, Department for Diagnostic Laboratory Medicine, University of Tübingen, Tübingen, Germany.
Background and aims: Exercise has beneficial effects on metabolism and brain function and is therefore recommended to promote weight loss and achieve weight maintenance. However, little is known whether exercise has a direct influence on the neuronal processing of food stimuli to influence eating behavior.
Materials and methods: 21 participants (14 women; BMI 31±3.9 kg/m2; age 31 ± 9 years) underwent two functional magnetic resonance imaging (fMRI) sessions before and after an 8-week supervised exercise intervention (1 h cycling and walking training, 3 times per week). After intranasal insulin administration, 60 visual food cues (high- and low calorie) were presented in a randomized order during the fMRI measurements. Afterwards, participants were asked to rate the food pictures.
Results: After the exercise intervention, activity in the striatum (i.e. caudate) increased in response to high calorie pictures (pFWE-corr= 0.003; small volume corrected (SVC)). Food pictures that were rated as more desirable elicited a stronger activation in the insula cortex before compared to after the exercise intervention (pFWE-corr=0.03; SVC).
Conclusion: Exercise can significantly impact neuronal processing of food pictures, particularly in reward- and taste-associated brain regions. These regions are known to be insulin sensitive and vital for the control of food intake. In the current study, exercise resulted in a differential activation in reward-related brain regions when responding to palatable food cues. This may help explain the often observed weight-cycling effect after a weight loss intervention. Further studies are needed, though, to show whether the identified improved brain processes in response to exercise ultimately translate into weight loss maintenance.
Clinical Trial Registration Number: NCT03151590
Supported by: DZD e.V. 01GI0925
Disclosure: L. Wagner: Grants; German Center for Diabetes Research (DZD e.V. 01GI0925).
194
Bicycling and all-cause mortality among individuals with diabetes
M. Ried-Larsen1, M.G. Rasmussen2, K. Blond3, L.B. Andersen4, N. Wareham5, S. Brage5, A. Grøntved2;
1Centre for Physical Activity Research, Rigshospitalet, Copenhagen, Denmark, 2University of Southern Denmark, Odense, Denmark, 3Bispebjerg and Frederiksberg Hospital, Copenhagen, Denmark, 4Western Norway University of Applied Sciences, Campus Sogndal, Sogndal, Norway, 5University of Cambridge School of Clinical Medicine, Cambridge, UK.
Background and aims: The risk of premature death from all-causes and cardiovascular causes is increased among persons with diabetes, with few effective preventive measures. The aim of the study was to investigate the association between time spent bicycling and all-cause and cardiovascular mortality among individuals with diabetes. Secondarily, to investigate the association between change in bicycling and all-cause and cardiovascular mortality.
Materials and methods: In this prospective cohort study, nested in the European Prospective Investigation into Cancer and Nutrition, a questionnaire-based survey was administered in 10 western European countries in 1992-2000 (1st examination). A follow-up survey (2nd examination) was administered (mean (standard deviation)) 5.3 (2.3) years after the 1st examination. Adults with self-reported or confirmed diabetes (N=9,207) at the first examination were included in the study. The primary and secondary outcomes were all-cause and cardiovascular mortality, respectively. The primary exposure was weekly time spent bicycling at 1st examination. A secondary exposure was change in weekly time spent bicycling from the 1st to the 2nd examination. Multivariable-adjusted Cox proportional-hazards models were used to estimate hazard ratios (HRs) and 95% CIs.
Results: During 128,860 person-years of follow-up 2,158 deaths from all-causes were registered. Compared to no bicycling at 1st examination (reference), the multivariable adjusted hazard ratios (95% CIs) for all-cause mortality were; 0.75 (0.59,0.95), 0.77 (0.66,0.90), 0.69 (0.58,0.82) and 0.76 (0.64,0.91) for >0 <60 min/week, >=60 <150 min/week, >=150 <300 min/week and >=300 min/week of bicycling, respectively. In the analysis of change (60,469 person-years of follow-up), 1,079 deaths from all-causes were recorded. Compared to persons reporting no bicycling at both examinations (reference), the multivariable hazard ratios (95% CIs) for all-cause mortality were; 0.88 (0.71,1.09), 0.69 (0.50,0.94), 0.66 (0.54,0.80) for persons who ceased, initiated and continued bicycling from the 1st to the 2nd examination, respectively. Inverse associations with cardiovascular mortality were also observed for increased weekly time spent bicycling at baseline and change in bicycling from the 1st to the 2nd examination.
Conclusion: Any bicycling confers with benefit among persons with diabetes after considering other physical activities, as well as other putative risk factors. As initiation of bicycling decreases risk of both all-cause and cardiovascular mortality among persons with diabetes, these findings suggest that bicycling could be considered as an addition to existing physical activity referral schemes to increase physical activity in the clinical care of diabetes.
Clinical Trial Registration Number: NCT04171557
Supported by: Trygfonden
Disclosure: M. Ried-Larsen: None.
195
High-intensity interval training combining biking and rowing markedly improves insulin sensitivity, body composition and VO 2 max in obesity and type 2 diabetes
M.H. Petersen1, M.E. de Almeida2,1, E.K. Wentorf2, N. Ørtenblad2, K. Højlund1;
1Steno Diabetes Center Odense, Odense University Hospital, Odense, 2Department of Sports Science and Clinical Biomechanics, University of Southern Denmark, Odense, Denmark.
Background and aims: Physical activity is a cornerstone in the treatment and prevention of type 2 diabetes. However, the beneficial effects of endurance exercise training on insulin sensitivity are often modest (10-20%). Recent studies suggest that high-intensity interval training (HIIT) may be more effective, and that the involvement of more muscle groups may enhance the effect of exercise training. Our aim was to examine the effect of a whole body HIIT-protocol recruiting both lower and upper body muscles on insulin sensitivity, substrate metabolism, VO2max, body composition and glycemia.
Materials and methods: In 15 obese (BMI: 31±0.8 kg/m2) men with type 2 diabetes, and age-matched obese (n=15, BMI: 31±0.7 kg/m2) and lean (n=18, BMI: 24±0.4 kg/m2) healthy glucose tolerant men, the effect of 8-weeks supervised HIIT combining biking and rowing (3 sessions/week) were examined by DXA-scans, VO2max tests and euglycemic-hyperinsulinemic clamps combined with indirect calorimetry. HIIT-sessions consisted of blocks of 5 x 1 min exercise interspersed with 1 min rest, shifting between blocks on cycle and rowing ergometers, and with an increasing volume from two to five blocks during the 8 weeks.
Results: At inclusion, men with type 2 diabetes had 35-37% lower insulin sensitivity and ~13% lower insulin-mediated suppression of lipid oxidation compared with obese and lean individuals (all p<0.01). In response to the HIIT-protocol, insulin sensitivity increased 32-37% in lean and obese healthy men and 44% in men with type 2 diabetes (all p<0.01). No changes in resting or insulin-stimulated substrate metabolism or respiratory exchange ratios were seen in response to the HIIT-protocol in men with type 2 diabetes or in obese and lean controls. VO2max increased 10% in lean and obese healthy men and 15% in men with type 2 diabetes (all p<0.05). Fat mass was reduced by 1.6-2.3 kg in all 3 groups (all p<0.01), whereas fat free mass was increased 0.9-1.5 kg in obese men with and without type 2 diabetes (all p<0.05). There were no differences in the HIIT-induced improvements between the groups. HIIT reduced HbA1c 3.9 mmol/mol (p<0.05), and fasting plasma glucose 1.0 mmol/l (p<0.001) in patients with type 2 diabetes.
Conclusion: A HIIT-protocol recruiting both lower and upper body muscles efficiently improves insulin sensitivity, VO2max and body composition to the same extent in obesity and type 2 diabetes as in lean healthy individuals. In patients with type 2 diabetes, the HIIT-protocol also improved glycemic control.
Clinical Trial Registration Number: 17/31977
Supported by: Novo Nordisk Foundation
Disclosure: M.H. Petersen: Grants; Novo Nordisk Foundation, Sawmill owner Jeppe Juhl and wife Ovita Juhl Memorial Bursary 2016, Christenson-Cesons Family Fund, OUH PhD Fund for Operation Costs. Other; Scholarship from the Region of Sourthern Denmark, PhD scholarship from the faculty of University of Southern Denmark.
196
Differences in physiological responses to cardio-pulmonary exercise testing in adults with type 1 diabetes and healthy controls: a pooled analysis
M.L. Eckstein1, D. Pesta2, O. McCarthy3, D.J. West4, J. Yardley5, T. Zueger6, C. Stettler6, J. Boufleur Farinha7, M.C. Riddell8, L. Brugnara9, M. Roden2, H. Sourij1, R.M. Bracken3, P. Hofmann10, O. Moser1;
1Cardiovascular Diabetology Research Group, Medical University of Graz, Graz, Austria, 2German Diabetes Centre, Düsseldorf, Germany, 3College of Engineering, Swansea University, Swansea, UK, 4Newcastle University, Newcastle, UK, 5University of Alberta, Alberta, Canada, 6Inselspital Bern, Bern, Switzerland, 7Federal University of Rio Grande do Sul, Porto Alegre, Brazil, 8York University, Toronto, Canada, 9CIBERDEM, Madrid, Spain, 10Institute of Sports Science, University of Graz, Graz, Austria.
Background and aims: People with type 1 diabetes (T1D) show alterations in oxygen economy and heart dynamics during incremental cardio-pulmonary exercise (CPX) testing, which are associated with elevated glycated haemoglobin (HbA1c) levels. Yet, a comprehensive assessment of the impact of T1D, its associated glycaemic control and specific T1D characteristics on functional capacity is missing. This study investigated the physiological response to CPX testing in people with T1D when compared to healthy controls and assessed if cardio-pulmonary and performance responses are associated with HbA1c and specific T1D characteristics.
Materials and methods: The analysis included cycle ergometer CPX datasets and participants and T1D characteristics from 692 people with T1D and healthy controls. Ventilatory threshold 1 (VT1) and ventilatory threshold 2 (VT2) were defined as the aerobic and anaerobic thresholds. In addition, the degree and direction of the deflection of the heart rate to performance curve (kHR) were calculated. A linear mixed-effects model with post-hoc tests was applied to assess changes in CPX parameters over VT1, VT2 and peak performance and compare changes in CPX parameters between groups while HbA1c and diabetes characteristics were only available for T1D. For kHR, linear regression modelling was performed (for all p<0.05).
Results: 347 people with T1D and 345 healthy controls were included (age: 34 ± 11 vs. 34 ± 12 years; BMI 24.6 ± 3.6 vs. 24.3 ± 3.5 kg/m2; 244 male vs 240 male) (p>0.05)(Table 1).
Conclusion: We showed differences over all physiological parameters and performance capacity between people with T1D and matched healthy controls. Physiological parameters and power output were not associated with HbA1c, yet were associated by c-peptide and total daily insulin dose (TDD). While heart rate dynamics were not associated with any T1D characteristics, controversially, levels of c-peptide and TDD were associated with lower power output. T1D duration was not associated with any physiological parameter and power output. The question arises if T1D per se or lower levels of physical activity instead of HbA1c and specific T1D characteristics alter functional capacity in people with T1D.

Disclosure: M.L. Eckstein: None.
197
Bolus insulin dose depends on previous-day race intensity during 5 days of professional road-cycle racing in athletes with type 1 diabetes: a prospective observational study
M. Dietrich1, O. McCarthy2, M.L. Eckstein1, R.M. Bracken2, O. Moser1;
1Medical University of Graz, Graz, Austria, 2Swansea University, Swansea, UK.
Background and aims: Individuals with type 1 diabetes (T1D) often participate in extreme sports competitions and hence prove that T1D per se is not the sole determinant of being physically inactive. However, physical activity and exercise are associated with glycaemic disturbances. Therefore, the question arises of whether dysglycaemia around extreme sporting events frequently occurs in athletes with T1D. The aim of this study was to investigate glycaemic responses and therapy adaptations during a 5-day professional road-cycling race in athletes with T1D.
Materials and methods: 7 professional male cyclists with T1D (age: 28±4 years; BMI: 20.9±0.9 kg/m2; HbA1c: 7.3±0.6 % [56±7 mmol/mol]; diabetes duration: 10±6 years; all using multiple daily injections (MDI); peak oxygen uptake (VO2peak) 72±5 mL/kg/min) participated in a 5-day Union Cycliste Internationale (UCI) road-cycling race. During the 5-day period, cyclists used a real-time continuous glucose monitoring system (rtCGM) and smart bolus and basal insulin pens, whilst macronutrient intake was recorded daily. Data were assessed by means of repeated measures ANOVA/Friedman test with post-hoc testing for glycaemia, macronutrient intake and insulin doses for the 2-day pre-race and race periods. Data were stratified for pre-defined glycaemic ranges and night-/daytime. Associations between exercise physiological data and diabetes markers data were analysed by linear regression modelling (p<0.05).
Results: Although glycaemic variability significantly increased during the 5-day competition period when compared against the pre-race condition (mean difference [MD] 5.0±4.6%, p=0.03), night-time sensor glucose decreased during the 5-day competition period (MD -21±20 mg/dL [-1.2±1.1 mmol/L], p=0.04). The total daily bolus insulin dose was significantly altered over the 5-day competition period (p=0.01). Data followed a bell shaped curve in which bolus doses initially increased from day 1 to day 2 (p=0.04) then decreased from day 2 to day 5 (p=0.04). Basal insulin dose remained unchanged (p=0.64). Subsequent day bolus insulin doses were reduced to a larger extent when the previous-day race intensity was higher (p=0.04). Higher race intensities were associated with lower mean sensor glucose levels (p=0.03) and less time spent in severe hyperglycemia (>250 mg/dL [>13.9 mmol/L] (p=0.04) in the post-race period. Macronutrient intake remained unaffected during the 5-day competition period (p=0.06).
Conclusion: This is the first study evidencing a deterioration in glycaemic variability, yet an improvement in night-time glycaemia during 5 days of road cycle racing compared to pre-race conditions in professional cyclists with T1D. Intriguingly, bolus insulin dose was firstly increased and then latterly reduced, while carbohydrate intake and basal insulin dose remained the same. Exercise intensity during racing was the main determinant in explaining the altered sensor glucose levels.
Clinical Trial Registration Number: DRKS00019928
Supported by: Team Novo Nordisk
Disclosure: M. Dietrich: Grants; Team Novo Nordisk.
198
Plasma aminoadipic acid levels responded to acute and long-term exercise and correlated with insulin sensitivity, pancreatic fat content and C-peptide concentrations in men
S. Lee1, A. McCann2, P.M. Ueland2, C. Drevon3, K.I. Birkeland3;
1340101, P.O. Box 1085 Blindern, University of Oslo, Kongsvinger, Norway, 2BEvital, Bergen, Norway, 3340101, P.O. Box 1085 Blindern, University of Oslo, Oslo, Norway.
Background and aims: The lysine metabolite aminoadipic acid (2-AAA) is strongly associated with the risk of developing type 2 diabetes in observational studies, and may enhance insulin secretion from pancreatic β-cells. Physical activity may improve insulin sensitivity and prevent or delay the onset of type 2 diabetes, yet the relationship between 2-AAA and exercise is unknown.
Materials and methods: We collected blood, skeletal muscle and adipose tissue samples from 13 dysglycaemic and 13 normoglycaemic sedentary, middle-aged men who underwent two bicycle challenges, one before and one after 12 w exercise intervention. We measured plasma concentrations of 2-AAA, lysine and a panel of 13 novel diabetes-related plasma biomarkers, such as branched-chain amino acids, ketone bodies and tryptophan metabolites, using LC- and GC-MS/MS. In addition to mRNA sequencing of skeletal muscle and adipose tissue biopsies, insulin sensitivity was quantified by euglycemic hyperinsulinemic clamping, and body fat distribution and pancreatic fat content analysed by MRI/MRS.
Results: Among the investigated plasma biomarkers 2-AAA concentrations was the most enhanced in dysglycaemic vs. normoglycaemic men at baseline (1.6-fold, p=0.002), and was most strongly negatively associated with baseline insulin sensitivity (M) (β[95%CI]: -2.68[-4.38,-1.00] mg/kg/min, p=0.0031) and M-improvement after 12 w of exercise intervention (-1.50[-2.87,-0.13] mg/kg/min, p=0.033). These associations remained unaltered after adjustment for branched-chain amino acid levels. Furthermore, plasma 2-AAA levels correlated positively with amounts of visceral adipose tissue and pancreatic fat content, and also positively with plasma c-peptide concentration and HOMA-β. Plasma concentration of 2-AAA was also the most exercise responsive metabolite increasing 11.5% (p<0.043) after 12 w of exercise and by ~40% (p<0.001) after both bicycle challenges. Changes in plasma lysine levels were similar to 2-AAA, although less pronounced. Untargeted mRNA sequencing pathway analyses revealed supressed lysine and tryptophan metabolism in adipose tissue from dysglycaemic men, and enhanced lysine and tryptophan metabolism in muscle after 12 w of exercise in both groups. Plasma concentrations of 2-AAA correlated negatively with mRNA levels of DHTKD1, a rate-limiting enzyme in lysine metabolism, in both skeletal muscle and adipose tissue.
Conclusion: Plasma concentrations of 2-AAA were strongly associated with markers of insulin resistance and secretion in men, and responded to acute as well as long-term exercise intervention. Our data support a role for plasma 2-AAA in insulin sensitivity.
Clinical Trial Registration Number: NCT01803568
Disclosure: S. Lee: None.
OP 34 Back to the future: risk markers in diabetes
199
Environmental assessment of persistent glycaemic traits in a northern Swedish population
H. Pomares-Millan1, A. Poveda1, P.W. Franks1,2;
1Lund University, Malmö, Sweden, 2Nutrition, Harvard University, Boston, USA.
Background and aims: Epidemiological research has demonstrated the complex (e.g. additive, synergistic) interplay of multiple environmental risk factors in disease onset. Not all individuals exposed to shared environments will develop the disease at the same rate. The heterogeneity in the disease presentation is more evident in resilient individuals to ‘unfavourable’ environments, and also for those susceptible to a ‘favourable’ one. We aimed to investigate and characterise environmental risk factors and their association with the persistence of glycaemic traits.
Materials and methods: We investigated 18,908 Swedish participants without diabetes or cardiovascular disease in a subcohort from the Västerbotten Intervention program followed between 1999-2009. Venous and capillary blood samples were drawn after overnight fasting and 2 h after the administration of a 75-gram oral glucose load. Environmental exposures were assessed with health, socio-economic, quality of life, and food frequency questionnaires. Using an environmental-wide association approach, we prioritised risk factors associated with glycemic traits at Bonferroni-correction significance (P≤3.47×10⁻⁵). Retrieved exposures were modeled into a linear mixed model to obtain 95% prediction intervals (bootstrapping). Individuals outside the lower and upper bounds were defined as ‘persistently resistant’ and ‘persistently susceptible’, respectively. After data partition (train:70%; test:30%) we performed logistic regression (log OR); Random forest (RF) classification under 10-fold cross-validation was performed to distinguish variables associated with each subgroup. All analyses were undertaken in R software (v3.6.1).
Results: We identified 37 (out of 160 variables) shared environmental factors between the two traits at the specified significance level. Shared modifiable factors included: smoking, quality of life, fitness status, alcohol intake, and iron intake. Top non-modifiable predictors were: relatives with diabetes or heart disease, years smoking, and self-rated overall health (R2 ranged from 0.05 - 0.09). Two-hour glucose resistant (n= 2,323) and susceptible (n= 2,216), and fasting glucose resistant (n= 1,927) and susceptible (n= 2,019) individuals were assessed in logistic models (adjusted for BMI, age, age2, FFQ version, and total energy intake). Odds Ratio (95%CI) of average portion size of meat (g/day): 0.89 (0.82, 0.97); and iron intake (mg/day): 0.83 (0.69,0.97) had lower odds when compared with resistant individuals. At follow-up, smoking status was 36% (1.36 95%CI 1.06,1.75) higher in the susceptible group when compared with resistants. In Fasting glucose, a higher quality of life was associated with 22% less chance of being susceptible. The RF performance (AUC) in the testing dataset, for the first visit, was 60% and 62% in the follow-up, respectively, higher than the logistic regression models (57%).
Conclusion: Our findings suggest modifiable risk factors increased the odds of being susceptible in a long follow-up. Future epidemiological research will benefit from incorporating non-linear assessments when exploring risk factors in subgroups with persistent glycemic traits.
Supported by: Swedish Research Council, Swedish Heart-Lung Foundation, NASCENT
Disclosure: H. Pomares-Millan: None.
200
Mapping robust risk factors for the development of type 2 diabetes: a data-driven approach in Lifelines, a prospective cohort study in the Netherlands
T.P. van der Meer1,2, B.H. Wolffenbuttel1, C.J. Patel2;
1Endocrinology, University Medical Center Groningen, Groningen, Netherlands, 2Department of Biomedical Informatics, Harvard Medical School, Boston, USA.
Background and aims: Many risk factors have been identified for the development of Type 2 Diabetes (T2D), leading to different models for prediction. Yet, conventional approaches consider a limited number of factors and use techniques susceptible for effect overestimation and false-positive findings. Further, while weight, glucose, lipids, and blood pressure are known antecedents, the reporting of novel risk factors often do not consider the complex trajectories to develop overt diabetes.
Materials and methods: We aimed to assess 134 factors - to our knowledge the largest range to-date - from six domains (Biochemicals, Anthropometrics, Lifestyle, Medication, Quality of Life, Pre-determined) for T2D risk with a data-driven exposure-wide association study (XWAS) approach in the population-based Lifelines cohort study (n=96,534, 5-year follow-up). We then compared replicated risk factors between general and at-risk (i.e. pre-diabetes or cardiovascular disease) populations to glean equivalences between risk factors. Subsequently, we assessed independent contribution of replicated factors within and between respective domains with a statistical machine learning approach, lasso-regression.
Results: We were able to replicate 63 out of 134 factors, including 24 biochemicals, nine anthropometrics, 11 lifestyle factors, nine medicaments, seven quality-of-life indicators and three predetermined variables. After we removed 8,109 at-risk individuals (730 cases), all replicated factors but neutrophilic granulocytes remained nominally significant (p <0.05) and we were able to replicate 36/63 risk factors through the XWAS pipeline. Exclusion impacted hazard ratios of glycaemic traits and family history (decrease of 11-20%), and quality-of-life factors (increase of 10-33%) most. Biochemicals and anthropometric factors explained disease risk best (c-index: 0.877, 0.803). Lifestyle-related factors showed similar discrimination as medication and quality of life (0.752, 0.747, 0.742, respectively). Next to established factors, work-related and light-intensity activity, statin and H2-receptor blocker use, and dietary protein intake independently contributed to disease risk.
Conclusion: We identified a wide variety of risk factors and quantified their relative contribution to the development of T2D using a data-driven approach. Information on lifestyle and medication use can be of additional value in risk prediction models. In development of risk prediction models for T2D, we recommend a systematic approach to identify and replicate factors that are sensitive to the complex etiology of the disease.
Disclosure: T.P. van der Meer: None.
201
Plasma concentrations of methylglyoxal during an oral glucose tolerance test are associated with worse beta cell function: the CODAM and Maastricht studies
M.M.J. van Greevenbroek1, J.L.J. Scheijen1, C.J.H. van der Kallen1, P.C. Dagnelie1, S.J.P. Eussen2, C.D.A. Stehouwer1, C.G. Schalkwijk1;
1Dept. of Internal Medicine, Maastricht University, Maastricht, 2Dept. of Epidemiology, Maastricht University, Maastricht, Netherlands.
Background and aims: After a meal, methylglyoxal (MGO) concentrations in the circulation increase. MGO is a highly reactive dicarbonyl that is produced during glycolysis. MGO reacts with, among others, arginines in proteins leading to the formation of advanced glycation end products and is associated with the development of diabetic complications. In the beta-cell, proteins that mediate the fusion of insulin-containing vesicles with the cell membrane, such as VAMP2 and CD59, have arginines in their active site. We hypothesized that high MGO concentrations, particularly in persons with hyperglycaemia and/or diabetes, are associated with beta-cell dysfunction.
Materials and methods: Analyses were done in two independent observational cohorts, i.e. the Cohort on Diabetes and Atherosclerosis Maastricht (CODAM, n=473, 60±7 yrs, 24% impaired glucose metabolism [IGM], 19% type 2 diabetes [T2D]) and The Maastricht Study (n=2608, 60±8 yrs, 16% IGM, 23% T2D). A standard oral glucose tolerance test (OGTT) was performed in CODAM (0-30-60-120 min) and in The Maastricht Study (0-15-30-45-60-90-120 min). Ultra-performance liquid chromatography tandem mass spectrometry (UPLC-MS/MS) were used to quantify MGO in EDTA plasma at time-points 0 and 120 min. The association of fasting and post-OGTT MGO with different aspects of beta-cell function was evaluated using multiple linear regression analyses. C-peptidogenic index (ΔCpeptide t30-t0//ΔGlucose t30-t0) was used as a simple measure of beta-cell function. Beta-cell total insulin secretion, glucose sensitivity, potentiation and glucose rate sensitivity were derived from mathematical modeling. Main dependent and independent variables were standardized. Analyses were adjusted for age, sex, glucose metabolism status, Matsuda index and fasting plasma glucose, as wells as for lifestyle factors, use of medication and metabolic risk factors.
Results: In the CODAM study, higher post-OGTT concentrations of MGO were significantly associated with worse beta-cell function as reflected by the C-peptide index (standardized beta: -0.24, 95% confidence interval (CI) [-0.32; -0.15], fully adjusted model). It was also significantly and in an adverse direction associated with total insulin secretion, beta-cell glucose sensitivity and beta cell potentiation. Associations of fasting MGO with beta cell function were weaker; the association with C-peptide index was -0.12 [-0.21; -0.03]) and the only other measure that reached statistical significance was beta-cell glucose sensitivity. These observations were confirmed in the Maastricht Study. In the latter, larger, study we performed additional analyses stratified on glucose metabolism status and the results showed that the observed associations of post-OGTT MGO concentration with worse beta-cell functions were substantially more pronounced in persons with T2D (-0.04 [-0.09; 0.00 in NGM, n=1586; 0.05 [-0.02; 0.12] in IGM, n=425; -0.21 [-0.28; -0.13] in T2D, n=597).
Conclusion: Post-prandial MGO excursions may contribute to beta-cell dysfunction.
Supported by: This work was supported by the DFN and ZonMW (Diabetes II breakthrough project).
Disclosure: M.M.J. van Greevenbroek: None.
202
Visualising heterogeneous islet autoantibody trajectories of children who develope type 1 diabetes from multi-site birth cohort studies
V. Anand1, P. Achenbach2, J.L. Dunne3, W. Hagopian4, B. Kwon1, M. Lundgren5, R. Veijola6, B.I. Frohnert7, the T1DI Study Group;
1IBM Research, Cambridge, USA, 2Helmholtz Zentrum München, München, Germany, 3JDRF, New York, USA, 4University of Washington, Seattle, USA, 5Department of clinical sciences, Lund University, Malmö, Sweden, 6University of Oulu, Oulu, Finland, 7University of Colorado, Denver, USA.
Background and aims: We investigated evolution of islet autoantibodies (IAs) prior to onset of T1D from 5 large-scale birth cohort studies. Our analysis revealed three distinct IA trajectories leading up to diagnosis of T1D.
Materials and methods: Of 24673 children from five prospective studies (DAISY, DiPiS, DIPP, DEW-IT, and BABYDIAB), 688 who were diagnosed with T1D and had 3 or more visits were included in this analysis. Hidden Markov Models were developed to label visit-level observation of each subject based on three IAs: GADA, IAA, and IA-2A. Interactive visualizations were then applied to explore model outcomes, identify IA evolution trajectories, and examine their clinical characteristics.
Results: Three trajectories were identified (figure 1) with a majority of children having multiple IA (Tr1: n=265) or IAA first (Tr2: n=282) at seroconversion; the minority seroconverted with GADA first (Tr3: n=131). The Tr3 group had seroconversion and T1D onset at an older age in months (58, 132) than Tr1 (42, 96) and Tr2 (31, 88), P < .01. Distribution of HLA DR/DQ differed between groups: higher DRX/X and lower DR3/4 in Tr3 (18%, 24%) than Tr1 (11%, 26%) and Tr2 (10%, 31%).
Conclusion: The three IA trajectories show distinctive antibody patterns, ages of seroconversion and T1D onset and HLA DR/DQ group distributions among them. Furthermore, heterogeneity is also shown within each trajectory in terms of progression time and needs further investigation.

Supported by: 1-IND-2019-717-I-X, 1-SRA-2019-722-I-X, 1-SRA-2019-723-I-X, 1-SRA-2019-719-I-X, 1-SRA-2019-721-I-X
Disclosure: V. Anand: None.
203
The transcriptome of islets and exocrine tissue in subjects with long-standing type 1 diabetes
L. Granlund, M. Wahlhütter, A. Hedin, P. Seiron, O. Korsgren, M. Lundberg, O. Skog;
Immunology, Genetics and Pathology, Uppsala, Sweden.
Background and aims: Classically described as a disease affecting the beta cells, type 1 diabetes (T1D) has recently been recognized to entail the entire pancreas. This is due to frequent reports of reduced pancreas volume and exocrine dysfunction in some T1D patients. However, the morphology of acinar tissue has only been described in a limited number of studies, often on autopsy biopsies where autolysis of the tissue is expected due to release of exocrine enzymes. Description of the acinar tissue with molecular biological methods is even more limited. The hypotheses of this study were that acinar tissue has an altered morphology and transcriptome profile in pancreases in subjects with longstanding T1D when compared with non-diabetic subjects and that such alteration would be relative to the distance from islets. Also, the transcriptome of islets from subjects with longstanding T1D was compared with that in non-diabetic subjects.
Materials and methods: Biopsies from heart-beating organ donor pancreases from 7 subjects with longstanding T1D and 8 non-diabetic subjects were examined in this study. Histological examination and laser capture microdissection (LCM) were used to selectively study regions of acinar tissue adjacent to, and at various distances from islets. Islets were also studied using the same methodology. Transcriptome analysis was performed on the LCM extracted tissue using Ion AmpliSeq.
Results: Acinar atrophy was estimated based on nuclei density, which was not reduced closer to islets than further away from islets in T1D subjects. Neither was there any difference in acinar nuclei density between T1D- and non-diabetic subjects. Furthermore, no atrophy could be noted by visual morphological inspection. A limited number of differentially expressed genes (DEG) were found in T1D acinar tissue (50 DEG closer to islets, 16 DEG further away from islets, FDR < 0.1, FC > 2), suggesting a conserved transcriptome profile. After IHC staining for amylase, trypsinogen and lipase, amylase negative patches could only be found in one case in our cohort. In this case, the pattern was consistent on consecutive sections stained with three different antibodies targeting amylase, although the same areas were positive for trypsinogen and lipase. The amylase negative patches were randomly spread throughout the sections, appearing both adjacent to and at various distance from islets. No beta cells were detected in the T1D donors and 279 DEG (FDR < 0.1, FC > 2) in the islet tissue have been identified.
Conclusion: We conclude that several of the previously reported differences in acinar tissue of T1D pancreases could not be confirmed in our cohort and that the transcriptome of the exocrine pancreas appeared unaltered. Furthermore, amylase negative patches in non-diabetic pancreases were not as frequent as previously reported. This study was performed on biopsies obtained from pancreases treated as intended for clinical transplantation from heart-beating organ donors. This may explain some of the discrepancy as compared to earlier studies where biopsies often have been obtained from autopsies where autolysis likely was present in the pancreas. As expected given the different composition of endocrine cells in the two groups, many differently expressed genes in the islet tissue were discovered. Current analysis is ongoing to determine whether beta-cell specific genes are still expressed in the islets in subjects with longstanding T1D.
Supported by: VR, Barndiabetesfonden, Diabetes Wellness and the Nordic Network for Clinical Islet Transplantation
Disclosure: L. Granlund: None.
204
Cardiovascular health, genetic predisposition, and lifetime risk of type 2 diabetes in general population
K. Wang, M. Kavousi, T. Vortman, M. Ikram, F. Ahmadizar;
Epidemiology, Erasmus University Medical Center, Rotterdam, Netherlands.
Background and aims: Ideal cardiovascular health (CVH) is associated with lower risk of type 2 diabetes (T2D). However, data on lifetime risk of T2D incidence across different CVH categories are scare. Moreover, it remains unclear whether the impact of CVH on lifetime risk of T2D is modified by genetic predisposition to T2D.
Materials and methods: Using data from the prospective population-based Rotterdam Study, an ideal CVH score of 0-6 was calculated based on baseline measurements of body mass index, blood pressure, total cholesterol, smoking status, diet, and physical activity. Participants were categorized into poor (CVH score 0-2), intermediate (CVH score 3) and ideal (CVH score 4-6) cardiovascular health categories. Genetic predisposition to T2D was assessed by creating a Genetic Risk Score (GRS) composed of 403 common genetic variants so far identified for T2D. GRS was divided into tertiles. Incident T2D cases were determined during follow-up. In each CVH category, we used a modified version of survival analysis adjusted for the competing risk of death to estimate the remaining lifetime risk for T2D at 55, 65, and 75 years of age. We then estimated the lifetime risk of T2D based on GRS status in each CVH category.
Results: Among 6057 individuals free of T2D at baseline (mean (standard deviation) age, 69.1 (8.5) years; 58% female), 3427 (56.6%) were categorized as poor CVH, 1885 (31.1%) as intermediate CVH, and 745 (12.3%) as ideal CVH. During a follow-up time up to 14.7 years, 756 individuals developed T2D. At age 55 years, the remaining lifetime risk of T2D was 30.9% (95%CI: 28.5-33.4) for poor CVH, 26.5% (22.8-30.2) for intermediate CVH, and 18.2% (13.0-23.4) for ideal CVH. Individuals in ideal CVH category and at the lowest GRS tertile had a lifetime risk of 16.2% (7.3-25.1) for T2D, whereas those in poor CVH category and highest GRS tertile had a lifetime T2D risk of 35.7% (31.1-40.3). At age 55 years, the lifetime risk for T2D was 23.4% (18.6, 28.2) for poor CVH, 21.9% (15.9, 27.9) for intermediate CVH, and 16.2% (7.3, 25.1) for ideal CVH in the lowest GRS tertile; 29.7% (24.8, 34.6) for poor CVH, 22.5% (17.0, 28.0) for intermediate CVH, and 15.3% (6.1, 24.5) for ideal CVH in the second GRS tertile; and 35.7% (31.1, 40.3) for poor CVH, 29.2% (23.2, 35.1) for intermediate CVH, and 22.4% (12.9, 32.0) for ideal CVH in the highest GRS tertile.
Conclusion: At age 55 years, more favorable CVH was associated with lower lifetime risk for type 2 diabetes and was not counterbalanced by the genetic susceptibility for T2D. Our results highlight the importance of favorable cardiovascular health in preventing T2D among middle-aged individuals regardless of their genetic predisposition.
Disclosure: K. Wang: None.
OP 35 Diet: not only quantity matters
205
Circulating miRNAs as predictive biomarkers for effectiveness of dietary and exercise intervention for weight loss and metabolic improvement
M. Clemente-Postigo1,2, L. Coin-Aragüez1, J. Fernandez-Garcia1,3, J. Alcaide-Torres1,3, R. El Bekay4,3, M. Bernal-Lopez5,3, M. Macias-Gonzalez1,3, F.J. Tinahones1,3;
1UGC Endocrinologia y Nutricion, Hospital Universitario Virgen de la Victoria, Universidad de Malaga, Instituto de Investigación Biomédica de Málaga (IBIMA), Malaga, 2Department of Cell Biology, Physiology and Immunology, University of Cordoba, Instituto Maimónides de Investigación Biomédica de Córdoba (IMIBIC)- Reina Sofia University Hospital, Cordoba, 3CIBER Fisiopatologia de la Obesidad y Nutricion (CIBERobn), Madrid, 4UGC Endocrinologia y Nutricion, Hospital Regional Universitario, Universidad de Malaga, Instituto de Investigación Biomédica de Málaga (IBIMA), Malaga, 5Internal Medicine Department, Regional University Hospital, Instituto de Investigación Biomedica de Malaga (IBIMA), Malaga, Spain.
Background and aims: Lifestyle modifications based on diet and exercise are raised as strategies for the treatment and prevention of obesity and related comorbidities. However, there are great heterogeneity in the type of weight loss interventions as well as high interindividual response variability. Then, strategies for predicting the individual response are required for improving intervention efficiency by personalized recommendations. microRNAs (miRNAs), small RNA particles which regulates gene expression, has been detected in the circulation and proposed as biomarkers for disease and treatment response. However, there are few studies analyzing the usefulness of circulating miRNAs (c-miRNAs) as predictive biomarkers for the response to lifestyle modifications. Furthermore, c-miRNAs has not been specifically analyzed regarding interventions based on Mediterranean diet, which has been associated with higher health-related quality of life. Thus, the aim of this study was to analyze the relationship of the response to hypocaloric Mediterranean diet and physical activity with c-miRNAs previously associated with Type 2 Diabetes (T2D) and obesity.
Materials and methods: 37 obese subjects (BMI>30kg/m2) underwent a hypocaloric Mediterranean diet together with increased physical activity and c-miRNA levels as well as biochemical and anthropometric parameters were determined before and at year 1. Participants were classified according to their 1-year weight loss in low-responders (LR) and high-responders (HR).
Results: There was a significant improvement in anthropometric and biochemical variables after intervention, but there were no differences between baseline and 1-year c-miRNA levels. However, HR subjects had lower baseline miR-130a and miR-150 levels than LR group (p<0.05). There were positive and significant (p<0.05) correlations between baseline miR-130a levels and weight at year 1 (r=0.334); baseline miR-150 levels and 1-year triglyceride levels (r=0.430) and HbA1c (r=0.404); baseline miR-142-3p and 1-year weight (r=0.58), BMI (r=0.482), glucose (r=0.333) and triglyceride (r=0.355) levels. In a lineal regression model baseline miR-150 levels were independently associated with weight loss at year 1. In silico enrichment analyses of miR-150 and miR-130a target genes showed an overrepresentation of adiposity-related pathways (white adipocyte adipogenesis, insulin signaling and lipid metabolism).
Conclusion: c-miRNAs could serve as predictive biomarkers for the interindividual response to dietary intervention based on hypocaloric Mediterranean diet and physical activity.
Clinical Trial Registration Number: ISRCTN89898870
Supported by: Juan de la Cierva (FJCI-2017-32194), PI-0092-2017, PI17/00855, CIBEROBN, Fondos FEDER
Disclosure: M. Clemente-Postigo: None.
206
Eating fast speed has a significant impact on postprandial glycaemic excursion in young healthy women: randomised controlled cross-over trial
S. Imai1, Y. Saito1, S. Kajiyama2,3, T. Miyawaki1, N. Ozasa4, S. Kajiyama5, Y. Hashimoto6, M. Fukui6;
1Kyoto Women's University, Kyoto, 2Kajiyama Clinic, Kyoto, 3Graduate School of Medical Science, Kyoto Prefectural University of Medicine, Kyoto, 4Kyoto University, Kyoto, 5Japanese Red Cross Kyoto Second Hospital, Kyoto, Kyoto, 6Kyoto Prefectural University of Medicine, Kyoto, Japan.
Background and aims: Epidemiological studies have shown associations between self-reported fast eating and diabetes, obesity, and other metabolic syndrome. However, interventional study of the effect of eating speed on glycaemic response has not been investigated. Our aim was to evaluate the acute effect of consuming test meals in different eating speed on glycaemic parameters by flash glucose monitoring system (FGM) in young healthy women.
Materials and methods: In this randomized controlled two-treatment cross-over within-subject trial, we compared postprandial glycaemic responses for varying eating speed over 2 days. Nineteen healthy women [20.8 ± 0.6 years, BMI 20.6 ± 1.9 kg/m2, HbA1c 34 ± 2 mmol/mol (5.4 ± 0.2%): mean ± SD] wore FGM for 6 days. Each participant consumed identical test meals in a different eating speed on the fourth and the fifth day. The test meals of breakfast, lunch, and dinner were consisted of boiled white rice, white bread, milk, vegetable, and frozen lunch boxes of gluten-meat steak and fried fish with vegetable with energy 1,757 kcal, protein 67.2 g, fat 41.3 g, carbohydrate 282 g, and energy ratio of protein, fat, and carbohydrate were 15%, 21%, and 64%, respectively. All participants consumed breakfast at 07:00, lunch at 12:00, and dinner at 18:00. The eating protocol was controlled as follows; in fast eating the participants consumed test meals in 10 min by mixture of vegetable, main dish, and carbohydrate, while in slow eating they consumed the identical test meals in 20 min by sequence of vegetable → main dish → carbohydrate on the fourth or the fifth day. The order of eating speed was random sequence prior to participants beginning the study. The daily glycaemic parameters were compared between 2 days of consuming identical meals in a different eating speed.
Results: The mean amplitude of glycaemic excursion (MAGE; 3.67 ± 0.31 vs. 2.67 ± 0.20 mmol/L, p < 0.01), standard deviation of glucose (SD; 1.18 ± 0.10 vs. 0.92 ± 0.06 mmol/L, p < 0.05), incremental glucose peak (IGP; breakfast 2.30 ± 0.19 vs. 1.71 ± 0.12 mmol/L, p < 0.01, lunch 4.06 ± 0.33 vs. 3.13 ± 0.28 mmol/L, p < 0.01, dinner 3.87 ± 0.38 vs. 2.27 ± 0.27 mmol/L, p < 0.001) , and incremental area under the curve for glucose of dinner (IAUC; 2h 256 ± 30 vs. 128 ± 18 mmol/L×min, p < 0.001, 3h 336 ± 34 vs. 200 ± 25 mmol/L×min, p < 0.01, 4h 373 ± 35 vs. 260 ± 31 mmol/L×min, p < 0.01) of fast eating were all significantly higher compared to those of slow eating.
Conclusion: The results of this interventional study suggest that the eating fast speed is associated with higher postprandial glucose concentrations and glycaemic excursion in young healthy women without diabetes.

Clinical Trial Registration Number: 38684
Supported by: Kyoto women's University
Disclosure: S. Imai: None.
207
Acute metabolic effects of intermittent fasting in the morning compared to two different breakfasts among lean individuals
D. Tsilingiris, A. Tentolouris, I. Eleftheriadou, I. Anastasiou, O. Kosta, C. Dimosthenopoulos, A. Kokkinos, N. Katsilambros, N. Tentolouris;
1st Department of Propaedeutic Internal Medicine, Laiko General Hospital, Athens University Medical School, Athens, Greece.
Background and aims: It has been hypothesized that prolongation of the nocturnal low insulin state that is achieved through an early day fasting results in a greater mobilization of adipose tissue stores. The aim of this study was to investigate further this hypothesis in comparison with two different approaches of early day nutritional strategies.
Materials and methods: In this cross-over study, 10 lean healthy volunteers (7 females and 3 males, aged 28.6±4.3 years, mean BMI 22.9±1.4 kg/m2) underwent three 6-hour morning sessions after an overnight fast as follows: (a) fasting, (b) 500 kcal zero carbohydrate breakfast, and (c) 500 kcal Mediterranean-type breakfast. Fasting duration before the experiments was reported. Insulin resistance (HOMA-IR) was measured at baseline. Plasma glucose and insulin measurements as well as visual analog scales (VAS) for hunger were obtained every 30 minutes during the study. As index of adipose tissue mobilization, plasma beta hydroxybutyric acid (bHB) concentrations were used and measured via a colorimetric assay on an hourly basis. The trapezoidal rule was used to calculate the area under the curves (AUCs) during the study for all obtained parameters.
Results: The unadjusted AUC [bHB] was not significantly different among the three sessions (p=0.108). After controlling for session type, linear regression analysis demonstrated that the AUC [bHB] correlated positively with fasting duration (beta=0.416, p=0.018) and negatively with HOMA-IR (b= -0.398, p=0.024). The AUC [bHB], after adjustment for fasting duration and HOMA-IR, was significantly higher after session (a) vs (b) (p=0.021) and (a) vs (c) (p=0.008) , but it did not differ (p>0.05) between sessions (b) vs (c) (6.08±0.55 vs. 4.14±0.55 vs. 3.76±0.60 mmol/h/L, for sessions a, b and c respectively). The AUC [insulin] was significantly lower for session (a) vs (c) (p=0.001) and there was a trend to be lower in session (a) vs (b) (p=0.067) as well as between session (b) vs (c) (p=0.081), while the AUC [glucose] was similar among the three sessions (p=0.907). The AUC [VAS-hunger] was significantly higher in session (a) compared with either (b) or (c) (p<0.01) and similar between (b) and (c).
Conclusion: In young healthy lean individuals, a greater mobilization of adipose stores, lower insulin levels but higher hunger was achieved through intermittent fasting in the morning compared with either a zero carbohydrate or a Mediterranean-type breakfast intake. Carbohydrate restriction in the morning and a Mediterranean-type breakfast constitute equal choices in terms of adipose tissue mobilization and hunger suppression. Further studies are needed to examine the long-term metabolic effects of fasting in the morning.
Clinical Trial Registration Number: NCT04293003
Disclosure: D. Tsilingiris: None.
208
Manchester Intermittent versus Daily diet Diabetes App Study (MIDDAS). Pilot RCT comparing a continuous with an intermittent low energy diet in patients with type 2 diabetes
B.G. Issa1, M. Harvie2, S. Mcdiarmid1, R. Johnson1, A. Vyas1, A. Aglan3, H. Ruane2, A. Hulme1, K. Sellers2, L.A. Jones4, M.G. Jenkins4;
1Department of Endocrinology and Diabetes, Manchester University NHS Foundation Trust, Manchester, 2Prevent Breast Cancer Research Unit, The Nightingale Centre, Manchester University NHS Foundation Trust, Manchester, 3Greater Manchester Mental Health NHS Foundation Trust, Manchester, 4Oviva UK Ltd, London, UK.
Background and aims: Continuous low energy diets (CLED) providing 800 kcal/day can produce significant weight loss and remission from Type 2 diabetes (T2D). Intermittent low energy diets (ILED) may be an alternative low energy approach, supporting patient choice and adherence. This pilot RCT assesses the acceptability (uptake, retention) and efficacy (weight loss, HbA1c) of a CLED versus an isocaloric ILED (5:2 diet) in a remotely delivered, digitally-enabled programme for patients with T2D.
Materials and methods: Seventy-nine participants were randomised to CLED (n=40) (8 weeks of Optifast® 800 calorie diet followed by 4 weeks of food reintroduction) or ILED (n=39) (2 days of Optifast® 800 calorie diet and 5 days of a portion controlled Mediterranean diet for 28 weeks), followed by a maintenance phase up to 12 months. Participants received remote 1-to-1 high-frequency support from a multidisciplinary team including a dietitian, diabetes nurse, exercise specialist and psychologist via a smartphone app (features: logging of food/photos/weight/activity and goal-completion, plus video/message-based communication) and telephone calls. Weight and HbA1c were recorded at baseline, 6-months and 12-months.
Results: Baseline characteristics: 53%(m)/ 47%(f), mean+/-SD BMI 36.9(+/-5.8)Kg/m2 (CLED) and 35.8(+/5.8)Kg/m2 (ILED) and mean+/-SD HbA1c were 63.0(+/-13.7)mmol/mol (CLED) and60.3(+/-11.3)mmol/mol (ILED). At 6 months 4x CLED and 5x ILED had withdrawn, which increased to 10xCLED (25% drop out) and 12x ILED (31% drop out) at 12 months. HbA1c<48 was achieved in 67% (CLED) and 56% (ILED) at 6 months and maintained in 53% (CLED) and 48% (ILED) at 12 months. Mean(95% CI) weight losses(%) were -8.9(CI -10.4 to -7.3 )% for CLED and -8.1(-10.1 to -6.2)% for ILED at 6 months, and 6.5%( -8.1 to -4.8) and 5.9%(-7.9 to -3.8) at 12 months, respectively. Whilst higher volumes of CLED achieved ≥10% weight loss at 6 months (43% v 33%), volumes achieving this at 12 months were similar; 20%(CLED) v 19%(ILED). This trend matched the findings in HbA1c reductions, -14.6(-20.2 to -9.1))mmol/mol (CLED) and -10.9 (-14.1 to -7.7)(mmol/mol) (ILED) at 6 months, and -8.9mmol/mol (-13.5 to 4.3) and -8.3mmol/mol (-11.4 to -5.2) at 12 months respectively.
Conclusion: This shows the feasibility of both CLED and ILED dietary interventions for weight loss and reduction in HbA1c at 12 months, delivered through a remote, digitally-enabled type 2 diabetes programme. ILED may be an effective alternative to CLED. A larger RCT is needed to confirm this.
Clinical Trial Registration Number: 34397
Supported by: Nestle Health Sciences
Disclosure: B.G. Issa: Grants; Nestle Health Science.
209
The effect of dietary fiber on glycaemic control in patients with type 2 diabetes on metformin monotherapy
F. Tramontana, E. Maddaloni, S. Greci, G. Defeudis, R. Strollo, P. Pozzilli, N. Napoli;
Department of Medicine, Unit of Endocrinology and Diabetes, Campus Bio-Medico University of Rome, Rome, Italy.
Background and aims: The efficacy of increasing dietary fiber intake to ameliorate glycaemic control in patients with type 2 diabetes (T2D) is still controversial. In this randomized open-label comparator-controlled study we tested the effect of high-fiber diet and fiber supplement on glycaemic control in patients with T2D on metformin monotherapy. Changes in body weight and lipid profile were also evaluated.
Materials and methods: Seventy-eight T2D overweight and obese patients on metformin monotherapy were randomized 1:2:1 to 12 weeks intensive nutrition program to follow standard diet recommendations (SDR), high-fiber diet (HFD) or dietary fiber supplementation (FS). Dietary recommendations were reinforced in all groups every 4 weeks by study dieticians. HFD contained a minimum of 35 g of dietary fiber per day through the consumption of unfortified foods. The FS added 9.73 g of dietary fiber per day to the normal nutrition. Biochemistry, anthropometric measures and food frequency questionnaires to asses dietary fiber intake were collected at baseline and after 12 weeks.
Results: At baseline groups did not differ in terms of mean age, BMI, metformin intake, HbA1c, fiber and calorie intake (p> 0.05 for all). After three months, dietary fiber intake significantly increased in both HDF and FS group but not in SDR group (HFD: 19.8 ± 6.1 g vs 24.3 ± 6.8 g, p= 0.0001; FS: 17.5 ± 5.9 g vs 27.0 ± 6.2 g p< 0.0001; SDR: 22.8 ± 9.1 g vs 21.2 ± 6.4 g, p= 0.32). HbA1c significantly improved in all groups (SDR: 7.2 ± 0.4 % vs 6.7 ± 0.5 g, p< 0.001; HFD: 7.1 ± 0.5 % vs 6.6 ± 0.6 %, p< 0.0001; FS: 7.1 ± 0.5 % vs 6.8 ± 0.5 % p< 0.001). All SDR, HFD and FS interventions reduced mean body weight by 1.1 ± 2.1 Kg (p< 0.05), 2.1 ± 2.6 Kg (p< 0.0001) and 1.0 ± 1.8 Kg (p< 0.05), respectively. Changes in HbA1c and body weight did not differ among groups. A significant correlation between calorie intake and the reduction of HbA1c levels was seen across groups (r= 0.307 p<0.01). No significant correlation between dietary fiber intake and HbA1c levels was observed. Total cholesterol, HDL, LDLc and triglycerides did not significantly change in all groups.
Conclusion: Intensive nutrition education programs with monthly meetings similarly reduced HbA1c in all groups. Furthermore, our study suggested that rather than fiber intake, caloric restriction followed by moderate weight loss is the main driver for glycaemic improvement in overweight and obese patients with T2D.
Disclosure: F. Tramontana: None.
210
Association of daily carbohydrate intake with glycaemic control in adults with type 1 diabetes using a hybrid closed-loop system
V. Lehmann, T. Zueger, A. Zeder, L. Bally, M. Laimer, C. Stettler;
Department of Diabetes, Endocrinology, Nutritional Medicine and Metabolism, Inselspital Bern, University Hopital and University of Bern, Bern, Switzerland.
Background and aims: With the clinical implementation of hybrid closed-loop (HCL) systems, efforts are moving towards personalised medicine. However, sparse evidence exists on how individual carbohydrate (CHO) intake affects glycaemic control in type 1 diabetes (T1D), especially in those using an HCL system. The HCL-device MiniMed 670G (MM670G) requires CHO-input for mealtime bolus calculation while in “auto-mode”. We aimed at assessing glycaemic control as a function of individual daily CHO-intake.
Materials and methods: We screened data from 59 adults with T1D using the MM670G HCL system between 11/2018 and 10/2019 at our tertiary referral centre. CHO-intake (g/day) and CGM data were evaluated during a 30-day period before a routine visit. Only days with availability of ≥ 70% of CGM data, and with time in “auto-mode” ≥ 50% were included in the analysis. Mean individual, daily CHO-intake (MIDC) was assessed per patient. For each day, the relative deviation from MIDC (rMIDC) was calculated, and days were stratified into low, medium and high CHO-consumption (≤80%, 81-120% and >120% rMIDC, respectively). Glucose control was assessed using standard CGM metrics including time in target range (TIR, 3.9-10.0 mmol/L), time above target range (TAR, >10mmol/L), time below target range (TBR, <3.9 mmol/L), mean glucose, and coefficient of variation (CV). CGM readouts were additionally stratified by time in “auto-mode” (<80%, 80-90%, >90%). The three rMIDC groups were compared using ANOVA and associations between CHO-intake and CGM metrics were assessed using mixed linear models.
Results: Records from 36 patients (26 male, 10 female; age 36.9±13.5y; HbA1c 7.1±0.9%; diabetes duration 23.0±13.0y; BMI 26.5±3.6kg/m2) were included, providing a total of 810 days of data (22.5±6.7 days per patient). Average time on MM670G at time of analysis was 107±36 days. Mean time of sensor use was 96.1±6.2% and mean time in ‘’auto-mode” was 91.0±12.4%. Mean daily CHO-intake was 166.4±69.6g distributed over 5.7±3.2 meals per day. CGM-findings and average daily CHO-intake of the three rMIDC-groups stratified according to time in ‘’auto-mode” are displayed in table 1. Mixed linear models adjusted for time in ‘’auto-mode” showed a decrease in TIR of -1.1% (p<0.001) and an increase in TAR of 1.2% (p<0.001) for every 10% increase in relative, daily CHO-intake. There was no effect of daily CHO-intake on TBR (p=0.42).
Conclusion: Individual daily CHO-intake was inversely associated with glycaemic control in adults with T1D using the MiniMed 670G HCL-system. The effect appears more pronounced with higher time in ‘’auto-mode”, suggesting that carbohydrate restriction may facilitate glucose control in patients consistently using the ‘’auto-mode”.

Disclosure: V. Lehmann: None.
OP 36 On the road to human islet failure in type 2 diabetes
211
Cross-sectional multi-omics insight from islet and plasma samples into the progression to type 2 diabetes in metabolically profiled pancreatectomised surgical donors
L. Wigger1, M. Barovic2,3, A.D. Brunner4, F. Marzetta1, E. Schöniger2,3, F. Mehl1, N. Kipke2,3, K. Simons5, M. Distler6, A.M. Schulte7, M. Mann4, M. Ibberson1, M. Solimena2,3;
1Vital-IT, SIB Swiss Institute of Bioinformatics, Lausanne, Switzerland, 2Paul Langerhans Institute Dresden (PLID), Helmholtz Center Munich, Dresden, Germany, 3German Center for Diabetes Research (DZD e.V.), Neuherberg, Germany, 4Max Planck Institute of Biochemistry, Martinsried, Germany, 5Lipotype GmbH, Dresden, Germany, 6Department of Surgery, University Hospital and Faculty of Medicine, TU Dresden, Dresden, Germany, 7Sanofi Deutschland GmbH, Frankfurt, Germany.
Background and aims: Type 2 diabetes mellitus (T2D) is caused by the complex interplay of genetic and environmental factors. Its key physiological phenotype is the inability of pancreatic islet beta cells to secrete insulin in amounts adequate to metabolic demand. We performed a comprehensive multi-omics analysis of the islet state in relationship to glycemic control by integrating clinical traits with multiple islet and preoperative peripheral blood omics datasets of metabolically profiled pancreatectomized patients (PPP) across the continuum of glycemic rise from healthy to overt T2D.
Materials and methods: We collected medical histories and laboratory data, e.g. preoperative fasting glucose, HbA1c and 2-hour glucose OGTT values, in a cohort of 133 PPPs at a university hospital and stratified them into subgroups using ADA-recommended criteria for diabetes and prediabetes. Surgical pancreatic tissue and preoperative peripheral blood samples were snap frozen immediately after collection. Laser capture microdissected (LCM) islets were analyzed by RNA sequencing and mass spectrometry-based proteomics. Blood plasma lipidomics analyses were performed by shot-gun and targeted mass spectrometry. Data analysis included differential abundance analyses, pathway overrepresentation analyses and a multi-omics approach combining RNA-Seq, lipidomics and clinical data.
Results: We identified 535 differentially expressed genes in islets of 39 T2D PPPs (adj. p ≤ .01; FC ≤ 1.5) compared to islets of 18 non-diabetic (ND) PPPs. After additional QC filtering, we found 40 genes that were differentially expressed in islets of PPPs with impaired glucose tolerance (IGT) versus ND islets. Weighted gene correlation network and consensus orthogonal partial least square (WGCNA and Consensus OPLS) analyses identified gene co-expression modules and lipids jointly associated with HbA1c levels. Extracted model features constitute a combined transcriptomic-lipidomic signature for beta cell decline in T2D. Genes from the signature modules were enriched, e.g., in pathways related to carbohydrate, protein and sphingolipid metabolism and AMPK signaling. We found Aldolase B to be a major discriminator between islets of T2D and ND patients by both RNA-Seq (adj. p = .0004) and proteomics analysis (p = 4.15 x 10⁻¹⁰) while its gene co-expression module correlated well with HbA1c levels (r = 0.67).
Conclusion: For the first time, a multi-omics approach integrating transcriptomics and lipidomics data by WGCNA and Consensus OPLS identified islet gene co-expression modules and plasma lipids that characterize the progressive increase of HbA1c, hence pointing to promising candidates with direct or indirect causal relationship with beta cell failure in T2D. Proteomics analysis of LCM islets provided corroborating evidence for gene regulation patterns found in our primary analysis.
Supported by: EU/EFPIA/Innovative Medicines Initiative 2 Joint Undertaking (RHAPSODY grant No 115881)
Disclosure: L. Wigger: None.
212
Integration of single-cell datasets reveals novel transcriptomic signatures of beta cells in human type 2 diabetes
E. Bosi1, L. Marselli1, C. De Luca1, M. Suleiman1, M. Tesi1, M. Cnop2, D. Eizirik3, M. Ibberson4, P. Marchetti1;
1Department of Clinical and Experimental Medicine, University of Pisa, Pisa, Italy, 2Division of Endocrinology, Universite Libre de Bruxelles, Brussels, Belgium, 3Center for Diabetes Research, Universite Libre de Bruxelles, Brussels, Belgium, 4Swiss Institute of Bioinformatics, Lausanne, Switzerland.
Background and aims: Pancreatic islet β-cells are key to the onset and progression of type 2 diabetes (T2D). Given the heterogeneity of islet cell subpopulations, the advent of single-cell RNA sequencing to study β cells transcriptomes has been welcomed. However, the application of this technique has been underwhelming, as three independent studies focused on the differences showed no shared differentially expressed genes in T2D β-cells. Here, we performed an integrative analysis of data from available studies of human islets from T2D and non-diabetic donors to overcome confounding sources of variability and better highlight T2D β-cell transcriptomic signatures.
Materials and methods: Raw sequencing data was downloaded from 3 available studies. Reads were aligned using STAR against GRCh37 (ensembl annotation) to obtain gene read counts for each cell and to filter low quality cells. The use of Scanpy allowed to perform dataset integration with MNN and to identify the main cell types. Differences associated with T2D in β cells were identified using DESeq2 (gene expression) and Enrichr (gene set enrichment).
Results: Integrating the reads of 3 single cell studies we produced a dataset with 3046 single cells collectively expressing 27931 genes. Cell level analyses allowed to reduce dataset specific biases and divide cells into endocrine cell types.In T2D β-cells (n=801) we found 210 and 16 genes respectively up and down regulated (several of which not reported previously) identifying key pathways and functions (including defective insulin secretion, SREBP signaling, oxidative stress and apoptosis) that are enriched in cells from T2D donors. Using available literature and databases, we manually curated the associations between differentially expressed protein-coding genes (n=60) and T2D at different levels, including β cell failure mechanisms. For 35 genes it was possible to find a known relation with T2D, whereas the other 25 were not previously described. Of them, 16 have a function unknown while 9 could be ascribed to processes linked to β cell dysfunction.We also compared our results with previous micro-array data of β cells obtained by laser capture microdissection (LCM). Despite differences between the methods, we identified 6 shared genes over-expressed in both RNA-seq and LCM T2D β cells, mostly not described so far.
Conclusion: In this work we harmonised available single-cell transcriptomics datasets of human islets, creating an integrated dataset that will represent an important resource for the community. The analysis of β cells from this dataset allowed to identify differentially expressed genes previously undetected that might represent central components of β cell dysfunction in T2D.

Supported by: RHAPSODY, INNODIA, T2DSystems,
Disclosure: E. Bosi: None.
213
Single cell transcriptomics of transplanted human islets
L. Chen1, A. Ahnmark1, X. Li1, A. Zhou1, J. Liu2, Q. Peterson3, B. Tyrberg4, M.S. Winzell5, B. Zarrouki1;
1Research and Early Development Cardiovascular, Renal and Metabolism (CVRM), BioPharma R&D, AstraZeneca, Mölndal, Sweden, 2Single Cell Sequencing Facility, Integrated Cardio Metabolic Centre (ICMC), Karolinska Institutet/AstraZeneca, Huddinge, Sweden, 3Department of Physiology and Biomedical Engineering, Mayo Clinic, Rochester, USA, 4Cardiovascular and Metabolic Diseases, Institute de recherches Servier, Suresnes, France, 5AstraZeneca IPD-CA, South San Francisco, USA.
Background and aims: The single cell transcriptome of pancreatic endocrine cells has been extensively characterized in vitro by several groups. However, the metabolic profiling and transcriptomic understanding of human pancreatic endocrine cells in vivo is still elusive. Extensive in vitro manipulation and long-term culture may change the phenotype of cells and thereby change the transcriptomic profile. In this study, we utilize single cell RNA sequencing (scRNA-Seq) technology to study implanted human pancreatic endocrine cells transcriptomics in vivo. By using this in vivo model system, we aim to better understand the transcriptomic changes that may occur during islet isolation and in vitro culture. We also aim to build on this model to understand islet transcriptomics during metabolic stress and diabetes in the recipient animal to model human disease.
Materials and methods: The Scid beige mice (CB17.Cg-PrkdcscidLystbg-J/Crl) were used as recipients for the transplantations. About 1500IEQ (Islet equivalents) human islets were transplanted under the kidney capsule and stayed maintained for 22 weeks. After transplantation, human C-peptide level was monitored at week 10 and week 22 to determine the in vivo function of human the islets. The xenografts was were dissected by using customized surgical tools and cell dissociation. The dissociated cells were stained with a live cell indicator (Calcein AM) followed by a human cell surface marker (HLA-ABC). Live human cells were then sorted into 384-well plates and used for single cell RNA sequencing (Smart-seq2). The scRNA-Seq data was then compared to Sandberg’s published in vitro human islet data.
Results: Human C-peptide increased over time post transplantation (267±13pM at 10 weeks; 1875±79pM at 22 weeks). After dissociation with TrpLE select and staining with Calcein A plus human HLA-ABC, we succeeded in sorting out a fraction of live human islet cells. Subsequent scRNA-seq analysis confirmed insulin, glucagon, PPY and GHRL positive cells. A set of typical beta-cell transcription factors including IAPP, NEUROD1, PAX6, MAFA/B, PDX1 were identified. In common with healthy donors in Sandberg’s study, we identified 4820 overlapping genes. For example the genes that were reported to express in endocrine cells, such as CHGA, SCGN, G6PC2, PCP4, STMN2, LINC00643, SLC30A8, were also found in our study. In addition, we identified 105 additional islet genes, which are annotated as “enriched in endoplasmic reticulum membrane (GO:0005789)”, “apical plasma membrane (GO:0016324) and extracellular exosomes (GO:0070062)”.
Conclusion: Our study has successfully established a model to study human pancreatic endocrine cells transcriptomics in vivo in a humanized mouse model. Further application will be transplanting human islets or inducible pluripotent cells-derived alpha/beta cells into normal and diabetic Scid beige mice (HFD-induced) to identify key changes during long-term diabetes.
Supported by: AstraZeneca postdoc innovation fund
Disclosure: L. Chen: None.
214
Endoplasmic reticulum stress contributes to the loss of beta cell identity in human pancreatic islets treated with glibenclamide
C. Fernandez1, N. Tellez1, V. Gutierrez1, K. Rivera1, M. Nacher1,2, E. Montanya1,2;
1CIBERDEM, IDIBELL-Universitat de Barcelona, Barcelona, 2Endocrine Unit, Hospital Universitari Bellvitge, Barcelona, Spain.
Background and aims: Loss of pancreatic beta cell mass and beta cell dysfunction are central in the development of type 2 diabetes (T2DM). Reduced beta cell mass has been attributed to increased beta cell apoptosis, and more recently to beta cell dedifferentiation. Beta cell dedifferentiation has been described in response to chronic pathophysiological stress. Chronic closure of the KATP channel in rodent beta cells by exposure to the sulfonylurea glibenclamide, or by genetic manipulation results in impaired beta cell function, endoplasmic reticulum (ER) stress and loss of beta cell mass, that could account for the secondary failure to sulfonylurea treatment described in T2DM. We aimed to investigate whether chronic exposure of human islets to glibenclamide induces beta cell dedifferentiation, and the potential contribution of ER stress.
Materials and methods: Islets from human multi-organ donors (n=13, 30.8% female; 57.38±2.3 y.o.; BMI: 25.5±0.89) were cultured for one week at 5.5 mM glucose in the presence or not of Glibenclamide (1 μM) and the chemical chaperone 4-phenylbutyrate (PBA, 2.5 mM). Beta cell function was evaluated by Glucose-Stimulated Insulin Secretion (GSIS), at 2.8 mM (basal) and 20 mM (stimulated) glucose, insulin content by ELISA (DNA-corrected) and beta cell apoptosis by TUNEL assay. Beta cell dedifferentiation and ER stress were determined by differential gene expression analyses of beta cell identity, disallowed, progenitor-related, and ER stress markers using qRT-PCR (Taqman).
Results: Human islets exposed to glibenclamide showed beta cell dysfunction (stimulation index in control group (C): 5.05±1.32; Glibenclamide: 1.65±0.26, p=0.05) with increased basal insulin secretion (C: 0.87±0.15%; Glibenclamide: 1.88±0.51%, p=0.07) and similar stimulated insulin secretion (C: 4.5±1.6%; Glibenclamide: 3.01±0.82%, p=0.17). Insulin content was similar (C: 349.2±87.6; Glibenclamide: 267.0±78.7 ng Ins/μg DNA, p=0.21). Differential gene expression analyses showed downregulation of key beta cell transcription factors MAFA, MAFB, PDX1, NKX6.1, NKX2.2 and PAX6, as well as insulin, PCSK2 and the beta cell marker GLP1R (p<0.05). No differences were observed on disallowed gene transcripts (HK1, HK3, LDHA) or progenitor-related gene transcripts (ALDH1A3, NGN3, SOX9). Glibenclamide-cultured islets showed differential gene expression of ER stress markers: increased DDIT3, increased XBP1 spliced form and decreased WFS1 (p<0.05). Accordingly, beta cell apoptosis was significantly increased (C: 0.75±0.05%; Glib: 1.49±0.24%, p=0.04). Addition of PBA prevented glibenclamide-induced changes in gene expression of ER stress markers DDIT3, XBP1s and WFS1 and the downregulation of the beta cell identity markers PDX1, NKX6.1, NKX2.2, PAX6 and GLP1R.
Conclusion: Chronic exposure of human islets to glibenclamide resulted in ER stress and loss of beta cell identity. ER stress relief by addition of PBA partially prevented glibenclamide-induced loss of beta cell identity, indicating that glibenclamide-induced loss of beta cell identity in human islets is mediated, at least partially, by ER stress.
Supported by: PI 16/00462 ISCIII, FEDER
Disclosure: C. Fernandez: None.
215
Deciphering glucocorticoid-mediated stress responses in the human pancreatic beta cell
A. Karagiannopoulos1,2, J. Ofori1,2, J.L.S. Esguerra1,2, L. Eliasson1,2;
1Islet Cell Exocytosis, Department of Clinical sciences - Malmö, Lund University, Lund, 2Lund University Diabetes Centre, Skåne University Hospital, Malmö, Sweden.
Background and aims: Glucocorticoids (GCs) are a class of steroid hormones that are widely prescribed due to their anti-inflammatory and immunosuppressant properties. However, their use comes with various metabolic complications such as steroid-induced diabetes mellitus. Although the role of glucocorticoids is established in insulin resistance, recent studies show that they can also directly impair insulin secretion from pancreatic β-cells. Here, we investigated the transcriptomic changes in human islets and beta cells upon GC treatment to elucidate the molecular mechanisms underlying GC-mediated β-cell dysfunction.
Materials and methods: We treated human pancreatic islet preparations (n=4) and EndoC-βH1 cells (n=4) with dexamethasone (2 uM). We then performed RNA-seq using Illumina-based platform to identify differentially-expressed genes. To screen for direct glucocorticoid receptor (GR) targets, a customized bioinformatics pipeline was developed, in which RNA-seq data were integrated with publicly available GR ChIP-seq data. An aggregate score similar to a p-value was generated for each gene indicating the probability of direct GR targeting.
Results: RNA-seq revealed both established and novel genes to be differentially regulated in GC-treated human islets (1507 genes) and EndoC-βH1 cells (3175 genes) (adj P value = 0.05). Integration with ChIP-seq data revealed many potential direct targets of the glucocorticoid receptor. We found ZBTB16 to be the top GR target in both the EndoC (aggregate score 0.00001) and the human islet set (aggregate score 0.00005). Additionally, the pipeline validated other properties of GR such as the preferential DNA binding to distal, intronic and conserved sites. Finally, the discovery of transcription factor (TF) binding motifs in non-canonical GR DNA-binding regions, as well as their evolutionary conservation, imply the involvement of co-regulating TFs in the GC-regulated gene transcriptional program in the beta cell.
Conclusion: In this project we identified potential direct GR gene targets and GR binding properties in the human pancreatic β-cell, revealing at the same time the important role of auxiliary transcription factors in the GC-dependent gene regulation. Overall, this study provides a better understanding of the way GCs could potentially disrupt the normal β-cell function that triggers the development of diabetes in patients undergoing GC treatment.
Supported by: VR-SSF Exodiab, SSF LUDC-IRC, Crafoord Foundation
Disclosure: A. Karagiannopoulos: None.
216
Mitochondrial STAT3 contributes to pancreatic beta cell adaptation in obesity
A. Schaschkow1, L. Pang2, S.A. Litwak2, E. Maillard3, F.M.M. Paula1, D.L. Eizirik1, P. Marchetti4, D.J. Gough5, E.N. Gurzov1;
1ULB Center for Diabetes Research, Brussels, Belgium, 2St Vincent’s Institute of Medical Research, Melbourne, Australia, 3Centre Européen d'Etude du Diabète, Strasbourg, France, 4Department of Clinical and Experimental Medicine, Pisa, Italy, 5Hudson Institute of Medical Research, Melbourne, Australia.
Background and aims: While reduction of β-cell mass and function can be observed in obese diabetic patients, most obese and insulin resistant individuals do not develop diabetes. This is the result of the capacity of β-cells to adapt and produce enough insulin to cover the needs of the organism. The underlying mechanism of β-cell adaptation in obesity, however, remains unclear. Previous studies have suggested a role for STAT3 in mediating β-cell development and function, but little is known about its role in β-cell adaptation in obesity.
Materials and methods: Human pancreas from organ donors with different body mass index (BMI) have been stained for STAT3 by immunofluorescence. To address the functional role of STAT3 in adult β-cells, we generated a tamoxifen-inducible STAT3 β-cell specific knockout model in MIP-CreERT transgenic mice (βSTAT3KO mice) and fed them with high fat diet before analysis. The EndoC-βH1 β-cell line and dispersed human islets were transfected with STAT3 siRNAs and mitochondrial respiration measured.
Results: In human organ donor pancreas (n=3-5), STAT3 was localized in the cytoplasm of β-cells and its expression correlated with BMI (p<0.05, lean vs obese). To study the role of STAT3 in β-cells in vivo, we treated βSTAT3KO homozygous, heterozygous and control mice with oral gavages of tamoxifen at 10 weeks of age to induce complete or 50% STAT3 gene deletion respectively. The mice did not show any metabolic phenotype after 14 weeks when fed a chow diet (n=5-9). We challenged βSTAT3KO and control mice with a high fat diet as model of obesity. Body weight, oxygen consumption, respiratory exchange rate, energy expenditure, food intake and ambulatory activity were similar in 12 weeks high fat fed βSTAT3KO and control mice (n=8-14). Interestingly, homozygous and heterozygous βSTAT3KO mice showed glucose intolerance in oral and intraperitoneal glucose tolerance tests when compared to controls (n=10-14, p<0.05). The serum insulin concentration in βSTAT3KO mice was 2.1-fold lower than in control mice after glucose administration (n=9, p<0.05). No difference was observed in percentage insulin area between βSTAT3KO and control mice, suggesting no changes in β-cell mass. qPCR analysis showed reduced (30-35%) expression of mitochondrial genes Nd4, Nd5 and Cytb in FACS-purified β-cells from βSTAT3KO mice (n=4-5, p<0.05). Mitochondrial STAT3 was confirmed by colocalization studies in β-cells of high fat fed mice and in EndoC-βH1 cells. EndoC-βH1 cells with 80% knockdown of STAT3 have impaired mitochondria activity (n=4, p<0.05). The result was confirmed in 5 out of 6 dispersed human islet preparations, suggesting a mechanism for STAT3-regulated β-cell function.
Conclusion: Our results implicate STAT3 in mediating β-cell adaptation in obesity. We propose a novel role of STAT3 in the regulation of mitochondrial activity during glucose induced insulin secretion in β-cells.
Supported by: NHMRC - FNRS
Disclosure: A. Schaschkow: None.
OP 37 A deep dive into the mechanisms of diabetes
217
Pnliprp1 hypermethylation in human exocrine pancreas reveals a link between diabetes and pancreatic cancer
A. Khamis1,2, M. Canouil1, L. Marselli3, R. Boutry1, M. Suleiman3, N. Jonckheere4, A.M. Schulte5, M. Solimena6, A. Bonnefond1, I. Van Seuningen44, M. Ibberson7, A. Jörns8, S. Lenzen8, P. Marchetti3, P. Froguel1,2;
1Univ. Lille, CNRS, CHU Lille, Institut Pasteur de Lille, UMR 1283/8199 - EGID, Lille, France, 2Imperial College London, Section of Genomics of Common Disease, Department of Metabolism, London, UK, 3University of Pisa, Department of Clinical and Experimental Medicine, Pisa, Italy, 4Univ. Lille, CNRS, Inserm, CHU Lille, UMR9020 – UMR1277 – Canther – Cancer Heterogeneity, Plasticity and Resistance to Therapies, Lille, France, 5Sanofi-Aventis Deutschland GmbH, Diabetes Research, Frankfurt, Germany, 6Paul Langerhans Institute Dresden of the Helmholtz Center Munich at University Hospital Carl Gustav Carus and Faculty of Medicine, Dresden, Germany, 7Vital-IT Group, Swiss Institute of Bioinformatics, 1015, Lausanne, Switzerland, 8Institute of Clinical Biochemistry, Hannover Medical School, Hannover, Germany.
Background and aims: Type 2 diabetes (T2D) is a known risk factor of the mostly lethal pancreatic cancer, but the molecular mechanisms are unknown. The putative epigenetic effects of hyperglycaemia in the exocrine tissue has not yet been explored.
Materials and methods: Pancreatic exocrine tissue from 141 organ donors were isolated and subjected to a genome-wide DNA methylation analysis performed using Illumina’s Infinium ‘850K’ MethylationEPIC array. Genotyping of the same samples was performed using the Illumina Omni2.5M array and combined with methylation data to generate cis-mQTLs (cis-methylation quantitative trait loci) using a cis-window of 50 kb. Biological validation was performed using the rat exocrine cell line AR42J.
Results: We found one FDR-significant epigenetic association with T2D at the cg15549216 probe located within the gene body of the PNLIPRP1 gene (Pancreatic Lipase Related 1 Protein) (beta-value = 11.2 %; FDR = 0.02; unadjusted p-value = 2.1x10⁻⁸; standard error = 0.10). Based on the aggregation of this CpG with two adjacent CpGs (cg06606475 and cg08580014), nominally associated with T2D in the same locus, we identified a strong overall differentially methylated region (with a minimum FDR = 3.2x10⁻¹⁰). We showed that PNLIPRP1 expression was dysregulated in response to high glucose and insulin treatment of the AR42J cell line (35% downregulation; p<0.01). We further investigated a link between PNLIPPR1 and pancreatic cancer and found that the expression of PNLIPRP1 in two human cohorts was significantly decreased in human pancreatic tumour tissue compared to normal tissue (p<0.001). Finally, we combined our methylome analysis with genotyping data of the same samples and found 13 significant cis-mQTLs that co-localised with GWAS SNPs for T2D (including KCNJ11) and pancreatic cancer (ZNRF3and FAM91A1), demonstrating a pleiotropic effect of these variants.
Conclusion: We have identified epigenetic markers for T2D in the exocrine pancreas in genes relevant to pancreatic cancer pathophysiology, providing insight into the link between T2D and pancreatic cancer. Although future studies are needed to investigate the role of PNLIPRP1 in exocrine tissue within the context of T2D, our novel findings provide a foundation for future hypothesis development in clinical studies for prevention and treatment of pancreatic cancer.
Supported by: RHAPSODY IMI
Disclosure: A. Khamis: Grants; RHAPSODY.
218
Anti-insulin receptor antibodies improve hyperglycaemia in a mouse model of human insulin receptoropathy
G.V. Brierley1, H. Webber2, E. Rasijeff2, S. Grocott2, K. Siddle1, R.K. Semple1,3;
1Wellcome Trust-MRC Institute of Metabolic Science, University of Cambridge, Cambridge, 2MRC Disease Model Core, Wellcome Trust-MRC Institute of Metabolic Science, University of Cambridge, Cambridge, 3Centre for Cardiovascular Science, Queen’s Medical Research Institute, University of Edinburgh, Edinburgh, UK.
Background and aims: Biallelic loss-of-function mutations in the insulin receptor (INSR) usually lead to death in childhood or early adult life, and therapeutic options are limited. This study aims to build upon previous proof-of-concept studies in cell model systems and generate a novel mouse model of insulin receptoropathy. This mouse model was used to assess the effects of two thoroughly characterised murine anti-INSR monoclonal antibodies (83-7, 83-14) as surrogate agonists to provide targeted therapy for the treatment of severe insulin resistance arising from insulin receptoropathies.
Materials and methods: A novel mouse model of insulin receptoropathy was generated using adeno-associated virus (AAV) to deliver Cre to the liver of floxed Insr mice. After knockout of endogenous mouse Insr (L-IRKO), adenovirus (AdV) were used to ‘add-back’ mutant human Insr transgenes, enabling the shuttling of different mutant human receptors into the model. Utilising this approach, two mutant human INSR (S350L, D734A) and WT INSR were expressed in the liver of L-IRKO mice. Antibodies were administered twice weekly (10mg/kg) via intraperitoneal injection and glucose metabolism assessed after a five hour fast by oral glucose tolerance test (2g/kg).
Results: Viral vectors effectively transduced the liver of floxed Insr mice resulting in knockout of endogenous mouse INSR (L-IRKO+GFP) and ‘add-back’ of human INSRs. L-IRKO+GFP mice were glucose intolerant and hyperinsulinemic, which was corrected by the add-back of human WT INSR, but not mutant human INSR. Antibody treatment reduced hyperinsulinemia in both S350L and D734A INSR-expressing mice and improved glucose tolerance in D734A INSR-expressing animals. Antibody injection did not cause hypoglycemia in WT INSR-expressing animals. Antibody treatment lead to a downregulation of both WT and mutant INSR protein expression, attenuating its beneficial metabolic effects.
Conclusion: A novel mouse model of insulin receptoropathy was generated in which the therapeutic potential of anti-insulin receptor antibodies with partial agonistic activity could be tested. Antibodies improved glucose tolerance and reduced hyperinsulinemia in the acute model of insulin receptoropathy. However, results imply a narrow therapeutic window due to the effect of antibodies on receptor downregulation.
Supported by: Diabetes UK (15/0005304)
Disclosure: G.V. Brierley: Grants; Diabetes UK (15/0005304), Wellcome Trust (210752/Z/18/Z), MRC (MC_UU_00014/5).
219
Chromatin 3D interaction analysis of the STARD10 locus unveils FCHSD2 as a new regulator of insulin secretion
M. Hu1, I. Cebola2, G. Carrat1, S. Nawaz3, A. Khamis4, M. Canouil4, P. Froguel2, A. Schulte5, M. Solimena6, M. Ibberson7, P. Marchetti8, P. Gadue9, B. Hastoy3, H. McMahon10, G. Rutter1;
1Section of Cell Biology and Functional Genomic, Department of Metabolism, Digestion and Reproduction, Imperial College London, London, UK, 2Department of Metabolism, Digestion and Reproduction, Faculty of Medicine, Imperial College London, London, UK, 3Oxford Centre for Diabetes Endocrinology and Metabolism, University of Oxford, Oxford, UK, 4CNRS, CHU Lille, Institut Pasteur de Lille, University of Lille, Lille, France, 5Diabetes Research, Industriepark Höchst, Sanofi-Aventis Deutschland GmbH, Frankfurt, Germany, 6Molecular Diabetology and DZD, Paul Langerhans Institute, Dresden, Germany, 7Vital-IT Group, SIB Swiss Institute of Bioinformatics, Lausanne, Switzerland, 8Department of Endocrinology and Metabolism, University of Pisa, Pisa, Italy, 9Department of Pathology and Laboratory Medicine, University of Pennsylvania, Philadelphia, USA, 10MRC MRC Laboratory of Molecular Biology, Cambridge, UK.
Background and aims: Genome-wide association studies (GWAS) have identified more than 200 loci in the human genome associated with type 2 diabetes. We recently analysed a locus close to the STARD10 gene and mapped five causal variants within an islet enhancer cluster. Here, we aimed to understand how these variants affect enhancer activity, gene expression and beta cell function.
Materials and methods: EndoC-βH1 cells were used throughout. Promoter-luciferase reporter, chromatin conformation capture (3C), glucose-stimulated insulin secretion (GSIS) assay, membrane capacitance measurements and expression quantitative trait locus analysis (eQTL) were deployed. CRISPR/Cas9 genome editing was used to create the required mutations or deletions.
Results: We first analysed the enhancer regions at this locus. Of these, R2 displayed a 6-fold increase of luciferase activity compared with the empty vector [control, 1.26 ± 0.06 vs. R2, 7.82 ± 0.17; p<0.001; n=3]. Deletion of R2 using CRISPR/Cas9 reduced STARD10 (fold; Control 1 vs. dR2, 0.39 ± 0.07; p<0.001, n=3) and FCHSD2 (fold; Control 1 vs. dR2, 0.7 ± 0.06; p<0.01, n=3) gene expression, and lowering of GSIS (15/0.5 mM glucose, fold change: Control, 3.07 ± 0.11 vs. dR2, 1.72 ± 0.16; p<0.05; n=4). 3C assays demonstrated that the causal variants interact with R1 and R13 enhancers through chromatin looping. Deletion of the variant region (VR) reduced the chromatin interaction between R1 and R13, lowered STARD10 (fold: control 1 vs. dVR, 0.765 ± 0.03; p<0.01, n=3) and FCHSD2 (fold: control 1 vs. dVR, 0.859 ± 0.03; p<0.01, n=3) mRNAs and reduced GSIS (15/0.5 mM glucose, fold change: control, 2.00 ± 0.11 vs. dVR, 1.64 ± 0.06; p<0.05; n=4). Deletion of STARD10 reduced GSIS (15/0.5 mM glucose, fold change: Control, 2.56 ± 0.14 vs. STARD10-KO, 2.12 ± 0.19; p<0.05; n=4) while FCHSD2 deletion reduced basal insulin secretion (0.5/0.5 mM glucose, fold change: Control, 1 ± 0 vs. FCHSD2-KO, 0.78 ± 0.053; p<0.05; n=4). In preliminary measurements of capacitance changes, a non-significant tendency towards lowered exocytosis was observed after FCHSD2 inactivation. A nominal association by eQTL analysis was observed with rs1552224 and FCHSD2 expression in analysis of 103 samples from IMIDIA consortium (n=47 non diabetes, n=56 T2D, p=0.013). The association with STARD10 expression was similarly significant in these samples (p=2.98 x 10⁻⁴).
Conclusion: Both STARD10 and FCHSD2 contribute to disease risk at the STARD10 locus and might provide new therapeutic targets.
Supported by: Wellcome Trust Senior Investigator, MRC Programme grants
Disclosure: M. Hu: None.
220
Non-parallel roles of three disulfide bonds in proinsulin folding and pathogenesis of diabetes
Y. Yang, H. Shu, Y. Huang, X. Zhang, L. Ding, M. Liu;
Department of Endocrinology and Metabolism, Tianjin Medical University General Hospital, Tianjin, China.
Background and aims: Proinsulin (PI) has three evolutionarily conserved disulfide bonds (B7-A7, B19-A20, and A6-A11), which are critical for PI folding in the endoplasmic reticulum (ER). The B19-20 bond is considered as the most important and the first formed bond during oxidative folding of PI. Insulin gene mutations disrupting any one of the three disulfide bonds can lead to proinsulin misfolding and diabetes in humans. Diabetogenic effects of unpaired B7-A7 or A6-A11 bonds has been experimentally confirmed in mouse lines and transgenic pigs. However, transgenic expression of C(B19)G mutation did not impair glucose homeostasis and cause β-cell apoptosis in zebrafish, suggesting that diabetogenic effect caused by disruption of B19-A20 bond remain to be elucidated. In a program screening for monogenic diabetes in China, we identified PI-C(B19)Y mutation in a patient with neonatal diabetes. In this study, we aimed to characterize biological behavior and diabetogenic function of PI-C(B19)Y.
Materials and methods: We established Ins2 KI mouse lines heterozygous and homozygous for PI-C(B19)Y mutation in C57BL/6J background using CRISPR/Cas9 mediated genome editing. We monitored fasting blood glucose (FBG) and body weight (BW) of mice weekly and performed intraperitoneal glucose tolerance test (IPGTT) monthly. Serum insulin levels were detected by Elisa. Pancreatic islet cell composition were detected by immunohistochemistry and confocal immunofluorescence. The insulin content and cellular response in KI mouse islets were examined by western blotting. For in vitro experiments, PI-WT and different mutants that disrupt either B7-A7, or B19-A20, or A6-A11, respectively, were transiently expressed in HEK293T cells and Min6 cells. The oxidative folding, the ER export, degradation and the dominant negative effects of PI-WT or mutants were analyzed using SDS-PAGE under both non-reducing and reducing conditions.
Results: In the heterozygous KI mice, although intra-islets insulin content decreased, no significant differences in FBG, BW and IPGTT were observed compared with that of wild-type mice. However, in the homozygous KI mice, insulin content was further decreased, which led to glucose intolerance at about 2 months of age. We compared formation of abnormal disulfide-linked proinsulin complexes (DLPC) formed between PI-WT and mutants. We found that C(A7)Y and C(A6)Y formed large amount of DLPC with co-expressed PI-WT in the ER. However, C(B19)Y did not appear to form DLPC. The intracellular degradation rate of C(B19)Y was faster than that of C(A7)Y and C(A6)Y, suggesting that C(B19)Y is less stable in the cells. More importantly, due to its instability and less interactions with co-expressed PI-WT, C(B19)Y showed much less degree of dominant negative effect, which accounted for mild diabetes phenotype in KI mice.
Conclusion: PI-C(B19)Y mutant induced diabetes causes proinsulin ER entrapment, leading to decreasing insulin production from mutant PI. However, unlike other two PI mutants, C(A7)Y and C(A6)Y, that cause severe insulin deficient early onset diabetes, C(B19)Y has less significant dominant negative effect on co-expressed PI-WT, leading to mild late onset diabetes. This study not only uncovers molecular mechanism of diabetes caused by C(B19)Y, but also reveals non-parallel roles of PI disulfide bonds in PI folding and diabetes phenotypes.
Supported by: NNSFC, National Key R&D Program,Tianjin Municipal Science and Technology Commission of China
Disclosure: Y. Yang: None.
OP 38 Triggers and drivers of beta cell failure in type 1 diabetes
221
Presentation of insulin granule derived peptides on MHC I in Enterovirus-infected beta cells and type 1 diabetes
Z. Marinicova1, M. Ghosh2, K.-P. Knoch1, A. Petzold1, C. Wegbrod1, A. Sönmez1, R. Scharfmann3, S. Stevanović2, M. Solimena1;
1Paul Langerhans Institute Dresden, of the Helmholtz Center Munich, Dresden, Germany, 2Department of Immunology, University of Tübingen, Tübingen, Germany, 3Endocrinology, Metabolism and Diabetes, INSERM U1016, Institut Cochin, Paris, France.
Background and aims: Type 1 diabetes (T1D) results from autoimmune destruction of the insulin producing pancreatic beta cells. Enteroviruses (EVs), including Echoviruses, have been studied as possible factors for T1D onset and/or progression. Our lab found that EV infection decreases the stores of mature secretory granule (SG) cargoes such as insulin, ICA512/IA-2/PTPRN, PC1/3, PC2 and CgA, some of which are targets of autoimmunity in T1D. This depletion likely results from intracellular protein degradation, which is the main pathway to generate antigen peptides presented on MHC I. We hypothesize that EV-induced degradation of mature SG proteins alters the presentation of peptides thereof, hence possibly influencing the response of activated autoreactive CD8+ T-cells toward these antigens.
Materials and methods: 1x10⁸ ECN90 human beta cells/replicate were infected with Echovirus 9 strain DM, which was isolated from a diabetic patient who died of ketoacidosis, under multiplicity of infection 0,003 plaque-forming units/cell. After a 48h incubation, several viral and cellular markers were assessed by western blotting. HLA I molecules were immunoisolated from infected and control ECN90 cells; eluted HLA I-bound peptides were identified by LC-MS/MS, and compared for their presence and abundance between infected and control ECN90 cells.
Results: Infection conditions were optimized based on a) detection of the viral protein VP1; b) cleavage of cellular factors eIF4G, PABP1, PTBP1, PARP and Cas3 to assess the stage of cell infection; c) levels of ICA512 and ChgA and their proforms to assess the size of SG stores; d) levels of HLA I and β2 microglobulin to confirm sufficient antigen presentation. About 500 unique HLA I presented peptides were found per replicate and condition with purity of 89% (peptides predicted to bind HLA alleles expressed by ECN90 cells). In total, we detected 23 peptides from known T1D autoantigens associated with SGs (e.g. insulin, chromogranin A, ICA512) in both conditions. The majority of them were predicted to bind HLA I alleles B4001 and A0201, while two viral peptides were found to bind B4001 and A0301 alleles. The distribution of unique peptides presented by infected ECN90 cells significantly differed from those presented by control cells as 54 unique peptides were present only in all infected samples and none of uninfected and 13 peptides were only found in uninfected cells.
Conclusion: Antigen presentation is altered in EV-infected ECN90 cells. We identified several novel autoantigen epitopes, including 4 novel A0201 restricted epitopes from IAPP, HSPA5, ICA512 and IA-2/PTPRN2, which will be characterized with pHLA tetramers for their reactivity with CD8+ T-cells from subjects with T1D and healthy controls.
Supported by: EU-IMI INNODIA, DZD e.V., DFG IRTG 2251: ICSMD
Disclosure: Z. Marinicova: None.
222
Diabetogenic CD4+ T-cells induce autoimmune diabetes in an interferon regulatory factor 4-dependent manner
T. Niri1, S. Akazawa2, M. Miwa3, M. Kobayashi4, N. Abiru1;
1Division of Advanced Preventative Medical Sciences, Nagasaki University Graduate School of Biomedical Sciences, Nagasaki, 2Atomic Bomb Disease Institute, Nagasaki University, Nagasaki, 3Department of Metabolism/Diabetes and Clinical Nutrition, Nagasaki University Hospital, Nagasaki, 4Center for Health and Community Medicine, Nagasaki University, Nagasaki, Japan.
Background and aims: Both acquired and innate immune system are essential for the development of autoimmune diabetes. We previously reported that haploinsufficiency of the transcription factor interferon regulatory factor 4 (IRF4) almost completely suppressed the onset of spontaneous diabetes in NOD mice. To clarify which immune cell types were responsible for the protection from autoimmunity by IRF4 deficiency, we established IRF4 gene-deleted BDC2.5 TCR transgenic NOD mice (BDC2.5Tg-NOD) or Rag1 knockout NOD mice (Rag1KO-NOD) and observed spontaneous progression of diabetes and conducted adoptive transfer experiments as follows.
Materials and methods: BDC2.5Tg-NOD and Rag1KO-NOD were crossed with IRF4 deficient NOD mice respectively to produce wild-type (wt), Irf4+/-, Irf4-/--BDC2.5Tg-NOD and -Rag1KO-NOD. Then, wt, Irf4-/--BDC2.5Tg-NOD were crossed with wt, Irf4-/--Rag1KO-NOD respectively to produce wt, Irf4-/--BDC2.5Tg Rag1KO-NOD mice, and the incidence of spontaneous progression of diabetes was observed by consecutive blood glucose monitoring. In adoptive transfer experiments, firstly, naïve BDC2.5-TCR T cells (CD62L+CD4+ T cells) magnetically isolated from wt, Irf4+/-, Irf4-/--BDC2.5Tg-NOD were intravenously transferred into wt-Rag1KO-NOD. Secondly, naïve wt-BDC2.5-TCR T cells were transferred into wt, Irf4+/-, Irf4-/--Rag1KO-NOD recipients. Each experiments were followed by consecutive blood glucose monitoring in the recipient mice to evaluate incidence of diabetes.
Results: Irf4-/--BDC2.5Tg Rag1 KO-NOD were completely protected from the spontaneous progression of diabetes whereas wt-BDC2.5Tg Rag1 KO-NOD showed rapid diabetes-onset at 27 days of median duration after birth (p<0.01). In adoptive transfer experiments, the diabetes-onset was completely protected in wt Rag1KO-NOD recipients transferred with Irf4-/--BDC2.5 T cells (p<0.01), and suppressed up to 50% in those with Irf4+/--BDC2.5 T cells (p=0.03), respectively compared to those with wt donor-T cells. In contrast, no significant differences were observed in the cumulative incidence of diabetes among Irf4-/--, Irf4+/-- and wt-Rag1KO-NOD recipients transferred with wt-BDC2.5 T cells. The median duration of diabetes-onset in Irf4-/--Rag1KO-NOD recipients were 17 days after transfer with a significant delay compared to 13 days of median duration in wt-recipients (p<0.04). Irf4+/--Rag1KO-NOD recipients transferred with wt-donors developed delayed diabetes without statistically significance compared to wt-recipients.
Conclusion: IRF4 deficiency abrogates effector function of diabetogenic CD4+ T cells in gene-dose dependent manner and attenuates innate immune function to delay the onset of autoimmune diabetes. IRF4 predominantly controls adaptive immunity as well as it adjunctively promotes innate immune responses towards progression of diabetes in NOD mice.
Disclosure: T. Niri: None.
223
The role of NF-κB-inducing kinase (NIK) in beta cell-mediated inflammation in type 1 diabetes
P. Xiao1, T. Takiishi1, N.M. Violato1, G. Licata2, F. Dotta2, G. Sebastiani2, A.K. Cardozo1;
1ULB Center for Diabetes Research, Université Libre de Bruxelles (ULB), Brussels, Belgium, 2Dept. of Medical Sciences, Surgery and Neurosciences, University of Siena, Siena, Italy.
Background and aims: In type 1 diabetes (T1D) β-cell destruction results from an aberrant inflammatory crosstalk between the β-cells and immune-cells mediated, partly, via activation of the transcription factor NF-κB. NF-κB signaling occurs via two major pathways called canonical and the alternative. The alternative pathway is characterized by stabilization of the NF-κB-inducing kinase (NIK) triggering p100 processing into p52, which dimerizes with RelB to regulate gene transcription. The canonical NF-κB pathway was shown to contribute to β-cell death in T1D, however, the role of the alternative pathway in T1D is unknown. Ligands that activate the alternative pathway (e.g. LIGHT, CD40L) are present in the serum of T1D patients and are involved in pathogenesis in non-obese diabetic mice. We previously identified that in vitro cytokine treatment, which induces β-cell death, promotes NIK stabilization and activation of downstream NF-κB signaling in rat β-cells. Thus, the aim of this study is to characterize the role of NIK in β-cell demise during T1D and its regulation on peripheral and local immune responses.
Materials and methods: To evaluate the role of NIK specifically in β-cells we developed a β-cell specific NIK KO mouse (NIKβKO). To verify if lack of NIK in β-cells affects its development and function we followed NIKβKO mice and wild type littermates (WT) up to 24 weeks. Mouse glycemia and bodyweight were measured weekly and intraperitoneal glucose tolerance tests (ipGTT) were performed at 12 and 24 weeks of age. Insulin content of the islets were measured when mice were euthanized. To induce T1D, mice were injected with multiple low doses of streptozotocin (MLDSTZ). Mice were sacrificed 14 and 45 days after the last streptozotocin injection. The metabolic parameters described above were measured weekly and (ipGTT) were performed at both endpoints. Moreover, to evaluate immune profiles, T cell and myeloid cell populations were analysed by FACS in blood, spleen and pancreatic draining lymph nodes (pLN) of mice sacrificed at day 14.
Results: Under physiological conditions lack of NIK didn’t affect β-cell development nor function. However, after MLDSTZ treatment, a significantly higher diabetes incidence in NIKβKO mice was observed (83% NIKβKO mice vs 40% WT, n=15-17, p<0.05). Moreover, NIKβKO mice had markedly worse glucose control compared to WT during an IPGTT (492 mg/dL NIKβKO vs 400 mg/dL WT, p<0.05, 15 min). Furthermore, our preliminary results shows that NIKβKO mice display a discreet reduction in the frequency of regulatory T cells (Tregs) (CD4+Foxp3+, 12.5%±5.6% NIKβKO vs 14.6%±4.8% WT) but noticeable higher frequencies of cytotoxic CD8+IFN-γ+ lymphocytes (55.0%±23.8% NIKβKO vs 38.2%±18.9% WT) in the pLN. Particularly, NIKβKO mice presented higher cytotoxic/Treg ratio (9.2±9.2 NIKβKO vs 3.8±4.0 WT) indicating local immune dysregulation in KO β-cells. Overall, the data suggest stronger inflammatory responses in β-cells that are KO for NIK, indicating a protective role for NIK in T1D.
Conclusion: Our new results unveiled NIK as a new player on the crosstalk between β-cells and the immune cells leading to T1D. Revealing the downstream players of these network may allow new targeted approaches to treat or prevent T1D development.
Supported by: Excellence of Science Grant – FNRS/FWO
Disclosure: P. Xiao: Grants; Excellence of Science Grant (EOS) Fonds National de Recherche Scientifique.
224
Ptpn2 is a pro-inflammatory cytokine regulator and novel player in the endoplasmic reticulum stress response in beta cells
B. Elvira Jimenez, V. Vandenbempt, E. Gurzov;
Signal Transduction and Metabolism Laboratory, ULB Center for Diabetes Research, BRUSSELS, Belgium.
Background and aims: Type 1 diabetes (T1D) results from autoimmune destruction of β cells. Previous studies have demonstrated that sustained inflammation induces endoplasmic reticulum (ER) stress in β cells, resulting in cellular dysfunction and eventually cell death. Available evidence suggests that protein tyrosine phosphatases play a key role in the break of tolerance and development of T1D. Our aim is to study the role of PTPN2, a candidate gene for T1D, in the stressed β cell in a pro-inflammatory environment and dysregulated signaling.
Materials and methods: PTPN2 was silenced by transfection of siRNAs in the human EndoC-βH1 cell line. The nuclear (45kDa) or ER (48kDa) isoforms of PTPN2 were overexpressed by adenovirus transduction. Transfected and transduced cells were treated with hIFN-γ (1000U/ml) in a pulse-chase experiment. ER stress was induced in transfected and transduced cells with thapsigargin (TG, 1μM) and cyclopiazonic acid (CPA, 75μM) for 48h. β-cell apoptosis was evaluated by Hoechst 33342/propidium iodide staining and caspase-3 activation. The effect of TG on intracellular calcium levels under basal condition was examined by Fura-2 dye in transfected cells.
Results: PTPN2 knockdown (>70%, p<0.001) increased pSTAT1 (p<0.001) at the timepoints 0, 2 and 4h and pSTAT3 (p<0.05) 2h vs control after hIFN-γ exposure. The mRNA levels of the chemokines CXCL9 and CXCL10 were increased at 24h after hIFN-γ treatment and PTPN2 knockdown: 2 fold, p<0.05, and 1.5 fold, p<0.05, respectively. Adenovirus-mediated overexpression of the nuclear (45kDa) but not the ER (48kDa) isoform of PTPN2 decreased hIFN-γ-induced pSTAT1 activation. PTPN2 silencing sensitized EndoC-βH1 cells to TG-induced apoptosis (47±3% in PTPN2-silenced vs 36±1% in control cells, p<0.01) and significantly increased expression levels of the ER stress markers CHOP, ATF3, ATF4, peIF2α and ER chaperone BiP (p<0.05, p<0.001). Overexpression of the 48kDa PTPN2 isoform (5.6 fold, p<0.001) protected EndoC-βH1 cells from TG-induced apoptosis (39±3% in 48kDa PTPN2-overexpressed vs 49±3% in control cells, p<0.05) but not the 45kDa PTPN2 isoform (46±3% in PTPN2-overexpressed vs 49±3% in control cells). We confirmed the results with a second ER stressor, CPA: 45±3% apoptosis in PTPN2-silenced vs 29±2% in control cells, p<0.001 and 24±1% apoptosis in 48kDa PTPN2-overexpressed vs 31±1% in control cells, p<0.05). PTPN2 silencing decreased the intracellular calcium levels (p<0.05), suggesting a mechanism for the 48kDa PTPN2 function in the ER in β cells.
Conclusion: The 45 kDa nuclear isoform of PTPN2 reduces hIFN-γ response in β cells via STAT1/STAT3-dependent signaling pathways. The 48kDa ER isoform of PTPN2 protects β cells from ER stress-induced signaling and apoptosis. Our results demonstrate isoform-dependent dissociation of the PTPN2 activity, and postulate PTPN2 as an important protective factor in β cells in inflammation and ER stress.
Supported by: F.R.S-FNRS Charge de recherches and ERC consolidator grant
Disclosure: B. Elvira Jimenez: Grants; F.R.S-FNRS Charge de Recherches, ERC consolidator grant.
OP 39 Gastro-entero pancreatic factors: organoids, mice and men
225
Characterisation of human GLP-1 secreting cells after fluorescent tagging in primary ileal organoids
F. Reimann, D. Goldspink, V. Lu, E. Miedzybrodzka, C. Smith, R. Foreman, L. Billing, R. Kay, F. Gribble;
Addenbrooke's Hospital, University of Cambridge, Cambridge, UK.
Background and aims: Injectable Glucagon-like peptide-1 (GLP-1) receptor agonists are widely used in the treatment of type2 diabetes and obesity. Bariatric surgery profoundly exaggerates postprandial GLP-1 plasma excursions, suggesting an alternative therapeutic strategy of targeting endogenous GLP-1 pools located in distal intestinal L-cells, found scattered in and constituting <1% of the epithelium. Whereas our understanding of murine L-cell physiology has been enhanced by studying transgenic mice with fluorescently tagged L-cells, it has not been possible to study stimulus secretion coupling in human L-cells in detail. In this project we fluorescently tagged human L-cells in ileal organoids to study L-cell physiology.
Materials and methods: CRISPR-Cas9 was used to engineer a P2A ribosomal stutter sequence followed by the fluorescent protein Venus-sequence 3’ of the proglucagon coding-sequence in chromosome 2. Bulk RNAseq and LC-MS/MS were used to characterise L-cell transcriptome and peptidome, respectively, after FACSorting. GLP-1 secretion was measured by ELISA in organoid supernatants, single-cell Ca2+-dynamics were monitored after Fura2-loading and whole-cell patch recordings were used to assess electrophysiological activity in response to different agonists.
Results: Co-immunohistochemistry confirmed labelling of >90% of glucagon-expressing cells with Venus in human ileal organoids and vice versa. Addition of Notch- and MEK-inhibitors to standard IF-medium (IF*) boosted L-cell frequency ~5-fold from 0.4±0.1% (n=5) to 2.1±0.6% (n=3) of all cells. L-cells were enriched for other hormones, including peptideYY and neurotensin, by transcriptomic and peptidomic analysis. L-cell transcriptomic profiles were clearly different from non-fluorescent cells and broadly similar in IF (n=5) and IF* (n=3) medium. GPCR-mRNAs enriched in L-cells included the bile acid receptor GPBAR1, lipid sensing receptors FFAR1 and GPR119 and the vasopressin receptor AVPR1B. Agonists for these receptors stimulated GLP-1 secretion (mn±sem -fold increase relative to control (10 mM glucose): GPBAR1A [3 μM] 7.9±0.9 n=12; FFAR1 agonist AM1638 [10 μM] 6.1±0.5 n=19, GPR119 agonist AR231453 [100 nM] 3.3±0.2 n=6, AVP [10 nM] 4.9±0.7 n=10). AM1638 [10μM], AVP [10 nM] and KCl [70 mM] increased cytosolic Ca2+ (median (IQR; n) 1.08 (1.03-1.28; 56), 2.25 (1.45-3.04; 24) and 3.47 (2.08-5.67; 91) -fold, respectively. Human L-cells were electrically excitable and the interspike membrane potential (-60±1.6 mV) depolarised in response to glucose (10 mM, ΔVm 4.5±1.2 mV n=13) resulting in an increase in action potential frequency. This effect was more pronounced when cAMP levels were elevated, and in the presence of forskolin [10 μM] glucose-stimulated GLP-1 secretion was sensitive to inhibition of sodium-coupled glucose uptake with phloridzin (mn±sem -fold increase relative to control (10 mM glucose): fsk [10 μM] 5.9±0.3 n=6; fsk+phloridzin [5 μM] 4.3±0.1 n=6; p<0.001).
Conclusion: Human L-cells employ similar sensing machinery to their murine counterparts. The ability to label and maintain human L-cells in organoid culture opens new avenues to explore L-cell function and develop drugs targeting the human enteroendocrine system, either to stimulate L-cell secretion or to boost L-cell numbers.
Supported by: Wellcome Trust, MRC, BBSRC, LGC
Disclosure: F. Reimann: None.
226
Metabolic surgery recovers Ca 2+ dynamics across pancreatic islets in obese mice
E. Akalestou, K. Suba, L. Lopez-Noriega, E. Georgiadou, P. Chabosseau, I. Leclerc, V. Salem, G.A. Rutter;
Imperial College London, London, UK.
Background and aims: Metabolic surgery improves both glucose tolerance and insulin sensitivity in T2D but its impact on insulin secretion is difficult to monitor continuously and directly. The impact of surgery on β-cell function and the time course of this effect, remain unclear. To investigate the effect of metabolic surgery on β-cell function in vivo, we imaged Ca2+ dynamics prospectively and at the cellular level in islets engrafted into the anterior eye chamber.
Materials and methods: Ins1Cre mice were crossed to animals that express the genetic calcium indicator GCaMP6f behind a LoxPSTOPLoxP cassette. Isolated islets were engrafted into male C57BL6 mice maintained for 12 weeks on high fat/high sucrose diet (HFD). Mice were separated into Vertical Sleeve Gastrectomy (VSG) (n=7) and sham (n=6) groups. Islets were imaged in anaesthetised mice at post-operative weeks 4, 8 and 10 using a Nikon microscope equipped with a spinning disc, 488 nm laser and 20x/0.8 water immersion objective. Islets were categorised for wave activity when these were recurrent, showed a defined point of origin and covered> 75 % of the image plane. Glucose (3g /kg) tolerance and insulin and incretin secretion were assessed in parallel.
Results: The VSG group initially demonstrated substantial weight loss but regained pre-operative weight by week 10. However, VSG mice displayed significantly improved glucose tolerance (p<0.001) and insulin secretion (p<0.01), as well as increased basal (21.8pmol/L ±0.9) and post-prandial (135.5pmol/L ±35) GLP-1 secretion (p<0.01), when compared to sham mice. VSG improved coordinated Ca2+ activity, with 100% of islets observed exhibiting enhanced wave readouts 8 weeks post-surgery, while islet wave activity dropped to zero discernible coordinated islet Ca2+ dynamics by week 10 in the sham group. Moreover, the percentage of significantly connected cell pairs and correlation coefficient decreased vastly in the sham group at week 10, while the VSG group remained stable across the length of the study. Although percentage of pancreatic area occupied by β-cells was not changed between the two groups (0.65% ±0.5), α to β cell ratio was increased in the VSG group (p<0.01), indicating higher α-cell population.
Conclusion: Continuous imaging of islet function in the eye in vivo demonstrates that metabolic surgery leads to an increase in glucose-induced Ca2+ dynamics of individual islets in a time-dependent manner, likely to underlie increased insulin secretion.
Supported by: Wellcome Trust, Rosetrees Foundation, MRC, DUK
Disclosure: E. Akalestou: None.
227
Impaired insulin secretion via Wnt signalling induces diabetes in pancreatic cancer patients: insights from a prospective cohort study
M. Lee1, H. Park2, S. Kang2;
1Yonsei University College of Medicine, Seoul, 2Gangnam Severance Hospital, Seoul, Republic of Korea.
Background and aims: Pancreatic ductal adenocarcinoma (PDAC) patients are known to have a higher prevalence of new-onset diabetes but the mechanisms are largely unknown.
Materials and methods: We built a prospective cohort composed of 160 patients scheduled for pancreatectomy mainly as pylorus preserving pancreaticoduodectomy (PPPD) (72 PDAC patients, 88 non-PDAC patients). The patients underwent 75g oral glucose tolerance test before, and 2 weeks and 1year after pancreatectomy. Pancreatic tissues were obtained during surgical resection.
Results: Compared with non-PDAC patients, PDAC patients had a higher prevalence of new-onset diabetes (31.9% vs. 19.3%, p = 0.012), with a higher HbA1c level and decreased insulin secretory function. After PPPD, there was a consistently larger improvement of HbA1c in PDAC patients than in non-PDAC patients. Furthermore, unlike non-PDAC patients whose insulin secretion was consistent before and after PPPD, PDAC patients revealed a significant improvement in insulin secretion 1 year after PPPD, suggesting that a diabetogenic factor secreted from pancreatic cancer may induce hyperglycemia by suppressing the insulin secretion. In immunofluorescent staining of pancreatic tissue, PDAC patients had a higher β-catenin expression than that of non-PDAC patients. Pancreatic β-catenin expression positively correlated with hyperglycemia and negatively correlated with insulin secretion in PDAC patients only. The plasma level of Wnt5a, which was highly expressed in PDAC cells compared to normal ductal cells, positively correlated with pancreatic β-catenin level and was elevated in PDAC patients with new-onset hyperglycemia compared with non-PDAC patients. Treatment with Wnt5a significantly suppressed insulin release in response to glucose stimulation in isolated mouse islets.
Conclusion: In conclusion, the development of PDAC-induced hyperglycemia could result from an impaired insulin secretion by activated Wnt5a/β-catenin pathway in PDAC patients.
Supported by: Ministry for Health, Welfare & Family Affairs
Disclosure: M. Lee: None.
228
Effect of macronutrient composition and energy content on postprandial secretion of satiety hormones and next meal food intake
C. Martinussen1, M.S. Svane1, K.N. Bojsen-Møller1, B.V. Andersen2, O.J. Hulme3, D.V. Byrne2, H.R. Siebner3, K. Hermansen4, S. Gregersen4, J.F. Rehfeld5, B. Hartmann6, J.J. Holst6, S. Madsbad1;
1Dept. of Endocrinology, Hvidovre Hospital, 2Food Quality Perception and Society Team, iSense lab, Dept. of Food Science, Aarhus University, 3Danish Research Centre for Magnetic Resonance, Center for Functional and Diagnostic Imaging and Research, Hvidovre Hospital, 4Dept. of Endocrinology and Internal Medicine, Aarhus University Hospital, 5Department of Clinical Biochemistry, Rigshospitalet, 6Dept. of Biomedical Sciences and NNF Center for Basic Metabolic Research, University of Copenhagen, Denmark.
Background and aims: The satiating capacity of food depends on its energy content and macronutrient composition with proteins having a greater satiating effect per unit energy than carbohydrates and fats. It is unknown whether this is related to differences in secretion of appetite-regulating hormones from the gut and pancreas. We investigated the impact of 4 different preload meals with varying energy content and protein/carbohydrate (P/C) ratio on secretion of satiety hormones (glucagon-like peptide-1, GLP-1; Peptide YY, PYY; cholecystokinin, CCK; and insulin) and next meal food intake.
Materials and methods: In a randomized, single-blinded, cross-over design, 24 healthy male participants (age 24.9 range 20-40 years, BMI 23.2 range 20.9-24.9 kg/m2) ingested 4 different preload meals. A: 1679 kcal, P/C ratio 2.1 (HighPROHighCAL) B: 1680 kcal, P/C ratio 0.2 (LowPROHighCAL) C: 839 kcal, P/C ratio 2.1 (HighPROLowCAL) D: 840 kcal, P/C ratio 0.2 (LowPROLowCAL). The preloads consisted of meal replacement powder (Queal) mixed in water to which was added either Whey Protein Isolate (HighPRO) or Lactose Monohydrate (LowPRO). Paracetamol was added to all meals to assess gastric emptying rate. Blood was sampled before and frequently after the preload (at -15, -5, 20, 35, 50, 65, 100, 120, 140, 180 min; n=23). Subjective appetite and satiety were evaluated using visual analogue scores. After 180 min, an ad libitum meal was served to investigate the effect of the preloads on next meal caloric intake. Data were analyzed in linear mixed effects model with P/C ratio and energy content as independent variables. Hormone responses are presented as 3-h area-under-the-curve.
Results: Ad libitum food intake 3 h after the preloads did not differ significantly (HighPROHighCAL 1122 ± 306 kcal; LowPROHighCAL 1166 ± 266 kcal; HighPROLowCAL 1205 ± 284 kcal; LowPROLowCAL 1214 ± 276 kcal; mean ± SD). Preloads with high energy and protein content led to increased satiety and lower hunger scores compared with preloads with low energy and protein content after 3 h. Paracetamol absorption rate (gastric emptying) was comparable between the 4 preloads. Peak plasma glucose was lower after HighPRO vs. LowPRO (p<0.001) and greater after HighCAL vs. LowCAL (p<0.001). Plasma insulin (p<0.01), GLP-1 (p<0.01) and CCK (p<0.01), but not PYY (p=0.16), depended on the energy content of the preload (HighCAL > LowCAL) but none of the hormonal responses depended on the P/C ratio (p=0.68 for insulin, p=0.15 for GLP-1, p=0.46 for CCK, p=0.62 for PYY).
Conclusion: Postprandial secretion of satiety hormones was determined by meal energy content rather than macronutrient composition. The results suggest that factors other than acute gut hormone secretion explain the greater satiating capacity of proteins compared with carbohydrates.
Clinical Trial Registration Number: NCT03900130
Supported by: We thank Arla Food for Health for funding the OmniSaM project (The omnibus satiety metric)
Disclosure: C. Martinussen: None.
OP 40 New aspects of novel therapies
229
Effects of 5 weeks of treatment with dapagliflozin, a SGLT2 inhibitor, on energy metabolism in patients with type 2 diabetes
Y. Op den Kamp1, M. de Ligt1, B.D. Dautzenberg1, R. Esterline2, J. Hoeks1, V.B. Schrauwen-Hinderling1,3, B. Havekes4, J. Oscarsson5, E. Phielix1, P. Schrauwen1;
1Nutrition and Movement Sciences, Maastricht University, Maastricht, Netherlands, 2BioPharmaceuticals R&D, AstraZeneca, Gaithersburg, USA, 3Radiology and Nuclear Medicine, Maastricht University Medical Center, Maastricht, Netherlands, 4Internal Medicine, Maastricht University Medical Center, Maastricht, Netherlands, 5BioPharmaceuticals R&D, AstraZeneca, Gothenburg, Sweden.
Background and aims: To explore the effects of dapagliflozin (DAPA) on insulin sensitivity, 24h energy metabolism and skeletal muscle mitochondrial function in patients with type 2 diabetes (T2D).
Materials and methods: Twenty-six T2D patients with HbA1c between 42 and 75 mmol/mol, were randomized to a double blind, cross-over study. Examinations were done at the end of the 5-week treatment periods, separated by 6-8-week wash-out. 24h energy- and substrate metabolism was measured in respiration chambers, and blood was sampled at 7 time points. A two-step euglycemic hyperinsulinemic clamp (10 and 40 mU/m2/min) with infusion of [6.6-2H2] glucose to determine glucose rate of disposal (Rd), endogenous glucose production (EGP) and indirect calorimetry was performed. Intramyocellular (IMCL), intrahepatic lipid (IHL) content and resting and post-exercise (70% Wmax) muscle acetylcarnitine were analysed by 1H-Magnetic Resonance Spectroscopy (MRS). Phosphocreatine recovery upon exercise was measured by 31P-MRS and body composition by DEXA. Ex vivo mitochondrial respiration was measured in a muscle biopsy taken after overnight fast. Results are presented as the LSM (95% CI) difference between treatments.
Results: Evaluable patients (n=24) had a mean (SD) age of 64.2(4.6) years, BMI of 28.1(2.4) kg/m2, and HbA1c of 51.7(6.8) mmol/mol. Patients were on metformin or no antidiabetic therapy. DAPA decreased total body weight (-1.12 (-1.66, -0.58) kg, p<0.01). Rd was unaffected by DAPA, while fasting EGP increased (+2.27 (1.39, 3.14) μmol/kg/min, p<0.01), EGP upon insulin infusion was unchanged. A trend towards a larger increase in carbohydrate oxidation (+0.77 (-0.37, 1.91) μmol/kg/min, p=0.11) and a larger decrease in fatty acid oxidation (-0.28 (-0.65, 0.09) μmol/kg/min, p=0.13) upon insulin infusion was observed. 24h energy expenditure (-0.11 (-0.24, 0.03) MJ/day), sleeping metabolic rate or diet-induced thermogenesis were unaffected by DAPA. DAPA reduced RER during day- (-0.024 (-0.034, -0.014), p<0.01) and night-time (-0.033 (-0.046, -0.020), p<0.01). Day-time glucose was lower (p<0.01), while free fatty acids (p<0.01) and β-hydroxybutyrate (p<0.05) levels were higher upon DAPA. On placebo, urinary glucose loss was neglectable, whereas DAPA induced a 24h glucose loss of about 90g; rate of glucose loss was 50% lower during the night compared to daytime. IMCL increased upon DAPA (+0.06 (0.01, 0.11) %, p<0.05), whereas IHL decreased (-0.29 (-2.53, 1.94) %, p<0.05). DAPA had no effect on ex vivo mitochondrial respiration, phosphocreatine recovery rate or acetylcarnitine metabolism.
Conclusion: Five weeks dapagliflozin treatment in T2D patients had no effect on insulin sensitivity or energy expenditure, while 24h fatty acid oxidation was increased. A trend towards improved metabolic flexibility was observed. Intramyocellular lipids were increased and intrahepatic lipids decreased, but skeletal muscle mitochondrial function was not changed by dapagliflozin treatment.
Clinical Trial Registration Number: 2016-003991-27
Supported by: AstraZeneca
Disclosure: Y. Op den Kamp: None.
230
The SGLT2 inhibitor empagliflozin does not stimulate compensatory appetite responses in patients with excess adiposity and type 2 diabetes
M.J. Davies1,2, E.L. Baldry1,2, D.H. Bodicoat3, S. Chatterjee4, C.L. Edwardson1,2, L.J. Gray1, K. Khunti1, J.A. Sargeant1,2, D.J. Stensel5,2, D.R. Webb1,2, J.P.H. Wilding6, S.A. Willis5,2, T. Yates1,2, J.A. King5,2;
1Diabetes Research Centre, University of Leicester, Leicester, 2NIHR Leicester Biomedical Research Centre, Leicester, 3Simplified Data, Leicester, 4University Hospitals of Leicester NHS Trust, Leicester, 5School of Sport, Exercise and Health Sciences, Loughborough University, Loughborough, 6Institute of Ageing and Chronic Disease, University of Liverpool, Liverpool, UK.
Background and aims: In patients with type 2 diabetes (T2D), SGLT2 inhibitors (SGLT2i) lower HbA1c and cause weight loss; however, observed weight change is less than predicted by modelling. This study tested the hypothesis that compensatory changes in appetite, and appetite-related hormones, explain this less-than-expected weight loss with SGLT2i.
Materials and methods: In a 24-week prospective, double-blind placebo-controlled trial, patients with overweight / obesity and T2D (age 30 - 75 years, BMI ≥ 25kg/m2 ) were randomised (1:1:1:1) to one of four treatments: 1) placebo; 2) empagliflozin 25mg/day [EMPA]; 3) placebo and diet-induced weight loss [DIET]; 4) empagliflozin 25mg/day plus diet-induced weight loss [EMPA+DIET]; and assessed at 0, 2, 6, 12 and 24 weeks. DIET and EMPA+DIET groups reduced energy intake by 1500kJ/day. The primary outcome was circulating total peptide-YY (PYY) concentrations over a 3-hour mixed meal tolerance test (33% of daily energy requirements) at 24 weeks. Secondary outcomes included circulating concentrations of acyl ghrelin, GLP-1, leptin, appetite perceptions (100 mm VAS), body composition (DEXA) and physical activity (accelerometery). Data were analysed using generalised linear models at each time-point comparing each group with placebo; adjusting for baseline, age and BMI. Generalised estimating equations (GEE) examined overall treatment effects across follow-up.
Results: 68 participants were randomised (median [IQR]; age 63 [57, 69] years; BMI 31.8 [29.2, 35.1] kg/m2; HbA1c 6.8 [6.6 -7.2]%; 35% female) with primary outcome data available for 61. Circulating concentrations of PYY were no different vs placebo in any treatment arm at 24 weeks (Table 1); but were elevated in EMPA at 12-weeks (P = 0.003). Circulating acyl ghrelin and GLP-1 were unchanged at all time-points; however, GEE showed that GLP-1 was higher in EMPA vs placebo (P = 0.016). Treatments had no effects on perceived huger or fullness. Lean mass was reduced in EMPA and EMPA+DIET vs placebo at 24 weeks (P ≤ 0.001), with accordant (but not significant) reductions in resting metabolic rate. GEE highlighted a reduction in daily steps with EMPA vs placebo (P = 0.038); but not in the other treatment arms.
Conclusion: Empagliflozin does not provoke obvious compensatory appetite or appetite-related hormone responses in patients with excess adiposity and T2D. Additional studies should explore the effects of SGLT2i on hedonic drivers of eating behaviour.

Clinical Trial Registration Number: NCT02798744
Supported by: Funded by Boehringer Ingelheim and supported in-kind by the NIHR Leicester BRC
Disclosure: M.J. Davies: None.
231
Peripherally administered incretin peptides, including GIP, GLP-1 and a dual GIP/GLP-1 receptor agonists, activate several brain regions in anesthetised rats
J.M. Wilson1, L. Becerra2, K. Goetter2, K. Briley2, A. Novicki2, D. Cissell2, R.M. Smith1, M. Ai1, P.J. Emmerson1, Z. Milicevic1, A. Haupt1, T. Coskun1;
1Diabetes and Complications, Eli Lilly and Company, Indianapolis, 2Invicro, A Konica Minolta Company, Boston, USA.
Background and aims: Following peripheral administration of incretin peptides, activation of deep brain regions has been shown and may occur through neuronal relays. To characterise the central responses to peripherally administered (i.v.) incretin peptides, we used superparamagnetic iron oxide (SPIO)-based MRI to image the activation of multiple brain regions known to regulate appetite in anesthetised rats.
Materials and methods: Anesthetised Sprague-Dawley rats were positioned in the cradle of a Bruker 7.0T MRI system. Anatomic imaging was acquired with a T2-weighted sequence. For SPIO-MRI, a Multiple Gradient Echo sequence with in-plane resolution of 230x230 μm and 1 mm slices with a repetition time of 25.6 s was prescribed either transversely (for amygdala) or parasagittally (all other regions). For SPIO-MRI scans, Molday ION contrast agent (BioPAL Inc.) was administered through a tail vein at a dosage of 10 ml/kg and infusion rate of 2.5 mL/min 5 min after initiation of scan. After 20 minutes of continuously scanning, a placebo (buffer vehicle), acylated long-acting GLP-1 receptor agonist (LA-GLP-1RA), acylated long-acting GIP receptor agonist (LA-GIPRA) or acylated long-acting GIP/GLP-1 dual receptor agonist (LA-GIP/GLP-1RA) were administered at a dosage of 10 nmol/kg with an infusion rate of 0.16 mL/min. Images were acquired for an additional 20 minutes post infusion. Standard analysis was used to calculate voxel-wise maps of change in relative cerebral blood volume (rCBV) following the administration of each agent. Average rCBV for each anatomic region of interest was calculated from the maps.
Results: Treatment with each peptide led to increased rCBV in multiple brain regions including area postrema, hypothalamus, amygdala, cingulate cortex and retrosplenial cortex compared to vehicle.
Conclusion: This is the first study demonstrating that peripherally administered incretin peptides can activate brain regions which are known to regulate appetite via increased blood flow in rats. Further studies are needed to demonstrate the functional importance of these findings on the regulation of appetite or glucose control.

Disclosure: J.M. Wilson: Employment/Consultancy; Eli Lilly and Company.
232
GIP infusion in patients with type 1 diabetes seems to attenuate postprandial glucose excursions after prandial insulin over-dose and physical activity
B. Hoe1,2, S.M.N. Heimburger1,3, L.S. Gasbjerg1,2, A.R. Lanng1,2, M.B. Lynggaard1, B. Hartmann2,4, J.J. Holst2,4, T. Vilsbøll3,1, A. Lund3,1, S. Engberg3, T.F. Dejgaard3,1, M.B. Christensen1,5, F.K. Knop1,3;
1Gentofte Hospital, Hellerup, 2University of Copenhagen, Copenhagen, 3Steno Diabetes Center Copenhagen, Gentofte, 4Department of Biomedical Sciences, University of Copenhagen, Copenhagen, 5Department of Clinical Pharmacology, Bispebjerg Hospital, Copenhagen, Denmark.
Background and aims: The gluco-regulatory effects of the insulinotropic and glucagonotropic gut hormone glucose-dependent insulinotropic polypeptide (GIP) in type 1 diabetes (T1D) are unclear. We evaluated the effects of exogenous and endogenous GIP on plasma glucose excursions in a setting of prandial insulin over-dose and physical activity after meal ingestion.
Materials and methods: In a randomised, placebo-controlled, double-blinded, crossover study, 12 men with T1D (age [mean ± SD]: 26 ± 6.6 years; BMI: 23 ± 2.3 kg/m2; HbA1c: 48 ± 6.3 mmol/mol (6.5 ± 2.7 %); diabetes duration: 11 ± 5.5 years; plasma C-peptide: < 200 pmol/l) underwent three separate study days involving a liquid mixed meal test with 125 % of regular prandial insulin dose, 30 minutes of intermediate bicycling (60 minutes after mixed-meal), and 270 minute infusions of GIP, the GIP receptor antagonist GIP(3-30)NH2 and placebo, respectively.
Results: The GIP infusion attenuated postprandial plasma glucose excursions (Cmax - Cmin) by [mean ± SEM] 1.5 ± 0.5 mmol/l and 0.92 ± 0.56 mmol/l compared to GIP(3-30)NH2 and placebo, respectively (p = 0.03) (Figure). The amounts of infused glucose needed to avoid plasma glucose < 2.5 mmol/l were similar on all three study days (p = 0.13) (Figure).
Conclusion: In conclusion, GIP infusion seems to attenuate postprandial plasma glucose excursions without significantly increasing the need of glucose to avoid hypoglycaemia in patients with T1D.

Clinical Trial Registration Number: H-18002707
Supported by: Helmsley Charitable Trust
Disclosure: B. Hoe: None.
OP 41 Fatty matters
233
Liraglutide accelerates the catabolism of apolipoprotein B100 containing lipoproteins (VLDL 1 , VLDL 2 , IDL and LDL) in patients with type 2 diabetes: an in vivo kinetic study
B. Vergès1,2, B. Bouillet1,2, A. Rouland1, S. Baillot-Rudoni1, P. Buffier1, E. Crevisy1, J. Petit1,2, L. Duvillard1,2;
1Hopital du Bocage, Dijon, 2INSERM, Dijon, France.
Background and aims: Dyslipidemia observed in type 2 diabetes (T2DM) is highly atherogenic and plays an important role in the increased cardiovascular risk in T2DM patients. Important features of diabetic dyslipidemia are increased levels of triglyceride-rich lipoproteins and small dense LDL particles which, all have the apolipoprotein B100 (apoB100) as major apolipoprotein. This prompted us to study the effect of the GLP1 agonist, liraglutide, on the metabolism of apoB100 containing lipoproteins.
Materials and methods: We performed an in vivo kinetic study with stable isotopes (L-[1-13C] leucine) in 10 T2DM patients featuring diabetic dyslipidemia (triglycerides ≥1.7 Mmol/L and/or HDL-cholesterol < 1.29 (F)/1.03 (M)), before and 6 months after the initiation of a treatment with liraglutide at a dose of 1.2 mg/day. Lipoproteins were separated by ultracentrifugation and apoB100 isolated by electrophoresis. ApoB100 isotopic enrichment was measured by mass spectrometer after separation of amino acids by gas chromatography.
Results: Six months after initiation of liraglutide treatment, significant reductions in the means of HbA1c (7.1±1.1 vs. 9.6±2.6 %, p=0.009), body weight (100.5±19.6 vs.104.9 ±19.6 kg, p=0.021), fasting triglycerides (1.761±0.37 vs. 2.48±0.69 Mmol/L, p=0.005), plasma apoB100 (0.93±0.13 vs. 1.09±0.11 g/L, p=0.011) were observed. A borderline significant decrease in LDL-cholesterol was also noted (2.75±0.56 vs. 3.04±0.47 Mmol/L, p=0.09). The kinetic study showed a significant increase in catabolism of VLDL1-apoB100 (4.72±2.23 vs. 3.28±1.12 day-1, p=0.013), of VLDL2-apoB100 (6.17±2.11 vs. 3.42±1.97 day-1, p=0.013), of IDL-apoB100 (5.27±2.77 vs. 3.74±1.85 jour-1, p=0.017) and of LDL-apoB100 (0.72±0.22 vs. 0.56±0.22 jour-1, p=0.005). Kinetic data showed that only the indirect catabolisms of VLDL1, VLDL2 and IDL were increased, indicating an acceleration of the catabolism of the VLDL-IDL-LDL cascade.
Conclusion: Treatment with liraglutide induces a significant acceleration of the catabolism of triglyceride-rich lipoproteins (VLDL1, VLDL2, IDL) and of LDL. This positive effect on lipoprotein metabolism may reduce vascular risk in T2DM.
Clinical Trial Registration Number: NCT02721888
Supported by: Novo Nordisk
Disclosure: B. Vergès: Grants; from Novo Nordisk.
234
Serine palmitoyl transferase 2 deficiency in mice hepatocytes induces changes in bile acids composition and improves glucose tolerance
J. Lallement1, E. Foppen1, F. Lachkar2, D. Rainteau3, G. Merlan4, F. Preitner5, A. Rebelo Pimentel5, M. Schiffano6, M. Croyal6, M. Krempf6, F. Foufelle2, T. Tordjmann4, H. Le Stunff1, C. Magnan1, C. Cruciani-Guglielmacci1;
1Université de Paris, Unité Biologie Fonctionelle et Adaptative (BFA) - UMR 8251 CNRS, Paris, France, 2Sorbonne Université, Inserm, Centre de Recherche Saint-Antoine, CRSA, AP-HP, Hôpital Saint Antoine, Biochemistry Department, Paris, France, 3INSERM, Sorbonne Université, Université de Paris; Centre de Recherche des Cordeliers, Paris, France, 4INSERM U1174 Université Paris Sud, Orsay, France, 5. Mouse Metabolic Evaluation Facility, Center for Integrative Genomics, University of Lausanne, Lausanne, Switzerland, 6Plateforme de Spectrométrie de Masse du CRNH-O, UMR1280, Nantes, France.
Background and aims: Numerous studies have shown the role of ceramides as lipotoxic inducers, which could impair insulin pathway and cause insulin resistance, leading to type 2 diabetes (T2D). Recently, several studies suggest that ceramides could be relevant plasma biomarkers of T2D susceptibility. Ceramides are precursors for the predominant sphingolipids, which are components of cell membranes. Their de novo synthesis, very active in the liver, involves serine palmitoyltransferase 2 (SPT2), the rate limiting enzyme.
Materials and methods: In this study, we investigated the role of de novo ceramide synthesis in the liver on energy homeostasis. Therefore, using the cre-lox system, we generated mice lacking SPT2 in the liver (SPT2ΔHep). The SPT2ΔHep mice and their littermate controls (SPT2lox/lox) were fed with control diet or high fat diet (HFD) for 2 months, during which we measured metabolic parameters.
Results: Despite lower expression of liver spt2, we found higher concentration of ceramides in the liver of SPT2ΔHep mice associated with an increased sphingomyelin phosphodiesterase expression, and a decreased sphingomyelin content. These results suggested a compensatory mechanism from sphingomyelin hydrolysis. We find that SPT2ΔHep mice are protected against body mass gain induced by HFD and display a decreased body fat mass. Bile acid composition and content are modified in KO mice. : the hydrophobic bile acid pool is drastically decreased in SPT2ΔHep mice, leading to lipid absorption defect. In addition, the nuclear bile acid receptor Farnesoid X receptor (FXR) and its target genes are downregulated in intestine and liver of SPT2ΔHep mice. Moreover, SPT2ΔHep mice, fed with HFD, display a significantly enhanced glucose tolerance compared to the controls. This is not associated with an improved insulin sensitivity. However, the ability of glucose production after injection of gluconeogenic substrates is lower in SPT2ΔHep mice. We measured glycemia time course during a 24H fast, and SPT2ΔHep mice displayed a lower glycemia compared to controls after 5h of food deprivation. These results suggest a defect in glucose production or storage by the liver
Conclusion: Our data shows for the first time a potential compensatory mechanism of ceramide synthesis in the liver. Then, these results highlight the role of hepatic sphingolipid modulation on hepatic glucose production through bile acid composition change. We are currently investigating the role of FXR on glucose homeostasis in our model.
Supported by: IMI - Rhapsody
Disclosure: J. Lallement: None.
235
Difference in lipid metabolism between men and women: implications for the pathophysiology of type 2 diabetes development and remission
A. Al-Mrabeh1, S. Melhem1, S. Zhyzhneuskaya1, C. Peters1, A. Barnes2, A. Jesuthasan1, K.G. Hollingsworth1, N. Sattar3, M.E. Lean4, R. Taylor1;
1Translational and Clinical Research Institute, Magnetic Resonance Centre, Newcastle University, Newcastle upon Tyne, 2Human Nutrition Research Centre, Population Health Sciences Institute, Newcastle University, Newcastle upon Tyne, 3Institute of Cardiovascular & Medical Sciences, Glasgow University, Glasgow, 4School of Medicine, Dentistry and Nursing, Glasgow University, Glasgow, UK.
Background and aims: Women experience a greater increase in cardiovascular risk than men on developing type 2 diabetes, possibly linked to differences in hepatic lipoprotein metabolism. We compared sex for markers of hepatic lipid content and triglyceride export in the Diabetes Remission Clinical Trial (DiRECT).
Materials and methods: The Tyneside subset of DiRECT (34M/30F, 52.3±SD 8.0 years, BMI 35.2±4.6kg/m2) was studied at baseline and followed up to 24 months after weight loss (BMI 29.9±4.6kg/m2). Results were compared with non-diabetic controls selected to match the diabetes group for weight after weight loss (14M/13F, 55.8±6.0 years, BMI 29.7±3.8kg/m2). Intra-organ and abdominal fat were quantified by 3-point Dixon MRI, and hepatic VLDL-TG production was measured using a competitive blocking method. Plasma biomarkers were quantified using commercial kits.
Results: Liver and pancreas fat were lower in women than men within the non-diabetic group, (3.4±0.1 vs. 5.4± 1.1 %, p=0.005, and 4.7±0.4 vs. 7.6±0.5%, p=0.0006, respectively). No such difference was evident in diabetes at baseline (16.9±1.9 vs. 15.4± 1.9%, p=0.49, and 8.3±0.5 vs. 8.5±0.4%, p=0.83, respectively). After weight loss, plasma VLDL-TG fell much less in women than men (0.58±0.08 to 0.54±0.09 mmol/l, p>0.05 and 0.83±0.08 to 0.40±0.06 mmol/l, p=0.0001, respectively) despite similar falls in VLDL-TG production rates (559±33 to 475±37 and 554±39 to 419±28mg/kg/day). Women had a lower: VLDL-TG pool size (1894± 294 vs. 3176± 339mg diabetes; 924±349 vs. 2640±618mg controls), visceral adipose tissue (226.6±12.3 vs. 320.9±12.4cm2 diabetes; 92.8±16.0 vs. 287.3 ±19.7cm2 controls) and fasting glucagon (22.5±1.8 vs. 30.3 ±2.5 ng/mL diabetes; 9.2±1.7 vs. 19.2±1.9 ng/l controls) than men. They also had higher: subcutaneous adipose tissue, adiponectin, GDF-15, FGF-21, and leptin (all p<0.01). After weight loss, pancreas fat remained similar in women and men unlike non-diabetic controls. However, after weight loss, men and women remained significantly different in subcutaneous/visceral adipose tissues, GDF-15, FGF-21, leptin, and adiponectin (p<0.05 for all). In contrast, fasting NEFA, HDL cholesterol, and IGF-1 became similar between men and women (p>0.05 for all).
Conclusion: Women have lower liver and intrapancreatic fat than men in the non-diabetic state, but in type 2 diabetes these differences are lost. Overall, women appear to have more efficient mechanisms to clear VLDL-TG from blood which are impaired in type 2 diabetes. Sex needs to be taken into account when planning metabolic studies. Recognition of the inadequate clearance of VLDL-TG in women with diabetes may lead to specific therapeutic interventions.
Supported by: Diabetes UK
Disclosure: A. Al-Mrabeh: None.
236
Characterisation of seven HDL subspecies and their association with incident type 2 diabetes in PREVEND study
S. Sokooti Oskooei1, J.L. Flores-Guerrero1, L.M. Kieneker1, H.J.L. Heerspink2, M.A. Connelly3, S.J.K. Bakker1, R.P.F. Dullaart1;
1Internal Medicine, University Medical Center Groningen, Groningen, Netherlands, 2Clinical Pharmacy and Pharmacology, University Medical Center Groningen, Groningen, Netherlands, 3Laboratory Corporation of America® Holdings (LabCorp), Morrisville, USA.
Background and aims: While high concentrations of high-density lipoprotein (HDL) and HDL cholesterol are thought to be protective against type 2 diabetes (T2D), HDL particles vary in size, density, protein composition and function have been shown to associate differently with development of T2D. Also, associations between small, medium and large HDL subclasses with incident T2D have been inconsistent. A newly developed algorithm provides concentrations for seven HDL subspecies and, categorizes the HDL particles more specifically. The aim of our current study was to investigate seven HDL subspecies and evaluate their association with incident T2D.
Materials and methods: We included 4828 subjects of the Prevention of Renal and Vascular End-Stage Disease (PREVEND) study without T2D at baseline. HDL subspecies with increasing size from H1P to H7P were measured using the LP4 algorithm of the Vantera NMR platform. Insulin resistance was determined by homeostatic model assessment index (HOMA-IR).
Results: Among the seven HDL subspecies, H1P, H3P, H4P, H6P, and H7P were inversely associated with HOMA-IR ([ r=0.058; P<0.001], [ r=0.118; P<0.001], [ r=0.168; P<0.001], [ r=0.265; P<0.001], and [ r=0.283; P<0.001] respectively), whereas H2P was positively associated with HOMA-IR [ r=0.205; P<0.001]. During a median follow-up of 7.3 years, 265 individuals developed T2D. In multivariable-adjusted Cox regression models, higher levels of H1P, H4P, H6P, and H7P were associated with a lower risk of developing T2D, independent of adjustment for baseline covariates, including age, gender, lifestyle, use of medication, BMI, and hypertension. Oppositely, higher levels of H2P were associated with an increased risk of developing T2D. The associations for H2P, H4P, H6P, and H7P remained, independent of further additional adjustment for glucose and triglycerides. Moreover, the association of H6P was not independent of HDL cholesterol. In the last model, with adjustment for all relevant variables, H2P was the only subspecies that remained significant, with a positive association with T2D development.
Conclusion: H2P, the predominant HDL subspecies, was positively associated with metabolic factors including HOMA-IR and triglycerides. Additionally, H4P and H7P levels showed the strongest inverse association with incident T2D, whereas H2P levels were positively associated with incident T2D, independent of clinical risk factors.

Supported by: European Union’s Horizon 2020
Disclosure: S. Sokooti Oskooei: None.
OP 42 Diabetes care is expensive
237
Socioeconomic factors and obesity: Are they independently associated with prevalence of diabetes?
S. Liatis1, G. Touloumi2, N. Kalpourtzi2, I. Ioannidis1, S. Iraklianou1, A. Raptis1, A. Sotiropoulos1, A. Karakosta2, G. Karamanakos1, K. Makrilakis1;
1Hellenic Diabetes association, Athens, 22Department of Hygiene, Epidemiology & Medical Statistics, National and Kapodistrian University of Athens Medical School, Athens, Greece.
Background and aims: Due to population aging and diet habits change, prevalence of diabetes and obesity has increased in Greece during last decades. Financial crisis widened socioeconomic disparities, associated with both diabetes and obesity. We aimed to assess the independent association of socioeconomic indices and BMI with diabetes prevalence
Materials and methods: Data were derived from the health examination survey EMENO (National Study of Morbidity and Risk Factors), conducted in Greece during 2014-2016, in a random sample of the general adult (≥18 years) population. Diabetes was defined as fasting plasma glucose (FPG) ≥126mg//dL or HbA1c≥6.5% or taking antidiabetic medications or self-reported. The study design was taken into account in the statistical analysis whereas inverse probability weighting was applied to adjust for the differences between those with/without available FPG/HbA1c measurements.
Results: : Of 6006 EMENO participants, 4,393 (48.5% men; median age: 47.7 years) had available FPG/HbA1c measurements. The overall diabetes prevalence was 11.9% (95% CI:10.9-12.9). Univariately, the higher the educational level and the family income the lower was the diabetes prevalence; being overweight or obese were significantly associated with increased diabetes prevalence (Table). Multivariable analysis showed that diabetes prevalence was increased with age, was lower in women and in those living in rural compared to urban areas, and higher in those with dyslipidemia and family history. The association with the socioeconomic indices remained significant even after adjusting for the above-mentioned factors. Further adjustment for BMI did not practically alter these associations, whereas BMI categories remained a significant and independent risk factor (Table). Food insecurity or physical examination did not remain significant factors in adjusted analysis. .
Conclusion: In Greece, low socioeconomic status is associated with higher diabetes prevalence independently of BMI. Interventions should include obesity prevention measurements and targeted primarily to people of low educational and socioeconomic status
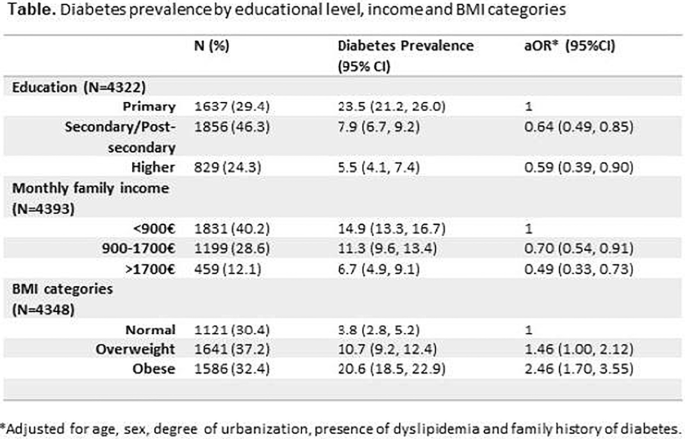
Supported by: co-funded by the European Union (European Social Fund) and the Hellenic Diabetes Association
Disclosure: S. Liatis: None.
238
Estimation of hospitalisations cost savings deriving from a wider application of EMPAREG and LEADER inclusion criteria in the real world practice: data from AMD Annals
A. Da Porto1, V. Manicardi2, C.B. Giorda3, E. Manicardi4, A. Agliadoro5, R. Fornego6, A. Nicolucci7, A. Rocca8, M. Rossi7, G. Russo9, D. Mannino10, P. Di Bartolo11;
1Clinica Medica ASUFC, Udine, 2Coordinatore gruppo Annali AMD, Reggio Emilia, 3Metabolism and Diabetes Unit ASL 5, Turin, 4SOS Diabetologia, Reggio Emilia, 5SSD Diabetologia, Endocrinologia e Malattie Metaboliche ASL3, Genova, 6SSD Diabetologia e Malattie Metaboliche ASLTO4, Chiavasso, 7Coresearch, Pescara, 8UOS Diabetologia e Malattie Meboliche ASST Nord, Milano, 9Dipartimento di Medicina Clinica e Sperimentale, Università di Messina, Messina, 10UOC Diabetologia, Reggio Calabria, 11Rete Clinica di Diabetologia AUSL Romagna, Ravenna, Italy.
Background and aims: Aim of the study was to quantify the proportion of patients potentially eligible for the EMPA-REG and LEADER studies and to estimate the potential impact on reduction of MACE, HHF and corresponding cost savings resulting if the use of these treatments would have been extended to all eligible patients.
Materials and methods: In Italy, an initiative of continuous monitoring and quality improvement of diabetes care (AMD Annals) is in place since 2004 promoted by the scientific society of diabetologists (AMD). A network of diabetes centers periodically extracts anonymous data from electronic clinical records for the continuous monitoring of quality of care. The same selection criteria used for recruiting patients in EMPAREG-Outcome and LEADER study were applied to the AMD Annals population. Reductions in absolute risk of cardiovascular death and hospitalization for heart failure or myocardial infarction associated with the use of the drugs if all eligible patients had been treated, were estimated on the basis of rates shown in the EMPA-REG OUTCOME and LEADER trials. Hospitalization cost savings were estimated from national reference cost in 2018 for diagnosis related group codes (DRG).
Results: From the AMD-database including 468,940 patients seen in 222 Diabetes Clinics in 2016, 342,190 had all the data required for evaluating the eligibility for both EMPA-REG or LEADER study. 41,715 patients met the eligibility criteria for EMPAREG study and 139,637 for LEADER study. Although theoretically eligible, in real world setting only 2,161 patients (5.2%) were currently treated with empaglifozin and 4,823 (3.5%) with liraglutide. Estimate numbers of prevented events and potential cost savings are summarized in table 1.
Conclusion: Even if CVOTs results provide evidence that use of empaglifozin and liraglutide are associated with reduced cardiovascular morbidity and mortality, only a minimal portion of eligible patients is on treatment with these drugs in a real world setting. Our cost analysis suggests that a wider use of empaglifozin and liraglutide in patient meeting CVOT eligibility criteria would result in a significant reduction of CV event rate and subsequent relevant hospitalization cost saving.

Disclosure: A. Da Porto: None.
239
Costs of diabetes complications: hospital based care and production loss for 392,200 people with type 2 diabetes and matched controls in Sweden
K. Steen Carlsson1,2, E. Andersson1, S. Persson1,3, N. Hallén4, Å. Ericsson5, D. Thielke4, P. Lindgren1,6, J. Jendle7;
1The Swedish Institute for Health Economics, IHE, Lund, Sweden, 2Department of Clinical Sciences, Malmö, Lund Unviersity, Lund, Sweden, 3Department of Clinical Sciences, Malmö, Lund University, Lund, Sweden, 4Novo Nordisk A/S, Copenhagen, Denmark, 5Novo Nordisk Scandinavia, Malmö, Sweden, 6Department of Learning, Informatics, Management and Ethics, Karolinska Institutet, Stockholm, Sweden, 7Örebro University, Örebro, Sweden.
Background and aims: The prevalence of diabetes has increased rapidly over the last decades worldwide. The risk of complications and medical consequences is well known and identified as key driver of costs. Less evidence on the impact of individual diabetic complications on the societal burden is available. The objective was to analyse costs of hospital-based health care and work absence related to individual macrovascular and microvascular complications of type 2 diabetes in Sweden in 2016.
Materials and methods: The study used data from a Swedish retrospective observational database cross-linking 20 years of individual-level data (1997-2016) from national population-based health, social insurance and socio-economic registers for 392,200 people with type 2 diabetes and matched controls (5:1). Diabetes status and presence of 19 types of complications were derived from years 1997-2016 while the costs of hospital-based care and of production loss due to diabetes complications were estimated for 2016. Regression analysis was used for comparison to controls, to attribute production loss to individual complications, and to account for joint presence of complications.
Results: Complications are prevalent and patterns complex in type 2 diabetes (Fig. 1). Use of hospital care for complications was higher compared to controls: 86,104 vs 24,608 outpatient visits per 100,000 persons and 9,894 vs 2,546 inpatient admissions per 100,000 persons (p<0.001) in 2016. 26% vs 12% had ≥1 hospital contact. The corresponding total costs of hospital-based care for complications were EUR 91,875 vs EUR 23,222 per 100 persons (p<0.001) and 75% were directly attributed to diabetes (EUR 689/person). Regression analyses distributed the costs of days absent from work across diabetes complications, basic type 2 diabetes effect and unattributed causes: diabetes complications amounted to EUR 2,165/person in 2016. Key drivers of costs of production loss were macrovascular complications angina pectoris, heart failure and stroke, and microvascular complications eye disease including retinopathy, kidney disease and neuropathy. Early mortality in working ages cost additional EUR 579/person and medications used in risk-factor treatment amounted to EUR 418/person.
Conclusion: The economic burden of complications in type 2 diabetes is substantial. Costs of productivity loss in this study were found to be greater than those of hospital-based care highlighting the need for considering treatment consequences in a societal perspective in research and policy.

Supported by: Novo Nordisk A/S, Copenhagen Denmark to the Swedish Institute for Health Economics, Lund, Sweden
Disclosure: K. Steen Carlsson: Grants; Novo Nordisk A/S, Copenhagen Denmark to the Swedish Institute for Health Economics, Lund, Sweden.
240
Economic burden associated with diabetes technologies: a cross-national comparison of out-of-pocket expenses
T. Froment1, A. Thieffry2, H. Ballhausen3, M. Wäldchen1, S. O'Donnell1, B. Cleal4;
1University College Dublin, Dublin, Ireland, 2Technical University of Denmark, Copenhagen, Denmark, 3DeDoc Labs GmBH, Berlin, Germany, 4Steno Diabetes Center, Copenhagen, Denmark.
Background and aims: This study looked into the financial burden for those living with Type-1-Diabetes (T1D) in regards to Out-of-Pocket Expenses (OoPE) associated with diabetes technologies and insulin. This investigation highlights the costs of living with diabetes and identifies potential sources of social inequality in diabetes treatment, such as a technological divide. The primary aim is to understand the economic burdens for People with Diabetes (PwD) associated with accessing diabetes technologies and the extent to which these burdens are barriers to access for optimal treatment.
Materials and methods: Using the 2018 T1International “Type 1 Diabetes Access to Insulin and Supplies Survey”, a combination of both quantitative and qualitative methods were used to analyse the out-of-pocket expenses for diabetes technology in relation to health care coverage, with focus on continuous glucose monitoring (CGM), test strips, insulin and pump supplies.
Results: A total of 1048 answers representing 8 countries (Australia, Canada, Croatia, Germany, UK, Pakistan, South Africa and USA) were considered in this study. Quantitative analyses showed substantial variation of OoPE between countries, which appeared to be largely driven by the extent of healthcare coverage availability in each country. The majority of respondents reported partial healthcare coverage (77.7%, cross-country average). In half of the selected countries, participants with full healthcare coverage still reported OoPE. In the USA, substantial OoPE were reported both with respect to insulin and diabetes technologies. In contrast, the vast majority of UK respondents experienced virtually no OoPE associated with insulin. Manual curation of more than 390 qualitative responses shed light on the experience of PwD and provided valuable insights on the relationship between healthcare coverage and costs. This relates both to what is perceived as diabetes-related costs and expectations about what coverage should actually cover; a sliding scale from access to insulin to coverage for the latest technological innovation. Respondents in countries with universal healthcare coverage acknowledged the benefits of the system, even when the state did not cover every supply or the total cost of diabetes management. In the absence of public healthcare coverage, PwD applied a variety of methods to access diabetes medication and supplies wherever possible, with many relying on private health insurance and employment-based insurance plans, whereas some reported struggle accessing even the most basic necessities such as insulin and test strips. In terms of technology access, latest development were often reported as hardly accessible and/or unaffordable (i.e. CGM).
Conclusion: The study demonstrated inequalities for diabetes technologies within and across eight countries. Public healthcare coverage provided patient satisfaction more likely than privately led systems, as PwD can benefit from it and reduce their monthly OoPE. The analysis further uncovered that OoPE associated with hypoglycemia treatments and other medical supplies should not be ignored when discussing the financial burden of living with T1D.
Supported by: H2020-MSCA-RISE-2018
Disclosure: T. Froment: None.
OP 43 Developing beta cells
241
Real-time functional assessment and quality control of iPSC-derived human beta-like cells for diabetes modelling
M. Jaffredo1, N. Krentz2,3, B. Champon2, A. Clark4, S. Nawaz4, C. Duff2, S. Renaud5, A. Gloyn2,3, J. Lang1, M. Raoux1, B. Hastoy4;
1CBMN UMR 5248, Bordeaux, France, 2WTCHG, Oxford, UK, 3Stanford Department of Medicine, Stanford, USA, 4OCDEM & NIHR Biomedical Research Centre Churchill Hospital, Oxford, UK, 5IMS UMR 5218, Bordeaux, France.
Background and aims: Human β-like cells (BLC) derived from iPSCs hold promise for diabetes research and therapy, but their differentiation remains long, costly and challenging in terms of homogeneity and maturity. Current quality control focuses on expression of key genes providing minimal insight on function and on static stimulations of insulin secretion which vary due to heterogeneity. Here, we characterized BLC electrical behaviour with non-invasive multielectrode arrays (MEAs) to provide a standardized and automated functional quality control of BLC. To evaluate our system further, we analysed BLC from an established SLC30A8 loss-of-function diabetes model.
Materials and methods: BLC were generated in clusters (N=8) and monolayers (N=9) according to the Rezania protocol. Both single-cell (action potential, AP) and multicellular coupling signals (slow potential, SP) were recorded with MEAs and processed either offline, or online (when specified) with an electronic circuit dedicated to real-time analysis. Whole-cell patch clamp was used to measure ion currents and exocytosis (membrane capacitance).
Results: The majority of BLC preparations were electrically active: 87.5% of clusters and 88.9% of monolayers. 85.7% of electrically active clusters and 87.5% of monolayers generated both APs and SPs. The detection of SPs, an established β cell-specific coupling signal, revealed that mature BLC are electrically coupled. This was supported by the maximal Connexin-36 (GJD2) expression from the endocrine-like stage onward. We established a standardised functional quality control of BLC to successive stimuli. Upon glucose and forskolin, the electrical activity increased in 67% of monolayers (N=4/6) by 9.6±3.7-fold and in 40% of clusters (N=2/5) by 2.1±0.1-fold. Glibenclamide increased the activity in 33% monolayers (N=1/3) by 2.8-fold and in 67% clusters (N=2/3) by 2.7±0.2-fold. Monitoring BLC revealed that they were glucose-responsive for a short period (2-3 days). Furthermore, automatic online analysis of SPs and APs correlated well with glucose levels and with insulin secretion measured on the same cells. Application of Bay K8644, Cobalt and TTX as ion channel modulators showed the contribution of Ca2+ and Na+ voltage-gated channels in BLC’s electrical activity. Single cell patch clamp recordings from 3 independent differentiations revealed 48.9±7.9pA.pF-1 Na+ and 9.22±1.1pA.pF-1 Ca2+ current densities (N=20), similar to human primary β cells. The amplitude of exocytosis was of 497±200fF with a biphasic kinetics (N=14), the latter as described in mature β cells. Finally, assessment of the electrical activity of BLC derived from loss-of-function SLC30A8 CRISPR-edited iPSCs confirmed the improved glucose and forskolin responsiveness, corroborating recently published data on the protective effect against type 2 diabetes (N=2 independent CRISPR clones).
Conclusion: Our non-invasive system allows real-time dynamic functional assessment of BLC even in heterogeneous preparations. We show that mature BLC are electrically active and coupled. The MEA represents a valuable quality control of iPSC differentiations protocols for therapy and type 2 diabetes research.
Supported by: EFSD Albert Renold Travel Fellowship Programme, French Ministry of Research, ANR-18-CE17-0005, FEDER, Diabetes UK, Wellcome Trust
Disclosure: M. Jaffredo: None.
242
Intravital microimaging of human iPSC-derived surrogate islets in the anterior chamber of the eye
K. Zhao1, Y. Shi1, J. Yu1, L. Yu1, A. Mael2, A. Kolton2, T. Joyce2, J. Odorico2, P.-O. Berggren1, S.-N. Yang1;
1The Rolf Luft Research Center for Diabetes and Endocrinology, Karolinska Institutet, Stockholm, Sweden, 2Regenerative Medical Solutions, Inc., Madison, USA.
Background and aims: Induced pluripotent stem cell (iPSC) technology enables engineering human iPSC-derived surrogate islets (hiPSC-SIs) from human subjects’ or patient’s own somatic cells. So far, hiPSC-SIs have not been used to treat patients with diabetes, primarily due to incomplete maturation in vitro into authentic pancreatic islets. To guide hiPSC-SIs in vivo to their full maturity where they timely and accurately secrete insulin in response to glycemic changes, we have established a way to microimage the in vivo dynamics and fates of islet hormone-expressing cells in hiPSC-SIs in a longitudinal and non-invasive manner. To make this possible, we have exploited the anterior chamber of the eye (ACE) of immunodeficient mice as a transplantation site and the cornea as a natural body window for microimaging hiPSC-SIs.
Materials and methods: hiPSC-SIs were produced in vitro from the undifferentiated hiPSC line NCRM-1 and immunocytochemically, flow cytometrically, and functionally characterized. The resultant hiPSC-SIs were transplanted into the ACE of NOD/scid/IL2Rgamma -/- immunodeficient mice. The engraftment, vascularization and backscattering signal of the intraocular hiPSC-SIs were longitudinally and non-invasively monitored by applying intravital microimaging.
Results: hiPSC-SIs generated in vitro resembled native human islets in size and shape. Most of cells in hiPSC-SIs were islet-hormone positive and displayed glucagon, insulin or somatostatin immunofluorescence. Once implanted into the ACE, hiPSC-SIs rapidly engrafted onto the iris. Thereafter, transplanted hiPSC-SIs underwent vascularization. When imaged at day 3 post-transplantation, functional blood vessels were sparsely seen in hiPSC-SI grafts. By 1 week after transplantation, blood vessels became significantly enriched within islet structures, and continued to increase in density through week 4 after transplantation and plateaued thereafter. Light scattering signals, reflecting the abundance of zinc-insulin crystals within insulin secretory granules, were also imaged and quantified. The light scattering signal of intraocular hiPSC-SI transplants progressively increased over the first month and plateaued 2 months after transplantation.
Conclusion: The present work establishes a unique research platform for intravital microimaging of hiPSC-SIs transplanted into the mouse ACE in a longitudinal and non-invasive manner. Importantly, the platform enables high spatiotemporal resolution dynamics of engraftment, vascularization and insulin granule density. This not only lays a solid foundation for monitoring in vivo hiPSC-SI maturation, but also offers a feasible and reliable means to screen compounds with clinical potential for promoting this cellular process.
Supported by: VR; ERC; SRP
Disclosure: K. Zhao: None.
243
Spatiotemporal expression pattern of adhesion G-protein coupled receptors in developing human pancreas reveals a role for GPR56 in developing islets
O.E. Olaniru1, K. Toczyska1, N. Guccio1, S. Giera2, X. Piao2, A.J. King1, P.M. Jones1, S.J. Persaud1;
1King's College London, London, UK, 2University of California, San Francisco, USA.
Background and aims: Adhesion G-protein coupled receptors (aGPCRs) play important roles in organ development but their role in islet development and function is poorly understood. We have now systematically characterised their expression in developing human pancreas and generated β-cell-specific GPR56 knockout mice to determine the effect of β-cell-specific deletion of GPR56 on islet function.
Materials and methods: The aGPCR transcriptome in human fetal pancreatic cells at 8 to 21 weeks post conception (wpc) was profiled by single cell RNA sequencing and qPCR. Immunohistochemistry of GPR56, the aGPCR with the highest fold increase during pancreas development, and its colocalization with endocrine progenitor markers, was investigated in human fetal and mouse embryonic pancreas sections. We generated transgenic mice with GPR56 deletion specifically in islet β-cells (GPR56-βKO) by crossing Ins1Cremice with LoxP-GPR56 mice flanking exons 4 to 6. Glucose tolerance tests were performed in lean GPR56-βKO mice and their wild type (floxWT) littermates at 8 weeks, and insulin secretion from isolated islets was determined by radioimmunoassay. Islet morphology of GPR56 global null mice and GPR56-βKO mice, with their appropriate littermate controls, was evaluated by immunoprobing for insulin, glucagon, BrdU and Ki67, and images were quantified by ImageJ.
Results: Transcripts encoding 29 aGPCRs were detected in developing human fetal pancreases and aGPCRs were dynamically expressed across the developmental timepoints, with GPR56 showing the highest fold increase at 17wpc. Unbiased clustering and t-SNE visualization of 7,369 human fetal pancreatic cells showed that GPR56 is expressed in endocrine, ductal and pancreatic progenitor clusters while GPR123, CELSR3 and VLGR1 expression are restricted to the endocrine progenitor cluster. Genotyping showed a 465kb LoxP band and the presence of Cre in GPR56-βKO mice, as expected, and GPR56 deletion was confirmed by Western blotting in isolated islets. There was no significant difference in the weights of GPR56-βKO mice and WT littermates at 8 weeks (floxWT: 24.5±1.9g,βKO: 25.5±1.4g, n=6, P>0.2), in pancreas size (weight;floxWT: 0.30±0.06g,βKO: 0.37±0.03g, n=3, P>0.2) nor in fasting glucose levels (floxWT: 8.4±0.7mM, βKO: 7.9±0.4mM, n=6, P>0.2). In addition, GPR56 deletion in β-cells did not significantly affect glucose tolerance (AUC;floxWT: 1,292±58.2, βKO: 1,114±81.2, n=7, P>0.2) nor insulin content (ng/islet;floxWT: 36.9±3.8, βKO: 34.4±2.0, n=4), but the stimulation index of βKO islets to 20mM glucose was 46% lower than in floxed islets. There was no change in islet morphology in GPR56 null mice or GPR56-βKO mice, but there was an altered α/β cell ratio with less β-cells (% β-cells/islet; WT: 68.5±0.8, KO: 54.8±3.0, n=3, p<0.05), and higher numbers of α-cells in GPR56 null islets at P9 (% α-cells/islet; WT: 17.7±0.9, KO: 33.7±2.8, n=3, p<0.01).
Conclusion: These data demonstrate that aGPCRs are dynamically regulated during human pancreas development and may be required at key stages of endocrine lineage decisions. Lean GPR56-βKO mice are phenotypically normal and show normal glucose tolerance, but GPR56 deletion is associated with altered α/β cell ratio. These mice will allow us to evaluate the requirement of β-cell GPR56 in β-cell development and compensatory responses of β-cells to metabolic dysregulation.
Supported by: Diabetes UK
Disclosure: O.E. Olaniru: None.
244
Regulatory role of tyrosine kinase 2 (TYK2) in human pancreatic endocrine differentiation
V. Chandra1, H. Ibrahim1, J. Kvist1, D. Balboa2, R.B. Prasad3, O.P. Dwivedi4, L. Groop4, D. Eizirik5, T. Otonkoski1;
1Faculty of Medicine, Helsinki University, Helsinki, Finland, 2Centre for Genomic Regulation (CRG), Barcelona, Spain, 3Department of Clinical Sciences, Diabetes and Endocrinology, Lund University, CRC, Malmo, Sweden, 4Institute for Molecular Medicine Finland (FIMM), Helsinki, Finland, 5ULB Center for Diabetes Research, Brussels, Belgium.
Background and aims: Type 1 diabetes is a multifactorial autoimmune disease that results in the destruction of insulin producing pancreatic beta cells. One of the genes associated with T1D is TYK2 which encodes a JAK tyrosine kinase with critical roles in cytokine mediated intracellular signaling. Specific variants of TYK2 have been associated with either protection against or predisposition to T1D.
Materials and methods: To study the role of TYK2 in human pancreatic beta cell development we generated TYK2 knockout (KO) iPSCs using CRISPR-CAS9 and induced them to differentiate to pancreatic lineage.
Results: Interestingly, loss of TYK2 did not alter the pluripotency or the early pancreatic endoderm differentiation but severely compromised the emergence of endocrine progenitors. Transcript levels of key pancreatic transcription factors (PDX1 (55±17%, p≤0.05), NGN3 (65±13%, p≤0.01)), RFX6 (58±14%, p≤0.05) were significantly reduced in the TYK2-KO cells at the endocrine progenitor stage. TYK2-KO lines also showed low expression levels of NKX6.1, INS, GCG and SST compared to control lines. Additionally, selective inhibition of TYK2 activity using the inhibitor BMS-986165 decreased the number of NKX6.1/PDX1- positive endocrine progenitors suggesting a direct regulatory role of TYK2 in endocrine lineage commitment. In contrast to the wild-type controls, the TYK2-KO iPSC-derived pancreatic cells displayed no activation of STAT1 and STAT2 and showed impaired STAT3 activation in response to IFNα or stimulation by polyinosinic-polycitidilic acid, a viral infection mimetic. Stage specific transcriptomic analysis revealed the upregulation of KRAS (p = 1.06e-13) at all differentiation stages in the TYK2-KO cells. Interestingly, KRAS has been shown to antagonize endocrine neogenesis in the developing pancreas. Additionally, microarray data from human cadaveric islets showed a highly significant (p = 4.4e-14) negative correlation (r = -0.51) between TYK2 and KRAS expression.
Conclusion: These results provide evidence for an important role for TYK2 in pancreatic endocrine differentiation through the control of STAT and KRAS signaling.
Supported by: INNODIA
Disclosure: V. Chandra: None.
OP 44 Modelling metabolism: lessons from animals
245
Critical role of TRAPalpha in maintaining beta cell function and glucose homeostasis
X. Li, M. Wang, W. Feng, Y. Huang, X. Zhang, H. Shu, X. Xu, J. Sun, M. Liu;
Endocrinology and Metabolism, Tianjin Medical University General Hospital, Tianjin, China.
Background and aims: An endoplasmic reticulum (ER) membrane protein, translocon-associated protein alpha (TRAPα), is one of subunits of TRAP complex assisting secretory proteins translocation across the ER membrane. Genome-Wide Association Studies (GWAS) reveals that TRAPα is a type 2 diabetes-associated gene. We have recently reported that TRAPα is required for insulin biosynthesis in β-cells. However, the pathophysiological significance of TRAPα in maintaining normal β-cells function and glucose homeostasis remains unknown. By establishing a pancreatic β-cell specific TRAPα knockout (TRAPα βKO) mouse line, in this study, we aim to elucidate biological significance of TRAPα in β-cells and its role in maintaining glucose homeostasis.
Materials and methods: A TRAPα βKO mouse line was generated using CRISPR-Cas9-mediated genome editing. The TRAPα βKO mice and their littermate controls were fed with either regular chow or high-fat diet for three months. Body weight, fasting blood glucose, and plasma insulin were recorded weekly. Intraperitoneal glucose tolerance tests (IPGTT) and plasma insulin response to glucose challenge were performed monthly. Pancreatic islet morphology and cell composition, as well as the distribution of insulin, glucagon, and somatostatin were detected by immunohistochemistry and confocal immunofluorescence in paraffin-embedded pancreatic sections. The effects of TRAPα deficiency on the stability of other subunits of TRAP complex and intracellular insulin precursors (including preproinsulin and proinsulin) and mature insulin were examined by western blotting.
Results: Targeted disruption of TRAPα in pancreatic β-cells has no significant effects on the mouse body weight, fasting blood glucose, and fasting insulin in both regular and high-fat diet (HFD). However, IPGTT revealed that glucose tolerance and insulin secretion response to glucose were significantly impaired in the TRAPα βKO mice fed with regular chow, and these impairments were further aggravated in HFD fed mice. Consistent with these phenotypes, glucose-stimulated insulin secretion (GSIS) was markedly impaired in isolated islets from TRAPα βKO mice. Immunohistochemistry and confocal immunofluorescence showed that although insulin content was decreased, neither islet morphology nor cell composition was not significantly affected by TRAPα βKO. Western blotting revealed that deficiency of TRAPα in β-cells resulted in diminished other subunits of TRAP complex, including TRAPβ, TRAPγ, and TRAPδ, suggesting that TRAP complex was destabilized in the absence of TRAPα. Consistent with our recent report on the role of TRAPα in insulin biosynthesis in β-cell lines, we found that preproinsulin translocation was impaired along with markedly decreased intracellular mature insulin in the islets isolated from TRAPα βKO mice, supporting the notion that TRAPα is critical for maintaining β-cell function in vivo.
Conclusion: These results provide the first in vivo evidence that ablation of TRAPα leads to defects in insulin production and glucose intolerance. This study not only reveals pathophysiological significance of TRAPα in maintaining β-cell function, but also provides insight into pathogenesis of type 2 diabetes associated with impaired TRAPα function.
Supported by: National Natural Science Foundation of China 81830025, 81620108004, 81870533, 81800733, 81700720
Disclosure: X. Li: None.
246
Glucokinase haploinsufficiency ameliorates glucose intolerance by increasing beta cell mass in db/db mice
K. Omori1, A. Nakamura1, H. Miyoshi2, K. Takahashi1, H. Nomoto1, H. Kameda1, K. Cho1, Y. Terauchi3, T. Atsumi1;
1Department of Rheumatology, Endocrinology and Nephrology, Faculty of Medicine, Hokkaido University, Sapporo, 2Division of Diabetes and Obesity, Faculty of Medicine, Hokkaido University, Sapporo, 3Department of Endocrinology and Metabolism, Yokohama City University School of Medicine, Yokohama, Japan.
Background and aims: Some clinical trials have shown that glucokinase activators (GKAs) improve glycemic control, but the effect is limited to a short-term period. One reason for the loss of efficacy may be the toxicity of GKAs toward beta-cells. In the present study, we aimed to investigate the effect of glucokinase haploinsufficiency in pancreatic beta-cells on glucose tolerance as well as beta-cell mass using a mouse model of diabetes.
Materials and methods: We obtained Leprdb/+ (db/+) mice and crossed them with glucokinase haploinsufficiency in pancreatic beta-cells (Gck+/−) mice, generating Gck+/−db/+ mice. We then crossed mice to generate Gck+/+db/+, Gck+/−db/+, Gck+/+db/db, and Gck+/−db/db mice. Glucose tolerance, beta-cell mass, and survival time were evaluated. Gene expressions in isolated islets were evaluated by microarray and quantitative real-time PCR analyses. Metabolome analyses were also performed on the isolated islets.
Results: Fed glucose levels in Gck+/−db/+ mice were higher than those in Gck+/+db/+ mice, consistent with previous findings, while those in Gck+/−db/db mice gradually decreased after 13 weeks of age and remained lower than those in Gck+/+db/db mice. Oral glucose tolerance tests revealed that glucose tolerance improved significantly in Gck+/−db/db mice compared with Gck+/+db/db mice. Beta-cell mass were significantly increased in Gck+/−db/db mice at 24 weeks of age compared with those in the other three mice (Gck+/−db/db 22.5±10.1 mg vs. Gck+/+db/+ 2.2±1.4 mg, Gck+/-db/+ 1.9±0.6 mg, and Gck+/+db/db 7.0±7.1 mg). Furthermore, the survival time of Gck+/−db/db mice was significantly longer than that of Gck+/+db/db mice. Pathway analyses on the microarray data demonstrated that oxidative stress-related genes were downregulated in islets isolated from Gck+/−db/db mice compared with those from Gck+/+db/db mice. Quantitative real-time PCR analyses revealed that the gene expressions of pyruvate carboxylase (Pcx), Nkx6.1, Mafa, Pdx1, Ki67, and Ccnd2 were increased in Gck+/−db/db mice compared with Gck+/+db/db mice. Meanwhile, oxidative stress-related genes including Atf3 and Cyba were decreased in Gck+/−db/db mice. In metabolome analyses, glycolytic intermediates and metabolites such as fructose 6-phosphate, pyruvate acid and lactic acid were decreased, while isocitric acid and ATP were increased in Gck+/−db/db mice. These results suggested that the metabolic pattern shifted from glycolytic pathway dominance, as observed in diabetic islets, toward TCA cycle and oxidative phosphorylation dominance.
Conclusion: The present results demonstrated that glucokinase haploinsufficiency in pancreatic beta-cells ameliorated glucose intolerance by increasing beta-cell mass in db/db mice. Amelioration of glucotoxicity by glucokinase haploinsufficiency may reduce oxidative stress, followed by increased expression of transcription factors related to maintenance and maturation of beta-cell function, and improved metabolic remodeling, resulting in augmentation of beta-cell proliferation. Glucokinase inactivation in beta-cells may be a potential strategy for treatment of type 2 diabetes.
Disclosure: K. Omori: None.
247
Stbd1 deficiency results in altered hepatic and cardiac glycogen levels and decreased glucose tolerance in mice
S. Kyriakoudi, A. Drousiotou, P.P. Petrou;
Biochemical Genetics, The Cyprus Institute of Neurology and Genetics, Nicosia, Cyprus.
Background and aims: Glycogen metabolism and endoplasmic reticulum (ER) stress are disturbed in diabetic patients and in experimental animal models of diabetes. Moreover, recent findings support that both hepatic glycogen levels and the extent of ER stress directly impact on the severity of pathological features related to type 2 diabetes (T2D). Starch binding domain-containing protein 1 (Stbd1) is a glycogen-binding protein which resides in the ER membrane with a poorly characterized role in glycogen metabolism. The aim of the current study is to evaluate the metabolic abnormalities of Stbd1-/- mice. This will provide new insights into the role of Stbd1 in glycogen metabolism and its potential role as a modulator of pathological conditions related to T2D.
Materials and methods: Quantification of hepatic and cardiac glycogen content was performed in randomly fed 6-months-old wild type (WT) and Stbd1-/- male mice on a C57Bl6 background, at 18hrs of fasting and 3hrs after refeeding following an overnight fast, by the enzymatic degradation of glycogen and the colorimetric determination of the liberated glucose. Western immunoblot was employed to assess Stbd1 expression levels in the liver of C57Bl6 male mice following i.p injection of the ER stress inducer tunicamycin (1mg/kg) for 24 hrs. OGTT was conducted by monitoring blood glucose levels at timed intervals following the administration of dextrose solution (2g/kg). Glucose measurements were performed in blood samples obtained from the tail tip using a hand-held glucometer.
Results: Randomly fed Stbd1-/- mice displayed significantly reduced glycogen content in the liver as compared to WT controls (p<0.001). Fasting resulted in a marked reduction of hepatic glycogen in WT and it’s near complete depletion in Stbd1-/- mice. In contrast to glycogen in the liver, cardiac glycogen was found to be increased in randomly fed Stbd1-/- mice (p<0.01). We found that fasting induced an opposite effect on cardiac glycogen content in WT and Stbd1-/- mice resulting in an increase in controls and a reduction in knockout animals (p<0.05). Our results further indicate that Stbd1-/- mice displayed impaired tolerance to fasting as evidenced by a significant reduction in body mass and decreased ability to defend blood glucose as compared to WT controls. Moreover, Stbd1-/- mice showed reduced ability to clear glucose from the blood as demonstrated by OGTT (p<0.05). We further identify Stbd1 as a target of the ER stress response as evidenced by the marked upregulation of Stbd1 in the liver following the i.p administration of tunicamycin (p<0.001).
Conclusion: Our results reveal for the first time metabolic aberrations in Stbd1-/- mice such as decreased glucose tolerance, impaired response to fasting and abnormalities in tissue glycogen content. In particular, the reduced liver and increased heart glycogen content displayed by randomly fed Stbd1-/- is also featured by patients with diabetes. Moreover, our findings strongly suggest a direct relationship between ER stress activation and Stbd1 expression. Interestingly, both ER stress and hepatic glycogen content were previously shown to influence metabolic manifestations related to T2D such as insulin resistance and glucose intolerance. Taken together the above data may suggest a potential modifying effect of Stbd1 on the metabolic abnormalities related to diabetes and further imply that Stbd1-/- mice could serve as a novel animal model for the study of T2D and related pathologies.
Supported by: RIF
Disclosure: S. Kyriakoudi: None.
248
Dynamic characteristics of high-fat diet model and its temporal transcriptomic landscape of interorgan crosstalk between islet and liver contributing to beta cell dysfunction
R. Gao1,2, H. Jiang2, Q. Fu2, Q. Zhang1, T. Yang2;
1Oxford Centre for Diabetes, Endocrinology and Metabolism, University of Oxford, Oxford, UK, 2Department of Endocrinology and Metabolism, The First Affiliated Hospital of Nanjing Medical University, Nanjing, China.
Background and aims: Hyperinsulinemia and insulin resistance are co-existing characteristics of type 2 diabetes. However, the forerunner initiating the deleterious cycle remains elusive. The temporal transcriptomic landscape of islets (responsible for hyperinsulinemia) and liver (involved in insulin resistance) could provide new insights.
Materials and methods: The dynamic profile of glucose metabolism, islet architecture and secretion, insulin sensitivity and T cell subpopulations were monitored in C57BL/6N mice fed on a 60% high-fat diet (HFD) or control for 24 weeks. RNA-sequencing and transcriptomic analyses of islets and liver were respectively performed in quadruplicates at 4, 8, 12, 16, 20 and 24 weeks. To evaluate co-ordinated molecular interactions of islets and liver, we generated a massive matrix of Pearson correlation coefficients in weighted gene co-expression network analysis (WGCNA). Ingenuity Pathway Analysis was also applied to construct networks and identify major integrative hubs.
Results: HFD mice exhibited progressively impaired glucose homeostasis with evident hyperinsulinemia and first-phase insulin secretion defect since 4 weeks. Insulin, glucagon and somatostatin secretion in response to glucose or co-stimulated palmitic acid demonstrated a gradually deteriorated transition from islet dysfunction to failure. HFD islet morphology showed increased abundance of β-cell whose proliferation peaked at 4 weeks, with concomitant reduction in δ- and α-cell proportion. Ultrastructure of β-cell also presented decreased docked granules and deranged cristae of mitochondria. We identified impaired systemic insulin sensitivity from 12 weeks with variable time course in tissue-specific insulin action. Liver and skeletal muscle developed insulin resistance from 16 weeks, while adipose tissue initiated from 8 weeks. Our RNA-sequencing dataset outlined the impact of HFD on dynamics of molecular network in islets and liver at different stages. Correlation analyses of islet and liver modules with metabolic phenotypes illustrated that these two tissues jointly program β-cell compensatory adaption and irreversible impairment. Top scored networks combining the islet and liver transcriptomes showed potential interactions of genes implicated in cell cycle during 4 weeks, organismal development around 12 weeks, and immune cell trafficking at 24 weeks. To validate that immune and inflammatory responses might be involved in HFD-induced diabetes, we observed significant increase in the proportion of T helper 1 cells and T helper 17 cells, and decrement in regulatory T cells.
Conclusion: Our data provide a comprehensive landscape of crosstalk between islets and liver in diet-induced diabetes, linking to the development of islet dysfunction and insulin resistance.

Supported by: NFSC
Disclosure: R. Gao: None.
OP 45 Diabetic foot: new developments in wound healing
249
Extracellular vesicles derived from platelet-rich plasma accelerate dermal wound healing via activation of TGF-β1/Smad2 signalling pathway in a diabetic rat model
S. Rui1,2, L. Li1, W. Deng2, G. Yang3, D. Armstrong4;
1Key Laboratory of Diagnostic Medicine (Ministry of Education) and Department of Clinical Biochemistry, Chongqing Medical University, Chongqing, China, 2Bioengineering College and Department of Endocrinology, Chongqing University Central Hospital, Chongqing University, Chongqing, China, 3Department of Endocrinology, the Second Affiliated Hospital, Chongqing Medical University, Chongqing, China, 4Department of Surgery, Keck School of Medicine of the University of Southern California, Los Angeles, USA.
Background and aims: Dermal wounds have become an economic, social, and public health burden and need advanced treatment in diabetic patients. Our previous study has proven that platelet-rich plasma (PRP) contains an abundance of promotion-related factors secreted by platelets and promotes wound healing in diabetic foot patients, but the underlying mechanism is not clear. Extracellular vesicles (EVs) released from PRP play an important role in cell-to-cell communication. This study aimed to investigate the effects of PRP-derived extracellular vesicles on dermal wound healing and the underlying mechanism in a diabetic rat model.
Materials and methods: Extracellular vesicles were isolated from PRP using a gradient ultracentrifugation method. EVs were identified by transmission electron microscopy (TEM), dynamic light scattering, western blotting. In vitro, HUVEC, HaCaT, human dermal fibroblasts are used for cytological analysis. EVs uptake, cell migration, cell proliferation and effects on major signal transduction pathways were analyzed by immunofluorescence, wound-healing assay, flow cytometry, tubule formation assay, qRT-PCR, Western blotting. In vivo, we established a cutaneous wound model in streptozotocin-induced diabetic rats. Rats were randomly assigned to two groups of ten rats each: diabetic control group and PRP-EVs group. PRP-EVs were injected dispersively into the wound edge. The curative effects of PRP-EVs on inflammation and wound healing were observed and evaluated. Histology, immunofluorescence, and immunochemical analysis were performed for wound histological analysis.
Results: Our in vitro results showed that PRP-EVs stimulated the cell migration, proliferation of HaCaT, human dermal fibroblasts and HUVEC in a dose-dependent manner. Furthermore, PRP-EVs also promoted collagen synthesis of HDF via activation of TGF-β1/Smad2 signaling pathway and tube formation of HUVEC. Testing this system in a diabetic rat model, we found that this approach resulted in accelerated skin wound healing, remodeling, activated angiogenesis, and promotion of collagen maturity in vivo. The levels of expression of TGF-β1 and Smad2 mRNAs were significantly higher in the PRP-EVs treated group than in the control group (p < 0.05). The expressions of TGF-β1 and Smad2 proteins were also significantly upregulated in the PRP-EVs treated group than in the control group (p < 0.05).
Conclusion: We provide evidence of the probable molecular mechanisms underlying the PRP-EVs effect on the healing of chronic ulcers and could have infinite possibilities for future therapy.
Supported by: cstc2018jcyjAX0335
Disclosure: S. Rui: None.
250
Vasomotion analysis based on speed-resolved perfusion measurement as a method to investigate microvascular dysfunction in patients with type 2 diabetes
F. Iredahl1, E. Tesselaar2, R. Mirdell2, H. Jonasson3, S. Bergstrand3, F.H. Nyström1, C.J. Östgren1, I. Fredriksson3, M. Larsson3, T. Strömberg3;
1Department of Health, Medicine and Caring Sciences, Linköping University, Linköping, 2Department of Biomedical and Clinical Sciences, Linköping University, Linköping, 3Department of Biomedical Engineering, Linköping University, Linköping, Sweden.
Background and aims: Type 2 diabetes is associated with the risk of microvascular complications such as diabetic foot ulcers and diabetes nephropathy. Early detection of impaired microvascular circulation could be used to increase preventive action, before clinical complications appear. Vasomotion has been suggested to be the mechanism by which the microcirculation adjusts local tissue blood flow, maintaining local homeostasis. The aim of this study was to analyze vasomotion in healthy subjects and patients with type 2 diabetes with microalbuminuria (DMA) and no microalbuminuria (DNMA), respectively. We hypothesized that decreased vascular myogenic and endothelial activity would be observed in patients with type 2 diabetes as a sign of microvascular complication, particularly in signals related to perfusion in capillaries, venules and small arterioles.
Materials and methods: Speed-resolved microcirculatory perfusion (% red blood cells (RBC) × mm/s) divided into three speed regions: 0-1, 1-10 and above 10 mm/s, were assessed during baseline and after local heating of the foot with a new device integrating diffuse reflectance spectroscopy and laser Doppler flowmetry. Patients with type 2 diabetes (41 DMA defined as uACR ≥ 3.0 mg/mmol, and 34 DNMA) and 41 age-matched control subjects were included. For each speed region, blood flow variations related to respiration (0.15 - 0.6 Hz), myogenic activity in the vessel wall (0.05 - 0.15 Hz), sympathetic activity (0.02 - 0.05 Hz) and endothelial activity (0.008 - 0.02 Hz) was quantified using wavelet analysis. Speed regions below 1 mm/s are associated with capillary flow, 1-10 mm/s is foremost constituted from flow in venules and small arterioles, and above 10 mm/s are related to flow in larger arterioles and other larger vessels.
Results: At rest, blood flow variations associated with endothelial, myogenic and sympathetic activity was lower in DMA compared with controls in the 0-1 mm/s speed region (endo: 2.4 vs. 9.8 %RBC × mm/s, p = 0.002; myo: 7.6 vs. 14.6 %RBC × mm/s, p = 0.01; symp: 6.0 vs. 16.1 %RBC × mm/s, p = 0.001). After local heating, endothelial, myogenic and sympathetic activity was lower in DNMA compared with controls in the 0-1 mm/s speed region (endo: 5.8 vs. 13.2 %RBC × mm/s, p = 0.04; myo: 22.0 vs. 30.3 %RBC × mm/s, p = 0.01; symp: 10.8 vs. 20.3 %RBC × mm/s, p = 0.01).
Conclusion: Patients with type 2 diabetes show impaired microvascular vasomotion related to endothelial, myogenic and sympathetic activity compared to age-matched controls, specifically in low speed regions, both at rest and after local heating. Vasomotion analysis in combination with speed-resolved laser Doppler flowmetry seems to be a promising method for non-invasive observation of microvascular dysfunction.
Supported by: VINNOVA, NovaMedTech
Disclosure: F. Iredahl: None.
251
Macrophage phenotype in diabetic wound healing
I. Eleftheriadou1, A. Tentolouris1, I. Anastasiou1, D. Tsilingiris1, O. Kosta1, E. Tzeravini1, I. Pateras2, N. Tentolouris1;
11st Department of Propaedeutic Internal Medicine, Laiko General Hospital, Medical School, National & Kapodistrian University of Athens, Athens, 2Department of Histology-Embryology, Medical School, National & Kapodistrian University of Athens, Athens, Greece.
Background and aims: Diabetic foot ulcers (DFUs) are usually chronic wounds stalled in the inflammatory phase of the wound healing process. In the early inflammation phase pro-inflammatory (M1) macrophages clean the ulcer by phagocytosing bacteria and debris. As the inflammation resides macrophages undergo a transition to an anti-inflammatory and healing phenotype (M2 macrophages). Diabetic animal wound studies have shown delayed macrophage phenotype transition and increased M1/M2 macrophage ratio. The aim of our study was to examine the macrophage phenotype in the skin of patients with diabetes with and without DFUs.
Materials and methods: A total of 20 patients with diabetes (10 with chronic non-infected DFUs, 10 without DFUs) and 12 healthy controls were recruited. Forearm skin punch biopsies were obtained from all participants. In addition, punch biopsies from the borders of the ulcers were performed from patients with DFUs. CD64 (M1 macrophages) and CD163 (M2 macrophages) immunohistochemistry staining was performed in all biopsies.
Results: The number of CD64+ and CD163+ cells from the forearm biopsies differed significantly between the 3 groups of participants (p=0.001 and p=0.003, respectively); sub-analysis showed that patients with DFUs had significantly higher number of CD64+ cells [(5.8 (5.3, 6.4)] when compared with patients without DFUs [3.9 (3.1, 4.4)] (p=0.001) and healthy participants [3.4 (3.1, 4.5)] (p<0.001). Participants with DFUs and without DFUs had significantly higher number of CD163+ cells [6.5 (5.2, 7.5) and 7.0 (6.0, 7.6), respectively] when compared with healthy individuals [3.6 (2.7, 5.7)] (p=0.006 and p=0.002, respectively) in the forearm biopsies. The number of CD64+ and CD163+ cells did not differ between the forearm and foot of patients with DFUs.
Conclusion: There is increased inflammation in the skin of patients with DFUs when compared with patients with diabetes without DFUs and with healthy individuals. In the forearm and foot of individuals with DFUs similar macrophage phenotype was observed that is associated with a chronic pro-inflammatory state. This notion could suggest that increased inflammation in the skin of patients with diabetes either results in foot ulceration or impairs normal wound healing.
Disclosure: I. Eleftheriadou: None.
252
Additive effect of miRs-146a and 29a inhibition using in vitro and in vivo wound healing models of type 1 diabetes
M. Petkovic1, A.E. Sørensen1, E.C. Leal2, R.J. Willemoes1, H. Jenssen1, E.M. Carvalho2,3, L.T. Dalgaard1;
1Roskilde University, Roskilde, Denmark, 2University of Coimbra, Coimbra, Portugal, 3Department of Geriatrics, University of Arkansas for Medical Sciences, Little Rock, USA.
Background and aims: Impaired wound healing among diabetic patients is a result of chronic inflammation, microvascular and macrovascular complications, leading to development of diabetic foot ulcers. The role of microRNAs miR-146a and miR-29a, both highly increased in diabetes, is not well characterized in wound healing. We aimed to evaluate the impact of miR-146a and miR-29a, on wound healing using an in vitro scratch essay followed by pathway analysis of proteomics data. In addition, the effect of topical dermal treatments of miR-146a and miR-29a inhibitors on wound healing kinetics and restoring the collagen structure during wound healing in diabetic mice was evaluated.
Materials and methods: Human keratinocyte cells (HaCaT) were cultured in high glucose DMEM medium. For scratch migration assays, HaCaT cells were transfected with a negative control (neg ctrl) or miR inhibitors targeting miR-146, miR-29a alone or in combination. Predicted target genes in skin were retrieved from TargetScan 7.1 and filtered using an mRNA expression array (E-GEOD-23006) and subsequently analyzed for Gene Ontology (GO) enrichment using DAVID. Diabetes was induced in C57BL/6 mice using low-dose streptozotocin injections for 5 consecutive days. Wound-healing kinetics were evaluated up to day 10. Collagen deposition was assessed by the Masson Goldner staining in mouse skin sections 10 days after full thickness wounding.
Results: MiR-146 inhibition (25pmol) caused slower scratch closure: 64.07+/- 8.87% remaining gap after 24hrs compared with miR-29 inhibition (25pmol) (43.57+/-10.86%) or the neg. ctrl (25pmol) (35.95+/- 9.08%) (p˂0.001). Combination of miRs-146a and -29a inhibitors (12.5pmol each) accelerated the scratch closure to 48.37+/- 13.07% remaining gap, 24h later relative to miR-146 inhibition (64.07+/- 8.87% remaining gap) (25pmol), p˂0.01. GO analysis indicated predicted target genes of miR-29a to be over-represented in the GO category 0030199~collagen fibril organization (p=0.045). MiR-146a and -29a inhibitors (2.5 nmol/day) accelerated the wound closure on day 8 (22.02+/-8.80) and day 9 (15.36+/-8.73) compared to negative controls (2.5nmol/day) (22.02+/-8.80) MiR-29a inhibition (2.5nmol/day) improved collagen deposition (63.06+/-10.37%), when compared to miR-146a inhibition (11.02+/-6.01%) and neg. ctrl (15.47+/-8.74%) (2.5 nmol/day), (p˂0.001).
Conclusion: Migration of HaCaT keratinocytes was the highest following the combined inhibition of miR-146a and miR-29a. Moreover, miRs-146a and -29a, dynamically regulated by wounding and differentially regulated under diabetic conditions improved collagen structure in an animal model of wound healing. These findings imply that manipulating the expression levels of miR-146a and miR-29a may improve healing outcome under diabetic conditions.
Supported by: EFSD
Disclosure: M. Petkovic: None.
OP 46 Challenges in delivering diabetes care: new solutions
253
HbA1c thresholds have substantial impact in screening procedures for those at risk of developing type 2 diabetes
R.S. Greiner1, A. Hill1, B.A. Knight1, T. McDonald1, B. Shields1, A.G. Jones1, L.R. Rodgers2;
1Exeter Clinical Research Facility, University of Exeter, Exeter, 2Institute of Health Research, University of Exeter, Exeter, UK.
Background and aims: We aimed to investigate the performance of screening procedures for identifying individuals at high risk of Type 2 diabetes (T2D) in identifying progression to T2D within 5 years. Screening is carried out to identify individuals for referral to a diabetes prevention intervention designed to reduce risk through weight management, diet and exercise change. Places are limited, so ensuring that they are given to those at the greatest risk of developing T2D is of paramount importance.
Materials and methods: The sample consisted of 3,469 participants from the Exeter 10,000 population cohort (non-diabetic at baseline). At baseline participants completed the Cambridge Risk Score (CRS) and Leicester Risk Score (CRS) and had their HbA1c measured. HbA1c results from routine clinical care in the following 5 years were recorded. Participants were considered to have developed T2D when their HbA1c rose above 47 mmol/mol (≥48 mmol/mol). Progression to T2D within 5 years was modelled using a flexible parametric survival model. NICE recommended cut offs of CRS ≥0.128, LRS ≥16, and HbA1c 42-47 mmol/mol were used to assess diabetes risk. We divided those at high risk in to categories of HbA1c 42-44 mmol/mol and 45-47 mmol/mol. Hazard ratios (HR) for risk of developing T2D within 5 years for these categories relative to those at low risk (HbA1c <42 mmol/mol) were calculated. We calculated the hazard ratio for those with a high HbA1c alongside a high risk score, compared to those with high HbA1c alone.
Results: The median (IQR) age of participants was 62 years (52, 68); BMI was 26.3 kg/m2 (23.8, 29.3); HbA1c was 39 mmol/mol (37, 41); and follow up was 51 months (27-60). 3.0% of participants progressed to T2D within 5 years (n=105). 21.9% of participants were classified as high risk for T2D (n=760) by HbA1c, and of those 10.9% progressed to T2D (n=83), compared to 0.8% of those classified as low risk (n=22). 17.0% had HbA1c 42-44 mmol/mol (n=588) and of those 6.0% developed T2D within 5 years (n=35). 5.0% of participants had HbA1c 45-47 mmol/l (n=172), and of those 27.9% developed T2D within 5 years (n=48). Those identified as high risk for T2D by HbA1c alone had 13.6 (95% CI: 8.5, 21.7) times the chance of developing T2D within 5 years as those with low risk. Within the high risk range there were different degrees of increase in risk; those with HbA1c 45-47 mmol/mol had 39.8 (95% CI: 24.0, 66.0) times higher risk compared to <42 mmol/l, whereas for those in the 42-44 mmol/mol range had a risk only 7.1 (95% CI: 4.2, 12.2) times higher. Among those with high HbA1c, both risk scores helped further separate those at greatest risk (HR=2.8 (1.6, 4.8) for LRS≥16 vs <16; HR=2.6 (1.5, 4.4) for CRS≥0.128 vs <0.128).
Conclusion: Individuals at high risk for T2D had a greater risk of developing T2D within 5 years compared to those identified as low risk. However, individuals with HbA1c 45-47 mmol/mol had higher risk of developing T2D within 5 years compared to those with HbA1c 42-44 mmol/mol, despite both being considered as high risk. Raising the threshold for identification of high risk individuals may help to ensure that places are allocated to those with the greatest need. The addition of a risk score, calculated using readily available data such as age and BMI, helped to identify those at greater risk, and the CRS and LRS performed similarly in this task.
Disclosure: R.S. Greiner: None.
254
Effects of patient-initiated visits in the diabetes outpatient clinic: 2 year RCT (DIATAST - the DIAbetes patient TAkes reSponsibiliTy)
N. Drojdahl Ryg1,2, J. Gram1,3, M. Haghighi1, C.B. Juhl1,2;
1Medical Department/Endocrinology, Hospital South West Jutland, Esbjerg, 2STENO Diabetes Centre Odense, Odense, 3Department of Regional Health Research- Hospital South West Jutland, Odense, Denmark.
Background and aims: Type 1 diabetes (T1DM) patients usually attend the outpatient-clinic with regular intervals decided by the health care providers. No previous studies have assessed possible consequences of exclusively patient-initiated visits in this patient population. The aim of the study was to examine the effects of patient-initiated visits in the diabetes outpatient clinic on 1) Patient reported experience measures (PREM), 2) Clinical diabetes variables and 3) Number of contacts to the outpatient clinics.
Materials and methods: Adults with T1DM for more than 6 months, who were internet users, were included. Patients with unstable diabetic complications, large increase in HbA1c within the past 6 months, or found non-eligible because of frailty were excluded. After informed consent and collection of baseline data, patients were randomized (1:1) to two years intervention with 1) Patient-initiated visits and push reminders every 3rd month (INT) or 2) Usual care with pre-scheduled visits (CON). The primary outcome was PREM evaluated by a self-designed questionnaire (5-point Likert scale). Questions were focused on 1) accessibility of the outpatient clinic, 2) the benefit of the consultation and, 3) overall patient satisfaction with the use of the outpatient clinic. Secondary outcomes included Hba1c and other clinical diabetes variables and use of resources in the outpatient clinic. Data were analyzed as intention to treat. Likert data were analyzed using linear logistic regression, continuous data by mixed model multilevel regression, resource use by Poisson regression, and dichotomous data by χ2-test. All data were corrected for age, sex, diabetes duration (+/- 5 years), and insulin administration (pump/injection).
Results: Of 849 patients screened, 596 were found eligible, and 357 accepted inclusion (INT: 178/CON: 179). After 2 years, more patients in the intervention group reported to be able to get an appointment when needed (p< 0.001). The INT group experienced more benefit of the consultations within group (p<0.04) and compared with CON (p=0.06). Similarly the INT group reported having fewer unnecessary visits (p<0.005) and being more involved in the content of the consultations compared to CON (p<0.01). Overall patient satisfaction was high in both groups at baseline and at 2y with no change from baseline to 2y between groups (p=0.17). The number of visits in the outpatient clinic during the 2 year study period were significantly lower in the INT-group (median 4 [IQR 3;6]) compared to CON (6 [5;8]) (p<0.001) covering visits both at physicians, nurses, and dieticians. Concurrently, there the was an increase in the number of telephone contacts (INT: 2 [1;4] /CON: 1 [0;3], p<0.001). Mean HbA1c (mmol/mol) was unchanged within and between groups (INT: 59.7(bl)/60.5(2y); CON: 59.7/59.3), p>0.5. Blood pressure, LDL-cholesterol, and albumin-creatinine-ratio likewise remained equal between groups.
Conclusion: The on-demand structure resulted in high and maintained or improved patient reported experience measures and no decline of in the quality of clinical diabetes care. The total use of outpatient clinic resources was reduced. Implementation of such a concept will potentially save resources that can be relocated to patient groups with special needs.
Clinical Trial Registration Number: NCT03083899
Disclosure: N. Drojdahl Ryg: None.
255
Monitoring perception of risk and disruption to medical supplies in people with type 1 diabetes during the covid-19 pandemic
S.N. Scott1, F.Y. Fontana2, T. Zueger1, M. Laimer1, C. Stettler1;
1Department of Diabetes, Endocrinology, Nutritional Medicine and Metabolism, University of Bern, Bern, Switzerland, 2Team Novo Nordisk Professional Cycling Team, Atlanta, USA.
Background and aims: The Centers for Disease Control and Prevention and World Health Organization have determined that Coronavirus Disease-19 (COVID-19) is a serious public health threat, stating that people with chronic medical conditions, including diabetes, are at a higher risk of experiencing complications. However, due to the rapid onset of the pandemic and changing situation, there is currently no data on the risk perception of people with type 1 diabetes (T1D) and whether they are experiencing disruption to healthcare and medical supply. We aimed to 1) gather real-time information on the challenges and perception of risks to people living with T1D during the COVID-19 pandemic and 2) develop a means to display the data in a clear and meaningful way.
Materials and methods: We designed an anonymous questionnaire using an open-access web-based platform (SurveyMonkey.com), which was widely distributed via social media. The survey covered questions relating to coronavirus infections, symptoms, incidence of hospitalization, risk perception and whether respondents have experienced interruption to medical supplies. Data were then analyzed descriptively and the mean population responses were summarized in a live electronic library using Microsoft Power BI (Figure 1).
Results: In the first 7 days of the study, there were 3361 survey responses from individuals in 82 countries (34% from Europe, 43% from America and the rest from Africa, Asia and Oceania). The majority of responses were collected from UK (15%) and USA (36%). 33% of respondents were men, 67% were women. 55% of respondents were in the 25-44 years age category and the average HbA1c of the entire cohort was 7.1±1.2%. The majority (>80%) perceived themselves to be in a good-to-excellent health condition. However, 80% perceived themselves to be exposed to a higher risk to complications if they contract COVID-19, compared to the average person without diabetes. The average risk perception was 88% in USA, 72% in Europe, 86% in Asia, 85% in Australia and 80% in Africa. 60% reported that the pandemic had affected their healthcare access. Insulin, continuous glucose monitors and fast-acting carbohydrates were the diabetes-relates supplies most difficult to access due to the COVID-19 pandemic.
Conclusion: Based on the present data from this large-scale, worldwide survey, we demonstrate an increase in risk perception of people with T1D related to COVID-19. Secondly, access to relevant healthcare services and/or medical supplies appears to have been significantly impaired for people with T1D so far during the pandemic. These issues and concerns need to be taken into account in the care of these patients. Interactive survey approaches such as this may help to address these challenges.

Disclosure: S.N. Scott: None.
256
AMD Annals as a model for improving the quality of diabetes care in Italy
M. Rossi1, V. Manicardi2, G. Clemente3, S. De Cosmo4, R. Manti5, A. Rocca6, P. Pisanu7, A. Nicolucci1, A. Aglialoro8, D. Mannino9, P. Di Bartolo10, on behalf of AMD Annals Study Group;
1Center for Outcomes Research and Clinical Epidemiology, Pescara, 2AMD Annals Study Group Coordinator, Rome, 3CNR, Istituto di Ricerche sulla Popolazione e le Politiche Sociali (IRPPS), Fisciano (SA), 4Scientific Institute, S. Giovanni Rotondo (FG), 5ASL Turin 5, Turin, 6ASST Nord H. Bassini, Cinisello Balsamo (MI), 7Azienda Ospedaliero-Universitaria, Cagliari, 8ASL3 Genovese, Genova, 9AMD Past President, A.O. Bianchi Melacrino-Morelli, Reggio Calabria, 10AMD President, AUSL Romagna, Ravenna, Italy.
Background and aims: Diabetes management is complex and extends beyond glycemic control. A huge gap between ideal care (guidelines) and actual care exists. Standardized performance measures are considered a key strategy to assess quality of care in different settings. In Italy, an initiative of continuous monitoring and quality improvement of diabetes care (AMD Annals) is in place since 2004, promoted by the scientific society of diabetologists (AMD). Changes in AMD quality of care indicators provided by diabetes clinics over 14 years were assessed.
Materials and methods: All participating centers share the same electronic medical records system and a standardized software for the extraction of data collected from 2004 to 2018. Participation is voluntary, anonymous, and free. The annual extraction of data is perceived as a normal part of routine clinical practice and scientific society activity. In 2004, 180 centers provided an annual sample of 239,638 patients with type 2 diabetes, while, in 2018, 249 centers provided an annual sample of 462,600 patients.Changes in the process and intermediate outcome indicators were assessed. Furthermore, a composite indicator of overall care (Q score) was evaluated; Q score was validated in previous studies and correlates with the 3-year risk of incident cardiovascular events (80% excess risk if score <15, and 20% with score between 15- 25, compared to scores> 25).
Results: Percentage changes 2018-2004 documented an improvement both in process indicators (+ 7.2% for annual monitoring of HbA1c, + 18.5% for annual monitoring of lipid profile, + 15.9% for at least one measurement of blood pressure in the last year) and in favorable intermediate outcome indicators (subjects with HbA1c <= 7% increased from 39.0% to 52.9%, those with LDL <100 mg / dl from 26.2 to 63.5%, and those with blood pressure <140 / 90 mmHg from 36.0% to 53.5%). In parallel, the percentages of subjects with particularly high HbA1c (> 8%), LDL cholesterol (>= 130 mg / dl) and blood pressure values (>= 140/90 mmHg) decreased respectively by 17.0%, 27.3% and 17.5%. On the other hand, the proportion of patients with BMI >= 30 kg/m2 (about 40%) and the percentage of smokers (about 17%) remained stable over the years, reflecting the greater difficulty in influencing patients’ lifestyle in the routine clinical practice. The proportion of patients with Q score <15 decreased from 11.5% to 3.7%, while that of patients with Q score between 15 and 25 decreased from 60.2% to 36.3%.
Conclusion: Participation to AMD Annals initiative has markedly improved the quality of care provided by a large network of diabetes centers during 14 years in Italy. Improvements in Q score likely translates into thousands of avoided cardiovascular events, with evident clinical, social and economic benefits. These data confirm the efficacy of the AMD Annals initiative as an effective tool for clinical governance.
Supported by: Sposor: AMD scientific society
Disclosure: M. Rossi: None.
OP 47 Thinking about diabetes complications in the brain
257
Neuroprotective properties of incretin-based therapies
A. Simanenkova1,2, A. Yakovleva2, N. Timkina1, O. Shpilevaya3, D. Samsonov2, S. Chefu2, T. Karonova1,2, T. Vlasov2,1;
1Almazov National Medical Research Centre, Saint-Petersburg, 2Pavlov First Saint-Petersburg State Medical University, Saint-Petersburg, 3North-Western State medical University named after I.I. Mechnikov, Saint-Petersburg, Russian Federation.
Background and aims: Ischemic stroke is the second leading cause of death in patients with type 2 diabetes mellitus. Moreover, it has severe manifestations in this patients cohort. All this requires a search of a drug that has not only glucose-lowering property, being safe and effective, but also neuroprotective effect. The aim of this study was to investigate and to compare neuroprotective actions of incretine-based drugs, glucagon-like peptide-1 receptor agonist liraglutide (LIR) and dipeptidylpeptidase-4 inhibitor sitagliptin (SIT) in acute rat brain ischemia. To exclude a potential connection between protective effect of LIR or SIT and their influence on glycaemia, we conducted a study in non-diabetic rats.
Materials and methods: male Wistar rats 200-255 g were treated with LIR 1 mg/kg s.c. once daily for 7 days (group “LIR”, n=15), SIT 50 mg/kg per os once daily for 7 days (group “SIT”, n=5) or 0.9% NaCl s.c. once daily for 7 days (“Control” group, n=15). Five hours after last drug administration all the animals were subjected to 30-min filament middle cerebral artery occlusion (MCAO). 48 hours after MCAO rats neurological deficit was evaluated by means of Garcia score - healthy animals have 18 points while maximal neurological deficit is characterized by 3 points. After that rats were euthanized and brain slices were prepared and incubated with 0.1% 2,3,5-triphenyltetrazolium chloride for necrosis measurement. Blood glucose level (BGL) was studied 3 times every second day during the treatment.
Results: Brain infarct volume was significantly smaller in “LIR” group in comparison with “Control” (3.97 (2.20; 9.60) and 16.56 (10.87; 26.80) % of total brain volume, respectively, р=0.00). Brain infarct volume in “SIT” group (6.43 (4.24; 16.92) % was also smaller than that in “Control” one (16.56 (10.87; 26.80) %), p=0.012. But, importantly, rats receiving LIR had significantly smaller brain necrosis volume than rats receiving SIT, p=0.019. Rats in group “LIR” had less prominent neurological deficit and consequently more points according to Garcia score (14.0 (11.5-15.5) points) comparing with “Control” group (12.0 (9.0-14.0) points), p=0.038. On the other hand, SIT administration did not lead to significant neurological improvement (10.0 (9.25; 11.5) points) comparing with control group (12.0 (9.0-14.0) points), p=0.24. Neurological deficit was significantly less prominent in “LIR” group comparing with “SIT” one, p=0.021. It is important to notice that BGL was normal in all groups all the time, with no hypoglycemic episodes.
Conclusion: Both LIR and SIT have certain neuroprotective properties in rats transient brain ischemia and this effect is not connected with influence on glucose metabolism. Infarct-limiting effect of LIR is more prominent than that of SIT. LIR, but not SIT, diminishes neurological deficit after transient brain ischemia in rats while administered prior to ischemia modelling.
Supported by: RSF (No. 17-75-30052)
Disclosure: A. Simanenkova: None.
258
Effects of liraglutide and semaglutide on stroke subtypes in patients with type 2 diabetes: a post hoc analysis of the LEADER, SUSTAIN 6 and PIONEER 6 trials
W.D. Strain1, A.G. Holst2, S. Rasmussen2, H.A. Saevereid2, M.A. James1;
1Diabetes and Vascular Research Centre, University of Exeter Medical School, Exeter, UK, 2Novo Nordisk A/S, Søborg, Denmark.
Background and aims: Diabetes is an independent risk factor for stroke, with approximately a two-fold excess risk in people with vs those without diabetes. Accumulating evidence suggests glucagon-like peptide-1 (GLP-1) analogues (including liraglutide and semaglutide) may reduce the risk of stroke in patients with type 2 diabetes (T2D). We examined the effect of liraglutide and semaglutide on stroke and its subtypes based on pooled data from LEADER, SUSTAIN 6 and PIONEER 6.
Materials and methods: LEADER, SUSTAIN 6 and PIONEER 6 were global randomised cardiovascular (CV) outcomes trials of liraglutide, subcutaneous semaglutide and oral semaglutide, respectively, in patients with T2D at high CV risk. In this post hoc analysis, we evaluated the effect of these GLP-1 analogue treatments (pooled) on time to first occurrence of all strokes and subtypes of stroke. Ischaemic stroke was subcategorised according to the TOAST classification, based on aetiology by an external blinded reviewer. A Cox proportional hazards model stratified by trial with pooled treatment as a factor was used to examine treatment effects.
Results: Across the three trials, 216/7907 (2.7%) patients in the GLP-1 analogue group and 262/7913 (3.3%) in the placebo group had a stroke. The risk of first occurrence of all strokes was significantly reduced in the GLP-1 analogue vs placebo group (HR 0.82, 95% CI 0.68-0.98; p=0.030). Treatment effects were consistent across stroke subtypes: ischaemic (HR 0.84, 95% CI 0.69-1.02; p=0.08), haemorrhagic (HR 0.72, 95% CI 0.42-1.22; p=0.22) and undetermined (HR 0.71, 95% CI 0.32-1.60; p=0.41; Figure). Across TOAST subcategories, there was a trend that GLP-1 analogue treatment had the greatest benefit vs placebo in small vessel occlusion strokes compared with large artery disease or cardioembolic strokes; however, no statistically significant effects were found in any subcategory.
Conclusion: In this post hoc analysis of the LEADER, SUSTAIN 6 and PIONEER 6 trials, GLP-1 analogue treatment reduced the risk of stroke in patients with T2D and high CV risk, with an indication using TOAST criteria of the strongest effect on stroke caused by small vessel occlusion.

Clinical Trial Registration Number: LEADER (NCT01179048), SUSTAIN 6 (NCT01720446) and PIONEER 6 (NCT02692716)
Supported by: Novo Nordisk A/S
Disclosure: W.D. Strain: Non-financial support; Abstract supported by Novo Nordisk.
259
Impaired awareness of hypoglycaemia in type 1 diabetes is associated with brain structural alterations and increased cerebral metabolism
N. Stantonyonge, F. Sampedro, S. Martínez-Horta, M. Camacho, B. Gómez, A. Chico;
Hospital de la Santa Creu i Sant Pau, Barcelona, Spain.
Background and aims: Type 1 Diabetes (T1D) is associated to an increased morbidity and mortality including higher risk of cognitive impairment. Despite the relaying mechanisms are still unknown, severe hypoglycemia (SH) would play a fundamental role. Impaired awareness of hypoglycemia (IAH) is the main risk factor for developing SH. Previous studies have described neurocognitive differences between T1D patients with IAH and those with normal awareness (NAH). However, underlying responsible structural and metabolism brain alterations remain poorly characterized.
Materials and methods: Clarke test were performed to assess hypoglycemia awareness. We studied whole-brain gray matter (GM) and white matter (WM) alterations in 20 T1D-IAH patients with respect to 20 T1D-NAH. We compared both groups using different neuroimaging techniques. To assess GM differences, we applied both voxel-based-morphometry (VBM) and cortical surface area analysis pipelines. WM differences were studied using VBM-WM and fractional anisotropy (FA). On the other hand, using state-of-the art neuroimaging techniques, we compared 18F-Fluorodeoxyglucose Positron Emission Tomography (FDG-PET) uptake at rest between 10 T1D patients with IAH and 10 patients with NAH.
Results: Both groups were comparable in terms of gender, age, diabetes duration, cognitive status and cardiovascular risk factors. However, T1D-IAH patients showed reduced GM and cortical surface area thanT1D-NAH, especially in frontal and parietal regions (p<0.05 corrected). They also showed a relative WM compromise, which was evidenced by a reduction in FA along major WM tracts (Figure 1). In terms of brain metabolism, T1D-IAH patients showed a pattern of increased FDG-PET uptake with respect to NAH patients (p<0.05 corrected). Topographically, glucose metabolism was increased in frontal and precuneus regions. Importantly, the structural and metabolism brain compromise observed in T1D-IAH patients correlated in turn with SH frequency and IAH severity. The hypermetabolic state appeared unrelated to compensatory mechanisms due to reduced gray matter density or a neuroinflammatory state.
Conclusion: IAH in T1D patients is associated with a relative structural brain compromise and an abnormal increase in FDG-uptake in brain regions strongly related to cognition. Further research is needed to elucidate whether these brain structural differences predispose to IAH or rather they appear as a consequence to an increase in the frequency and severity of hypoglycemic events. Regarding the increased brain metabolism, a possible mechanism could be that glucose transport is increased in hypoglycemia unawareness to compensate for recurrent hypoglycemia, but further research confirmation is needed.

Supported by: Sociedad española de diabetes
Disclosure: N. Stantonyonge: None.
260
The importance of HbA1c levels for the risk of depression in persons with and without diabetes: a study in four large cohorts
I. Wium-Andersen1, E. Hengeveld1, J. Rungby2, M. Jørgensen3, A. Sandbæk4, M. Osler5, M. Wium-Andersen1;
1Center for Clinical Research and Prevention, Psychiatric Center Copenhagen, Copenhagen, 2Endocrinology and Center for Translational Research, University of CPH, Copenhagen, 3Psychiatric Center Copenhagen, Copenhagen, 4Department of Public Health, University Aarhus, Aarhus, 5Center for Clinical Research and Prevention, University Hospital Bispebjerg, Copenhagen, Denmark.
Background and aims: Diabetes mellitus is a risk factor for depression, glycaemia may be the driver of the risk for depression. Most studies on the association between blood glucose and depression focus on persons with diabetes, individuals without diabetes are less studied. We examined Hba1c levels and risk of developing depression in persons with and without diabetes.
Materials and methods: We used data from 4 cohorts: participants with no diabetes from the Copenhagen Aging and Midlife Biobank (CAMB) (n=5,304, the Glostrup cohorts (n=16,124), and the Addition Study (n=26,507), and participants with diabetes from the Danish Adult Diabetes Database (n=96,544). HbA1c was categorized into tertiles. Depression was in CAMB measured by Major Depression Inventory (MDI), cut-off of 26 points or more. In the Glostrup cohort and the Danish Adult Diabetes Database, depression was defined by an ICD-10 / ICD-8 diagnosis of depression or prescription of antidepressants. In Addition, depression was based on an ICD-10 / ICD-8 diagnosis of depression. Cohorts were analyzed separately by logistic regression or Cox proportional hazard regression models to test if higher HbA1c levels associated with risk of depression. Adjustment for socio-demographic variables, life style variables (body mass index, smoking, alcohol use, physical activity), and illness variables (previous depression, diabetes complications) and inflammatory markers did not change estimates significantly.
Results: Median HbA1c was 35 mmol/mol in the no diabetes cohorts and 56 mmol/mol in the diabetes cohort. In our no diabetes cohorts, we found that higher HbA1c was associated with a higher risk of depression in women in the CAMB (odds ratio 1.96 (95% confidence interval (CI) 1.05-3.66) and the Glostrup cohorts (hazard ratio (HR) 1.32 (95% CI 1.14-1.54), this was not the case in the Addition Study or in the diabetes cohort. In the diabetes cohort, women with higher HbA1c had a slightly lower risk of depression (HR 0.94 (95% CI 0.90-0.98). In men, there was a non-significant tendency that men in the second tertile had the lowest risk in all cohorts.
Conclusion: Taken together, Hba1c levels were not consistently associated with the risk of depression in individuals with or without diabetes. We did not examine glucose fluctuations, exaggerated in diabetes, as possible drivers of the risk. A recent study implied that HbA1c variability, but not mean HbA1c, was associated with depression. Also, another study suggested that hypoglycemia increases the risk of depression, and even as we were able to adjust for hospital contacts due to hypoglycemia, we were unable to further explore the role of hypoglycemia in this study. Further studies of HbA1c variability and glucose fluctuations are warranted to elucidate the relationship between diabetes and depression.
Disclosure: I. Wium-Andersen: None.
OP 48 Insulin secretion in various subgroups
261
Upregulation of Kcnk9 contributes to insulin secretion defect in MODY10
J. Qiao1, W. Chen1,2, Y. Xiong2, X. Li1, H. Shu1, Y. Huang1, W. Feng1, X. Zhang1, A. Anjum2, D. Larkin2, X. Chen3, S. Vadrevu4, L.S. Satin4, P. Arvan2, M. Liu1;
1Tianjin Medical University General Hospital, Tianjin, China, 2Division of Metabolism, Endocrinology & Diabetes, the University of Michigan Medical School, Ann Arbor, USA, 3Department of Physiology, School of Medicine, Wayne State University, Detroit, USA, 4Department of Pharmacology, University of Michigan, Ann Arbor, USA.
Background and aims: Preproinsulin (pPI) translocation across the endoplasmic reticulum (ER) membrane is the first and critical step in β-cell insulin biosynthesis. Inefficient pPI translocation has been linked to maturity-onset diabetes of the young type 10 (MODY10). However, the underlying mechanism of this type of diabetes remains unclear.
Materials and methods: We established transgenic mouse lines specifically expressing MODY10 causing mutant pPI-R6C in β-cells. The body weight and blood glucose were monitored every other week. The oral glucose tolerance test (OGTT) and insulin tolerance test (ITT) on were performed at the age of 1.5-months. Serum insulin was measured by ultrasensitive insulin ELISA. Insulin and β-cell dedifferentiation marker of mouse islets were detected by Western Blot and Immunofluorescence. RNA was isolated from mouse islets and transcriptome analysis was performed with GeneChip® Mouse Gene ST Arrays. Calcium oscillation of isolated islets were performed under different glucose stimulation.
Results: We found that untranslocated pPI accumulated in a juxtanuclear compartment, caused degranulation and decreased insulin positive cells along with increased glucagon positive cells and insulin/glucagon double positive cells, as well as increased β-cell dedifferentiation marker Aldehyde dehydrogenase 1 family member A3 (Aldh1a3), and led to the development of diabetes. Transcriptome analysis indicated that the expression of Kcnk9 was dramatically unregulated. Importantly, upregulating Kcnk9 was associated with abnormally elevated calcium oscillation and flux, linked to increased basal insulin secretion and decreased glucose stimulated insulin secretion (GSIS). Furthermore, overexpressing Kcnk9 in wild-type islets resulted in abnormally elevated basal insulin secretion accompanied with decreased insulin contents, recapitulating insulin secretion defect caused by pPI-R6C.
Conclusion: This study provides the first in vivo experimental evidence supporting that untranslocated pPI causes β-cell failure, and dysregulation of Kcnk9 expression plays an important role in the pathogenesis of this form of diabetes.
Supported by: National Natural Science Foundation of China 81830025, 81620108004, 81870533, 81800733, 81700720
Disclosure: J. Qiao: None.
262
Circulating C-peptide levels mirror patterns of residual beta cell mass in the pancreas of children and young people with type 1 diabetes
A.L.J. Carr1, J.R.J. Inshaw2, C.S. Flaxman1, P. Leete1, N.G. Morgan1, J.A. Todd2, R.A. Oram1, S.J. Richardson1, R.E.J. Besser2,3;
1Institute of Biomedical and Clinical Science, Exeter, 2JDRF/Wellcome Diabetes and Inflammation Laboratory, Wellcome Centre for Human Genetics, Oxford, 3Department of Paediatrics, Oxford, UK.
Background and aims: C-peptide (CP) levels decline in type 1 diabetes (T1D), although many patients have low but detectable levels of CP for many years after diagnosis. Currently there is little understanding of how the levels of circulating CP relate to pancreatic beta cell retention and if this varies with age at diagnosis. In this study we used a large clinical T1D cohort and unique T1D pancreas biobanks to independently assess the CP levels in the blood and beta cell loss within the pancreas, in subjects diagnosed at increasing ages and with differing diabetes durations.
Materials and methods: We studied 4,079 serum CP from the UK Genetic Resource Investigating Diabetes (UK GRID) cohort, diagnosed at <16 years as well as 238 pancreas samples recovered from people with T1D (diagnosed <18 years) from the network for Pancreatic Organ donors with Diabetes (nPOD) biobank and the Exeter Archival Diabetes Biobank (EADB). Cases were stratified by age at diagnosis (<7, 7-12, ≥13 years) and grouped by diabetes duration (<1, 1-5, 5-10, ≥10 years). We report the proportion of individuals from the UK GRID cohort with detectable CP (>3 pmol/L) and the proportion of donors from the two independent pancreatic biobanks having residual insulin containing islets (ICIs), within each age group over increasing diabetes durations.
Results: Detectable CP levels persisted in some individuals in all age groups over time, although this was least common in those diagnosed <7 years (detectable CP: <7 group: 372/1666 (22%), 7-12 group: 981/1887 (52%), ≥13 group 363/526 (69%)). A similar pattern was observed in the proportion of individuals with residual ICIs in the pancreas, (residual ICIs: <7 group: 33/87 (38%), 7-12 group: 51/89 (57%), ≥13 group: 42/62 (68%). In all groups, the number of individuals with detectable CP levels declined beyond the first year after diagnosis, but was most marked in those diagnosed at younger ages (detectable CP <1 year post diagnosis: <7 group: 19/20 (95%), 7-12 group: 108/110 (98%), ≥13 group 58/61 (95%) vs. detectable CP 1-5 years post diagnosis: <7 group: 227/522 (44%), 7-12 group: 681/995 (68%), ≥13 group: 243/289 (84%). This was mirrored by an equally rapid decline in individuals with residual ICIs in the pancreas (residual ICIs <1 year post diagnosis: <7 group: 24/26 (92%), 7-12 group: 32/33 (97%), ≥13 group: 22/25 (88%) vs. residual ICIs 1-5 years post diagnosis: <7 group: 2/12 (17%), 7-12 group: 8/13 (62%), ≥13 group: 7/8 (88%). A proportion of children diagnosed <7 years had detectable CP ≥10 years post diagnosis (37/489 (7.6.%)) and a similar proportion retained some beta cells (3/35 (8.6%)) over this time.
Conclusion: Our study suggests that serum CP levels provide a strong indication of residual beta cell mass in the pancreas in patients with T1D at all ages and diabetes durations. Thus, progressive loss of beta cells is the main contributory factor in the decline in endogenous insulin secretion observed in children and young people diagnosed with T1D. Interventions that delay this loss would promote higher CP secretion, which is associated with improved clinical outcomes.
Supported by: nPOD, JDRF, Leona M. & Harry B. Helmsley Charitable Trust, Wellcome Trust
Disclosure: A.L.J. Carr: None.
263
Impaired 1st phase insulin secretion predicts beta cell functional capacity following partial pancreatectomy in humans
T. Mezza1, P.M. Ferraro2, G. Di Giuseppe1, U. Capece1, F. Cinti1, S. Moffa1, C.M.A. Cefalo1, A. Mari3, A. Giaccari1;
1Endocrinologia e Diabetologia, Fondazione IRCCS Policlinico Universitario Agostino Gemelli, Roma, 2Nefrologia, Fondazione IRCCS Policlinico Universitario Agostino Gemelli, Roma, 3Istituto di Neuroscienze, Consiglio Nazionale delle Ricerche, Padova, Italy.
Background and aims: The relative contributions of decreased function or mass to clinically manifest β-cell dysfunction represents a matter of debate. β-cell functional defects temporally anticipate (and eventually cause) the subsequent development of hyperglycemia, whereas a significant reduction (~50%) of beta-cell mass is observed at diagnosis of type 2 diabetes.
Materials and methods: To further investigate the relative role of beta-cell mass reduction/dysfunction in the development of diabetes we performed oral glucose tolerance tests (OGTT) and hyperglycemic clamps (HC), followed by arginine stimulation and mixed meal test (MMT), in 39 non-diabetic patients undergoing pancreatoduodenectomy (PD), as model of acute mass reduction, pre- and post-surgery. Based on post-surgery OGTT, subjects were divided into 3 groups depending on glucose tolerance: normal (NGT, n=11), impaired (IGT, n=10) or diabetic (DM, n=18) (23 F/16 M, 63±13.7 anni, BMI 23.9±4.5 kg/m2). To evaluate β-cell function, β-cell glucose sensitivity (GS) was calculated during HC, MMT e OGTT as the ratio of insulin secretion and glucose increments.
Results: Comparison among the 3 groups revealed that pancreatectomy had a significantly different effect on time-dependent change of glucose and insulin levels during all tests (P<0.01 for the interaction between pancreatectomy, time and glucose tolerance of glucose, insulin and c-peptide levels). Before surgery, Arginine-stimulated Insulin Secretion rates (AIS) and GS were similar across groups, whereas incremental 1st phase insulin secretion were significantly lower in IGT and DM as compared with NGT subjects (p=0.01). Following PD, the reduction of GS during HC e OGTT was greater in IGT and DM compared to NGT (p=0.01 per HC and OGTT). A similarly scaled reduction was observed in ΔAIS (p<0.01 and 2nd phase of insulin secretion (p<0.01), but not in ΔIRS1 (p=0.33).
Conclusion: In this study the acute beta-cell mass reduction had a different impact on insulin secretory capacity, despite comparable functional mass at baseline, according to pre-surgery insulin secretion characteristics. This suggests that underlying impairment in beta-cell dysfunction anticipates the decline of beta-cell responses, being the pivotal mechanism for the development of hyperglycemia.
Supported by: EFSD Future Leaders Mentorship Programme
Disclosure: T. Mezza: Grants; Mentorship Programme.
264
In vivo estimates of beta cell mass in 251 normoglycaemic individuals are strongly associated with BMI and insulin resistance
T.M. Frayling, A. Pitt, M. Hudson, B. Knight, R. Nice, T. McDonald, A. Jones, A.T. Hattersley;
University of Exeter, Exeter, UK.
Background and aims: Beta cell mass is difficult to study in vivo but may be critical in maintaining normal glucose homeostasis. Beta cell mass is associated with BMI and reduced in diabetes in autopsy studies (n=57). There are few studies of beta cell mass in vivo. The best in vivo measure of mass is based on depolarisation of beta cells using an arginine bolus at high glucose concentrations achieved by glucose infusion to provide a maximal stimulus. The majority of previous studies have been small ( <60 people) and typically examine the impact of an intervention (e.g. acute weight loss or therapeutic intervention (e.g. metformin) in subjects with diabetes. There have been limited studies in people without diabetes (max n=70) with contradictory results on whether beta-cell mass can compensate for insulin resistance associated with obesity. We aimed to use beta-cell mass to assess the factors associated with beta-cell mass in normoglycaemic individuals looking specifically to assess if there were associations with BMI and insulin resistance.
Materials and methods: We recruited and completed the glucose potentiated arginine insulin secretion (GPAIS) test in the largest study of beta cell mass (N=251 non-diabetic, BMI 25.4 (SD 3.58) kgm2, Age 59.7 (SD 9.7) years, 38% male). In this test we gave a dose of 5g arginine when the glucose was maintained at 20 mmol/l. We estimated beta-cell mass using the previously described calculation of insulin increment in response to the depolarising stimulus of the arginine infusion. We also measured insulin secretion using an intravenous glucose tolerance based test (IVGTT).
Results: Beta-cell mass measured in the GPAIS test was associated with higher measures of adiposity: BMI (+0.35SDs [se0.06]; px10-9), waist hip ratio (+0.40SDs [se0.08]; px10-6), body fat % (+0.36SDs [se0.06]; px10-9), but not with measures of size (height) or age. Beta-cell mass was associated with higher measures of insulin resistance: HOMAS (-0.39SDs [se0.06]; px10-11), SI-index ((-0.60SDs [se0.05]; p<2x10-16)). For a given fat mass percentage, men had a higher estimated beta cell mass than women. Beta cell mass was more strongly associated with insulin resistance and adiposity than beta cell function, as measured by an IVGTT in the same test protocol (e.g. HOMAS (-0.32SDs [se0.06]; px10-7); BMI (+0.26SDs [se0.06]; px10-5)).
Conclusion: These data, in the largest study of in vivo beta cell mass, show a strong association of higher estimated beta-cell mass with higher measures of adiposity and insulin resistance. The results are consistent with a higher islet mass compensating for chronically higher insulin resistance. This increased beta-cell mass could contribute to the maintenance of normoglycaemia in obese subjects and suggests plasticity in functional beta-cell mass in humans outside infancy.
Clinical Trial Registration Number: NCT02505308
Supported by: Medical Research Council
Disclosure: T.M. Frayling: None.
PS 01 Diabetes and early death
265
Estimating life years lost to diabetes: outcomes from analysis of National Diabetes Audit and Office of National Statistics data England
M. Stedman1, M. Davies2, M. Livingston3, R. Alshames4, M. Lunt5, G. Rayman6, R. Gadsby7, A.H. Heald4;
1The Office, Res Consortium, Andover, 2Res Consortium, Andover, 3Walsall Manor Hospital, Walsall, 4Endocrinology & Diabetes, Salford Royal NHS Foundation Trust, Salford, 5University of Manchester, Manchester, 6Diabetes Centre, Ipswich Hospital NHS Trust, Salford, 7Medical School, University of Warwick, Coventry, UK.
Background and aims: With sustained growth of diabetes predicted for the future, avoiding long term comorbidities means that effective treatment of the condition is vital, along with sustained patient engagement. New treatments give opportunities to improve longer term health outcomes for people with diabetes. In this study we calculated the impact of sub-optimal management of diabetes on overall expected lost life years (LLY) in people with diabetes mellitus (DM) in England.
Materials and methods: The National Diabetes Audit (NDA) published for 2015-16 the all-cause standardised mortality ratio for people with Type 1DM(T1DM) and Type 2DM(T2DM) in 5 different age groups and each sex and number of people with T1DM/T2DM in quinary age groups by sex. The Office for National Statistics (ONS) published for 2015-17 actual mortality rates of the general population for each age year and sex. The model we employed applied relative NDA mortality rates to population rates for each age/sex, and calculated the future life expectancy for T1DM/T2DM/non-DM populations. The difference between total life expectancy for the total reported populations by age and gender of T1DM and T2DM to an equivalent population with non-DM gave lost life years.
Results: We analysed data from 6,165 general practices supporting 41.3m people of whom 217k were on T1DM register and 2.50m on T2DM register. In the model the ‘average’ person with T1DM (age 42.8 years) has a life expectancy of 32.6 years (total population 7.1m life years), compared to 40.2 years in the equivalent age non-DM population, corresponding to LLY of 7.6 years/average person (1.7m total LLY for T1DM). The ‘average’ person with T2DM (age 65.4 years) has a life expectancy of 18.6 years (total population 46m life years) compared to the 20.3 years for equivalent non-DM population, corresponding to LLY of 1.7 years/average person (4.3m total LLY for T2DM). The average LLY/person for women were 21% higher for T1DM and 45% higher for T2DM women versus men.
NDA reports 70% of T1DM and 33% of T2DM had Hba1c>58mmol/mol, so were at higher risk. Allocating total LLY to the future life expectancy of both T1DM and T2DM at-risk group, shows that one year with HbA1c>58mmol/mol could lose around 100 life days.
Conclusion: The higher mortality risks associated T1DM and T2DM and historic treatments, project a future loss of over 6 million LY in the current diabetes population. The consequences in terms of LLY for women with diabetes are greater than for men according to our model. Linking poor glycaemic control to expected mortality in such a quantitative way may incentivise clinicians and people with diabetes and poor control to increase their efforts to achieve targets.

Disclosure: M. Stedman: None.
266
Thresholds for postprandial hyperglycaemia and hypertriglyceridaemia associated with increased mortality risk in type 2 diabetes patients: a real-world longitudinal study
T. Takao1, M. Suka2, H. Yanagisawa2, M. Kasuga1;
1Diabetes and Metabolism, The Institute for Adult Diseases, Asahi Life Foundation, Tokyo, 2Public Health and Environmental Medicine, The Jikei University School of Medicine, Tokyo, Japan.
Background and aims: Postprandial hyperglycaemia and hypertriglyceridemia predict cardiovascular disease morbidity and mortality. However, relevant thresholds associated with increased mortality risk in diabetes patients have not been identified. We evaluated associations between postprandial hyperglycaemia and hypertriglyceridemia at clinic visits and all-cause mortality in patients with type 2 diabetes in a real-world setting.
Materials and methods: This retrospective cohort study included 1928 patients with type 2 diabetes who first visited our clinic between 1995 and 1999 and were followed up for at least 1 year. During the first year, blood glucose levels were measured in 1130 patients 2 h ± 30 min after breakfast (2h-BG) and postprandial (non-fasting) serum triglyceride levels (ppTG) were measured in 1848 patients. The first observation during year 1 was taken as baseline. After excluding patients with missing data, 1122 patients (BG cohort) and 1826 patients (TG cohort) were followed up until 2017 and provided with questionnaires. Outcomes were determined by reviewing medical records and questionnaire responses. Multivariate Cox proportional hazards models were used to assess associations between 2h-BG and ppTG levels and mortality risk.
Results: Participants’ mean age at baseline was 55 years; 80% were male and 41% were smokers. Mean baseline duration of diabetes, BMI, 2h-BG levels, and ppTG levels (natural logarithm) were 6.1 years, 23 kg/m2, 10.6 mmol/L, and 1.48 mmol/L, respectively. Over 17,429 person-years, 162 deaths occurred in the BG cohort and over 28,026 person-years, 253 deaths occurred in the TG cohort. HRs (95% CI) for all-cause mortality associated with 1 SD increases in 2h-BG and ppTG were 1.34 (1.08-1.67) and 1.24 (1.06-1.45), respectively, after adjusting for age, sex, duration of diabetes, BMI, systolic blood pressure, HbA1c levels, total cholesterol levels, HDL cholesterol levels, smoking status, alcohol intake, history of cardiovascular disease, and history of cancer. As shown in the Table, adjusted HRs for all-cause mortality showed increasing trends across quintiles of 2h-BG (P=0.034) and ppTG (P=0.007). The HR was significantly elevated (2.37, 95% CI 1.26-4.47) in the fifth quintile of 2h-BG (≥13.8) compared with the first quintile (<7.0; P=0.008). The HR was also significantly elevated (1.63, 1.03-2.60) in the fifth quintile of ppTG (≥2.30) compared with the first quintile (<0.91; P=0.038).
Conclusion: Postprandial hyperglycaemia and hypertriglyceridemia at clinic visits were associated with increased risk of all-cause mortality in real-world patients with type 2 diabetes. We propose approximate thresholds of 13.8 mmol/L 2h-BG and 2.30 mmol/L ppTG to identify patients at increased risk of all-cause mortality.

Disclosure: T. Takao: None.
267
Association between exercise capacity and all-cause mortality in people with type 2 diabetes
Y.-J. Lai;
Puli branch, Taichung Veterans General Hospital, Nantou, Taiwan.
Background and aims: Exercise improves insulin sensitivity, inhibits inflammatory cytokines, and reduces the risk of cardiovascular disease. But the effect of exercise capacity on all-cause mortality in people with diabetes has not been fully explored.
Materials and methods: We used data from the National Health Interview Survey and the National Health Insurance research database in Taiwan. Baseline participants’ characteristics including socioeconomic status and health behaviors were obtained by standardized face to face interviews in 2001, 2005, 2009, and 2013. Comorbidities were confirmed by National Health Insurance research database 2000-2016. Participants were followed up until December 31 2016. All-cause mortality was ascertained from the National Registration of Death. Kaplan-Meier curves and Cox proportional hazard analysis were used to evaluate the relationship between exercise capacity and all-cause mortality.
Results: In total, 4,859 adult participants with type 2 diabetes were analyzed; 2,389 (49.17%%) were male and with a mean (SD) age of 59.5(12.63) years. Kaplan-Meier curves of all-cause mortality stratified by exercise capacity demonstrated significant findings (Log-rank P<0.01). Multivariate Cox regression analysis showed that those with higher exercise capacity had a significantly decreased risk of all-cause mortality, compared with those with no exercise habits (moderate exercise with 0-800 kcal/week HR = 0.75, 95% CI: 0.62-0.91, high exercise with more than 800 kcal/week HR = 0.68, 95% CI: 0.57-0.81) after adjusting for potential confounders. A significant trend (P for trend<0.01) was also noted.
Conclusion: Among people with type 2 diabetes, those with increased exercise capacity had a significant decreased risk of all-cause mortality. Further studies should investigate the type and dose of exercise that is most helpful to promote health and prolong life expectancy.
Disclosure: Y. Lai: None.
268
Discontinuation of diabetes medication in the 10 years before death: a nationwide register-based study
V. Kosjerina1,2, B. Carstensen1, M.E. Jørgensen1,3, B. Brock1, H.R. Christensen4, J. Rungby2,5, G.S. Andersen1;
1Steno Diabetes Center Copenhagen, Gentofte, 2Department of Endocrinology, Copenhagen University Hospital, Bispebjerg-Frederiksberg, Copenhagen, 3University of Southern Denmark, Copenhagen, 4Department of Clinical Pharmacology, Copenhagen University Hospital, Bispebjerg-Frederiksberg, Copenhagen, 5Copenhagen Centre for Translational Research, Copenhagen University Hospital, Bispebjerg-Frederiksberg, Copenhagen, Denmark.
Background and aims: Discontinuation of medication in the last stages of life has been suggested to reduce medication-related side effects and thereby improve quality of life. However, the extent and patterns of discontinuation of glucose lowering medication in the last stages of life with T2D has been scarcely described. We describe the discontinuation of metformin, and sulfonylureas (SU) during the last 10 years before death, in a nationwide population of elderly with T2D in Denmark.
Materials and methods: All persons with T2D that died ≥ 80 years of age between 2006-2016 were identified through the Danish Diabetes Register and linked to the Register of Medicinal Products Statistics (RAMPS) to obtain the dates of last intake of metformin and/or SU. We followed the population backward in time from death to last date of medication. A Poisson model for the rate of medication with time before death and sex as variables was fitted. It was used to estimate the cumulative proportion of patients on metformin and SU in separate models.
Results: A total of 42,042 persons (55% female) were identified, with a median (Q1,Q3) age at T2D diagnosis of 78.0 (72.5,82.9) years, a median (Q1,Q3) age at death of 86.5 (83.2,90.3) years and a median (Q1,Q3) diabetes duration at death of 8.9 (4.4,13.7) years. The proportion of the study population that had filled at least one prescription of metformin or SU was 59.6% and 62.7 %, respectively.10 years before death 54.3% (95% CL 54.3%-53.6%) of males were on metformin, significantly more than for females 49.4% (95% CL 48.9%-50.0%). These proportions decreased for both genders towards the end of life, and at time of death only 15.4 % (95% CL 14.9%-16.0%) of males and 15.2% (95% CL 14.7%-15.7%) of females were on metformin (figure). A similar discontinuation pattern was seen for SU, but the proportion that died with SU was greater and there was a significant difference between gender at time of death, 21.2% (95% CL 20.7%-21.8%) of males and 19.6% (95% CL 19.1%-20.1%) of females.
Conclusion: Metformin and SU were to a large extent discontinued in the last 10 years of life with T2D. This was particularly pronounced in the last year, and at different levels and patterns for males and females. Further analyses will include other glucose lowering drugs, and further studies should be conducted to clarify the clinical and socioeconomic predictors of discontinuation.

Disclosure: V. Kosjerina: None.
269
Risk of major adverse cardiovascular events, severe hypoglycaemia and all-cause mortality for widely used anti-hyperglycaemic dual and triple therapies in type 2 diabetes
M.H. Jensen1, M. Kjolby2, O. Hejlesen3, P. Jakobsen1, P. Vestergaard1;
1Steno Diabetes Center North Denmark, Aalborg University Hospital, Aalborg, 2Department of Biomedicine, Aarhus University, Aarhus, 3Department of Health Science and Technology, Aalborg University, Aalborg, Denmark.
Background and aims: The vast number of anti-hyperglycemic medications and growing amount of evidence makes clinical decision-making difficult. The aim of this study was to investigate the safety of anti-hyperglycemic dual and triple therapies for type 2 diabetes management with respect to major adverse cardiovascular events (MACE), severe hypoglycemia and all-cause mortality in a real-life clinical setting.
Materials and methods: Adjusted Cox regression models were constructed to analyse 20 years of data from the Danish National Patient Registry with respect to effect of the anti-hyperglycemic therapies on the three endpoints.
Results: 66,807 people with type 2 diabetes were treated with metformin including a combination of second- and third-line therapies. As seen in Figure 1, people on metformin + sulfonylurea (SU) had the highest risk of all endpoints, except for severe hypoglycemia, where people on metformin + basal insulin had a higher risk. The lowest risk of MACE was seen for people on a regimen including a glucagon-like peptide-1 receptor agonist (GLP1). People treated with metformin + GLP1 + basal insulin had a lower risk of all three endpoints than people treated with metformin + basal insulin, especially for severe hypoglycemia (HR: 0.47, 95% CI: 0.32-0.69 versus HR: 1.09, 95% CI: 0.93-1.29). The lowest risk of all three endpoints was in general seen for people treated with metformin + sodium-glucose cotransporter-2 inhibitor (SGLT2) + GLP1.
Conclusion: Findings from this study do not support SU as the second-line treatment choice for type 2 diabetes patients. Moreover, the results indicate that adding a GLP1 to people treated with metformin + basal insulin could be considered, especially, if they suffer from severe hypoglycemia.

Disclosure: M.H. Jensen: None.
270
A prediction model for end-stage kidney disease in type 1 diabetes in the presence of competing risk of death
D. Vistisen1, G.S. Andersen1, A. Hulman2, S.M.C. Gurnaghan3, H.M. Colhoun3, J.E. Henriksen4, R.W. Thomsen5, F. Persson1, P. Rossing1,6, M.E. Jørgensen1,7;
1Steno Diabetes Center Copenhagen, Gentofte, Denmark, 2Steno Diabetes Center Aarhus, Aarhus, Denmark, 3University of Edinburgh, Edinburgh, UK, 4Steno Diabetes Center Odense, Odense, Denmark, 5Aarhus University Hospital, Aarhus, Denmark, 6University of Copenhagen, Copenhagen, Denmark, 7University of Southern Denmark, Copenhagen, Denmark.
Background and aims: Although end-stage kidney disease (ESKD) is a life-threatening complication to diabetes, it is preventable and early detection of high-risk persons is therefore essential. We aimed to develop a prediction model for first ESKD event in type 1 diabetes (T1D).
Materials and methods: In the period 2001-2017, 5,460 Danish adults with T1D were followed for a median of 10.4 years (Q1-Q3: 5.1-14.7). Clinical- (including BMI, eGFR, albuminuria, blood pressure, lipids, retinopathy and treatment) and lifestyle data (smoking, exercise and alcohol intake) from electronic patient records was linked to ESKD events and mortality recorded in the national registries. During follow-up, 303 (5.5%) developed ESKD and 764 (14.0%) died of non-ESKD related causes. To account for the competing risk of death, rate models for ESKD and death were estimated separately using Poisson regression analysis, censoring for the other event, and subsequently combined to give the cumulative incidence function for ESKD.
Results: The rate model for ESKD included age, male-sex, diabetes duration, eGFR, albuminuria, urine albumin-to-creatinine ratio, systolic blood pressure, HbA1c, haemoglobin, previous cardiovascular disease and retinopathy status. Model discrimination was excellent for up to 10-year risk of ESKD with C-statistics ≥0.88 (95%-CI: 0.86;0.91). Calibration was adequate for predicting up to 5-year risk of ESKD (P ≥ 0.166, Figure 1).
Conclusion: This prediction tool for ESKD risk in T1D could be an essential support for the decision on initiating preventive treatment. However, external validation in other T1D cohorts is needed.

Disclosure: D. Vistisen: None.
PS 02 Living with chronic diabetes complications
271
The relation between rheumatoid arthritis and diabetes incidence: a systematic review and meta-analysis
Z. Tian, J. Mclaughlin, A. Verma, M. Gibson, A.H. Heald;
the University of Manchester, Manchester, UK.
Background and aims: Inflammation has emerged as a key factor in the onset and progression of diabetes mellitus (DM). Rheumatoid arthritis (RA) is an autoimmune and inflammatory disease. Systemic inflammation associated with RA might contribute to the risk of developing diabetes in the future. This systematic review and meta-analysis was conducted to investigate the relation between RA and the incidence of DM.
Materials and methods: A comprehensive search was conducted up to March 10, 2020 in Medline (via Ovid), Embase (via Ovid) and Web of science core collection to identify cohort studies comparing the risk of DM incidence in people with RA to the general population. The I2 statistic was used to test heterogeneity. Pooled relative risks (RR) were calculated using random-effects models. Publication bias was assessed using Begg’s test.
Results: The initial search provided 3,667 articles, and 47 studies were identified after titles and abstracts screen. Of those, 5 journal articles and 2 conference abstracts (Table) comprising 1,629,854 participants were included in this study. The characteristics of eligible studies showed in the table. All the eligible studies were retrospective cohort in design. Most eligible studies were population-based whereas one was hospital-based. No evidence for publication bias was found in Begg’s test (-0.05, P=1.00). Heterogeneity was observed in I2 test (I2=96%, P<0.00001). RA was associated with a higher risk of DM incidence [pooled RR 1.23, 95% CI 1.07- 1.40) (Figure). In sensitivity analysis, excluding the hospital-based study did not materially change the result [pooled RR 1.23, 95% CI 1.06- 1.42)].
Conclusion: RA is associated with an increased risk of diabetes incidence. This finding supports the notion that inflammatory pathways are involved in the pathogenesis of diabetes. We suggest that more intensive screening and management of DM risk factors should be considered in people with RA. Furthermore, agents that reduce systemic inflammatory marker levels may have a role in preventing DM. This may involve focussing on more than one pathway at a time.

Disclosure: Z. Tian: None.
272
Trends in complications in type 1 and type 2 diabetes in Denmark 1996-2018
B. Carstensen, H. Amadid, M.E. Jørgensen;
Steno Diabetes Center Copenhagen, Gentofte, Denmark.
Background and aims: Both micro- and macro vascular complications represent major problems for diabetes patients, and monitoring of the extent of these among diabetes patients is essential. Several studies have reported decreasing complications rates. We describe the absolute burden and trend in 18 groups of complications among persons with diabetes in Denmark 1996-2018, subdivided by type of diabetes. To our knowledge this is the first nation wide study including detailed follow-up over 15+ years for T1D patients
Materials and methods: We compiled a diabetes register for the entire Danish population, including reliable classification of type of diabetes. From the National Patient Register we extracted dates of first recorded complications in 21 classes. Binomial regression was used to describe the prevalence of complications at diagnosis and change in these over time. Rate models based on Poisson likelihood were used to describe the incidence rates of complications and changes in these. Analyses were conducted separately for T1D and T2D, and controlled for sex, age, duration of diabetes and including a linear term to describe the calendar time effect (date of diagnosis).
Results: The prevalence at diagnosis of previous CVD was 10% in T1D and 37% in T2D, with annual relative changes of 3% in T1D and 5% in T2D. Retinopathy prevalence at diagnosis was 4.3% in T1D and 1.7% in T2D with no change in T1D, but a relative decrease of 6% in T2D. We found similar decreases in incidence rates of complications in T1D and T2D after diagnosis; decrease of 2%/year in rates of CVD, 5%/year in amputations, while there were no changes in the incidence rates of retinopathy and renal disease over the period 1996-2016. For most complications we found a very high incidence during the first year after diagnosis, most likely reflecting a diagnostic catch-up and not any biological phenomenon. A full account for all complications will be given.
Conclusion: We observed a steady decrease in incidence rates of most macrovascular complications, but no change for microvascular complications. The pattern of complications at diagnosis was more mixed but likely more influenced by fluctuations in diagnostic activity over the period. In general an encouraging trend in complication occurrence was seen in Denmark in the period 1996-2016.
Supported by: Novo Nordisk Foundation
Disclosure: B. Carstensen: None.
273
Genetic determinants of diabetic retinopathy in people with type 1 diabetes
S. McGurnaghan1, S. Hatam1, A. Spiliopoulou1, L.A.K. Blackbourn1, C.N.A. Palmer2, P.M. McKeigue1, H.M. Colhoun1;
1University of Edinburgh, Edinburgh, 2University of Dundee, Dundee, UK.
Background and aims: Previous studies have estimated that heritability for diabetic retinopathy (DR) in type 1 diabetes ranges from 25-50%. To date, several studies have reported borderline results in genome wide association studies (GWAS), with little in the way of new pathological insights. We performed a large GWAS of DR in people with type 1 diabetes using the Scottish Diabetes Research Network Type 1 Bioresource cohort (SDRNT1BIO).
Materials and methods: The study cohort of 5125 people with type 1 diabetes included 1221 cases of diabetic retinopathy. Retinopathy was ascertained as having referable disease on national screening photograph gradings, defined as severe background or proliferative retinopathy or macular lesions. Samples were genotyped using the Illumina Human CoreExome array, and imputed using the Sanger Institute online imputation service. GWAS was performed with logistic regression in SNPTEST, adjusting for age, sex, diabetes duration and population structure principal components.
Results: We identified one novel locus with GWAS significance at p<5x 10⁻⁸and two suggestive loci at p <1x10⁻⁶. The Ephrin Type-A Receptor 8EPHA8 locus (lead SNP rs209690, p=1.92x10⁻⁸, MAF 0.11, Quality 0.97) has not previously been linked with DR, but is expressed in eye tissue and the Eph family is implicated in vascular endothelial growth factor inhibition of the retina. The two suggestive loci were in FAM50B(rs2239713, p=1.22x10⁻⁷) and in ABCC1 (rs17265551, p=1.17x10⁻⁷).
Conclusion: We identified one genome wide significant and two suggestive retinopathy loci that now require replication in other cohorts and further bioinformatic and functional analyses.
Supported by: JDRF DUK
Disclosure: S. McGurnaghan: None.
274
No improvement in the incidence of lower extremity amputation in the Scottish population with diabetes between 2009 and 2016
K. Hainey1, S. Wild2, Scottish Diabetes Research Network Epidemiology group;
1University of Edinburgh, Edinburgh, 2Usher Institute, University of Edinburgh, Edinburgh, UK.
Background and aims: Recent policy and service improvements have sought to decrease incidence of diabetes-related lower extremity amputations (LEA) and reduce socioeconomic inequalities in diabetic foot disease. The aim of this study was to describe time trends in LEA rates and characterise the association between socioeconomic status (SES) and risk of LEA in the Scottish population with diabetes between 2009 and 2016.
Materials and methods: Using the Scottish national diabetes register, all individuals living with diabetes in Scotland between 2009 and 2016 were identified. LEA outcomes were determined by data linkage with national hospital admission registries. Scottish Index of Multiple Deprivation quintiles were used as a marker of SES. Total LEA event rates and incidence rates, age-standardised to the European standard population 2013, were calculated to examine time trends.
Results: A cohort of 390,258 individuals with diabetes in Scotland was identified. Between 2009 and 2016, 6,744 LEA took place in the cohort, of which 57.7% were first diabetes-related LEA. Total LEA rate rose from 3.06 to 3.27 per 1,000 population with diabetes between 2009 and 2016 (p<0.001). Incidence rates of LEA were unchanged, both for all LEA and when stratified by LEA type. Time trends in incidence by SES were unchanged. Relative risk of incident LEA in the most relative to the least deprived fifth increased from 1.57 to 2.17 (95% CI: 1.09-2.23, 1.54-3.05).
Conclusion: This study demonstrates no improvement in LEA incidence in Scotland between 2009 and 2016, with evidence to suggest a widening of socioeconomic inequalities in foot outcomes. Continued efforts are required to deliver improvement in LEA incidence in the Scottish population with diabetes.
Disclosure: K. Hainey: None.
275
Difference cut-off point of haemoglobin A1c for diagnosing diabetes based on OGTT versus diabetic-specific retinopathy in China
Z. Du, Z. Sun, S. Qiu;
Department of Endocrinology, Zhongda Hospital, Institute of Diabetes, School of Medicine, Southeast University, Nanjing, China.
Background and aims: China is a vast multi-ethnic country. At present, the cut-off point of HbA1c for Chinese has not been determined. Previous studies in China on optimal HbA1c diagnostic cut-off points always used OGTT as the reference standard, and the threshold was fluctuating from 5.6% to 6.5%. A few studies based on diabetic retinopathy have shown that the optimal HbA1c threshold is between 5.9% and 6.4%. However, there is still a lack of multi-ethnic data to determine the optimal cut-off point. Also, which reference standard is more suitable for the Chinses population is unknown. This study will calculate and compare the HbA1c performance and optimal threshold based on two different reference standards.
Materials and methods: The cross-sectional database was used to analyze from the cohort study conducted among a randomized cluster sample of 18-70 years old residents in six ethnic groups in China. The optimal sensitivity and specificity of HbA1c for diagnosing diabetes based on OGTT (WHO criteria) and diabetic-specific retinopathy (ETDRS>31) were achieved using the receiver operating characteristic curve (ROC).
Results: 8852 participants (mean [SD] age, 50.5[11.3] years old) were graded. The optimal cut-off point is 6.0% based on the OGTT according to the Youden Index. The area under the ROC curves of HbA1c was 0.876 (95% CI 0.863 to 0.888, P<0.01). The sensitivity and specificity of HbA1c were 74.46% (95% CI 71.9% to 76.9%) and 86.36% (95% CI 85.6% to 87.1%), respectively. The optimal cut-off point is 6.2% when detecting diabetic-specific retinopathy. The area under the ROC curves of HbA1c was 0.844 (95% CI 0.800 to 0.889, P<0.01). The sensitivity and specificity of HbA1c were 72.66% (95% CI 64.1% to 80.2%) and 88.34% (95% CI 87.7% to 89.0%), respectively. There was no significant difference between the AUC based on two different reference standards (P = 0.1727). When the population stratified by age and different ethnicities, the diagnostic cut-off points were different in each group.
Conclusion: Our study suggests that HbA1c shows the equal performance when detecting diabetes based on OGTT and diabetic-specific retinopathy in Chinese multi-ethnic population. And the optimal cut-off points are 6.0% and 6.2% based on OGTT and diabetic-specific retinopathy, respectively. Our study provides a clue for determining a new HbA1c criterion in Chinese people.

Clinical Trial Registration Number: NCT03024788
Supported by: National Key R&D Program of China (2016YFC1305700)
Disclosure: Z. Du: Grants; NKRD Program of China and NKSIED Project.
276
Renal replacement therapy in persons with and without diabetes in Germany 2010-2016
H. Claessen1, M. Narres1, T. Kvitkina1, A. Wilk2, H. Friedel2, C. Günster3, F. Hoffmann4, M. Koch5, A. Icks1;
1German Diabetes Center, Düsseldorf, 2Team Gesundheit, Essen, 3AOK Research Institute, Berlin, 4Department of Health Services Research, University, Oldenburg, 5Centre of Nephrology, Mettmann, Germany.
Background and aims: End-stage renal disease (ESRD) is a serious complication of diabetes, resulting in reduced quality of life, high mortality and increased medical costs. Epidemiological studies showed that half of the patients who start chronic renal replacement therapy (RRT) have diabetes mellitus (DM). Population-based studies analysing the incidence of RRT in people with DM compared to those without DM and corresponding time trends are limited. The few available studies show contradictory results regarding time trends, which differ in particular with age. The aim of this study was (i) to examine the time trend of incidence rate (IR) of RRT in the population with and without DM in Germany and the corresponding relative risk (RR) for the period 2010-2016, (ii) to analyse if these patterns differ by age and sex.
Materials and methods: The data was sourced from nationwide-pooled claims data from two German branches of statutory health insurances covering approximately 25 million inhabitants who were insured in the years 2009-2017 with 12.8% having documented DM. RRT was defined as a first chronic dialysis based on relevant physician service or a pre-emptive kidney transplantation. Chronic dialysis was defined as (i) documentation of dialysis claims at least once per week over a period of 12 consecutive weeks or (ii) documentation of dialysis for less than 12 weeks and the person died with a diagnosis of ESRD. All persons with a chronic RRT, who were free of disease for at least one year, were assessed between 1.1.2010 and 31.12.2016. We estimated age-sex-standardised IR for chronic RRT in the population with and without DM and the corresponding RRs. We analysed age- and sex-adjusted time trends of IR using Poisson regression models stratified for DM Status.
Results: We identified 73,638 persons with a first RRT between 2010 and 2016 (60.0% male, 60.6% with DM, mean age 71.3 years). The IR was higher among persons with DM compared to those without DM (RR 4.19 [3.93-4.47]). This RR decreased considerably with age: < 40 years: 26.41 [23.99-29.09]; ≥ 80 years: 2.71 [2.51-2.93] with similar results in both sexes. The IR was twice as high among men than women in the population with DM (RR 2.31 [2.25-2.41]) and without DM (RR 1.77 [1.72-1.83]). We found a decline of IR per 100,000 person-years in the population with DM (2010: 129.9 [95% CI 118.9, 140.8], 2016: 98.8 [92.3, 105.3]), 3% annual reduction, p < 0.0001) with consistent results in both sexes and almost all age classes. In contrast, in the entire population without DM time trend was inconsistent: (2010: 21.3 [20.7, 21.9], 2013: 18.5 [17.9-19.0], 2016: 19.7 [19.1, 20.3], p = 0.07). Only in the oldest age group in both sexes (> 80 years, p < 0.0001) and women under 40 years (p = 0.0003) incidence of RRT decreased significantly over time.
Conclusion: Incidence of RRT was significantly increased among persons with DM compared to those without DM, which was true for all age and sex classes. Risk of RRT was twice as high in men compared to women independent of DM status. The IR significantly decreased during the observation period in persons with DM but remained stable in those without DM. In persons with DM, time trends did not differ between men and women and different age groups. In persons without DM, time trends depended on age.
Supported by: ZMV I 5-2514FSB505
Disclosure: H. Claessen: None.
PS 03 Micro- and macrovascular complications of diabetes
277
Glucagon-like peptide-1 receptor agonists decrease cancer incidences in type 2 diabetes: a cohort study using the National Database of Health Insurance Claims of Japan
R. Ishibashi1,2, M. Koshizaka2, T. Ishikawa3, N. Mitsutake3, J. Sato4, K. Goda4, M. Kitsuregawa4, K. Yokote2;
1Department of Medicine, Division of Diabetes, Endocrinology and Metabolism, Kimitsu Chuo Hospital, Chiba, 2Department of Endocrinology, Hematology, and Gerontology, Chiba University Graduate School of Medicine, Chiba, 3Institute for Health Economics and Policy, Tokyo, 4Institute of Industrial Science, The University of Tokyo, Tokyo, Japan.
Background and aims: The real world evidence of cancer incidences in users of glucagon-like peptide-1 receptor agonists (GLP-1 RAs) is limited for Asian. GLP-1 RA users were compared to non-users (controls) for cancer incidences using data from the National Database of Health Insurance Claims and Specific Health Checkups of Japan.
Materials and methods: Patients diagnosed with type 2 diabetes mellitus (DM) were identified between 2011 to 2014. Those who were <20 years old, had already been diagnosed with cancer, or were undergoing dialysis were excluded. Age, sex, duration of DM treatment, co-medications (other antidiabetic, antihypertensive, lipid lowering, antiplatelet, and anticoagulant drugs), and diagnosis of cardiovascular, DM complications or duration of trackable period were used as explanatory variables indicating the exposures of patients. Logistic regression analysis was performed using these items; the propensity scores for the explanatory variables were obtained, and nearest neighbor propensity score matching was performed between GLP-1 RA users and non-users. Caliper was defined as standard deviation of propensity score * 0.25. Matching was done in order of propensity score close to median. A cancer diagnosis noted for >3 months as an outpatient or a diagnosis during hospitalization was defined as the onset of cancer. The period from the start of a GLP-1 RA or another diabetes drug to the onset of cancer was analyzed using the Cox proportional hazard model.
Results: Among 9,180,887 patients with type 2 DM, 56,341 patients were GLP-1 RA users, and 1,077,009 patients were controls. Overall, 46,565 patients were included from each group after matching. GLP-1 RA users had less cancer events compared to controls regarding with all cancers (2,108 vs 2,215, HR 0.832, 95% CI 0.784-0.884, Figure 1), stomach cancer (277 vs 295, HR 0.809, 95% CI 0.686-0.953), colorectal cancer (366 vs 427, HR 0.744, 95% CI 0.647-0.856), lung cancer (194 vs 237, HR 0.702, 95% CI 0.580-0.850), and pancreatic cancer (151 vs 186, HR 0.721, 95% CI 0.581-0.894).
Conclusion: GLP-1 RAs may decrease cancer incidences in those with type 2 DM in the Japanese population. The limitations of this study include the absence of clinical and mortality data.

Disclosure: R. Ishibashi: None.
278
The DISCOVER Global Registry: a long term, large scale patient registry of routine care for people with type 2 diabetes
M. Kosiborod1,2, A. Cooper3, P. Fenici3, K. Khunti4, A. Nicolucci5, L. Ramirez6, J. Sia7, H. Vasnawala8, J. Wei9, C. Lam10,11;
1Saint Luke's Mid America Heart Institute, Kansas City, USA, 2University of Missouri-Kansas City, Kansas City, USA, 3AstraZeneca, Cambridge, UK, 4University of Leicester, Leicester, UK, 5Center for Outcomes Research and Clinical Epidemiology, Pescara, Italy, 6AstraZeneca, Luton, UK, 7AstraZeneca, Petaling Jaya, Malaysia, 8AstraZeneca, Bangalore, India, 9AstraZeneca, Shanghai, China, 10National Heart Center Singapore and Duke-National University of Singapore Medical School, Singapore, Singapore, 11University Medical Center Groningen, Groningen, Netherlands.
Background and aims: Understanding current treatment practices, variations and associated outcomes in the management of individuals with type 2 diabetes (T2D) is fundamental to improving patient care. Currently, no single platform exists to assess and improve quality of care on a global scale.
Materials and methods: The DISCOVER Global Registry is a prospective, investigator-led quality improvement registry collecting real world data in adults with diabetes. A total of 14 countries are currently included across six WHO regions, with engagement from 194 investigators and co-ordinators. Information is entered into a cloud-based data collection form by investigators in primary and specialty healthcare settings as part of routine care. Data collected include demographic and clinical characteristics, treatments, prevalence and incidence of complications and outcomes, including all-cause and cause-specific deaths and hospitalizations. Here, we present baseline data for enrolled patients with T2D.
Results: As of 30 November 2019, data were available from 4774 patients with T2D (mean age 57.1 years [SD, 12.1]; 51.2% men; mean T2D duration 9.4 years [SD, 8.0]; Table). HbA1c or fasting plasma glucose measurements were available in 82.0% of patients, glucose-lowering therapy data was available for 92.0% of patients, and 59.3% of patients had a treatment recorded that was marked as being first-line. Mean HbA1c was 8.1% globally, and was highest in Europe (8.6%) and lowest in the Americas (7.6%). Overall, 26.9% of patients had baseline HbA1c ≥ 9.0% (across-regions range [ARR]: 10.9 - 35.0%). For the 2949 patients (61.8%) with records for medical history and diagnosis, the prevalence of concomitant cardiometabolic risk factors was high: 56.0% of patients had hypertension (ARR: 23.8 - 61.3%) and 39.9% of patients had hyperlipidaemia (ARR: 31.9 - 65.6%).
Conclusion: The DISCOVER Global Registry is a unique resource for comparing prospective data on quality of care in patients with T2D and can inform practice in many countries for which such data are currently lacking. Baseline data show a need for improvement in quality of care in all regions, including improved control of HbA1c. The registry will be further developed to include patients with heart failure and chronic kidney disease, making it the first global-scale registry of cardio-renal-metabolic disease.

Clinical Trial Registration Number: NCT03549754
Supported by: AstraZeneca
Disclosure: M. Kosiborod: Grants; AstraZeneca, Boehringer Ingelheim. Honorarium; Amarin, Amgen, Applied Therapeutics, AstraZeneca, Bayer, Boehringer Ingelheim, Eisai, Eli Lilly, GlaxoSmithKline, Glytec, Intarcia, Janssen, Merck (Diabetes), Novartis, Novo Nordisk, Sanofi, Vifor Pharma.
279
Increased risk of falls, fall-related injuries and fractures in people with type 1 and type 2 diabetes compared with the general population: a nationwide cohort study
N.H. Rasmussen1, J. Dal2, J. van den Bergh3, F. de Vries3, M. Hasselstrøm Jensen4, P. Vestergaard5;
1Steno Diabetes Center North Jutland Aalborg University Hospital, Aalborg, Denmark, 2Endocrinology Aalborg University Hospital, Aalborg, Denmark, 3Department of Clinical Pharmacy and Toxicology, Maastricht University Medical Center+, Maastricht, The Netherlands; Cardiovascular Research Institute Maastricht (CARIM), Maastricht University, Maastricht, The Netherlands; Division of Pharmacoepidemiology, Utrecht, Netherlands, 4Steno Diabetes Center North Jutland and Aalborg University, Aalborg, Denmark, 5Steno Diabetes Center North Denmark, Aalborg University Hospital, Aalborg, Denmark.
Background and aims: Falls are a tremendous burden on society. People with diabetes could have an increased risk of falls as they show more complications, morbidity and use of medication compared to the general population. This study aimed to estimate the risk of falls and to identify risk factors associated with increased falls in people with diabetes compared with the general population. The second aim was to estimate fall-related injuries including lesions and fractures and their anatomic localization in people with diabetes compared with the general population.
Materials and methods: From the Nationwide Danish National Patient Register we identified people with Type 1 Diabetes (T1D) (n=12,896), Type 2 Diabetes (T2D) (n=407,009) and a sex- and age-matched control group (1:1) from the general population. All episodes of people hospitalized with a first fall from 1996 to 2017 were analyzed using a Cox proportional-hazards model. Risk factors such as age, sex, diabetic complications, a history of alcohol abuse and a history of medication were included in an adjusted analysis. The incidence rate and rate ratio of falls and the anatomic localization of fall-related injuries as lesions and fractures were identified.
Results: In the adjusted analysis T1D and T2D were associated with a higher risk of falls [Hazard Ratio (HR): 1.33 (95% CI: 1.25 - 1.43) and HR: 1.19 (95% CI:1.16 - 1.22), respectively]. The cumulative incidence, of falls requiring hospital treatment was 13.3% in T1DM, 11.9% in T2DM. Women, aged >65 years, use of selective serotonin receptor inhibitors, opioids and a history of alcohol abuse were significantly associated with an increased risk of falls [HR 1.61 (CI:95%:1.58 - 1.64), HR 1.32 (CI:95%: 1.30-1.35), HR 1.32 (CI:95%:1.27-1.38), HR 1.09 (CI:95%:1.05-1.12) and HR 1.88 (CI:95%:1.65-2.15), respectively]. The incidence rate ratios (IRR) of fall-related injuries as hip, humerus, radius, pelvis and skull/facial fractures were more prevalent in people with T2D than controls from the general population [IRR 1.08 (CI:95%:1.02-1.15), IRR 1.24 (CI:95%: 1.12-1.37), IRR 1.39 (CI:95%: 1.28-1.51,) IRR 1.21 (CI:95%: 1.12-1.48) and IRR 1.11 (CI:95%:1.02-1.21)].
Conclusion: Advanced aging and sex are non-modifiable risk factors, whereas diabetes, use of medications and alcohol abuse could be potentially modifiable risk factors for falls. Gaining information on risk factors for falls could guide the management of diabetes treatment i.e. choice of medication, which enables us to improve treatment particularly in people with a high risk of falls and fractures associated with high mortality.
Disclosure: N.H. Rasmussen: None.
280
Impact of micro- and macrovascular complications of type 2 diabetes on quality of life: insights from the DISCOVER study
S.V. Arnold1,2, K. Khunti3, F. Tang1, M.B. Gomes4, L. Ji5, A. Nicolucci6, M.V. Shestakova7, H. Watada8, A. Cooper9, N. Hammar10,11, P. Fenici9, J. Medina12, M. Kosiborod1,2;
1Saint Luke's Mid America Heart Institute, Kansas City, USA, 2University of Missouri-Kansas City, Kansas City, USA, 3University of Leicester, Leicester, UK, 4Rio de Janeiro State University, Rio de Janeiro, Brazil, 5Peking University People's Hospital, Beijing, China, 6Center for Outcomes Research and Clinical Epidemiology, Pescara, Italy, 7Endocrinology Research Center, Diabetes Institute, Moscow, Russian Federation, 8Juntendo University, Tokyo, Japan, 9AstraZeneca, Cambridge, UK, 10AstraZeneca Möldnal, Gothenburg, Sweden, 11Institute of Environmental Medicine, Karolinska Institute, Stockholm, Sweden, 12AstraZeneca, Madrid, Spain.
Background and aims: Not only do micro- and macrovascular complications of type 2 diabetes (T2D) increase the risk of morbidity and mortality, but cross-sectional studies indicate they also likely worsen quality of life (QoL). In a multinational study of patients with T2D, we prospectively examined the association of complications that developed during the study with concurrent changes in QoL.
Materials and methods: DISCOVER is a global, multinational, prospective, observational study of patients with T2D, enrolled at initiation of second-line glucose-lowering therapy and followed up for 3 years. QoL was assessed with 36-item Short-Form Health Survey (SF-36) physical (PCS) and mental component summary (MCS) scores at baseline, 6 months, and 1, 2 and 3 years. Hierarchical repeated measures regression models for PCS and MCS were constructed with all complications included as time-dependent covariates.
Results: Among 7830 patients with T2D from 31 countries with complication and QoL data (mean age 57 ± 12 years, 48% women, mean T2D duration 5.6 ± 5.1 years), baseline mean PCS and MCS scores were 48.0 ± 7.8 and 45.5 ± 10.4, respectively. At baseline, 1422 patients (18.2%) had a prior microvascular complication and 966 (12.3%) had a prior macrovascular complication. Over the 3 years of the study, 641 (12.0%) developed a new microvascular complication (most commonly neuropathy) and 372 (5.8%) developed a new macrovascular complication (most commonly coronary disease). New diagnoses of coronary disease, stroke, peripheral artery disease, heart failure and neuropathy were each associated with moderate reductions in both PCS and MCS scores (0.5 and 2.7, respectively) (Figure).
Conclusion: In a prospective, multinational study of patients with T2D, the development of macrovascular complications and neuropathy were associated with notable decreases in both physical and mental aspects of QoL.

Clinical Trial Registration Number: NCT02322762, NCT02226822
Supported by: AstraZeneca
Disclosure: S.V. Arnold: None.
281
BMI and BMI change following incident type 2 diabetes and risk of microvascular and macrovascular complications: the EPIC-Potsdam study
E. Polemiti1,2, J. Baudry1, O. Kuxhaus1,2, S. Jäger1,2, M.M. Bergmann3, C. Weikert4, M.B. Schulze1,2;
1Molecular Epidemiology, German Institute of Human Nutrition Potsdam-Rehbruecke (DIfE), Nuthetal, 2German Center for Diabetes Research (DZD), Neuherberg, 3Human Study Center, German Institute of Human Nutrition Potsdam-Rehbruecke (DIfE), Nuthetal, 4Food Safety, German Federal Institute for Risk Assessment, Nuthetal, Germany.
Background and aims: Studies suggest decreased cardiovascular mortality among overweight or obese persons with type 2 diabetes compared to normal-weight individuals (an “obesity paradox”). However, the relation of body weight and weight gain with macrovascular compared to microvascular complications of type 2 diabetes remains unresolved.
Materials and methods: We studied participants with incident type 2 diabetes from the European Prospective Investigation into Cancer and Nutrition (EPIC)-Potsdam cohort, who were free of cancer, cardiovascular and microvascular disease at diagnosis (n=1,097). Macrovascular (myocardial infarction and stroke, n=99) and microvascular events (kidney disease, neuropathy, and retinopathy, n=348) were identified over a median follow-up of 10.8 years. Pre-diagnosis BMI and relative annual change between pre- and post-diagnosis BMI were evaluated in multivariable-adjusted Cox models.
Results: Higher pre-diagnosis BMI was positively associated with total microvascular complications [Hazard Ratio (HR) per 5 kg/m2: 1.21 (95% CI: 1.07-1.36)], kidney disease [1.39 (1.21-1.60)] and neuropathy [1.12 (0.96-1.31)], albeit not significant for neuropathy. No association was observed for macrovascular complications [1.05 (0.81-1.36)]. Associations were not modified by sex, smoking status or age. An 1% BMI change per year was associated with higher risk of total microvascular complications [HR: 1.06 (1.01-1.10)], kidney disease [1.07 (1.00-1.13)] and neuropathy, [1.05 (1.00-1.11)]; whereas an inverse non-significant association was observed for macrovascular complications [HR: 0.93 (0.85-1.02)]. Associations were consistent across strata of sex, age, pre-diagnosis BMI or medication, but were stronger among never-smokers.
Conclusion: We found positive associations between pre-diagnosis BMI and weight gain with microvascular complications among persons with type 2 diabetes. The relationship with macrovascular disease was less clear and warrants further investigation. Our study underpins the importance of weight management for the prevention of microvascular complications.
Clinical Trial Registration Number: DRKS-ID: DRKS00020593
Supported by: BMBF (01 EA 9401), EU (SOC 95201408 05 F02,SOC 98200769 05 F02), DK (70-2488-Ha I), DZD (82DZD00302)
Disclosure: E. Polemiti: None.
282
Atherosclerotic cardiovascular disease among migrants with type 2 diabetes: a nationwide register-based study
G.S. Andersen1, S. Byberg1, A.-S.D. Bjørkman1, A.A. Isaksen2, H. Amadid1, B. Carstensen1, M.E. Jørgensen1;
1Clinical Research, Steno Diabetes Center Copenhagen, Gentofte, 2Institute of Public Health, Aarhus University, Aarhus, Denmark.
Background and aims: Non-western migrants in Europe are at increased risk of developing type 2 diabetes (T2D) and do so at earlier ages. It is not known if this translates into increased risk or earlier onset of cardiovascular complications. We aimed to calculate age- and sex-specific incidence rates (IR) of first atherosclerotic cardiovascular disease (ASCVD) following T2D among 1st generation western and non-western migrants in Denmark compared with Danish-born.
Materials and methods: A total of 346.947 Danish citizens with T2D in the National Diabetes Register between 1997-2016 were followed for a median (Q1-Q3) of 6.7 (3.1-11.9) years. Individuals were classified as Danish-born, western- or non-western migrants according to country of birth, obtained from national registers together with information on education. First ASCVD event and death from other causes were identified in the national patient- and death registers. Age- and sex-specific IR were estimated using Poisson regression models with risk time as offset using natural splines to model the effect of age, adjusting for diabetes duration and education.
Results: Non-western migrants (n=27,693) were younger at diabetes diagnosis than Danish-born (mean [SD], 50.8 [11.8] vs 61.6 [13.5] years). A total of 104,286 persons (30.1%) developed ASCVD during follow-up and 61,274 (17.7%) died of non-ASCVD related causes. In adjusted models ASCVD rates were higher for non-western migrant women at 40-60 years but lower for both genders at 60-80 years, compared to western migrants and Danish-born (figure). Non-ASCVD related mortality rates were also lower among non-western migrant men and women.
Conclusion: Despite higher rates and earlier onset of T2D, non-western migrants with T2D had lower risk of developing ASCVD at 60-80 years and lower mortality from other causes. This could reflect a ‘healthy migrant effect’ or differences in lifestyle or medication

Disclosure: G.S. Andersen: None.
PS 04 Global view on diabetes complications
283
Epidemiology and treatment of chronic kidney disease among commercially-insured patients in the US
T. Kauf1, W. Wang2, A. Dillon2, H. Mikulski3, I. Singh4, J. Odegard4, C. Ringemann5, S. Haldrup6;
1Genesis Research, Zug, Switzerland, 2Genesis Research, Hoboken, USA, 3Roche Diabetes Care, Sant Cugat del Vallès, Spain, 4Roche, Indianapolis, USA, 5Roche, Mannheim, Germany, 6Roche Diabetes Care, Basel, Switzerland.
Background and aims: Early diagnosis and treatment of chronic kidney disease (CKD) may delay disease progression and reduce the burden of disease. This study examined the epidemiology and treatment of CKD among commercially-insured patients in the US.
Materials and methods: A retrospective cohort study was conducted using January 2010-December 2018 MarketScan® data. Patients with ≥2 outpatient (≥30 days apart) and/or ≥1 inpatient claims containing a diagnosis code for CKD were eligible for analysis. The earliest CKD diagnosis date served as the index date. Continuous enrollment for ≥6 months pre- and post-index was required. Baseline characteristics and use of ACE inhibitors and/or ARBs pre/post-index were analyzed for the overall CKD population and patients with pre-existing diabetes. Annual CKD prevalence and incidence were calculated from the total enrollee population in a given year.
Results: Of 753,097 CKD patients identified, 310,837 (41.3%) had pre-existing diabetes. More CKD patients with pre-existing diabetes had hypertension (81.7% vs 75.7% for overall CKD). Approximately 45% of patients in both cohorts were diagnosed at Stage 3. Overall CKD prevalence per 1,000 enrollees increased from 11.7 in 2011 to a high of 16.7 in 2016 before decreasing to 13 in 2018. Among persons with pre-existing diabetes, prevalence was 2.0 per 1,000 enrollees in 2011, falling to 1.6 in 2018, with a high of 2.83 in 2015. In the pre-index period, 55.3% of CKD patients overall and 66.2% of CKD patients with pre-existing diabetes received an ACE/ARB. Following CKD diagnosis, use of ACE/ARBs increased to 63.2% and 73.7% for the overall CKD and diabetes populations, respectively.
Conclusion: On a population basis, the annual incidence of new CKD patients enrolled in commercial plans is not inconsequential. Greater efforts are needed to identify patients at earlier stages of disease and ensure that treatment guidelines are being followed.
Disclosure: T. Kauf: Employment/Consultancy; Roche Diabetes Care.
284
Diabetic complications at the time of diagnosis of type 2 diabetes
A. Pappas1, A. Gikas2, E. Markakis1, A. Anyfantakis1, M. Bristianou3, B. Chryssoula4, A. Kontouri5, A. Kouloukoura1, E. Kyrlaki1, G. Dimitriadis5, L. Lanaras3, K. Makrilakis4, V. Lampadiari5;
1Diabetes Center, Venizeleio-Pananeio Hospital, Gazi, 2Internal Medicine, Health Centre of Kalivia, Kalivia, Attiki, 3Internal Medicine, Lamia General Hospital, Lamia, 4Diabetes Center, Laiko General Hospital, Athens, 5Diabetes Center, Attikon Hospital, Athens, Greece.
Background and aims: The early detection of type 2 diabetes (T2DM) is a major health and social problem in order to prevent the long term complications with proper treatment. Aim of the present study was to examine the prevalence of long term complications and their associations with clinical parameters in newly-diagnosed subjects with T2DM.
Materials and methods: Patients attending 3 Greek Diabetes Care Centers with a new diagnosis of T2DM were included. In this cross-sectional retrospective study we examined the occurrence of micro- and macro-vascular complications and their associations with clinical and metabolic parameters at the time of diagnosis.
Results: A total of 1451 subjects were analyzed(855 males [58.9%], 57.3±11.8 years old, BMI 31.9±6.3 kg/m2, HbA1c 8.0±2.1%. A total of 66 (5.1 %) patients had retinopathy and 74 (5.8%) neuropathy. The patients with retinopathy (but not neuropathy), in comparison with those without complications, had greater HbA1c at diagnosis (retinopathy 9.1±2.6% vs. 7.9±2.0% P<0.01,neuropathy 8.2±2.2% vs. 7.9±2.1%, p=0.106). We compared the groups of patients according to the way of diagnosis. Symptomatic (n=287) in comparison with asymptomatic patients (n=1164) had greater HbA1c at diagnosis (10.5±2.3% vs. 7.4±1.6% p<0.01), lower BMI (31.0±6.6 vs. 32.2±6.2 kg/m2, P=0.006) and were younger (53.9±12.4 vs. 58.2±11.5 years, p<0.01). A greater proportion of symptomatic patients were diagnosed with retinopathy (7.7% vs. 4.5%, p=0.05) and neuropathy (9.3% vs. 4.9% P=0.01). Macro-vascular complications were found in 16.1% of the patients(n=233) (coronary heart disease, myocardial infraction and stroke in 13.4%, 5% and 3.2%, respectively). We did not observe statistically significant differences in the prevalence of macro-vascular complications between asymptomatic and symptomatic patients.
Conclusion: At the time of diagnosis, patients with T2DM had already a substantial burden of long term complications. In our sample, 4.5% of asymptomatic patients had retinopathy and 4.9% neuropathy. It seems that the current practice in routine clinical care is unable to attenuate the occurrence of complications before the diagnosis of T2DM. Early detection of T2DM and possibly pre-diabetes is urgently needed.
Disclosure: A. Pappas: None.
285
Hospitalisation for hypoglycaemia in adults in Denmark, 1997-2017
M.B. Bengtsen1, J.S. Knudsen2, N. Møller1, R.W. Thomsen2;
1Department of Endocrinology, Aarhus University Hospital, Aarhus, 2Department of Clinical Epidemiology, Aarhus University Hospital, Aarhus, Denmark.
Background and aims: The aims were to assess incidence trends of first hospitalization for hypoglycemia (HH) in type 1 diabetes and type 2 diabetes in Denmark, and to examine HbA1c levels and glucose-lowering drug use before and after a HH event.
Materials and methods: We performed a population-based study linking diagnosis-, prescription-, and laboratory-data. Standardized incidence of first HH in type 1 diabetes (n=2,897 events) and type 2 diabetes patients (n=18,301 events) was assessed for each calendar year 1997-2017. HbA1c and glucose-lowering drug use was compared with age- and sex-matched diabetes comparisons without HH.
Results: Between 1997 and 2017 the annual age- and sex-standardized incidence rate of HH per 100,000 person-years declined by 67% (from 1,412 to 460) in type 1 diabetic patients and 63% (from 640 to 236) in type 2 diabetic patients. Both patient groups experienced a mean HbA1c decrease of about 1 percentage point in the months preceding first HH, followed by a gradually increasing HbA1c afterwards. Patients with type 1 diabetes and HH used similar insulin therapies than those without HH. Patients with type 2 diabetes and HH more often received insulin (65%) than non-HH comparisons (55%), and many discontinued insulin or stopped all glucose-lowering therapy after first HH.
Conclusion: HH incidence has declined by two thirds during the last 20 years in both type 1 and type 2 diabetes patients. A clearly observable HbA1c decrease precedes first HH, and drastic changes in glucose-lowering drug therapy occur among real-world type 2 diabetes patients after HH.
Supported by: Aarhus University
Disclosure: M.B. Bengtsen: None.
286
Association between circulating 25-hydroxyvitamin D and cardiometabolic risk factors in rural and urban Cameroon
C.M. Mba1, A. Koulman1, F.K. Assah2, J. Mbanya2, N.J. Wareham1;
1MRC Epidemiology Unit, University of Cambridge, Cambridge, UK, 2Faculty of Medicine and Biomedical Sciences, University of Yaounde 1, Yaounde, Cameroon.
Background and aims: The association between 25 hydroxyvitamin D (25[OH]D) a status marker of vitamin D and cardiometabolic diseases differs by ethnicities and potentially strongly confounded by adiposity and physical activity. We aimed to investigate the association between 25(OH)D and cardiometabolic risk factors in adults in rural and urban Cameroonians while adjusting for objectively measured physical activity and body fat.
Materials and methods: Using samples from a cross sectional population-based study in Cameroon, we measured serum 25(OH)D concentrations by liquid chromatography-tandem mass spectrometry in 550 participants (258 rural and 292 urban; 63% women), with mean age (±SD) 38.2±8.6 years. The primary outcome of a continuous metabolic syndrome risk z-score (zMS) was computed based on the International Diabetes Federation criteria and secondary outcomes were individual cardiometabolic risk factors. zMS was derived by standardising and then summing up the continuously distributed variables of waist circumference (WC), blood pressure, fasting blood glucose (FBG), triglycerides and subtracted HDL cholesterol. Results were adjusted for free living physical activity energy expenditure (PAEE) measured using the combined heart rate and movement sensing over 7 continuous days and body fat measured by bioimpedance analysis.
Results: Age-adjusted 25(OH)D was lower in women (50.8nmol/L [95% CI 49.5-52.2]) than men (53.7nmol/L [51.9-55.4]), p=0.01 and in urban (50.6nmol/L [49.2-52]) than rural dwellers (53.4nmol/L [51.9-54.9]), p=0.008 (age and sex-adjusted). 0.73%, 44.4%, 50.7%, 4.2% had 25(OH)D concentrations below 25nmol/L, 25-49.9nmol/L, 50-74.9nmol/L and ≥ 75nmol/L respectively. After adjustment for age, sex, smoking, alcohol drinking, years of education, season of blood draw and CRP, significant change in zMS was -0.37(-0.71 to -0.030), p=0.03; homeostatic model assessment for insulin resistance (HOMA-IR) was -0.1(-0.19 to -0.01), p=0.03; and WC was -2.11( -3.75 to -0.46), p=0.01 per 12.4nmol/L (1SD) increase in 25(OH)D concentrations for urban residents. These associations were abolished after the inclusion of body fat and PAEE in the models. Serum 25(OH)D was inversely associated with FBG in the overall sample even after controlling for body fat and PAEE (β= -0.1[95% CI -0.2 to -0.02]) per 1SD increase in serum 25(OH)D. There was evidence that the effect of 25(OH)D on zMS differed by BMI categories (p=0.007 for interaction), with a significant association found only in the obese category (β= -0.6[95% CI -1.1 to 0.1]), p=0.03 per 1SD increase in 25(OH)D. Significant positive correlates of serum 25(OH)D included alcohol drinking and physical activity while inverse correlates were years of education, body fat and FBG.
Conclusion: Urban residence is associated with lower concentrations of 25(OH)D compared to rural. The association between 25(OH)D and the metabolic risk score was found only among urban dwellers suggesting targets for public health interventions as vitamin D supplementation could confer greater metabolic health benefits to those with low 25(OH)D concentrations. This population-based study is the first study from sub-Saharan Africa to control for objectively measured physical activity, which is a major confounder in the association between vitamin D and cardiometabolic traits
Disclosure: C.M. Mba: None.
287
Visit-to-visit blood lipid variability as predictors of mortality in patients with type 2 diabetes
C.-I. Li1, T.-C. Li2, C.-C. Lin1, C.-S. Liu1;
1China Medical University Hospital, Taichung, 2China Medical University, Taichung, Taiwan.
Background and aims: Blood lipid parameters linked to the progression of coronary artery disease (CVD), but the effects on mortality from CVD, non-CVD and overall mortality have remained uncertain, especially in patients with type 2 diabetes (T2D). The aim of this study is to investigate the associations between visit-to-visit variability in high-density lipoprotein cholesterol (HDL-C), low-density lipoprotein cholesterol (LDL-C), total cholesterol (TC), and triglyceride (TG) and mortality from all causes, CVD, and non-CVD in patients with T2D.
Materials and methods: We identified 10,583 T2D patients aged 30 years and older with follow-up ≥ 3 years and who participated in the National Diabetes Case Management Program in Taiwan. Variability in blood lipid measurements within 3-year after entry were calculated for HDL-C, LDL-C, TG, and TC using coefficient of variation. Cox proportional hazard models were used to examine the blood lipid variability in relation to subsequent mortality from all causes, CVD, and non-CVD.
Results: Over a mean follow-up of 6.4 years, we observed 1,838 deaths (809 CVD-deaths and 1,029 non-CVD deaths). In multiple proportional hazard models, each 10% increase in HDL-C, LDL-C, and TC variability increased risk of all-cause (hazard ratio: 1.30, 95% confidence interval: 1.22-1.37, 1.05, 1.01-1.09, and 1.10, 1.03-1.16, respectively) and CVD mortality (1.27, 1.16-1.39, 1.08, 1.02-1.09, and 1.16, 1.07-1.27, respectively). In, addition, each 10% increase in HDL-C also have a 31% greater risk of non-CVD mortality (1.31, 1.22-1.42).
Conclusion: Blood lipid variability except for TG variability were independently associated with all-cause and CVD mortality, but not with non-CVD mortality. Visit-to-visit variability in HDL-C, LDL-C, and TC could be useful in predicting all-cause and CVD mortality in patients with T2D.
Supported by: Ministry of Science and Technology of Taiwan
Disclosure: C. Li: None.
288
Risk of morbidity and mortality of COVID-19 in subjects with diabetes in Norway
H.L. Gulseth, V. Hjellvik, Ø. Karlstad, H.N. Eide, L.C. Stene, I. Ariansen, K.E. Telle, W. Nystad, S.E. Håberg;
Norwegian Institute of Public Health, Oslo, Norway.
Background and aims: The SARS-CoV-2 virus was detected in Norway in February 2020. In reports from China and Italy subjects with diabetes were at increased risk of severe outcomes after coronavirus 2019 disease (COVID-19). We aimed to study COVID-19 morbidity and mortality in subjects with diabetes in Norway.
Materials and methods: In this Norwegian nationwide cohort study, we link data from national registries for all residents in Norway (>5,3 million people) using the unique personal identification number. Diabetes is defined as at least two diagnoses of diabetes registered in primary and/or specialist health care. COVID-19 will be identified as a lab-confirmed SARS-CoV-2 diagnosis in the Norwegian Surveillance System for Communicable Diseases, as COVID-19 hospitalizations from discharge diagnosis codes in the Norwegian Patient Register and as COVID-19 related deaths from the Cause of Death Register. Relevant comorbidities are identified from the Norwegian Patient Register. This data linkage is a part of the national COVID-19 surveillance system and is updated weekly.
Results: As per 31.03.20, 4655 subjects have tested positive for SARS-CoV-2 in Norway, 32 persons have died and 168 are or have been admitted to intensive care units (ICU). Preliminary Norwegian data suggest that diabetes is a common risk factor for ICU admittance, especially in those above 50 years. Time trends in lab-confirmed SARS-CoV-2 diagnoses, COVID-19 hospitalisations and mortality from February to September in subjects with type 2 diabetes compared to the non-diabetes population will be presented.
Conclusion: Diabetes is a common risk factor for COVID-19 ICU admittance. Updated data on diabetes and risk of COVID-19 associated morbidity and mortality will be presented
Supported by: FHI
Disclosure: H.L. Gulseth: None.
PS 05 Type 2 diabetes treatment IRL
289
Effectiveness and safety of empagliflozin in routine care patients: interim results from the EMPagliflozin compaRative effectIveness and SafEty (EMPRISE) study
E. Patorno1, A. Pawar1, L. Bessette1, J. Franklin1, M. Najafzadeh1, D. Wexler2, A. Déruaz-Luyet3, K. Brodovicz3, S. Schneeweiss1;
1Brigham and Women's Hospital, Boston, USA, 2Massachusetts General Hospital, Boston, USA, 3Boehringer Ingelheim, Ingelheim am Rhein, Germany.
Background and aims: The EMPA-REG OUTCOME trial showed that empagliflozin, a sodium-glucose co-transporter-2 inhibitor (SGLT2i), reduces the risk of cardiovascular (CV) death by 38%, all-cause mortality by 32%, and hospitalization for heart failure (HHF) by 35%, on top of standard of care in patients with type 2 diabetes and established CV disease. The effectiveness and safety of empagliflozin has not been evaluated in routine clinical care. EMPRISE is a study program on the effectiveness, safety and healthcare utilization of empagliflozin in routine care across a spectrum of CV baseline risk using real-world data from Medicare and 2 U.S. commercial claims datasets from August 2014 to September 2019. In this interim analysis based on data from August 2014 to September 2017, we evaluated the occurrence of effectiveness and safety outcomes among patients with type 2 diabetes initiating treatment with empagliflozin compared with patients initiating treatment with dipeptidyl peptidase 4 (DPP4) inhibitors.
Materials and methods: Within the three databases, we identified 1:1 propensity score-matched patients ≥18 years with type 2 diabetes initiating empagliflozin or a DPP4 inhibitor. Effectiveness outcomes of interest included HHF [defined as a HF discharge diagnosis in the primary (HHF-Specific) or in any position (HHF-Broad)], a composite of myocardial infarction or stroke, and all-cause mortality (Medicare only). Safety outcomes were lower-limb amputations, bone fractures, diabetic ketoacidosis, and acute kidney injury. We estimated pooled hazard ratios (HR) and 95% confidence intervals (CI) adjusting for over 140 baseline covariates.
Results: After propensity-score matching, we identified 39,169 patient pairs with similar characteristics, as measured by standardized differences (Table 1). The average age was approximately 60 years, almost 55% of the study participants were males, and about 28% had history of CV disease. Compared to initiation of DPP4 inhibitors, empagliflozin initiation was associated with a reduced risk of HHF [HHF-Specific, HR (95% CI): 0.46 (0.30-0.73); HHF-Broad: 0.63 (0.51-0.77)], a similar risk of MI or stroke [0.89 (0.73-1.09)], and a reduced risk of all-cause mortality [0.52 (0.36-0.76)] in Medicare. Over a mean follow up of 178 days, empagliflozin initiators had a decreased risk of acute kidney injury [(0.64 (0.53-0.77)], an increased risk of diabetic ketoacidosis hospitalization [1.56 (1.00-2.44)], and a similar risk of lower-limb amputations and fractures.
Conclusion: Interim findings from EMPRISE showed that compared to the initiation of DPP4 inhibitors, the initiation of empagliflozin in routine care had effectiveness profile consistent with findings from clinical trials and safety outcomes in line with documented information.

Supported by: Boehringer Ingelheim
Disclosure: E. Patorno: Grants; Boehringer Ingelheim.
290
The utilisation of long-acting insulin analogues and intermediate-acting insulin in patients with type 2 diabetes in the United Kingdom
V.C. Brunetti1,2, O.H.Y. Yu2,3, R.W. Platt1,4, K.B. Filion1,5;
1McGill University, Montreal, 2Center for Clinical Epidemiology, Lady Davis Institute, Jewish General Hospital, Montreal, 3Division of Endocrinology and Metabolism, Jewish General Hospital, Montreal, 4Department of Pediatrics, McGill University, Montreal, 5Department of Medicine, McGill University, Montreal, Canada.
Background and aims: Approximately 15% of patients with type 2 diabetes will eventually require treatment with insulin. International treatment guidelines recommend treating patients with type 2 diabetes with basal insulin including neutral protamine Hagedorn (NPH) human insulin or long-acting insulin analogs (glargine, detemir, or degludec), if their glycemic levels remain uncontrolled with oral antidiabetic drugs (OADs). Changes in prescription patterns of basal insulins over time remain poorly delineated, particularly since the market entry of newer OADs (e.g. SGLT-2 inhibitors). The objective of this study was to describe changes in the prescription of basal insulins in patients with type 2 diabetes over time from 2002 to 2019 in the United Kingdom (UK).
Materials and methods: We conducted a retrospective cohort study using data from the Clinical Practice Research Datalink (CPRD) Aurum, a primary care database from the UK. We created a primary cohort of all patients receiving pharmacological treatment for type 2 diabetes between September 1st, 2002 (the year glargine was marketed in the UK) and October 31st, 2019. We then excluded patients with 1) ˂18 years of age at cohort entry, 2) a database history of ˂365 days, 3) a diagnosis of polycystic ovary syndrome or type 1 diabetes at any time prior to cohort entry and 4) a diagnosis of gestational diabetes in the year prior to cohort entry. Exposure was defined by current use of each class of antidiabetic drugs. Yearly prescription rates were determined using negative binomial regression and were stratified by age categories, sex, presence of cardiovascular disease, glycated hemoglobin (HbA1c), and renal function (estimated glomerular filtration rate [eGFR]).
Results: Our cohort included 724,114 patients who used antidiabetic drugs between September 1st, 2002 and October 31st, 2019. Rates of prescription for NPH insulin decreased over the follow-up period, going from 0.73 (95% confidence interval [CI]: 0.71, 0.76) prescriptions per person-year in 2002 to 0.37 (95% CI: 0.36,0.38) prescriptions per person-year in 2019. In contrast, rates of insulin analogs prescription increased during this period, from 0.02 (95% CI: 0.02,0.03) in 2002 to 0.53 (95% CI: 0.52,0.54) in 2019. The most widely used insulin analog in 2019 was glargine (prescription rate: 0.36, 95% CI: 0.35, 0.37); prescription rates for detemir and degludec were 0.12 (95% CI: 0.12,0.13) and 0.04 (95% CI: 0.04, 0.04), respectively. Rates were similar between strata of age categories, sex, cardiovascular disease status, and HbA1c category. However, differences in prescription rates were observed across strata of renal function, where the prescription rates for NPH insulin and for all 3 long-acting insulin analogs were greater in patients with renal insufficiency (eGFR˂60mL/min/1.73m2).
Conclusion: Prescribing of NPH insulin and long-acting insulins has greatly changed in recent years in the UK. The current study provides insight into the changing characteristics of users of different types of insulin among patients with type 2 diabetes and may inform public policy on reimbursement modalities.
Disclosure: V.C. Brunetti: None.
291
Gender-specific temporal trends and regional differences in treatment of type 2 diabetes: results from the German multicentre registries DPV and DIVE
S. Lanzinger1, P. Bramlage2, S. Geist3, S. Khodaverdi4, T. Danne5, R.W. Holl1;
1Institute of Epidemiology and Medical Biometry, ZIBMT, University of Ulm, Ulm, 2Institute for Pharmacology and Preventive Medicine, Cloppenburg, 3Children and Adolescent Medicine, Clinical Center Dres. Düngfelder und Geist, Kaiserslautern, 4Clinic for Children and Adolescent Medicine, Clinical Centre Hanau, Hanau, 5Children’s and Adolescent‘s Hospital „AUF DER BULT“, Hannover, Germany.
Background and aims: Antidiabetic treatment in adult individuals with type 2 diabetes might differ between females and males. The primary objective was to study gender-specific differences in temporal treatment trends in type 2 diabetes. Regional differences were examined as a secondary objective.
Materials and methods: Individuals with type 2 diabetes ≥18 years (no beta-cell antibodies) documented in German centers of the multicenter diabetes patient follow-up registry (DPV) or the DIVE (Diabetes Versorgungs-Evaluation) initiative were studied. We focused on glucagon-like Peptide 1 (GLP-1) receptor analogues, dipeptidyl peptidase-4 inhibitors (DPP-4i) and sodium-glucose cotransporter 2 inhibitors (SGLT-2i). Multivariable logistic regression models (adjustment for age and diabetes duration) were used to study temporal trends from 2012 to 2019 as well as current regional differences (North, South, East and West Germany 2018/2019). Repeated measurements were considered and an interaction term between gender and treatment year was included for analyzing changes in gender-specific treatment choices over time.
Results: We examined 283.891 individuals with type 2 diabetes (54% males, median age 69.9 years (Q1 to Q3: 59.6-78.0, diabetes duration 9.4 years (3.4-15.8)). Proportions of GLP-1 receptor analogues were consistently higher in females (6.4% in 2012 to 11.6% in 2019) compared to males (6.2% to 9.9%, p-value of interaction term 0.015). From 2012 to 2016 DPP-4i were prescribed less frequently in females (26.6% to 38.5%) than in males (28.6% to 39.0%, p=0.036), however in 2019 proportions of DPP-4i were similar between females (45.9%) and males (45.4%, p=0.266). Proportions of SGLT-2i were below 1% before 2014, but increased considerably from 3.5% in 2014 to 12.9% in 2019 in females and from 3.9% to 17.9% in males, p<0.001). Prescription of GLP-1 receptor analogues was lowest in West (7.8%) and highest in North Germany (17.5%) in 2018/2019. DPP-4i ranged from 34.1% in the North to 47.4% in the South, SGLT-2i from 12.6% in the West to 22.7% in the South.
Conclusion: There is a preference for GLP-1 receptor analogues in females and SGLT-2i in males, while recent proportions of DPP-4i use were similar between females and males with type 2 diabetes. Further research is needed to explore potential reasons for the observed differences and whether they affect clinical outcomes.
Disclosure: S. Lanzinger: None.
292
Secular trends in drug utilisation among adults with type 2 diabetes 2001-2019: a 19-year analysis of the Hong Kong Diabetes Registry
A. Yang1,2, H. Wu1, E.S.H. Lau1, R.C.W. Ma1,2, A.P.S. Kong1,2, W.Y. So3, A.O.Y. Luk1,2, J.C.N. Chan1,2, E. Chow1,2;
1Department of Medicine and Therapeutics, Prince of Wales Hospital, Hong Kong, 2Hong Kong Institute of Diabetes and Obesity, The Chinese University of Hong Kong, Hong Kong, 3Hong Kong Hospital Authority Head Office, Hong Kong, Hong Kong.
Background and aims: There have been major updates in international guidelines on utilization of glucose lowering drugs (GLDs) in type 2 diabetes (T2D) in 2015 and 2019 reflecting personalization based on glycaemic targets and atherosclerotic cardiovascular disease (ASCVD) risk. Data on recent prescribing trends of newer GLDs, particularly sodium-glucose cotransporter-2 inhibitors (SGLT2i) and glucagon-like peptide-1 receptor agonists (GLP-1RA) are scarce. We examined secular trends in GLD utilization between 2001 and 2019 in Chinese T2D patients in Hong Kong who were enrolled as part of a quality improvement programme.
Materials and methods: We analyzed population-based data from 27,428 individuals with T2D in the Hong Kong Diabetes Registry. All individuals were enrolled between 1994-2018 with follow-up to 31 December 2019. Prescription data was extracted from the Hong Kong Hospital Authority Clinical Data Analysis and Reporting System. GLDs were grouped according to the Anatomical Therapeutic Chemical (ATC) classification system. We estimated the annual age- and sex-standardized proportion of GLDs classes in 2001-2019. In any one year, the data comprised that from prevalent cases of diabetes alive. We used joinpoint regression to examine secular trends over time.
Results: Overall, metformin use increased from 31.8% to 77.4% between 2001-2019 (Figure 1). Use of dipeptidyl peptidase 4-inhibitor (DPP-4i) increased since its introduction in 2007 (0.1% in 2007 to 32.2% in 2019). There was a sharp increase in SGLT2i use by 10-fold since 2015 (from 2.4% to 19.7% in 2019). The proportion on thiazolidinediones (TZD) and GLP-1RA also increased after 2015. Prescription patterns of individual GLDs varied by age but not sex. Patients in the youngest age group (20-44 years) had higher use of SGLT2i as compared with those ≥75 years (27.9% versus 4.9% in 2019). Increases in use of GLP-1RA, TZD and insulin was greatest among the youngest. Patients ≥75 years had the lowest use of metformin and greatest decrease in sulfonylurea use (annual percentage change: -2.7, 95% CI: -2.9 to -2.4) between 2005-2019. The use of DPP-4i increased similarly between 2008-2019 across all age groups.
Conclusion: In this 19-year survey, we observed markedly changing prescribing patterns with rapid increases in DPP-4i and SGLT2i use since their introduction. Secular differences in utilization of GLD classes may reflect personalization based on hypoglycaemic risk, ASCVD risk and renal function between the different age groups.

Supported by: Dr. Aimin Yang was supported by a CUHK Impact Research Fellowship Scheme.
Disclosure: A. Yang: None.
293
Are interventions with dapagliflozin, metformin and exercise associated with changes in plasma glucagon concentrations in individuals with prediabetes? The PRE-D trial
K.K.B. Clemmensen1, M.B. Blond1, H. Amadid2, L. Bruhn1, D. Vistisen2, K. Karstoft3, F. Persson4, M. Ried-Larsen3, J.J. Holst5,6, N.J. Wewer Albrechtsen7,6, S. Torekov6,5, J.S. Quist1, M.E. Jørgensen2, K. Færch1,6;
1Clinical Prevention Research, Steno Diabetes Center Copenhagen, Gentofte, 2Clinical Epidemiology, Steno Diabetes Center Copenhagen, Gentofte, 3Centre of Inflammation and Metabolism and the Centre for Physical Activity Research, Rigshospitalet, University of Copenhagen, Copenhagen, 4Complications Research, Steno Diabetes Center Copenhagen, Gentofte, 5NNF Center for Basic Metabolic Research, Copenhagen, 6Department of Biomedical Sciences, University of Copenhagen, Copenhagen, 7Department of Clinical Biochemistry, Rigshospitalet, Copenhagen, Denmark.
Background and aims: Glucagon concentrations are affected in prediabetes and type 2 diabetes. Whether glucose-lowering interventions can normalize glucagon concentrations in prediabetes is unclear. We examined the effects of dapagliflozin, metformin and exercise on plasma concentrations of glucagon in individuals with HbA1c-defined prediabetes.
Materials and methods: Individuals aged 30-70 years, with overweight (≥25 kg/m2), HbA1c of 39-47 mmol/mol were recruited. After baseline testing they were randomized to a 13-week intervention with dapagliflozin (10 mg once daily), metformin (850 mg twice daily), exercise (interval training 30 min 5 days/week) or control (habitual living). A 75 g oral glucose tolerance test (0, 30, 60 and 120 min) was performed at baseline, at 13 weeks (end of intervention) and at 26 weeks (end of follow-up). Total area under the curve (tAUC) for glucagon was calculated using the trapezoid rule. Early and total suppression relative to baseline (rAUC0-30min and rAUC0-120min) were calculated by tAUC/(fasting level × time). Linear mixed-effects models with a participant-specific random intercept to account for the correlation of repeated measures within participants were used to compare differences in change between the treatment groups and the control group.
Results: At baseline the 120 participants had a median (Q1;Q3) age of 62 (54;68) years, BMI 30.8 (28.6;34.3) kg/m2 , and 44% were men. Median (Q1;Q3) plasma fasting glucose was 5.6 (5.2:5.8) mmol/L, and mean (SD) HbA1c 40.9 (2.3) mmol/mol. Median (Q1;Q3) fasting glucagon was 11 (7;15) pmol/L. Median (Q1;Q3) fasting glucagon concentration at baseline was 9.0 (8.0;13.5) pmol/L in the dapagliflozin, 11.0 (7.0;14.8) pmol/L in the metformin, 12.0 (7.0;16.0) pmol/L in the exercise and 9.0 (6.2;13.8) pmol/L in the control group. No statistically significant differences in any of the glucagon measures between the groups from baseline to 13 or 26 weeks were observed, see Table 1.
Conclusion: In this study, 13 weeks of treatment with dapagliflozin, metformin or exercise was not associated with changes in glucagon concentrations in individuals with prediabetes.

Clinical Trial Registration Number: NCT02695810
Supported by: AstraZeneca and NNF
Disclosure: K.K.B. Clemmensen: Grants; AstraZeneca, Novo Nordisk Foundation. Stock/Shareholding; Novo Nordisk A/S.
294
Therapeutic inertia in management of hypertension and dyslipidaemia in young-onset type 2 diabetes and the risk factor burden: evidence from UK primary care
J. Ling1, O. Montvida2, C. Xue1, K. Khunti3, S. Paul2;
1RMIT University, Melbourne, Australia, 2University of Melbourne, Melbourne, Australia, 3University of Leicester, Leicester, UK.
Background and aims: Management of hypertension and dyslipidaemia in young-onset Type 2 Diabetes (T2DM) has not been adequately studied. The aims were to evaluate the prevalence of hypertension and dyslipidaemia, the probability of initiating anti-hypertensive therapy (AHT) and lipid-lowering therapy (LLT), and the population level probability of consistently failing to achieve clinically acceptable systolic blood pressure (SBP) and lipid control by time to AHT and LLT initiation in young-onset T2DM.
Materials and methods: A cohort of 254,925 adults newly diagnosed with T2DM between 2005-2017 were identified with 5 years median follow-up, with 4,912, 15,763 and 40,692 in the 18-29, 30-39, and 40-49 years age groups, respectively. At diagnosis (Dx), the hypertension (SBP≥130/140 mmHg in people without/with Atherosclerotic Cardiovascular Disease (ASCVD), on AHT or Dx of AHT), dyslipidaemia (LDL-C ≥ 2.6/1.8 mmol/l or non-HDL-C ≥ 3.4/2.6 mmol/l in people without/with ASCVD, on LLT or Dx of dyslipidaemia ) and high-risk (No ASCVD and ≥2 risk factors of current smoking, hypertension, dyslipidaemia, microvascular disease including kidney diseases, eGFR < 60 mL/min/1.73m2) were defined. In each age group and separately for hypertension / dyslipidaemia status, we evaluated the probability of initiating an AHT or LLT within 6 months of Dx, and the probability of having consistently high SBP or LDL-C / non-HDL-C over 2 years post Dx of T2DM by people initiating therapy within 1 year or later. Propensity score weighted logistic regression models were used, adjusting for age and sex, balancing for socio-economic status and high-risk.
Results: The n (%) of people with hypertension / dyslipidaemia / high-risk at Dx in the age groups 18-29, 30-39, and 40-49 years were 1,203 (25%) / 4,318 (88%) / 1,886 (38%), 5,963 (38%) / 13,897 (88%) / 7,511 (48%) and 23,330 (57%) / 36,163 (89%) / 23,554 (58%) respectively. The adjusted probability (95% CI) of initiating a AHT / LLT within 6 months in the three age groups were 25 (21, 29)% / 14 (12, 15)%, 29 (28, 31)% / 26 (25, 27)% and 36 (35, 37)% / 41 (40, 42)% respectively.
Compared to those who initiated AHT within 1 year of Dx, those who initiated therapy after 1 year had 12%, 11% and 9% significantly higher probability of failing to control SBP over 2 year follow-up in the 18-29, 30-39 and 40-49 year groups (Figure). In people dyslipidaemia, compared to those who initiated LLT after 1 year had 11%, 18% and 19% higher probability of failing to lipid control over 2 year follow-up in the respective age groups.
Conclusion: Therapeutic inertia in management of hypertension and dyslipidaemia is prevalent in young onset T2DM. Early interventions to control blood pressure and dyslipidaemia is likely to lead to reduced longer-term cardiovascular outcomes in this high-risk group.

Disclosure: J. Ling: None.
295
Impact of early or late intensification of glucose-lowering therapy in patients with type 2 diabetes: the global DISCOVER study
L. Ramirez1, L. Ji2, F. Bonnet3, H. Chen4, A. Cooper5, N. Hammar6,7, P. Leigh5, G.L. Saraiva4, J. Medina8, A. Nicolucci9, W. Rathmann10, M.V. Shestakova11, F. Surmont1, F. Tang12, H. Watada13;
1AstraZeneca, Luton, UK, 2Peking University People's Hospital, Beijing, China, 3University of Rennes, Rennes, France, 4AstraZeneca, Gaithersburg, USA, 5AstraZeneca, Cambridge, UK, 6Institute of Environmental Medicine, Karolinska Institute, Stockholm, Sweden, 7AstraZeneca Möldnal, Gothenburg, Sweden, 8AstraZeneca, Madrid, Spain, 9Center for Outcomes Research and Clinical Epidemiology, Pescara, Italy, 10Institute for Biometrics and Epidemiology, German Diabetes Center, Leibniz Institute for Diabetes Research at Heinrich Heine University, Düsseldorf, Germany, 11Endocrinology Research Center, Diabetes Institute, Moscow, Russian Federation, 12Saint Luke's Mid America Heart Institute, Kansas City, USA, 13Juntendo University, Tokyo, Japan.
Background and aims: Intensification of glucose-lowering therapy in patients with type 2 diabetes (T2D) is needed if first-line treatment fails. Using data from the DISCOVER study, we compared patients who intensified treatment early after failure of first-line therapy with those who intensified treatment late.
Materials and methods: DISCOVER is a global, 3-year, observational study of patients with T2D initiating second-line therapy. In the present analysis, patients were included if their first-line therapy was an oral monotherapy or dual therapy, they had a baseline HbA1c measurement and they intensified treatment at second line (add-on treatment or switch to insulin). Patients were categorized into two groups: early intensification (baseline HbA1c ≤ 7.5%) and late intensification (baseline HbA1c > 7.5%). Categorical data analysis was used to assess differences in achieving target glycaemic control (HbA1c < 7.0%) between the two groups over time.
Results: In total, 9575 patients from 37 countries were included (55.9% male, mean age 57.5 years [SD: 12.0]), of whom 3275 (34.2%) intensified treatment early and 6300 (65.8%) intensified treatment late. Mean baseline HbA1c levels in the early and late groups were 6.9% and 9.2%, respectively (overall mean 8.4%), mean time since T2D diagnosis was 5.7 and 5.6 years, respectively (overall mean 5.6 years) and 43.9% of patients in the early intensification group had HbA1c < 7.0%. Older age and ≥ 7 years’ education (vs < 7 years or no formal education) were associated with early intensification. Patients in the late intensification group were more likely to have received dual therapy at first line (vs metformin monotherapy) and were more likely to receive ≥ 3 oral drugs or any injectable drug at second line (vs dual oral therapy). At 3 years, a higher percentage of patients who intensified treatment early achieved target glycaemic control (HbA1c < 7.0%) than those who intensified late (Figure).
Conclusion: Early diagnosis and timely intensification of glucose-lowering treatment is important for achieving long-term glycaemic control, thereby improving clinical outcomes.

Clinical Trial Registration Number: NCT02322762, NCT02226822
Supported by: AstraZeneca
Disclosure: L. Ramirez: Employment/Consultancy; AstraZeneca.
296
Sodium glucose cotransporter-2 inhibitor treatment and the risk of diabetic ketoacidosis in Denmark: a retrospective cohort study of five years of use
H. Laursen1,2, J. Røikjer1,2, J. Dal1, M. Jensen1,2;
1Aalborg University Hospital, Aalborg, 2Steno Diabetes Center North Jutland, Aalborg, Denmark.
Background and aims: Sodium-glucose cotransporter 2 inhibitors (SGLT2i) have been associated with an increased risk of diabetic ketoacidosis (DKA) in both people with type 1 and type 2 diabetes mellitus. Too few studies using data from high-quality registries exist, that attempt to determine the real-world impact of the increasing use of this drug. The aim of this study was to investigate the incidence and risk of DKA in connection with SGLT2i treatment in Denmark.
Materials and methods: A nationwide retrospective cohort of people with type 2 diabetes mellitus using SGLT2 inhibitors and glucagon-like peptide-1 receptor agonist (GLP1-RA) was established and analysed using both Cox-proportional hazard regression and Kaplan-Meier survival analysis, dependent on insulin use.
Results: The 37,058 individuals included in the cohort, were made up of SGLT2i (10,923), GLP1-RA (18,849), SGLT2i+insulin (2,069), and GLP1-RA+insulin (10,178) users. The incidence rate of DKA was 0.84 (95% CI 0.49-1.44) and 0.53 (95% CI 0.36-0.77) for the SGLT2i and GLP1-RA groups, respectively, and there was no statistically significant increase in the risk for DKA with SGLT2i use (adjusted HR 1.02, 95% CI, 0.44-2.36). However, for the SGLT2i+insulin and GLP1-RA+insulin groups, the IRs were 3.47 (95% CI 1.92-6.27) and 0.97 (95% CI 0.68-1.37) accordingly, and risk was noticeably higher and statistically significant (adjusted HR 5.42, 95% CI 2.16-13.56).
Conclusion: We observed a nonsignificant increase in risk of DKA for SGLT2i users compared to GLP1-RA. However, significantly higher IR were observed with concomitant insulin use, and the risk of DKA was much higher for the SGLT2 group using insulin.
Disclosure: H. Laursen: None.
PS 06 Unusual forms of diabetes
297
Whole-exome sequencing in a family with multiple cases of early-onset diabetes reveals a candidate causative mutation in the PTF1A gene
D. Tanaka1, S. Okamoto2, Y. Liu3, K. Iizuka3, Y. Hamamoto2, Y. Horikawa3, D. Yabe3, N. Inagaki1;
1Department of Diabetes, Endocrinology and Nutrition, Kyoto University, Kyoto, 2Kansai Electric Power Hospital, Osaka, 3Gifu University, Gifu, Japan.
Background and aims: Maturity-onset diabetes of the young (MODY) is characterized by early-onset diabetes with dominant inheritance. To date, 14 causative genes have been proposed for MODY, however the disease-causing genetic variants in numerous cases of early-onset diabetes with features of MODY remain unknown. The aim of this study was to investigate the genetic background of a family with multiple cases of early-onset diabetes using whole-exome sequencing to identify a causative gene.
Materials and methods: The Japanese family that we examined included eight members with diabetes, three of whom were diagnosed with the disease before the age of 35. All three of these individuals were lean (BMI <25 kg/m2). Serum C-peptide was detectable and GAD antibody was negative in the three cases. We performed whole-exome sequencing for the three members with early-onset diabetes.
Results: We predicted that the familial aggregation of early-onset diabetes in this family was due to a rare non-synonymous variant shared by three members sequenced. Accordingly, we selected non-synonymous variants shared by three members and excluded common variants with minor allele frequency of >1% in the 1000 genomes project or the Japanese exome database. Then we focused on rare non-synonymous variants in 35 genes linked to monogenic diabetes and other 101 genes that were reported to be located within loci associated with type 2 diabetes in Japanese genome-wide association studies. As a result, we found only one variant, a heterozygous S18F mutation in PTF1A [rs761787095, chr10:23192583C>T (GRCh38)]. Interestingly, the PTF1A gene has been implicated in pancreas development.
Conclusion: The S18F mutation in PTF1A may be a causative mutation for early-onset diabetes. Family-based comprehensive whole- exome sequencing is a promising strategy to elucidate the complex genetic background of diabetes.
Clinical Trial Registration Number: G1158-1
Supported by: JSPS KAKENHI
Disclosure: D. Tanaka: None.
298
Glucokinase deficit prevalence in women with diabetes in pregnancy: a matter of screening selection
O. Bitterman1, C. Giuliani2, C. Festa1, A. Napoli1;
1Department of Clinical and Molecular Medicine, Sant’Andrea Hospital, Sapienza University of Rome, Rome, 2Department of Experimental Medicine, Sant’Andrea Hospital, Sapienza University of Rome, Rome, Italy.
Background and aims: The prevalence among pregnant women with glucokinase deficit diabetes (GCK-MODY) varies from 0 to 80%, based on the chosen selection criteria for genetic test. New pregnancy-specific Screening Criteria (NSC), validated on an anglo-celtic pregnant cohort, include pre-pregnancy BMI <25 Kg/m2 and fasting glycemia >99 mg/dl. The aims of our study were to estimate the minimum prevalence of GCK-MODY in our population of diabetic pregnant women, excluding those with autoimmune diabetes, to evaluate the diagnostic performance of NSC in a cohort of women tested for GCK-MODY and to explore the elegibility to the genetic test based on NSC in our entire population of pregnant women with diabetes in pregnancy.
Materials and methods: We retrospectively selected from our database of 409 diabetic pregnant patients with negative pancreatic autoimmunity, from 2010 to 2018, all the women with fasting hyperglycemia ≥92 mg/dl who received a test for GCK deficit, based on the clinical suspicion and the availability of the test in that moment. We estimated the prevalence of GCK-MODY among tested women and the minimum prevalence in our entire population with not autoimmune diabetes. We evaluated diagnostic performance of NSC on the tested cohort and estimated the eligibility to genetic test based on NSC in the entire population.
Results: 21 patients have been tested for GCK-MODY, 8 been positive and 13 negative (2 of them had HNF1-alfa mutations and 1 had HNF4-alfa mutation). We found no significant differences in clinical features between positive and negative groups except for fasting glycemia at the 1st visit, higher in the positive group [111 mg/dl (103.25-121) vs 96 mg/dl (93-100)]. The minimum prevalence of monogenic diabetes in our population was 2.4%, of GCK-MODY was 1.95%. In the tested cohort the prevalence of GCK-MODY was 38%. In this group NSC sensitivity is 87% and specificity 30%, positive predictive value is 43% and negative predictive value 80%. Applying NSC on the entire population, 41 patients (10%) would be eligible for genetic test; considering a fasting glycemia >92 mg/dl, 85 patients (20.7%) would be eligible.
Conclusion: in our population, NSC have good sensitivity but low specificity, probably because there are many GDM with GCK-MODY like features. It is mandatory to define selective criteria with a good diagnostic performance on Italian population, to avoid unnecessary genetic tests.
Disclosure: O. Bitterman: None.
299
Combined lifestyle factors and the risk of latent autoimmune diabetes in adults
K. Herzog1, E. Ahlqvist2, L. Groop2,3, J. Edwall Löfvenborg1, R. Hjort1, T. Tuomi3,2, S. Carlsson1;
1Karolinska Institutet, Stockholm, Sweden, 2Department of Clinical Sciences, Lund University, Malmö, Sweden, 3Institute for Molecular Medicine, Finland FIMM, University of Helsinki, Helsinki, Finland.
Background and aims: It has been shown that a substantial proportion of type 2 diabetes (T2D) can be prevented by maintaining a healthy lifestyle. Our aim was to investigate, for the first time, the combined effect of healthy lifestyle factors on the risk of latent autoimmune diabetes in adults (LADA) and estimate the proportion of cases attributable to an unhealthy lifestyle.
Materials and methods: Analyses were based on Swedish case-control data, including incident LADA (n=474), T2D (n=1589), and population-based controls (n=1874). Low-risk lifestyle groups were defined by normal weight (BMI <25 kg/m2), moderate-to-high physical activity, healthy diet based on Life’s Simple 7 dietary guidelines, no smoking, and moderate consumption of alcoholic beverages. We estimated odds ratios (OR) with 95% confidence intervals (CIs) adjusted for age, gender, education, and family history of diabetes.
Results: A healthy lifestyle (≥4 low-risk components) was associated with a lower risk of LADA (OR 0.49, 95% CI 0.30-0.77) when compared to a lifestyle with <4 low-risk components, which was even more pronounced for T2D (OR 0.11, 95% CI 0.06-0.18). Out of these components, maintaining normal weight was associated with the largest risk reduction for both LADA and T2D (Table). Estimation of population attributable risk % indicated that 48.6% of LADA cases (95% CI 21.9%-66.8%) and 88.2% of T2D cases (95% CI 81.3%-93.2%) were attributable to a lifestyle that did not conform to the low-risk pattern.
Conclusion: Our findings suggest that adherence to a healthy lifestyle could prevent a substantial number of LADA cases.

Supported by: Novo Nordisk postdoctoral fellowship in partnership with Karolinska Institutet
Disclosure: K. Herzog: Grants; This work is supported by a Novo Nordisk postdoctoral fellowship run in partnership with Karolinska Institutet.
300
Revisiting HAPO from a population perspective
P. Kaul, A. Savu, L. Moore, R. Yeung, E. Ryan;
University of Alberta, Edmonton, Canada.
Background and aims: The extent to which the association between maternal glycemia and large for gestational age (LGA) outcomes in large unselected populations are consistent with or diverge from those found in the Hyperglycemia and Adverse Pregnancy Outcomes (HAPO) study has not been previously documented.
Materials and methods: The study included 52,256 pregnancies between 1st-Oct-2008 and 31st-Dec-2014 resulting in live births in Alberta, Canada for which with 75-g oral glucose tolerance test (OGTT) data were available. Fasting plasma glucose (FPG), 1-h and 2-h glucose values were categorized according to HAPO thresholds (C1-C7). An additional category of pregnancies (C8) with glucose levels >5·8 and >11·1 mmol/L for FPG and 2-h on the OGTT that were excluded from the HAPO study were identified. LGA rates in HAPO were compared with those in our study.
Results: LGA rate increased from 7.9% in C1 to 23.1% in C7, and was 28.3% in C8 in our study population (Figure, panel 1). Based on Diabetes Canada guidelines, a diagnosis of GDM, and treatment initiation would occur at C6. LGA rates in our study for 1-h and 2-h glucose categories C6 and C7 were significantly lower than those reported in the HAPO study (Figure, panel 2-3). Further categorization of pregnancies with elevated post-load glucose values into those with and without elevated FPG found that LGA rates in pregnancies with elevated 1-h glucose without elevated FPG were 9.4% and 10.5%, compared to 21.1% and 25.5% in those with elevated FPG, in C6 and C7, respectively. Similarly, LGA rates in pregnancies with elevated 2-h glucose without elevated FPG were 8.8% and 8.1%, compared to 20.6% and 24.6% in those with elevated FPG, in C6 and C7, respectively.
Conclusion: The association between maternal glycemic levels and LGA outcomes at the population-level in untreated women are similar to those observed in HAPO. Those with levels of glucose consistent with GDM, and presumably treated, showed an attenuation in the risk of LGA. However, this reduction appears to be restricted to those pregnancies without elevated FPG.

Supported by: CIHR
Disclosure: P. Kaul: None.
301
A novel mutation of HNF1B gene identified in MODY5
Y. Fujita1,2, T. Hyo1, Y. Yamazaki1,2, M. Matsubara1,2, Y. Hamamoto1,2, T. Komiya3,4, D. Tanaka5, Y. Seino1,2;
1Center for Diabetes, Endocrinology & Metabolism, Kansai Electric Power Hospital, Osaka, 2Yutaka Seino Distinguished Center for Diabetes Research, Kansai Electric Power Medical Research Institute, Kobe, 3Center for Nephrology, Kansai Electric Power Hospital, Osaka, 4Division of Renal Disease and Blood Purification, Kansai Electric Power Medical Research Institute, Kobe, 5Diabetes, Endocrinology and Clinical Nutrition, Kyoto University, Kyoto, Japan.
Background and aims: Maturity-onset diabetes of the young (MODY) is a form of dominantly inherited non-autoimmune diabetes characterised by early onset. Delayed diagnosis or misdiagnosis as type 1 and type 2 diabetes mellitus is common, but early and correct diagnosis of MODY is important because it significantly alters the management of the patient and his or her relatives. MODY5 is caused by mutations in the HNF1B gene, which are associated with renal and pancreatic abnormalities. Recently, we identified a novel pathogenic mutation in IVS3-1G>C of the HNF1B gene in a Japanese MODY family.
Materials and methods: A 30-year-old male presented to our clinic with a 15-year history of diabetes after being diagnosed at age 15. Since he had tested negative for autoimmune antibodies, he was initially diagnosed with type 2 diabetes mellitus and treated with basal-bolus insulin. The possibility of MODY was suspected because of a strong family history of early-onset diabetes in his sister, father and paternal grandmother. Genetic analysis by Sanger sequencing of all coding exons and exon-intron boundaries was performed for him, his sister and his father.
Results: Genetic analysis revealed a shared unreported gene mutation g.37731831C>G (GRCH38 Chr17) in the HNF1B gene, suggesting a diagnosis of MODY5. The mutation was located in the splicing site, and we considered that the novel mutation might cause the production of abnormal proteins or the failure of protein synthesis and would likely to be pathogenic. The proband had renal dysfunction and microalbuminuria from the early stage of the disease. An abdominal ultrasound showed bilateral hyperechogenic kidneys and a few renal cysts, and the pancreas was intact. No other dysmorphic features were evident. A kidney biopsy was obtained for RNA sequencing and histologic analysis to identify the disease progression. It revealed enlarged glomeruli and tubular structures, but arteriolosclerosis was not seen suggesting that there was no evidence of diabetic nephropathy.
Conclusion: Our MODY5 case was unique in that the splice site mutation in intron3 might have affected the clinical phenotype; the proband showed early-onset diabetes with insulin-deficiency and early-appearance of renal dysfunction despite of the mild renal morphological abnormalities. Clinically, there is a wide variation of renal disease caused by HNF1B mutations, evoking the importance of considering the possibility of monogenic diabetes even in cases with scarce structural abnormalities if they present with atypical diabetes and a strong family history.
Disclosure: Y. Fujita: Grants; Boehringer Ingelheim Japan, Inc., Sumitomo Dainippon Pharma Co., Ltd., Bayer Yakuhin, Ltd., TERUMO CORPORATION, ARKRAY, Inc., Ono Pharmaceutical Co., LTD., Taisho Pharma Co., Ltd., Sumitomo Dainippon. Lecture/other fees; Kao Corporation, Taisho Pharma Co., Ltd., Takeda Pharmaceutical Co., Ltd., Novo Nordisk Pharma Ltd., MSD K.K., Nippon Becton Dickinson Co., Ltd., Boehringer Inhelheim Japan, Inc.
302
Molecular biomarkers during gestational diabetes
S. Dias1,2, S. Adam2, P. Rheeder3, J. Louw1,4, C. Pheiffer1,5;
1Biomedical Research and Innovation Platform, South African Medical Research Council, Cape Town, 2Department of Obstetrics and Gynecology, University of Pretoria, Pretoria, 3Department of Internal Medicine, Faculty of Health Sciences, University of Pretoria, Pretoria, 4Department of Biochemistry and Microbiology, University of Zululand, Kwa-Dlangezwa, 5Division of Medical Physiology, Faculty of Health Sciences, Stellenbosch University, Cape Town, South Africa.
Background and aims: Gestational diabetes mellitus (GDM) is associated with short- and long-term complication in both mothers and offspring. Molecular mechanisms are attracting increased interest for their potential as biomarkers for GDM that could lead to improved detection of GDM with positive effects on health outcomes. The aim of this study was to explore the potential of DNA methylation and single nucleotide polymorphisms (SNPs) to serve as molecular biomarkers for GDM in South African women.
Materials and methods: Genome-wide DNA methylation using a MethylationEPIC BeadChip Array (n=24) and gene-specific methylation of the adiponectin (ADIPOQ) gene using bisulfite pyrosequencing (n=286) were profiled in the peripheral blood of women with or without GDM. In addition, variants ADIPOQ rs266729 and rs17300539, and methylenetetrahydrofolate reductase (MTHFR) rs1801133 were quantified using quantitative real-time PCR (n=449).
Results: Genome-wide methylation analysis identified 1046 differentially methylated CpG sites (associated with 939 genes), of which 148 CpG sites were hypermethylated and 898 CpG sites were hypomethylated (p<0.01). Among the top five CpG sites, one CpG mapped to the calmodulin-binding transcription activator 1 (CAMTA1) gene, which has been shown to regulate insulin production and secretion. Two CpG sites (-3410: p=0.048 and -3400: p=0.004) in the ADIPOQ promoter were hypomethylated during GDM in Human Immunodeficiency Virus (HIV) negative, but not in HIV positive women. Lastly, no association between ADIPOQ and MTHFR polymorphisms and GDM was observed in our population.
Conclusion: DNA methylation may offer potential as molecular biomarkers for GDM in a South African population. Future longitudinal studies in larger samples that include both HIV negative and positive pregnant women are warranted to explore the candidacy of DNA methylation as molecular biomarkers for GDM.
Supported by: NRF Thuthuka Grant (99391) and SAMRC baseline funding
Disclosure: S. Dias: None.
303
A rare cause of type 2 diabetes, dyslipidaemia and pancreatitis: familial partial lipodystrophy: presentation of a family with lipodystrophy
G.A. Molnar1, S. Sánchez Iglesias2, E. Csajbok3, Z. Nagy1, D. Araujo-Vilar2, I. Wittmann1;
1Second Department of Medicine and Nephrology-Diabetes Centre, University of Pecs Medical School, Pecs, Hungary, 2Center for Research in Molecular Medicine and Chronic Disease, University of Santiago de Compostela, Santiago de Compostela, Spain, 3First Department of Medicine, University of Szeged, Szeged, Hungary.
Background and aims: Conditions of insulin resistance, hyperglycaemia and hypoglycaemia due to hyperinsulinaemia become more frequent and are sometimes hard to diagnose. Sometimes, rare conditions can be in the background. A 1983-born female patient presented at our outpatient department because of high glucose values and frequent hypoglycemic episodes. In the past medical history, she had a urogenital malformation operation at the age of 11. She was treated several times because of pancreatitis episodes between 2004-2012, in the background severe hypertriglyceridemia was present. In 2018, diabetes was diagnosed, along with severely elevated insulin levels. Dietetotherapy was initiated. Because of dyspnea, heart CT was undertaken, no coronary disease, but a highly enlarged liver of especially high density (16 HU) was seen. She could not take metformin because of abdominal complaints and subjective hypoglycemia-feelings, acarbose was also tried, but also led to more frequent hypos and abdominal complaints, thus only treated using diet, but no antidiabetics.
Materials and methods: Standard laboratory tests, abdominal MRI scan, skinfold measurements, estimation of total body fat content was performed using standard equations. Using blood samples, DNA-extraction and sequencing of the lamin-A gene has been performed.
Results: On physical examination, slightly Cushingoid face, trunk-localized obesity, absence of fat on the extremities, masculine-type musculature, expressed acanthosis nigricans were noted. Her HbA1c value was 6.2, then 5.9%, the triglyceride value was 7.6 mM despite fibrate and ezetimib treatment, anti-GAD was negative, the C-peptide 4.9 ng/ml. ACTH, cortisol, renin-aldosterone, GH, IGF-1 did not indicate any pathology. Upon consultation with our endocrinologist, to exclude endocrine malignancies (like MEN-1), abdominal MRI was requested, that described a very large, highly steathotic liver (approx.. 35-40% fat content), signs of a chronic pancreatitis. The mother of our index patient showed a similar phenotype, she is known type 2 diabetic, currently treated with metformin and MDI insulin. The suspect of a genetic cause was strengthened by the phenotype of the sister of the index case, we initiated metformin. The distribution of body fat is rather uneven, skinfolds were: biceps: 4mm, triceps: 4mm, subscapular: 25 mm, suprailiacal: 9 mm, thigh: 6mm, calf: 6mm, waist circumference 86 cm, hip circumference 87 cm. The body fat content estimated from standard equations (depending on the equation, between 9.74%, 14.99% ill. 19.69%) markedly differed from the result of the bioimpedance-based value (26,2%), due to the uneven fat distribution. Upon permission of the ethical board, we turned to the European Lipodystrophy Register, beacuse of suspected familiar partial lipodystrophy. Genetic analysis was performed in Santiago de Compostela, and verified a heterozygous mutation at c.1445G>T, p.(Arg482Leu) in LMNA gene (exon 8), along with other, benign polymorphisms.
Conclusion: As a result of international collaboration, the proposed diagnosis has been verified. Work-up of other family-members is in progress.
Disclosure: G.A. Molnar: None.
PS 07 Molecular insights into glucose abnormalities
304
Use of protein informatics to assess how mutations of glucokinase affect enzymatic function
M.S.M. Almotawa1, N. Rabbani2, P.J. Thornalley1;
1Diabetes Research Center, Qatar Biomedical Research Institute, Doha, 2College of Medicine, Qatar University, Doha, Qatar.
Background and aims: Glucokinase (GCK) enzyme is part of glucose homeostasis system. it catalyzes the first step in glycolytic pathway by binding and phosphorylating glucose to glucose-6-phosphate for further metabolism. GCK-maturity-onset diabetes of the young (GCK-MODY) is an autosomal dominant disorder caused by heterozygous inactivating GCK gene mutations. GCK-MODY is one the most common MODY subtypes. It affects 0.1% of the population and 0.4-1% of women with gestational diabetes mellitus. Some homozygous and compound heterozygous mutations in GCK lead to activation of the enzyme, increasing affinity to substrate and increase secretion of insulin as hyperinsulinemia and hypoglycemia of infancy (HHI). The functional effects of GCK mutations are not always easy to predict. The crystal structure of human GCK has been determined. Most of these mutations are located in or close to allosteric activation site away from the cleft where glucose binds. In this study we assessed if a simple protein informatics tool, receptor binding domain (RBD) analysis - applicable to GCK, may be used to deduce change in GCK function for a given mutation without resort to expert protein structural knowledge.
Materials and methods: Receptor-binding domain (RBD) analysis is a sequence-based method to predict amino acid location in functional domains: receptor-binding domain (RBD) - protein-protein, protein-ligand and enzyme-substrate interaction, surface domain (S), interior of globular domain (G) and membrane domain (M). It is a plot of mean hydrophobic moment versus mean Eisenberg hydrophobicity for a window of 5 amino acids moving through the sequence. The RBD plot of wild-type GCK assigns the domain location of each amino acid residue (Fig. 1). This plot may then be produced for GCK mutants. When a mutation causes loss of charged amino acid in the RBD or movement of a charged residue out of the RBD (by mutant of a neighboring residue), we predict that this will produce loss of function. When a mutation brings amino acid residues of the allosteric site into the RBD or surface domain, we predict this will be a gain of function. We produced RBD plots of known GCK loss and gain of function mutations to test our predictions. We produced computer code scripts to automate the RBD plot within the R-statistical software platform.
Results: RBD plot of wild type GCK. Key: each circle is an amino acid, yellow circles are amino acids in the RBD; red circles are mutations.
Conclusion: RBD analysis may assist with identifying when coding region mutations produce loss or gain of function of GCK

Disclosure: M.S.M. Almotawa: None.
305
The benefit effect of hepatic ER-associated protein PDI on glucose metabolism
T. Hong1,2, T. Gu1, P. Zhang1, D. Zhu1, Y. Bi1;
1Department of Endocrinology, Drum Tower Hospital Affiliated to Nanjing University Medical School, Nanjing, 2Department of Endocrinology, Zhongshan Hospital Affiliated to Fudan University, Shanghai, China.
Background and aims: The liver plays critical roles in glucose metabolism regulation. Accumulating evidence supported that endoplasmic reticulum (ER) stress in liver tissue may involve in the development of type 2 diabetes. However, the role of ER stress-associated proteins in diabetes still needs to be clarified.
Materials and methods: Genome-wide DNA methylome and proteome in the liver biopsies from patients with or without type 2 diabetes were performed and further validated by pyro-sequencing, real-time PCR and western blots. Circulating levels at baseline and postoperative follow-up were measured by ELISA. The glucose tolerance, metabolic gene expression, glycogen deposition, glycogenesis and ER-associated proteins were detected in adeno-associated virus (AAV)-treated high fat-diet (HFD) mice. Adenovirus-treated primary hepatocytes were employed for functional study.
Results: Based on methylome and proteome analysis, we identified the hypermethylation of protein disulfide isomerase (PDI) gene in liver biopsies, concomitant with decreased mRNA expression and protein levels in diabetic group compared with non-diabetic group (p<0.05). Circulating PDI levels were lower in patients with diabetes (10.60±3.25 vs. 7.65±2.69 ng/ml, p<0.001) and elevated after metabolic surgery (7.58±2.90 ng/ml vs. 10.24±3.00 ng/ml, p<0.001). The decreased PDI expression was correlated with increased gluconeogenesis (G6P, r=-0.539, p<0.001; PEPCK, r=-0.262, p=0.033, respectively) and reduced glycogen synthesis (GS, r=0.308, p=0.012) in the liver. Furthermore, hepatic PDI downregulation aggravated hyperglycemia, whereas PDI overexpression ameliorated glucose intolerance, decreased glycogen deposition and increased glycogenesis in HFD mice (p<0.05). Moreover, PDI overexpression decreased the levels of phosphorylated PKR-like endoplasmic reticulum kinase and eukaryotic initiation factor 2 α by restoring the binding of glucose-regulated protein 78 in hepatocytes (p<0.05).
Conclusion: We identified the benefit effect of ER-associated protein PDI on the regulation of hepatic glucose metabolism, which is expected to be a potential therapeutic target against type 2 diabetes, and provided an important clue for better understanding ER stress in the pathogenesis of diabetes.

Clinical Trial Registration Number: NCT03296605
Supported by: NNSF
Disclosure: T. Hong: None.
306
Epigenome wide association study of serum vitamin B12 levels in European and South Asian women reveals CpG sites in glucose related genes
N. Fragoso-Bargas1,2, G.-H. Moen2,3, S. Lee-Ødegård2,4, J.O. Opsahl2, L. Sletner2,5, A.K. Jenum2, R.B. Prasad6, L.C. Groop6, E. Qvigstad1,2, K.I. Birkeland2, C. Sommer1;
1Oslo University Hospital, Oslo, Norway, 2University of Oslo, Oslo, Norway, 3The University of Queensland Diamantina Institute, Brisbane, Australia, 4Akershus University Hospital, Kongsvinger, Norway, 5Akershus University Hospital, Oslo, Norway, 6Lund University Diabetes Centre, Malmö, Sweden.
Background and aims: Vitamin B12 has been associated with hyperglycemia and Gestational diabetes mellitus (GDM). A recent Mendelian randomization study suggested a possible positive causal relationship between serum vitamin B12 (s-vitB12) and fasting glucose, and a negative causal relationship with HOMA-B. Vitamin B12 plays a role in one carbon metabolism, therefore it could promote DNA methylation (DNAm) changes in several genes. However, we are not aware of any Epigenome Wide Association Study (EWAS) of s-vitB12. The aims of this study were to 1) perform an EWAS of s-vitB12 in pregnancy, 2) assess if any s-vitB12 associated CpGs from the EWAS was in glucose related genes, and if so, 3) to evaluate the association of these CpGs with glucose related traits.
Materials and methods: We included 303 European (EU) and 161 South Asian (SA) women with DNA methylation and s-vitB12 data from the EPIPREG cohort. Venous blood samples were drawn in gestational week 28. We measured Fasting Glucose (FG), 2-hour glucose (2hG) after a universal oral glucose tolerance test, HbA1c, and DNAm was quantified using the EPIC beadchip array (850 k). Beta Values of the DNAm array were logit-transformed to M-values. EWAS of s-vitB12 was performed separately in EU and SA, using linear regression models, adjusting for age, smoking status and cell composition per Houseman algorithm. All probes in each ethnic group were meta-analyzed, accepting a 5% false discovery rate (FDR), and discarding probes with p<0.05 in the I2 Heterogeneity test. In R, we used the “limma” package for the linear models, and METAL was used for the meta-analysis. s-vitB12 associated CpGs situated in glucose related genes were tested for association with FG, 2hG and HbA1c through standard linear models in R, adjusting with the same covariates as the EWAS
Results: A total of 35 CpGs passed the FDR threshold and the heterogeneity test (p>0.05), with four CpGs located in glucose related genes (table 1). Of these, cg18202492 showed association with HbA1c in EUR (Effect=0.157, SE=0.060, p=0.009), and cg23724878 with 2hG in SA (Effect= -0.071, SE=0.033, p=0.033).
Conclusion: We discovered 35 s-vitB12 related CpGs, whereof four were situated in previous glucose related genes. DNAm in two of these sites showed association with glucose traits. Hence, s-vitB12 could play a role in glucose regulation in pregnancy, and potentially mediate GDM risk, but replication in an independent cohort is necessary.

Supported by: NDA and HSØ
Disclosure: N. Fragoso-Bargas: None.
307
Exposure of 3T3-L1 and NIH-3T3 cells to low dose of bisphenol-A induces hypomethylation of PPARγ without enhancing adipogenesis
J. Naderi1,2, F. Zatterale1, M. Longo1, M. Campitelli1, G. Cacace1, I. Prevenzano1, C. Nigro1, C. Miele1, F. Beguinot1;
1URT Genomics of Diabetes-IEOS, CNR & Department of Translational Medicine – Federico II University, Naples, 2Department of Environmental, Biological, and Pharmaceutical Sciences and Technologies, University of Campania Luigi Vanvitelli, Caserta, Italy.
Background and aims: Bisphenol-A (BPA) is one of the most prevalent endocrine-disrupting chemicals, which is commonly used in the production of polycarbonate plastics. It has been suggested that BPA may contribute to obesity, insulin resistance, and diabetes by dysregulating adipogenesis. PPARγ is a downstream target of BPA in adipogenesis. Epigenetic modifications may elucidate important underlying mechanisms of the BPA effect on adipogenesis. In this in vitro study, we sought to demonstrate whether adipogenesis could be affected by long-term exposure to a low, but environmentally relevant, dose of BPA. We also investigated the potential epigenetic mechanism underlying the effect of BPA on adipogenesis.
Materials and methods: Committed (3T3-L1) and uncommitted (NIH-3T3) adipose precursor cells were treated or not with BPA (1nM) for 8 days and subsequently differentiated. mRNA levels, DNA methylation status, and adipocyte differentiation rate were analysed by quantitative real-time PCR, bisulphite sequencing, and Oil Red O staining, respectively.
Results: BPA chronic exposure did not change Pparγ mRNA expression in 3T3-L1 preadipocytes. BPA reduced Pparγ promoter methylation in BPA-exposed 3T3-L1 preadipocytes (17.5%) compared to vehicle (41.7%). This hypomethylation preceded the increased Pparγ expression during adipocyte differentiation. Indeed, its expression transiently increased at day 4 of the 3T3-L1 differentiation process in the presence of BPA and paralleled with an increase in lipid droplets accumulation (p<0.05). However, in terminally differentiated adipocytes, expression of Pparγ, cEBPα, AP2, and GLUT4 was similar in BPA-treated cells and vehicle-treated controls. Pparγ promoter methylation decreased in BPA-treated 3T3-L1 even during adipocyte differentiation. Pparγ expression was also induced in the absence of differentiation mix in BPA-treated 3T3-L1 cells (day 4, p<0.05). Nonetheless, the spontaneous 3T3-L1 cell differentiation was not enhanced by BPA exposure. We found that the Pparγ promoter methylation profile in BPA-exposed 3T3-L1 cells can be reverted, as the stopping BPA exposure and switching 3T3-L1 preadipocyte to normal growth condition were associated with similar Pparγ promoter methylation in control 3T3-L1 cells. Interestingly, NIH-3T3 cells responded to BPA chronic exposure by reduction of Pparγ promoter methylation, although the exposure did not promote the commitment of cells to the adipocyte lineage.
Conclusion: Collectively, our study demonstrates that prolonged BPA exposure affects DNA methylation at Pparγ promoter. The increased Pparγ expression is transient and not associated with an improved adipogenic ability of the exposed committed or uncommitted preadipocytes. The termination of the exposure restores the normal epigenetic profile.
Supported by: INCIPIT Programme (grant No.: 665403)
Disclosure: J. Naderi: None.
308
Line-1 methylation changes relate to cardiovascular complications in type 2 diabetes
H.A. Fachim, K. Siddals, M. Gibson, A. Heald;
Salford Royal NHS Foundation Trust, Salford, UK.
Background and aims: Epigenetic mechanisms may play an important role in the etiology of obesity and cardiovascular diseases, by activating or silencing the related-genes. LINE-1 comprise approximately 17% of human DNA and can insert a new locus and function as alternative promoters that regulate genome activity. LINE-1 changes may cause repression of gene expression, genomic instability, and aberrations in DNA repair genes and DNA double-strand break repair, and has been associated with body composition and obesity-related diseases, including insulin resistance, type 2 diabetes mellitus (T2DM), and cardiovascular disease (CVD). CVD remains the major macrovascular complication and main cause of death in people with T2DM. We aim to identify if LINE-1 methylation changes could predict future macrovascular events and/or sudden cardiac death in our cohort of T2DM patients.
Materials and methods: Blood samples were collected from a total of T2DM 642 individuals from Salford, UK. Genomic DNA was extracted, bisulphite converted and a pyrosequencing method was used to determine mean methylation across 4 CpG sites in LINE-1. All patients had clinical and metabolic variables measured in 2002 (baseline outcomes) and annually through to 2016. CVD events were determined by MACE (major adverse cardiac events), and considered as a positive diagnosis those individuals showing at least one of the following events: sudden cardiac death, myocardial infarction, stroke, heart failure, angina, ischemic heart disease or those who have undergone a revascularisation procedure. We used general linear model, including methylation levels as dependent variables, groups with or without CVD complications (yes or no) as fixed factor or the presence of some of them combined, age and gender, as covariates.
Results: The overall mean ± SD global LINE-1 methylation was 75.81 ± 3.25%. We did not find differences in LINE-1 mean methylation considering the presence of CVD in general (MACE yes or no), however we found greater LINE-1 methylation in the interaction with presence of angina and ischemic heart disease (n=60 presenting angina*ischemic heart disease X n=582 without these events together; F = 5.13, p=0.024), controlling for age and sex.
Conclusion: Our results suggest that LINE-1 methylation may be a predictive measure for T2DM patients with more vulnerability to develop angina and ischemic heart disease in the future. Future studies using bigger cohorts are necessary to better understand the link between LINE-1 methylation and CVD in T2DM, this would allow clinicians to apply existing therapies in a more timely manner and therefore help patients to live healthier for longer.
Disclosure: H.A. Fachim: None.
PS 08 Pathophysiology of glucose homeostasis
309
Brain derived neurotrophic factor (BDNF) methylation and serum levels in patients with impaired glucose regulation (IGR): effect of a lifestyle change intervention
K. Siddals, M. Gibson, A. Heald, H. Fachim;
Salford Royal NHS Foundation Trust, Salford, UK.
Background and aims: We investigated whether a lifestyle intervention influenced serum levels and DNA methylation of BDNF in fat tissue and buffy coat of IGR individuals, as BDNF is thought to play a role in glucose metabolism.
Materials and methods: 20 participants underwent anthropometric measurements/fasting blood tests, adipose tissue biopsy pre- and post-lifestyle (6 months) intervention. DNA was extracted from adipose tissue and buffy coat, bisulphite converted and pyrosequencing was used to determine methylation levels in the BDNF gene IV exon. Serum BDNF levels were measured by ELISA.
Results: No differences were found regarding BDNF serum levels or methylation status. There were correlations between BDNF serum levels and: hip-waist ratio, HDL and HOMA-B (r=-0.762, p=0.028; r=0.776, p=0.023; r=-0.951, p=0.013, respectively) post-intervention.Pre-intervention for BDNF methylation, we found positive Pearson correlations between overall methylation in fat tissue (MF) and: hip-waist ratio (r=0.528, p=0.017), cholesterol (r=-0.552, p=0.012); negative correlation between overall methylation in buffy coat (MBC) and weight (r=-0.482, p=0.037). Post-intervention we found correlations between MBC and HbA1c (r=-0.510, p=0.036), BDNF serum and insulin (r=-0.629, p=0.003).For patients who lost 3% or more in weight (n=8), we found a negative correlation pre-intervention between MF and LDL (r=-0.943, p=0.016), positive correlation between BDNF serum and weight (r=0.793, p=0.019). Post-intervention we found correlations between MBC and: weight (r=0.793, p=0.006), triglycerides (r=0.860, p=0.006), HOMA-B (r=0.973, p=0.005
Conclusion: We observed associations between BDNF serum and BDNF DNA methylation with a range of cardiometabolic markers, differing pre/post lifestyle intervention. This suggests that BDNF may be involved in processes mediating insulin resistance/dysglycaemia.
Disclosure: K. Siddals: None.
310
Consequences of ketogenic diet and beta-hydroxybutyrate on epigenetic modifications and transcriptional control of cell metabolism in insulin responsive cells and tissues
L. Pirola1, S. Nasser1, D. Zygała2, T. Solé3, M. Strigini3, A. Balcerczyk2;
1South Lyon Medical Faculty, INSERM Unit 1060, Pierre Benite, France, 2Department of Molecular Biophysics, University of Lodz, Faculty of Biology and Environmental Protection, Lodz, Poland, 3INSERM U1059 SAINBIOSE, UdL/UJM Saint-Etienne, University Hospital CHU, Saint-Etienne, France.
Background and aims: Increased circulating ketone bodies within a physiological range appear to confer multiple metabolic benefits and ketogenic diet may be a valuable nutritional option to counteract multiple pathogenic conditions, including non-alcoholic fatty liver disease, insulin resistance, obesity and osteoarthritis. These effects can be mediated by beta-hydoxybutyrate (BHB) acting as a small molecule inducing a novel histone post-translational modification, beta-hydroxybutyrylation, and consequently multiple transcriptional changes. The extent of translational potential of beta-hydroxybutyrylation on metabolic signalling, at cellular level as well as on animal models, is yet not fully explored.
Materials and methods: The extent of beta-hydroxybutyrylation and transcriptional modulation induced by BHB were studied on i) cell lines or ii) by administration of a ketogenic diet to mice, leading to hepatic production of BHB. We explored cell lines including: (i) hepatocytes treated with the ketone body precursor 1,3 butanediol (ii) microvascular and vein endothelial cells cultured with BHB in increasing glucose concentrations (0, 1 and 5.5 mMol/l). Histone post-translational modifications were assessed by western blot, gene expression by quantitative real-time PCR.
Results: We found that ketone bodies readily induce beta-hydroxybutyrylation on histone 3 lysine 9 (H3K9bhb). In HepG2 and HuH7 hepatocytes, administration of the ketone body precursor 1,3 butanediol allowed the synthesis of BHB, and consequently the occurrence of beta-hydroxybutyrylation, not seen in non-hepatic cells. In a model of mice submitted to high fat diet followed by a switch to ketogenic diet, the latter diet exerted positive metabolic affects, and BHB-induced histone beta-hydroxybutyrylation could be observed in multiple organs.
Endothelial cells cultured for 4 days with 1 mM BHB in media containing different glucose concentrations, showed significant changes in gene expression levels of hexokinases (HK1,2 and 4), glucose transporters (GLUT 1 and 4 ) as well as the genes involved in ketone bodies metabolism BDH1 and SCOT1/Oxct1. Despite modulation of the transcriptional patterns of genes regulating cellular ‘fuel’ metabolism, BHB did not affect cell proliferation.
Conclusion: We suggest that, besides acting as a fuel molecule, BHB may exert its metabolic effects through modulation of the epigenome - via histone hydroxybutyrylation - and transcriptional modulation in multiple insulin responsive tissues/organs.
Supported by: Polish National Science Centre, project grant: NCN Harmonia 2019/30/M/NZ3/00682
Disclosure: L. Pirola: None.
311
MicroRNA changes following a lifestyle intervention in individuals with impaired glucose regulation
C. Loureiro1, K. Siddals2, H. Fachim2, C. Dalton1, G. Reynolds1, C. Zhen3, M. Gibson2, A. Heald2;
1Sheffield Hallam University, Sheffield, UK, 2Salford Royal NHS Foundation Trust, Salford, UK, 3Beckman Research Institute, City of Hope, USA.
Background and aims: Since their discovery microRNAs (miRNAs) have been shown to be involved in the pathogenesis of diabetes and its associated complications. They regulate insulin production, secretion and action. We sought to determine whether levels of 4 key miRNAs would change in response to a lifestyle intervention of individuals with IGR.
Materials and methods: Serum was collected from 20 IGR individuals at baseline and following a 6-month telephone-led lifestyle intervention where they received exercise and nutritional advice. MiRNAs were extracted from 1ml of serum pre- and post-intervention, reverse transcribed and levels of 4 key miRNAs previously shown to be associated with diabetes (Let-7a, Let-7e, miR-144 and miR-92a) were analysed by TaqMan real time PCR on a StepOne Real time-PCR. Changes in miRNA levels were then correlated with clinical parameters.
Results: In the whole cohort (n=20) both Let-7a and miR-92a were significantly elevated following intervention (p=0.009 & p=0.0001 respectively). When we analysed those that maintained or lost weight only (n=14) over the 6 month intervention only miR-92a remained significantly elevated post-intervention (p=0.008). In this group however Let-7e levels were significantly decreased post-intervention (p=0.017). When baseline miRNA levels were correlated with clinical parameters we found significant negative correlations between Let-7a and total cholesterol (r=-0.668, p=0.009), LDL (r=-0.603, p=0.05), HDL (r=-0.59, p=0.26) and triglycerides (r=-0.663, p=0.014).
Conclusion: A telephone led lifestyle intervention involving dietary and exercise advice resulted in marked changes in several miRNAs shown to be associated with diabetes. The miRNA Let-7a showed consistent and significant correlations with circulating lipids, which warrants further investigation.
Disclosure: C. Loureiro: None.
312
Lower expression of bile acid transporters and fibroblast growth factor 19 in mucosa biopsies from the intestine of patients with type 2 diabetes compared to healthy controls
H.H. Nerild1, A. El Haddouchi1, A. Brønden1, T. Jorsal1, D.P. Sonne1,2, J. Jelsing3, K. Rigbolt3, T. Vilsbøll1,4, F.K. Knop1,4;
1Center for Clinical Metabolic Research, Hellerup, 2Clinical pharmacology, Bispebjerg-Frederiksberg Hospital, Copenhagen, 3Gubra, Hørsholm, 4Steno Diabetes Center Copenhagen, Gentofte, Denmark.
Background and aims: Bile acids stimulate the secretion of gluco-regulatory and appetite-regulating gut hormones (including glucagon-like peptide 1 and fibroblast factor 19 (FGF19)) and increase energy expenditure. Changes in postprandial concentrations of circulating bile acids (primarily determined by the apical sodium-dependent bile acid transporter (ASBT) and organic solute transporter α/β (OSTα/β) in the terminal ileum) have been linked to type 2 diabetic pathophysiology.
Materials and methods: In a cross-sectional study, 12 patients with type 2 diabetes (T2D) (mean[range] age 51[34-63] years, BMI 26.8[23.7-31.5] kg/m2, HbA1c 48[36-85] mmol/mol) and 12 gender, age and BMI-matched non-diabetic controls (CTRLs) (age 50[41-67] years, BMI 27.1[20.3-30.8] kg/m2, HbA1c 34[29-43] mmol/mol) underwent upper and lower double-balloon enteroscopy with retrieval of mucosal biopsies from every 30 cm along the entire intestinal tract. The biopsies were subjected to full mRNA sequencing and here, the expression of ASBT, OSTα/β and FGF19 is reported.
Results: For both groups, robust expression (reads per kilobase million (RPKM) ≥1) of ASBT and OSTα/β was evident in the duodenum and this increased along the small intestine, with highest expression of ASBT in the ileocaecal region and highest expression of OSTα/β in terminal ileum. Compared to healthy controls, patients with T2D exhibited significantly lower ASBT and OSTα/β expression in the ileocaecal region (P<0.05). Compared to patients with T2D in whom expression of FGF19 was below 1 RPKM in all locations, the control group had robust and significantly greater expression of FGF19 in the terminal ileum (P<0.01).
Conclusion: T2D is associated with reduced expression of ASBT, OSTα/β and FGF19 in the terminal ileum and the proximal colon. This may point to a link between dysfunctional enterohepatic circulation of bile acids and type 2 diabetic pathophysiology.
Clinical Trial Registration Number: NCT03044860
Disclosure: H.H. Nerild: None.
313
Gut-derived exosomes in prediabetes: proteomics insight
I.A. Ferreira1,2, R. Machado de Oliveira1, A. Teshima3,1, R. Matthiesen4, B. Costa-Silva2, P. Macedo1,5;
1Metabolic Disorders, Centre of Chronic Diseases, NOVA Medical School, Lisbon, Portugal, 2Systems Oncology, Champalimaud Centre for the Unknown, Lisbon, Portugal, 3Department of Diabetes, Tokyo Medical University Hospital, Tokyo, Japan, 4Computational and Experimental Biology, Centre of Chronic Diseases, NOVA Medical School, Lisbon, Portugal, 5Department of Medical Sciences, University of Aveiro, Aveiro, Portugal.
Background and aims: Prediabetes is a strong indicator of later development of type 2 diabetes (T2D). Since its characterized by mild glycemia fluctuations it requires delicate monitorization. However, when properly and timely diagnosed it is the perfect window of opportunity to prevent T2D. T2D is a systemic disease and cannot be seen from the perspective of one only single organ affected. Thus inter-organ communication plays an important role in its propagation. Recently, a novel mean of organismal communication captured our attention: the extracellular vesicles (EVs). EVs have the capacity of carrying genetic and protein cargoes inside its membranes, from one cell to another.Metabolic surgery initially designed to promote weight loss, impressively improves glucose homeostasis beforehand, causing total remission of T2D. This evidence highlights the importance of understanding the intestine as a metabolically active organ that may be targeted in the future to improve health. The intestinal tract sends to the liver, blood containing digestion and absorption products. We hypothesize that gut derived exosomes (GDE) are carrying a diabetogenic signal from the gut to the liver, in response to diet. Our purpose is to identify this message through the panel of proteins expressed inside them, by proteomics.
Materials and methods: C57Bl/6 mice were fed for 12 weeks with normal chow diet (NCD) and high fat diet (HFD). Exosomes were isolated directly from gut, sorted by a gradient of size and density and controlled for bacterial contamination. The isolated GDE were finely characterized in terms of number and size, by using a nanoparticle tracker, as well as in terms of protein content by mass spectrometry. Next, in order to evaluate the tropism and the physiologic effect of long-term GDE-injections, fluorescent labelled GDE were retro-orbitally injected every other day into wild-type mice for 6 weeks
Results: We observed that GDE from HFD-fed mice carry more protein inside compared with GDE from NCD-fed mice despite the number of particles in circulation do not vary. There are 17% of proteins that are exclusively expressed in HFD-GDE and 10% exclusive for NCD-HFD, and from the 73% that are co-expressed in both conditions the expression patterns are very different, especially in proteins that belong to metabolic pathways, namely the ones used by fatty acids and alcohol. Interestingly, GDE appear to have affinity to the liver and in great extent they are uptaken by the resident macrophages of this tissue, the Kupffer cells. Also, the levels of triglycerides are increased in the liver of HFD-GDE injected mice.
Conclusion: These data corroborate our hypothesis that GDE content is altered by different dietetic scenarios and the information they carry inside reflects the environment where they are produced with signalization to a target tissue. High fat diet seems to work as a toxic component, neglecting some important pathways. If we are able to identify the specific diabetogenic message inside these GDE, they have the potential to be used in the future as liquid biopsies as diagnostic tool.
Supported by: FCT PTDC/MEC-MET/29314/2017; SPD
Disclosure: I.A. Ferreira: None.
PS 09 The inner workings of the pancreas
314
Presence of markers associated with viral infections in the pancreas before and after onset of type 1 diabetes
P. Apaolaza Gallegos1, D. Balcacean1, J. Zapardiel-Gonzalo1, S. Richardson2, P. Akhbari2, N. Morgan2, G. Nelson3, I. Gerling3, I. Kusmartseva4, A. Pugliese5, T. Rodriguez-Calvo1, the nPOD-Virus Group;
1Helmholtz Zentrum München, Munich, Germany, 2University of Exeter Medical School, Exeter, UK, 3University of Tennessee Health Science Center, Memphis, USA, 4University of Florida, Gainsville, USA, 5University of Miami Miller School of Medicine, Miami, USA.
Background and aims: Previous investigations support an association of type 1 diabetes (T1D) with enteroviruses (EV). These viruses can infect beta cells and could induce chronic inflammation accompanied by activation of cellular processes, which may compromise beta cell function and survival. Our objective was to investigate the presence or absence of markers associated with viral infections (EV capsid protein VP1 and double stranded RNA (dsRNA)), anti-viral immune and stress response proteins (HLA-I, MxA and PKR), and immune infiltration (CD3) in the islets of non-diabetic (ND), autoantibody positive (AAb+) and T1D organ donors.
Materials and methods: Pancreatic sections from 11 ND, 10 T1D, and 7 AAb+ donors were obtained from nPOD. Frozen sections were stained for insulin, glucagon, HLA-I, MxA, PKR, dsRNA and CD3 by IF (Helmholtz Zentrum Munich). FFPE-sections were stained for the viral protein VP1 by IHC (Exeter Medical School). Sections were scanned in a slide scanner. Insulin and glucagon positive islets, as well as the presence of HLA-I, MxA, PKR, and dsRNA were analyzed manually. Results from consecutive sections were combined in one single image and each islet was classified based on the expression of 1, 2, 3 or 4 markers on the same islet. Infiltration and VP1 positivity were analyzed using the software QuPath. Additional sections were used for transcriptomic analysis (University of Tennessee). RNA was extracted from islets with 0, 1 or more than 1 marker. Analysis was performed using Genespring and webgestalt softwares.
Results: Most of the islets in ND donors had normal HLA-I while islets with elevated expression were significantly higher in AAb+ and T1D donors. Hyperexpression was observed in double AAb+ and in all the T1D donors. VP1+ cells could be detected in a high percentage of islets in T1D donors while ND donors showed only low VP1 positivity. In T1D subjects, a significantly higher percentage of islets expressed PKR and MxA while there was no difference in dsRNA expression between the groups. The combined analysis of HLA-I, MxA, PKR, and dsRNA showed that a significantly higher percentage of islets in AAb+ and T1D donors expressed 1 or more of these markers on the same islet. Interestingly, gene expression analysis showed that islets that expressed 1 or more markers had decreased expression of genes related to the insulin secretion pathway. Moreover, in T1D donors, these markers were more frequently expressed in insulin containing than in insulin deficient islets. In addition, high T cell infiltration was present in a few islets in almost all T1D and in some AAb+ donors. More than 80% of these islets expressed 1 or more anti-viral immune response markers.
Conclusion: Our findings point to the existence of an anti-viral signature in T1D that affects a selective group of islets and might contribute to beta cell dysfunction and destruction by increasing cellular stress, diminishing insulin production and attracting immune cells to the islets. Our study shows the importance of therapeutic interventions aimed at targeting persistent infections, cellular stress and inflammation in individuals with T1D.
Supported by: JDRF
Disclosure: P. Apaolaza Gallegos: None.
315
Regulatory genomic variation in the developing human pancreas
A. MacCalman, E. De Franco, A.R. Jeffries, E.J. Hannon, J. Davies, J. Burrage, N.G. Morgan, A.T. Hattersley, J. Mill;
College of Medicine and Health, University of Exeter, Exeter, UK.
Background and aims: Little is known about patterns of gene regulation occurring during development of the human pancreas. Much of our current understanding is based on the study of model species - in particular mouse - although there remains critical differences in the structural and spatial organisation of pancreatic islet cells and divergences in the genes which are critical for pancreatic development. Although cell-specific and temporally appropriate gene expression is primarily controlled through the direct action of transcription factors, there is growing recognition of the role of epigenetic mechanisms in the dynamic regulation of gene function during cellular development and differentiation. In particular, the establishment and maintenance of tissue-specific DNA methylation (DNAm) patterns is crucial for normal mammalian development. Here, we present an analysis of dynamic changes in DNAm taking place during development of the human pancreas.
Materials and methods: We obtained pancreatic tissue from 114 fetal donors ranging from Carnegie Stage (CS) 19 to 21 weeks post conception (WPC). We quantified genome-wide patterns of DNA methylation at ∼850,000 sites using the Illumina EPIC HumanMethylation array. Our analyses focused on identifying DNAm changes associated with pancreatic development.
Results: We identified highly significant changes in DNA methylation across fetal pancreas development at a large proportion of sites. To our knowledge, our dataset represents the most extensive study of DNA methylation across human fetal pancreatic development to date, confirming the prenatal period as a time of considerable epigenomic plasticity.
Conclusion: By advancing our understanding of the epigenetic and transcriptional changes that occur throughout human pancreas development, we can better understand the pathogenesis of diseases of the pancreas such as diabetes. This analysis forms part of a larger project aiming to characterize multiple layers of gene regulation during human pancreatic development, facilitating a systematic exploration of hypotheses related to the developmental origins of diabetes.
Supported by: E3 Fund
Disclosure: A. MacCalman: None.
316
TIGER: the translational human pancreatic islet genotype tissue-expression resource
L. Alonso1, A. Piron2,3, I. Morán1, R. Royo1, M. Puiggròs1, M. Guindo-Martínez1, S. Bonàs-Guarch4, A. Gloyn5,6, J.L.S. Esguerra7, J. Ferrer4,8, P. Marchetti9, D.L. Eizirik2,10, J. Mercader1,11, M. Cnop2, D. Torrents1,12;
1Barcelona Supercomputing Center (BSC), Joint BSC-CRG-IRB Research Program in Computational Biology, Barcelona, Spain, 2ULB Center for Diabetes Research, Université Libre de Bruxelles, Brussels, Belgium, 3Université Libre de Bruxelles, Interuniversity Institute of Bioinformatics in Brussels (IB2), Brussels, Belgium, 4Bioinformatics and Genomics Program, Centre for Genomic Regulation (CRG), The Barcelona Institute of Science and Technology (BIST), Barcelona, Spain, 5Wellcome Centre for Human Genetics, Nuffield Department of Medicine, University of Oxford, Oxford, UK, 6Division of Endocrinology, Department of Pediatrics, Stanford University School of Medicine, Stanford, USA, 7Lund University Diabetes Centre, Lund University, Malmö, Sweden, 8Section of Epigenomics and Disease, Department of Medicine, Imperial College London, London, UK, 9Department of Clinical and Experimental Medicine, University of Pisa, Pisa, Italy, 10Indiana Biosciences Research Institute, Indianapolis, USA, 11Programs in Metabolism and Medical and Population Genetics, Broad Institute of Harvard and MIT, Cambridge, USA, 12Institució Catalana de Recerca i Estudis Avançats (ICREA), Barcelona, Spain.
Background and aims: The scarcity of human islets preparations from organ donors available and their scattering across research labs, limits the understanding of the genomic and regulatory landscape of human islets and type 2 diabetes (T2D). The Horizon 2020 T2DSystems Consortium set out to gather genomic, transcriptomic and epigenomic datasets from a large number of human pancreatic islet samples from several laboratories and make the data publicly available.
Materials and methods: We collected RNA-seq and genotyping data from 495 human islet samples and performed harmonization, quality control, genotype phasing and imputation. We integrated a) T2D association from genome-wide association studies (GWAS) identified in large meta-analyses or included in the GWAS Catalog, b) variant annotation and characterization through Variant Effect Predictor and Gnomad, c) epigenomic marks from islet DNA-methylation sites, chromatin accessibility and CHiP-seq profiles, d) annotation from Gene Ontology, lncRNAs and islet regulome, e) gene expression from normalised islet RNA-seq counts, microarrays and the Genotype-Tissue Expression database, and f) computed expression quantitative loci (eQTL) and allelic specific expression (ASE) and created the largest regulatory variation database from human pancreatic islets.
Results: We developed TIGER, a publicly accessible database (http://tiger.bsc.es) provided with a genome browser to ensure the comprehensive data integration. The platform encloses tools for visualizing, querying, and downloading human islet data. TIGER facilitates follow-up by providing genetic and molecular findings related to T2D pathophysiology with a gene or a variant summary, eQTL and ASE results, associations with T2D and other related traits or diseases, genomic context information such as the islet chromatin landscape and direct access to other genomic databases.
Conclusion: The comprehensive collation in TIGER of genomic, transcriptomic and epigenetic human islet datasets, and the integration with T2D GWAS and regulatory variation, represents a formidable resource to interrogate the molecular etiology of beta-cell failure in T2D.
Supported by: European Union's Horizon 2020 research and innovation programme under grant agreement No 667191
Disclosure: L. Alonso: Grants; Horizon 2020 No 557191.
317
Exosomal transfer of miRNAs in response to Coxsackie-viral infection in beta cells
S. Geravandi, B. Dasgupta, H. Liu, K. Maedler;
Centre for Biomolecular Interactions, Bremen, Germany.
Background and aims: Type 1 diabetes (T1D) is characterized by immune-mediated destruction of insulin-producing beta cells, resulting from genetic pre-dispositions and multiple environmental factors. For many years, enteroviruses have been suggested as causative for intra-islet inflammation and beta cell failure in T1D. Enteroviral RNA and protein have been found in patients with T1D in few but significantly more cells throughout the pancreas than in controls, and prolonged enteroviral infections correlate with islet autoimmunity in children. Several microRNAs (miRNAs) have been linked to autoimmunity and T1D, and their differential expression in the blood from T1D patients suggests them as potential biomarkers for T1D. In the current study we identified exosomal accumulation of two miRNAs: -155 and -146b from beta cells in response to viral infection, in parallel to beta cell destruction.
Materials and methods: A high-throughput miRNA qPCR array (miRCURY LNA™ Universal RT microRNA PCR) was performed from isolated human islet RNAs infected with coxsackieviruses (CVB3 and CVB4; MOI of 5) and miRNAs expression confirmed by an in situ hybridization-based high sensitive ViewRNA assay using target-specific probe sets. Total exosomes were isolated from culture media of CVB3-, CVB4- and non-infected CM9 beta-cells, which characterized by dynamic light scattering (DLS) and western blot analyses for positive and negative exosomal markers. RT-PCR was performed on RNAs isolated from the exosomal fraction as well as from whole cell lysates.
Results: A miRNA qPCR array showed particularly high induction of miR-155 and -146b by CVB3 and CVB4 infection of human islets from 4 independent human islet isolations. As these miRNAs were previously found to be transferred by exosomes in response to pro-inflammatory cytokines, we isolated exosomes from CVB4 infected beta cells. DLS analysis of purified exosomes defined vesicles ranging from 130-160 nm corresponding to exosome size distribution, and western blotting confirmed the presence of several exosomal markers Alix, CD9, CD54, HSP70, Flotillin, Annexin V and the absence of the negative marker GM130. RT-PCR analysis of miRNAs isolated from exosomes showed an induction of miR-155 and -146b in infected, compared to non-infected beta cells. Also, the exosomal marker CD9, which had been associated with viral and inflammatory responses, was upregulated in infected compared to non-infected beta cells. An in situ hybridization based method also showed the increase of miR-155 and -146b in virus-infected CM9 beta cells; with high expression in insured cells with fragmented and condensed nuclei.
Conclusion: Our results indicate that miR-155 and -146b are up-regulated in whole-cell as well as exosomal fractions in coxsackievirus infected human islets/beta cells. The transfer of beta cell derived exosomal miRNAs to recipient cells may initiate apoptotic, inflammatory and autoimmune processes in pancreatic islets.
Supported by: German Research Foundation (DFG)
Disclosure: S. Geravandi: None.
PS 10 Islets and antibodies in type 1 diabetes
318
A visual analytics method to explore the evolution of autoantibodies during progression to type 1 diabetes in multi-site birth cohort studies
B. Kwon1, P. Achenbach2, V. Anand1, J.L. Dunne3, W. Hagopian4, M. Lundgren5, R. Veijola6, B.I. Frohnert7, the T1DI Study Group;
1IBM Research, Cambridge, USA, 2Helmholtz Zentrum München, München, Germany, 3JDRF, New York, USA, 4University of Washington, Seattle, USA, 5Department of Clinical Sciences, Lund University, Malmö, Sweden, 6University of Oulu, Oulu, Finland, 7University of Colorado, Denver, USA.
Background and aims: To explore the evolution of islet autoantibodies (IAs) prior to onset of type 1 diabetes (T1D), we developed an interactive visual analytics method usingHidden Markov Models (HMM). The goal was to allow users to gain clinically meaningful insights through coordinated and interactive visualizations of individual IA patterns combined with demographic characteristics and genetic, environmental, and anthropometric measures. This approach opens the black-box of HMM to depict data for all individual participants without aggregation, allowing identification of trajectory patterns and characterization of subgroups.
Materials and methods: HMMs are applied to probabilistically discover latent states manifested at each visit observed in 688 individuals from multi-site birth cohort studies (DiPiS, DAISY, DIPP, DEW-IT, and BABYDIAB). Subjects had ≥3 visits with IA data (GADA, IAA, IA-2A) and progressed to T1D. Interactive visualizations are then applied to summarize the latent states and frequent transitions between states by combining the outputs of HMMs and genetic, environmental, anthropometric and demographic features drawn from the observational data.
Results: The interactive visualizations allow investigators to formulate and test hypotheses regarding the dynamic evolution of IAs in relation to T1D onset. Such hypotheses include: i) what are the distinctive IA evolution trajectories in relation to different first-appearing autoantibody pattern? ii) what is the average age of seroconversion of the first and second IA in relation to the diabetes diagnosis trajectory? Additionally, investigators can interactively create and refine cohorts based on cross-sectional and longitudinal measures. The analysis visually presented the 11 HMM states and transition patterns, and identified 3 distinctive trajectory groups: Tr1) develop multiple IAs at seroconversion; Tr2) develop IAA first; Tr3) develop GADA first.
Conclusion: Interactive visualizations combined with HMMs provide an effective approach to help investigators gain clinically meaningful insights about IA evolution in T1D.

Supported by: JDRF
Disclosure: B. Kwon: None.
319
Heterogeneous islet autoantibody evolution trajectories in multi-site birth cohort studies
P. Achenbach1, V. Anand2, J.L. Dunne3, W. Hagopian4, B. Kwon2, M. Lundgren5, R. Veijola6, B.I. Frohnert7, the T1DI Study Group;
1Helmholtz Zentrum München, München, Germany, 2IBM Research, Cambridge, USA, 3JDRF, New York, USA, 4University of Washington, Seattle, USA, 5Department of Clinical Sciences, Lund University, Malmö, Sweden, 6University of Oulu, Oulu, Finland, 7University of Colorado, Denver, USA.
Background and aims: To investigate the evolution of islet autoantibodies (IA) in children who progress to T1D compared to non-progressors.
Materials and methods: Analysis was performed on 2515 children from five cohort studies: DAISY, DiPiS, DIPP, DEW-IT, and BABYDIAB. Participants were IA positive on at least one visit and had three or more follow-up visits. Hidden Markov Models were used to label patient observations based on the status of three IAs: GADA, IAA, and IA-2A. Interactive visualizations were generated to gain insights into IA evolution trajectories.
Results: Among IA+ children, 688 (27.35%) progressed to T1D (P) and 1827 had not progressed by their last visit (NP); mean age of NP at last visit was 13.73 ± 4.99 years. HLA group distributions differed by group; P had more HLA-DR 3/4 than NP (21% vs 12%) and fewer DR X/X (11% vs 28%). Out of 1827 children in NP, 790 children (43.24%) developed IA positive states. Three trajectories were found with respect to the first IA states: Tr1) Multi-IA first (265 P, 96 NP); Tr2) IAA first (282 P, 220 NP); Tr3) GADA first (131 P, 418 NP), showing that many children, who did not progress to T1D, developed multiple IAs by gaining GADA as their first IA in Tr3. Age at first IA was significantly different (p < .001) between P and NP, with Tr2 showing the largest difference. Mean age in months at first IA was: Tr1) P: 46, NP: 77; Tr2) 28, 80; Tr3) 53, 92.
Conclusion: Three IA trajectories exist for both children who progress or do not progress into T1D. There were differences between P and NP with respect to HLA-DR distribution and age of first IA. Many IA positive children who did not progress to T1D (418 NP) developed GADA as the first IA.

Supported by: 1-IND-2019-717-I-X, 1-SRA-2019-722-I-X, 1-SRA-2019-723-I-X, 1-SRA-2019-719-I-X, 1-SRA-2019-721-I-X
Disclosure: P. Achenbach: None.
320
High-throughput sequencing of circulating plasma microRNAs in newly diagnosed type 1 diabetes identifies four different patient clusters
G. Sebastiani1, G.E. Grieco1, D. Fignani1, P.J. Chmura2, C.A. Brorsson2, S. Bruggraber3, A. Pugliese4, C. Evans-Molina5, M. Knip6, M. Peakman7, A.M. Schulte8, S. Brunak2, D.B. Dunger3, C. Mathieu9, F. Dotta1;
1Dep. of Medical Science, Surgery and Neurosciences, University of Siena, Siena, Italy, 2Center for Protein Research, University of Copenhagen, Copenhagen, Denmark, 3Dep. of Paediatrics, University of Cambridge, Cambridge, UK, 4Miller School of Medicine, University of Miami, Miami, USA, 5Center for Diabetes and Metabolic Diseases, Indiana University School of Medicine, Indianapolis, USA, 6Children's Hospital, University of Helsinki, Helsinki, Finland, 7Peter Gorer Dep. of Immunobiology, Guy's Hospital, London, UK, 8Sanofi Deutschland GmbH, Frankfurt, Germany, 9Laboratory of Clinical and Experimental Endocrinology, Dep. of Chronic Diseases, KU Leuven, Leuven, Belgium.
Background and aims: MicroRNAs (miRNAs) are present in the blood, associated with proteins or enclosed in vesicles. Of note, some plasma circulating miRNAs have been demonstrated to be differentially expressed in Type 1 diabetes (T1D) or associated with C-peptide decline or islet autoimmunity, and, therefore, have been suggested as potential T1D biomarkers. In the IMI-2 INNODIA consortium, we established a standardized protocol (SOP) to collect and process blood samples in people with newly diagnosed T1D followed longitudinally to evaluate plasma miRNA expression profiles as potential stratification tools.
Materials and methods: Plasma samples from 116 newly-diagnosed people with T1D (≤6 weeks from diagnosis) were collected following the SOP. Of those, n=100 were pediatric (age 9,9±3,7y, range 2-17y; 49F,51M) and n=16 were adult (age 28,3±7,2y, range 18-38y, 9F,7M). From each patient 15μl plasma was analyzed using HTG Edge seq miRNA profiling allowing the evaluation of 2083 miRNA by next generation sequencing. Duplicate samples were included as internal controls. HTG Edge Seq parser software was used to align fastq files and to perform median normalization.
Results: Of 2083 miRNAs analyzed, 386 were detected as consistently expressed in all 116 samples, based on mean filtering. Analysis of duplicate samples revealed a highly significant correlation (Spearman; r-value 0,93-0,96). Using a hierarchical clustering approach, we identified 4 main groups characterized by miRNA expression diversity. In particular, two main miRNA clusters, named miRNA cluster-A (n=93 miRNAs) and miRNA cluster-B (n=98 miRNAs) drove this classification. miRNAs included in cluster-A showed high expression in people designated as groups #1 and #4 and low expression in groups #2 and #3, while miRNAs in cluster-B showed high expression in group #2 and low expression in groups #3 and #4. Of note, within miRNA cluster-A, we identified 17 miRNAs previously associated with immune system function and already repeatedly linked to T1D (e.g. miR-24, miR-146a, miR-21) as well as a 10 miRNA subcluster belonging to the T1D susceptibility locus 14q32 and associated with the regulation of autoantigens in autoimmune diabetes
Conclusion: We show that high-throughput analysis of miRNAs in plasma samples collected in INNODIA at T1D diagnosis results in the identification of 4 distinct subgroups based on miRNA expression diversity. These results may pave the way for early patient stratification, as well as defining populations for detailed analysis of longitudinal clinical outcomes and mapping onto other biomarker sets in the consortium.
Supported by: IMI2- n.115797 (INNODIA)
Disclosure: G. Sebastiani: None.
321
Building a clinical trial simulation tool for disease modifying therapies in type 1 diabetes (TOMI-T1D)
A. Lam1, I. O'Doherty2, M. Rigby3, P. Senior1, P. Gottlieb4, C. Dayan5;
1University of Alberta, Edmonton, Canada, 2Critical Path Institute, Tucson, USA, 3Janssen Pharmaceuticals, Philadelphia, USA, 4University of Colorado, Colorado, USA, 5Cardiff University, Cardiff, UK.
Background and aims: Despite more than 30 years of clinical trials in type 1 diabetes (T1D), there are still no disease modifying therapies licensed for use. A major challenge has been the lack of standardized and clinically meaningful, efficacy endpoints. Since no therapy has yet been licensed, the path to regulatory approval remains unclear with the use of unproven surrogate endpoints adding to the uncertainty of clinical trials in T1D. To address this, the JDRF and Diabetes UK have funded the Trial Outcome Markers Initiative in T1D (TOMI-T1D) an international partnership between academia, pharmaceutical industry and non-profit organizations to accelerate drug development in T1D through the development of a clinical trial simulation tool (CTST). The CTST will help identify optimal endpoints to 1) improve clinical interpretability of trials 2) shorten the time to primary outcome and/or 3) minimize the number of participants required in trials. CTSTs have been successfully applied in other diseases including Alzheimer’s disease where the first CTST was endorsed for drug development by the FDA and EMA.
Materials and methods: The CTST is being developed/implemented in 4 parallel phases 1) assembly of the largest database to date of patient data from completed clinical trials and observational studies in T1D, 2) building and ongoing refinement of the CTST based on this database using nonlinear mixed-effects modelling, 3) pursuing regulatory agency endorsement of the CTST through formalized submission processes at FDA and EMA and 4) using the CTST to simulate clinical trials in T1D including covariates which reflect different patient populations and trial designs.
Results: We have identified 27 priority trials (including completed phase 3 immunotherapy trials) and observational studies in T1D comprising more than 4000 patients. To date we have agreements for patient level data on 18 Trials (n = 1833). Shared data are aggregated into a single de-identified database including patient demographics, T1D characteristic (age at onset, duration of diabetes, etc.), measures beta cell function (i.e. C-peptide random, fasting, peak and AUC) and clinical measures of metabolic control (glucose levels, insulin usage, HbA1c). Based on this, the CTST is able to simulate a wide range of trial conditions including with different patient populations (i.e. child vs. adult onset T1D) and different trial designs (i.e. short vs. long duration). Importantly, it will be possible to model endpoints including measures of beta cell function and metabolic control in different combinations to identify composites which are the most responsive to treatment effect in order to optimize statistical power and trial success.
Conclusion: TOMI-T1D’s effort to assemble the largest, integrated database of clinical trials and observational studies to ensure the validity and robustness of the first CTST in T1D will require an unprecedented level of collaboration and data sharing within the T1D community (academia and industry). Continued refinement of the CTST will depend on the sharing of new trial data as it becomes available. Ultimately, the goal of TOMI-T1D is to provide open access to the integrated database and regulatory agency endorsed CTST as a means to design more efficient and successful clinical trials of disease modifying therapies in T1D.
Supported by: JDRF and Diabetes UK
Disclosure: A. Lam: None.
322
Trajectories of childhood adversity and type 1 diabetes: a nationwide study of 1 million children
J. Bengtsson1,2, A. Rieckmann2, B. Carstensen1, J. Svensson3, M.E. Jørgensen1,4, N.H. Rod2;
1Clinical Epidemiology, Steno Diabetes Center Copenhagen, Gentofte, 2Department of Public Health, University of Copenhagen, Copenhagen, 3Department of Paediatrics and Adolescent Medicine, Copenhagen University Hospital, Herlev, 4National Institute of Public Health, University of Southern Denmark, Copenhagen, Denmark.
Background and aims: Experiencing stressful adversities in childhood such as bereavement, parental divorce, or being placed in foster care has been suggested a potential risk factor for type 1 diabetes. However, previous studies have lacked the statistical power to account for timing of exposure to childhood adversities and age at onset of type 1 diabetes. We aim to describe the age-specific incidence of type 1 diabetes for boys and girls separately in five predefined groups covering the most common trajectories of adversity among Danish children taking timing, frequency, and accumulation of adversity exposure into account.
Materials and methods: We estimated age-specific incidence rates of type 1 diabetes in five trajectory groups of adversity among all children born in Denmark between 1980 and 1998 (N=1,081,939) using register data. The trajectory groups were characterized by 1) low adversity, 2) early life material deprivation, 3) persistent material deprivation, 4) loss or threat of loss, and 5) high adversity. We derived age-specific incidence rate ratios of type 1 diabetes from 0 to 35 years of age and estimated adjusted incidence rate ratios (IRR) and 95% confidence intervals (95% CI) of type 1 diabetes in three age intervals (i.e. 0-10 years; 11-16 years; and >16 years) in each trajectory group relative to the low adversity group. All analyses were conducted separately for boys and girls.
Results: In total, 5619 persons developed type 1 diabetes before the end of 2015. We generally found only minor differences when comparing the incidence rates of type 1 diabetes for boys and girls in the trajectory groups. The only clear exceptions were observed in the high vs. low adversity group where boys had higher incidence of type 1 diabetes in childhood (<11 years [(adjusted IRR: 1.78; 95% CI: 1.31-2.42]) and girls had higher incidence of type 1 diabetes in early adulthood (>16 years [adjusted IRR: 2.19; 95% CI: 1.57-3.07]).
Conclusion: Childhood adversities were generally not associated with age-specific incidence of type 1 diabetes. Only a very high and increasing annual rate of childhood adversities was associated with type 1 diabetes. The potential mechanisms underlying these associations seem to differ between boys and girls.

Supported by: Innovation Fund Denmark (5189-00083B) and Helsefonden (17-B-0102)
Disclosure: J. Bengtsson: Grants; Innovation Fund Denmark (grant number 5189-00083B), Helsefonden (grant number 17-B-0102).
323
A comparison of patients with type 1 diabetes with and without autoimmune polyglandular syndrome type 2: data from the German/Austrian/Swiss and Luxembourgian DPV registry
G. de Sousa1,2, S.R. Tittel3,4, R. Bachran5, R. Birnbacher6, J. Brückel7, D. Dunstheimer8, H. Haberland9, M. Hess10, W. Karges11, R. Oeverink12, A. Veigel13, N. Prinz3,4;
1Pediatric Endocrinology and Diabetology, Children’s Hospital Dortmund, Dortmund, Germany, 2Pediatrics, University of Witten/Herdecke, Witten, Germany, 3Central Institute for Biomedical Technology, University of Ulm, Ulm, Germany, 4German Center for Diabetes Research (DZD), Munich-Neuherberg, Germany, 5Children’s Hospital Oberhausen, Oberhausen, Germany, 6Children’s Hospital, KABEG, LKH Villach, Villach, Austria, 7Department of Internal Medicin, Westallgäu-Klinikum, Wangen, Germany, 8Children’s Hospital, University Hospital of Augsburg, Augsburg, Germany, 9Children’s Hospital, Sana Klinikum Lichtenberg, Berlin, Germany, 10Department of Pediatric Endocrinology and Diabetology, Children’s Hospital, University of Basel, Basel, Switzerland, 11Department of Endocrinology and Diabetology, University Hospital Aachen, Aachen, Germany, 12Department of Pediatric Endocrinology and Diabetology, MVZ Medicover, Oldenburg, Germany, 13Children’s Hospital Karlsruhe, Karlsruhe, Germany.
Background and aims: Autoimmune polyglandular syndrome type 2 (APS 2) has been defined by the presence of at least two of the following three endocrinopathies: Type 1 diabetes (T1DM), autoimmune thyroid disease (AIT), and Addison’s disease. The aim of this study was to better characterize the clinical phenotypes of T1DM patients with APS 2.
Materials and methods: We searched the database for T1DM patients with the additional diagnosis of autoimmune thyroid disease and/or Addison’s disease. Data were aggregated over each patient’s most recent treatment year. Patients with T1DM and APS 2 were compared with isolated T1DM (T1DM with no further autoimmune disorders). Linear regression models were used for HbA1c and daily insulin dose/kg, logistic models for retinopathy, microalbuminuria, and neuropathy, and Poisson models for rates of ketoacidosis and severe hypoglycemia/hypoglycemia with coma. All models were adjusted for age, sex, duration of diabetes, treatment regimen, and migration background. Models for retinopathy, microalbuminuria, and neuropathy were additionally adjusted for HbA1c. 45 T1DM patients with AIT and Addison’s disease contributed to two groups.
Results: The number of patients found, the patient characteristics, and the results of the comparisons are shown in table 1. We found more females in all groups with APS 2. We do not consider the statistically significant differences in daily insulin dose and HbA1c as clinically relevant. The percentage of patients with neuropathy was higher in both groups with AIT. Moreover, we detected more patients with retinopathy in the group with Grave’s disease.
Conclusion: The percentage of females is higher in all groups with T1DM and APS 2. T1DM patients with both types of AIT seem to have a higher risk to develop neuropathy. T1DM patients with Grave’s disease seem to have a higher risk to develop retinopathy, as well.

Dislcosure: G. de Sousa: None.
324
International comparison of glycaemic control of type 1 diabetes: an update and extension
J.A. McKnight1,2, International Quality of Care for Type 1 Diabetes(IQoC-T1) Group;
1Metabolic Unit and Acute Receiving Unit, Western General Hospital, Edinburgh, 2University of Edinburgh, Edinburgh, UK.
Background and aims: A previous international comparison of glycaemic control using data up to 2013 revealed that the majority of people with type 1 diabetes had higher HbA1c levels than recommended in clinical guidelines. In addition, there was substantial variation between different data sources and room for significant improvement, particularly in young adults. Since then several new technologies to support management of type 1 diabetes have been introduced. We aimed to update and extend the international comparison of glycaemic control in people with type 1 diabetes.
Materials and methods: Data were available for 474,637 children and adults with type 1 diabetes in the 2016 - 2020 period from 15 population- and five clinic-based registers from 20 countries or regions (Austria, Australia, Belgium, Canada, Denmark, England, Finland, France, Germany, Greece, Hong Kong, Ireland, Italy, Latvia, Netherlands, Norway, Scotland, Slovenia, Ukraine, and Wales). Data from additional countries are anticipated. Median HbA1c values (IQR) were compared between countries in each age stratum (< 15 years, 15 - 24 years, ≥ 25 years). Proportions of individuals with low (< 58mmol/mol or < 7.5%), moderate (58 - 74 mmol/mol or 7.5 - 8.9%) and high HbA1c (≥ 75mmol/mol or ≥ 9.0%) were compared between countries in each of the three age groups. Multivariable logistic regression was used to estimate the odds of low HbA1c relative to moderate or high HbA1c. The model was adjusted for sex, age, and data source using the largest sub-group as the comparison group. Data from countries were included where information was available for more than 100 people in each age group.
Results: The sample sizes ranged from 508 (Greece) to 283,414 (England). Median HbA1c values ranged from 55 (51; 65) mmol/mol [7.2% (6.8; 8.1)] in Italian individuals aged < 15 years to 79 (64; 99) mmol/mol [9.4% (8; 11.2)] in Latvian individuals aged 15 - 24 years. The proportion of individuals with high HbA1c varied between countries from 5.8% to 53.2% for people aged < 15 years (n = 53,927), from 13.9% to 57.1% in people aged 15 - 24 years (n = 80,080), and from 11.2% to 34.9% among those aged ≥ 25 years (n = 340,368). Adjusted odds ratios (95% CI) for low HbA1c were 0.91 (0.90 - 0.93) for females compared to males, 1.61 (1.57 - 1.66) and 0.75 (0.73 - 0.77) for people aged < 15 years and 15 - 24 years compared to those aged ≥ 25 years, respectively, and 1.44 (1.37 - 1.50) for clinic-based data compared to population-based data. Differences between countries persisted after adjusting for sex, age, and data source.
Conclusion: Glycaemic control among people with type 1 diabetes continues to vary substantially between countries and data sources, with proportions of people with high HbA1c greatest among those aged 15 - 24 years. Further research is required to establish explanations for the differences and to identify effective approaches to improving glycaemic control and reducing risk of complications from type 1 diabetes.
Disclosure: J.A. McKnight: None.
PS 11 Markers and phenotypes of glucose traits
325
1,5-anhydroglucitol as a circulating biomarker of beta cell loss independently of diabetes onset
C. Jiménez-Sánchez1, T. Mezza2, G. Di Giuseppe2, A. Giaccari2, P. Maechler1;
1Cell Physiology and Metabolism Department, University of Geneva, Geneva, Switzerland, 2Endocrinologia e Diabetologia, Università Cattolica del Sacro Cuore, Rome, Italy.
Background and aims: In diabetes, symptoms appear only once about half of the functional β-cell mass has been lost, with asymptomatic decline months or years before diagnosis. However, this key event is difficult to capture and to demonstrate unequivocally, as there is currently no way to assess the β-cell mass in living individuals. In a previous study, we identified the metabolite 1,5-anhydroglucitol (1,5-AG) as a circulating biomarker of the β-cell mass in the prediabetic asymptomatic period of both Bet-Phb2 knockout and db/db mice. The aim of the present study is the validation of this biomarker in patients undergoing hemi-pancreatectomy, i.e. acute and controlled resection of β-cell mass.
Materials and methods: To validate 1,5-AG as biomarker of beta-cell mass reduction in the development of diabetes we performed oral glucose tolerance tests (OGTT), 2-hour euglycemic clamp (EC), hyperglycemic clamps (HC), followed by arginine stimulation and mixed meal test (MMT) in 9 non-diabetic patients (7 female; 2 male; mean age 55±7 years) undergoing pancreatoduodenectomy (PD) as model of acute mass reduction, before and 40 days after the surgery. Plasmatic 1,5-AG levels were measured with the colorimetric assay Glycomark® on fasting plasma samples both before and after surgery.
Results: Plasmatic levels of 1,5-anhydroglucitol were significantly reduced in patients following pancreatoduodenectomy. Only one of the patients became diabetic after the surgery, demonstrating functional adaptation of the remaining β-cells without apparent signs of diabetes. After the surgery, we observed that impairment of first phase insulin secretion (p=0.01) and arginine-stimulated insulin secretion (p=0.052) are linked to reduction of 1,5-AG levels.
Conclusion: In conclusion, our results suggest that circulating levels of 1,5-AG levels reflect β-cell functional mass in humans. The reduction of 1,5-AG levels are directly related to early metabolic defects in dysfunctional β-cells, highlighting the importance of this biomarker in estimating β-cell loss, even before diabetes onset.
Supported by: Fundación Alfonso Martín Escudero, HJELT Diabetes Foundation, EFSD Future Leaders Mentorship Programme
Disclosure: C. Jiménez-Sánchez: None.
326
The "Squeezer": an HTML programme designed to estimate relative insulin sensitivity and relative beta cell function using OGTT data
P.H. Contreras;
Endocrinology, Reproductive Health Research Institute (RHRI), Santiago, Chile.
Background and aims: An instrument helping clinicians to evaluate the OGTT at-a-glance is lacking. We decided to write a program in HTML to squeeze relevant metabolic information from the OGTT, using glucose and insulin measurements.
Materials and methods: We validated a new biochemical predictor of insulin resistance, the Percentual Relative Insulin Sensitivity (%RIS), which is a ratio between a given I0*G60 (JES, 2019; 3(6):1154) and the median I0*G60 value (530.4) of a reference population (312 NGT subjects with G120 values in the first 2 tertiles of the values of 468 NGT subjects). Additionally, we developed a parameter to estimate the beta-cell function, the Percentual Relative Beta-Cell Function (%RBCF), calculated as follows: [Insulinogenic Index /(I0*G60)] / 2.5. The 2.5 figure corresponds to the median value of the Disposition Index of the reference population. Our program requires 10 inputs (G0-G120 and I0-I120) and produces the following outputs: I0*G60, Matsuda’s ISI Composite, QUICKI, and HOMA (biochemical predictors), Insulinogenic Index, Disposition Index, %RBCF, and %RIS. Also, the program categorizes the OGTT (NGT, Prediabetes, and Diabetes).
Results: The program (see accompanying Figure) was written and executed under EXCEL and, subsequently, translated into HTML programming. An example (screen-shot) is provided below (complete version). We also developed an abbreviated version (four glucose and two insulin levels) and a minimal version (two glucose and one insulin levels) of the program to reduce costs.
Conclusion: We successfully developed the “OGTT squeezer” allowing the clinician to fully evaluate an OGTT at-a-glance.

Disclosure: P.H. Contreras: None.
327
Exploring islet amyloidosis in type 2 diabetes in metabolically profiled pancreatectomised surgical donors
M. Barovic1,2, K. Steinmeyer3, F. Burdet4, A. Forberger5, E. Schöniger1,2, D. Richter1,2, N. Kipke1,2, M. Ibberson4, D. Aust5, A. Schulte3, M. Solimena1,2;
1Molecular Diabetology, Paul Langerhans Institute Dresden (PLID), Helmholtz Center Munich, University Hospital and Faculty o, Dresden, Germany, 2German Center for Diabetes Research (DZD e.V.), Neuherberg, Germany, 3Sanofi Deutschland GmbH, Höchst, Germany, 4Vital-IT, Swiss Institute for Bioinformatics, Lausanne, Switzerland, 5Institute for Pathology, University Hospital and Faculty of Medicine Carl Gustav Carus, Dresden, Germany.
Background and aims: While the detrimental effects of amyloid plaques have been known and studied for decades, amyloid deposition in the islets of Langerhans is a phenomenon with elusive origins and unclear significance in the pathophysiology of type 2 diabetes mellitus (T2D). In our cohort of partially pancreatectomized patients (PPP) we quantified the occurrence of this pathological phenomenon and explored it in view of the demographic and clinical parameters pertaining T2D. A unique characteristic of our cohort is the ability to metabolically profile the patients and collect their clinical data preoperatively. This enables us to place each patient on the spectrum from non-diabetic (ND), across prediabetic states (impaired fasting glucose or impaired glucose tolerance (IFG/IGT)) and early pancreatogenic diabetes (T3cD) to overt T2D.
Materials and methods: Formalin fixed paraffin embedded pancreas sections were collected from 121 PPP. Amyloid plaques were detected using Thioflavin S histochemical stain and islets of Langerhans were identified using insulin and synaptophysin immunostaining. Quantification of islet amyloidosis was performed using a custom semi-automated ImageJ pipeline. Wilcoxon Rank Sum, Welch’s ANOVA, Levene’s and t-test were used on the R platform for statistical analysis.
Results: The cohort consisted of 18 ND, 39 IFG/IGT, 32 T3cD and 32 T2D cases. Aiming to examine at least 200 islets per patient, a total of 28344 islets were assessed for presence of amyloid plaques. We identified amyloid deposits in pancreatic sections of 76 (62.8%) patients. This relatively high number could be attributed to the composition of the cohort in relation to diabetes status as well as age distribution (65.35±11.69). Most affected were patients in the T2D group, with 81.3% amyloid deposits in their pancreatic sections, while in ND, IFG/IGT and T3cD groups 44.4%, 59% and 59.4% were affected, respectively. Welch’s ANOVA pointed out a significant difference in absolute numbers of affected islets across diabetes categories (F = 4.61, p = 0.01), which was identified between T3cD and T2D subjects by post-hoc testing (Benjamini-Yekutieli adjusted p = 0.03). Independent of categorization, HbA1c was found to be higher in patients with islet amyloidosis, while age, BMI and glycaemia at the 2h point of OGTT did not differ. Interestingly, in the ND group the patients affected by islet amyloidosis had higher HbA1c (5.42±0.12 vs 5.12±0.34, p = 0.02) and glycaemia at the 2h point of OGTT (6.79±0.64 vs 5.41±1.17, p = 0.01) than the unaffected ones.
Conclusion: Islet amyloidosis is present in prediabetic and early diabetic patients, as well as in ND. It correlates with glucose tolerance, but causality remains to be proven. Availability of laser capture microdissected islets from the same donors used in the present study will enable us to link islet amyloidosis to gene expression dysregulation, in an attempt to explain the significance of this phenomenon in onset and development of T2D.
Supported by: IMI 2 grant n° 115881(RHAPSODY); SERI contract number 16.0097
Disclosure: M. Barovic: Grants; Innovative Medicines Initiative 2 Joint Undertaking under grant agreement n° 115881(RHAPSODY).
328
Ethnic differences in the link between pancreatic fat and insulin secretion in white European and black African men
M. Ladwa1, O. Bello1, O. Hakim1, F. Shojaee-Moradie2, L. Boselli3, J. Peacock4, G. Charles-Edwards1, M. Umpleby2, R.C. Bonadonna5, S.A. Amiel1, L.M. Goff1;
1Faculty of Life Sciences and Medicine, King's College Hospital, London, UK, 2University of Surrey, Guildford, UK, 3University of Verona, Verona, Italy, 4King's College Hospital, London, UK, 5University of Parma, Parma, Italy.
Background and aims: It is proposed that pancreatic fat accumulation induces beta cell dysfunction due to local lipotoxic mechanisms. Black African (BA) populations are at a higher risk of type 2 diabetes compared with white European (WE) populations and demonstrate greater insulin secretory deficits in the presence of glucose intolerance. We aimed to investigate relationships between beta cell function and pancreatic fat in healthy BA and WE men.
Materials and methods: We assessed 23 WE and 23 BA men with normal glucose tolerance (NGT), matched for age and BMI, who underwent a 3-hour mixed meal tolerance test (MMTT) with C-peptide modelling to assess post-prandial insulin secretion and beta cell sensitivity to glucose. Subjects also underwent magnetic resonance imaging to quantify mean intrapancreatic lipid (IPL) and a hyperinsulinaemic-euglycaemic clamp to measure whole-body insulin sensitivity.
Results: There were no ethnic differences in mean IPL (BA vs WE: 6.33% (5.24, 7.65) vs 6.24% (5.11, 7.62), p=0.92) or beta cell sensitivity to glucose during either first phase (BA vs WE: 2.81 (2.08, 3.79) x103 vs 2.82 (2.18, 3.66) x103 [pmol m-2 BSA]/[mmol L-1 min-1], p =0.41) or second phase response (BA vs WE: 287.2 (211.3, 390.3) vs 214.3 (177.1, 259.4) [pmol min-1 m-2 BSA]/[mmol L-1], p = 0.25). There was no association between IPL and beta cell sensitivity to glucose, either within each ethnic group or across the whole cohort. IPL was inversely associated with whole-body insulin sensitivity (r=-0.681, p<0.001) and positively associated with total insulin secretion (r=0.588, p= 0.003) in the WE men, but no significant associations were found in the BA men.
Conclusion: We did not observe an association between beta cell function and IPL in either WE or BA men with NGT. However, there are ethnic differences in the relationships between pancreatic fat accumulation, insulin resistance and compensatory insulin secretory response. Pancreatic fat may play a lesser role in the metabolic dysfunction of BA populations and this may have implications for diabetes preventative and therapeutic strategies in this ethnic group.
Supported by: Diabetes UK (project grant 14/0004967)
Disclosure: M. Ladwa: None.
329
Novel 3-D spatiotemporal mathematical model proposed to explain type 2 diabetes pathogenesis and its phenotypes
S.N. Shinde;
Medicine, Academy of Continuing Medical Education & Research, Pune, India.
Background and aims: Analysis of OGTT glucose profiles was observed to follow a definite mathematical pattern which prompted to create this mathematical model.
Materials and methods: OGTT glucose profiles of 1350 individuals, not previously diagnosed having T2D, were analysed (age group: 15 - 80 years). Fasting plasma Glucose (FPG) was assigned as dependent variable & prandial plasma glucose (PPG) as main independent variable. Insulin resistance (IR), either genetic or acquired were considered as confounding variables. Excel® scatter chart of FPG & PPG values was plotted & a trendline (TLN) of scatter was obtained. GeoGebra® 3D graphing calculator & NCSS® were used to visualise, generate & superimpose the equations on data scatter to construct this model.
Results: Data scatter analysis revealed quadratic distribution with TLN regression equation (EQN), Y = 0.0008x^2 - 0.0135x + 88.163; R^2 = 0.8443 , p < 0.00001. wherein ‘x’ = PPG and constant ‘c’ = ‘y’ intercept. i.e. FPG(88.163 mg/dl). It was observed that Hepatic IR (hIR) raises FPG whereas peripheral IR (pIR) raises PPG. CSP & Muscle IR (mIR) lead to obesity but Adipose IR (aIR) resists obesity resulting in lean T2D. Ongoing calorie surplus (CSP) leads to saturation of peripheral glucose disposal mechanisms & increases PPG. This drives dysglycemia timeline, i.e. TLN, in ‘x-y’ plane 'temporally'. Ongoing CSP increases whole body IR with synchronous increase in BMI, FPG & PPG. This causes a vertical shift of data-points from ‘x-y’ plane along 'z' axis in 3-D space. This 'temporal' progression of data-points continues along TLN until PPG value of '200' is reached. This value, which defines T2D onset, also represents the maximum BMI value that begins to fall hereafter. The 'spatial' starting point (SSP) of TLN in 3-D space shifts as per the genetic IR mutations in either liver, muscle , adipose tissue or combinations thereof. hIR shifts SSP to left in x-y plane as per severity of mutation, by increasing EQN value by '% factor' (e.g. +20% ; FPG = 105.7). This leads to T2D phenotypes with FPG > PPG such as IFG, T2D with normal PPG & T2D with IGT. As per severity, pIR mutations shift SSP to right, by decreasing EQN value by '% factor' (e.g. -20% ; FPG = 70.5). This leads to T2D phenotypes with PPG > FPG such as IGT, T2D with normal FPG & T2D with IFG. Resultant equations were tested by superimposing on the data scatter. pIR has two subgroups, namely mIR & aIR. mIR shifts the SSP 'upwards' on z axis, e.g. +20%, resulting in obese T2D phenotype whereas aIR shifting SSP 'downwards' on z axis, e.g. -20%, results in lean T2D. Combination of hIR & pIR results in 'non-shifted' SSP but with higher FPG & PPG startup values and an overlap phenotype, i.e. 'IFG+IGT'. Hence, CSP leading to spatiotemporal progression of TLN curve, is the main T2D pathway, whereas genetic mutations generate accessory pathways that are spatially located 'around' the main pathway creating various T2D phenotypes.
Conclusion: This simple model explains the pathophysiology of most T2D phenotypes & will be useful in staging as well as planning personalized & precision therapy.

Disclosure: S.N. Shinde: None.
330
Altered HOXA5 epigenetic profile associates with restricted adipogenesis in healthy first-degree relatives of type 2 diabetes subjects
L. Parrillo1, R. Spinelli1, P. Florese1, A. Desiderio1, A. Leone1, A. Nicolò1, D. Conza1, G.A. Raciti1, U. Smith2, F. Beguinot1;
1URT Genomics of Diabetes-IEOS, CNR & Department of Translational Medicine – Federico II University, Naples, Italy, 2Lundberg Laboratory for Diabetes Research, Department of Molecular and Clinical Medicine, Sahlgrenska Academy, University of Gothenburg, Gothenburg, Sweden.
Background and aims: First-degree relatives (FDR) of individuals with type 2 diabetes (T2D) feature significantly larger subcutaneous adipose tissue (SAT) cells due to restricted adipogenesis and hypertrophy of pre-existing mature adipocytes, which render them more vulnerable to T2D. Epigenetics may contribute to these abnormalities. In the present work, we have been focusing on the HOXA5 transcription factor. Indeed, we have previously demonstrated that HOXA5 is implicated in the regulation of adipogenesis in mice and is sensitive to environment-induced epigenetic modifications. This study aims at investigating whether altered HOXA5 epigenetic regulation occurs in pre-adipocytes of FDR and may correlate to impaired SAT adipogenesis in these subjects.
Materials and methods: Pre-adipocytes from the stromal vascular fraction (SVF) of SAT and peripheral blood leukocytes (PBL) were obtained from 9 FDR and 11 control individuals (CTRL). Gene expression and DNA methylation were measured by qRT-PCR and bisulfite sequencing, respectively. Promoter activity was evaluated by luciferase assay. Specific siRNA was used to silence HOXA5 in differentiating human pre-adipocyte.
Results: The clinical characteristics of subjects in the study group are shown in Table 1. A significant reduction of HOXA5 expression was observed in pre-adipocytes from FDR individuals (p<0.05). Furthermore, the level of DNA methylation at the HOXA5 promoter was increased in pre-adipocytes of FDR vs. CTRL (p<0.05). Interestingly both HOXA5 gene expression and DNA methylation were significantly correlated with SAT adipose cell hypertrophy in FDR (p<0.05), where the increased adipose cell size is a marker of impaired adipogenesis and an independent predictor of T2D. Luciferase assay revealed that DNA methylation at HOXA5 promoter modulated its expression (p<0.01). More importantly, HOXA5 silencing in human pre-adipocytes impaired their differentiation into mature adipocytes, as shown by reduced adipogenic gene expression and decreased lipid droplet accumulation. Finally, the HOXA5 promoter region was significantly hypermethylated also in PBL from the same FDR individuals (p<0.01), indicating that PBL seems to be a convenient and easily accessible proxy of the pre-adipocyte epigenetic profile of this gene in FDR.
Conclusion: Our findings indicated a previously unrecognized role of HOXA5 in regulating/promoting human adipogenesis, and that the epigenetic regulation of HOXA5, which is also reflected in blood-borne DNA, may contribute to the SAT dysfunction and increase the FDR proclivity to develop T2D.

Supported by: COEPICA
Disclosure: L. Parrillo: None.
PS 12 Global aspects on the epidemiology of type 2 diabetes
331
HbA1c screening in 195,460 ‘non-diabetic’ individuals (40-69 years) identifies 1.1% with undiagnosed diabetes 2 years before clinical diagnosis
K.G. Young1, N.J. Thomas1,2, A.G. Jones1,2, A. McGovern1,2, B.M. Shields1, I. Barroso1, A.T. Hattersley1,3;
1College of Medicine and Health, University of Exeter, Exeter, 2Macleod Diabetes and Endocrine Centre, Royal Devon and Exeter NHS Foundation Trust, Exeter, 3Research and Development, Royal Devon and Exeter NHS Foundation Trust, Exeter, UK.
Background and aims: In the UK, Type 2 diabetes is predominantly diagnosed through HbA1c testing when patients are symptomatic or when they attend their GP practice for other reasons. This can result in a delay between diabetes onset and the start of treatment, increasing the risk of complications. Population-level screening could identify these cases earlier and so reduce complications. In UK Biobank, all participants were in effect screened for diabetes, as their HbA1cs were measured at recruitment, but results were not reported back to them or their healthcare professionals. We will aim to use this data to address two important questions: 1. How many additional people with diabetes can be identified by population screening using HbA1c? and 2. How much would screening reduce the time to receive a diagnosis of diabetes compared to present approaches?
Materials and methods: UK Biobank (UKBB) is a cohort of ~500,000 participants aged 40-69 at recruitment, with primary care records (clinical codes and prescription data) available for 221,530 (44%) participants. We defined participants without a diagnosis of diabetes at recruitment as those who: a) did not self-report diabetes; and b) had no indications of diabetes in their primary care records prior to recruitment (clinical codes for diabetes, HbA1c measurements ≥48 mmol/mol, or prescriptions for glucose lowering medication). Undiagnosed diabetes was defined as those with a UKBB HbA1c measurement ≥48 mmol/mol (following calibration of UKBB HbA1c measurements to align them with those in primary care records). For participants with undiagnosed diabetes, we found the time that it took to actually receive a clinical diagnosis in their primary care records (defined as the first of: a diagnosis code for diabetes, HbA1c ≥48 mmol/mol, or a prescription for glucose lowering medication).
Results: Of the 207,324 UKBB participants with primary care records available and an HbA1c measured at recruitment, 195,460 (94%) did not have a diagnosis of diabetes at recruitment (median (IQR) age 58 (50-64) years, median (IQR) BMI 26.7 (24.1-29.7) kg/m2, 44.3% male, median (IQR) HbA1c 37.2 (34.8-39.5) mmol/mol). 2,174 (1.1%) had undiagnosed diabetes on screening by HbA1c. Individuals with an HbA1c ≥48 mmol/mol on screening, compared to those with an HbA1c <48 mmol/mol, were older (61 (55-65) years vs 58 (50-63) years p<0.0001), more obese (BMI 30.7 (27.7-34.4) kg/m2 vs 26.6 (24.1-29.6) kg/m2, p<0.0001), and more frequently males (54% vs 44%, p<0.001). 1,831 (84%) of undiagnosed diabetes had primary care records covering the time period following recruitment to UKBB. Using survival analysis, the median time to clinical diagnosis was 2.3 years (IQR: 0.8-4.7 years) with 23% not diagnosed at 5 years follow-up.
Conclusion: We identified that screening by HbA1c would have identified 1.1% of a population aged 40-69 years as having undiagnosed diabetes. This screening diagnosis would have been ~2 years before a clinical diagnosis was made. 23% had still not received a diagnosis at 5 years. The identification of these patients for whom primary care records are available in UKBB gives us a unique opportunity to study the impact of this delay on the risk of developing complications in the future.
Supported by: EASD-Novo Nordisk Foundation Diabetes Prize for Excellence
Disclosure: K.G. Young: None.
332
Spousal concordance in pathophysiological mechanisms and risk factors for type 2 diabetes: a cross-sectional analysis of The Maastricht Study
O. Silverman-Retana1,2, S. Brinkhues3,4, A. Hulman2, C.D.A. Stehouwer3,5, N.H.T. Dukers-Muijrers3,6, R.K. Simmons1, H. Bosma3,7, S.J.P. Eussen8,9, A. Koster3,7, P.C. Dagnelie5,8, H.H.C. Savelberg10, N.C. Schaper3,5, D.R. Witte1,2, M.T. Schram5,8;
1Department of Public Health, Aarhus University, Aarhus, Denmark, 2Steno Diabetes Center Aarhus, Aarhus University Hospital, Aarhus, Denmark, 3Care and Public Health Research Institute (CAPHRI), Maastricht University, Maastricht, Netherlands, 4Department of Knowledge and Innovation, Public Health Service South Limburg, Heerlen, Netherlands, 5Department of Internal Medicine, Maastricht University Medical Centre+, Maastricht, Netherlands, 6Department of Sexual Health, Infectious Diseases, and the Environment, Public Health Service South Limburg, Heerlen, Netherlands, 7Department of Social Medicine, Maastricht University, Maastricht, Netherlands, 8Cardiovascular Research Institute Maastricht (CARIM), Maastricht University, Maastricht, Netherlands, 9Department of Epidemiology, Maastricht University, Maastricht, Netherlands, 10Department of Nutrition and Movement Sciences, NUTRIM, Maastricht University, Maastricht, Netherlands.
Background and aims: We compared the degree of spousal concordance in a set of detailed pathophysiological mechanisms and risk factors for type 2 diabetes to understand where in the causal cascade spousal similarities are most relevant
Materials and methods: We carried out a cross-sectional analysis of couples who participated in The Maastricht Study. We used quantile regression models to assess spousal concordance in pathophysiological mechanisms of type 2 diabetes, including beta cell function and insulin sensitivity. Risk factors included four adiposity measures, two dimensions of physical activity, sedentary time and two diet indicators. We additionally assessed glucose metabolism status using fasting and 2h plasma glucose and HbA1c
Results: Complete case analysis (n=172 couples) showed the strongest spousal concordance for the Dutch Healthy Diet Index (DHDI) for men, this means that a one unit increase in wives’ DHDI was associated with a 0.53 (95% CI 0.22, 0.67) unit difference in the men’s DHDI. For women the strongest concordance was for the time spent in high intensity physical activity (HPA); thus, a one unit increase in husbands’ time spent in HPA was associated with a 0.36 (95% CI 0.17, 0.64) unit difference in women’s time spent in HPA. The weakest spousal concordance was observed in beta cell function indices
Conclusion: Our results show with a high level of detail that spousal concordance was strongest in behavioural risk factors and that concordance weakend when moving downstream in the causal cascade leading to type 2 diabetes. From a practical point of view, public health prevention strategies to mitigate diabetes risk may benefit from spousal similarities in health-related behaviors and diabetes risk factors to design innovative and potentially more effective couple-based interventions

Supported by: EFSD Albert Renold Travel Fellowship Programme, Danish Diabetes Association, DDA, SDCA
Disclosure: O. Silverman-Retana: Employment/Consultancy; Steno Diabetes Center Aarhus. Grants; EFSD Albert Renold travel fellowship, Danish Diabetes Association travel fellowship.
333
The metabolic pathways between components of stature and HbA 1c : a causal structure learning approach in the UK Biobank
L.W. Johnston1, C. Wittenbecher2, H.T. Vistisen3, C.C. Dahm3, D.R. Witte1,3;
1Steno Diabetes Center Aarhus, Aarhus, Denmark, 2Harvard University, Boston, USA, 3Aarhus University, Aarhus, Denmark.
Background and aims: Shorter relative adult leg length (LL), a marker of adverse growth conditions during early childhood, is associated with a higher risk for type 2 diabetes. How this link is mediated metabolically is not well known in humans. Our aim was to identify how the components of stature influence the metabolic profile in adults and the consequent risk for type 2 diabetes through higher HbA1c.
Materials and methods: We used 367,838 participants (176,420 men, 191,418 women) from UK Biobank, excluding prevalent diabetes cases. We applied a causal structure learning algorithm (NetCoupler) to identify the most likely pathways between an exposure, a metabolic network, and an outcome. The algorithm: constructs an estimated network for the metabolic variables; iterates through each variable, linking it to either the exposure or outcome; and identifies links as potential direct effects that exist when independent of neighbouring variables in the network. For this study, we used height, LL, and leg-to-height ratio (LHR) as the individual exposures and HbA1c as the outcome. The metabolic variables chosen to form part of the network were: gamma-glutamyltransferase (GGT), alanine aminotransferase (ALT), aspartate aminotransferase (AST), TG, LDL, HDL, total cholesterol, C-reactive protein (CRP), apolipoprotein A and B, and albumin. Age, sex, and waist circumference adjustments were applied in the algorithm.
Results: The initial network generated from the metabolic variables identified links expected between metabolic variables (Figure), such as between HDL-LDL-Cholesterol-TG (serum lipid profile) and GGT-ALT-AST (liver function). A darker blue link indicates a positive relationship, while darker orange indicates a negative relationship. Between the metabolic network variables and HbA1c there were positive relationships between ALT, GGT, and CRP. For the stature components, there were negative relationships between: LHR, LL, and height on TG; LHR, LL on CRP and ALT; and, LL and height on GGT. There were positive relationships between: LL on HDL. Based on the NetCoupler algorithm, we found that LHR, LL, and height were likely causally linked with HbA1c through GGT, ALT, and CRP.
Conclusion: Our findings suggest that overall childhood growth conditions that result in relatively longer legs and a taller stature may confer some protection against dysregulation of glucose metabolism and possibly type 2 diabetes (from higher HbA1c) potentially through preserved liver function (through GGT and ALT) and through generally lower inflammation (via CRP).

Supported by: DDA Postdoctoral Grant
Disclosure: L.W. Johnston: None.
334
Heterogeneity of diabetes in young patients: diagnostic questions
I.V. Kononenko, A.Y. Mayorov, O.M. Schmidt, E.O. Koksharova, Z.A. Kalmykova, A.N. Tyulpakov, M.V. Shestakova;
Diabetes Institution, Endocrinology Research Centre, Moscow, Russian Federation.
Background and aims: Manifestation of diabetes mellitus (DM) at the age of 18-45 years causes difficulties in determining a type of DM, and further treatment. In this age group manifestation of both type 1 DM (T1DM) and type 2 DM (T2DM), as well as monogenic forms of DM is possible. Due to the increasing prevalence of obesity in young a subset of T1DM cases with manifestation in adulthood is relatively large, which makes the differences between T1DM and T2DM less distinguishable in recent decade. The aim of the study was to investigate the heterogenity and clinical features of various types of DM in young adult patients.
Materials and methods: We examined 58 patients at the age of 18-45 years (37.2 [18; 45]) with an unspecified type of DM. All patients were underwent a genetic testing for MODY: 27 genes were tested using NGS (GCK, HNF1α, HNF4α and others). Also we analyzed antibodies to β-cell antigens (GADA, IA-2A, ICA, IIA, ZnT8) and C-peptide levels during OGTT (0, 60 and 120 min) with the calculation of the HOMA-В and HOMA-IR indices in all patients. Ageof manifestation was 31.4 years [34; 45], duration - 6 years [1; 14]. Therapy at the time of the examination: 22.8% - diet, 59.7% - oral hypoglycemic agents, 17.5% - insulin therapy. НbА1с level was 6.8% [5.0; 11.8], BMI - 23.4 kg/m² [15.6; 35.1].
Results: Heterozygous mutations in GCK gene (MODY2) were detected in 39.7% of cases (n = 23), HNF1 gene (MODY3) - 10.3% (n = 6), HNF4α gene (MODY1) - in one patient. Antibodies to β-cell antigens were detected in 22.4% of cases. 8 patients (13,8%) were diagnosed with LADA provided the absence of an acute disease onset and good metabolic control with oral hypoglycemic agents for at least 6 months. 5 patients (8.6%) had remission of T1DM. T2DM was established in 14 patients (24,1%) with no mutations in the studied genes and no antibodies to β-cell antigens.Carbohydrate metabolism disorders in MODY2 and T1DM cases were diagnosed earlier than in other types of DM: 23 years [9; 41] and 25.4 years [18; 25] vs 30.5 years [10; 42] in patients with MODY3, 31.5 years [18; 45] with T2DM, 34.5 years [32; 45] with LADA (p <0.05). We did not observe significant differences in HbA1c levels and BMI between subgroups. C-peptide secretion levels were significantly lower in T2DM compared with other subgroups (p <0.05).
Conclusion: Our results demonstrate heterogeneity of DM in young adult patients. Patients with MODY2 made the largest share of the study group, which is probably associated with a targeted examination of patients with characteristic clinical signs of the disease to confirm the alleged diagnosis. Clinical differences between other types of DM in the study group were practically absent, which indicates the need genetic and immunological testing to verify the type of DM in adult young patients. Genetic and immunological tests are necessary to verify monogenic and autoimmune forms of DM. It is also important for further management . More studies are needed to identify mechanisms of impaired insulin secretion in young adult patients with T2DM.
Disclosure: I.V. Kononenko: None.
335
The effect of occupational position on aging trajectories of glycaemic measures in non-diabetic individuals: The Whitehall II study
A. Tabak, E.J. Brunner, M. Kivimaki;
University College London, London, UK.
Background and aims: Lower socioeconomic status and occupational position is associated with an increased risk of type 2 diabetes but little is known about the development of glycaemic traits in non-diabetic individuals. We compared age-related changes in glycaemic traits between non-diabetic British civil servants by occupational position at study baseline.
Materials and methods: In a prospective British occupational cohort with 2-5-yearly clinical examinations (n=6027, mean age 49±6 years at baseline) age-related trajectories of fasting and 2-h postload glucose (FG, PLG), homeostasis model assessment insulin sensitivity (HOMA2-%S) and insulin secretion (HOMA2-%B) were fitted for participants with high (administrative, n=2613) and low occupational position (professional/executive/ clerical/support) based on the employment grade at baseline.
Results: In sex-adjusted multilevel models FG was lower in the higher occupational position group (by 0.026 [SE 0.011] mmol/l at age 50) and increased minimally with age (0.03 [SE=0.01] mmol/l/decade) non-significantly faster in the lower occupational group (slope difference 0.013 [SE 0.007] mmol/l/decade). PLG was lower in the higher occupational grade group (by 0.086[SE=0.033] mmol/l at age 50) although their age-related trajectories were parallel (slope difference 0.038 [0.029] mmol/l/decade). Log transformed HOMA2-%S was higher (by 0.029 [SE=0.013] at age 50) and declined slower in the high occupational position group (by 0.024 [SE 0.008] /decade). HOMA2-%B was similar in the groups at age 50, however it increased slower in the high occupational position group (by 0.013 [SE=0.005]). These differences remained even after adjusting for obesity and lifestyle measures.
Conclusion: Findings from a diabetes-free population showed stable fasting and increasing postload glucose values with slightly higher baseline values in the lower occupational position group and parallel increases in both groups. In contrast, insulin sensitivity was lower and declined faster in the lower occupational position group. The higher and faster increasing HOMA2-%B values in this group show adequate compensation even in the lower occupational position group. Our results highlight that lower occupational position even in the absence of abnormal glycaemia is associated with deteriorating glucose metabolism.
Supported by: US NIA, BHF, UK MRC
Disclosure: A. Tabak: None.
336
Characterisation of novel subgroups of type 2 diabetes in the Ukrainian population
O. Fedotkina1, T. Ozgumus1, L. Cherviakova2, N. Khalimon3, T. Svietleisha4, T. Buldenko5, P.M. Nilsson6, V. Lyssenko1;
1Department of Clinical Science, Department of Clinical Science, Bergen, Norway, 2Department of Clinical Science, Chernihiv Regional Hospital, Chernihiv, Ukraine, 3City Hospital № 2, Chernihiv, Ukraine, 4City Hospital №1, Chernihiv, Ukraine, 5Department of Health Care of Chernihiv Regional State Administration, Chernihiv, Ukraine, 6Department of Clinical Sciences, Lund University Diabetes Center, Malmo, Sweden.
Background and aims: Type 2 diabetes (T2D) is a heterogeneous disease with a diverse clinical manifestation. A recent Scandinavian study proposed a novel classification of diabetes into five subgroups based on the disease pathophysiology and increased risk for macro- and microvascular complications.
Materials and methods: We performed analysis in T2D patients from the Diagnostic Optimization and Treatment of Diabetes and its Complications in Chernihiv Region (DOLCE) study, with absence of positive glutamic acid decarboxylase antibodies (GADA) and age-onset above 35 years. BMI, age at onset, HbA1c, homeostasis model assessment estimates of beta-cell function (HOMA2-B), and insulin resistance (HOMA2-IR) were used in the analysis. Diabetic retinopathy (DR) was defined as proliferative retinopathy, laser treatment, or blindness in either eye. Nephropathy was defined as eGFR less than 60, clinically documented diagnosis of nephropathy, dialysis, or end-stage renal disease. Neuropathy was defined as clinically diagnosed peripheral neuropathy. Cardiovascular diseases (CVD) were defined as history of myocardial infarction or stroke. Cluster analysis was performed using k-mean clustering on centered and scaled values.
Results: In total,1,853 DOLCE participants were analyzed. Ukrainian cohort was characterized by longer diabetes duration (6.46±6.6, years), younger age of onset (55 ±9.57, years), higher HbA1c (115.42±45.46, mmol/mol), lower c-peptide (0.95±0.46, nmol/l ), lower HOMA2-B (76.23±44.84), lower HOMA2-IR (2.44±1.21) as compared with the Scandinavian cohort (Ahlqvist et al., 2017). SIRD (severe insulin-deficient diabetes) cluster was nearly twice as prevalent in the DOLCE study including 28% of participants and was characterized by younger age at onset and lower HOMA2-B as compared to Scandinavian cohort. SIRD (severe insulin-resistant diabetes) cluster included 20% of participants and was characterized by highest HOMA2-IR, which was lower compared to the Scandinavian individuals. In the DOLCE study, MOD (mild obesity related diabetes) cluster, was less prevalent comprising 20% of participants and was different from the Scandinavian cohorts. Individuals in this cluster showed mild features of all three risk factors, i.e. obesity, insulin deficiency and insulin resistance. Characteristics and prevalence of MARD (mild age-related diabetes) cluster including 32% of participants were similar in both cohorts. SIDD cluster had the highest prevalence of severe DR (6.6%). Nephropathy was most prevalent in SIDD (37.7%) and SIRD (32.3%) clusters. Neuropathy prevalence was highest in the SIDD (86.1%) and SIRD (65.7%). CVD prevalence was similar between the clusters, being highest in MOD (10.3%) and MARD (9.8%).
Conclusion: These findings replicate presence of clusters defining different subgroups of diabetes. Ethnic specific differences, duration of diabetes and environmental factors may partially contribute to higher prevalence of nephropathy in the insulin deficient cluster.
Supported by: Swedish Research Council, the Novo Nordisk Foundation, Bergen Research Foundation, UiB
Disclosure: O. Fedotkina: None.
PS 13 Risk factors for type 2 diabetes
337
Risk of type 2 diabetes after hypertensive disorders of pregnancy: a systematic review and meta-analysis
G. Zhao1, D. Bhatia2, F. Jung1, L.L. Lipscombe2,3;
1Faculty of Medicine, University of Toronto, Toronto, 2Institute of Health Policy, Management and Evaluation, University of Toronto, Toronto, 3Women's College Research Institute, Women's College Hospital, Toronto, Canada.
Background and aims: This systematic review examined the risk of developing type 2 diabetes mellitus (T2DM) in women with a history of hypertensive disorders of pregnancy (HDP), including gestational hypertension (GH) and preeclampsia (PEC). We aimed to build upon currently inconclusive data to recommend timely opportunities for screening and prevention.
Materials and methods: A systematic search of MEDLINE, Embase, and CINAHL was performed from inception to February 17, 2020. Studies were excluded if participants had a history of gestational diabetes mellitus, pre-pregnancy diabetes, or chronic hypertension. Two independent reviewers screened each citation and results were abstracted. Study quality was assessed in duplicate using the Newcastle-Ottawa Scale (NOS). Random-effects models were used to pool risk estimates of T2DM risk in women with HDP relative to those without. Heterogeneity was assessed using the I2 statistic.
Results: 16 cohort and 4 case-control studies were included (HDP only n=8, PEC only n=5, GH and PEC n=7). Those 20 studies involved a total of 3,275,314 patients, with median follow-up of 11 (range 1-40) years after the index pregnancy. There was notable variability in study quality (median NOS score = 8, range 3-9). The risk of T2DM was significantly higher in women with a history of any HDP (HDP: hazard ratio [HR] 2.05, 95% confidence interval [CI] 1.64-2.55, I2=89%; GH: HR 2.19, CI 1.69-2.84, I2=87%; PEC: HR 2.56, CI 2.02-3.24, I2=94%; severe PEC: 3.05, CI 2.05-4.56, I2=82%), compared to those without. Women with HDP also developed T2DM earlier than those with normotensive pregnancies.
Conclusion: Women with HDP have an increased risk of developing T2DM later in life. A history of HDP should prompt clinicians to start screening women for T2DM early after delivery, to provide an opportunity for early behavioural interventions.
Disclosure: G. Zhao: None.
338
Serum regenerating protein I (REG I) joint risk factors scoring model for predicting new onset type 2 diabetes in China
N. Huang1,2, Y. Dai3, X. Su4;
1Endocrinology, Zhongda Hospital, Southeast University, Nanjing, Jiangsu, 2Pancreatic Research Institute, Southeast University, Nanjing, Jiangsu, 3Nanjing Foreign Language School, Nanjing, Jiangsu, 4Endocrinology, Changji Branch, First Affiliated Hospital of Xinjiang Medical University, Xinjiang, China.
Background and aims: Regenerating protein I (REG I) is a protein mostly secreted by pancreas and elevate during pancreatic diseases. Recently, our study revealed that REG I was elevated in high-risk and impaired glucose regulation patients, and significantly up-regulated in newly diagnosed type 2 diabetes mellitus (T2DM) patients.This study aimed to construct a new scoring model which consisted serum REG I and risk factors for predicting newly diagnosed T2DM.
Materials and methods: To develop a New Chinese Diabetes Risk Score for screening new onset T2DM, a total of 407 individuals from community hospital were incorporated in this study. These participants were randomly assigned as experimental samples and validation samples at a ratio of 3:2. The double antibody sandwich ELISA was used to detect serum REG I. The new onset T2DM was diagnosed by 2h-PBG, FBG and HbA1c. Non-parametric tests were performed to look for the group differences of serum REG I. Correlations between serum REG I and other factors were analyzed by Spearman’s rank correlation coefficient. A simple factor analysis was used to identify the baseline risk factors for T2DM. β-coefficients derived from a multiple logistic regression model predicting the presence of T2DM were used to calculate the new scoring model.
Results: Serum REG I level was significantly higher in new onset T2DM patients than healthy control (P=0.001). Serum REG I level was positively correlated with 2h-PBG, FBG, HbA1c and age (P<0.05). The cutoff value of serum REG I to predict T2DM was 29.76ng/ml. The area under the receiver operating curve (AUC) was 0.605 (0.534-0.676), which was better than the AUC of 2013 Chinese Diabetes Risk Score 0.564 (0.492-0.636). In order to improve the predictive capability, a new scoring model combined serum REG I with risk factors was established. The meaningful predictors in the model were serum REG I, sex, BMI, waist circumference, heart rate, systolic blood pressure and history of hyperlipidemia. The score ranges from 0 to 67. The AUC of the model for predicting T2DM was 0.780 (0.723-0.837) in experimental samples and 0.718 (0.639-0.797) in validation samples. At the optimal cutoff value of 17.50, the sensitivity and specificity of the model for predictingT2DM were 81.90% and 61.72% in experimental samples, and 82.09% and 56.25% in validation samples. This new scoring model was superior to the 2013 Chinese Diabetes Risk Score. Combining serum REG I with the diabetes risk score improves the predictive ability in both experimental samples and validation samples.
Conclusion: The new scoring model based on serum REG I and risk factors is a screening tool to predict new onset T2DM in China.
Clinical Trial Registration Number: 2018ZDSYLL143
Supported by: NSFC (No. 81570739 and 81970717); KR&D program of Jiangsu Province (No. BE2018742)
Disclosure: N. Huang: None.
339
Epidemiology of diabetes in Russian Federation: What has changed over 2007-2019 yr?
M. Shestakova, O. Vikulova, A. Zheleznyakova, M. Isakov, I. Dedov;
Endocrinology Research Center, Moscow, Russian Federation.
Background and aims: Epidemiological monitoring of diabetes mellitus (DM) in Russian Federation (RF) founded since 1996 through the national diabetes registry, carried on online format since 2014. Nowadays it works as the unified dynamic database that provide DM data from the whole country. The aim of our study was to access the prevalence and dynamics of DM and diabetes-related complications during the last decade 2007-2019 yr.
Materials and methods: The object of the study analysis was the depersonalized database of the national diabetes registry of RF with more than 4630 clinics of primary care data (uploaded until 01/01/2020).
Results: The total number of registered DM patients in RF at 01.01.2020 was 4752585 (3,2% of the population), including 261 thousand patients with type 1 (T1), 4,4 million with type 2 (T2) and 96,5 thousand with other DM types, that reflects the growth in 2,3 times since 2000 yr, with annual increase by 250-320 thousand patients. There were about 11 and 315 thousands of new cases in T1 and T2 patients revealed, respectively. Gender distribution M/F in T1: 54/46%; in T2: 29,7/70,3%. The current HbA1c reported annually in 59% and 52% of patients with T1 and T2, respectively, with proportion of patients reached the target level <7% in 2019: T1 - 35,5%: T2 - 52,3%. Data of complications prevalence in 2019 among T1/T2 patients were: for diabetic retinopathy (DR) 31,4%/ 13,5%; chronic kidney disease (CKD) - 23,2%/15,1%, neuropathy 42,5%/23,5%; diabetic foot (DF) - 3,5%/1,6%; amputations - 1,1%/0,7%; myocardial infarction (MI) - 1%/3,3%, CHD - 2,7%/10,1%. We observed decrease in the frequencies of diabetes-related complications compared with 2007 year in T1/T2 patients, respectively: ketoacidotic coma in 1,7/3,3 times, blindness in 2,5/4,6, DF in 1,8/3,2 times, CKD in 1,4/1,2 times, MI in 5,7/2,3 times, cerebrovascular disease in 3,8/1,9 times (see the graph).
Conclusion: Despite the continued increase in the number of DM patients, significant achievements have been made in the management of diabetes in RF over the past decade. There is a significant improvement in the quality of diagnostics and decrease of complications frequency. The priority remains the development of specialized diabetes care to standardization of screening algorithms and the early methods of diagnostics.

Supported by: Funded by the Russian Ministry of Health
Disclosure: M. Shestakova: None.
340
Haemoglobin glycation index is associated with incident type 2 diabetes in healthy subjects
H. Kim1, J. Lee1, Y. Cho2, W. Lee1, C. Jung1, J.-Y. Park1, J. Kang2, C.-Y. Park3;
1Internal Medicine, Asan Medical Center, Seoul, 2Internal Medicine, Hallym University Sacred Heart Hospital, Seoul, 3Internal Medicine, Kangbuk Samsung Hospital, Seoul, Republic of Korea.
Background and aims: The hemoglobin glycation index (HGI) quantifies interindividual variations in glycated hemoglobin (HbA1c) and is associated with diabetic complications and metabolic diseases. However, information on the association between HGI and incident diabetes mellitus (DM) in healthy subjects is limited. This study aimed to investigate the association between HGI and incident DM in a healthy Korean population.
Materials and methods: The study population consisted of 42,059 people without type 2 DM who underwent routine health examinations at Asan Medical Center in Korea from 2007 to 2013. HGI was defined as the difference between measured HbA1c and estimated HbA1c. The participants were stratified in quartiles according to their baseline and follow-up HGI. Multiple logistic regression analysis was performed to evaluate the association between HGI quartiles and incident DM.
Results: Of 42,059 participants, 850 developed type 2 DM during follow-up. HGI was significantly higher in DM developers than non-developers. The incidence of DM increased with the HGI quartile (0.4%, 0.9% 1.2% and 5.6% in the 1st, 2nd, 3rd and 4th HGI quartiles, respectively; p < 0.001). In the Cox proportional hazards model, the hazard ratio (95% confidence interval) for DM incidence was 13.042 (9.348-18.196) in the highest HGI quartile group, after adjustment for other confounding factors. Furthermore, when considering the changes in HGI, the subjects who had consistently high HGI (high-to-high group) were at significantly increased risk of incident DM (hazard ratio, 10.123; 95% confidence interval 7.233-14.170).
Conclusion: Elevated baseline and follow-up HGI levels are associated with incident type 2 diabetes mellitus in a healthy Korean population.
Disclosure: H. Kim: None.
341
Contribution of rare and common genetic variants to early-onset type 2 diabetes
S. Pezzilli1, M. Tohidirad1,2, T. Biagini1, F. Alberico1, L. Mercuri1, M.G. Scarale1, M. Garofolo3, G.C. Mannino4, T. Filardi2, F. Andreozzi4, T. Mazza1, Study on Early-onset Type 2 diabetes (SET2) group, S. Prudente1;
1Fondazione IRCCS Casa Sollievo della Sofferenza, San Giovanni Rotondo, 2Sapienza University, Rome, 3University of Pisa, Pisa, Italy, 4University "Magna Graecia" of Catanzaro, Catanzaro, Italy.
Background and aims: Early-onset type 2 diabetes (T2D) shows a more aggressive metabolic phenotype and both higher risk of chronic diabetes complications and premature mortality as compared to the usual T2D diagnosed in middle-aged patients. Unfortunately, the intrinsic pathogenic signatures of early-onset T2D are not completely understood. While there are several strong evidences on the contribution provided by worse behavioral and environmental risk factors, data on the genetic background are sparse and inconclusive. Both rare and common genetic variants play a role on the risk of T2D, but their contribution in shaping the age of diabetes onset is still unknown. Thus, we sought to investigate whether rare deleterious variants in monogenic diabetes-genes and/or common T2D susceptibility SNPs play a role in determining the risk of early-onset T2D.
Materials and methods: By using the extreme-phenotype approach, 600 individuals with age at diabetes onset <35 (n=300, cases) or >65 (n=300, controls) years, as selected among 9,700 Italian patients, were investigated. All 600 DNAs were subjected to targeted resequencing of 27 monogenic diabetes-genes and to genotyping of 22 GWAS-derived T2D-SNPs then used to create an un-weighted genetic risk score (GRS).
Results: Rare (i.e. minor allele frequency, MAF <1%) and possibly deleterious (i.e. with an estimated impact on protein function) alleles (n=51, carried by 47 individuals) from 27 monogenic diabetes genes significantly (p=0.014) increased by 71% the risk of early-onset type 2 diabetes. A progressively stronger association was observed for progressively rarer variants (OR, 95% CI =2.1, 1.2-3.7, p=0.014; 2.5, 1.7-5.2 p=0.018; and 6.5, 1.9-22.1, p=0.003 for MAF <0.1%, <0.01% and <0.001%, respectively). A similar, though less pronounced, trend was observed when MODY-causing mutations (n=8, as previously reported in HGMD) were excluded, with variants with MAF <0.001% being still associated with early-onset T2D (OR, 95% CI=4.8, 1.4-16.9 p=0.01). Additionally, each allele of a GRS including 22 susceptibility SNPs for T2D increased the risk of early diabetes by 20% (p<0.001). When the 600 study subjects were sub-grouped according to the two different geographical regions of recruitment, 324 subjects (182 cases vs. 142 controls) from Central-Southern Italy and 276 (118 vs. 158) from the Rome urban area, a similar association with early-onset T2D for both rare variants and GRS was observed, with no evidence of heterogeneity between the two subgroups (data not shown), thus providing an internal validation of our findings.
Conclusion: Our data show for the first time a sizeable influence of both rare and possibly deleterious variants in monogenic-diabetes genes and of common T2D susceptibility variants in increasing the risk of early-onset T2D. Genetic information can help predict people at higher risk and, therefore, try to prevent/delay the onset of T2D.
Supported by: Italian Diabetology Society (SID); Italian Ministry of Health; Sapienza University of Rome
Disclosure: S. Pezzilli: None.
342
Daily heat exposure for type 2 diabetes
H. Katsuyama1, M. Hakoshima1, Y. Masui2, H. Adachi1, A. Sako2, S. Inokuma3, H. Yanai1;
1Department of Diabetes, Endocrinology and Metabolism, Kohnodai Hospital, Ichikawa, Chiba, 2Department of Internal Medicine, Kohnodai Hospital, Ichikawa, Chiba, 3Department of Rheumatology, Kohnodai Hospital, Ichikawa, Chiba, Japan.
Background and aims: Previous studies suggested that heat therapy, such as sauna and hot-tub bathing, improved glycemia and adiposity, and, thus, could be a therapeutic tool in the daily life for type 2 diabetes (T2D). However, there were no studies using a lot of patients which examined effects of hot-tub bathing on metabolic parameters in patients with T2D in the real-world setting. In Japan, most residences are fitted with a hot-tub and hot-tub bathing is a traditional and common life habit. Thus, we studied the influences of hot-tub bathing in Japanese patients with T2D.
Materials and methods: We obtained the information on the habits of hot-tub bathing by using a questionnaire from 1,297 patients with type 2 diabetes, who regularly visited the outpatient unit of our hospital between October 2018 and March 2019, and studied the association of frequency of hot-tub bathing with anthropometric measurements and blood test. The patients were divided into three groups according to the frequency of hot-tub bathing as follows; group 1: ≥4, group 2: <4, ≥1, group 3: < 1. The differences between the three groups were examined using one-way analysis of variance (ANOVA) and Tukey's multiple comparison test. Multiple linear regression analysis was used to identify the predictors included in multivariable analysis.
Results: The mean frequency of hot-tub bathing was 4.2 ± 2.7 times a week and the duration of bathing was 16 ± 14 minutes. Body weight, body mass index (BMI), waist circumference, diastolic blood pressure as well as glycated hemoglobin were significantly lower in the order of group 1, group 2 and group 3 (Table 1). Multiple regression analysis identified the frequency of hot-tub bathing as a significant determinant of glycated hemoglobin after adjusting by age, sex, BMI, insulin use and the number of oral hypoglycemic agents. The frequency of hot-tub bathing was also an independent determinant of BMI after adjusting sex and age, as well as diastolic blood pressure after adjusting age, sex and the number of antihypertensive agents.
Conclusion: Our results indicate that daily heat exposure through hot-tub bathing has beneficial influences on cardiovascular risk factors in patients with T2D.

Clinical Trial Registration Number: UMIN000035930
Disclosure: H. Katsuyama: None.
PS 14 Prevalence of type 2 diabetes around the world
343
Characteristics of people with type 2 diabetes newly initiated with basal insulin therapy: a population-based study using CPRD
M. Adan1, S. Seidu1,2, F. Zaccardi1,2, K. Khunti1,2, D. Webb1,2, C. Gillies1, M. Davies1,2, R. Lubwama3, A. Boss3, T. Dex3;
1Health Sciences, University of Leicester, Leicester, UK, 2Leicester General Hospital NHS Trust, Diabetes Research Centre, Leicester, UK, 3Sanofi, New Jersey, USA.
Background and aims: Intensive glycemic control in people with type 2 diabetes (T2DM) has been shown to reduce the risk of long-term complications. Intensive treatment often includes initiation of insulin; however, many barriers have been reported to initiate insulin therapy in clinical practice and little is still known about the characteristics of patients with T2DM initiated insulin therapy in a UK real world primary care setting. This study aimed to determine the socio-demographic, clinical characteristics, and prescribing patterns of people with T2DM newly initiated on basal insulin in primary care.
Materials and methods: This cross-sectional study used the UK primary care database - Clinical Practice Research Datalink (CPRD) - to identify adults diagnosed with T2DM initiated on basal insulin from January 2004 to December 2016. Patients had to be continuously registered in the database at least ≥ 12 months before and after the index-date (start of basal therapy) and were 18-years of age or over at the index-date. Demographic and clinical data were collated at or prior to index-date. Patients’ glycemic measurements were collected at baseline and at 6 and 12-months follow up. Poor glycemic control was defined as HbA1c ≥53mmol/mol (≥7%).
Results: A total of n=13,811 patients were included in the study. Patients had mean age ± SD of 64.90 ± 12.88 years, with a median T2DM duration of 8 years (IQR, 4-12). Most patients were male (55.43%) and 37.39% had their first insulin therapy ≥10 years after T2DM diagnosis. The median glycated haemoglobin at basal insulin initiation was 82.7mmol/mol [9.72%] (IQR, 70.5-98.0 mmol/mol; 8.60-11.12%) while decreasing to 66.1mmol/mol [8.20%] (IQR, 57.2-79.1mmol/mol, 7.38-9.39%) at 12-months after insulin initiation. The average Charlson comorbidity index-score was 2.90±2.26 and 35.26% had ≥2 chronic comorbidities prior to basal insulin therapy. Neuropathy, hypertension, renal disease, ischaemic heart disease and depression were the most common co-morbidities and present in 87.15%, 25.26%, 16.41%, 9.81% and 18.03% of patients, respectively. Overall, 87.0% (n=12,029) of patients had a record use of prior OADs (oral antihyperglycemic drugs), with 61.94% receiving two or more OAD’s prior to insulin therapy. Of those receiving OAD therapy, sulfonylureas (59.42%), biguanide (53.59%) and thiazolidinedione (41.34%) agents were most commonly prescribed. A large proportion of the study population were also on antiplatelet, antihypertensive and lipid-lowering drugs prior to initial insulin use.
Conclusion: T2DM patients newly initiating basal insulin were mostly middle-aged-to-older men with multiple co-morbidities. These patients also had long duration of diabetes, diabetes related complications as well as poor glycemic control both before and following insulin treatment. These characteristics suggest that early and appropriate use of insulin therapy is essential in achieving glycemic goals and therefore reducing the long-term risk of complications.
Supported by: Sanofi Ltd
Disclosure: M. Adan: None.
344
Mapping diabetes in Greece: results from a real-world study
L. Daflla1,2, K.-A. Poulia3, J. Doupis4, J. Yfantopoulos5;
1Greek National Organization for Health Care Provision – EOPYY, Maroussi, 2Department of Geography, School of Environment, Geography and Applied Economics, Harokopio University, Athens, 3Department of Nutrition, General Hospital of Athens Laiko, Athens, 4Department of Internal Medicine and Diabetes, Salamis Naval and Veterans Hospital, Salamis Naval Base, 18900 Salamis, Salamis, 5Department of Economics, Health Economics, National and Kapodistrian University, Athens, Greece.
Background and aims: Diabetes Mellitus (DM) is a non-communicable chronic disease with continually growing prevalence. Geospatial Data for the distribution of the DM patients in Greece are scarce. The aim of the study was to investigate the prevalence of DM in the Greek population, by gender and by geographical region using geospatial data, in order to identify and map the areas with higher prevalence, exploring also the possible existence of spatial clusters of areas with higher prevalence of DM.
Materials and methods: Data were collected from the DM registry of the Greek National Organization for Health Care Provision - EOPYY (including 581.526 patients with all types of diabetes - based on the Unique National Insurance Numbers) subscribed from 21 January 2019 to 21 January 2020 and were correlated with the geospatial data of the Greek Prefectures (NUTS 3 level), leveraging Geographical Information Systems- GIS. Data regarding DM Type 1 (T1DM), DM Type 2 (T2DM) and Gestational DM were analyzed by sex and age, and thematic maps were developed.
Results: The analysis of our data suggested that the prevalence of DM in the Greek population is 55 patients per 1000 people (5,38% of the total population). The regions of Chios and Lesvos islands, as well as Serres, Trikala, Argolis, Drama, Kavala and Evros prefectures appeared to have high prevalence compare to the prevalence of the total population (70, 65, 70, 65, 65, 63, 62 and 62 per 1000 population respectively). A small difference among sexes was identified (52 patients/ 1000 women vs 54 patients/1000 men respectively). Higher prevalence was noted in ages≥75 years (21.3% of the population) especially in men of this age group (24% of men vs 21% of women). In the population of the study 93% of the patients had T2DM, 6% had T1DM and 1% Gestational DM
Conclusion: This is, to our knowledge, the first time that real-world data, for the prevalence of DM in Greece, are geospatially presented. According to our data DM was found to affect 55 per 1000 people in the Greek population (5.38% of the total population). Northern Greece presents a significantly higher prevalence of DM in mainland and insular prefectures compared with the rest of the country. This statistically significant clustering of T2DM in the Northern Greece would require further investigation in order to identify possible modifiable risk factors for the better control of DM and its complications.
Disclosure: L. Daflla: None.
345
Prevalence of dysglycaemia-based chronic diasease (DBCD) in Brno, Czech Republic: a new paradigm to address diabetes burden. The Kardiovize study
J.P. Gonzalez-Rivas1,2, J.I. Mechanick3, M.M. Infante-Garcia4, J.R. Medina-Inojosa5, I. Pavlovka1,6, O. Hlinomaz1, P. Zak7, S. Kunzova1, R. Nieto-Martinez2,8, M. Skladaná1, J. Brož9, J.P. Hernandez1, F. Lopez-Jimenez5, G.B. Stokin1;
1International Clinical Research Center (ICRC), St Anne’s University Hospital (FNUSA), Brno, Czech Republic, 2Department of Global Health and Population, Harvard TH Chan School of Public Health. Harvard University, Boston, USA, 3Divisions of Cardiology and Endocrinology, Diabetes and Bone Disease, Icahn School of Medicine at Mount Sinai, USA, 4Foundation for Clinic, Public Health, and Epidemiological Research of Venezuela (FISPEVEN), Caracas, Venezuela, Bolivarian Republic of, 5Preventive Cardiology, Mayo Clinic, Mayo Clinic, Rochester, USA, 6Public Health, Faculty of Medicine, Masaryk University, Brno, Czech Republic, 7St Anne’s University Hospital (FNUSA), Brno, Czech Republic, 8LifeDoc Diabetes and Obesity Clinic, Memphis, USA, 9Internal Medicine, Second Faculty of Medicine, Charles University, Prague, Czech Republic.
Background and aims: In contrast to the decreasing mortality rates observed with cardiovascular disease (CVD), mortality rates with diabetes increased by 68% in Czechia, in the last decade. The American Association of Clinical Endocrinologists developed a new framework termed Dysglycemia-Based Chronic Disease (DBCD), a multi-morbidity care model consisting of 4 distinct stages along the insulin resistance-prediabetes-type 2 diabetes (T2D)-CVD spectrum, prompting a complication-centric, rather than a glucocentric approach. This paper presents the prevalence rates and associated risk factors of each DBCD stage
Materials and methods: Subjects aged 25 to 64 years from a random population-based sample were evaluated in Brno, Czechia, between 2013-2014. DBCD categories were: Stage 1 “Insulin Resistance” (abdominal obesity or family history of diabetes); Stage 2 “Prediabetes” (fasting glucose between 5.6 to 6.9 mmol/L); Stage 3 “T2D” (history of T2D or fasting glucose ≥ 7 mmol/L); and Stage 4 “Vascular Complications” (T2D with CVD). Binary logistic regression analysis was performed to assess risk factors associated with DBCD with normal as reference.
Results: 2147 subjects were included (57.8% women), median age of 48 (IQR =19) years. Prevalence of DBCD stages were 54.2% (Stage 1); 10.3% (Stage 2), 3.7% (Stage 3); and 1.2% (Stage 4). Stages 2 to 4 were higher in men, and stage 1 was higher in women (p < 0.001). All stages increased with age (p < 0.001). Risk factors associated to DBCD are presented in Table.
Conclusion: Using the new DBCD framework, 69.4% of the population presented DBCD. All DBCD stages were associated with traditional cardiometabolic risk factors, implicating common pathophysiological mechanisms and the potential for early preventive care. In an alarming proportion, social determinants of health (lower education and middle-low income) were related with all DBCD stages, exposing severe health inequalities in this population that may represent targetable drivers.

Supported by: the European Regional Development Fund – Project FNUSAICRC [no. CZ.1.05/1.1.00/02.0123], by project
Disclosure: J.P. Gonzalez-Rivas: None.
346
Fatty liver index as predictor for the risk of type 2 diabetes in normoglycaemic subjects: the Di@bet.es study
E. Garcia Escobar1,2, S. Valdés1,2, F. Soriguer3, A. Lago-Sampedro1,2, S. García-Serrano1,2, N. Colomo1,2, C. Maldonado1,2, L. Castaño1, E. Delgado1, J. Franch-Nadal1, F.-J. Cháves1, A. Calle1, G. Rojo-Martínez1,2;
1Spanish Biomedical Research Network (CIBER), Madrid, 2Endocrinology and Nutrition Department, Regional University Hospital of Malaga, Biomedical Research Institute of Malaga (IBIMA), Málaga, 3Science Academy of Malaga, Madrid, Spain.
Background and aims: It is unclear whether fatty liver index (FLI), a surrogate marker for liver steatosis, is associated with the development of type 2 diabetes (T2DM) in normoglycemic subjects. The aim of the study was to evaluate whether FLI is associated with the risk of T2DM development after 7.5 years in the Spanish adult population according to the prediabetic status and examine the incremental predictive value of FLI compared with traditional risk factors.
Materials and methods: Design: Population based cohort study with a 7.5 years follow-up. The study has been reviewed by the Local Ethics Committee and it has been performed in accordance with the Helsinki Declaration. Sample: 2260 subjects without T2DM at baseline with FLI data available (1619 normoglycemic and 641 prediabetic subjects). Variables: Socio-demographic, anthropometric and clinical data and survey on habits were recorder. A fasting blood draw and an oral glucose tolerance test were performed. Serum determinations of glucose, lipids and insulin were made. HOMA index was calculated. FLI was calculated and classified into three categories: Low FLI (FLI<30: no steatosis), Intermediate (FLI 30-60) and High FLI (FLI >60: steatosis). The association between FLI and T2DM incidence in the follow-up was evaluated using Poisson robust regression models adjusted by confounding variables (age, sex, plus fasting glucose level and family T2DM background; HOMA index; serum lipids; or life style habits including alcohol consumption and physical activity). Net reclassification improvement (NRI) and integrated discrimination index (IDI) were used to examine the incremental predictive value of FLI categories in diagnosing incident T2DM.
Results: 143 people developed diabetes at follow-up, among them 106 had prediabetes at baseline. The proportions of subjects with high FLI who develop diabetes were 68.5% in the general population and 73.6% and 54.0% in the group with and without prediabetes, respectively. High_FLI category was in all cases a significant independent risk factor in overall population independently of the model adjustment (e.g. 2.98[1.71-5.20] adjusted by sex, age, background of T2DM and fasting glucose levels; and 2.71[1.35-5.44] adjusted by sex, age and HOMA index). After split the population according to the prediabetes status the associations disappeared in normoglycemic subjects when HOMA index was included in the model (1.91[0.37-9.91] in normoglycemic subjects; 2.20[1.06-4.55] in prediabetic subjects). The inclusion of FLI categories in models based on the conventional T2DM risk factors (age, sex, fasting glucose levels, background of T2DM and HOMA index) did not provide significant increment in the prediction power in the splited groups (p values for IDI and NRI not significant).
Conclusion: FLI may be considered an early indicator of T2DM in the Spanish general population and subjects with prediabetes, but also in normoglycemic subjects except when insulin resistance is considered. However, in our study FLI levels do not seem to provide additional information for the prediction of future T2DM beyond the conventional risk factors.
Clinical Trial Registration Number: NCT02542735
Supported by: PI14/00710 (ISCIII, FEDER, EU)
Disclosure: E. Garcia Escobar: None.
347
Relationship between vascular endothelium growth factor b levels and metabolic syndrome in the Di@bet.es study: preliminary results
S. Garcia Serrano1,2, A. Lago-Sampedro1,2, S. Valdés1,2, N. Colomo1,2, C. Maldonado1,2, F. Soriguer3, G. Rojo-Martínez1,2;
1Biomedical Research Institute of Malaga (IBIMA), Endocrinology and Nutrition Department, Regional University Hospital of Malaga, Malaga, 2Spanish Biomedical Research Network (CIBER), Malaga, 3Science Academy of Malaga, Malaga, Spain.
Background and aims: Several studies reveal that vascular endothelial grown factor b (VEGFb) has an important role in lipid transport and energy metabolism regulation. This fact might have an impact on diabetes, obesity and related metabolic complications; however, clinical evidences regarding circulating levels of VEGFb in subjects with metabolic syndrome (MS) are conflicting and scarce. Aim: to evaluate the association between VEGFb serum levels and the presence of MS and its individual components in the Spanish adult population.
Materials and methods: Design: Population based in a cross-sectional study. Sample: 5072 adults randomly selected from all over Spain. Studied variables: A fasting blood draw and an oral glucose tolerance test were performed. Serum determinations of glucose, lipids and insulin were made. The study was reviewed by the Local Ethics Committee and performed in accordance with the Ethical Helsinki Declaration Guidelines. Serum VEGFb levels were determined by ELISA kit in a random sample of 916 subjects. VEGFb levels were categorised in 4 groups according to the variable quartiles (C1: VEGFb levels<=43.40 μg/ml, C2: VEGFb levels 43.40-57.04 μg/ml, C3: VEGFb levels 57.04-73.25 μg/ml, and C4: VEGFb levels >73.25 μg/ml). The presence of MS and its individual components were defined according to the IDF criteria. Association between VEGFb levels and the presence of both MS and its components was tested by logistic regression models adjusted by sex and age.
Results: Among the 916 studied subjects, 376 had MS. Those subjects with MS showed higher VEGFb levels than subjects without MS (VEGFb_MS: 67.99±28.68μg/ml, VEGFb_noMS: 56.13±23.59 μg/ml; p<0.0001). Age and gender of subjects were different according to the VEGFb categories (C1: 44.73±14.03 years; C2: 46.37±15.55 years; C3: 49.32±14.37 years and C4: 54.8±15.87 years. p<0.0001. C1: 34.5% men; C2: 41.5% men; C3: 46.3% men y C4: 51.1% men, p<0.001). Logistic regression analysis for the likelihood of having MS according to the VEGFb categories showed that subjects with VEGFb levels over the first quartile had significantly increased likelihood of presenting MS (C2: 1.70[1.12-2.58]; C3: 2.26[1.50-3.42]; C4: 2.15[1.41-3.27]), with a significant trend to increase this likelihood with subsequently higher VEGFb serum levels (p for trend < 0.0001). Similar results were found evaluating the association between VEGFb levels and the presence of the MS individual components abdominal obesity (C2: 1.61[1.07-2.40]; C3: 1.53[1.02-2.29]; C4: 2.21[1.43-3.43]. p for trend = 0.001), hypertriglyceridemia (C2: 2.17[1.31-3.59]; C3: 2.82[1.72-4.62]; C4: 2,44[1.48-4.04]. p for trend < 0.0001) and low hdl cholesterol levels (C2: 1.46[0.98-2.18]; C3: 2.21[1.50-3.28]; C4: 2.04[1.35-3.06]. p for trend < 0.0001).
Conclusion: Our preliminary data show that increased VEGFb serum levels are associated with the presence of MS as well as with the presence of the lipid components of the MS and abdominal obesity in the Spanish adult population.
Clinical Trial Registration Number: NCT02542735
Supported by: PI18/01168-PI14/00710 (ISCIII, FEDER, EU)
Disclosure: S. Garcia Serrano: None.
348
Effectiveness of a female community health volunteers-led lifestyle intervention in blood glucose reduction among adults with type 2 diabetes: a cluster-randomised trial
B. Gyawali1, R. Sharma2, S.R. Mishra3, D. Neupane4, A. Vaidya5, A. Sandbæk6, P. Kallestrup7;
1University of Copenhagen, Copenhagen, Denmark, 2Macquarie University Centre for the Health Economy (MUCHE), Sydney, Australia, 3Nepal Development Society, Bharatpur, Nepal, 4Welch Center for Prevention, Epidemiology, and Clinical Research Johns Hopkins Bloomberg School of Public Health, Baltimore, USA, 5Kathmandu Medical College and Teaching Hospital, Kathmandu, Nepal, 6Steno Diabetes Centre, Aarhus, Denmark, 7Aarhus University, Aarhus, Denmark.
Background and aims: Type 2 diabetes, which is characterized by elevated blood glucose level is a growing problem in many low-and middle-income countries. We aimed to assess the effectiveness of an intervention delivered by Female Community Health Volunteers (FCHVs) of Nepal’s Ministry of Health to lower blood glucose level.
Materials and methods: We carried out an open-level cluster-randomized controlled trial in a semi-urban area of Nepal. Using computer-generated randomization sequence, we randomly assigned clusters (1:1) to the intervention group, which received a 12-month intervention delivered by female community health volunteers (FCHVs) or control (usual care). In the intervention group, 20 FCHVs provided home visits every four months for health promotion counselling and blood glucose monitoring. If participants had elevated blood glucose levels, FCHVs referred the participant to the nearest health facility, and if on antidiabetic medication, were also followed up for adherence to their medication during the FCHV visit. Eligible participants were those who had been involved in a previous community-based prevalence survey, were aged 25-65 years, had a fasting blood glucose level of 7 mmol/l or higher, did not have plans to migrate outside the study area for at least 12 months, and were not severely ill or pregnant. The primary outcome was the difference in mean change in fasting blood glucose level between the intervention and control group. We included all participants who remained in the trial at 12 months in the primary analysis.
Results: We recruited 14 clusters and 244 participants between November 2016 and April 2017. At 12 months, 107 of 127 participants remained in the intervention group and 105 of 117 remained in the control group. At baseline, the mean fasting blood glucose was 8·73 mmol/l in the intervention group and 8·51 mmol/l in the control group. The mean fasting blood glucose at 12 months decreased by 1.27 mmol/l (to 7.46 mmol/l) in the intervention group and increased by 0.41 mmol/l (to 8.92 mmol/l) in the control group; the mean reduction in fasting blood glucose was 1.60 mmol/l greater in the intervention group than in the control group (95% CI, -2.14 to -1.07; P<0.001).
Conclusion: Our findings showed that FCHV-delivered intervention could reduce blood glucose level in adults with type 2 diabetes in a low-resource setting. Further research is warranted to assess the generalizability and cost-effectiveness of this intervention in other settings similar to Nepal.
Clinical Trial Registration Number: NCT03304158.
Disclosure: B. Gyawali: None.
PS 15 Risk factors in type 1 diabetes
349
Incidence of type 1 diabetes over twenty six consecutive years among 15-39-year-old Lithuanian inhabitants
R. Ostrauskas;
Institute of Endocrinology, Lithuanian University of Health Scences, Kaunas, Lithuania.
Background and aims: The objective of the study - to document the database of the incidence of type 1 diabetes mellitus in the Lithuanian 15-39-year-old population from 1991 to 2016.
Materials and methods: Electronic registration of newly identified patients with type 1 diabetes in the Lithuanian Compulsory Health Insurance Information System was considered as the primary data source. A specifically developed contact system with all general practitioners and family physicians involved in the diabetes care covering 100% of the 15-39-year-old Lithuanian inhabitants registered in primary health care units, was the secondary data source for case ascertainment. Information from all sources was entered into the computer-based information system. The capture-recapture method was employed to detect the number of missing cases and to adjust count for the accurately estimated number of people who had type 1 diabetes.
Results: A total of 2424 new cases (1587 males and 837 females) of type 1 diabetes mellitus were recorded among the 15-39-year-old Lithuanian inhabitants during the period 1 January 1991 - 31 December 2016. The overall completeness of case ascertainment was estimated at 78.86%. The cumulative incidence density per person-year was 7.59/100,000 (95% Poisson distribution confidence interval (CI) was 6.93-7.50) and was slightly higher among males (9.88/100,000, 95%CI 8.94-9.86) than among females (5.02/100,000, 95%CI 4.69-5.37), p<0.0001. World Standard Population standardized age-adjusted overall incidence rates for males and females were 9.71 and 5.07, respectively. The male/female ratio was 1.85. Results from linear regression models showed that the incidence density for type 1 diabetes mellitus in the 15-39-year-old Lithuanian inhabitants had a pronounced tendency to decrease.
Conclusion: Our data demonstrated the male predominance in the primary incidence of type 1 diabetes mellitus in 15-39-year-aged population in Lithuania. The incidence density of type 1 diabetes mellitus in 15-39-year-aged males and females decreased during 1991-2016.
Disclosure: R. Ostrauskas: None.
350
Patterns of autoimmunity of genetically defined adult onset type 1 diabetes are different above and below 30 years of age, without impacting on clinical presentation
N. Thomas, A. Hill, P. Tippett, T. McDonald, B. Knight, A. Carr, R. Oram, A. Hattersley, M. Weedon, A. Jones;
Level 3, Exeter University, Exeter, UK.
Background and aims: Robustly identifying adult onset type 1 diabetes (T1D) clinically is difficult and means the rates of autoantibody positivity and clinical features at diagnosis are unclear. Using an unbiased genetic methodology we aimed to define patterns of autoantibody positivity and clinical characteristics of T1D presenting above and below 30 years of age.
Materials and methods: We used a T1D genetic risk score (T1DGRS) to define T1D within 1107 white Europeans with diabetes in the STARTRIGHT study (inclusion criteria: diagnosis age ≥18, ≤12 month’s diabetes duration). We compared autoantibodies (GAD, IA-2, ZNT8) and clinical characteristics at presentation in genetically defined T1D diagnosed above and below 30 years of age.
Results: T1D was genetically defined in 23% (207/887) and 66% (146/220) of participants diagnosed >30 and ≤30 years of age respectively. Overall, autoantibody positivity (≥1 autoantibody positive) (89% vs 90%) and GAD (87% vs 79%) were similar between age groups: both p>0.05. Those diagnosed older were less likely to have IA-2 (34% vs 50%), ZNT8 (41% vs 52%) therefore multi-antibody (≥2) positivity (48% vs 61%) all p<0.05. However, the severity of presentation of T1D above and below 30 years of age was near identical: Hba1C (102 mmol/mol vs 97 mmol/mol), glucose (21.6 mmol/L vs 19.7mmol/L), DKA (16% vs 18%), osmotic symptoms (92% vs 90%) and weight loss (74% vs 75%) all p >0.1. (Table 1).
Conclusion: We show, whilst rates of single autoantibody positivity are unaffected by age of T1D diagnosis, differences in the pattern of individual antibody positivity exists. Despite this, age of diagnosis has no impact on the clinical presentation of T1D.

Clinical Trial Registration Number: NCT03737799
Supported by: Diabetes UK, Wellcome, NIHR
Disclosure: N. Thomas: None.
351
Association of patient- and disease-related factors with glycaemic target achievement in type 1 diabetes in the SAGE study
J. Seufert1, H. Ikegami2, S. Brette3, V. Pilorget4, F. Lauand4, E.G. Wilmot5, E. Renard6, J.J. Gagliardino7;
1University Hospital Freiburg, Freiburg, Germany, 2Kindai University Faculty of Medicine, Osaka-sayama, Japan, 3Aixial, Boulogne-Billancourt, France, 4Sanofi, Paris, France, 5University Hospitals of Derby and Burton NHS FT, Derby, UK, 6University of Montpellier, Montpellier, France, 7CENEXA, Center of Experimental and Applied Endocrinology (La Plata National University National Scientific and Technical Research Council), La Plata, Argentina.
Background and aims: Most people with T1D do not achieve HbA1c targets, but this may vary with patient- and disease-related factors.
Materials and methods: SAGE was a multinational, cross-sectional study using data from medical records and interviews of eligible people with T1D for ≥1 year, aged ≥26 years (N=3858). The relationship between each group of selected factors (sociodemographics, diabetes complications and comorbidities, T1D treatment, structure and process of medical care) and HbA1c target achievement (both general [HbA1c <7 %] and individualised) were evaluated.
Results: Overall, 24.3% of people achieved HbA1c <53 mmol/mol (<7 %); 20.9% achieved individualised targets. For both targets, better achievement was associated with: lower body mass index, diastolic blood pressure, and total daily insulin dose; ≥1 symptomatic hypoglycaemic event (<3.0 mmol/l) within the last 3 months; higher levels of education; and having health insurance (Table). Poorer target achievement was associated with ≥1 severe hyperglycaemic event leading to diabetic ketoacidosis within the last 6 months, microvascular complications, and dyslipidaemia. Older people were more likely to achieve individualised targets while younger people were more likely to achieve HbA1c <53 mmol/mol (<7 %).
Conclusion: HbA1c target achievement remains a challenge but SAGE identified factors that appear to be associated with HbA1c target achievement, offering opportunities for intervention.

Supported by: Sanofi
Disclosure: J. Seufert: Employment/Consultancy; Sanofi. Grants; Sanofi. Honorarium; Sanofi. Lecture/other fees; Sanofi.
352
Characterisation and narrowing of the diabetes locus Nidd/DBA
H. Aga-Barfknecht1, N. Hallahan2, P. Gottmann1, W. Jonas1, M. Jaehnert1, H. Vogel1, A. Schürmann1;
1Experimental Diabetology, German Institute of Human Nutrition (DIfE), Nuthetal, Germany, 2Charles Perkins Centre, Sydney, Australia.
Background and aims: Type 2 diabetes (T2D) is a complex metabolic disease regulated by genetic predisposition and environmental factors. It is still considered as today’s most common health threat that does not only entail several comorbidities but also remarkable secondary consequences. To understand the genetic contribution in the development of diabetes we utilized different diabetogenic mouse models. The New Zealand Obese (NZO) strain is an obese, polygenic mouse model of human T2D. Dilute Brown Agouti (DBA) mice are lean, carry diabetes genes and develop hyperglycemia on obese background. Analysis of a NZOxDBA backcross population revealed one major diabetes susceptibility locus (Nidd/DBA) with a size of 38 Mbp, whereby DBA alleles enhanced hyperglycemia and β-cell loss. The aim of the study was to elaborate the detailed phenotype induced by the locus, to narrow the critical region and to identify genetic variant(s).
Materials and methods: Analysis of random recombination events and subsequent repeated backcrossing to NZO were utilized to generate recombinant congenic strains in order to reduce the critical fragment size. RCS were phenotypically characterized on a standard diet in respect to whole-body glucose homeostasis experiments (oral glucose tolerance, fasting blood glucose and fasting-refeeding tests). Insulin was stained in pancreas sections of mice at different age. Haplotype mapping and RNAseq of pancreatic islets from congenic mice were performed to define potential candidate genes.
Results: Recombinant congenic mice carrying 6.3 Mbp of the DBA allele on NZO background displayed normal metabolic phenotype at 6 weeks of age similar to NZO allele carriers. 12 weeks old DBA allele carriers developed hyperglycemia, exhibited an impaired glucose clearance and elevated blood glucose levels and showed an inadequate insulin response in fasting-refeeding experiments. DBA allele carriers exhibited severe reduction of total pancreatic insulin accompanied by severe β-cell loss in week 16. Further breeding resulted in a fragment of 3.3 Mbp which was sufficient to induce hyperglycemia at 15 weeks of age. By combination of transcriptome analysis and haplotype mapping, the number of putative responsible variants within the 3.3 Mbp could be narrowed to 27 genes, 12 gene models and 17 non-coding RNAs. The fact that none of the annotated genes were differentially expressed in islets of NZO and DBA and exhibited sequence alterations which affect protein function indicates that the responsible genomic defect of Nidd/DBA is located in the gene models or non-coding RNAs.
Conclusion: The diabetes locus Nidd/DBA was narrowed from 38 Mbp to 3.3 Mbp. The causal gene variant(s), which remain to be identified, lead to a loss of β-cells between 12 and 16 weeks of age.
Disclosure: H. Aga-Barfknecht: None.
353
Integrated analysis of clinical and multi-dimension omics data from 100 newly diagnosed type 1 diabetes subjects from the INNODIA study
C. Brorsson1, P. Chmura1, G. Mazzoni1, D.D. Dunger2, S.F.A. Bruggraber2, M. Knip3, T. Tree4, M. Peakman5, A.M. Schulte6, R. Lahesmaa7, T.R.L. Suvitaival8, F. Dotta9, G. Sebastiani9, C. Mathieu10, S. Brunak1;
1University of Copenhagen, Copenhagen, Denmark, 2University of Cambridge, Cambridge, UK, 3University of Helsinki, Helsinki, Finland, 4King's College London, London, UK, 5Sanofi S.A, Cambridge, USA, 6Sanofi Deutschland GmbH, Frankfurt, Germany, 7University of Turku, Turku, Finland, 8Steno Diabetes Center Copenhagen, Copenhagen, Denmark, 9University of Sienna, Sienna, Italy, 10University of Leuven, Leuven, Belgium.
Background and aims: Development of disease-modifying therapy for T1D is hampered by limitations in our understanding of pathogenesis, heterogeneity and lack of disease biomarkers and stratifiers. Using the INNODIA consortium pan-European infrastructure to collect prospective clinical data from newly diagnosed patients (within 6 weeks) combined with multiple Omics Discovery Platforms (ODPs), we mined single and integrated datasets to identify novel relationships that could transform the disease monitoring landscape.
Materials and methods: Biological samples collected <6 weeks from diagnosis from a cohort of 100 patients were pipelined through our ODPs and the data integrated with clinical parameters, as well as measurements of C-peptide from mixed meal tolerance tests (at 3, 6 and 12 months) and monthly home dried blood spots. Genotyping was performed on Affymetrix SNP array, HLA genotypes were imputed to 4-digits. Plasma metabolomics, lipidomics and serum proteomics was preformed by mass-spectrometry, plasma miRNA by targeted sequencing and RNA-sequencing was performed in whole blood. After pre-processing each data set was quality-controlled, standardized by rank normalization, and subsequently the baseline clinical and omics data were integrated using a variational autoencoder (VAE) framework. The latent (lower dimensional) representation of the VAE integrated data was clustered to identify clinically meaningful subgroups
Results: Cohort characteristics at baseline were: mean age 12.2 years, disease duration 4.2 weeks, HbA1c 97.7 mmol/mol, 48 were female, and all were positive for >= 1 islet autoantibody. More than 90 individuals had finished the 12 months visit. First results show significant associations between omics features and clinical variables (age and weight: LPE(16:0), p<0.001; HbA1c: PE(38:4), p<0.001; GADA: PC(35:4), p<0.01, IA-2A: TG(51:2), p<0.01). We found high accuracy (>0.96) of the data reconstruction after applying the VAE on the clinical, metabolomics and lipidomics data. Clustering of the latent representation indicates that the known internal data correlations are reproduced. There was an age and C-peptide gradient, sex was evenly distributed. The remaining omics data are being prepared for integration in the VAE pipeline. Preliminary analysis of RNA-sequencing data using WGCNA analysis identified modules of co-expressed genes associated to clinical variables (e.g. a large gene module correlated with HbA1c, PCC=0.399).
Conclusion: INNODIA collects deep omics and clinical data on an unprecedented scale in the field of T1D with extremely high completeness and quality. These first results using a subset of omics data highlight novel associations with clinical variables. The preliminary results from the VAE data integration show the feasibility of this approach and hold great promise to uncover important data structures not readily discovered when analyzing single data types.
Supported by: EU IMI No 115797 (INNODIA)
Disclosure: C. Brorsson: Grants; EU-IMI.
354
Higher level of body mass index (≥ 22 kg/m 2 ) is a useful predictor of non-insulin requirement in Slowly Progressive Insulin-Dependent (Type 1) Diabetes Mellitus (SPIDDM)
T. Onoue, E. Wada, A. Hayase, T. Handa, M. Furukawa, T. Kobayashi, M. Goto, H. Arima;
Department of Endocrinology and Diabetes, Nagoya University Graduate School of Medicine, Nagoya, Japan.
Background and aims: Glutamic acid decarboxylase antibodies (GADA)-positive non-insulin-dependent diabetic patients show clinical features of type 2 diabetes at the onset, but are known to lead to insulin-dependent state over several months to several years. They are defined as Slowly Progressive Insulin-Dependent (Type 1) Diabetes Mellitus (SPIDDM). However, some patients matching these definitions do not require insulin therapy for a long-term. There is a need to differentiate between patients who will lead to an insulin-dependent state and those who will not require insulin therapy for a long-term. Therefore, we conducted a retrospective cohort study in SPIDDM patients.
Materials and methods: We reviewed electronic medical records of all patients who measured GADA using the Radioimmunoassay (RIA) method at the 8 medical centers in Japan. We defined patients who have not required insulin therapy for more than 5 years after diagnosis of SPIDDM with mean HbA1c of less than 8.0% (63 mmol/mol) for 5 years as non-insulin-requiring (NIR) group, and those who required insulin therapy within 5 years after SPIDDM diagnosis and HbA1c at the time of insulin starting was over 8.0% (63 mmol/mol) as insulin-requiring (IR) group.
Results: There were 1,439 GADA-positive diabetic patients and 1,016 patients matched SPIDDM criteria, 31 patients were classified as NIR group, while 158 patients were classified as IR group. The patients in the NIR group had a significantly higher GADA (RIA) level, higher body mass index (BMI) and lower HbA1c level than those in the IR group at diagnosis of SPIDDM. The percentage of patients who had hypertension were significantly higher in the NIR group than in those in the IR group. A multivariate logistic regression analysis showed that higher levels of BMI (≥ 22 kg/m2) were predictors of non-insulin-requirement, independent of the confounding factor HbA1c.
Conclusion: High BMI (≥ 22 kg/m2) at diagnosis can be a predictor of long-term insulin-independent state in Japanese SPIDDM patients.
Clinical Trial Registration Number: UMIN-CTR: UMIN000022047
Disclosure: T. Onoue: None.
355
Islet autoantibody qualification for optimising trial design type 1 diabetes prevention studies
I. O'Doherty1, J. Burton1, J. Hedrick2, A. Lernmark3, J. Podichetty1, K. Romero1, J.L. Dunne4, Type 1 Diabetes Consortium;
1Critical Path Institute, Tucson, USA, 2Janssen Research & Development, LLC, Raritan, USA, 3Lund University, Malmo, Sweden, 4JDRF, New York, USA.
Background and aims: Type 1 diabetes (T1D) is a chronic autoimmune disease that results from the destruction of insulin-producing beta cells (β-cells) in the islets of Langerhans of the pancreas. The ability of T1D patients to make insulin is impaired, and consequently patients are unable to regulate their blood glucose levels. The incidence of T1D is on the rise globally. Currently, there are no approved therapies to prevent or delay the onset of T1D, and there is a lack of biomarkers and quantitative tools to optimize patient selection for clinical trials and to quantify risk of conversion to a diagnosis of T1D. Investigations have shown that the majority of individuals in stage 1 or 2 T1D progress to diabetes diagnosis with symptoms (stage 3) within 10 years. (JAMA. 2013 Jun 19;309(23):2473-9; Diabetes Care. 2015 Oct;38(10):1964-74). Translating these observations to optimize subject selection in T1D prevention trials is challenging due to the variable rate of disease progression. To utilize islet autoantibodoies (AAs) in drug development, it is necessary to understand the quantitative relationship between islet AAs and factors affecting subject variability to the timing of T1D diagnosis. Understanding this relationship would allow sponsors to design informative clinical trials of appropriate and reasonable size, duration, and cost capable of adequately evaluating therapies. The purpose of this project is to develop a predictive model that describes the time varying probability of T1D diagnosis in at-risk subjects.
Materials and methods: The Type 1 Diabetes Consortium, a public-private partnership, acquired, remapped, integrated and curated existing subject-level data from observational studies and evaluated islet AAs as biomarkers to enrich subjects for T1D prevention trials using a time-to-event model-based approach. The model is intended to account for several predictors of T1D diagnosis within the defined subject population (individuals that are first-degree relatives (FDRs) of a T1D patient, or who have a human leukocyte antigen (HLA) haplotype of risk, defined as HLA-DR3/3, DR4/4, DR3/4, DR3/X [X≠3], DR4/X [X≠4]). This model aims to provide the necessary evidence to support the use of islet AAs to enrich clinical trials for T1D prevention of reasonable duration with subjects who have a higher likelihood of reaching T1D onset over time based on population patient features.
Results: A quantitative description of time varying probability of T1D diagnosis was developed. Survival curves were generated to illustrate effects of number of islet AAs on progression from stage 1 and stage 2 to Stage 3. The presence of 2 or more islet AAs significantly decreases the time to T1D diagnosis. The pairwise log-rank test was statistically significant in terms of survival between the groups being in either stage 1, stage 2, or progressing to stage 3 (alpha=0.05; p < 0.05).
Conclusion: Islet AAs are predictors of conversion to a T1D diagnosis and will be used for formal regulatory qualification with EMA and FDA to provide a framework for development and regulatory acceptance of scientific tools for use in drug development programs for T1D prevention.
Supported by: JDRF 3-RSC-2017-460-I-X, Membership Fees from: Novo Nordisk, Janssen, Provention Bio, Helmsley Grant
Disclosure: I. O'Doherty: None.
PS 16 Islet transplants revisited
356
New reporter pluripotent stem cell lines for the purification of ins-positive pancreatic islet cells
R. Dettmer, O. Naujok;
Institute of Clinical Biochemistry, Hannover Medical School, Hannover, Germany.
Background and aims: Although in vitro differentiation of pluripotent stem cells towards pancreatic islets is promising, it is also challenging because of the heterogeneity of the cells that are generated during differentiation. In order to facilitate the characterization of insulin-producing cells derived in vitro, we sought to establish new reporter cell lines through CRISPR/Cas9 nickases (CRISPR/Cas9n) mediated homology-directed repair. This reporter cell lines should give information about the developmental processes during human pancreatic organogenesis, prepare for therapeutic use of surrogate insulin-producing cells and enable the isolation of insulin-producing cells by magnetic or fluorescent activated cell sorting (MACS/FACS).
Materials and methods: To create a staggered cut around the stop codon of the INS locus, two pairs of sgRNAs were cloned using the Cas9 D10A nickase in PAM-out configuration and a distance of 46-66 bp between the nick sites. Then HES3 embryonic stem cells and human iPS MHHi006-A (Phoenix) cells were nucleofected with the pairs of CRISPR/Cas9n and a targeting vector comprising either a P2A-H-2KK-F2A-GFP2 (HES3) or a P2A-mCherry (Phoenix) gene cassette flanked by 500 bp 5’ and 3’ homology arms. Either a floxed hygromycin or blasticidin gene was used for clonal selection of targeted cells. Cell clones were screened by PCR and DNA sequencing and then the functionality of the knock-in was tested by differentiation into insulin-producing cells using an adopted differentiation protocol.
Results: Nucleofection of pluripotent stem cells with both designed CRISPR/Cas9n pairs and the HDR vectors led effectively to integration. In total, 18 HES3 clones were obtained, 8 with homozygous integration, 9 with heterozygous integration and 1 only with hygromycin resistance without any integration. Nucleofection of Phoenix cells led to 12 Phoenix clones, 3 with homozygous integration and 9 with heterozygous integration. The tested clones activated GFP2 or mCherry upon differentiation. One HES3 clone and one Phoenix clone were then used for further characterization. GFP2-and mCherry positive cells allowed FACS-assisted cell purification. GFP2-positive cells also co-expressed the surface antigen H-2KK, which allowed MACS-assisted cell purification. MACS-sorted H-2KK-positive cells and FACS-sorted mCherry positive cells were positive tested for insulin gene expression, whereas H-2KK-negative and mCherry-negative cells remained mainly negative for insulin gene expression.
Conclusion: In summary, this study reports the derivation of new pluripotent reporter cell lines which comprises the knock-in of the fluorescence reporter mCherry or GFP2 and the surface antigen H-2KK into the INS locus. Due to the design of the targeting vector, the INS locus remains unharmed so that mCherry, GFP2 and H-2KK are expressed along with INS under the control of the endogenous gene promoter. The analysis of fluorescent protein-expressing cells showed that they co-express insulin. The duality of the reporter gene knock-in allows the purification by magnetic or fluorescent activated cell sorting. Thus, we conclude that these cell lines are powerful tools to study the developmental processes during human pancreatic organogenesis. Furthermore, these cell lines could be used to purify insulin-producing cells for cell replacement therapy studies of diabetes.
Disclosure: R. Dettmer: None.
357
Human 3D islet organoids generation using a novel engineered porous microcarrier platform
Y. Dai1, J. Li2,3, X. Zhu2,3, Q. Wei2,3;
1Nanjing Foreign Language School, Nanjing, 2Department of Endocrinology, Zhongda Hospital, School of Medicine, Southeast University, Nanjing, 3Pancreatic Research Institute, Southeast University, Nanjing, China.
Background and aims: Developing cellular products to treat type 1 diabetes mellitus (T1DM) faces the unique challenge of autoimmunity. It would be ideal to protect transplanted β cells with engineered materials. Encapsulation physically separates β cells from immune cells but it also separates β cells from blood vessels, thus altering the kinetics of glucose sensing and oxygen and nutrient delivery, and potentially compromising the survival and function of the encapsulated cells. New technologies will play an important part in advancing these studies.
Materials and methods: We fabricated the desired microcarriers by using a coaxially assembly capillary microfluidic device for 3D culture of islet organoids. In this system, silicone oil was utilized as the inner and outer phase, while Na-alginate and poly ethylene glycol diacrylate (PEGDA) hybrid solution was employed as the middle phase. PEGDA held the capacity of non-adhesiveness, stimulating the accumulation of multicellular spheroids by self-aggregation of cells. Cell viability of islet organoids during the long-term culture was tested and images were taken using a fluorescence microscope at different time points. The glucose-stimulated insulin release (GSIS) and potassium-stimulated insulin secretion (KSIS) assays were carried out for the evaluation of the glucose responsiveness of β cells in the microcarriers.
Results: A porous microcarrier was produced utilizing a simple capillary microfluidic device for the culture of pancreatic β cells, with external/interconnected cores encapsulated in the hydrogel. Due to the architecture of microcarriers, the exchange of necessary substances such as nutrient and oxygen were facilitated, this promoted the formation of 3D islet multicellular spheroids. The cells exhibited a better cell viability than those cultured in matrigel without microcarriers, ascribing to the spherical architecture of cells. The islet multicellular spheroids exhibited more sensitive GSIS response, and the result of KSIS assay was consistent with the GSIS assay, indicating the maturation of islet organoids. It was not only attributed to the 3D architecture of the microcarriers, but also the assistant of the connected windows for the informational communication.
Conclusion: The communicational efficiency among multicellular spheroids was reinforced by small-scale windows between the cores, bolstering the function of β cells. The characters made the novel microcarrier we proposed promising for the cultivation of islet organoids, the tissue engineering and the regenerative medicine, drug screening and cell therapy for diabetes care.
Disclosure: Y. Dai: None.
358
Islet stellate cells: a new potential resources for differentiation into beta-like cells
Y. Zhou, Z. Sun;
Department of Endocrinology, Zhongda Hospital, Institute of Diabetes, Medical School, Southeast University, Nanjing, Jiangsu, China.
Background and aims: Numerous studies demonstrated adult tissue-specific stem cells could differentiate into specialized functional cells. However, the exact cell type(s) of adult islet stem/progenitor cells remain unclear. Islet stellate cells (ISCs), which located in the inner part of islet, are directly adjacent to endocrine cells. This study intends to observe whether ISCs share biological phenotypes with properties of stem/progenitor cells and have the potential to be β-like cells.
Materials and methods: The biological typical stem/progenitor characterization of freshly isolated and cultured ISCs was identified using Oil O staining, reverse transcription polymerase chain reaction (RT-PCR) and immunofluorescence. A modified protocol of three-step pancreatic specialized induction was performed in cultured ISCs. Differentiation phenotype of ISCs was detected by RT-PCR, immunofluorescence, dithizone staining, and electron microscopy. The insulin content and insulin secretion in response to glucose stimuli of these cells are measured by enzyme-linked immunosorbent assay.
Results: Freshly isolated ISCs displayed a classical polygonal appearance containing lipid-loaded vesicles. With culturing, ISCs transformed into fibroblast-like cells. The adult stem/progenitor cell markers (desmin, CK-19, GFAP, Vimentin) of cultured ISCs increased in a time-dependent manner, while the genes responsible for β cell-specific differentiation exhibited the opposite tendency. After maturation with multi-step induction strategy, differentiated ISCs gradually changed morphology into round cells leading to form islet clusters and exhibited positive brownish-red cytoplasmic staining, indicating a sequestration of zinc. These differentiated cells expressed multi-pancreatic β cell-specific markers and comprised C-peptide-positive cells. Most of these C-peptide-positive cells co-expressed insulin and glucagon, as well as CK-19, GFAP, Vimentin. Ultrastructural studies showed differentiated ISCs revealed the presence of extensive hypertrophy of the rough endoplasmic reticulum, electron-dense granules, abundant lysosomes in the cytoplasm, and fibres of collagen in extracellular compartment. In addition, the insulin content in interior of differentiated cells was detected. Glucose-stimulated insulin secretion of differentiated cell clusters tended to increase, nevertheless, no significant difference was found.
Conclusion: These results indicated that ISCs exhibited properties of adult stem/progenitor cells and could differentiate into endocrine hormone-producing cells. This finding suggests that ISCs may be a not yet recognized adult islet-specific stem/progenitor cell type and provides a useful resource for future limited source of β cells for diabetes mellitus therapy.
Disclosure: Y. Zhou: None.
359
Co-localisation of islet stellate cells with islet endothelial cells and it’s potential impact on islet microcirculation
Z. Sun1, W. Li1, Z. Li2, P.-O. Carlsson2;
1Department of Endocrinology, Zhongda Hospital,Institute of Diabetes, School of Medicine, Southeast University, Nanjing, China, 2Department of Medical Cell Biology, Uppsala University, Uppsala, Sweden.
Background and aims: T2DM is a heterogeneous disease, with varying degrees of reduction in number and function of the insulin-producing β-cells. Besides, there is considerable evidence of dysfunction of also the stromal islets cells, including stellate cells, endothelial cells, nerve cells etc. Quite often islet fibrosis and islet microcirculation distortion can be seen both in patients and animal models of T2DM and also the transplanted islets. However, the co-localization and also the interaction between the fibrosis producing islet stellate cells (ISC) and the microcirculation composition islet endothelial cells (IEC) has not been studied yet. As with their role in the prognosis of islet transplantation.
Materials and methods: Co-localization of ISC and IEC was studied by co-staining desmin, CD31, insulin and DAPI using the 8w SD rat pancreas. Analysis of ISC and IEC co-localization was performed by Fiji Image J macro which was written based on the formula co-localized intensity / total intensity or co-localized area / total area in a specific color channel. Then the islets cultured in vitro for 1d, 3d, and 5d were collected and stained for markers such as CD34, desmin, α-SMA, Collagen I, collagen III and fibronectin to examine the dynamic change of these two type cells.
Results: Co-localization analysis revealed that in all CD31 positive staining IEC, 20.9% were co-localized with desmin positive ISC by intensity and 19.75% by area. While in all desmin positive staining ISC, there was a higher 53.14% ISC co-localized with IEC by intensity and 48.34% by area. As in vitro culture time extends, there was a remarkable decrease of CD34 positive staining IEC (5d vs 3d vs 1d = 20% vs 50.9% vs 100%, P<0.01) and a significantly increase of desmin positive ISC(5d vs 3d vs 1d = 1106% vs 380.9% vs 100%, P<0.01) and also α-SMA positive activated ISC((5d vs 3d vs 1d = 548.5% vs 174.9% vs 100%, P=0.039). Extracellular matrix (ECM) components including Collagen I, collagen III and fibronectin produced by ISC were also increase as culturing time extends.
Conclusion: 1. Nearly half of ISC were co-localized with IEC which means ISC may have a potential role in regulating islet microcirculation just like hepatic stellate cell can adjust hepatic blood flow. 2. The opposite dynamic change of IEC and ISC markers in culturing islets may suggest that ISC and ISC secreted ECM components may involved in the decrement of IEC. Thus attenuation of ISC activation may be a potential target for better IEC survival of transplanted islets.

Supported by: The work was supported by the National Nature Science Foundation of China (NSFC-81870534)
Disclosure: Z. Sun: None.
360
Factors affecting function of human pancreatic islets after isolation
C. De Luca1, M. Suleiman1, A.M. Schulte2, D.L. Eizirik3, M. Tesi1, W. Baronti1, E. Bosi1, M. Solimena4, M. Cnop3, P. Marchetti1, L. Marselli1;
1Department of Clinical and Experimental Medicine,and Cisanello University Hospital, University of Pisa, Pisa, Italy, 2Sanofi-Aventis Deutschland GmbH, Diabetes Research, Frankfurt, Germany, 3ULB Center for Diabetes Research, Bruxelles, Belgium, 4Paul Langerhans Institute Dresden of the Helmholtz Center Munich, Dresden, Germany.
Background and aims: Human pancreatic islets (HPI) can be used for clinical and basic research, but variability in islet function often hampers their use. Therefore, more information is needed on variables affecting HPI function after isolation.
Materials and methods: We studied human islets obtained from 425 non-diabetic organ donors [age: 63±17 years, M/F: 207/218, BMI: 25.3±4.0 kg/m2, pancreas cold ischemia time: 16±7 hours]. Islet preparation purity was assessed by dithizone staining and by insulin immunostaining for selected samples. Insulin release in response to 3.3 mM glucose (G), 16.7 mM G, 3.3 mM G+100 μM glyburide (Glib) and 3.3 mM G+20mM Arginine (Arg) was assessed, and respective insulin stimulation indices (SIs) calculated. Correlations (by linear and multiple regression analyses) between insulin release and donor and islet characteristics were calculated.
Results: Insulin release (μU/islet/45 min) in response to 3.3 and 16.7 mM G, Glib and Arg was 1.53±0.63, 4.54±3.60, 4.63±3.15 and 4.72±3.10, respectively. The correspondent SIs for G, Glib and Arg were 2.9±1.7, 3.1±1.7 and 2.5±1.4. SI in response to G and Glib increased with islet purity (both p<0.01). A negative correlation was observed between G and Glib SIs and the days of culture prior to functional studies (p<0.01). Arg-induced insulin release was not correlated with any of the tested variables.
Conclusion: Our data, obtained from a very large number of islet preparations, show that islet purity and days of tissue culture from isolation to the time of functional studies impact significantly on glucose- and glibenclamide-stimulated ex-vivo insulin secretion from human islets. Standardization of these variables is needed to optimize results and make them comparable between research laboratories.
Supported by: Rhapsody and INNODIA (H2020-IMI2), and T2DSystems (H2020)
Disclosure: C. De Luca: None.
361
The assessment of intrahepatic islet transplantation using exendin PET imaging
T.J.P. Jansen1, M. Buitinga1,2, M. Boss1, E.J.P. de Koning3, M.A. Engelse3, M.F. Nijhoff3, I. Velikyan4, O. Korsgren4, O. Eriksson4, M. Brom1, M. Gotthardt1;
1Radboudumc, Nijmegen, Netherlands, 2KU Leuven, Leuven, Belgium, 3LUMC, Leiden, Netherlands, 4Uppsala University, Uppsala, Sweden.
Background and aims: Intrahepatic transplantation of islets is performed in patients with complicated type 1 diabetes (T1D) and unstable glycemic control. This procedure leads to an improved glycemic control and quality of life. Graft function can however deteriorate over time due to various factors. A tool to assess transplantation success and monitor islet survival and functionality would be of great clinical value. We used dynamic PET imaging with the beta cell specific tracer 68Ga-exendin to study the presence of intrahepatic islet grafts in T1D patients.
Materials and methods: Dynamic 68Ga-exendin PET scans of 8 T1D patients with functional intrahepatic islet grafts (Tx-group: 4 men, 4 women) and 3 control patients with T1D (2 men, 1 woman) awaiting islet transplantation, were acquired and hepatic tracer uptake was measured by kinetic modeling. Islet function was measured through a mixed-meal tolerance test (MMTT) and expressed as AUC for C-peptide and peak C-peptide, to determine its relation with the PET signal.
Results: The control and Tx-group did not differ in age (58.7±5.5 vs. 57.6±9.1 years, p=1.00), BMI (24.5±4.5 vs. 24.2±3.8 kg/m2, p=0.92) and HbA1c (62.3±6.1 vs. 46.3±10.0 mmol/mol, p=0.052), though AUC for C-peptide (22.6 vs. 145.2 nmol.min/L, p=0.01)) and peak C-peptide (0.24 vs. 1.69 nmol/L, p=0.01)) significantly differed. The number of transplanted islet equivalents in the Tx-group was 9.4*105±2.9*105. The distribution volume (Vt) of the PET tracer was significantly higher in the Tx-group (Fig. 1), indicating an increased retention of 68Ga-exendin in the liver i.e. the presence of islets (0.43±0.02 vs. 0.57±0.08, p=0.01). A significant correlation was observed between Vt and AUC for C-peptide (p=0.03, Pearson r=0.65) and between Vt and peak C-peptide (p=0.03, Pearson r=0.66). There was no significant correlation found in the Tx-group between Vt and the number of islet equivalents.
Conclusion: These preliminary data of this explorative study indicate that dynamic PET imaging using 68Ga-labeled exendin is a highly promising tool to monitor pancreatic islet grafts in T1D patients. The interesting finding that there a correlation between Vt and C-peptide production should be studied more extensively using larger datasets.

Clinical Trial Registration Number: NCT03785236
Supported by: INNODIA (IMI2-JU, grant agreement 115797) and BetaCure (FP7/2014-2018, 602812)
Disclosure: T.J.P. Jansen: Grants; This work is supported by INNODIA (IMI2-JU, grant agreement 115797) and BetaCure (FP7/2014-2018, 602812).
362
Actual 15-year follow-up of pancreas transplant alone (PTA) in patients with type 1 diabetes
W. Baronti1, F. Vistoli2, L. Marselli3, F. Indovina3, E. Gianetti3, C. Terrenzio3, U. Boggi3, P. Marchetti1;
1Department of Clinical and Experimental Medicine, University of Pisa, Pisa, 2University of Pisa, 3University of Pisa, Pisa, Italy.
Background and aims: PTA restores normoglycemia in diabetic patients by replenishment of beta cell functional mass. However, the long-term safety and efficacy of PTA in T1D is still debated.
Materials and methods: In the present study we report the outcomes of PTA as performed in our center, after 15 yr actual follow-up. Forty-four consecutive patients were studied (re-transplants excluded), having the following clinical characteristics at time of transplant: age, 37.5±8.2 yrs; 20 males and 24 females; BMI: 23.7±3.1 kg/m2; duration of diabetes, 24.5±9.6 yrs; C-peptide values: 0.1±0.2 ng/ml; insulin requirement, 43.5±12.7 IU/day. PTA was performed with portal-enteric drainage. The anti-rejection induction phase included basiliximab in 82% of cases or ATG in the remaining 18%. Tacrolimus and mycophenolate mofetil were used in the maintenance phase.
Results: At 15 yrs since transplantation, patient survival was 84.1% and death censored graft survival (HbA1c, 5.5±0.5%) was 56.7%. At 15 years since PTA, 7 patients (18.9%) developed stage 4 or 5 ESRD, mainly associated with lower pre-PTA eGFR.
Conclusion: These actual 15-yr results indicate that PTA is an effective and reasonably safe option to cure diabetes in selected cases of T1D patients;
Disclosure: W. Baronti: None.
363
Neoplastic risk assessment ten years after islet transplantation
M.-C. Vantyghem1, M. Chetboun2, K. Le Mapihan1, A. Jannin1, J. Kerr-Conte3, F. Pattou4;
1Endocrinology, Diabetology, Metabolism and Nutrition, Lille University Hopital, Lille, 2Endocrine Surgery, Lille University Hopital, Lille, 3EGID, Lille, 4Endocrine Surgery, Lille University Hospital, Lille, France.
Background and aims: The use of immunosuppressants is associated with an increased risk of neoplasia. The purpose of this work was to assess the incidence of neoplasia after islet transplantation with the Edmonton protocol (including a mTOR inhibitor).
Materials and methods: This longitudinal study included 28 type 1 diabetic patients who received an islet transplant alone (n = 14; ITA) or after kidney (n = 14; IAK), under immunosuppression comprising anti-interleukin2 receptor antibody, sirolimus (a mTOR inhibitor), and low dose tacrolimus. The patients received 13.6 [11.0-15.7] x103 islet-equivalent / kg in 2 (n=10) to 3 (n=18) intraportal injections within 68 (43-92) days. The number of solid neoplasia observed was identified from reports of quarterly patient visits for 10 years, in intention to treat.
Results: At ten years, insulin-independence with A1c ≤ 6.5% (48 mmol/mol) was met by 28 (13-45) % of the initial cohort, and graft function ( meaning blood C-peptide level ≥ 0.3 ng/mL) persisted in 78(57-89)% of cases (Kaplan-Meier estimates, 95% confidence interval). An IAK died of a stroke 35 months after his islet transplant with functional islet and kidney grafts. The mean duration of follow-up was 11.5 (8.9-12.9) years, or 298 patient-years. Six patients (4 ITA, 2 IAK) had lost their islet graft at 10 years, but only the 4 ITA stopped immunosuppression while continuing their follow-up. Both IAKs continued immunosuppression due to the functioning kidney transplant. Four skin cancers (2 basal and 2 squamous cell carcinomas, one of which was vulvar), of favourable outcome, were excised in 3 IAK and 1 ITA. An IAK developed a lymphoma just after the 10-year anniversary. Primary graft function, evaluated one month after the last islet infusion, was significantly associated with the duration of graft function and insulin-independence.
Conclusion: IAK patients seem to be more exposed to neoplastic complications than ITA. This is likely related to more prolonged exposure to heavier immunosuppression and repeated inductions, despite the use of a mTOR inhibitor. These results encourage systematic annual dermatological screening , anticipation of the type of induction used for kidney transplantation, and consideration of the Epstein-Barr virus status before transplantation.
Clinical Trial Registration Number: NCT00446264, NCT01123187
Supported by: PHRC, FEDER, ANR-10- LABX-46
Disclosure: M. Vantyghem: Grants; This study was supported by the French Ministry of Health, PHRC (Programme hospitalier de recherche clinique) 2001, the European Community (Fond Européen de Développement Régional), Conseil Régional d.
PS 17 Islets in type 1 diabetes: new players
364
Optimal ages for screening for type 1 diabetes risk in children
M. Ghalwash1, V. Anand2, W. Hagopian3, M. Lundgren4, M. Rewers5, R. Veijola6, A.-G. Ziegler7, J. Dunne8, T1DI Study Group;
1IBM Research, Yorktown Heights, USA, 2IBM Research, Cambridge, USA, 3Pacific Northwest Research Institute, Seattle, USA, 4Department of Clinical Sciences, Lund University/CRC, Malmö, Sweden, 5Department of Pediatrics, Barbara Davis Center for Diabetes, Denver, USA, 6Department of Pediatrics, University of Oulu, Oulu University Hospital, Oulu, Finland, 7Institute of Diabetes Research, Helmholtz Zentrum München, German Research Center for Environmental Health, Munich-Neuherberg, Germany, 8JDRF, New York, USA.
Background and aims: Screening for pre-symptomatic type 1 diabetes (T1D) can significantly reduce the risk of DKA at diagnosis. Screening can also identify children who may benefit from interventions to delay/prevent progression from islet autoimmunity (IA) to T1D. To help design a rational screening schedule, we analyzed data to determine the optimal ages to screen children for IA. Recognizing that T1D incidence is not uniform across different geographies, we analyzed country-specific data to determine optimal ages to screen children for IA to predict T1D onset by age 15.
Materials and methods: Longitudinal data sets from birth cohort studies (DIPP, BABYDIAB, DiPiS, DEWIT, and DAISY) were harmonized for analyses. We analyzed screening at two ages for multiple autoantibodies to insulin, GAD and IA-2 to maximize the sensitivity and positive predictive value (PPV) to predict development of T1D by age 15. Inverse probability censoring weighting was used to account for right censored outcomes. Cumulative sensitivity, dynamic specificity, positive and negative predictive values were used to assess the models.
Results: In the combined cohort (n=6722), a one-time screening for multiple autoantibodies achieved a maximum sensitivity of 31% and a PPV of 66-70% when applied at age 5-6y. To increase the sensitivity to NN% and retain PPV >70%, two screenings should occur: at 2-4y and at 5-9y.Each dataset was also individually analyzed. The analyses showed regional differences in terms of optimal ages for 2-age screening strategies. In DIPP (Finland, children with high HLA risk), maximum sensitivity (52%-56%) and PPV (74%) used a first screen at age 2-3y and a second screen at age 5-6y. In BABYDIAB (Germany, children with FDRs with T1D), the maximum (sensitivity 49%-55%, PPV 63%-69%) was 2-3y for the first screen and 8-9y for the second screen. In DAISY (USA, both FDR and high HLA risk children), results were more heterogeneous, with maximum sensitivity (49%-51%) and PPV (78%-86%) at 2y and 4y for the first screen and at 6y and 9y for the second screen.
Conclusion: Public health screening efforts to identify children progressing to T1D must make compromises based on feasibility and cost while optimizing sensitivity and PPV. Our data represent a starting point for these considerations that should be customized based on the population’s underlying disease characteristics and public health infrastructure.
Supported by: 1-IND-2019-717-I-X, 1-SRA-2019-722-I-X, 1-SRA-2019-723-I-X, 1-SRA-2019-719-I-X,1-SRA-2019-721-I-X
Disclosure: M. Ghalwash: None.
365
Reduced hepatocellular lipid content precedes diabetes onset in a mouse model of accelerated type 1 diabetes
C. Wessel1,2, M. Rothe1,2, J.-H. Hwang1,2, M. Roden1,2, V. Burkart1,2;
1Institute for Clinical Diabetology, German Diabetes Center, Düsseldorf, 2German Center for Diabetes Research, München-Neuherberg, Germany.
Background and aims: The manifestation of type 1 diabetes (T1D) is frequently preceded by metabolic disorders, which might accelerate the disease development. However, the metabolic factors affecting diabetes progression in the prediabetic phase are not well understood. The toll-like-receptor 4 (TLR4)-deficient non-obese diabetic (NOD) mouse represents a model of accelerated development of autoimmune insulin-deficient diabetes. These mice exhibit not only impairments of glucose metabolism, but also lipid metabolism before the age of diabetes manifestation. As hepatic lipid metabolism plays a central role in the regulation of whole-body energy homeostasis, we hypothesized that accelerated diabetes development in TLR4-deficient NOD mice associates with impaired lipid and energy metabolism in the liver before diabetes onset.
Materials and methods: Prediabetic female TLR4-expressing (NOD-TLR4+/+) and TLR4-deficient (NOD-TLR4-/-) NOD mice, aged 70-90 days, underwent intraperitoneal glucose tolerance tests (ipGTT) with measurements of plasma insulin concentrations by ELISA. Free fatty acid (FFA) concentrations in plasma were quantified photometrically. Hepatocellular concentrations of lipids (HCL), γ-ATP and inorganic phosphate (Pi) were determined by multinuclei 1H/31P magnetic resonance (MR) spectroscopy. Liver and visceral adipose tissue (VAT) volume was quantified by MR imaging (MRI). All MR measurements were performed in a horizontal 11.7-T magnet (Bruker Biospin 117/16 USR). Expression of fatty acid receptors (CD36, FFAR2) was analyzed in liver tissue by Western blotting.
Results: NOD-TLR4-/- mice had 44 % higher plasma FFA concentrations than NOD-TLR4+/+ mice (p < 0.01), but 43 % lower insulin concentrations at 15 minutes of the ipGTT (p < 0.05). Interestingly, NOD-TLR4-/- mice showed about 42 % lower HCL contents than NOD-TLR4+/+ mice (2.43±0.34 % vs. 4.21±0.75 %) (p < 0.05). On the other hand, hepatic γ-ATP and Pi were not different between NOD-TLR4-/- (γ-ATP: 1.47±0.08 mmol/l; Pi: 1.20±0.12 mmol/l) and NOD-TLR4+/+ mice (γ-ATP: 1.62±0.09 mmol/l; Pi: 1.18±0.09 mmol/l). Both NOD-TLR4-/- and NOD-TLR4+/+ mice also showed comparable liver weight (1.14±0.03 g vs. 1.15±0.03 g) and volume (1.02±0.05 ml vs. 1.11±0.04 ml) as well as similar VAT weight (0.35±0.05 g vs. 0.23±0.03 g) and volume (0.27±0.05 ml vs. 0.26±0.02 ml). The hepatic expression levels of the fatty acid receptors CD36 and FFAR2 were comparable in NOD-TLR4-/- (CD36: 2.27±0.30; FFAR2: 0.45±0.10 relative expression) and NOD-TLR4+/+ mice (CD36: 2.17±0.52; FFAR2: 0.42±0.09 relative expression).
Conclusion: A marked reduction of HCL content precedes the accelerated manifestation of insulin-deficient diabetes in NOD-TLR4-/- mice, which could result from lower rates of insulin-stimulated triglyceride synthesis and/or decreased insulin-suppression of lipolysis.
Supported by: MKW NRW, BMG, BMBF, DZD e.V.
Disclosure: C. Wessel: None.
366
Plasmablasts contribute to the development of type 1 diabetes via enhancing T cell cytotoxicity
Q. Ling, J. Lu, D. Zhu, Y. Bi;
Department of Endocrinology, Drum Tower Hospital Affiliated to Nanjing University Medical School, Nanjing, China.
Background and aims: Disturbance of innate and adaptive immune systems is responsible for β-cell destruction in type 1 diabetes (T1D). Although increasing evidence indicated a crucial role for B cells in disease pathogenesis, exactly how B-cell subsets contribute to T1D remains unclear. This study aimed to evaluate the potential role of B-cell subset in the development of T1D.
Materials and methods: We enrolled 56 subjects with T1D, 22 with T2D, and 26 healthy controls. Frequencies of circulating B-cell subsets were analyzed by flow cytometry. Adoptive transfer assay was utilized to study the pathogenic role of B-cell subset in vivo. Co-culture and ELISPOT assays were conducted to assess the effect of B-cell subset in activation of diabetogenic T cells. Furthermore, bortezomib, a kind of proteasome inhibitor, was used to dissect the impact of depleting the exact B-cell subset on the prevention and reversal of T1D.
Results: Plasmablasts, but not naïve, unswitched or switched memory B cells, were increased in patients with recent-onset T1D (1.18×10^7/L), compared with those with long-term T1D (0.81×10^7/L), T2D (0.50×10^7/L) and healthy controls (0.29×10^7/L). Pearson correlation analysis suggested that the number of plasmablast negatively correlated with fasting C-peptide (r=-0.400, P=0.017) and area under the curve of C-peptide (r=-0.405, P=0.022) in patients with recent-onset T1D. Compared with other B-cell subsets, plasmablasts expressed a high level of CD86, which negatively correlated with the residual β-cell function while positively correlated with the number of islet autoantibodies. ELISPOT assay further showed that plasmablasts isolated from participants with T1D induced a dramatic increase of interferon-γ secretion in GAD65 stimulated T cells, which can be attenuated using CD86 and HLA-II neutralizing antibodies. Compared with euglycemic NOD mice, the number of plasmablasts was increased in the spleen, pancreatic lymph nodes, and islets of diabetic NOD mice. Afrer 60 days of adoptive transfer, 50% of the NOD/SCID mice receiving T cells combined with plasmablasts developed diabetes. In contrast, none of the mice receiving T cells alone or PBS developed diabetes until 70 days post transfer. Islets from 6-week-old NOD donors co-cultured with plasmablasts and T cells from diabetic NOD mice showed more severe structural deformation and cytolysis, compared with those co-cultured with T cells alone. Meaningfully, depletion of plasmablasts both delayed diabetes onset and reversed diabetes in 9 out of 16 new-onset diabetic NOD mice. In addition, plasmablasts decreased in line with an improvement of residual β-cell function in patients 3 months after MSC treatment (r=-0.771, P=0.015).
Conclusion: These data firstly demonstrated that plasmablasts play a vital role in immune disturbance, further expanding the knowledge of T1D pathogenesis. Plasmablasts may serve as a novel therapeutic target in T1D.
Disclosure: Q. Ling: None.
367
Aquaporin-8 is upregulated in cytokine-mediated type-1 diabetes and crucial for H2O2 membrane permeability in insulin-producing cells
M. Elsner, A. Jörns, C. Schaal;
Institute of Clinical Biochemistry, Hannover Medical School, Hannover, Germany.
Background and aims: Reactive oxygen species (ROS) play an important role in the manifestation and pathogenesis of diabetes mellitus. Hydrogen peroxide (H2O2) is an important ROS that contributes to β-cell death and eventually failure of insulin production in the islets of Langerhans. The insulin-secreting β-cells are especially vulnerable to oxidative stress due to their particularly weak antioxidative defence equipment compared to other cell types. In our studies we analysed H2O2 permeability in β-cells in order to discover the intracellular movements of H2O2. Aquaporins (AQPs) are membrane proteins which are mainly responsible for the water homeostasis of the cell but can also transport small hydrophilic molecules through membranes. AQP8 has been shown to transport hydrogen peroxide.
Materials and methods: The AQP8 expression in rat islets specimens was quantified by immunohistochemical staining. Gene expression of all twelve known AQP isoforms in rat islets and insulin-producing RINm5F cells was analysed by RT-qPCR as well as the AQP8 expression after incubation with pro-inflammatory cytokines (IL1b, IFNg, TNFa). AQP8 was knocked-out or knocked-down by CRISPR/Cas9 technique or overexpressed after lentiviral transduction in RINm5 cells expressing the H2O2 sensor protein HyPer. The H2O2 membrane permeability was measured in perifusion experiments by live cell microscopy. The mode of cell death was analysed by Caspase 8, 12 and 3/7 assays. ROS formation after stimulation with pro-inflammatory cytokines was quantified with 2',7'-dichlorofluorescin-diacetate (DCF-DA) and hydroxyphenyl fluorescein (HPF).
Results: AQP8 protein expression was 3-fold increased in islets of acute diabetic LEW.1AR1-iddm rats as well as the AQP8 gene expression in RINm5F cells after incubation with pro-inflammatory cytokines. The expression pattern of AQPs in rat islets and RINm5F cells was very similar. Live cell imaging clearly illustrated the AQP8 dependent H2O2 permeability through several lipid barriers since AQP8 overexpressing cells show a significantly higher permeability into the cytosol, the mitochondria and the peroxisomes. A complete knockout, surprisingly, turned out to be lethal for the cells. In AQP8 knock-down cells showed a 3- to 4-fold increase in caspase 3/7 and 12 activation and significant higher level of ROS and hydroxyl radical formation after cytokine incubation in comparison to control cells.
Conclusion: The increase in AQP8 expression, an AQP isoform that we have been shown to be involved in H2O2 transport in insulin-producing cells, could be a protective mechanism against the formation of H2O2 during the cytokine-mediated cell death of beta cells in type 1 diabetes manifestations. The reason for the lethality of an AQP8 knock-out in insulin-producing cells needs further investigations.
Supported by: Funded by the Deutsche Forschungsgemeinschaft (DFG, German Research Foundation) 231396381/GRK1947
Disclosure: M. Elsner: None.
368
Lrh1/nr5a2 conveys the anti-diabetic effects of the agonist bl001 and promotes alpha-to-beta-cell conversion in streptozotocin-treated mice
N. Cobo-Vuilleumier1, E. Martin-Vazquez1, P.I. Lorenzo1, I. Diaz-Contreras1,2, F. Martin1,2, J.M. Gerdes3, J. Ferrer4, Y.S. Romero-Zerbo5,2, M. Garcia6, F.J. Bermúdez-Silva5,2, M. Gannon7, P. Collombat8, B.R. Gauthier1,2;
1Regeneration and Cell Therapy, CABIMER, Sevilla, Spain, 2CIBERDEM, Madrid, Spain, 3Helmholtz Zentrum Munchen, Neuherberg, Germany, 4The Barcelona Institute of Science and Technology, Barcelona, Spain, 5UGC Endocrinología y Nutrición, Instituto de Investigación Biomédica de Málaga-IBIMA, Malaga, Spain, 6Departamento de Fisiología, Universidad de Málaga, Malaga, Spain, 7Vanderbilt University Medical Center, Nashville, USA, 8Nice Sophia Antipolis University, Nice, France.
Background and aims: We recently reported that BL001 an agonist of the nuclear liver receptor homolog 1 (LRH1) reverts autoimmune diabetes in mice through modulation of the immune system combined with improved β-cell survival and regeneration potentially via α-to-β-cell conversion. BL001 was shown to activate LRH1 in vitro. Herein, we aimed to establish whether this signalling pathway is involved in ‘trans-regeneration’ and preservation of the β-cell mass in vivo under stress conditions.
Materials and methods: Two transgenic mouse lines were generated to: 1) conditionally ablate LRH1 in adult β-cells (PDX1-CreERT::LRH1lox/lox::Rosa26-STOP-YFP denoted as βLRH1lox/lox) upon tamoxifen treatment (TAM) and 2) conditionally express YFP in α-cells (GlucrTTA::TetOCre::Rosa26-STOP-YFP denoted as AtoB/YFP) upon doxycycline (DOX) treatment. The βLRH1lox/lox mouse line was used to assess the contribution of LRH1 to BL001 pro-survival properties while the AtoB/YFP mouse line allowed lineage tracing for α-cell fate. Streptozotocin (STZ) and BL001 were provided to both mouse models and glycemia monitored over several weeks. Immunohistochemistry (IHC) and flow cytometry (FC) analyses were performed on pancreas extracts.
Results: TAM treatment induced YFP expression in 90% of β-cells with a concomitant 80% reduction in LRH1 transcript levels in islets but not in the brain or liver of βLRH1lox/lox mice. Glycemia, body weight and liver function were not altered upon TAM treatment in either gender. As previously reported for wild type mice, in the absence of TAM treatment 20-30% of βLRH1lox/lox mice that express LRH1 developed hyperglycemia after BL001/STZ administration. In contrast, 80% of TAM-treated mice that lack LRH1 developed hyperglycemia after BL001/STZ treatment. IHC analysis of the pancreas of these mice after BL001/STZ administration revealed that hyperglycemic TAM-treated βLRH1lox/lox mice exhibited a near-total ablation of β-cells whereas normoglycemic untreated βLRH1lox/lox mice harboured normal islets. Separately, after the demonstration that DOX treatment of AtoB/YFP mice induced YFP expression specifically in α-cells, we analyzed the effect of BL001 intervention in STZ-treated AtoB/YFP mice. BL001 treatment blunted mortality by 35% while decreasing hyperglycemia and improving the physical health of mice. IHC analyses performed on pancreas sections 8-weeks post-STZ-treatment revealed a subpopulation of YFP+/glucagon- cells in BL001-treated AtoB/YFP mice as compared to non-BL001 treated mice. Preliminary FC analysis demonstrated that this subpopulation expresses the by β-cell-specific GLUT2 membrane marker.
Conclusion: We establish that the pro-survival/anti-diabetic properties of BL001 are specifically conveyed by the LRH1 signalling pathway and that the agonist favours α-to-β-cell conversion.
Supported by: JDRF; MCIU; JA; CS; FPS; DiabetesCero
Disclosure: N. Cobo-Vuilleumier: None.
369
Intestinal delivery of proinsulin and IL-10 via Lactococcus lactis combined with low-dose anti-CD3 induces antigen-specific FoxP3+ Tregs in autoimmune diabetic mice
P.-J. Martens1, G. Sassi1, M. Viaene1, J. Laureys1, L. Teyton2, P. Rottiers3, C. Gysemans1, C. Mathieu1;
1Clinical and Experimental Endocrinology (CEE), KU Leuven, Leuven, Belgium, 2Department of Immunology and Microbiology, Scripps Research Institute, La Jolla, USA, 3ActoBio Therapeutics, Zwijnaarde, Belgium.
Background and aims: An interesting approach in the pursuit for a cure of type 1 diabetes is restoration of immune tolerance by a combination treatment of low-dose aCD3 with the islet antigen proinsulin (PINS) and the pro-tolerogenic cytokine IL-10 administered orally via genetically modified Lactococcus lactis (L. lactis) bacteria. The purpose of adding PINS is to expand antigen-specific Tregs as they are believed to migrate preferentially to disease-related target organs and be more powerful in dampening overactive immune responses. The aim of this study is to prove antigen-specificity of the L. lactis-based antigen immunotherapy.
Materials and methods: Newly diagnosed diabetic NOD mice were injected with alloxan (90 mg/kg i.v., Sigma) in order to completely deplete residual endogenous beta cell mass. After 48 hours, all mice received 500 insulitis-free syngeneic islets and were either 1) left untreated (CTRL), 2) treated with aCD3 alone (aCD3), 3) aCD3 combined with L. lactis bacteria secreting PINS with IL-10 (CT), or 4) aCD3 combined with L. lactis secreting a non-islet antigen, ovalbumin with IL-10 (aCD3+LL-OVA). Flow cytometry analysis was done with insulin-reactive (e.g., InsB12-20 (TEGVEALYLVC-GGGS) and InsB13-21 (TEGEALYLVCGEGGS) PE- and APC-labeled MHC/peptide tetramers, used at a final concentration of 10 mg/ml in FACS buffer for 1 hour at room temperature.
Results: The CT providing proinsulin protected 69% of mice, compared to 33% when an irrelevant antigen (OVA) was combined with aCD3 therapy, or to 27% with aCD3 therapy alone. Flow cytometry data indicate that Foxp3+ Tregs, both CD25- and CD25+, in the islet grafts of mice, treated with aCD3 combined with L. lactis secreting PINS and IL-10, contained significantly more InsB12-20+ cells compared to those in the islet grafts of mice under anti-CD3 (with or without OVA) therapy alone or the untreated controls (Figure 1). Interestingly, increased numbers of Foxp3+ Tregs detected in the islet grafts of the combination therapy-treated mice were reactive to InsB12-20 and less to InsB13-21 (data not shown). Only in the mice treated with the add-on of the islet antigen proinsulin, a higher degree of insulin-reactive Tregs in the islet grafts was observed. Moreover, these insulin-reactive Tregs were preferentially observed in the islet grafts but not in the kidney draining lymph nodes (KLN)(Figure 1), indicating that these cells trafficked to the inflammatory sites where they may suppress persistent effector T cell function.
Conclusion: This study provides for the first time strong evidence for the antigen specificity of our L. lactis-based antigen immunotherapy as PINS was needed for Foxp3+ Tregs to become insulin-reactive and home to insulin-containing islet grafts.

Disclosure: P. Martens: None.
370
MiR-375 levels in newly diagnosed type 1 diabetes: results from a phase 2, multicentre, randomised, placebo controlled trial (MEX0114)
L. Piemonti1, V. Lampasona1, I. Marzinotto1, E. Bosi1, P. Pozzilli2, F. Giorgino3, E. Cossu4, T. Linn5, L. Rose6, B. Keymeulen7, P. Gillard8, L. Daffonchio9, P. Ruffini9, A.R. Maurizi9, M. Allegretti9;
1Diabetes Research Institute, San Raffaele University Hospital, Milan, Italy, 2University Campus Bio-Medico, Rome, Italy, 3AOU Policlinico Consorziale, Bari, Bari, Italy, 4Policlinico Monserrato, Cagliari, Italy, 5Universitaetsklinikum Giessen und Marburg GmbH, Giessen, Germany, 6Institut fuer Diabetesforschung GmbH, Munster, Germany, 7Diabetes Research Institute, UZ Brussel Diabetes Clinic, Brussels, Belgium, 8Diabetes Research Institute, University Hospitals, Leuven, Belgium, 9Dompé Farmaceutici SPA, Milan, Italy.
Background and aims: Ladarixin (LDX), an investigational CXCR1/2 inhibitor, is able to reduce inflammatory process in NOD mice leading to prevent and reverse type 1 diabetes (T1D). Recently, we completed a phase II clinical study [MEX0114] in newly diagnosed T1D patients aimed to evaluate LDX efficacy to preserve β-cell function. miR-375 the most abundant microRNA in β-cells has been investigated as marker of β-cell death and glucotoxicity. Specifically, it was found that serum levels of miR-375 are lower in newly T1D children versus age-matched healthy subjects, suggesting altered miR-375 may represent a biomarker of functional failure. Within MEX0114 trial we measured miR-375 circulating levels as a predictive factor for preservation of β-cell function following LDX treatment.
Materials and methods: 76 T1D adult patients (aged 18-45 years), within 100 days from first insulin administration, were randomized 2:1 toLDX 400 mg twice daily or placebo (PLA) over 3 cycles of 14 days on and 14 days off drug and followed-up for 12 months. Primary endpoint was 2-hour area under the curve (AUC) of C-peptide after Mixed Meal Tolerance Test (MMTT) evaluated at the end of treatment period (week 13 ±1). In a post hoc exploratory analysis change in C-peptide AUC was evaluated after patients stratification in LDX or PLA groups according to baseline median level of miR-375. Within the two cohorts 2-hour C-peptide AUC after MMTT (log(x+1) transformed data) were analysed by Student t-test for unpaired data.
Results: At week 13 no difference was observed for primary endpoint (p=0.337). Notwithstanding, in a pre-specified analysis of the subset with “severe T1D onset” [identified as baseline fasting C-peptide <0.205 nmol/L (median value of trial population)] LDX showed a trend over PLA (p=0.111), reaching statistical significance at week 26 (p=0.041). Moreover, at week 26 patients with HbA1c <7% and daily insulin requirement <0.50 IU/kg/day were 76.6% in LDX vs 45.8% in PLA group in ITT and 84% in LDX vs 33.3% in PLA group in “severe T1D onset” subset, respectively (p=0.0095; p=0.0042). Baseline median miR-375 level was 2200 copies/mL in ITT population and 55.6% patients with miR-375 <2200 copies/mL had baseline fasting C-peptide <0.205 nmol/L. In patients with miR-375 <2200 copies/mL, C peptide AUCs at week 13 and 26 were significantly different between LDX and PLA groups (p=0.02 and p=0.01, respectively). No difference in C peptide AUC were found between the two arms in subjects with miR-375 >2200 copies/mL.
Conclusion: Analysis of the candidate biomarker miR-375 in MEX0114 trial support potential efficacy of LDX to preserve β-cell function in newly diagnosed T1D patients with lowest miR-375 levels. Based upon the results of this phase II trial, further investigation of LDX and biomarkers for patient stratification in new onset T1D might be warranted.
Clinical Trial Registration Number: NCT02814838
Disclosure: L. Piemonti: None.
PS 18 Beta cells under stress
371
Proinflammatory cytokines impact beta cell lipidome
E. Gurgul Convey1, S. Coldewey2, M. Gräler2;
1Hannover School of Medicine, Hannover, 2Jena University Hospital, Jena, Germany.
Background and aims: Type 1 diabetes (T1DM) is an autoimmune disease, characterized by a progressive and specific death of pancreatic beta cells as a result of infiltration of islets with activated immune cells. The trigger of the beta-cell specific autoimmune response as well as the beta-cell specific factors involved in the development of T1DM, are not yet fully understood. Previous studies suggest that children who progress to T1DM later in life have a distinct serum lipid profile at birth, characterized by a lower component of certain lipids, especially phospholipids and sphingomyelins, and a higher amount of cholesterol esters. Earlier investigations indicate that beta-cells are characterized by a unique expression pattern of enzymes regulating lipid biosynthesis, which undergoes alterations upon exposure to cytokines. Cellular lipid composition plays an important role in antigen presentation, pathogen recognition and modulates signal transduction. Phospholipids were shown to protect beta cells against cytokine toxicity. So far little is known about beta cell lipidome under T1DM development. Therefore the aim of this study was to analyse the influence of the major proinflammatory cytokines involved in beta cell death on beta-cell lipidome.
Materials and methods: Insulin-secreting INS1E cells were incubated with 600 U/ml IL-1β or a cytokine mixture (60 U/ml IL-1β, 175 U/ml TNFα, 10 U/ml IFNγ) for 24 h. Thereafter lipids were extracted by a methanol-based method and the lipidome was analyzed by LC-MS/MS.
Results: Exposure of INS1E cells to proinflammatory cytokines significantly affected the cellular lipid composition. Phospholipids were the major lipid species identified to be strongly reduced in cytokine-treated cells (especially the content of lysophosphatidylcholine, lysophosphatidylenthanolamine, lysophosphatidylinositol as well as phosphatidylethanolamine and phosphatidylcholine). Interestingly, lyso-PAF (alkylated lysophosphatidylcholine), which has been shown to enhance insulin secretion, was dramatically decreased in cytokine-treated cells. In contrast, ceramide species 15:0-24:0 that mediate apoptosis were upregulated. Sphingosine and sphingosine-1 phosphate were downregulated by around 25%, in contrast to sphingomyelin that was significantly increased in the presence of cytokines. The level of lactosylceramide, which is the branching point in the biosynthesis of glycosphingolipids and may play an important role in pathogen recognition and antigen presentation, was elevated upon exposure to cytokines. Cytokines mediated also an increase of cholesterol content, a phenomenon that was shown to weaken membrane-cytoskeleton association (membrane blebbing) and alter signal transduction.
Conclusion: Our results indicate that the intracellular lipid molecular species repertoire of beta-cells closely resembles the lipid profile described in T1DM patients. Beta-cell lipid composition alternations may serve as a novel mechanism of cytokine toxicity and beta-cell lipidomics may be a promising tool for identification of novel targets for beta-cell-specific protective approaches.
Disclosure: E. Gurgul Convey: None.
372
HSPB1 is essential for inducing resistance to proteotoxic stress in beta cells
L. Labriola1,2, V.M. Gomes1, R.A.M. Wailemann1, D.R.Q. Almeida1, G.S. Arini1, A.F. dos Santos1, L.F. Terra1, S. Lortz3;
1Dept. of Biochemistry, University of São Paulo, São Paulo, Brazil, 2Institute of Physiological Chemistry, University of Ulm, Ulm, Germany, 3Institute of Clinical Biochemistry, Hannover Medical School (MHH), Hannover, Germany.
Background and aims: During the development of type 1 diabetes (T1DM), beta-cells undergo endoplasmic reticulum (ER) stress and apoptosis via activation of the Unfolded Protein Response (UPR). We have previously shown that prolactin, via increasing Heat Shock Protein B1 (HSPB1) levels, induced protection against pro-inflammatory cytokines, ER-stressors or redox imbalance-induced beta-cell death. Previous results from our group have shown that, in beta-cells, proteins involved in protein quality control were clients of HSPB1 only when the levels of this chaperone were upregulated. Since the role of HSPB1 in beta-cells has not been directly studied we set out to unveil the molecular mechanisms involved in HSPB1-induced resistance to proteotoxic stress in beta-cells.
Materials and methods: HSPB1 overexpressing (OX) or silenced (shHSPB1) Min6 cells or primary cultures of mouse islets and their respective controls were incubated with cytokines (TNFα, IFNγ and IL-1β) or ER stress inducing agents (tunicamycin or thapsigargin) in the presence or absence of a pharmacological inhibitor of proteasome activity (MG132). Members of the main signaling pathways involved in UPR were analyzed by western blot after different times of ER stress induction in beta-cells.
Results: In this study we could show that only increased levels of HSPB1 were able to inhibit apoptosis induced by ER-stressors or cytokines- in Min6 cells significantly (p<0.05; % tunicamycin-induced cell death: Ox=17.15+2.19% vs. control=48.34+4.33%) as well as in primary mouse islets (% tunicamycin-induced cell death: Ox=9.76+0.79% vs. control=35.55+3.18%). In order to counterbalance cytotoxic pathways elicited by cytokines or ER-stressors such as up-regulation of CHOP , increased levels of HSPB1 promoted a significant inhibition of some of the UPR’s components linked to apoptosis induction (more than 50% reduction of CHOP expression in OX cells compared to silenced or control cells). An overall increase in protein ubiquitination levels was observed only in primary mouse islets presenting increased amounts of HSPB1. However, in both types of OX cells, proteasomal inhibition was able not only to significantly increase beta-cell death but also to potentiate the pro-apoptotic effect of cytokines or ER-stressors. By monitoring the speed of the ubiquitin-proteasome system to degrade proteins, we also found that higher levels of HSPB1 were able to promote a significant increase in protein degradation (increase of around 30% after 9 h of ER stress induction compared to control cells). Thus, we hypothesized that HSPB1 was able to reduce proteotoxicity and consequently beta-cell death via an initial increase in ubiquitin-tagged proteins as well as of the rate of Endoplasmic-Reticulum-Associated Protein Degradation (ERAD).
Conclusion: Collectively, our data showed that in beta-cells HSPB1 induced an increase of the proteolytic capacity and resistance to proteotoxic stress. These results could further contribute to generate efficient strategies leading to higher cell viability and thus to an optimization of beta-cell replacement therapies in diabetic patients.
Supported by: EFSD; DFG; FAPESP; CAPES; CNPq
Disclosure: L. Labriola: Grants; Research Training Group 1947 (BioX) of the Deutsche Forschungsgemeinschaft (DFG, Germany), European Foundation for the Study of Diabetes (EFSD, Germany), CNPq, Brazil [grant numbers 441878/2014-8, 151.
373
Phasor-flim analysis of beta cell metabolic trajectory upon glucose stimulation
G. Ferri1, M. Tesi2, F. Massarelli3, L. Marselli2, P. Marchetti2, F. Cardarelli1;
1NEST Laboratory, Scuola Normale Superiore, Pisa, 2Department of Clinical and Experimental Medicine, Islet Cell Laboratory, University of Pisa, Pisa, 3Physics department "E. Fermi", University of Pisa, Pisa, Italy.
Background and aims: A cascade of highly regulated biochemical processes connects glucose stimulation to insulin secretion in specialized cells of mammalian pancreas, the β-cells. Despite the central role of β-cells for systemic glucose homeostasis, there is a lack of non-invasive and fast strategies to identify their metabolic state in both physiological and pathological conditions.
Materials and methods: To tackle this issue, here we use reduced NAD(P)H species as intrinsic metabolic biomarkers and the Phasor approach to Fluorescence Lifetime IMaging (FLIM) microscopy on INS-1E cells as a quantitative, non-invasive and label-free measure of the metabolic signature in terms of the ratio of free and protein-bound NAD(P)H under different conditions.
Results: our data demonstrate that the NAD(P)H Phasor-FLIM signature distinguishes non-invasively INS-1E from non-β-like-cells for their metabolic response to glucose stimulation. INS-1E cells follow a metabolic trajectory from a glycolytic phenotype (maintenance condition) to an oxidative-phosphorylation phenotype (upon stimulation with glucose); non-β-cells are not responsive to the same treatment. We also demonstrate that such INS-1E metabolic trajectory is impaired by 48-hours pre-incubation under hyperglycemic conditions. Under hyperglycemic conditions, we can simultaneously monitor the appearance of intracellular characteristic long-lifetime species (LLS) as products of oxidative stress
Conclusion: In conclusion, Phasor-FLIM NAD(P)H signature identifies the peculiar response of INS-1E to glucose stimulation, in accordance with its unique commitment to secretion, in maintenance and hyperglycemic conditions and to reveal the presence of oxidative stress products in this latter.
Supported by: Rhapsody and INNODIA (H2020-IMI2), T2DSystems (H2020) and MIUR PRIN Grant (2017YF9FBS)
Disclosure: G. Ferri: None.
374
RhoG mediates pancreatic beta cell dysfunction under the duress of metabolic stress
A. Kowluru, S. Chundru;
Wayne State University, Detroit, USA.
Background and aims: Published evidence implicates regulatory roles for small G proteins (Arf6, Cdc42, Rac1) in glucose-stimulated insulin secretion (GSIS) from pancreatic beta-cells. More recent evidence suggests novel roles for these G proteins, specifically Rac1, in the onset of metabolic dysfunction and demise of the islet beta-cell under the duress of a variety of metabolic stress conditions. However, potential upstream regulators of sustained activation of Rac1 have not been identified in the beta-cell. In this context, studies in other cell types have identified RhoG, a small G protein, as an upstream regulator of Rac1 under specific experimental conditions. Therefore, we examined putative roles for RhoG in islet beta-cell dysfunction induced by chronic exposure to metabolic stress (glucotoxicity) conditions.
Materials and methods: INS-1 832/13 cells, rat islets and human islets were cultured in RPMI complete medium under basal (2.5mM glucose) and metabolic stress (20mM glucose; 24 hr) conditions. Nuclear and non-nuclear fractions from cell lysates were isolated using a commercially available kit. Endogenous expression of RhoG was suppressed by siRNA. Insulin secretion was quantified by ELISA. Rac1 activation was assessed using a pull-down assay kit. Degree of caspase-3 activation was determined by Western blotting.
Results: Western blot analysis indicated that RhoG is expressed in INS-1 832/13 cells, human and rat islets. siRNA-mediated knockdown of RhoG (~55%) exerted no effects on basal or GSIS in INS-1 833/13 cells. These data indicate minimal roles for RhoG in GSIS. Chronic exposure of these cells to metabolic stress (20mM; 24 hours) resulted in increased expression of RhoG. We have recently reported increased translocation of Rac1 to the nuclear fraction in INS-1 832/13 cells, rodent and human islets under metabolic stress. In a manner akin to Rac1, sub-cellular fractionation studies revealed increased translocation of RhoG to the nuclear fraction in INS-1 832/13 cells exposed to glucotoxic conditions (3.44 ± 0.80 fold; n=4; p<0.05). Furthermore, siRNA-mediated depletion of endogenous RhoG markedly attenuated sustained activation of Rac1 (HG mock-1.63±0.25 fold; HG Contsi-1.57±0.79 fold; and HG RhoGsi-0.91±0.54 fold; n=3; p< 0.05) and activation of downstream caspase-3 (i.e., mitochondrial dysfunction; HG Mock-3.61±1.79 fold ; HG RhoGsi-1.41±0.87 fold; n=4; p< 0.05) in INS-1 832/13 cells exposed to glucotoxic conditions.
Conclusion: Based on these data we conclude that RhoG plays critical regulatory roles in promoting Rac1-mediated metabolic dysregulation of the islet beta-cell under the duress of metabolic stress. Studies are in progress to identify potential mechanisms underlying RhoG activation (e.g., guanine nucleotide exchange factors) leading to acceleration of signaling events that underlie beta-cell dysfunction under metabolic stress conditions.
Supported by: Department of VA
Disclosure: A. Kowluru: None.
375
Increased rate of insulin folding generates H2O2 in the lumen of the endoplasmic reticulum and induces ER stress
B. Vidrio Huerta, S. Lortz;
Institute of Clinical Biochemistry, Hannover Medical School, Hannover, Germany.
Background and aims: Early stages of type 2 diabetes (T2DM) are characterized by high requirements of insulin to compensate insulin resistance. During insulin folding in the ER, the formation of disulphide bonds is mediated by the protein disulphide isomerase (PDI) and the sulfhydryl oxidase endoplasmic reticulum oxidoreductin 1 (ERO1) generating H2O2 as a by-product. The increased rate of insulin folding and the induced generation of H2O2 have been proposed as a cause of oxidative stress, activation of the unfolded protein response (UPR) and endoplasmic reticulum (ER) stress. These mechanisms combined with the characteristic low expression of antioxidative enzymes in β cells could lead to β cell dysfunction and progression of T2DM. However, the lack of effective tools to study the H2O2 production in the lumen of the ER hampers the confirmation of this hypothesis. Using TriPer, a novel fluorescent protein capable to sense H2O2 in the ER, together with an inducible insulin expression system, we studied the generation of H2O2 in the ER as a consequence of insulin folding. Additionally, potential effects on ER stress and cell dysfunction were characterized.
Materials and methods: To study the formation of H2O2 in the ER caused by increased insulin folding RINm5F cells were transduced with TriPer. Additionally, to exclude oxidative stress caused by glucose metabolism, these cells were co-transduced with a doxycycline-inducible system for the expression of human wild type insulin (Tet-On-WT-INS) or folding-deficient insulin (Tet-On-C96Y-INS), also known as Akita insulin. The expression of C96Y-INS was opted as a model to study the ongoing and accelerating effects of accumulative unfolded/misfolded insulin inside the ER. Additionally, overexpression of catalase targeted to the ER was used to verify the specificity of H2O2 related effects. After insulin induction, TriPer fluorescence was analysed by microscopy, UPR gene expression by qPCR and cell viability by MTT assay.
Results: After 72 h of WT-INS and C96Y-INS induction, a significant increase of H2O2 in the lumen of the ER was detected by reduction of TriPer fluorescence ratio. The highest concentration of H2O2 was identified through changes on TriPer fluorescence ratio in cells expressing C96Y-INS, being higher than the level reached after exogenous administration of 100 μM H2O2. In cells co-expressing ER catalase the induction of WT-INS or C96Y-INS did not elevated the concentration of H2O2. Upregulation of Xbp1s was shown in both models but only the induction of C96Y-INS triggered a significant two fold increase of Atf4 and Chop expression compared with non-induced cells. The co-expression of catalase reduced this UPR activity. Viability of Tet-On-WT-INS cells was reduced by 8%, whereas Tet-On-C96Y-INS cells showed a reduction of 19.2% compared with non-induced cells. Unexpectedly, cell viability was not enhanced by overexpression of ER catalase.
Conclusion: The results of this study suggest that increased insulin folding promotes the generation of H2O2 inside the ER and the activation of ER stress. Presumably, a long course of high insulin demand could overload the folding machinery of the ER, leading to ER stress, accumulation of un/misfolded insulin and higher generation of H2O2 impacting β cell viability. Therefore, a better understanding of the pathophysiological mechanisms involved in H2O2 generation by increased insulin folding could further elucidate β cell dysfunction during the progression of T2DM.
Supported by: CONACYT/DAAD
Disclosure: B. Vidrio Huerta: Grants; CONACYT/DAAD Scholarship.
376
Enhancement of palmitate-induced lipotoxicity in INS-1E cells by the HIV medications efavirenz and rilpivirine
S.C. Maandi, J.G. Mabley;
School of Pharmacy and Biomolecular Sciences, University of Brighton, Brighton, UK.
Background and aims: Lipotoxicity plays a key role in type 2 diabetes mellitus (T2DM) onset and progression by impairing β-cell function and survival. HIV medications have been linked to an increased risk of developing T2DM through side effects such as insulin resistance and lipodystrophy, with 1 in 5 people living with HIV developing T2DM. Non-nucleoside reverse transcriptase inhibitors (NNRTIs), a central component of anti-HIV therapy, include the 1st generation drug efavirenz and 2nd generation drug rilpivirine, both of which have been linked to complications that increase risk of T2DM development. Both drugs have also been shown to directly impair β-cell function but at supraphysiological concentrations. Therefore, the aim of this study was to determine whether β-cell dysfunction induced by palmitate was enhanced in the presence of clinical concentrations of efavirenz and rilpivirine.
Materials and methods: The rat β-cell line INS-1E was used to analyse the effects of palmitate (PA) in combination with clinical concentrations of rilpivirine or efavirenz. INS-1E cells were exposed to PA (10 or 30 μM) alone or in combination with rilpivirine or efavirenz (0.3, 3 or 10 μM) for 24 hours, before measuring glucose-stimulated insulin secretion (GSIS) by ELISA after exposure to 20 mM glucose for 30 minutes, cell viability using the MTT assay and oxidative stress by confocal analysis following staining with the dichloro-dihydro-fluorescein diacetate (DCFH-DA) fluorogenic dye. Mitochondrial membrane potential (ΔΨmt) was determined by flow cytometry following treatment with tetramethylrhodamine ethyl ester (TMRE). Data is expressed as mean ±SEM and statistical analysis was carried out using one-way ANOVA and Bonferroni correction. P<0.05 was considered as significant.
Results: PA (10 μM), rilpivirine (0.3 μM) and efavirenz (3 μM) alone had no significant effect on INS-1E cell function. However, when applied in combination, rilpivirine (0.3 μM) or efavirenz (3 μM) plus PA (10 μM) significantly inhibited GSIS by 37.3±6% and 45±5%, respectively (p<0.01 vs. untreated cells and PA, rilpivirine or efavirenz alone), while significantly increasing oxidative stress from 0.29±0.07 relative fluorescent units (RFU) to 1.09±0.2 RFU and 1.2±0.5 RFU, respectively (p<0.05 vs. untreated cells and PA, rilpivirine or efavirenz alone). The combination of rilpivirine (0.3 μM) or efavirenz (3 μM) plus PA (10 μM) significantly disrupted the ΔΨmt, with the combination of PA plus rilpivirine increasing it by 65.8%±7% (p<0.01 vs. untreated cells and PA or rilpivirine alone) while the combination with efavirenz decreased it by 36.5±9% (p<0.05 vs. untreated cells and PA or efavirenz alone). PA (30 μM), rilpivirine (3 μM) and efavirenz (10 μM) alone had no significant effect on INS-1E cell viability. However, the combinations of PA (30 μM) with rilpivirine (3 μM) or efavirenz (10 μM) reduced INS-1E cell viability by 25.1±5% and 21.5±2%, respectively (p<0.05 vs. untreated cells and PA, rilpivirine or efavirenz alone).
Conclusion: In this study we have demonstrated that the commonly used HIV drugs efavirenz and rilpivirine enhance the lipotoxic effects of palmitate on β-cell function and viability, likely through synergistic mitochondrial damaging effects resulting in increased cellular oxidative stress. From a clinical perspective, this could mean that HIV positive patients with T2DM are potentially more prone to developing insulin dependency, thus impacting the healthy ageing of this population.
Disclosure: S.C. Maandi: None.
377
Phosphoproteome reveals molecular mechanisms of antagonistic effects of sympathetic and parasympathetic neurotransmitters on different islet hormones secretion
Y. He, Q. Fu, K. Xu, M. Zhang, H. Jiang, R. Gao, Y. Qian, Y. Liu, X. Xu, H. Chen, T. Yang;
Department of Endocrinology and Metabolism, The First Affiliated Hospital of Nanjing Medical University, Nanjing, China.
Background and aims: Norepinephrine (NE) and acetylcholine (ACh) are important neurotransmitters of sympathetic and parasympathetic nerves, which play antagonistic roles in regulating different islet hormones secretion. Phosphorylation is reported as a critical post-translational modification participates in neural regulation on various physiological activities in islet. However, the molecular mechanisms of these two transmitters in islet are unknown and whether the neuronal regulation is abnormal in diabetes mellitus also unclear.
Materials and methods: Immunofluorescence multi-staining and co-localization assay were used to reveal the location of neural markers and receptors of NE or ACh in islet, and the effects of these two transmitters on different islet hormones secretion were also revealed by islet perfusion. Furthermore, quantitative proteomics and phosphoproteome analysis were performed on murine islet after short time stimulation with NE or ACh in vitro, and the regulatory kinases were predicted by motif analysis and further verified in different islet cell lines through SiRNAs. Also, diabetic mice with various islet functions were all used to investigate whether neuromodulation disorder was associated with islet dysfunction.
Results: Specific markers (TH, NET and VAChT) and different receptor subtypes of neurotransmitters NE and ACh were highly expressed in islet and distributed differently in alpha, beta and delta cells. Also, the results of islet perfusion revealed that NE and ACh had significantly different roles in regulating islet hormones secretion. A total of 3791 phosphorylated proteins, 10593 phosphorylated peptides and 15377 phosphorylation sites were detected in islets after stimulation with NE or ACh in vitro, whereas the changes of proteomics were not significant. These phosphorylated proteins were involved in many important biological and pathological processes, such as synaptic signaling transduction, calcium channel opening and diabetes mellitus related signaling pathways. Then, 23 kinds of protein kinases were predicted by motif analysis in this study, and the key kinases (CDK10, Krs-2, Map3k1, ERK2/3, JNK1 and PKACB) and substrate proteins (CADPS, c-FOS, Stat5a, Sik2 and Mlxipl) related to hormones secretion regulated by ACh or NE were found through SiRNAs in different islet cell lines. However, these critical kinases expression was found significantly decreased in pancreatic islet of diabetic mice (STZ mice, NOD mice and db/db mice) with poor islet functions. Also, the neural regulation on islet hormones secretion was found could be improved by activation of critical muscarinic and noradrenergic receptors and key kinases in diabetic mice in this study.
Conclusion: Pancreatic islet is importantly innervated by neurotransmitters NE and ACh, which significantly affect different islet hormones secretion. Protein phosphorylation and dephosphorylation is one of the important ways of nerves to regulate islet hormones secretion through many critical kinases. Various receptors and regulatory kinases of NE and ACh were abundantly expressed in islet, and the neuroregulatory dysfunction in islet is significantly improved by activation of key receptors and kinases, which may provide a promising therapeutic method for treatments of diabetic patients into the future.
Supported by: NSFC (81830023, 81530026)
Disclosure: Y. He: None.
PS 19 To live and let die: a beta cell perspective
378
Short-term induction of YAP fosters beta cell proliferation and beta mass expansion
M. Madduri, M. Elawour, S. Rafizadeh, K. Maedler, A. Ardestani;
Centre for Biomolecular Interactions Bremen, University of Bremen, Bremen, Germany.
Background and aims: Loss of functional pancreatic beta-cells is a major hallmark of both type 1 diabetes (T1D) and type 2 diabetes (T2D). Identifying the pathways to regenerate endogenous proliferation of quiescent beta-cells is a promising strategy for beta-cell-targeted therapy of diabetes. The Hippo signaling pathway has emerged as a master regulator of organ size and tissue homeostasis. The major downstream transcriptional regulator of the Hippo pathway is Yes Associated Protein (YAP) which acts mainly through TEA domain (TEAD) family transcription factors to promote the expression of target genes required for proliferation and survival. Highly expressed during embryogenesis, YAP is one of the “disallowed” genes in mature pancreatic β-cells. Overexpression of the active form of YAP induces robust beta-cell proliferation in isolated human islets while beta-cell function and functional identity genes are fully preserved. Here we investigated whether transient beta-cell selective induction of YAP fosters beta-cell regeneration in mice.
Materials and methods: We have generated doxycycline (Dox) inducible beta-cell specific Rip-Ins2-TetO-hYAP1-S127A (beta-YAP) mice through crossing inducible active overexpressing YAP (Teto-YAPS127A) mice with mice carrying the tTA tetracycline transactivator under the control of the insulin promoter (RIP-rtTA). We overexpressed YAP by Dox administration in drinking water for two weeks and analyzed pancreatic sections for proliferation by pHH3 and Ki67, beta-cell functional markers (PDX1 and NKX6.1), glucose transporter GLUT2 and beta-cell mass. Blood glucose levels, glucose tolerance and insulin secretion were monitored during two weeks in control and beta-YAP mice.
Results: Dox administration in adult mice led to a robust beta-cell selective induction of YAP in isolated islets, confirmed by IHC and Western blot. Consistent with YAP overexpressing human islets, YAP profoundly induced beta-cell proliferation, seen by increased Ki67- as well as pHH3-positive beta-cells, compared to the Dox-untreated control group. Beta-specific YAP-overexpressing mice showed a very robust, up to 12-fold increased beta-cell proliferation, compared to non-Dox treated YAP negative littermates, together with a remarkable beta-cell mass expansion. Pancreatic islets looked morphologically normal with typical islet structure and cellular composition (physiological alpha-beta-cell distribution) as well as normal unchanged expression of beta-cell functional identity genes such as PDX1, GLUT2, and NKX6.1 without any sign of beta-cell dedifferentiation. Both male and female beta-YAP mice showed similar fasted glucose and insulin levels, as well as glucose tolerance and insulin secretion, compared to the Dox-untreated control group.
Conclusion: Our results suggest that YAP fosters beta-cell regeneration, and that transient restoration of YAP increases beta-cell mass without showing any major cellular or systemic metabolic deregulation. YAP has a strong pro-proliferative activity in human islets in vitro and in mice in vivo and might be a novel target for beta-cell regenerative therapy to prevent loss of the functional pancreatic beta-cell mass in diabetes.
Supported by: JDRF
Disclosure: M. Madduri: None.
379
Hub mRNA and lncRNA co-expression network analysis reveals novel ceRNA mechanism for GLP-1RA-mediated protection in beta cells
L.J. Cui1, T. Bai1, H.H. Yang1, L.P. Zhi1, Z.H. Liu1, T. Liu1, H. Xue1, X.H. Yang1, X. Zhao1, Z.T. Wen1, Z.H. Lu1, Y.F. Liu2, Y. Zhang1;
1Department of Pharmacology, Shanxi Medical University, Taiyuan, 2Department of Endocrinology, First Affiliated Hospital of Shanxi Medical University, Taiyuan, China.
Background and aims: Studies have shown that long noncoding RNAs (lncRNAs) and mRNAs are widely involved in various physiological and pathological processes. It is well-known that GLP-1 receptor agonist (GLP-1RA) is a novel therapeutic strategy that could promote insulin secretion and decrease β-cell apoptosis in diabetes. However, lncRNA and mRNA function in this process has not been fully elucidated. Hence, this study aimed to reveal the role of lncRNAs and mRNAs involved in the protective effect of GLP-1RA in pancreatic β cells.
Materials and methods: Rat microarray was used to screen differentially expressed (DE) lncRNAs and mRNAs in β cells exposed to geniposide, a GLP-1RA. Biological information analysis were performed with databases such as David, String, Cytoscape plugin-CytoHubba, SwissTargetPrediction, MiRanda and TargetScan to explored ceRNA mechanism for GLP-1RA-mediated protection in β cells.
Results: We identified 308 lncRNAs and 128 mRNAs with a fold change filter of ≥ 1.5 and P-value < 0.05. Gene Ontology (GO) and Kyoto Encyclopedia of Genes and Genomes (KEGG) pathway enrichments were performed to assess the underlying functions of DE mRNAs and indicated that the most enriched GO and KEGG pathway terms were G-protein coupled receptor signaling pathway, inflammatory response, calcium signaling pathway, positive regulation of cell proliferation, and ERK1 and ERK2 cascade. Pomc, Htr2a, and Agtr1a were filtered as hub mRNAs through the String database and the Cytoscape plugin, CytoHubba. This result was further verified by SwissTargetPrediction. In order to reveal the regulatory relationship between lncRNAs and hub mRNAs, their co-expression network and competing endogenous (ceRNA) mechanism was explored. We identified 7 lncRNAs (NONRATT027738, NONRATT027888, NONRATT030038, etc.) co-expressed with 3 hub mRNAs (Pomc, Htr2a, and Agtr1a) based on the Pearson coefficient of the expression level. These lncRNAs regulated hub mRNA functions by competing with 6 miRNAs (rno-miR-5132-3p, rno-miR-344g, rno-miR-3075, etc.) via the ceRNA mechanism. Further analysis of the ceRNA network indicates that lncRNA NONRATT027738 interacted with all 3 hub mRNAs, suggesting that it was at a core position and had a broader regulatory relationship within the ceRNA network.
Conclusion: In summary, our current study revealed the lncRNA and mRNA profile in GLP-1RA geniposide-treated INS-1 cells. Further exploration via biological information analysis demonstrated that the ceRNA mechanism is involved in the regulatory relationship between lncRNAs and mRNAs in β cells. These findings provide significant insight into an understanding of the mechanism of GLP-1RA function at the transcript level.

Supported by: NSFC (81670710; 81770776; 81973378), FSKSC and 1331KSC, SXKJ201901D211323
Disclosure: L.J. Cui: Grants; NSFC (81670710; 81770776; 81973378), Cultivate Scientific Research Excellence Programs of Higher Education Institutions in Shanxi (2019KJ02), Advanced Programs of Shanxi for the Returned Overseas Chinese Scholars (2016-97), Research Project Supported by the Shanxi Scholarship Council of China (2017-053), FSKSC and 1331KSC, Department of Education Innovation Project in Shanxi Province (2019BY078), Innovation and Entrepreneurship Training Program for College Students in Shanxi Province.
380
Effects of incretin-based drugs and irisin in pancreatic beta cells treated with pasireotide
G. Biondi1, A. Natalicchio1, N. Marrano1, A. Borrelli1, L. Vincenti2, A. Cignarelli1, S. Perrini1, L. Laviola1, F. Giorgino1;
1University of Bari Aldo Moro, Bari, 2Division of General Surgery, University Hospital Policlinico Consorziale, Bari, Italy.
Background and aims: Pasireotide is a new-generation somatostatin analog, used for the treatment of acromegaly, Cushing's disease and neuroendocrine tumors. However, due to its high affinity for somatostatin receptors (SSTR) 2 and 5, highly expressed in enteroendocrine cells and pancreatic beta-cells, it can reduce insulin, GLP-1 and GIP release, causing marked hyperglycemia in some patients. The diabetogenic effects of pasireotide are significantly reduced in vivo by the co-administration of liraglutide or vildagliptin. The aim of the present study was to evaluate the effects of pasireotide on beta-cell survival and function, and the ability of molecules with known beneficial action on beta-cells (incretin-based drugs and irisin, a myokine with trophic properties on beta-cells) to prevent these effects.
Materials and methods: Rat insulinoma INS-1E cells and human pancreatic islets were acutely (2 h) or chronically (24 h) stimulated with different doses of pasireotide (1-1000 nmol/l) or with DMSO as control. In another set of experiments, INS-1E cells were pretreated with an incretin-based drug (10 nmol/l exendin-4, lixisenatide, or liraglutide, or 100 nmol/l saxagliptin) or 100 nmol/l irisin for 24 h, and successively stimulated with 10 nmol/l pasireotide for 24 h. Glucose-induced insulin secretion (GSIS), insulin content, and apoptosis were assessed through specific ELISA assays, while proinsulin mRNA and SSTR2/5 protein levels were evaluated by RT-qPCR and immunoblotting, respectively.
Results: In INS-1E cells, both acute administration of 10 nmol/l pasireotide and chronic administration of 50 nmol/l pasireotide reduced GSIS by 30% and 50%, respectively (p < 0.05); chronic administration of pasireotide (at all tested doses) was also able to reduce proinsulin mRNA levels by about 20% (p < 0.05), without altering insulin content. Furthermore, 10 nmol/l pasireotide for 24 h increased apoptosis levels in INS-1E cells (2.9 fold, p = 0.005) and human pancreatic islets (2.0 fold, p = 0.002). Pretreatment with both incretin-based drugs and irisin was able to prevent pasireotide-induced apoptosis in INS-1E cells (p < 0.05). In addition, pasireotide increased the protein levels of SSTR2 (2.1 fold, p = 0.01) but not of SSTR5. Among the protective molecules examined, only irisin was able to prevent this increase (p = 0.02).
Conclusion: Pasireotide can induce hyperglycemia and diabetes by reducing beta-cell function and survival. Both incretin-based drugs and irisin are able to reduce the proapoptotic effects of pasireotide, acting through partly different mechanisms. These results demonstrate for the first time a functional antagonism between SSTR2/5 activation and incretin-based drugs/irisin in pancreatic beta-cells.
Supported by: Novartis
Disclosure: G. Biondi: None.
381
Effect of the selective serotonin reuptake inhibitor paroxetine on mouse beta cell function
K. Toczyska, E.L. Hubber, B. Liu, S.J. Persaud;
Department of Diabetes, King's College London, London, UK.
Background and aims: Selective serotonin reuptake inhibitors (SSRIs) are widely prescribed antidepressants that act by blocking the serotonin transporter (SERT) in the brain. They have good tolerability and fewer side effects than most types of antidepressants, and therefore they are the first-choice medication for treating depression and anxiety. SSRIs can improve glycaemic control in depressed diabetic patients, but their mode of action has not been established. This study investigated the direct effects of a commonly used SSRI, paroxetine, on mouse beta cell function, to determine whether SSRIs can act on the endocrine pancreas.
Materials and methods: SERT mRNA and protein expression in MIN6 beta cells and isolated mouse islets ware determined by polymerase chain reaction (PCR) and Western blotting, respectively. MIN6 cells and mouse islets were exposed for 48h to 0.01-0.1μM paroxetine, concentrations that are reached in vivo with therapeutic use of this SSRI. BrdU incorporation into proliferating cells was identified using a colorimetric assay, ATP generation was quantified using the CellTiter-Glo assay and viability was assessed by Trypan blue exclusion. Apoptosis was induced in mouse islets by exposure to mixed pro-inflammatory cytokines (IL-1β, TNFα and IFNγ) and the extent of apoptosis was determined by quantification of caspase 3 and 7 activities and by flow cytometric quantification of annexin V binding. Insulin secretion was measured by radioimmunoassay following perifusion of mouse islets with 0.1μM paroxetine in the presence of 20 mM glucose.
Results: SERT mRNA was detected in MIN6 cells and mouse islets by PCR and the protein expression was confirmed by detection of 71kDa immunoreactive protein by Western blotting. Paroxetine at 0.01μM and 0.1μM did not reduce MIN6 cell or mouse islet viability, as indicated by no increase in cellular Trypan blue uptake, but the same concentrations markedly increased BrdU incorporation into MIN6 cells (OD 450nm, control: 0.102±0.004; 0.01μM: 0.142±0.013; 0.1μM: 0.147±0.015, n=8, P<0.05). Paroxetine also increased ATP production (luminescence units, MIN6: control: 3,798,491±365,772; 0.01μM: 4,767,906±1,802,099; 0.1μM: 5,749,196±93,685, n=7, P<0.01; mouse islets: control: 10,204,936±779,781; 0.01μM: 11,192,462±1,205,581; 0.1μM: 16,829,625±1,331,337, n=8, P<0.001). Exposure of mouse islets to paroxetine did not affect basal mouse islet apoptosis (luminescence units, control: 39,206±6,694; 0.01μM: 39,969±6,691; 0.1μM: 38,408±8,062, n=8, P>0.2). However, paroxetine at 0.01μM decreased cytokine-induced caspase 3/7 activities in mouse islets by 27.2±3.8% (luminescence units, control: 142,197±14,510; 0.01μM: 103,497±14,447, n=7, P=0.08), and this protective effect was confirmed in flow cytometry analysis of annexin V binding (22.7% reduction in apoptosis with 0.1μM paroxetine). Paroxetine also potentiated glucose-induced insulin secretion from perifused mouse islets (AUC, control: 166.3±15.3; 0.1μM: 243.0±25.4, n=4, P<0.05).
Conclusion: This study indicates that low therapeutic concentrations of paroxetine act directly at islets to induce beta cell proliferation, increase ATP generation, protect against cytokine-induced apoptosis and potentiate glucose-induced insulin secretion. These results could explain, at least in part, how paroxetine improves glycaemic control in vivo, and therefore suggest an innovative potential use of this SSRI for treating type 2 diabetes in depressed patients.
Supported by: MRC DTP
Disclosure: K. Toczyska: Employment/Consultancy; MRC DTP.
382
High density lipoproteins and protection against glucolipotoxicity in 1.1B4 beta cells: the role for hsa-miR-21-5p
J. Tarlton, S. Patterson, A. Graham;
Glasgow Caledonian University, Glasgow, UK.
Background and aims: Dyslipidemia is linked to development of type 2 diabetes as it promotes pancreatic β-cell dysfunction and death. High density lipoproteins (HDL) can improve β-cell function and protect β-cells from glucolipotoxicity-induced apoptosis. This research investigated the microRNA (miRNA) profile that mediates the protective effects of HDL against glucolipotoxicity by identifying changes in miRNA expression in a human β-cell model (PANC-1 1.1B4) after treatment with ApoA-I or HDL. MicroRNA-21-5p emerged as one of the sequences moderated by HDL: a mimic and an inhibitor were tested for their ability to replicate the effects of HDL on glucolipotoxicity.
Materials and methods: 1.1B4 β-cells were incubated in glucolipotoxic conditions (serum-free media containing 0.5% fatty-acid free bovine serum albumin, 0.25mM palmitic acid and 30mM glucose) in the presence or absence of ApoA-I (20-80 μg ml-1) or HDL (20-80 μg ml-1) for 24h; the functions of ApoA-I and HDL were confirmed at the same concentrations using a [3H]cholesterol efflux assay. Cell viability was measured by thiazolyl blue tetrazolium bromide (MTT) assay and apoptosis by caspase 3/7 activation. Total RNA was isolated from β-cells treated with 20μg ml-1 ApoA-I or 20μg ml-1 HDL for 24h, and changes in miRNA expression determined by microarray (LC Biosciences). Transfection (HiPerFect reagent) with 5nM miR-21-5p mimic or 10nM miR-21-5p inhibitor, and changes in target genes for miR-21-5p, were confirmed by RT-qPCR.
Results: Glucolipotoxic challenge reduced the viability of β-cells by increasing apoptosis (p<0.005, n=3); HDL co-incubation afforded protection (p<0.005, n=3) by reducing apoptosis (p<0.05, n=4). ApoA-I co-incubation did not offer protect against glucolipotoxicity (n=2). Microarray analysis showed 12 miRNAs upregulated and 9 downregulated by ApoA-I; 4 miRNAs upregulated and 9 downregulated by HDL; two miRNAs were upregulated specifically by HDL, of which one was hsa-miR-21-5p. RT-qPCR verified 1.56-fold increased expression (p<0.05; n=3) of miR-21-5p by HDL. Downstream targets of miR-21-5p, identified by DIANA-miRPath v3.0, showed repression of SMAD7 (0.67-fold expression, p<0.05) and a trend towards down-regulation of STAT3 (0.75-fold expression, p=0.054) and FOXO3a (0.87-fold expression, p=0.146) in cells treated with HDL (n=5). Transfection with miR-21-5p mimic and inhibitor altered miR-21-5p levels (miR-21-5p mimic: 1.37-fold expression, p<0.05, n=6; miR-21-5p inhibitor: 0.84-fold expression p<0.05, n=6). The microRNA-21-5p mimic reduced expression of SMAD7 (0.87-fold expression, p<0.05) and STAT3 (0.70-fold expression, p<0.05); expression of the same targets were not significantly affected by miR-21-5p inhibitor (ns, n=4-6). Transfection with miR-21-5p mimic (ns, n=3) or inhibitor (ns, n=3) prior to glucolipotoxic challenge did not alter glucolipotoxicity. Equally, miR-21-5p inhibitor transfection prior to glucolipotoxic challenge in coincubation with HDL did not appear to affect HDL protection (n=2).
Conclusion: HDL, but not ApoA-I, protect against glucolipotoxicity in human 1.1B4 β-cells; analysis of miRNA sequences regulated by HDL implicate miR-21-5p in this process. However, modulation of miR-21-5p levels (mimic/inhibitor) suggest that altered miR-21-5p levels alone are insufficient to protect against glucolipotoxicity or inhibit the protection of β-cells by HDL. Thus, a network of microRNA in β-cells may be involved in HDL in protection against glucolipotoxicity.
Supported by: GCU PhD srudentship
Disclosure: J. Tarlton: None.
383
Mesenchymal stromal cell derived exosomes improve islet function and survival
S. Caxaria, C. Rackham, T. Aziz, A. King, P. Jones;
Diabetes Department, King’s College London, London, UK.
Background and aims: Mesenchymal stromal cells (MSCs) improve islet function both in vitro and in vivo. These effects are due in part to the MSC secretome, including small vesicles called exosomes which deliver a variety of biologically active molecules. MSC-derived exosomes have potential therapeutic value because of their immunomodulatory and regenerative properties. Our aim was to determine whether the exosome fraction of the MSC secretome is responsible for some of the effects of MSCs on islet survival, viability and function.
Materials and methods: Exosomes were isolated from mouse bone marrow MSC conditioned media (48h in media supplemented with exosome free FBS). Quantification and characterization of exosomes was performed using Nanosight and Imagestream technology. Mouse islets were incubated for 48h with increasing concentrations of MSC-derived exosomes, after which islet function was assessed. Glucose-stimulated (20mM) insulin secretion (GSIS) was assessed in static incubation studies and quantified using radioimmunoassay. The effects of exosome pre-treatment on cytokine-induced apoptosis in islet cells was quantified using a caspase proluminescent assay to measure caspase 3/7 activity.
Results: Nanosight and Imagestream showed a range of MSC-derived exosomes, ranging from 50-200nm in size, although some larger particles were also detected. CFSE staining (an intracellular dye) allowed us to visualize the particles and quantify purity of the preparations. Exosome (Exo) pre-treatment influenced GSIS in a concentration dependent manner. A high concentration (2x10⁶ particles/ml) had detrimental effects on GSIS (control: 651±23%: Exo: 289±45%, p<0.05, n=10); an intermediate concentration (5x10⁵ particles/ml) potentiated GSIS (control: 449±9%: Exo: 656±19% , p<0.05, n= 7); while a lower concentration (4x10⁵ particles/ml) had no significant effects on GSIS (control: 449±9%: Exo: 473±25% , p>0.05, n= 7). We observed similar dose-related effects of MSC-derived exosomes on protecting islets from cytokine-induced apoptosis. Thus, cytokines induced islet cell apoptosis by 136±8% in control islets, while the highest concentration of exosomes (2x10⁶ particles/ml) increased islet apoptosis (166±10%, p<0.05, n=5). A protective effect of exosome pre-treatment on islet apoptosis was observed at 1.25x10⁶ particles/ml (95±6%, p<0.05, n=5) but lower concentrations (5x10⁵ and 2x10⁵ particles/ml) had no significant effect on cytokine-induced apoptosis in islets (138±13% and 152±6%, p>0.05, n=5). Our data suggest that different concentrations of MSC-derived exosomes are required to influence islet insulin secretory responses, or apoptotic responses to inflammatory cytokines, consistent with separate mechanisms of action on these different aspects of islet function and survival.
Conclusion: Here we show that MSC-derived exosomes enhance islet function, both in terms of insulin secretion and in preventing cytokine-induced cell death. The effects of exosomes on islet function were concentration dependent with lower concentrations being beneficial whilst higher concentrations had detrimental effects on islet survival and function. Further studies are required to identify the biologically active cargo delivered by MSC-derived exosomes. Using exosomes to improve islet function and survival could avoid some of the clinical risks associated with MSCs, as exosomes have lower immunogenicity, a higher safety profile and no risk of tumour formation.
Supported by: King's Health Partner's Research and Development Challenge Fund
Disclosure: S. Caxaria: Grants; King's Health Partner's Research and Development Challenge Fund.
384
Exosomes derived from TGF-β1 activated pancreatic stellate cells promote apoptosis of beta cells
X. Zhu1, D. Liu2, Y. Dai3, X. Su4, L. Li1;
1Endocrinology, Zhongda Hospital, School of Medicine, Southeast University, Nanjing, 2Pancreatic Research Institute, Zhongda Hospital, School of Medicine, Southeast University, Nanjing, 3Nanjing Foreign Language School, Nanjing, 4Endocrinology, First Affiliated Hospital of Xinjiang Medical University, Changji, China.
Background and aims: Chronic pancreatitis-related diabetes is associated with the loss of functional β cell mass. Activated pancreatic stellate cells (PSCs), which contribute to fibrosis in chronic pancreatitis, may be involved in β cell dysfunction. Recently, a novel cell-cell communication mediated by exosomes has been discovered. Here, we investigated the effects of exosomes from PSCs stimulated by TGF-β1 on the viability and function of β cells.
Materials and methods: Exosomes in the supernatants of mouse PSC lines were extracted via ultracentrifugation and identified via transmission electron microscopy, nanoparticle tracking analysis, and Western blot. Fluorescence-labeled exosomes were incubated with MIN6 cells for 48 h to detect whether exosomes internalize into MIN6 cells. The supernatant of PSCs was collected with and without TGF-β1 (2 ng/ml) treatment. The exosomes were extracted by ultracentrifugation. MIN6 cells were treated with PBS, C-Exo (exosomes extracted from non-stimulated PSCs), or T-Exo (exosomes extracted from TGF-β1-pretreated PSCs). CCK8 and glucose-stimulated insulin secretion assays were conducted to examine the cell viability and insulin secretion of MIN6 cells after incubation with exosomes. The proliferation and apoptosis rates of MIN6 cells in different groups were measured by bromodeoxyuridine (BrdU), TUNEL, and flow cytometry. The protein expression of Bcl-xl, Bim, and caspase 3 in MIN6 cells was determined by Western blot.
Results: Transmission microscopy showed that the exosomes were elliptical and heterogeneously distributed with a diameter ranging from 30 nm to 100 nm. The volume kurtosis was concentrated between 30 nm and 150 nm, and the exosome marker proteins CD63, CD81, and TSG101 were positive. The co-incubation results of fluorescence-labeled exosomes and MIN6 cells confirmed that MIN6 cells could ingest large amounts of exosomes secreted by PSCs. The level of high glucose used to stimulate the insulin secretion of MIN6 cells in the two exosome treatment groups did not change significantly compared with the control group. However, the insulin content decreased significantly after T-Exo intervention. The MIN6 cells incubated with T-Exo had lower viability and proliferation rate compared with those incubated with PBS or C-Exo. TUNEL and flow cytometry results showed that the rate of apoptosis was significantly increased in MIN6 cells treated with T-Exo compared with those treated with PBS or C-Exo. In addition, T-Exo could decrease Bcl-xl protein expression in MIN6 cells and increase the protein levels of cleaved Bim and cleaved caspase3.
Conclusion: The exosomes derived from TGF-β1-activated PSCs reduce β cell viability and promote cell apoptosis. Therefore, exosomes may play important roles in the crosstalk between PSCs and β cells in the progression of chronic pancreatitis-related diabetes.
Supported by: NSFC:No. 81970717
Disclosure: X. Zhu: None.
PS 20 Job description: insulin secretion
385
Tissue-specific alternative splicing of type 2 ryanodine receptor gene affects insulin biosynthesis in pancreatic beta cells
M. Makino, A. Itaya-Hironaka, A. Yamauchi, S. Sakuramoto-Tsuchida, S. Takasawa;
Biochemistry, Nara Medical University, Kashihara, Japan.
Background and aims: Intracellular Ca2+ is essential for insulin biosynthesis, including transcription, splicing, translation, and secretion. The ryanodine receptor (RyR) is an intracellular Ca2+ release channel in the endoplasmic reticulum. We previously found that type 2 RyR (RyR2; originally called cardiac-type) of three isoforms from separate genes in mammals was expressed in pancreatic β cells and that the RyR2 mRNA expressed in pancreatic β cells was deficient in the region of exon 75, whereas the region was included in the authentic cardiac-type RyR2 mRNA expressed in the heart. That alternative splicing of RyR2 is tissue-specific, which is presumably due to a unique splice donor site “gg” in intron 75 of RyR2 gene. In this study, we introduced a nucleotide substitution so that the splice donor “gg” of intron 75 of human RYR2 gene changed to “gt” using genome editing technology to express exon 75-containing RYR2 (cardiac-type) in pancreatic β cells and investigated the influence of the change in the splice type of RYR2 on insulin biosynthesis in β cells.
Materials and methods: In order to produce cardiac RYR2-expressing pancreatic β cells, the splice donor “gg” of RYR2 gene was changed to “gt” in human 1.1B4 cells by CRISPR/Cas9 genome editing system. The homozygous genome-modified and their parental 1.1B4 cells were cultured for 1 h and human insulin in the culture medium was measured by ELISA. Human insulin mRNA level was measured by real-time RT-PCR. Rat cardiac-type and islet-type RyR2 expression plasmid vectors were constructed by inserting the cDNA into pHook-3 mammalian expression vector and transfected into the modified and parental 1.1B4 cells. Reporter plasmid was constructed by inserting the promoter fragment of human insulin gene (-872~+239) upstream of a luciferase reporter gene in pGL4.19 vector. After the reporter plasmid vector was transfected into the modified and parental 1.1B4 cells followed by 24 h-incubation, the promoter activity was measured.
Results: (1) Two independent genome-modified cells, in which splice donor “gg” in intron 75 of RYR2 gene was changed to “gt”, were isolated. (2) The secreted insulin levels in the culture medium of the modified cells were significantly decreased than that of parental 1.1B4 cells (P=0.024 and P=0.004, respectively). (3) The expression levels of insulin mRNA were significantly decreased in the modified cells compared to parental 1.1B4 cells (P=0.002 and P=0.002, respectively). (4) The expression levels of insulin mRNA were significantly increased in the modified cells transfected with the islet-type RyR2 expression vector (P=0.049 and P=0.049, respectively, relative to the modified cells transfected with the empty vector), whereas that in the cells transfected with the cardiac-type RyR2 expression vector was not increased. (5) The promoter activity of insulin gene was not decreased in the modified cells as compared with parental 1.1B4 cells.
Conclusion: These results indicate that the splice type of RyR2 could have a critical effect on insulin biosynthesis, particularly on the post-transcriptional step, via Ca2+ homeostasis in pancreatic β cells.
Supported by: JSPS KAKENHI
Disclosure: M. Makino: None.
386
Expression of the CHI-linked S561F CDKAL1 variant affects the insulin processing and release in INS1E cells
A. Marku1, A. Galli1, E. Di Cairano1, S. Ghislanzoni1, C. Cosentino2, C. Battaglia3, C. Perego1;
1Department of Pharmacological and Biomolecular Sciences, Università degli Studi di Milano, Milan, Italy, 2Department of Fundamental Neurosciences, University of Lausanne, Lausanne, Switzerland, 3Department of Medical Biotechnology and Translational Medicine, Università degli Studi di Milano, Milan, Italy.
Background and aims: Congenital Hyperinsulinism (CHI) is a rare disorder, characterized by hypoglycemia due to inappropriate insulin release from pancreatic β-cells. Despite the advances in understanding the molecular pathogenesis of CHI, specific genetic determinants in about 50 % of the CHI patients remain unknown. A whole-exome sequencing analysis performed on 17 CHI patients lacking mutations in ABCC8/KCNJ11 identified a polymorphism in the CDKAL transcript (S561F-CDKAL1 variant). CDKAL1 is a methylthiotransferase that modifies cytoplasmic tRNALys to enhance translational fidelity of transcripts. Interestingly, CDKAL1 is a susceptibility gene for type 2 diabetes and CDKAL1 knock-out mice showed impaired glucose homeostasis, thus indicating the protein involvement in β-cell function. Since a lysine residue is located at the cleavage site for proinsulin to insulin processing, aim of this work was to investigate the impact of the CDKAL1 variant S561F on the insulin/proinsulin content and the formation of mature hormone granules.
Materials and methods: INS-1E clones expressing Wild Type (WT) or S561F CDKAL1 were generated and used as a model to characterize the S561F CDKAL1 impact on beta-cell function. Western Blot experiments and ELISA assays were performed in order to evaluate the expression, processing and release of insulin/proinsulin in the different INS-1E clones. The distribution of insulin granules in clones was monitored by indirect immunofluorescence and total internal fluorescence reflection microscopy (TIRFM).
Results: The insulin content in clones overexpressing the S561F-CDKAL1 variant was decreased as compared to WT clones (2 folds increase over WT, p<0.05). Conversely, insulin release measured in overnight culture medium or in 30 minutes static incubation, in normal glucose concentrations, was significantly increased in the S561F-CDKAL1 as compared to WT clones (2 to 4 folds increase over WT; p<0.05), thus suggesting a different insulin processing and/or secretion in the mutant CDKAL1. In line with these results, we found a higher proinsulin content in INS-1E-S561F clones than in CDKAL1 WT. Data were confirmed by western blotting analysis. Differences between the clones were highlighted by the proinsulin/insulin ratio which was significantly higher (2 to 4 folds increase over WT; p<0.05) in mutant than in WT clones. Immunofluorescence experiments showed an abnormal enrichment of insulin-positive granules in the perinuclear region, positive for Golgi markers, and a decreased granules density in the TIRF zone in mutant clones compared to WT CDKAL1, thus suggesting that alterations in proinsulin-insulin processing probably impact on insulin granules formation and secretion.
Conclusion: Our findings confirm the importance of CDKAL1 in insulin processing and suggest a possible mechanism by which this variant can participate in development of congenital hyperinsulinism.
Disclosure: A. Marku: None.
387
Assembly factors of the mitochondrial respiratory chain control glucose-induced insulin secretion in human EndoC-βH1 beta cells
S. Weksler-Zangen1, A. Saada2, E. Gurgul-Convey3;
1Liver Unit, Hadassah University Hospital, Jerusalem, Israel, 2The Department of Genetic and Metabolic, Hadassah University Hospital, Jerusalem, Israel, 3Hannover Medical School, Hannover, Germany.
Background and aims: Glucose homeostasis depends on the efficient adaptation of insulin secretion rates to blood glucose concentration. The rise in ATP/ADP ratio, coordinated by the mitochondrial respiratory chain complexes I-V (MRC, CI-CV), is a key event in glucose-induced insulin secretion (GIIS). Our previous studies showed that knockdown (K/D) of NDUFAF2 (mimitin, B17.2L), an assembly factor of CI, inhibits GIIS in a mouse β-cell line. We recently found a tight correlation between islet-complex-IV (CIV) activity and GIIS in hyperglycemic Cohen-diabetic-sensitive rat (CDs), a unique model of CIV deficiency. Whole genome sequencing performed in the CDs, identified a novel homozygous missense deleterious variant, in the NDUFAF5 gene another CI assembly factor that we previously implicated to be involved also in the assembly of CIV. However, a direct link between NDUFAF5, CIV activity and GIIS was not established. Aim: To compare the role of MRC assembly factors NDUFAF2 and NDUFAF5 K/D in GIIS of human EndoC-βH1 β-cells.
Materials and methods: We K/D (lipofectamine-mediated siRNA transfection) the expression of NDUFAF5 and NDUFAF2 in EndoC-βH1, a human β-cell line. We confirmed the efficiency of K/D by qRT-PCR and Western blotting. GIIS was measured after an overnight starvation period, followed by a 1-h incubation at low (0.5, 5) or high (16.7, 30) mmol/l glucose concentration. Insulin secretion was quantified by a specific human insulin ELISA and normalized to DNA content (PicoGreen). CIV activity was measured by a specific human CIV colorimetric microplate assay kit.
Results: NDUFAF2 and NDUFAF5 K/D resulted in the significantly reduced mRNA expression and protein levels (P<0.01) in the siRNA transfected EndoC-βH1-β-cells (reduction of 70% for NDUFAF2 and 75% for NDUFAF5). Suppression of NDUFAF5 led to a significant (55-75% P<0.01) inhibition of GIIS, while insulin content remained unchanged. CIV activity was decreased by 50% in the NDUFAF5 EndoC-βH-K/D β-cells. In contrast, though NDUFAF2 suppression reduced GSIS by 75% at all analyzed glucose concentrations, it had only a minor effect on CIV activity suggesting that NDUFAF2 may reduce GIIS via a different mechanism. Moreover, insulin secretion inhibition following NDUFAF5-K/D exhibited a glucose dose dependent pattern, while NDUFAF2-K/D blocked insulin secretion regardless of glucose concentration
Conclusion: These observations are linking for the first time the NDUFAF5 suppression, reduced β-cell CIV activity and decreased GIIS. The glucose dose dependent GIIS inhibition observed in NDUFAF5-K/D EndoC-βH1 β-cells could indicate an important regulatory role for CIV in insulin secretion that may be targeted by novel therapeutic modalities to treat diabetes.

Supported by: Bringing grant Hadassah; Cohen foundation
Disclosure: S. Weksler-Zangen: None.
388
Mechanotransduction impacts beta cell function by tuning mitochondrial dynamics
A. Galli1, E. Maffioli2,3, A. Marku1, S. Ghislanzoni1, P. Marciani1, P. Milani3,4, C. Lenardi3,4, G. Tedeschi2,3, C. Perego1;
1Dept. of Pharmacological and Biomolecular Sciences, Università degli Studi di Milano, Milan, 2Dept. of Veterinary Medicine, Università degli Studi di Milano, Milan, 3Cimaina, Università degli Studi di Milano, 4Dept. of Physics, Università degli Studi di Milano, Milan, Italy.
Background and aims: Increasing efforts are focusing on the development on new engineered surfaces that mimic the extracellular matrix (ECM) properties in order to boost β-cell differentiation and functions in vitro. We have recently demonstrated that mouse and human β-cells sense and respond to the ECM nanotopography by activating a mechanotransductive pathway, which mainly induces a reorganization of the cytoskeleton. Since mitochondria are connected to the cytoskeleton and play a pivotal role in regulating β-cells survival and function, aim of the proposed research was to evaluate whether extracellular nanotopography may affect mitochondrial dynamics, thus driving β-cell fate.
Materials and methods: Mouse β-cells were seeded on nanostructured zirconia films with controlled nanoscale morphology, produced by the supersonic clusters beam deposition (SCBD) technique. Changes in mitochondrial proteins were identified by a shotgun label-free proteomic approach performed on a mitochondrial sub-fractionation. Mitochondrial morphology and dynamics were evaluated by means of super-resolution fluorescence microscopy.
Results: Proteomic analyses revealed modifications in the expression of proteins involved in mitochondrial dynamics, cristae formation and shaping (OPA1, SAMM50, MICOS19) in cells grown on the nanostructure. Reorganization of mitochondrial morphology were confirmed by quantitative immunofluorescence analyses which showed elongated mitochondria with increased dimension in cells grown on the nanostructure. A significant increase in the mitochondrial membrane potential was detected in cells grown on the nanostructure compared to flat substrates. Interestingly, the mitochondrial proteome revealed also the up-regulation of proteins involved in vesicle-mediated transports in combination with a reduction of proteins shared between the endoplasmic reticulum (ER) and mitochondria (GRPEL1, DNAJA1, HSPAs), suggesting that the nanostructure alters the protein network involved in the complex interplay between ER and mitochondria. Accordingly, morphological analyses showed a profound reorganization of the mitochondrial-ER connection sites.
Conclusion: Our results indicate that extracellular nanotopography influences mitochondrial function and morphology, as well as their interplay with other organelles, which is crucial for matching the metabolic needs of the cells. Since mitochondria provide both the energy for cell survival and the signals for efficient glucose-dependent insulin secretion, these findings are particularly relevant to successfully engineer scaffolds in order to improve β-cell function and viability in vitro.
Disclosure: A. Galli: None.
389
Nudix Hydrolase 2 (NUDT2) is critical for physiological glucose stimulated insulin secretion from INS (832/13) beta cells
E. Cowan1, S. Kalamajski1, R. Jain1, P. Spégel2, H. Mulder1, M. Fex1;
1Clinical Sciences, Lund University, Malmö, 2Chemistry, Lund University, Lund, Sweden.
Background and aims: We identified NUDT2, a nudix hydrolase that converts Ap4A (an energy rich nucleotide) to yield ATP and AMP, as a target to improve β-cell function. NUDT2 interacts with hepatocyte nuclear factors 4α & 6 (hnf4α & hnf6) in pancreatic islets, and NUDT2- Ap4A interaction can induce changes in microphthalmia transcription factor (MITF) and upstream stimulatory factor 2 (USF2) activity. These transcription factors regulate genes key to β-cell function. Importantly, Ap4A is implicated in regulating KATP-channel activity in β-cells and increases and decreases in blood glucose and insulin respectively are reported in Ap4A treated animals. Together, these findings strongly suggest NUDT2 and Ap4A are important in β-cell physiology. To further understand NUDT2 function, we aimed to investigate effects of nudt2 knockdown in clonal β-cells.
Materials and methods: Nudt2 was silenced (150nM siRNA/ CRISPR/Cas-9) in rodent INS (832/13) β-cells. Protein and mRNA expression were determined by Western blot (WB) and qPCR after 48 and 72h respectively. Silenced cells were evaluated for insulin secretion responses to low and high glucose (2.8 & 16.7mM), pyruvate (10mM) and K+ (35mM) and also for insulin content. Insulin was quantified by ELISA. Mitochondrial metabolism was investigated by cellular respiration (Seahorse XF Analyser) and OXPHOS expression (WB). Finally, expression of nudt2 target genes (ins1, ins2, glut2, gck, pax4 & pax6) were determined by qPCR.
Results: NUDT2 protein and mRNA were significantly knocked down (((siRNA )(89% (P<0.0001; n=3)) & ((CRISPR/Cas-9)(65% (P<0.001; n=4))) and (((siRNA)(82% (P<0.0001; n=5)) & ((CRISPR/Cas-9)(38% (P<0.001; n=3))) respectively. Insulin secretion (ng insulin/mg protein) was inhibited at 16.7mM glucose in knocked down cells compared to controls (71±12 vs. 154±20; P<0.0001; n=5 (siRNA)) and (24±4 vs. 98±6; P<0.01; n=1 (CRISPR/Cas-9)), and secretory responses were blunted to pyruvate (65±13 vs 121±17; P<0.01: n=5 (siRNA)) and K+ (44±7 vs. 81±13; P<0.05; n=5 (siRNA)). Insulin content was concordantly reduced by 50% (P<0.0001; n=5 (siRNA)) and 36% (P<0.0001; n=3 (CRISPR/Cas-9)), as was expression of ins1 and ins2 genes (P<0.05; n=3 (CRISPR/Cas-9)). Cellular respiration was impaired (P<0.05; n=4 (siRNA)) while expression of all 5 OXPHOS proteins was unaffected (CRISPR/Cas-9). Data were analysed by one or two-way ANOVA followed by Bonferonni’s or Tukey’s posthoc test.
Conclusion: Our findings show nudt2 knockdown induces loss of function in INS (832/13) cells; silencing severely diminishes insulin production and secretion suggesting mitochondrial and exocytotic processes are impaired. Seahorse findings confirm nudt2 mechanisms involve mitochondrial metabolism however disruption in cellular respiration with knockdown was independent of change in OXPHOS expression suggesting nudt2 may be important for maintaining other processes necessary for mitochondrial health in β-cells e.g. those limiting oxidative stress. Importantly, gene expression investigations demonstrate nudt2 plays a key role in insulin gene expression and biosynthesis, albeit, this is not mediated by changes in expression of pax4 or pax6 which are central to β-cell function. Similarly, unaltered expression of glut2 or gck suggest impaired insulin secretion is unrelated to impaired glucose uptake or sensing in these cells.
Supported by: Exodiab/LUDC-IRC, EUHorizon2020, Vetenskapsrådet, Gyllenstiernska, Påhlsson
Disclosure: E. Cowan: None.
390
Telmisartan amplifies glucose-stimulated insulin secretion via ion channels, independent of AT1 receptor and PPARγ
T. Liu1,2, L. Cui2, Y. Zhang2;
1Department of General Surgery, Shanxi Bethune Hospital, Taiyuan, 2Department of Pharmacology, Shanxi Medical University, Taiyuan, China.
Background and aims: Growing evidences have demonstrated that AT1 receptor blockers (ARBs), ameliorated T2DM and its related complications, and ARBs have been highly recommended as pharmacological therapy regimen for patients with diabetes and hypertension. Insufficient insulin secretion is a fundamental process which determines the onset and progression of T2DM. However, the effects of ARBs on insulin secretion remain unclear.Therefore, we applied three ARBs, namely telmisartan, valsartan and irbesartan to evaluate the effects of ARBs on insulin secretion and investigate the underlying electrophysiological mechanism.
Materials and methods: Islets isolated from Wistar rats were incubated with drugs under different glucose conditions for 30 minutes, then supernatant liquid was collected for insulin secretion. Intracellular Ca2+([Ca2+]i) levels of β-cells were measured by calcium imaging technology. Patch-clamp technology was applied to detect effects on action potential duration(APD), Voltage-dependent potassium(Kv)channels, and voltage-gated calcium channels(VGCC). CHO-Kv2.1 cell line was constructed with lentivirus vector overexpressing Kv2.1 channel, which was main subtype in the regulation of insulin release on β-cell. Then patch-clamp experiment was performed on CHO-Kv2.1 cells. Finally, OGTT were performed to observe the in vivo effect of telmisartan in db/db mice.
Results: Among three ARBs, only telmisartan exhibited an insulin secretagogue role. Moreover,Telmisartan dose‐dependently enhanced insulin secretion and [Ca2+]i concentration only under high glucose condition. Telmisartan-induced elevation of [Ca2+]i levels were reversed in absence of extracellular calcium or with azelnidipine, a L-VGCC blocker added. Telmisartan, rather than valsartan and irbesartan, decreased current density of Kv channels, prolonged APD, and increased VGCC current density. GW9662, a PPARγ blocker, did not influence above effects of telmisartan. CHO cells have no endogenous outward potassium currents, while KV2.1 channels currents and its suppression by telmisartan were both detected on CHO-Kv2.1 cells. Further, acute administration of telmisartan ameliorates hyperglycemia by increasing insulin secretion in vivo in db/db mice.
Conclusion: we aimed to better understand the benefits of ARBs for diabetes, however we found an insulin secretagogue role for telmisartan which was distinct from other ARBs. Telmisartan amplifies glucose-stimulated insulin secretion in rat islets owing to enhancing [Ca2+]i levels of β-cells. The electrophysiological mechanism is that telmisartan inhibits kv channels to prolong duration of extracellular Ca2+ influx, and activates VGCC to promote extracellular Ca2+ influx. Considering that telmisartan is also a partial agonist for PPARγ, our studies also showed PPAR-γ was not involved in above effects, and telmisartan-induced effects was partly due to direct inhibition of kv2.1 channels. Our results may have important implications for determinant of the choice of ARBs for the treatment in patients with hypertension and diabetes. In addition, our identification of telmisartan, as a kv2.1 inhibitor and glucose-dependent insulinotropic agent, provide evidence for the development of new antidiabetic drugs.
Supported by: 2019XY015 of 136 ; NSFC (81670710; 81770776);
Disclosure: T. Liu: None.
391
Changes in insulin granule mobility and age correspond to changes in secretion after desensitisation and beta cell rest
B. Gaus, I. Rustenbeck;
Institute of Pharmacology and Toxicology, Technische Universität Braunschweig, Braunschweig, Germany.
Background and aims: The desensitization of insulin secretion by prolonged stimulation may be the initial phase of beta cell dysfunction in type 2 diabetes. This state is characterized by a diminished response to renewed stimulation, in particular a loss of the classical biphasic secretion pattern. The induction of beta cell rest, in contrast, permitted the recovery of the secretory profile and has been suggested as a therapeutic measure in the treatment of type 2 diabetes. Here, we have investigated the functional consequences of a prolonged stimulation by sulfonylurea-induced KATP channel block and of a prolonged resting state by agonism at the α2-adrenoceptor.
Materials and methods: The insulin granules of MIN6-cells (p20-p30) were labeled by transient transfection with hIns-EGFP or hIns-Ds-red E5 (timer) and cultured in DMEM-medium. Mouse beta cells were adenovirally transduced with hIns-EGFP. Desensitization or resting state were induced by 18 h exposure to 500 μM tolbutamide or 1 μM clonidine, respectively. Exposed and control cells were perifused with 30 mM glucose and, after wash-out, with 40 mM KCl. The submembrane secretory granules were imaged by TIRF-microscopy and number and mobility were analyzed with an observer-independent evaluation program. MIN6-pseudoislets were perifused utilizing the same stimulation protocol. Insulin secretion and -content were measured by ELISA.
Results: Prior to the perifusion the number of submembrane granules in the cell footprint area was not significantly different between tolbutamide- and control-cultured MIN6 cells, whereas it was significantly increased after clonidine culture. However, both types of pretreatment decreased the granule mobility orthogonal to the plasma membrane (fewer granule arrivals and fewer short-term resident granules), suggestive of a diminished turnover. This was accompanied by a decrease in lateral mobility (diminished caging diameter) and an increased proportion of the long-term resident granules. The number of exocytotic EGFP-flashes was lower after tolbutamide, but higher after clonidine. Observations with tolbutamide-treated beta cells were less clear-cut than with MIN6 cells, but showed the same tendency. Labeling MIN6 cells with hIns-timer showed that tolbutamide did not significantly affect the proportion of old granules, whereas clonidine increased it. In either dimension old (red) granules showed a higher mobility than young (green) granules. Perifusion experiments with MIN6 pseudoislets confirmed that both types of pretreatment slowed and diminished the secretory response to glucose and to KCl, even though tolbutamide pretreatment had decreased and clonidine pretreatment had increased the insulin content.
Conclusion: While the strongly diminished insulin secretion after tolbutamide exposure (desensitization) was expected, the moderately diminished secretion after a period of suppressed insulin secretion by clonidine (beta cell rest) was unexpected. The diminished granule mobility predicts the secretory response after desensitization or rest better than the insulin content, the number of submembrane insulin granules or the number of exocytotic flashes. Aged insulin granules (more than 16 h old) may be irrelevant for the strength of the secretory response.
Disclosure: B. Gaus: None.
392
Organic electrochemical transistors (OECTs) as new tool for non-invasive on-line analysis of islet activity
M. Abarkan1, D. Mafilaza2, A. Pirog2, G. Pathak3, G. N'Kaoua2, R. O'Connor3, M.J. Donahue3, M. Raoux1, S. Renaud2, J. Lang1;
1CBMN CNRS UMR 5248, Pessac, 2IMS Univ. Bordeaux CNRS UMR 5218, Talence, France, 3BEL EMSE, Gardanne, France.
Background and aims: Islet nutrient metabolism activates ion channels, resulting in single cell action potentials (APs) which are coordinated across beta-cells in slow potentials (SPs) to provide optimal activity and secretion. For long-term recordings in the absence of external probes or reporter transgenes, we developed a platform that incorporates a new class of sensors, organic electrochemical transistors (OECTs). These transistors reduce noise levels as compared to metal electrodes, which is of prime importance in view of small signal amplitudes in islets. Moreover, OECTs are printable and flexible for low-cost mass production and adaptable design. Such an approach has never been employed for islets and also requires new electronic circuits for these complex three-terminal devices.
Materials and methods: Our vertical OECTs were fabricated in-house by microfabrication techniques and characterized in saline solution with an Ag/AgCl gate, a Keithely 2600B SourceMeter and Labview software. We designed and validated a specific tunable electronic board, CHOSEI, to monitor signals. HL-1 cardiomyocytes or primary mouse islets were seeded on OECT arrays. 4 days later signals were recorded (10 kHz) via an INTAN RHD2000 acquisition system and analysed with MATLAB® and Spike2.
Results: Our vertical OECTs exhibited stable performances during culture at low voltage operation in depletion mode, characteristic of PEDOT:PSS OECTs. Optimized transistor geometry yielded useful channel sizes for interfacing with islets while maintaining a high transconductance (20.19 ± 2.00 mS, n=12). Our tuneable voltage amplifier board (CHOSEI) converted the output current of the OECT into a readable voltage signal (amplification >1075 V/A, board and INTAN pre-amp gain). The 3-terminal electrical parameters of the OECTs were extensively explored and fixed to optimal values (VDS -0.1 V; VGS +0.1 V) not altering biological behaviour. The platform was first validated with cardiomyocytes. We measured spontaneous APs of 100 ms duration and considerable amplitude (0.1-1 mV, whereas metal electrodes yielded <0.1 mV) with unprecedented signal to noise ratio (6-10, as compared to 1.1 of metal electrodes). Spontaneous AP frequency (1-2 Hz) was increased upon 0.1 mM noradrenaline. In islet we were able to capture not only SPs but for the first time also single cell APs which cannot be properly resolved by microelectrode arrays. APs lasted 10-20 ms, with an amplitude up to 1 mV after current-voltage conversion and appeared often in bursts (2 Hz at glucose 3 mM vs 9 Hz at glucose 11 mM). Alpha-cell activity was also clearly measured as APs at low glucose (G3) and disappeared at high glucose (G11). Finally, we are currently developing appropriate hardware to obtain online and real-time (<100 μs) analysis of the electrical signatures (APs, SPs).
Conclusion: In conclusion, we developed a novel islet-on-chip device to non-invasively record single cell and coupled islet activity simultaneously. This method enables recording of single cell activity non-invasively from different islet cell types via action potentials. Regarding future outlook, this opens the possibility to use ion-specific electro-organic polymers to capture defined ion channel activities.
Supported by: French National Research Agency (ANR-17-CE09-0015), LABEX
Disclosure: M. Abarkan: None.
PS 21 Further down the road to human islet failure in type 2 diabetes
393
Validation of exendin for beta cell imaging: ex vivo autoradiography of human pancreas demonstrates specific accumulation of radiolabeled exendin in islets of Langerhans
M. Gotthardt1, T.J.P. Jansen1, M. Buitinga1,2, C. Frielink1, M.W.J. Stommel1, M.B. van der Kolk1, H. van Goor1, B.E. de Galan1,3, M. Boss1, M. Brom1;
1Radboudumc, Nijmegen, Netherlands, 2KU Leuven, Leuven, Belgium, 3Maastricht UMC, Maastricht, Netherlands.
Background and aims: The fate of beta cells in diabetes and mechanisms responsible for the decrease in beta cell numbers are still not fully understood. Current data on beta cell mass is limited to data from material after autopsy or pancreatectomy, or estimated based on beta cell function. Radiolabeled exendin provides a non-invasive technique for beta cell visualization by targeting the glucagon-like peptide-1 receptor located on beta cells, which enables longitudinal assessment of beta cell mass. The reliability of this technique depends on the beta cell specificity of the radiotracer. So far this has only been demonstrated in animal models. In this study, we therefore aim to validate the specificity of radiolabeled exendin in humans.
Materials and methods: Seven patients with pancreas tumours were injected with 150 MBq 111In-labeled exendin one day prior to pancreatectomy. Pancreatic tissue sections without tumour were used for ex vivo autoradiography and immunohistochemically stained for insulin, which allowed the colocalization of insulin-positive regions with uptake of radiolabeled exendin. The endocrine-exocrine ratio of the uptake of 111In-labeled exendin was determined for each patient by quantitative analysis of the digital autoradiographic images after background correction.
Results: High tracer uptake on the digital autoradiographic images colocalizes with the distribution of the insulin-stained regions (Fig. 1). The autoradiography data showed high tracer accumulation in the pancreatic islets, with low tracer uptake in the exocrine tissue (Fig. 1). The average endocrine-exocrine ratio based on digital autoradiography was 3.9 ± 0.5. The endocrine-exocrine ratio was within similar range for all patients.
Conclusion: These preliminary data show the distinct colocalization of insulin-positive areas with high uptake of radiolabeled exendin in human pancreatic tissue. The 4-fold higher uptake in the endocrine tissue compared to the exocrine tissue points out the specificity of the tracer for pancreatic islets, comparable to data previously demonstrated in rats with high endocrine-exocrine ratios and linear correlation of uptake and beta cell mass. Radiolabeled exendin can provide a reliable, non-invasive measure for beta cell mass in humans.

Clinical Trial Registration Number: NCT03889496
Supported by: JDRF (2-SRA-2014-266-M-B) and INNODIA (IMI2-JU, grant agreement 115797).
Disclosure: M. Gotthardt: Grants; This work is supported by JDRF (2-SRA-2014-266-M-B) and INNODIA (IMI2-JU, grant agreement 115797). Stock/Shareholding; Martin Gotthardt is inventor and patent holder of invention affecting GLP-1 and exendin (Philipps-Universität Marburg, June 17, 2009). Other; Martin Gotthardt received financial support from Sanofi-Aventis, and from Sandoz and Boehringer Ingelheim.
394
Functional genomics of human islet gluco/lipotoxicity and type 2 diabetes
X. Yi1, M. Suleiman2, A. Piron1, L. Marselli2, F. Szymczak1, D. Eizirik1,3, P. Marchetti2, M. Cnop1;
1ULB Center for Diabetes Research, Université Libre de Bruxelles, Brussels, Belgium, 2University of Pisa, Pisa, Italy, 3Indiana Biosciences Research Institute, Indianapolis, USA.
Background and aims: Lipo- and glucolipotoxicity impair β cell function and survival, potentially contributing to type 2 diabetes onset and progression. Here we set out to characterize the transcriptome signatures of human islets under in vitro (gluco)lipotoxic conditions and from diabetic donors to discover the molecular mechanisms involved.
Materials and methods: Human islets were exposed to 1 mM palmitate + oleate (1:2 ratio) at 5.5 mM (PO) or 22.2 mM glucose (POG) for 2 days, followed by 4 days of washout (n=3-5/condition). Glucose-stimulated insulin secretion and RNA-seq transcriptomes were assessed. Data were compared to RNA-seq of islets from 34 type 2 diabetic and 62 non-diabetic donors by rank-rank hypergeometric overlap (RRHO), and to the Connectivity Map of the Broad Institute that provides transcriptomes of a large number of human cells following genetic perturbations.
Results: PO did not impair insulin secretion, while POG induced β cell dysfunction that persisted after washout. POG induced extensive transcriptomic changes compared to PO (1534 vs 359 differentially expressed genes, FDR adj-p<0.05). Both induced PPAR signaling, protein processing in the endoplasmic reticulum (ER) and aminoacyl tRNA biosynthesis (as determined by gene set enrichment analysis). POG further altered mitochondrial function and fatty acid, sugar and amino acid metabolism pathways and the spliceosome. In line with this, expression of 11 islet-expressed splicing factors was modified, possibly contributing to the observed alternative splicing of 83 genes. After POG washout, mitochondrial and ER stress pathways remained upregulated. The greatest overlap by RRHO between gluco/lipotoxicity and type 2 diabetes was seen in POG washout, with gene set enrichment among commonly upregulated genes for inflammatory responses and extracellular matrix organization. Comparison of persistent β cell dysfunction (POG and type 2 diabetes) gene signatures with Connectivity Map transcriptomes identified similarities for knockdown of the cholesterol sensor SCAP (positively correlated), the E3 ubiquitin ligase UBR7 (negatively correlated) and overexpression of TIRAP, involved in TLR4 signaling (positively correlated). These master regulator genes are involved in lipid sensing in the ER, protein degradation and immune signaling.
Conclusion: We unveiled the human islet transcriptome underlying persistent glucolipotoxic β cell dysfunction and identified similarities with type 2 diabetes islet transcriptomes. The comparison with the Connectivity Map identified master regulators of β cell failure and points to novel targets to preserve functional β cell mass in T2D.
Supported by: IMI Rhapsody
Disclosure: X. Yi: None.
395
Correlation between ex vivo islet proteomic analysis and in vivo secretory function in humans
C.M.A. Cefalo1, T. Mezza1, S. Moffa1, F. Cinti1, U. Capece1, R. Kulkarni2, A. Giaccari1;
1IRCCS, Fondazione Policlinico A. Gemelli, Rome, Italy, 2Department of Islet cell and Regenerative Medicine, Joslin Diabetes Center Research, Boston, USA.
Background and aims: Insulin resistance and β-cell dysfunction are the main actors in the pathogenesis of type 2 diabetes mellitus, causing both quantitative and qualitative loss of insulin secretion and therefore hyperglycemia. The molecular mechanisms underlying progressive β-cell dysfunction, however, are still unknown. The aim of the study is to highlight changes in the proteome of pancreatic islets that can anticipate and eventually predict diabetes’ onset.
Materials and methods: In order to correlate changes in the insular proteome to different metabolic conditions in vivo, a mass spectrometry analysis was performed on human islets, extracted by Laser Capture Microdissection, from surgical samples of 14 subjects who underwent duodeno-cephalopancreasectomy, and previously studied through OGTT and mixed meal test (MMT).
Results: The subjects were classified based on glucose tolerance into normal (n: 7 NGT), intolerant (n: 5 IGT) and diabetic (n: 2 DM2). A first quantitative analysis showed about 150 proteins differently expressed in the 3 groups (expressed as Log2 ratio of the average intensity ≥0.58 (or ≤ 0.58) in association with p value <0.05). Among these, a protein, SEL1L, which regulates the differentiation of pancreatic precursors in the endocrine line was significantly increased in IGT rather than DM2 and NGT subjects and was inversely correlated with β-cell glucose sensitivity calculated during MMT (r = -0.81, p = 0.01). The TCPD protein, involved in the folding and transport of neosynthesized proteins, which progressively decreases from NGT to DM2, was inversely correlated with the AUC of glycemia during OGTT (r = 0.5, p = 0.04). Finally, the expression of IQAG1 which was significantly reduced in DM2 compared to the other groups, and implicated in GLP-1 induced insulin production was inversely correlated with insulin resistance evaluated using the HOMA-IR index (r = -0.70, p = 0.004).
Conclusion: The results suggest that both insulin resistance and/or β-cell dysfunction in vivo are closely linked to changes in the intrainsular protein expression in both pre-diabetic and diabetic subjects.
Disclosure: C.M.A. Cefalo: None.
396
Glucose-lowering therapy and ex-vivo beta cell function in type 2 diabetes
M. Suleiman1, C. De Luca1, A.M. Schulte2, D.L. Eizirik3, M. Tesi1, E. Gianetti1, M. Solimena4, E. Bosi1, M. Cnop3, P. Marchetti1, L. Marselli1;
1Department of Clinical and Experimental Medicine, and Cisanello University Hospital, University of Pisa, Pisa, Italy, 2Sanofi-Aventis Deutschland GmbH, Frankfurt, Germany, 3ULB Center for Diabetes Research, Bruxelles, Belgium, 4Paul Langerhans Institute Dresden of the Helmholtz Center Munich, Dresden, Germany.
Background and aims: Very limited information is available on the association between glucose-lowering therapy and ex-vivo beta cell function in people with type 2 diabetes (T2D).
Materials and methods: We studied isolated islets from 75 T2D organ donors [age: 71.2±8.6 years, M/F:42/33; body mass index (BMI): 27.2±4.3 kg/m2; duration of diabetes: 9.7±7.8 years]. Insulin release (μU/islet/45min) was assessed in response to 3.3 mM glucose (G), 16.7 mM G, and 3.3 mM G+20 mM arginine (Arg), compared with that of islets from 128 non-diabetic (ND) donors, and correlated with the type of glucose-lowering therapy.
Results: Insulin release from T2D islets was 1.35±0.45 in response to 3.3 mM G and slightly but significantly increased upon challenge with 16.7 mM G (2.25±1.35, p<0.01) and Arg (2.70±1.35, p<0.01). The respective insulin stimulation index (SI) was 1.7±0.7 and 2.1±0.8. These values were lower than those obtained with ND islets (-40% with G, p<0.001; -15% with Arg, p<0.05). Based on the SI values, T2D islet results were subdivided in two groups: group A (n=45), in which the islets were at least in part responsive to glucose (SI≥1.5); and group B (n=30), in which the islets were not responsive to glucose (SI<1.5) but maintained some responsiveness to Arg (SI≥1.5) (that acts downstream the K+ATP channels). Donors of the two islet groups were comparable for age, BMI and duration of diabetes. Subjects treated with diet or diet+metformin were significantly more numerous in group A (44%) than group B (11%, p<0.01). Donors treated with metformin±stimulators of insulin release (sulphonylureas, glinides) or insulin were more represented in group B (89%) than group A (56%, p<0.01).
Conclusion: Beta cells of T2D subjects show different ex-vivo responsiveness to glucose and non-glucose secretagogues, depending on the glucose-lowering therapy. Molecular studies will clarify the underlying mechanisms.
Supported by: Rhapsody and INNODIA (H2020-IMI2), and T2DSystems (H2020)
Disclosure: M. Suleiman: None.
397
The mTORC1-PHLPP1/2 axis leads to chronic beta cell failure and dysfunction in diabetes
B. Lupše, K. Annamalai, K. Maedler, A. Ardestani;
Centre for Biomolecular Interactions Bremen, University of Bremen, Bremen, Germany.
Background and aims: The mechanistic/mammalian target of rapamycin complex 1 (mTORC1) is a master regulator of the nutritional and metabolic status in the cells. While short-term mTORC1 stimulation has a positive function in the β-cell physiology, its long-term sustained hyper-activation is deleterious, suggesting that mTORC1 acts as “double edge sword” in the regulation of beta-cell survival and function. PHLPP1 and 2 are serine-threonine phosphatases involved in numerous cellular processes such as proliferation, stress response and apoptosis. PHLPP1/2 are highly upregulated in human and rodent beta-cells under diabetogenic conditions, their forced overexpression induced beta-cell dysfunction and death, while their deficiency improved insulin secretion, and beta-cell survival and ameliorated diabetes in diabetic mouse models. The 5′ untranslated region (UTR) of PHLPP1 and PHLPP2 mRNAs contain terminal oligopyrimidine (TOP) and TOP-like motifs; such motifs are specifically regulated by mTORC1 at the translational level raising a possibility of PHLPP1/2 regulation by mTORC1. Our aim was to systematically investigate whether mTORC1 is an upstream regulator of PHLPP1/2 in beta-cells under diabetogenic conditions.
Materials and methods: mTORC1-PHLPP1/2 regulation was investigated in mouse embryonic fibroblasts (MEFs) isolated from Tuberous sclerosis complex 2 knock-out (TSC2-KO) mice, in beta-cells and human islets exposed to high glucose as well as in isolated islets from human and mouse diabetic mice. PHLPP1/2 levels, beta-cell apoptosis as well as mTORC1 activity (represented by phosphorylated S6K1, S6 and 4E-BP1) were analyzed by western blotting. mTORC1 signaling was inhibited both pharmaceutically, by selective inhibitors against mTORC1 (rapamycin) and its down-stream kinase S6K1 (PF-4708671) and genetically, by small interfering RNAs (siRNAs) against S6K1 or Raptor, key components of mTORC1 signaling. Stimulation of mTORC1 signaling was achieved by small molecule activators 3BDO and MHY1485 as well as by ectopic overexpression of the active form of S6K1.
Results: Both mTORC1 and PHLPPs were highly upregulated in pancreatic islets isolated from T2D patients, animal models of T2D as well as human islets and beta-cells cultured chronically under diabetes-associated glucotoxic conditions. Inhibition of mTORC1 by rapamycin or S6K1 by PF-4708671 diminished PHLPP1/2 levels, along with decreased levels of activated MST1, caspase-3 and PARP cleavage in beta-cells and human islets under high glucose concentrations, in isolated mouse islets from HFD-treated mice as well as in TSC2-KO-MEFs with constitutively active mTORC1 signaling. In line with this observation, selective inhibition of endogenous mTORC1 by siRNA-mediated silencing of S6K1 or Raptor reduced the deleterious upregulation of PHLPP1/2 in beta-cells under glucotoxic conditions and from patients with T2D. Consistently, chemical activation of mTORC1 by 3BDO or MHY1485 and overexpression of active S6K1 markedly increased PHLPP1/2 in beta-cells, resulting in beta-cell dysfunction and death.
Conclusion: These findings demonstrate the mTORC1-dependent upregulation of PHLPP1/2 in beta-cells under diabetic conditions and the significance of targeting the mTORC1-PHLPP1/2 axis in restoring pancreatic beta-cell survival and function in diabetes.
Supported by: DFG
Disclosure: B. Lupše: None.
PS 22 Sitting and exercising does it all
398
Interrupted sitting improves acute postprandial glucose control without increasing risk of hypoglycaemia in people with type 1 diabetes
A. Alobaid1, C. Dingena1, A. Marsh1, E. Coales1, L. O'Mahoney2, P. Dempsey3, M. Francois4, R. Ajjan5, M. Campbell1;
1Food Science and Nutrition, University of Leeds, Leeds, UK, 2Carnegie School of Sport, Leeds Beckett University, Leeds, UK, 3MRC Epidemiology Unit, School of Clinical Medicine, Unoversity of Cambridge, Cambridge, UK, 4School of Medicine, University of Wollongong, Australia, Australia, 5School of Medicine, University of Leeds, Leeds, UK.
Background and aims: We have previously shown that interrupting prolonged periods of sitting with short, frequent light-intensity walking activity improves postprandial glucose levels in people with and at risk of Type 2 Diabetes. However, no research has investigated whether and how such an intervention affects postprandial glucose control, including the risk of hypoglycaemia, in people with Type 1 Diabetes (T1D). Therefore, we assessed the impact of short, frequent bouts of light-intensity walking on acute postprandial glycaemia in people with T1D.
Materials and methods: In a randomised crossover design, ten inactive adults with T1D (6 men; mean±SD: 30±34.7 years) completed two fasted morning-time (~08:00am) laboratory visits each separated by a minimum of a 1-week washout. On each occasion participants consumed a standardised carbohydrate-based meal with their usual insulin dose determined by the carbohydrate-counting method; the meal and insulin dose was identical on each occasion. Following consumption of the meal, participants underwent two experimental conditions each lasting 4-hours: (1) uninterrupted sitting (SIT); or (2) sitting interrupted with 5-minute bouts of self-paced light-intensity walking every 30-minutes for a total of 4-hours (SIT-Less). Interstitial glucose responses were measured across the 4-hour postprandial period using continuous glucose monitoring (CGM).
Results: Postprandial glucose concentrations increased with SIT whereas this rise was tempered with SIT-Less (SIT: Δ2.7±2.6 vs. SIT-Less Δ0.4±1.2 mmol/L p=.043). With SIT-Less, Time in Range (3.9-10 mmol/L) was significantly increased (SIT 114±114 vs. SIT-Less 288±36 minutes p=.008), time spent in hyperglycaemia was significantly reduced (SIT 94±86 vs. SIT-Less 9.5±24 minutes, p=.043), and glucose peak was significantly lower (SIT: Δ5.8±4.1 vs. SIT-Less 2.0±1.4 mmol/L p=.047). There were no episodes of hypoglycaemia in either condition.
Conclusion: Interrupting sitting time, with brief regular bouts of light-intensity walking activity, significantly improves acute postprandial glycaemia in people with T1D without increasing the risk of acute hypoglycaemia. With low adherence to structured exercise and the ubiquity of sedentary behaviours, these preliminary findings suggest that interrupted sitting has the potential to be a safe, beneficial and practical means for improving postprandial glycaemia in people with T1D.
Disclosure: A. Alobaid: None.
399
Interrupted sitting improves 24-hour glucose control in people with type 1 diabetes
M. Campbell1, C. Dingena1, A. Marsh1, E. Coales1, L. O'Mahoney2, P. Dempsey3, M. Francois4, R. Ajjan5, A. Alobaid1;
1Food Science and Nutrition, University of Leeds, Leeds, UK, 2Carnegie School of Sport, Leeds Beckett University, Leeds, UK, 3MRC Epidemiology Unit, School of Clinical Medicine, University of Cambridge, Cambridge, UK, 4School of Medicine, University of Wollongong, Wollongong, Australia, 5School of medicine, University of Leeds, Leeds, UK.
Background and aims: Interrupting prolonged periods of sitting with short, frequent light-intensity walking improves 24-hour glucose control in people with and at risk of Type 2 Diabetes. However, it is unknown whether and how such an intervention influences 24-hour glucose control, including risk of hypoglycaemia, in people with Type 1 Diabetes (T1D). Therefore, we evaluated the effect of short, frequent bouts of light-intensity walking on 24-hour glycaemia in people with T1D.
Materials and methods: In a randomised crossover design, ten inactive adults with T1D (6 men; mean±SD: 30±34.7 years) completed two morning (~08:00am) laboratory visits in a fasted state, each separated by at least 1-week. On both visits, participants consumed a standardised carbohydrate-based meal with their usual insulin dose determined by the carbohydrate-counting method; the meal and insulin dose were identical on each visit. After consuming the meal, participants underwent two experimental conditions: (1) uninterrupted sitting (SIT); or (2) sitting interrupted with 5-minute bouts of light-intensity walking every 30-minutes for 4-hours (SIT-Less). Interstitial glucose responses were measured using continuous glucose monitoring (CGM) during the 4-hour laboratory visit for a further 20-hours under free-living conditions.
Results: Compare to SIT, whole-day glycaemia was significantly lower following SIT-Less; 24-hour interstitial glucose Area Under the Curve was -14%[1.2%] under SIT-Less (p=0.023), accompanied by a significantly smaller average change in interstitial glucose from baseline (SIT: Δ1.5±2.5 vs. SIT-Less Δ-0.01±1.6 mmol/L, p=0.001), and lower average interstitial glucose peak (SIT:Δ7.7±3.0 vs. SIT-Less Δ3.9±1.4 mmol/L, p=0.002). Furthermore, with SIT-Less, Time in Range (TIR; 3.9-10 mmol/L), was significantly greater (TIR: SIT 991.5±286.86 vs. SIT-Less 1240.5±173.5 minutes, p=0.030), while time spent in hyperglycaemia was significantly lower (SIT 413.5±266.8 vs. SIT-Less 162±163.6 minutes, p=0.020). However, time spent in hypoglycaemia was similar between conditions (SIT 35±68.68 vs. SIT-Less 37.5±62.19 minutes, p=0.933). Glycaemic variability was lower with SIT-Less (CV%: SIT 29.4±7.6 vs. SIT-Less 22.1±7.5 %, p=0.021).
Conclusion: Interrupting sitting time, with brief light-intensity walking activity, significantly improves whole-day glucose control in people with T1D. These preliminary findings suggest that interrupted sitting may serve as an effective and practical means of normalising daily glucose levels in people with T1D by increasing time in range and reducing glycaemic variability, without increasing the risk of hypoglycaemia.
Disclosure: M. Campbell: None.
400
The physiological, metabolomic and hormonal responses to hypoglycaemia versus euglycaemia during exercise in adults with type 1 diabetes
O. McCarthy1, J. Pitt1, R. Churm1, G.J. Dunseath2, C. Jones2, L. Bally3, C.T. Nakas4,5, R. Deere6, M.L. Eckstein7, S.C. Bain2, O. Moser7, R.M. Bracken1;
1Applied Sports, Technology, Exercise and Medicine, College of Engineering, Swansea University, Swansea, UK, 2Diabetes Research Group, Medical School, Swansea University, Swansea, UK, 3Department of Diabetes, Endocrinology, Nutritional Medicine & Metabolism, University of Bern, Bern, Switzerland, 4University of Thessaly, Greece, Greece, 5Department of Clinical Chemistry, University of Bern, Bern, Switzerland, 6Department for Health, Bath University, Bath, UK, 7Department of Internal Medicine, Graz University, Graz, Austria.
Background and aims: Though the prevalence of exercise-induced hypoglycemia has been well documented within literature, less is known about the effects of its occurrence during exercise on various aspects of physiology including the human metabolome. This study sought to detail the physiological, metabolomic and hormonal responses to hypoglycemia versus euglycemia during exercise in adults with type 1 diabetes (T1D).
Materials and methods: Thirteen individuals with T1D (HbA1c; 7.0±1.3%, [52.6±13.9 mmol/mol], age; 36±15 years) performed a maximum of 45-minutes of submaximal exercise (60±6% VO2max). Retrospectively identified exercise sessions that ended in hypoglycemia ([HypoEx] blood glucose [BG] ≤3.9 mmol/l) were compared against a participant matched euglycemic condition ([EuEx] BG ≥4.0 - ≤10.0mmol/l). Samples were compared for detailed physiological and hormonal parameters as well as metabolically profiled via targeted ultra-high-performance liquid chromatography coupled to tandem mass spectrometry. Data were assessed using univariate analysis techniques with FDR adjustment. Significant results were considered for p ≤0.05.
Results: Acute exposure to hypoglycemia during exercise (BG HypoEx 3.5±0.3 vs EuEx 5.8±1.1 mmol/l, p<0.001), presented with higher adenosine salvage pathway activity (5’Methylthioadenosine, p=0.02), increased utilisation of gluconeogenic precursors (L. Glutamine, p=0.02, L. Homoserine, p=0.05) and enhanced β-oxidation (lower carnitine, higher long-chain acylcarnitines, p<0.001) than observed during euglycemia. However, cardio-respiratory and counter-regulatory responses did not differ from those produced when euglycemic.
Conclusion: Hypoglycemia during exercise was associated with an overflow in adenosine purine salvage pathway activity as well as an increased reliance on gluconeogenesis and β-oxidation to support energy turnover. Despite the clear impact of hypoglycemia on skeletal muscle metabolism, the physiological and counter-regulatory hormonal responses to in-exercise hypoglycemia remained comparable to those observed during euglycemia.
Clinical Trial Registration Number: DRKS00013509
Supported by: Novo Nordisk
Disclosure: O. McCarthy: None.
401
Long duration diabetes is associated with a lower C-peptide concentration and response to aerobic exercise in individuals with type 1 diabetes
J.P. Pitt1, O. McCarthy1, O. Moser2, M.L. Eckstein2, R. Deere3, S.C. Bain4, R. Churm1, G.J. Dunseath4, C. Jones4, R.M. Bracken1;
1Applied Sport, Technology, Exercise and Medicine Research Centre (A-STEM), Swansea University, Swansea, UK, 2Department of Internal Medicine, Medical University of Graz, Graz, Austria, 3Department for Health, Bath University, Bath, UK, 4Diabetes Research Group, Medical School, Swansea University, Swansea, UK.
Background and aims: Although low-level endogenous insulin secretion is apparent in many individuals with type 1 diabetes (T1D), little is known about the responsiveness of the residual, yet functional, β-cells to different physiological stimuli, such as exercise. This study compared the influence of continuous aerobic exercise on C-peptide response in people with varying durations of T1D.
Materials and methods: 16 individuals (see Table) with T1D undertook 45 minutes of submaximal bicycle exercise (60 ± 6 % VO2max). Those with stimulated C-peptide concentrations ≥ 30.0 pmol.L-1 were classed as low-level secretors (LLS) or < 30.0 pmol.L-1 as microsecretors (MS). Venous C-peptide, blood glucose (BG) and hormones (glucagon, adrenaline [EPI], and noradrenaline [NE]) were characterised immediately before and after exercise. C-peptide was quantified via chemiluminescence assay. Participants consumed a carbohydrate meal (1g.kg-1 carbohydrates) 1 h before exercise with a bolus dose of insulin Aspart (MS 0.05 ± 0.03 vs LLS 0.04 ± 0.02 IU.kg-1; p = 0.016). Data were compared via Independent samples T-test or non-parametric equivalent while insulin dosage and exercise start BG were accounted for by ANCOVA. Relationships between characteristics and analytes were determined via regression analysis. Data expressed as Means ± SD. Statistical significance was accepted at p ≤ 0.05.
Results: MS had lower feed-stimulated C-peptide concentrations compared to LLS (10.39 ± 7.77 vs 200.42 ± 159.342 pmol.L-1, respectively; p < 0.001). Post-prandial C-peptide declined more during exercise in LLS than MS (MS 0.31 ± 6.96 vs LLS -59.86 ± 49.69 pmol.L-1; p < 0.001) yet remained higher at end of exercise (MS 10.69 ± 10.39 vs LLS 140.55 ± 119.88 pmol.L-1; p < 0.001). Longer duration diabetes was associated with a smaller exercise-induced drop in C-peptide (R2 = 0.277; p = 0.036). While the pre-exercise BG was similar (MS 8.08 ± 2.82 vs LLS 8.37 ± 2.48 mmol.L-1; p = 0.668), there was a lower BG concentration at exercise end when accounting for BG concentrations at exercise start in LLS (MS 4.87 ± 2.58 vs LLS 3.88 ± 1.19 mmol.L-1; p = 0.017). EPI concentrations were higher at end of exercise in LLS compared to MS (MS 0.048 ± 0.065 vs LLS 0.120 ± 0.140 nmol.L-1; p = 0.021). Exercise-induced responses in NE and glucagon concentrations were similar within and between groups.
Conclusion: People with long duration T1D have a lower concentration and smaller suppressive effect on C-peptide response to continuous aerobic exercise compared to those with shorter duration. These data reveal new insights into the impact of acute exercise as a physiological stimulus on pancreatic β-cell function in people with T1D.

Clinical Trial Registration Number: DRKS00013509
Supported by: Novo Nordisk
Disclosure: J.P. Pitt: Grants; Novo Nordisk.
402
Cutaneous blood flow after an acute sub-maximal exercise in type 2 diabetic patients without or with small and/or large fiber neuropathy
C. Reynès1, F. Plat2, H. Ennaifer2, L. Rocher2, Y. Knapp1, A. Vinet1;
1Laboratoire de Pharm-Ecologie Cardiovasculaire, Avignon, 2Centre Hospitalier Avignon, Avignon, France.
Background and aims: Microcirculation dysfunction is common in type 2 diabetes (DT2) and plays a crucial role in diabetic neuropathy (NP) development. NP could affect large and small nerve fibers concomitantly, or separately. Some microcirculatory vasomotor adaptations are altered in DT2 with NP. Exercise-induced vasodilation mainly due to endothelial and neurogenic factors could worsen the microvascular alterations in NP. The question of whether small and/or large fibers NP impacts exercise response is unknown. But, small adrenergic sympathetic fibers are known to innervate arterioles and arteriovenous anastomoses. Accordindly, small fiber NP may be more prone to have altered CBF response to exercise than large fiber NP. Thus, the aim of this study was to compare CBF in basal conditions and in response to acute sub-maximal exercise in DT2 patients without and with small or/and large fiber NP.
Materials and methods: Forty-nine patients with DT2 were recruited including18 DT2 without NP (DT); 12 DT2 with small fiber NP (SFN); 10 DT2 with large fiber NP (LFN); 9 DT2 with mixed small and large fiber NP (SLFN). NP was assessed with sural nerve conduction (amplitude and velocity; DPN-Check, Neurometrix) for large fibers and thermal testing (cold and warm; NerveCheck, PhiMed Europe) for small fibers. CBF on the dorsal foot was assessed using Laser Speckle Contrast Imaging (PeriCam PSI System®, Perimed) at rest and during 10 minutes following the six-minutes walking test. CBF values, expressed in conventional perfusion unit (PU) were averaged over each minute of recovery. Generalized linear mixed model and time effect analysis (repeated measures ANOVA) were used to compare CBF during 10 minutes recovery between DT2 and all NP, and in each group using SPSS® software (IBM Corp, Armonk, NY).
Results: Diabetes duration, HbA1c, arterial pressure and exercise performance were not different between groups. At rest, CBF was not different between groups. During recovery, no time and group effects were noted between DT and all NP. However, CBF decreased significantly from the first minute of recovery to the 10th in DT and LFN, with no difference between groups, due to return to basal CBF after exercise vasodilation. Dynamics of CBF during recovery were significantly different between DT and SFN (p<0.05) and between DT and SLFN (p=0.06) with no-time effect (Figure 1).
Conclusion: As soon as small fibers are impacted by diabetic neuropathy, vasodilatatory response are lost. This lack of exercise-induced vasodilation may be due to 1) loss of neurogenic control and/or 2) impaired vasodilation endothelial-dependant capacity. The study of flowmotion analysis during recovery may be helpful in understanding these underlying mechanisms.

Clinical Trial Registration Number: 03847779
Disclosure: C. Reynès: None.
403
Exercise non-response in hyperglycaemic NZO mice is associated with elevated concentrations of BCAAs and ketone bodies
C.A. Springer1, C. Binsch1, D. Herebian2, B. Knebel1, M. Lienhard3, R. Herwig3, A. Chadt1, H. Al-Hasani1;
1Institute for Clinical Biochemistry and Pathobiochemistry, German Diabetes Center, Leibniz Institute for Diabetes Research at Heinrich Heine University Düsseldorf; German Center for Diabetes Research (DZD), Düsseldorf, 2Department of General Pediatrics, Neonatology and Pediatric Cardiology, Medical Faculty, University Children's Hospital, Heinrich-Heine-University Düsseldorf, Düsseldorf, 3Max Planck Institute for Molecular Genetics (MPIMG), Berlin, Germany.
Background and aims: While regular exercise remains the predominant remedy for the prevention and treatment of type-2 diabetes (T2D), not all individuals show considerable improvements in glycemia. We recently showed that in New Zealand Obese (NZO) mice, the response to exercise is dependent on the glycemic state as well as on skeletal muscle mitochondrial function. In contrast to normoglycemic NZO mice (NG), a hyperglycemic subgroup (HG) did not demonstrate improved insulin sensitivity following a chronic training intervention. Here, we investigated plasma metabolites in the NZO subgroups using a targeted metabolome approach.
Materials and methods: EDTA-plasma samples were collected from NG and HG NZO mice subjected to a high-fat diet with 30 % fat from calories that either performed a six-week treadmill training intervention or remained sedentary. Plasma metabolites were analyzed by mass spectrometry using the Biocrates AbsoluteIDQ p180 kit. Concentration of plasma ketone bodies was measured photometrically. Significant differences between the groups were determined using two-way ANOVA.
Results: From all the different metabolites analyzed, most considerable changes were observed in plasma amino acid concentrations between the NG and HG subgroup. Total plasma amino acid levels were elevated in the HG subgroup in response to the training intervention compared to NG mice (HG vs. NG; 4230 ± 189 μmol/l vs 3299 ± 175 μmol/l, n = 6-8, p<0.05). Notably, concentrations of the branched-chain amino acids (BCAAs) isoleucine (HG vs. NG; 409 ± 37 μmol/l vs 184 ± 17 μmol/l, n = 6-7, p<0.001), leucine (HG vs. NG; 657 ± 56 μmol/l vs 295 ± 25 μmol/l, n = 6-7, p<0.001) and valine (HG vs. NG; 726 ± 58 μmol/l vs 421 ± 81 μmol/l, n = 4-5, p<0.05) were markedly increased in trained HG mice compared to the NG subgroup. Moreover, we found that total plasma ketone bodies were markedly elevated in response to exercise in the HG subgroup (HG vs. NG; 848 ± 249 μmol/l vs 69 ± 9.3 μmol/l, n = 8-9, p<0.001).
Conclusion: In conclusion, hyperglycemic NZO mice subjected to chronic exercise display disturbed amino acid metabolism and ketosis, resulting in impaired insulin sensitivity. Elevated BCAAs and ketone body concentrations in combination with hyperglycemia may be used as predictive markers for exercise non-response in future precision medicine approaches.
Disclosure: C.A. Springer: None.
404
Separate free fatty acid pools are involved in muscle lipid utilisation
L.S. Chow1, D.G. Mashek2, M.D. Jensen3;
1Medicine, University of Minnesota, Minneapolis, 2BMBB, University of Minnesota, Minneapolis, 3Medicine, Mayo Clinic, Rochester, USA.
Background and aims: Despite discrepant phenotypes, the insulin resistant (IR) and trained states have high levels of intramyocellular lipid. We hypothesize that higher muscle lipid turnover in the trained state may explain this discrepancy.
Materials and methods: O>bese, IR subjects and trained subjects were fasted overnight (Table1). To characterize muscle lipid turnover, we conducted a pulse-chase experiment using sequential [U-13C]palmitate and [9-2H]palmitate infusions (6 h each) with a 1 hour overlap to label endogenous and exogenous free fatty acid (FFA) pools. Biopsy#1 (Bx#1 -s/p 14 hr fast) was performed at the time of the overlap (last hour of the 6 h [U-13C]palmitate infusion, after 1 h of starting the [9-2H]palmitate). Bx#2 was performed at the study conclusion (last hour of the [9-2H]palmitate infusion-s/p 20 hr fast). Plasma and muscle samples were analyzed for palmitate enrichment and concentration.
Results: Regardless of phenotype, muscle triglyceride (IMTG) synthesis at Bx#1 was not different as assessed by either [U-13C]palmitate or [9-2H]palmitate; IMTG synthesis assessed by [9-2H]palmitate was 9-fold higher than [U-13C]palmitate. At Bx#2, IMTG breakdown as assessed by [U-13C]palmitate was similar between groups, whereas [9-2H]palmitate showed IMTG synthesis in the obese, IR group and IMTG breakdown in the trained group
Conclusion: IMTG synthesis was higher with recent (1 hour) FFA exposure than more prolonged (6 hour) FFA exposure supporting separate FFA pools in lipid utilization.

Clinical Trial Registration Number: NCT02150889
Supported by: NIH, NIDDK
Disclosure: L.S. Chow: Grants; NIH/NIDDK : 1R01DK098203, NIH :UL1TR000114.
405
AMPK and the RabGAPs TBC1D1 and TBC1D4 are necessary but not sufficient for contraction-mediated glucose metabolism in skeletal muscle
L. Espelage1, C. de Wendt1,2, L. Toska1, C. Springer1,2, T. Benninghoff1,2, T. Stermann1,2, A. Chadt1,2, H. Al-Hasani1,2;
1German Diabetes Center (DDZ), Düsseldorf, 2German Center for Diabetes Research, Munich-Neuherberg, Germany.
Background and aims: Skeletal muscle glucose uptake is enhanced by insulin or muscle contraction due to increased translocation of GLUT4-containing storage vesicles to the plasma membrane. The serine/threonine AMP-activated protein kinase (AMPK) is a key factor in controlling cellular energy metabolism. As major downstream targets of AMPK, the RabGAPs (Rab-GTPase-activating proteins) TBC1D1 and TBC1D4 are phosphorylated in response to skeletal muscle contraction, resulting in GLUT4 translocation, thus enhancing glucose influx into the cell. Loss of TBC1D1 and/or TBC1D4 leads to disturbed skeletal muscle glucose uptake after stimulation with the AMPK activator AICAR (5-Aminoimidazole-4-carboxamide ribonucleotide). The aim of this study was to reveal the individual contribution of AMPK inactivity and RabGAP deficiency in contraction-dependent glucose metabolism of skeletal muscle.
Materials and methods: A transgenic mouse strain overexpressing a kinase-dead mutant of the AMPKα2-subunit (AMPK-DN) under control of the muscle creatine kinase (MCK) promotor, was crossbred with RabGAP-deficient animals to obtain the following genotypes: Wildtype (WT), transgenic AMPKα2-DN (TG), AMPKα2-DN-D1KO (TG-D1KO), AMPKα2-DN-D4KO (TG-D4KO) and AMPKα2-DN-D1/4KO (TG-D1/4KO). Whole-body glycemia was measured via glucose and AICAR tolerance tests and a fasting and refeeding experiment. To determine ex vivo contraction-mediated glucose uptake, intact isolated Extensor digitorum longus (EDL) muscles were placed into a muscle strip myograph chamber, incubated with [3H]2-deoxyglucose and electrically stimulated for 10 minutes.
Results: The combined inactivation of AMPK and RabGAP deficiency did not lead to additive impairments in whole-body glycemia. Though postprandial blood glucose levels were increased in TG-D4KO and TG-D1/4KO mice (WT vs. TG-D4KO vs. TG-D1/4KO: 221 ± 8.35 vs. 294 ± 14.7 vs. 369 ± 27.5 mg/dl; p<0.05), glucose and AICAR tolerance were unaltered compared to WT mice. In EDL muscle, ex vivo contraction-mediated glucose uptake was impaired in TG-D1/4KO mice (WT vs. TG-D1/4KO: 9.49 ± 0.74 vs. 3.81 ± 0.45 nmol/mg/20min; p<0.05), likely due to reduced GLUT4 protein levels in EDL muscle of TG-D1KO and TG-D1/4KO mice (WT vs. TG-D1KO vs. TG-D1/4KO: 1.00 ± 0.03 vs. 0.62 ± 0.06 vs. 0.79 ± 0.08 arbitrary unit). However, contraction-mediated increase in glucose uptake was still observed, indicating an AMPK-RabGAP-independent pathway regulating contraction-induced glucose uptake. Interestingly, a significantly upregulated mRNA and protein expression of the AMPK-related kinase Nuak1 was observed in TG mice and strongly elevated in TG-D1KO, TG-D4KO and TG-D1/4KO mice.
Conclusion: We elucidated the contribution of an AMPK inactivity combined with RabGAP deficiency in contraction-dependent glucose metabolism of skeletal muscle. Our data reveal that a combined inactivation of AMPK and RabGAP deficiency did not lead to additive impairments in whole-body glycemia. Despite reduced contraction-induced glucose uptake into skeletal muscle, TG-D1/4KO muscle still displayed a contraction response. Our data indicate an alternative pathway of contraction-mediated glucose transport into skeletal muscle, independently from AMPK and the two RabGAPs. The AMPK-related kinase NUAK1 may play a role in this process.
Supported by: DFG (German Research Foundation): AL452/4–1, DDG (German Diabetes Society): General project funding
Disclosure: L. Espelage: None.
PS 23 The ins and outs of carbohydrate metabolism
406
Post-challenge hypoglycaemia in individuals with "normal glucose tolerance"
L. Hakaste1,2, M. Lehtovirta1, L. Groop1,3, T. Tuomi1,4;
1Finnish Institute of Molecular Medicine, University of Helsinki, Helsinki, Finland, 2Folkhälsan Research Centre, Biomedicum, Helsinki, Finland, 3Lund University Diabetes Centre, Lund University, Malmö, Sweden, 4Department of Endocrinology, Helsinki University Hospital, Helsinki, Finland.
Background and aims: Post-prandial hypoglycemia in non-diabetic individuals is often considered to be a prediabetic phenomenon associated with insulin resistance. Also poor first-phase insulin secretion (FPIR) may result in a high peak glucose concentration and reactive hypoglycaemia. However, some studies have shown that those with hypoglycemia are metabolically healthier. We studied the prevalence of post-challenge hypoglycaemia and its association with 30 min glucose, FPIR and insulin resistance estimated from OGTT.
Materials and methods: We studied 3449 (1523 men, 1926 women) individuals from the population-based PPP-Botnia Study, who were normoglycaemic by the WHO criteria. The examination comprised a 75 g OGTT with blood sampling at 0, 30 and 120 min, a questionnaire and measurement of height, weight, waist circumference, blood pressure (BP) and fat percentage (bioimpedance). We compared those with 2-h plasma glucose (PG) <3 mmol/l or ≥4 mmol/l (excluding those with intermediate 2-h PG). We repeated the analyses in a matched (sex, age ±5 years, BMI ±3 kg/m2, family history of diabetes) case-control setting (ratio 1:3 except for two 1:2 sets; 206 cases, 615 controls).
Results: As many as 6.1% (209/3449) of the formally normoglycaemic individuals had post-challenge hypoglycaemia, men more often than women (p=<0.001). Those with hypoglycemia had lower BMI (p=0.004) and BP (SBP p=0.03; DBP p =0.001), and better insulin sensitivity (HOMA1-IR p<0.001, insulin sensitivity index p <0.001) compared to those without. Contrary to our expectation, the post-challenge hypoglycaemia was not associated with a higher PG at 30 min or lower FPIR estimated as corrected insulin response (CIR) at 30 min. In fact, both 30 min glucose (p=0.02) and glucose area under curve (AUC, p=<0.001) as well as insulin AUC (p=<0.001) were lower in those with hypoglycemia. The GIP (Gastric inhibitory polypeptide) response at 120 min was lower in those with hypoglycemia (p<0.001), but they had higher fasting GIP (p=0.002; not statistically significant after adjusting for age, sex and BMI). The results were consistent in logistic regression analysis adjusted for sex, age, BMI as well as in the case-control setting. Incidentally, smoking was more frequent in those with hypoglycemia (p<0.001).
Conclusion: In this population-based setting, reactive hypoglycaemia or insulin resistance were not associated with the relatively common post-challenge hypoglycaemia. Those reacting with hypoglycaemia to oral glucose challenge were metabolically healthier and had lower 30 min glucose and insulin response during OGTT compared to others. This could be due to increased glucose responsiveness. We will proceed to explore possible genetic associations contributing to this phenomenon.

Disclosure: L. Hakaste: None.
407
Estimating pentose phosphate pathway activity from the analysis of hepatic glycogen 13C-isotopomers from [U-13C]fructose
G.D. Belew, L. Tavares, A.N. Torres, G.D. Nunzio, J.G. Jones;
Metabolic Control Group, Center for Neuroscience and Cell biology (CNC), Coimbra, Portugal.
Background and aims: In the fed state, sugar phosphate flux through the pentose phosphate pathway (PPP) is a key requirement for de novo lipogenesis since it generates NADPH equivalents for fatty acid synthesis and/or elongation. Recently, a method for quantifying PPP activity in circulating glucose or liver glycogen by analysis of hexose 13C-isotopomers generated from [U-13C]glycerol was developed. Since both fructose and glycerol are metabolized to glucose or glycogen via common triose phosphate intermediates, we reasoned that [U-13C]fructose could also be used to measure PPP activity. Among other things, this allows PPP activity to be measured under conditions of high fructose feeding, where it contributes acetyl-CoA to the synthesis of fatty acids via de novo lipogenesis. To date, it is not known to what extent fructose also contributes to PPP activity.
Materials and methods: Six male C57/BL6 mice fed with standard chow were provided with a 55/45 mixture of fructose and glucose. This sugar mixture was presented at 30% w/v in the drinking water for 18 weeks. On the final evening, the fructose component was enriched with 20% [U-13C]fructose. The mice were allowed to feed naturally overnight and then sacrificed. Livers were freeze-clamped and glycogen was extracted and derivatized for 13C NMR spectroscopy. From the 13C NMR analysis of glycogen 13C isotopomers, PPP activity was estimated using the same analysis previously developed for [U-13C]glycerol.
Results: Hepatic glycogen was enriched with 13C-isotopomers from the metabolism of [U-13C]fructose to glycogen via triose and hexose phosphates. The distribution of 13C-isotopomers in carbons 123 of glycogen was significantly different from those in carbons 456, indicating that the PPP was active under our experimental conditions. Applying the analysis previously developed for [U-13C]glycerol to our 13C-isotopomer data, we estimated that 9±1% of the fructose that had been metabolized to glucose-6-phosphate was utilized by the PPP.
Conclusion: Fructose is considered to be a highly lipogenic sugar and it has been previously shown to contribute substantially to de novo lipogenesis in mouse models. In this study, we demonstrate that it also supports PPP activity, thereby contributing NADPH for the reductive formation of fatty acids during de novo lipogenesis.
Supported by: Marie Curie ITN FOIE GRAS (No. 722619)
Disclosure: G.D. Belew: None.
408
Evaluation of carbohydrate biosynthesis with 18O-enriched water and isotope shifted 13C NMR analysis: proof of concept
M. Coelho, C. Barosa, J. Jones;
University of Coimbra, Coimbra, Portugal.
Background and aims: Water enriched with the heavy isotope of oxygen (H218O) is a potential tracer for evaluating endogenous glucose and glycogen synthesis. In contrast to the currently used deuterium-enriched water tracer (2H2O), 18O does not suffer significant isotope effects on being incorporated into glucose-6-phosphate. Therefore, H218O should provide more precise and reliable estimates of gluconeogenesis and glycogen synthesis provided that its incorporation into the various positions of the common intermediate, glucose-6-phosphate, can be quantified. We demonstrate that this can be achieved by 13C NMR analysis of glucose, where carbons that are bound to 18O are shifted upfield from those bound to 16O. As a proof of concept, we applied this analysis to erythrocyte hemolysate preparations that were provided with H218O and sugar phosphate intermediates to initiate 18O-exchange reactions mediated by aldolase and transaldolase.
Materials and methods: Erythrocyte hemolysates were prepared from fresh human blood, mixed with a buffer enriched to 20, 40 and 80% with H218O and incubated for 45 minutes at 37°C. Enzymatic activity was then quenched with ZnCl2/Ba(OH)2 and sugar phosphates were dephosphorylated with alkaline phosphatase. The glucose obtained from glucose-6-phosphate was derivatized to monoacetone glucose and analyzed by 13C NMR.
Results: In 13C NMR spectra taken in the presence of hemolysate, 18O-shifted signals were observed for glucose-6-phosphate positions 1, 2, 3, 4 and 5 while none were detected for positions 6. This 18O-enrichment pattern is consistent with exchanges of water and sugar phosphate oxygens catalyzed by aldolase and transaldolase. In the absence of hemolysate, there was no incorporation of 18O into any carbon-bound oxygen of glucose-6-phosphate.
Conclusion: Enrichment of specific glucose-6-phosphate oxygens from H218O can be detected by isotope-shifted 13C NMR. This demonstrates the potential for developing H218O as a novel tracer of hepatic glucose and glycogen synthesis.
Supported by: FCT-FEDER (02/SAICT/2017/028147), UIDB/04539/2020, P17827, PD/BD/135178/2017, REEQ/481/QUI/2006
Disclosure: M. Coelho: None.
409
Quantifying the contributions of the fructose and glucose components of high-fructose corn syrup formulation (HFCS-55) to hepatic glycogen synthesis
A. Nunez Torres, G.D. Belew, G. DiNunzio, L. Tavares, L. Tavares, J.G. Jones;
Intermediary Metabolism, Center for Neuroscience and Cell Biology, University of Coimbra, Coimbra, Portugal.
Background and aims: In North America, high-fructose corn syrup-55 (HFCS-55) is widely used as a sweetener in processed foods and soft drinks and is implicated in the rise in obesity rates and incidence of non-alcoholic fatty liver disease (NAFLD). Hepatic glycogen is an important short-term source of fasting glucose and also plays a role in systemic fuel sensing. The impact of HFCS-55 on hepatic glycogen synthesis is currently unclear. Glycogen synthesis from glucose is dependent on glucokinase (GK) activation, but this may be defective in the insulin-resistant state of NAFLD. While glycogen synthesis from fructose does not involve GK, fructose is a GK activator - which should promote glucose conversion to glycogen. We therefore sought to quantify the contributions of glucose and fructose components to glycogen synthesis in mice fed with standard chow and whose drinking water was supplemented with a 55/45 fructose/glucose mixture representing HFCS-55.
Materials and methods: 12 male C57/BL6 mice fed with standard chow were provided with drinking water containing 30% HFCS-55 w/v for 12 weeks. On the final evening, the fructose component was enriched with [U-13C]fructose for 6 mice while the glucose component was enriched with [U-13C]glucose for the remaining 6 mice. They were allowed to feed naturally overnight and then sacrificed. Livers were freeze-clamped and glycogen was extracted and derivatized for 13C NMR spectroscopy. From the 13C NMR analysis of glycogen 13C isotopomers, the contributions of glucose and fructose to glycogen synthesis was estimated.
Results: Hepatic glycogen was enriched with 13C-isotopomers form both [U-13C]fructose and [U-13C]glucose indicating that both sugars of the HFCS-55 formulation were recruited for glycogen synthesis. The majority of glucose was incorporated via the direct pathway while fructose was metabolized via the indirect pathway. The glucose component of HFCS contributed 15±5% of total glycogen while fructose contributed 14±2% (p=ns).
Conclusion: In mice whose chow diet was supplemented with high levels of HFCS-55 for 12 weeks, both glucose and fructose components of contributed equally to overall hepatic glycogen synthesis despite the higher proportion of fructose to glucose. This indicates that the capacity for glucose conversion to glycogen via GK was not compromised in this setting.

Supported by: TREATMENT (H2020-MSCA-ITN-2016-721236), FCT-FEDER (02/SAICT/2017/028147)
Disclosure: A. Nunez Torres: Grants; FCT-FEDER (02/SAICT/2017/028147), TREATMENT (H2020-MSCA-ITN-2016-721236).
410
Comparison of paracetamol absorption and gastric emptying measured by scintigraphy in relation to rate of appearance of oral glucose and postprandial glycaemia
R. Bizzotto1, C.K. Rayner2, L.E. Watson2, L.K. Phillips2, K. Lange2, M.J. Bound2, J. Grivell2, T. Wu2, K.L. Jones2, M. Horowitz2, E. Ferrannini3, D. Tricò4, S. Frascerra4, A. Natali4, A. Mari1;
1CNR Institute of Neuroscience, Padova, Italy, 2Adelaide Medical School, University of Adelaide, Adelaide, Australia, 3CNR Institute of Clinical Physiology, Pisa, Italy, 4Department of Clinical and Experimental Medicine, University of Pisa, Pisa, Italy.
Background and aims: Gastric emptying (GE) controls the rate of appearance of oral glucose (RaO), which affects postprandial glycaemia. ‘Gold standard’ methods exist for measurement of GE (scintigraphy) and RaO (dual tracer), but require complex methodology. Paracetamol absorption has been used widely as a surrogate for GE of liquids, but there is a lack of information about comparisons with scintigraphy and how each relates to RaO and postprandial glycaemia. We evaluated these parameters in patients with type 2 diabetes (T2D), with and without lixisenatide, which is known to slow GE markedly.
Materials and methods: 28 T2D patients underwent 240 min assessment of GE (scintigraphy) and RaO (dual tracer) after a 75 g OGTT (with 1 g paracetamol), before and after 8-week lixisenatide 20 μg daily (N=14) or placebo. We calculated paracetamol rate of appearance (RaP), dose-normalized cumulative RaP (AUCRaP) and RaO (AUCRaO), and incremental blood glucose AUC (iAUCG), at 60, 120 and 240 min. Differences and correlations were tested by repeated measures linear regression in OGTTs with lixisenatide (Lixi) and in all other OGTTs (NoLixi).
Results: In NoLixi, GE increased to approach 1.0 (ie. complete), while AUCRaO and AUCRaP reached a plateau (~0.6 and ~0.8) at 120 min (Table). AUCRaP overestimated GE initially and underestimated GE later. In Lixi, the increases in GE, AUCRaP and AUCRaO were markedly reduced, and AUCRaP consistently overestimated GE. Under both conditions, GE and AUCRaO curves overlapped for >60 min before diverging (GE > AUCRaO), while AUCRaP was consistently greater than AUCRaO. Correlations between GE, AUCRaP, and AUCRaO were evident with Lixi, but not NoLixi (Table). In NoLixi, iAUCG modestly correlated with AUCRaP (R2 = 0.53, 0.38 and 0.29 at 60, 120 and 240 min) and, at 60 and 120 min, modestly correlated with GE (R2 = 0.30 and 0.29) and AUCRaO (R2 = 0.58 and 0.24). In Lixi, iAUCG correlated with GE (R2 = 0.75 and 0.65 at 60 and 240 min) and similarly with AUCRaP (R2 = 0.76 and 0.58), although less strongly than with AUCRaO (R2 = 0.93 and 0.74). Correlations remained significant after adjustment for OGTT-derived β-cell function and insulin sensitivity measures.
Conclusion: In T2D patients, measures derived from scintigraphy, paracetamol, and glucose tracers differ after a 75g OGTT, with greater discordance when GE of liquids is inhibited pharmacologically. However, paracetamol is predictive of GE inhibition variability and of the effect of GE and glucose absorption variability on postprandial glucose, at baseline and when GE is slowed.

Clinical Trial Registration Number: ACTRN12616001059459
Supported by: Sanofi
Disclosure: R. Bizzotto: None.
411
Effect of meal texture on glucose excursions after bariatric surgery
N. Hedbäck1,2, M. Hindsø1,2, A.K. Linddal1, K.N. Bojsen-Møller1, N.B. Jørgensen1, C. Dirksen1, A. Møller1, V.B. Kristiansen3, J.J. Holst2,4, M.S. Svane1,3, S. Madsbad1;
1Department of Endocrinology, Hvidovre University Hospital, Hvidovre, 2Department of Biomedical Sciences, the Panum Institute, University of Copenhagen, Copenhagen, 3Department of Surgical Gastroenterology, Hvidovre University Hospital, Hvidovre, 4Novo Nordisk Foundation of Basic Metabolic Research, University of Copenhagen, Copenhagen, Denmark.
Background and aims: The metabolic consequences of the bariatric procedures, Roux-en-Y gastric bypass (RYGB) and sleeve gastrectomy (SG), are often studied using liquid meals, but it is not clear whether a liquid meal is representative for the metabolic and hormonal responses to a real-life solid meal. We therefore investigated the changes in plasma glucose in patients operated with RYGB or SG after ingestion of two identical mixed test meals, one of which was blended to create a smooth liquid meal while the other retained its solid components.
Materials and methods: We recruited 7 RYGB and 9 SG operated individuals with no history of diabetes who were carefully matched for age, sex, body mass index, and postoperative weight loss. In random order, each participant underwent a liquid and solid 4-hour mixed meal test on separate days. The composition of the two test meals were similar (309 kcal; 47 E% carbohydrates, 18 E% proteins, 32 E% fat and 3 E% dietary fibers; potato, chicken, raisins, pineapple, Patak’s Butter Chicken sauce, coconut, psyllium seeds and milk). The meals were ingested evenly over 20 minutes and blood was sampled before and for 4 hours after initiation of the meal. A two-way repeated measures ANOVA was performed to evaluate the effect of meal texture (liquid versus solid) over time on plasma glucose values. Area under the glucose curves were compared using students t-tests. Data are means (95% confidence intervals (CI)).
Results: The AUCs for plasma glucose did not differ after the two meals (liquid: 1445 mmol/L (CI 1364; 1526), solid: 1447 (CI 1359; 1535), p=0.84) in the SG operated patients or in the RYGB operated patients (AUC liquid: 1444 (CI 1388; 1456), solid: 1421 (CI 1358; 1483), p=0.95). Moreover, the AUCs for glucose were similar in RYGB and SG during both meals (liquid: p=0.56; solid meal: p= 0.57). The peak of glucose concentration did not differ between the two meals within groups (SG; liquid: 6.7+-0.50mM, solid: 6.7+0.57mM p = 0.91; RYGB; liquid: 7.4 ± 0.9mM, solid: 7.1 ± 0.7mM p = 0.55). Further, no difference was found for time to peak glucose concentration within groups (SG liquid: 24min ± 4., solid 23 ± 4.3 min p = 0.69; RYGB; liquid 22 ± 6.4min, solid 26 ± 4.2 p = 0.28) (figure 1).
Conclusion: Ingestion of solid and liquid but otherwise identical meals resulted in similar post-prandial glucose responses in RYGB-operated and SG-operated patients. Liquid test meals are therefore a representative tool when evaluating meal responses in these patients.

Clinical Trial Registration Number: NCT04082923
Supported by: European Research Council
Disclosure: N. Hedbäck: None.
412
Short-term high-starch diet reversibly increases beta cell mass in mice
S. Ueno1, Y. Seino1, A. Masuda1, S. Sakai1, M. Murase2, H. Fujisawa1, M. Shibata1, T. Takayanagi1, Y. Sugimura1, Y. Hayashi3, A. Suzuki1;
1Fujita Health University, 1-98, Dengakugakubo, Kutsukake-cho,Toyoake, Aichi, 2Toyota Memorial Hospital, 1-1, Heiwacyou,Toyota, Aichi, 3Nagoya University, D2-1, Furou-cho, chigusaku, Nagoya, Aichi, Japan.
Background and aims: We previously showed that excessive insulin secretion and increased β-cell mass (BCM) contributes to obesity in mice fed high-starch diet (HSTD) for 22 weeks. However, whether or not the increased BCM and associated insulin levels in these mice are due to body weight gain and/or insulin resistance or to other consequences of HSTD is not known. In the present study, we investigated to find if increased BCM and excessive insulin secretion induced by high-starch diet is independent of body weight gain and participates in glucose metabolism in mice fed HSTD for 7 weeks.
Materials and methods: Study 1 C57BL/6J wild-type (WT) mice were divided into three groups: Mice fed normal chow (NC) (starch 58%, protein 29%, and soy oil 13% of total energy 3.87 kcal/g) for 7 weeks, mice fed HSTD (starch 74%, protein 13%, soy oil 13% of total energy 3.43 kcal/g) for 7 weeks and mice fed HSTD for 5 weeks followed by NC for 2 weeks (STNC). Seven weeks after intervention of diets, 2 g/kg intraperitoneal glucose tolerance test (IPGTT) was performed; body weight, blood glucose levels, plasma insulin levels and pancreatic insulin contents were measured, and immunohistochemistry and morphological analyses were conducted. Study 2To investigate glucose metabolism in diabetic conditions, WT mice were divided into three groups: Mice fed NC treated with vehicle, mice fed NC treated with streptozotocin (STZ) and mice fed HSTD treated with STZ. Three weeks after intervention of diets, vehicle or 40 mg/kg STZ was administered intraperitoneally for 4 days, IPGTT was performed 5 weeks after intervention of diets, and insulin contents were measured 7 weeks after intervention of diets.
Results: Study 1 Body weight and blood glucose levels were not different among the three groups: NC group, HSTD group and STNC group. However, plasma insulin levels and pancreatic insulin contents were higher and pancreatic islet number and BCM were increased in HSTD group compared with NC group and STNC group, and were not different between NC group and STNC group 7 weeks after intervention of diets. On the other hand, blood glucose levels were not different among the three groups during IPGTT 7 weeks after intervention of diets. Study 2 Glucose intolerance during IPGTT was apparent in NC-STZ group and HSTD-STZ group compared to NC-vehicle group, and blood glucose levels during IPGTT were not different between NC-STZ group and HSTD-STZ group. Pancreatic insulin contents under ad libitum-fed condition were higher in NC-vehicle group compared with NC-STZ group and HSTD-STZ group, but there was no difference between NC-STZ group and HSTD-STZ group 7 weeks after intervention of diets.
Conclusion: Short-term high-starch diet increases islet number and BCM in mice independent of body weight gain. We expected that increased islet number and BCM induced by HSTD would contribute to improved glucose metabolism in mice, which was generally the case. However, HSTD did not improve glucose metabolism in mice in two models: (those switching from HSTD to NC (STNC) and β-cell destruction by STZ), probably because insulin content and/or BCM in STNC group and HSTD-STZ group are decreased.
Supported by: Grants-in-Aid for Scientific Research from Japan Society for the Promotion of Science (17k09823)
Disclosure: S. Ueno: None.
PS 24 Pregnancy: in vitro and in vivo studies
413
Nono/sfpq associate with shorter telomeres in villous trophoblasts of first trimester human placentas from insulin resistant mothers
J. Bandres-Meriz1, D. Hoch1, A. Majali-Martinez1, T.M. Kaudela1, A. Glasner2, S. Honeder3, M. Schittmayer-Schantl4, R. Birner-Gruenberger4, B. Novakovic5, R. Saffery5, G. Desoye1;
1Obstetrics and Gynaecology, Medical University of Graz, Graz, Austria, 2Femina-Med Center, Graz, Austria, 3Institute of Pathology, Diagnostic and Research Center for Molecular Biomedicine, Medical University of Graz, Graz, Austria, 4Institute of Chemical Technologies and Analytics, Vienna University of technology, Vienna, Austria, 5Murdoch Children’s Research Institute, Royal Children’s Hospital, Melbourne, Australia.
Background and aims: In the first trimester (FT) of human pregnancy the placenta is rapidly growing, making it sensitive to environmental influences. Here, we aimed to identify pathways and processes affected by the maternal metabolic environment associated with obesity.
Materials and methods: FT Placentas from lean (n=11) and obese (n=11) mothers and matched maternal blood samples were collected during voluntary pregnancy termination (week 5+0 to 6+0) after an overnight fast. Maternal BMI and leptin (ELISA) served as measures of obesity and adiposity and the maternal glucose-insulin axis (glucose, C-peptide, insulin sensitivity (ISHOMA)) was characterized. Untargeted proteome analyses (LC-MS/MS, Bruker maXis II ETD qTOF) were followed by dimensionality reduction (PCA) and pathway analysis (KEGG). Immunoblotting and immunohistochemistry validated the results. Telomere length was quantified (qPCR) in DNA from villous trophoblast (lean n=13, obese n=17) isolated by laser capture microdissection.
Results: The PCA model demonstrated two proteome clusters in the placenta samples. ISHOMA was the only discriminating maternal metabolic parameter (ISHOMA median [IQR] cluster 1: 0.95 [0.69-1.17]; cluster 2: 0.57 [0.20-1.00], p<0.05). SFPQ and its dimerization partner NONO, proteins involved in protecting telomere integrity, were significantly (p<0.05) enriched in the low ISHOMA group suggesting increased telomere instability in the trophoblast of insulin resistant mothers. Immunoblotting confirmed the association of SFPQ-NONO protein levels with insulin resistance and In-situ analysis co-localized SFPQ-NONO in the nucleus of villous cytotrophoblasts. Telomere lengths in the villous trophoblast were shorter in insulin resistant mothers (r=0.66, p=0.01).
Conclusion: Insulin resistance (low ISHOMA) associated with maternal obesity correlated with telomere instability and shortening in the villous trophoblast already at weeks 5-6. We speculate this may alter villous trophoblast, i.e. placental, growth early in pregnancy, and may explain reduced fetal growth in the second trimester of diabetic/obese pregnancies.
Supported by: FWF; PhD programmes DP-iDP and MOLIN
Disclosure: J. Bandres-Meriz: None.
414
T cell specific estrogen receptor alpha deficiency in gestational diabetic mice exhibits enhanced chronic inflammation with Th17 infiltration in visceral adipose tissue
T. Tanaka1, T. Wada2, K. Uno2, S. Ogihara2, Q. Ye2, H. Tsuneki2, A. Nakashima1, S. Saito1, T. Sasaoka2;
1Obstetrics and Gynecology, University of Toyama, Toyama City, 2Clinical Pharmacology, University of Toyama, Toyama City, Japan.
Background and aims: Maternal insulin resistance and a relative lack of insulin secretion are the pathogenesis of gestational diabetes mellitus (GDM). Increase of proinflammatory T helper 17 cells (Th17) and a decrease of regulatory T cells (Treg) have been reported in GDM patients, and these changes are suggested to cause insulin resistance in GDM. However, the underlying mechanisms for these immunological changes and their effect on glucose metabolism remain unknown. Since estrogen modulates T-cell immunity, we investigated the impact of estrogen receptor α (ERα) deletion specifically in T cells on glucose metabolism and chronic inflammations in the visceral adipose tissue of GDM model mice.
Materials and methods: Female CD4-cre, ERαfl/fl (KO) mice on a C57BL/6 background that ablated ERα specifically in T cells and ERαfl/fl (FL) mice were fed 60 kcal% HFD for 4 weeks, mated with male BALB/c mice to achieve allogenic pregnancy and were maintained with HFD to generate the GDM model. Mating was confirmed the next morning by the presence of a vaginal mucous plug, which represented gestational day (GD) 0.5. Mice were divided into four experimental groups: non-pregnant FL, KO, pregnant FL-GDM, and KO-GDM. Glucose and insulin tolerance tests were performed on gestational day (GD) 13.5 and 16.5, respectively. On GD 18.5, mice were sacrificed and T-cell subsets in the gonadal white adipose tissue (gWAT) and spleen were analyzed using flow cytometry. A histological examination was also conducted and proinflammatory gene expressions in the gWAT and liver were evaluated.
Results: KO mice mated with BALB/c mice showed a normal fertility rate as compared with FL mice. Fetal and maternal weights and tissue weights at sacrifice were similar between FL and KO mice. The liver weights of pregnant mice were heavier than those of non-pregnant mice, whereas weights of the spleen, gWAT and liver were not significantly altered between FL and KO mice. KO-GDM mice showed the deterioration of glucose tolerance with an increased number of Th17 cells in gWAT; however Th1 and Treg contents remained unchanged. Moreover, the expression levels of macrophage marker Emr1 and proinflammatory cytokine Tnfa in gWAT were significantly higher in KO-GDM mice than in FL-GDM mice. In contrast, expression of inflammatory genes was not significantly altered in the liver of both GDM mice. Hepatic steatosis observed in GDM mice in the histological analysis was also indistinguishable between the genotypes.
Conclusion: Estrogen contributes to the maintenance of glucose metabolism in GDM condition by coordinating T cell immunity through ERα. KO-GDM mice exhibited chronic inflammation with an increased number of Th17 cells, as the possible cause of immune abnormalities in patients with GDM.
Supported by: JSPS KAKENHI
Disclosure: T. Tanaka: None.
415
Pancreatic regenerating protein Iα: a novel predictor for gestational diabetes
J. Li1, X. Zhu1,2, L. Li1,2;
1Department of Endocrinology, Zhongda Hospital, Nanjing, Jiangsu, 2Pancreatic Research Institute, Southeast University, Nanjing, Jiangsu, China.
Background and aims: Pancreatic regenerating protein Iα (REG Iα) is an emerging biomarker in diabetes and its complications. However, the association between REG Iα and gestational diabetes mellitus (GDM) patients is unknown. In this study, we assessed whether REG Iα could predict the results of the oral glucose tolerance test (OGTT) for diagnosis of GDM.
Materials and methods: This was a case-control study of 436 subjects enrolled in a prospective cohort of pregnant women with a normal OGTT (control group) and a failed OGTT (GDM group). REG Iα serum values were measured by an enzyme-linked immunosorbent assay (ELISA) during the first trimester of pregnancy. Spearman correlation analyses were employed to identify the correlation between REG Iα and plasma glucose levels. Logistic regression analyses were used to determine the risk of GDM.
Results: Serum REG Iα levels were significantly higher in GDM subjects compared with those of healthy controls (p < 0.001). REG Iα levels correlated positively with fasting plasma glucose, 1-h postprandial glucose, as well as 2-h postprandial glucose levels (p < 0.001). Univariate analysis demonstrated that REG Iα has the highest diagnostic accuracy for GDM (odds ratio 7.8 [95% CI 3.7-16.5]). Multivariate regression analysis revealed REG Iα level as an independent predictor of GDM (8.3 [3.7-18.4]). The area under the receiver operating curve (AUC) for presence of GDM reached 0.710 (95 % CI 0.653-0.767).
Conclusion: REG Iα levels are significantly up-regulated in GDM patients and might be useful as a predictor of GDM in pregnant women. Measurement of REG Iα level may be a means to distinguish women at high risk for GDM early in pregnancy. A follow-up study with a large cohort is needed.
Clinical Trial Registration Number: 2016ZDSYLL076-P01
Disclosure: J. Li: None.
416
Maternal obesity affects DNA integrity and damage repair related functions in the first trimester with consequences for early human cytotrophoblast viability
D. Hoch1, M. Bachbauer1, C. Pöchlauer1, T. Kaudela1, A. Majali-Martinez1, J. Bandres-Meriz1, B. Novakovic2, A. Garvie3, A. Glasner4, R. Saffery2, L.H. Wong3, G. Desoye1;
1Medical University of Graz, Graz, Austria, 2Murdoch Children’s Research Institute, Melbourne, Australia, 3Monash University, Biomedicine Discovery Institute, Melbourne, Australia, 4Femina Med Center, Graz, Austria.
Background and aims: In the first trimester of human pregnancy, the intrauterine environment directly affects development of the rapidly growing placenta. Hence, we hypothesized that an intrauterine stress milieu associated with maternal obesity alters trophoblast DNA stability, thereby affecting its proliferative potential and apoptotic turnover.
Materials and methods: Placental tissue (gestational week 5-12 p.m.) was obtained from non-smoking women terminating pregnancy for psycho-social reasons. Pre-selected placental stress markers, DNA repair and cell cycle related genes were assessed using a PCR-gene panel and Nanostring, while proteins were quantified by immunoblotting. We quantified DNA damage (phospho-H2AX), proliferation (Ki67) and apoptosis (TUNEL) in villous cytotrophoblasts using a quantitative in situ analysis based on immunohistochemical triple-staining. Laser-capture microdissected trophoblast telomeres were quantified by qPCR and telomere length in situ was assessed by fluorescence in situ hybridization (FISH). Statistical analysis used a multivariate linear regression model with adjustments for gestational age.
Results: Maternal obesity increased expression of antioxidants glutathione S-transferase-1 (48%, P=0.05), glutathione reductase (2.12-fold, P=0.02) and decreased glutathione peroxidase-1 (-40%, P=0.01) and -2 (-24%, P=0.03). These differences were related to increased DNA damage in the villous trophoblasts (n=12, 6.9-fold, P<0.001) as well as to dysregulation of central DNA damage repair transducer genes (HDAC1, HDAC8, PARP1, FEN1, ku70, BLM) and proteins (ATR, p53, APE1). Proliferation of villous cytotrophoblast nuclei of obese women was decreased (n=22, -33.4%, P<0.05) and apoptosis increased (n=22, 5.6-fold, P<0.05) compared to non-obese women, whereas stromal cells were unaffected. Villous cytotrophoblast telomeres of obese women were shorter (n=32, - 58.6%, p < 0.001) in situ and may contribute to inducing damage repair processes.
Conclusion: The maternal obese environment changes DNA integrity, repair signaling and cell cycle control already in the first trimester of pregnancy. This is the first study linking maternal obesity with its effect on trophoblast proliferation and apoptosis in first trimester human placenta, which is known to associate with reduced placental and fetal growth in this period.
Disclosure: D. Hoch: None.
417
Nuclear receptors regulating inflammatory mediators in fetoplacental endothelial cells in gestational diabetes
M. George1, C.C. Gali1, C. Tam-Amersdorfer1, A. Stracke1, J. Strutz2, C. Wadsack2, U. Panzenboeck1, R. Zimmermann3, B. Leopold2;
1Pathophysiology and Immunology, Medical University of Graz, Graz, 2Obstetrics and Gynecology, Medical University of Graz, Graz, 3Molecular Biology and Biochemistry, University of Graz, Graz, Austria.
Background and aims: Gestational Diabetes Mellitus (GDM) is a state of increased oxidative stress with low-grade chronic inflammation accompanied by altered inflammatory profiles in mother, placenta and fetus. Oxysterols, endogenous liver-X receptor (LXR) ligands with pro-inflammatory properties, are elevated in cord blood and fetoplacental endothelial cells (HPEC) in GDM compared to healthy pregnancies. Here we aimed to investigate the pro-inflammatory signaling pathways elevated in GDM as compared to healthy HPEC, to assess the impact of LXR activation by endogenous (oxysterols) or synthetic agonists (TO901317 and GW3965) on inflammatory signaling pathways in HPEC, and to study the underlying mechanism of LXR mediated inflammatory signaling regulation.
Materials and methods: GDM subjects were diagnosed according to the WHO/IADPSG criteria, and those who had other pregnancy complications, such as hypertension, preeclampsia, HELLP syndrome or any sign of maternal or fetal infections were excluded from the study. HPEC were isolated from the arteries of the chorionic plate of term placentas obtained from healthy and GDM pregnancies using collagenase/dispase digestion mix and the cells were cultured for up to 12 passages for experiments. Cells were treated with oxysterols (7-ketocholesterol, 7βOH-cholesterol, 24OH-cholesterol, 27OH-cholesterol) in a concentration-dependent manner (10nM-10μM) or synthetic LXR specific agonists TO901317 and GW3965 (2 μM) for 24h. Intracellular cytokine profile, pro-inflammatory protein, ICAM1 and VCAM1 expression, p65-NFĸB translocation to the nucleus were analysed by qPCR, immunoblotting and immunofluorescence respectively.
Results: mRNA expression levels of pro-inflammatory cytokine IL6 and inflammatory mediator KLF-4 were upregulated by 2-fold in GDM compared to healthy HPEC. Phosphorylation of proteins involved in pro-inflammatory MAPK signaling (ERK, p38, JNK) and p65-NFκB were elevated in GDM HPEC. Treatment with TO and GW significantly reduced the pro-inflammatory MAPK signaling and mRNA expression levels of IL6 and KLF4 in GDM HPEC. However, oxysterol treatment significantly induced expression of cytokines like IL6, IL8, IL1α, IL1β, TNFα and activation of MAPK signaling and p65-NFĸB nuclear translocation in HPEC. Furthermore, oxysterol also induced cell adhesion molecules (ICAM1 and VCAM1) and Toll-like receptor 4 expressions in HPEC. Interestingly, treatment with TO and GW diminished the oxysterol induced inflammatory response in GDM and healthy HPEC.
Conclusion: Our findings suggest that GDM HPEC depict elevated inflammatory cytokine levels with active pro-inflammatory signaling. Oxysterols induce a pro-inflammatory condition in HPEC with activated MAPK and NFkB signaling and increased ICAM1 and VCAM1 expression while LXR activation with synthetic agonists improves the pro-inflammatory phenotype observed in GDM HPEC and also oxysterol induced inflammatory response.
Supported by: FWF
Disclosure: M. George: None.
418
The role of prolactin receptor in beta cell function and gene expression during pregnancy
C. Huang1, V. Shrivastava2, G. Makkar2, M. Lee2, M. Pretorius2, B. Radford2;
1Pediatrics, University of Calgary, Calgary, 2Biochemistry and Molecular Biology, University of Calgary, Calgary, Canada.
Background and aims: Pancreatic islets adapt to insulin resistance of pregnancy by up regulating beta-cell proliferation and increase insulin secretion. Previously, we found that prolactin receptor (Prlr) signaling is important for this process, as heterozygous prolactin receptor-null (Prlr+/-) mice are glucose intolerant, had a lower number of beta cells and lower serum insulin levels than wild type mice during pregnancy. However, Prlr expression is ubiquitous, and our aim is to understand the beta-cell specific effects of prolactin receptor.
Materials and methods: We obtained a promoter-driven cassette from EUCOMM and generated a transgenic mouse heterozygous for floxed exon 5 of prolactin receptor (i.e. PrlRfl/+), and crossed it with Pdx1CreERTM mice, to generate male Pdx1CreERTM:PrlRfl/+ mice, which was then crossed with female PrlRfl/+ mice to generate homozygous conditional knockout Pdx1CreERTM:PrlRfl/fl (i.e. βPrlRfl/fl). Tamoxifen were given at age 8-10 weeks and mice were used for experiments at age 12-16 weeks. Transgenic mice with global heterozygous prolactin receptor deletion (Prlr+/-) were purchased from Jackson Laboratory. For pregnancy, female mice were set up with wild type male mice. Intraperitoneal glucose tolerance test (IPGTT) and insulin tolerance test were performed on days 14 and 15 of pregnancy, respectively. Pancreas was isolated on day 15 of pregnancy and processed for immunohistochemistry. For RNAseq analysis, total RNA was extracted and sequencing was performed on Illumina NextSeq 550 system. Gene network analysis was performed using Qiagen's Ingenuity Pathways Analysis platform to identify differentially expressed genes.
Results: In this study, we found that in comparison to control littermate without the floxed Prlr allele, i.e. the βPrlR+/+ mice, the βPrlRfl/+ mice had a ~40% , islet-specific reduction in prolactin receptor expression. Furthermore, the magnitude of reduction in prolactin receptor expression is comparable between βPrlRfl/+ and Prlr+/- mice. During pregnancy, we found that beta-cell-specific Prlr reduction resulted in elevated non-fasting blood glucose as well as impaired glucose tolerance during an IPGTT. Similar to our previous finding in mice with global Prlr reduction, beta-cell-specific Prlr loss led to a lower beta-cell mass and a lower in vivo insulin level during pregnancy. However, islets from βPrlRfl/+ mice do not have an intrinsic insulin secretion defect when tested in vitro. Interestingly, when we compared the islet gene expression profile, using islets isolated from mice with global versus beta-cell-specific Prlr knockout, we found some important differences in genes that regulate apoptosis and insulin secretion between the two strains. Furthermore, Ingenuity pathway analysis found several canonical pathways that are differentially regulated between these two strains, including the serotonin receptor-signaling and the synaptogenesis signaling pathway.
Conclusion: Prolactin receptor has cell autonomous and non-cell autonomous effect on beta-cell adaptation to pregnancy, with the cell autonomous effect accountable for most of the effect on beta-cel mass expansion and insulin secretion. The role of non-cell autonomous effects of prolactin receptor signaling on beta-cell mass and function is yet to be determined.
Supported by: NSERC
Disclosure: C. Huang: None.
419
Depression and islet function during pregnancy: generation of a depressive phenotype using UCMS
L. Smith1, C. Fernandes2, S. Simpson1, P. Jones1, B. Liu1, J. Bowe1;
1Diabetes Research Group, King's College London, London, 2Social, Genetic & Developmental Psychiatry Centre & MRC Centre for Neurodevelopmental Disorders, King's College London, London, UK.
Background and aims: During pregnancy, increased maternal insulin resistance requires compensatory expansion of beta cell mass and glucose-stimulated insulin secretion to maintain normoglycemia. Gestational diabetes (GDM) occurs when insulin secretory capacity is insufficient to meet the increased demands. There is considerable clinical evidence to support a link between depression and both Type 2 diabetes (T2D) and GDM, although the mechanisms behind this are unclear. Unpredictable chronic mild stress (UCMS) is one of the most commonly used rodent models of depression. We sought to use UCMS to examine the metabolic effect of depression on pregnant and non-pregnant female mice.
Materials and methods: C57BL/6J female mice were divided into paired controls or UCMS-treated at 4 weeks old. UCMS mice were singly housed and subjected to 3-4 stressors daily of varying length and intensity for 6 weeks, whilst paired mice were housed under normal conditions. All mice were weighed weekly and subjected to periodic sucralose preference testing to measure anhedonia. Anxiety and depression-like behaviours were then assessed using open field and Porsolt swim tests, respectively, before an intraperitoneal glucose tolerance test (IPGTT) and insulin tolerance test (IPITT) were carried out on all mice following 6 h fast (n=11-14). Females were then mated and IPGTT and IPITT repeated at gestational days 16 and 18, respectively (n=6-8).
Results: UCMS females showed significantly impaired weight gain after 4 weeks of stressors (18.06g ±0.26) compared to pair controls (18.96g ±0.19 P=0.03). Crucially, no significant differences in weight were seen by metabolic testing after 8 weeks (UCMS 20.43g ±0.31 vs Pair 20.71g ±0.23 P=0.48). UCMS mice had significantly increased anhedonia as early as 1 week after initiation of stressors (UCMS 76.3% ±0.9 sucralose preference vs Pair 88.4% ±0.4 P<0.0001), and by 7 weeks UCMS mice (72.8% ±0.8) continued showing significantly lower sucralose preference compared to pair controls (79.1% ±0.5 P<0.0001). UCMS mice showed increased anxiety levels, with a trend for reduced time spent in the centre of the open field (UCMS 30s ±3 vs Pair 39s ±4 P=0.11) and increased hyperactivity (UCMS 8.4cm/s ±0.3 vs Pair 7.2cm/s ±0.3 P=0.01), as well as a depressive phenotype, with a trend for decreased latency to immobility in the Porsolt swim test (UCMS 84s ±7 vs Pair 111s ±21 P=0.09). Non-pregnant females showed a trend for improved glucose tolerance (UCMS 1452 ±46 AUC vs Pair 1590 ±56 P=0.07) but no changes were seen in insulin sensitivity (UCMS 351 ±21 AUC vs Pair 352 ±23 P=0.96). Furthermore, pregnant UCMS females had significantly improved glucose tolerance compared to pair controls (UCMS 1616 ±97 AUC vs Pair 2051 ±188 P=0.05), but again no significant effect on insulin sensitivity was observed (UCMS 386 ±36 AUC vs Pair 453 ±21 P=0.15).
Conclusion: UCMS appeared to provide a good model of depression in C57BL/6J females, with evidence of reduced weight gain, increased anhedonia, anxiety and behavioural despair. However, this did not appear to correlate with impaired glucose tolerance, either during pregnancy or in non-pregnant females. On the contrary, pregnant females with depressive-like symptoms in our study appeared to have a protective metabolic phenotype, improving glucose homeostasis, whilst insulin sensitivity appeared unchanged.
Supported by: EFSD European Research Programme on New Targets for Type 2 Diabetes
Disclosure: L. Smith: None.
420
Prebiotic early intervention improves blood glucose in pup mice
Q. Zhang, X. Xiao, M. Li;
Peking Union Medical College Hospital, Beijing, China.
Background and aims: Maternal high fat (HF) during pregnancy is known to have numerous adverse effects on offspring, including increased adiposity and impaired glucose tolerance later in life. The aim of this study was to determine if prebiotic early intervention could mitigate some of the negative effects of maternal HF.
Materials and methods: C57BL mice were fed a HF diet, normal diet or a HF diet with prebiotic supplementation during pregnancy and lactation. At 3 weeks of age, glucose tolerance were measured in the offspring. And offspring livers were obtained. Hepatic DNA methylation and gene expression was assayed.
Results: Maternal HF diet led offspring glucose intolerance and insulin resistance. Prebiotic early intervention moderated glucose metabolism and insulin resistance in male pup mice. Maternal HF diet reduced phosphatidylinositol-4-phosphate 3-kinase catalytic subunit type 2 alph (Pik3c2a), phosphatidylinositol-4-phosphate 3-kinase catalytic subunit type 2 beta (Pik3c2b), and phosphoinositide-3-kinase regulatory subunit 2 (Pik3r2) gene expression in male pup mice (P<0.01). Prebiotic early intervention increased these gene expression in pup livers (P<0.01). Moreover, maternal HF diet led these three gene hypermethylated (P<0.01). These three genes were hypomethylated in prebiotic early intervention group (P<0.01).
Conclusion: Prebiotic early intervention improved glucose intolerance by changing DNA methylation and gene expression of Pi3k in mice exposed to a maternal HF diet.
Supported by: National Natural Science Foundation of China (No. 81870545, 81870579), Beijing Natural Science Found
Disclosure: Q. Zhang: None.
PS 25 Pregnancy: Epidemiology
421
Trends in prevalence and treatment of gestational diabetes in Norway 2013-2018
K. Furu, L. Kjerpeseth, V. Hjellvik, H.L. Gulseth;
Norwegian Institute of Public Health, Oslo, Norway.
Background and aims: In 2017, Norway implemented new diagnostic criteria and treatment guidelines for gestational diabetes (GDM). We aimed to explore trends in GDM prevalence and treatment from 2013-2018.
Materials and methods: We linked nationwide data from Norwegian registries on primary care (KUHR), secondary care (NPR), births (MBR) and prescriptions (NorPD) from 2013-2018. We included all women with a live or stillbirth in MBR after week 16 of pregnancy, except those with a diabetes diagnosis other than GDM in NPR or KUHR during the 2 years before birth, or a diabetes drug prescription from 2 years before birth to the start of pregnancy. GDM was identified by ICD-10 codes in NPR during pregnancy and a specific diabetes variable in MBR. We calculated the proportion of insulin and metformin users in the GDM population by year of delivery from 2013-2018.
Results: We included 346,593 deliveries. The overall prevalence of GDM was 4.5%, increasing from 3.2% in 2013 to 5.4% in 2016 and thereafter quite stable. In 2013 85.4% of those diagnosed with GDM were treated with lifestyle only, 4.2% with metformin only, 9.3% with insulin only and 1.2% with both metformin and insulin. The proportions in 2017 were 81.4, 6.5, 9.8, and 2.3%, and in 2018 65.9, 11.1, 18.5 and 4.5%, respectively.
Conclusion: The prevalence of GDM in Norway increased until 2016. There has been an increase in the pharmacological treatment of GDM with insulin use doubled and metformin nearly tripled from 2013 to 2018. The changes in treatment were mainly from 2017 to 2018.
Supported by: NFR, NordForsk
Disclosure: K. Furu: None.
422
Differences in gestational diabetes diagnosed in early and late pregnancy
B. Barquiel, P. Parra, N. Hillman, L. Herranz;
Hospital Universitario La Paz, Madrid, Spain.
Background and aims: The vast majority of women with GDM are diagnosed in the second trimester of pregnancy when the diabetogenic effect of pregnancy is most marked. However, more and more patients are diagnosed during the first trimester of pregnancy depending on risk factors and screening strategies. The aim of this study was to evaluate differences between clinical variables, maternal and neonatal outcomes among early-pregnancy and late-pregnancy GDM.
Materials and methods: An observational retrospective study including 3284 patients with singleton pregnancies and GDM at a University Hospital (Spain). The women were compared according to the time of diagnosis and categorized into early diagnosis (less than 24 weeks gestation, n =155, 4.5%) or late diagnosis (more than 24 weeks gestation, n=3327). GDM diagnosis was made using National Diabetes Data Group criteria. Maternal and neonatal outcomes were compared between groups. Maternal outcomes included: insulin therapy, gestational hypertension, preeclampsia and caesarean delivery. Neonatal outcomes included: hypoglycaemia and three birthweight groups (SGA, adequate and LGA).
Results: The women in the early group were older and had a higher pre-pregnancy BMI (27.4 ± 6.3 vs 24.7 ± 4.6, p<0.05) as well as a higher prevalence of previous GDM. Additionally, insulinization rates during pregnancy were significantly higher in the group with early GMD (73.5% vs 47.1, p <0.05).Furthermore, gestational hypertension and preeclampsia were more prevalent in the early than in the late group (12.9 % vs 5.5%, p <0.05; 2.6% vs 0.8%, p <0.05, respectively). LGA neonates were more frequent in the late diagnosis group (325 vs 11, p 0.002) while in the early diagnosis group most of the neonates were SGA (102/155).
Conclusion: These results suggest the different phenotypic behavior of these two groups of gestational diabetes, with increased maternal complications especially hypertensive disorders and SGA neonates in the early diagnosis group.

Disclosure: B. Barquiel: None.
423
Monogenic diabetes in pregnancy: How many cases are we missing?
A. Surendran1, S.L. White2,3, J. Jarvis4,5, A. Dunkley4,5, Diabetes in Pregnancy GSTT team, A. Brackenridge2;
1Diabetes and Endocrinology, King's College Hospital NHS Foundation Trust, London, 2Diabetes and Endocrinology, Guys and St Thomas NHS Foundation Trust, London, 3Department of Women's Health, King's College London, London, 4Department of Diabetes, University of Leicester, Leicester, 5Department of Diabetes, University Hospital Leicester, Leicester, UK.
Background and aims: Diagnosis of monogenic diabetes (MODY) improves outcomes through subsequent change in management. Pregnancy provides an ideal opportunity to review diabetes diagnosis. We aimed to audit clinical practice in our Trust for screening and diagnosis of MODY (glucokinase (GCK), HNF1A and HNF4A mutations) during pregnancy, and implement a care pathway as informed by the results.
Materials and methods: Criteria were formulated using the European guidelines for diagnosing MODY, and by reviewing the records of women in our Trust with a previous diagnosis of GCK, HNF1A, and HNF4A MODY made during pregnancy. Subsequently, the notes of women attending antenatal clinic over one-year with gestational or pre-existing diabetes were audited. For women identified as eligible for genetic screening, their records were checked for genetic testing.
Results: Of 83 women with pre-existing diabetes, three were eligible for HNF MODY testing. Two of these women had a diagnosis of MODY (n=1 HNF1A, n=1 HNF4A) made prior to pregnancy, one woman had never been tested. Of 2788 women who had glucose tolerance tests (OGTT) in pregnancy, 143 were eligible to be tested for GCK MODY of whom none had been tested. A subsequent care pathway was constructed to aid identification of these women in pregnancy.
Conclusion: A structured approach during pregnancy is key to identifying unrecognized MODY. A formulated care pathway, as defined here, is an essential first step to achieve this goal.
Disclosure: A. Surendran: None.
424
Risk of major congenital malformations with metformin compared with insulin in pregnancy
L.J. Kjerpeseth1, C.E. Cesta2, A. Engeland3,4, K. Furu1, M. Gissler5, H.L. Gulseth1, Ó.Ö. Hálfdánarson6,7, Ø. Karlstad1, H. Kieler2,8, M.K. Leinonen5, M. Nørgaard9, L. Pazzagli2, L. Pedersen9, H. Zoega6,7, J.M. Cohen1;
1Norwegian Institute of Public Health, Oslo, Norway, 2Department of Medicine, Karolinska Institutet, Stockholm, Sweden, 3Norwegian Institute of Public Health, Bergen, Norway, 4University of Bergen, Bergen, Norway, 5Finnish Institute for Health and Welfare, Helsinki, Finland, 6University of Iceland, Reykjavík, Iceland, 7UNSW Sydney, Sydney, Australia, 8Department of Laboratory Medicine, Karolinska Institutet, Stockholm, Sweden, 9Aarhus University, Aarhus, Denmark.
Background and aims: Metformin is increasingly used in type 2 diabetic pregnancies. However, evidence is lacking on its safety for rare outcomes such as major congenital malformations. Unlike insulin, which is considered safe in pregnancy, metformin crosses the placenta in concentrations approaching that of maternal circulation. Thus, we sought to investigate whether use of metformin during the organogenesis in first trimester increases the risk of major congenital malformations (MCM) compared with insulin.
Materials and methods: In this cohort study, we pooled individually linked data from nationwide registers on prescriptions, births, patients, deaths in Iceland (2003-2017), Norway (2004-2017) and Sweden (2006-2016). We included pregnancies with singleton births (live or still) with use of insulin (or an analogue) or metformin in the first trimester. We assigned pregnancies with use of both insulin and metformin to the metformin group. We excluded the following pregnancies: preexisting type 1 diabetes; exposed to other glucose-lowering drugs, teratogenic drugs or infections in first trimester; chromosomal anomaly in the offspring. Using multivariable logistic regression, we estimated the OR for MCM in the offspring, diagnosed within 1 year of birth.
Results: We included 3075 pregnancies; 2132 used metformin (of which 211 also used insulin) and 732 used insulin only. An MCM occurred in 125 (5.3%) pregnancies in the metformin group and 63 (8.6%) pregnancies in the insulin group, giving a crude OR of 0.60. After adjustment for confounders, metformin ± insulin was associated with a lower risk of MCM compared to insulin only (OR 0.51, 95% CI 0.35-0.75). Comparing metformin only with insulin only did not change the result substantially (OR 0.44, 95% CI 0.29-0.66), nor did comparing metformin + insulin with insulin only (OR 0.87, 95% CI 0.46-1.68). Limiting the study population to those with a diagnosis of type 2 diabetes yielded similar results (OR 0.75, 95% CI 0.42-1.35 for metformin ± insulin vs insulin only; OR 0.61, 95% CI 0.27-1.37 for metformin only vs insulin only; and OR 1.08, 95% CI 0.52-2.22 for metformin + insulin vs insulin only).
Conclusion: We did not find evidence of an increased risk of major congenital malformations with the use of metformin in pregnancy. The results should be interpreted with caution, e.g. we do not have information on blood glucose levels and we were not able to adjust for BMI, smoking and folate use in the preliminary analyses. We plan to do additional analyses and to add data from Denmark and Finland to further our understanding.
Supported by: Research Council of Norway
Disclosure: L.J. Kjerpeseth: Grants; The Research Council of Norway.
425
Is HbA1c dosage relevant at gestational diabetes diagnosis outside identify a preexisting diabetes?
A. Vambergue1, F. Barbry2, C. Ternynck2, H. Wallet2, M. Cazaubiel1, J. Labreuche2, D. Subtil1, P. Fontaine2;
1Gynecology and obstetrics, CHRU, 2CHRU, Lille, France.
Background and aims: The current situation and increasing prevalence of gestational diabetes necessitates risk stratification directing limited antenatal resources to those at greatest risk. It is unclear whether HbA1c threshold has utility in predicting adverse outcomes in GDM. Furthermore, it is unknown if such an HbA1c threshold exists and/or differs among women diagnosed and treated for GDM prior to 20 week’s gestation. The aims of the study were to examine the relationship of HbA1c at GDM diagnosis with adverse pregnancy outcomes and to determine if this HbA1c risk threshold differs in women diagnosed with early vs standard GDM, in a large treated cohort.
Materials and methods: This was a retrospective cohort study based on 4384 women with GDM in France, between 2011 and 2018. Women with risk factors were screened for GDM with a FPG at the first prenatal visit and between 24-28 weeks with a 75-g OGTT using the IADPSG criteria. Pregnant women underwent an HbA1C measurement at the time of GDM management. We assessed the association of HbA1c with pregnancy outcomes using logistic regression models before and after adjustment in predefined risk factors of GDM. We examined the associations considering HbA1c as categorical variables using five pre-specified HbA1c classes: ≤4.5%, 4.6-4.9%, 5-5.5%, 5.6-5.9% and >5.9%. The results were expressed in odds ratios (OR) and their 95% confidence intervals (CI), calculated using HbA1c ≤ 4.5% as reference.
Results: HbA1c was measured at a median of 25 +/- 7.5 weeks gestation. Mean baseline HbA1c was 5.2% +/-0.4. 33 % of patients were treated with insulin. 41.6% of women had at least one complication from macrosomia, SGA, preeclampsia, preterm delivery, neonatal intensive care unit admission and shoulder dystocia (defining the Adverse Pregnancy Outcome Composite). A threshold HbA1c ≥5.6% identifies women with a greater need for surveillance for macrosomia (OR for 5.6-5.9 = 2.12 [CI 95% = 1.29 to 3.46]; OR for >5.9 = 2.06 [CI 95% = 1.14 to 3.70]) and cesarean (OR for 5.6-5.9 = 1.64 [CI 95% = 1.06 to 2.53] ; OR for >5.9 = 1.58 [CI 95% = 0.93 to 2.7]). It is the same for preterm delivery with a threshold HbA1c >5.9% (OR = 3.33 [CI 95% = 1.27 to 8.71]). After adjustment for GDM risk factors, we confirmed these results for macrosomia, preterm delivery (p<0.0001), and cesarean (p=0.020). HbA1c remained significant for Adverse Pregnancy Outcome Composite even after risk factor adjustment (p<0.0001). These analyses were carried out in the early GDM (diagnosed before 20 weeks gestation) and in the late GDM (after 20 weeks gestation) with similar results.
Conclusion: Our finding suggests that a single HbA1c taken at diagnosis for gestational diabetes mellitus with risk factor may be a useful pragmatic guide to identify women at risk for adverse outcomes. These clinical approaches could dichotomized women into high- and low-risk models of care at diagnosis. In view of the evolving coronavirus pandemic, and resource constraints, it is important to propose new strategies to identify women with GDM. It could be interesting to propose at 28 weeks a combined strategy HbA1c and/or fasting glucose and/or random plasma glucose to avoid OGTT.
Disclosure: A. Vambergue: None.
426
Diagnosis of gestational diabetes in the first trimester of pregnancy is associated with differences in CGM night profile
O. Krystynik, J. Schovanek, D. Goldmannova, L. Cibickova, D. Karasek;
Department of Internal Medicine III – Nephrology, Rheumatology, and Endocrinology, Faculty of Medicine and Dentistry of Palacky University Olomouc and Faculty Hospital, Olomouc, Czech Republic.
Background and aims: According to IADPSG criteria the diagnosis of GDM (Gestational Diabetes Mellitus) could be based upon oral glucose tolerance test (OGTT) in the second trimester and also upon repetitive measurement of fasting glycemia (FPG) ≥ 5.1 mmol/l during the first trimester. Currently it is not clear whether an increase in fasting glycemia in the first trimester screening is connected with an increase in glycemic variability during the day (postprandially) or during the night (without food), when compared to normal pregnancy.
Materials and methods: Into this study we included 54 women, 21 healthy non-pregnant (control), 15 healthy pregnant (non-GDM) and 18 females with GDM. Females with GDM were further divided based upon diagnostic IADPSG criteria as women with increased fasting glycemia (FPG ≥ 5.1 mmol/l) during the first trimester (FPG group, n=15) and increased post OGGT glycemia (OGGT group, n=3). Participants underwent blinded 7-days continuous glucose monitoring (CGM) between 9-15, 24-28 and 34-38 weeks of gestation. Women with GDM received standardized dietary recommendations. Women treated with insulin were excluded from the study. For purpose of this study we evaluated only the days with full (24h) CGM measurement. To evaluate glycemic profile medians of following parameters were calculated: mean day glucose (mean), standard deviation (SD), coefficient of variation (CV), MAGE index and nocturnal glycemia (median of the first 4 hours of the day).
Results: During the pregnancy (all trimesters) defined four groups (control, non-GDM, FPG, OGGT) differed significantly in glucose levels when evaluated by mean (± SD) [5.36 ± 0.39; 5.30 ± 0.72; 5.71 ± 0.56; 5.42 ± 0.26; p = 0.03]; the most significant difference was found in nocturnal glycemia [4.90 ± 0.36; 4.90 ± 0.57; 5.34 ± 0.62; 4.50 ± 0.34; p < 0.005]. Glucose variability did not differ significantly SD (p = 0.13), CV (p = 0.09) nor MAGE (p = 0.24) among those groups. Patients diagnosed based upon FPG had significantly higher nocturnal glycemia, when compared to the non-GDM pregnant women already in the first trimester [5.30 ±0.22; 4.80 ± 0.33; p = 0.04]. Nocturnal glycemia did not differ throughout the trimesters of pregnancy in FPG group [1st 5.30 ±0.22; 2nd 5.26 ± 0.67; 3rd 5.40 ± 0.63; p = 0.83].
Conclusion: IADPSG criteria for the diagnosis of gestational diabetes in the first trimester of pregnancy (FPG ≥ 5.1 mmol/l) identifies pregnant women with significantly increased blood glucose levels in CGM measurement, especially apparent during the night period. The higher nocturnal glycemia in FPG women is apparent already in the first trimester and do not significantly change during the pregnancy.
Supported by: Ministry of Health, Czech Republic: grant AZV NV18-01-00139 and FNOL, 00098892
Disclosure: O. Krystynik: None.
427
Postpartum screening for type 2 diabetes in women with gestational diabetes. Is it really performed?
G. de Gennaro1, C. Bianchi2, M. Aragona2, L. Battini3, A. Brocchi1, W. Baronti1, E. Minaldi1, S. Del Prato1, A. Bertolotto2;
1Diabetes Center, University of Pisa, Pisa, 2Diabetes Center, University Hospital of Pisa, Pisa, 3Maternal-Infant Department, University Hospital of Pisa, Pisa, Italy.
Background and aims: Gestational diabetes (GDM) is a risk factor for type 2 diabetes mellitus (T2DM). Therefore, international guidelines recommend a screening for T2DM at 4-12 week postpartum. However, rates of postpartum follow up have been extremely low. The aim of this study was to evaluate the adherence to postpartum screening and to identify elements associated with poor attendance.
Materials and methods: We retrospectively collected data from 650 women (mean age 34.8 ± 5.5 years; pre-pregnancy BMI 25.7 ± 6.5 kg/m2) with GDM between 2016-2018. We determined the percentage of women undergoing an OGTT 4-12 weeks after delivery and assessed the impact of a letter recommending such a screening after delivery (a procedure introducedat the end of 2016) on the adherence to the test. Of note, postpartum glucose test was free. Finally, we searched for demographic and socio-cultural factors associated with non-adherence to the test.
Results: Only 40.5% of women underwent the postpartum OGTT. Of these, 1.9% were diagnosed with T2DM, and 17.5% had impaired glucose regulation (IGR: IFG, IGT or IFG/IGT). After introducing the letter of recommendation, adherence to screening increased in the ensuing years to 47.0% in 2017 and 42.8% in 2018, compared to 32.0% in 2016. The screening procedure was more common in women with: family history of T2DM (45.5% vs. 38.0%; p <0.05), age >35 (46.6% vs. 33.1 %; p <0.01), higher level of education (49.4% university; 35.2% high; 31.8% lower; p <0.01) and stable employment (44.4% vs. 35.1%; p <0.05). At multivariate logistic regression analysis, age <35 years (OR 1.61; 95%CI: 1.14-2.28) and lower educational level (OR 1.64; 95% CI: 1.13-2.37) were independently associated with non-adherence. There was no significant difference in relation to other clinical and demographic variables such as previous GDM, pre-pregnancy BMI, therapy for GDM, ethnicity and marital status.
Conclusion: Less than half of women perform postpartum T2DM screening. A letter of recommendations for postpartum T2DM screening improved adherence. Nonetheless, the number of women undergoing postpartum OGTT remained lower in those with age <35 years and lower educational level. These results may help in designing specific strategies to increase the number of women screened after GDM.
Disclosure: G. de Gennaro: None.
PS 26 Pregnancy: Who is at risk?
428
Early gestational diabetes: adverse outcomes are both early and late
R. Mbundu Ilunga, J. Gross, O. Le Dizès, M. Andrey, A. Pauchet, D. Quansah, H. Legardeur, J. Puder;
Centre Hospitalier Universitaire Vaudois, Lausanne, Switzerland.
Background and aims: Women with higher glucose values without frank diabetes early in pregnancy have an increased risk of perinatal complications including cesarean section, macrosomia, and neonatal hypoglycemia compared to women with gestational diabetes (GDM) who are diagnosed in the second trimester. However, there is a need for data about adverse outcomes in a clinical setting and especially in the postpartum period. The aim of this study was a) to determine if early high-risk identification would overdiagnose women who would not have GDM in the second trimester and b) to evaluate if early clinical care in these women would reduce their increased risk.
Materials and methods: Since 2018, we identified women with prediabetes (using the criteria of ADA, i.e. fasting glucose ≥ 5.6 mmol/l or HbA1c ≥5.7%) and followed them at the GDM clinic starting at 13 weeks of gestational age (GA). We used this well-established definition, as there is no consensus on the GDM diagnosis in the first trimester. Women were either seen by a physician or diabetes educator and then by a dietician with a focus on lifestyle changes. Capillary glucose measures were performed several times/week up to 24-28 weeks GA using the usual cut-offs. Women were re-tested for GDM at 24-28 weeks GA and, once GDM was confirmed, were followed like the “habitual” GDM cohort. Their data regarding perinatal and postpartum outcomes were compared to those of the “habitual” GDM cohort of 853 women for whom we had metabolic data at 6-12 weeks postpartum.
Results: Twenty-five women were diagnosed with prediabetes. At early diagnosis, their fasting glycemia was 5.9±0.7 mmol/l and HbA1c 5.8±0.5%. Ninety-one percent of them were diagnosed having GDM at 24-28 weeks GA. Thereby, their fasting glycemia decreased by 0.3±0.5 mmol/l (p=0.03), while HbA1c did not change. Compared to the “habitual” GDM cohort, women with early diagnosis had higher pre-pregnancy BMI (31.4±7 vs 25.8±6 kg/m2, p<0.001), a tendency for a lower total gestational weight gain (10.5±7 vs 12.8±6 kg, p=0.2), needed more frequently medical treatment (94 vs 54%, p=0.01), but had similar HbA1c at the end of pregnancy (p=0.6). So far, 14 women with confirmed GDM were followed up to delivery. Of those, 71% needed a cesarean intervention, which corresponds to a 70% increase compared to the others (p=0.02). Despite the difference in maternal weight, neonatal weight was not different (p=0.4), but the proportion of large for gestational age (LGA) was higher (43 vs 19%, p=0.03). The sample size was too small to evaluate other complications. Regarding postpartum adverse outcomes, fasting glucose was higher in the early GDM women (5.5±0.8 vs 5.0±0.5 mmol/l, p<0.0001) and they had three times more prediabetes (58 vs 17%, p<0.0001). Postpartum weight retention was 1.3 kg less, though this was not significant (p=0.4).
Conclusion: Almost all women diagnosed with prediabetes early in pregnancy end up having GDM despite lifestyle interventions and a tendency for less weight gain. Thus, over-diagnosis is not a concern. Starting clinical care early in this high-risk group, there was a similar rate of many perinatal outcomes compared to “habitual” women with GDM. However, there remained a two-threefold increase in the need for medical treatment, the prevalence of LGA and cesarean section and of postpartum prediabetes. This calls for reflection about other measures to implement before or during pregnancy.
Supported by: Swiss National Science Foundation, unrestricted Novo Nordisk educational grant
Disclosure: R. Mbundu Ilunga: None.
429
Is height an important determinant of postload glucose levels in pregnant women?
M.M. Svebis1,2, A. Kun3, B.A. Domján1, E. Szabó4, J. Tornóczki5, G. Visolyi2,6, V.J. Horváth1, A.G. Tabák7,8;
1Department of Internal Medicine and Oncology, Semmelweis University, Budapest, Hungary, 2School of PhD Studies, Semmelweis University Faculty of Medicine, Budapest, Hungary, 3Department of Obstetrics and Gynaecology, Tolna County Balassa János Hospital, Szekszárd, Hungary, 4Szent Imre Teaching Hospital, Budapest, Hungary, 5Diabetes Outpatient Clinic, Tolna County Balassa János Hospital, Szekszárd, Hungary, 6Bajcsy-Zsilinszky Hospital, Budapest, Hungary, 7Department of Public Health, Semmelweis University, Budapest, Hungary, 8Department of Epidemiology and Public Health, University College London, London, UK.
Background and aims: It was found that differences in height may explain part of the differences in 2-hour postload glucose between nondiabetic men and women, while no association with fasting glucose was observed. As the diagnosis of GDM is heavily relying on postload glucose values and lower height is a known risk factor of GDM, we set out to investigate determinants of 1-hour and 2-hour postload glucose and risk of GDM after adjustment for fasting glucose, BMI and known risk factors of GDM.
Materials and methods: We used data of a universal GDM screening program (n=10.329 women, 2-point/3-point OGTT n=10.329/7.950) in a Western Hungarian region between 2009 and 2018. Risk factors for GDM were collected at the time of booking. 1-hour and 2-hour postload glucose were estimated using GLM, risk of GDM by GLzM with a logistic link with height, fasting glucose, BMI, history of hypertension, macrosomia, family history of diabetes as independent variables.
Results: Mean age was 29.6±5.6 years, BMI 26.5±6.4 kg/m2, height 165±7 cm. In unadjusted models height was negatively related to both 1-hour and 2-hour glucose (-0.11, SE 0.03 and -0.20, SE 0.02 mmol/l/10 cm). Height remained an independent determinant of postload glucose even after adjustment for fasting glucose, BMI and other risk factors (-0.14, SE 0.03 for 1-hour and -0.22, SE 0.02 mmol/l/10 cm). Furthermore, the risk of GDM was lower in taller women even in the multiple adjusted model (OR 0.80 95%CI: 0.70-0.91). In contrast, there was an almost perfect agreement regarding the diagnosis of GDM based either on height-corrected or uncorrected glucose values (kappa=0.986, SE 0.002).
Conclusion: We found that body height has a negative association with postload glucose values during the OGTT in pregnant women. While this association is non-trivial, it has only a small effect on the classification of pregnant women into GDM and normal glucose tolerance. However, in women with extreme height and glucose values close to the cut-off, knowledge of this effect may be of clinical value.
Disclosure: M.M. Svebis: None.
430
Maternal mental state correlates with maternal insulin sensitivity and interleukin-6 levels in late pregnancy
I. Bauer1, F. Schleger1, L. Fritsche2, N. Schneider1, M. Breuer1, M. Weiss3, J. Pauluschke-Fröhlich3, A.L. Birkenfeld4, M. Heni4, H. Preissl1, A. Fritsche4;
1fMEG Center, Institute for Diabetes Research and Metabolic Diseases (IDM) of the Helmholtz Center Munich at the University of Tuebingen, Tuebingen, 2Institute for Diabetes Research and Metabolic Diseases (IDM) of the Helmholtz Center Munich at the University of Tuebingen, Tuebingen, 3Department of Obstetrics and Gynecology, University Hospital of the Eberhard Karls University Tuebingen, Tuebingen, 4Department of Internal Medicine, Division of Diabetology, Endocrinology and Nephrology, University Hospital of the Eberhard Karls University Tuebingen, Tuebingen, Germany.
Background and aims: Pregnancy is characterized by personal, professional and hormonal changes, often accompanied by changes in maternal emotional states (MES, including stress and depression). MES can have adverse effects on fetal and infant development and on inflammation processes and metabolic changes during pregnancy: Psychosocial stress increases the pro-inflammatory Interleukin 6 (IL6) levels in late pregnancy and reduces maternal insulin sensitivity. High maternal IL6 levels are associated with gestational diabetes mellitus and maternal insulin sensitivity, independent of maternal obesity. We investigated the influence of MES on IL6 levels and maternal insulin sensitivity in late pregnancy in 223 women (participants of the Tuebingen PREG cohort, a prospective, multicenter follow-up study in Germany). We hypothesized that MES correlate with both maternal insulin sensitivity and IL6 levels.
Materials and methods: MES were investigated through three subscales (stress, depression, somatic symptoms) of the Patient Health Questionnaire (PHQ), a widely used screening and diagnostic tool.
Results: Insulin sensitivity correlated negatively with depression (rs=-.122, p=.034) and somatic symptoms (rs=.-193, p=.002). IL6 correlated positively with somatic symptoms (rs=.209, p=.001) and stress (rs=.159, p=.009). For depression there was a trend in the same direction (rs=.104, p=.061). There was a negative correlation between IL6 levels and insulin sensitivity (rs=-.414, p<.001).
Conclusion: Both increased maternal inflammatory activity and reduced insulin sensitivity are related to psychological well-being in late pregnancy. Thus, improving maternal emotional states during pregnancy might be a worthwhile target of treatment to improve insulin resistance and inflammation of the mother and to protect the developing child.
Clinical Trial Registration Number: NCT04270578
Supported by: BMBF (01GI0925) to the DZD e.V.; CIN (Mini Research Training Group, CIN/EXC307)
Disclosure: I. Bauer: None.
431
Influence of triglycerides on insulin sensitivity in gestational diabetes
E.-C. Krzizek1,2, J.M. Brix1,2, A. Tura3, G. Pacini3, B. Ludvik1,2;
11. Medizinische Abteilung, Krankenanstalt Rudolfstiftung, Vienna, Austria, 2Karl Landsteiner Institute of obesity and metabolic disease, Vienna, Austria, 3Metabolic Unit, CNR Institute of Neuroscience, Padova, Italy.
Background and aims: One of the risk factors for the development of gestational diabetes (GDM) is an increased body mass index (BMI), which is often associated with increased lipid levels. A change in the lipid profile during pregnancy is another well-known phenomenon. The aim of this study is to investigate a possible relationship between triglyceride levels and insulin sensitivity in the 2nd trimester.
Materials and methods: 643 women (age 29±5 years) were examined in this prospective study. All patients received a 2h 75g OGTT and a determination of fasting lipids in the 24th-28th week of gestation. HOMA-IR, QUICKI, PREDIM, OGIS and Matsuda index were calculated. If necessary, insulin therapy was initiated.
Results: 37.5% of women (n=241) with GDM were detected (age 30±5 years, BMI 26.8±5.7 kg/m2). 53.6% of these patients (n=129) needed insulin therapy. Patients with higher triglyceride (TG) levels showed significantly higher insulin resistance (HOMA-IR:R=0.165, p<0.001) and significantly lower insulin sensitivity (QUICKI: R=-0.225, p<0.001, PREDIM: R=-0.308, p<0.001; OGIS:R= -0.286, p<0.001; Matsuda index: -0.338, p<0.001). High TG values also correlated significantly with the need for insulin therapy during pregnancy (R=0.114, p=0.18).
Conclusion: In this study a correlation between the level of TG values and insulin sensitivity could be shown. Patients with higher values of TG levels significantly more often had a need for insulin therapy during pregnancy. Further studies are needed to further evaluate and interpret the influence of triglycerides on gestational diabetes.
Disclosure: E. Krzizek: None.
432
Assisted reproduction technology treatment and risk of gestational diabetes
C. Bianchi1, G. de Gennaro2, V. Cela3, M. Aragona1, W. Baronti2, E. Minaldi2, A. Brocchi2, S. Del Prato2, A. Bertolotto1;
1Diabetes Center, University Hospital of Pisa, Pisa, 2Diabetes Center, University of Pisa, Pisa, 3Maternal-Infant Department, University Hospital of Pisa, Pisa, Italy.
Background and aims: Assisted reproduction technology (ART) treatment seems to increase the risk of gestational diabetes (GDM), though the nature of this association remains unclear. The older age of women and the higher multiple pregnancy rate after ART treatment have been suggested to be the primary determinants of GDM in these women. In the attempt to gain more insights in such an association we have carried out a study to evaluate whether ART represents an independent risk factor for GDM in single pregnancies.
Materials and methods: We collected retrospectively clinical and anthropometric data in 221 ART- and 256 age- and BMI-matched women with natural conception (NC) screened for GDM between 2011-2019. Out of 477 women, 32 were excluded due to multiple pregnancies (PMA: 24; CN: 8).
Results: Between the two groups there were no differences in age (ART: 39 ± 5; NC: 38 ± 3 years; ns), BMI (ART: 23.6 ± 4.4; NC: 22.9 ± 3.6 Kg / m2; ns) and family history of diabetes (ART: 31.4%; NC: 24.2%; ns). ART-women were more frequently primiparous (62.6% vs. 22.6%; p<0.0001), while a higher prevalence of previous GDM was observed among NC-women (9.7% vs. 2.6%; p=0.002). The prevalence of GDM in the whole cohort was 36.1% and was significantly higher in women with ART (52.3% vs. 23.4%; p <0.0001). In the whole cohort, risk factors for GDM were: age (OR 1.07 95% CI 1.02-1.13), first degree family history of diabetes (OR 2.02 95% CI 1.31-3.10), previous GDM (OR 2.09 95% CI 1.39- 3.14), pre-pregnancy obesity (OR 3.28; 95% CI 1.57-6.86) and ART (OR 3.59; 95% CI: 2.39 - 5.39). On multivariate analysis, family history of diabetes (OR 1.67; 95% CI: 1.03-2.69), previous GDM (OR 7.05; 95% CI: 2.92-17.04); pre-pregnancy obesity (OR 2.72; 95% CI 1.21-6.13) and ART (OR 4.14; 95% CI 2.65-6.48) were independent risk factors for GDM. Among ART women, those with GDM were slightly older (40±5 vs. 38±5 years; p=0.008) and had a higher prevalence of previous GDM (5% vs 0%; p=0.04). At logistic regression analysis only age over 40 years was associated to GDM in ART women.
Conclusion: Among women undergoing ART treatment, at least one in two develops GDM. ART appears to be an independent risk factors for GDM in single pregnancies.
Disclosure: C. Bianchi: None.
433
Short sleep duration and risk of gestational diabetes in European women
A. Prete1, F. Nicolì1, G. de Gennaro1, A. Bertolotto2, M. Aragona2, L. Battini3, S. Del Prato1, C. Bianchi2;
1Diabetes Center, University of Pisa, Pisa, 2Diabetes Center, University Hospital of Pisa, Pisa, 3Maternal-Infant Department, University Hospital of Pisa, Pisa, Italy.
Background and aims: Sleep disturbances and short sleep duration are common in pregnancy as a consequence of hormonal changes, physical discomfort, and anxiety associated with childbearing. Growing evidence in non-European women suggests that sleep insufficiency during pregnancy might contribute to the development of hyperglycemia and gestational diabetes (GDM). Therefore, the aim of this study was to evaluate the reproducibility of this observation in a well clinically characterized cohort of European women.
Materials and methods: We collected demographic, clinical and anthropometric data of 386 women consecutively screened from January 1st through December31st, 2019 for GDM by 75g OGTT, according with IDPSG criteria. Pittsburgh Sleep Quality Index (PSQI) questionnaire was used to asses self-reported poor sleep quality (PSQI score >5) and short nocturnal sleep duration (<6 h).
Results: In the cohort of 386 women (age 35±5 years; BMI 24.5±5 Kg/m2; 26±1 gestational weeks), 148 (38.3%) had poor sleep quality and 87 (22.5%) had short sleep duration; the prevalence of GDM was 26.9%. Women with pre-pregnancy BMI>25 Kg/m2 had more frequently poor sleep quality (46.2% vs. 33.6%; p=0.014). Mean fasting, 1h and 2h post load glucose values were not significantly different between women with poor or good sleep quality, neither in those with short or regular sleep duration. There was no difference in GDM prevalence between women with poor or good sleep quality (26% vs. 28%; n.s.), while GDM was more frequent in women with short sleep duration (35.6% vs. 24.4%; p=0.038). On univariate logistic regression analysis, short sleep duration (OR 1.71; 95%CI: 1.03-2.86; p=0.039), as well as previous GDM (OR 3.52; 95%CI: 1.83-6.76; p<0.0001), family history of type 2 diabetes (OR 1.96; 95%CI: 1.21-3.91; p=0.007), pre-pregnancy overweight (OR 1.85; 95%CI: 1.06-3.23; p=0.031) or obesity (OR 2.56; 95%CI: 1.40-4.70; p=0.002) were associate to GDM risk. However, after adjustment for previous GDM (OR 2.60; 95%CI: 1.27-5.31; p=0.009), family history of diabetes (OR 1.53; 95%CI: 0.90-2.59; ns) and pre-pregnancy BMI (overweight: OR 1.85; 95%CI: 1.04-3.30; p=0.037; obesity: OR 2.40; 95%CI: 1.28-4.50; p=0.006), short sleep duration did not persist as an independent risk factor for GDM (OR: 1.55; 95%CI: 0.91-2.65; ns).
Conclusion: Sleep disturbances are relative common among pregnant women. Although GDM seems more common among women with short sleep duration, this sleep disturbance does not seem to be an independent risk factor for GDM in European women.
Disclosure: A. Prete: None.
434
Triglyceride and glucose index as a predictor of insulin use during pregnancy
K.-S. Kim1, K. Han2, C.-Y. Park3;
1CHA University School of Medicine, Seongnam, 2Soongsil University, Seoul, 3Sungkyunkwan University School of Medicine, Seoul, Republic of Korea.
Background and aims: Because uncontrolled hyperglycemia during pregnancy is associated with elevated risk of maternal and fetal complications, it is very important to predict uncontrolled hyperglycemia in pregnancy. Hyperglycemia could occur since insulin resistance increases exponentially during second and third trimester and insulin is the first-line agent recommended for the treatment of uncontrolled hyperglycemia during pregnancy. Triglyceride and glucose (TyG) index is a useful marker of insulin resistance but there is no study about association between TyG index and insulin use during pregnancy. The aim of this study was to investigate the ability of TyG index to predict insulin use during pregnancy in women without diabetes before pregnancy.
Materials and methods: We analyzed 316,210 women who gave birth between 2011 and 2015 using the Korean National Health Information Database. They underwent the Korean National Health Screening Program within one year before pregnancy and were not prescribed insulin or oral anti-diabetic drugs before antepartum 280 days. The TyG index was calculated as the Ln[fasting triglyceride (mg/dL) x fasting plasma glucose (mg/dL)/2].
Results: The prevalence of insulin use during pregnancy was 0.61% (n = 1,925). Insulin use during pregnancy was increased with increasing quartiles of TyG index (Q1 0.23%, Q2 0.34%, Q3 0.54%, Q4 1.32%; P for trend < 0.001). After adjustment for covariates, women with the highest quartile of TyG index were 3.52 times (95% CI 2.92 - 4.25) more likely to use insulin during pregnancy than those with the lowest quartile. Furthermore, TyG index had gradually high odd ratios for insulin use according to 10th decile of TyG index, but triglyceride and glucose was not. In obese women (body mass index ≥ 25 kg/m2) with highest quartile of TyG index, the risk of insulin use during pregnancy was 7.40 times higher than in non-obese women with Q1 to Q3 of TyG index.
Conclusion: In conclusion, TyG index is effective to predict insulin use during pregnancy in women without diabetes before pregnancy.
Disclosure: K. Kim: None.
435
Use of non-nutritive-sweetened soft drink and risk of gestational diabetes
F. Nicolì1, A. Prete1, G. de Gennaro1, A. Bertolotto2, M. Aragona2, L. Battini3, S. Del Prato1, C. Bianchi2;
1Diabetes Center, University of Pisa, Pisa, 2Diabetes Center, University Hospital of Pisa, Pisa, 3Maternal-Infant Department, University Hospital of Pisa, Pisa, Italy.
Background and aims: Use of sugar-sweetened soft drinks has been associated with risk of type 2 diabetes and gestational diabetes (GDM). However, whether non-nutritive-sweetened soft drink (NNSSD) also increase such risk is still unknown. The aim of this study was to evaluate the association between use of NNSSD and GDM.
Materials and methods: We collected demographic, clinical and anthropometric data of 386 pregnant women consecutively screened from January 1st through December31st, 2019 for GDM by 75g OGTT, according with IDPSG criteria. A 16-item semi-quantitative beverage frequency questionnaire was used to assess NNSSD consumption.
Results: Among 386 women (age 35±5 years; BMI 24.5±5 Kg/m2; 26±1 gestational weeks), 177 (48.4%) consumed NNSSD regularly. The prevalence of GDM was 26.9%. Mean fasting, 1h and 2h post load glucose values were not significantly different between NNSSD-user and non-user. However, GDM prevalence was higher in the user group (32.6% vs. 21.6%; p=0.015). By univariate logistic regression analysis, NNSSD use (OR 1.76; 95%CI: 1.11-2.77; p=0.039), as well as previous GDM (OR 3.52; 95%CI: 1.83-6.76; p<0.0001), family history of type 2 diabetes (OR 1.96; 95%CI: 1.21-3.91; p=0.007), pre-pregnancy overweight (OR 1.85; 95%CI: 1.06-3.23; p=0.031) or obesity (OR 2.56; 95%CI: 1.40-4.70; p=0.002) were associate to GDM risk. After adjustment for previous GDM (OR 2.80; 95%CI: 1.37-5.73; p=0.005), family history of diabetes (OR 1.49; 95%CI: 0.88-2.54; ns) and pre-pregnancy BMI (overweight: OR 1.86; 95%CI: 1.04-3.32; p=0.036; obesity: OR 2.35; 95%CI: 1.25-4.40; p=0.008), NNSSD use remained an independent risk factor for GDM (OR: 1.70; 95%CI: 1.05-2.74; p<0.03).
Conclusion: The NNSSD consumption is common among Italian pregnant women and is an independent risk factor for GDM. This association, however, does not allow to conclude whether NNSSD can be considered a risk factor per se or it simply represents a marker for unhealthy life style.
Disclosure: F. Nicolì: None.
436
The influence of gestational diabetes treatment modalities on gut and saliva microbiome composition
P. Popova1, E. Tikhonov2, Y. Pinto2, A. Tkachuk1, E. Vasukova1, A. Dronova1, Y. Bolotko1, S. Frishman2, E. Pustozerov1,3, T. Pervunina4, E. Grineva1, O. Koren2;
1Institute of Endocrinology, Almazov National Medical Research Centre, Saint Petersburg, Russian Federation, 2Azrieli Faculty of Medicine, Bar Ilan University, Safed, Israel, 3Saint Petersburg State Electrotechnical University, Saint Petersburg, Russian Federation, 4Almazov National Medical Research Centre, Saint Petersburg, Russian Federation.
Background and aims: The aim of the study was to assess the influence of diet, insulin and different glycemic targets on microbiome composition of women with gestational diabetes mellitus (GDM).
Materials and methods: We obtained stool and saliva samples for 108 pregnant Russian women, recruited for a randomized trial of very tight versus less tight glycaemic targets in women with GDM. Women with GDM were randomized to 2 groups per target glycaemic levels: GDM1 (tight glycaemic targets, fasting blood glucose <5.1 mmol/L and <7.0 mmol/L postprandial, N=55) and GDM2 (less tight glycaemic targets, <5.3 mmol/L and <7.8 mmol/L, respectively, N=53). All participants were instructed on diet and lifestyle changes. In case of exceeding the target blood glucose levels (in 2 or more measurements per week in group 1 and in more than 1/3 of measurements per week in group 2) insulin therapy was started. Stool and saliva samples were collected within 1-2 weeks after recruitment (28.8±3.6 weeks) (visit 1, V1) and at 35-36 weeks of gestation (V2). In order to study the associations of insulin administration and microbiome changes we divided all the patients in two groups: those who used insulin (“insulin use”; N=29) and those who did not (“no insulin use”; N=79). 16S rRNA gene sequencing was done using the Illumina MiSeq platform and microbiome analysis was carried out using QIIME2.
Results: There were no differences in the gut and saliva microbiomes between the groups at the time of V1. There was a significant change in Faith phylogenetic diversity (Alpha-diversity) in stool samples between visits (V1 vs V2) in both GDM1 and GDM2 groups (p=0.0001, 0.022, respectively). However, there was no difference in the change of phylogenetic diversity between the groups (p=0.29). According to beta-diversity analysis (weighted UniFrac), saliva samples from women with GDM who were on diet before V1 were more similar to each other than they were to samples from women with GDM who were not dieting at the time of V1. Phylogenetic diversity of the gut microbiomes increased during diet between visits (V1 vs. V2) in each group (“insulin use” and “no insulin use”) and hence isn’t associated with insulin administration.
Conclusion: Diet in women with GDM was associated with changes in saliva and gut microbiomes. There was no association between insulin therapy or glycemic targets and microbiome composition change.
Clinical Trial Registration Number: NCT03610178
Supported by: RSF №18-75-10042
Disclosure: P. Popova: Grants; RSF grant № 18-75-10042.
437
Estimated foetal weight vs abdominal circumference in predicting macrosomia in women with gestational diabetes
I.A. Scott1, A. Anbazhagan2, S. Leigh-Atkins3, K. Cheer4, B. Issa4;
1Manchester Medical School, The University of Manchester, Manchester, 2Obstetrics and Gynaecology, Wythenshawe Hospital, Manchester, 3Midwifery, Wythenshawe Hospital, 4Endocrinology, Wythenshawe Hospital, Manchester, UK.
Background and aims: EFW is a good predictor of actual birth weight in normal pregnancies, and therefore it has been similarly used in pregnancies with GDM, despite lack of evidence from robust clinical trials and the higher incidence of macrosomia in this group of women. Although recommendations are that individual foetal measurements are used in conjunction with the estimated foetal weight (EFW) when making clinical decisions, clinicians have been making obstetric decisions largely based on EFW as the primary predictor of actual birth weight. In order to investigate the best predictor of foetal macrosomia in woman with GDM, we compared the performance of EFW and abdominal circumference (AC) in this retrospective study.
Materials and methods: We retrospectively collected data of 495 women with GDM who delivered singleton infants at Wythenshawe Hospital, Manchester, UK from 2015 to 2019. Foetal biometrics (AC, head circumference (HC) and femur length (FL)) were collected from a growth scan performed closest to 36 weeks(34 weeks to 38+4 weeks) from the patients’ electronic patient records, along with estimated delivery date, actual delivery date, date of ultrasound, EFW and actual birth weight. These were recorded in an excel spreadsheet and statistical analysis was performed using SPSS.
Results: The average gestational age at delivery was 38 weeks 6 days and the average age of gestation at the final growth scan was 36 weeks 2 days. Forty-six of the infants were macrosomic (birth weight of ≥4000g or ≥90th percentile for gestational age) at birth. The number of babies predicted to be delivered with macrosomia was 68 for EFW >90th percentile and 127 for AC >90th percentile. For a birth weight of ≥4000g, EFW > 90th percentile had a sensitivity of 60.9% and a specificity of 91.1% while AC > 90th percentile had equivalent values of 82.6% and 80.2% respectively (positive predictive value 29.9%, negative predictive value 97.8%). For EFW >90th percentile vs AC >90th percentile a receiver operating curve (ROC) was produced; AC had an area under the curve of 0.888 as compared to 0.883 for EFW. Both predictors were therefore well above the reference line (0.5), indicating that they have high prognostic capability for estimating actual birth weight. AC percentile had a slightly larger area, suggesting that it performed slightly better as a predictor of macrosomia.
Conclusion: In this retrospective study both AC and EFW > 90th percentile were shown to be good predictors of actual birth weight with the possibility of AC being the superior measure in women with GDM. Even though EFW percentile had a higher specificity than AC percentile, AC percentile had a higher sensitivity and its specificity was still relatively high. Arguably, a better sensitivity is of more relevance in women with GDM where complications are mostly related to the delivery of a macrosomic baby. The use of AC percentile however, may lead to unnecessary intervention with early induction of labour and caesarean section deliveries. Future studies should explore the potential use of other parameters including a single or a combination of foetal biometrics (e.g. HC, FL or HC:AC ratio), in predicting actual birth weight in order to avoid pregnancy complications in this relatively high risk group of women.
Disclosure: I.A. Scott: None.
PS 27 Incremental studies on gut hormones
438
Entero-pancreatic hormone secretion, gastric emptying and glucose absorption after frequently sampled oral glucose and liquid mixed meal tests in healthy young men
S. Veedfald1,2, J.F. Rehfeld3, G.V. Hall4, L.B. Svendsen2, J.J. Holst1;
1University of Copenhagen, Copenhagen, 2Department of Surgical Gastroenterology, Rigshospitalet, Copenhagen, 3Rigshospitalet, 4Department of Clinical Chemistry, Rigshospitalet, Copenhagen, Denmark.
Background and aims: Entero-pancreatic hormone secretion has been reported during the pre-absorptive cephalic and gastric meal phases, but never with a frequency of blood sampling providing a temporal resolution that allows close scrutiny and correlations with gastric emptying and glucose-absorption. We hypothesized that entero-pancreatic hormone secretion would be rapid after ingestion of liquid test meals, correlate with gastric emptying and coincide with glucose absorption.
Materials and methods: Ten healthy, fasting, young men ingested liquid test meals, a 75 g glucose drink (OG) and a liquid mixed nutrient meal (LMM), on separate days. Paracetamol and 3-O-methyl-D-glucopyranose (3-OMG) were added to the OG and LMM solutions to allow estimations of gastric emptying and small intestinal glucose absorption, respectively. Arterialised venous blood was sampled frequently before and after (t= -30, -20, -18, -16, -14, -12 , -10, -8, -6, -4, -2, 0, 2, 4, 6, 8, 10, 12, 14, 16, 18, 20, 30 min) ingestion of the OG/LMM (t= 0-2 min). Plasma concentrations of glucose, glucose-dependent insulinotropic polypeptide (GIP), glucagon-like peptide-1 (GLP-1), gastrin, cholecystokinin (CCK), glucagon, pancreatic polypeptide (PP) &, and serum concentrations of insulin, C-peptide and paracetamol were measured.
Results: Basal glucose and hormone concentrations were stable. Paracetamol was significantly increased 8 min after OG (p<0.001) and LMM (p<0.05). 3-OMG; 8 min after LMM (p<0.0001) and 10 min after OG (p=0.04). PP; 4 min after LMM (p<0.03), but did not significantly increase after OG. Gastrin; 6 min after LMM (p<0.003) and OG (p<0.003). CCK; 6 min after LMM (p=0.0001), but not after OG. GIP; 8 min after OG (p<0.05) and LMM (p<0.03). Glucose, 8 min after OG (p<0.001) and 12 min after LMM(p<0.02). GLP-1; 12 min after OG (p<0.01) and 10 min after LMM (p<0.01). Glucagon was attenuated 30 min after OG (p<0.02), but not after LMM. Insulin; 12 min after LMM (p=0.02) and OG (p=0.002). C-peptide; 12 min after OG (p=0.002) and LMM (p=0.04).
Conclusion: Within 5 min after OG and LMM ingestion, gastric emptying, glucose absorption and gut hormone release are underway. Early postprandial responses are highly variable with regards to timing and amplitude and this should be considered when interpreting mean responses and designing blood sampling protocols.
Clinical Trial Registration Number: NCT03543423
Supported by: Michaelsen Fonden
Disclosure: S. Veedfald: None.
439
Bitter taste signalling modulates bile acid-induced PYY, but not GLP-1 secretion in healthy humans
C. Xie1, X. Wang1,2, M.J. Bound1, R.L. Young1, K.L. Jones1, M. Horowitz1, C.K. Rayner1, T. Wu1,2;
1University of Adelaide, Adelaide, Australia, 2Southeast University, Nanjing, China.
Background and aims: The gastrointestinal tract, like the tongue, can detect taste signals through activation of taste-specific G-protein coupled receptors. There is emerging evidence that stimulation of bitter taste receptors (BTRs), present abundantly in the distal gut, triggers the release of gastrointestinal hormones. We evaluated the effects of taurocholic acid (TCA, a bitter-tasting physiological bile acid) and denatonium benzoate (DB, a non-nutritive bitter flavouring) with and without the bitter taste receptor antagonist, probenecid, on glucagon-like peptide-1 (GLP-1) and peptide YY (PYY) secretion in healthy humans.
Materials and methods: 16 healthy subjects (7 male and 9 female; mean age 23.5 ± 1.0 years; BMI 23.1 ± 0.8kg/m2) were studied on 5 occasions each, in a double-blind, randomised, crossover fashion. On each study day, the subject was positioned in the left lateral decubitus position, and 20 mL of an aqueous gel (1% carboxymethyl cellulose) containing DB (30 mg), DB (30 mg) + probenecid (456 mg), TCA (3500 mg), TCA (3500 mg) + probenecid (456 mg), or vehicle only (control) was infused into the rectum via a soft catheter over 2 min. “Arterialised” venous blood was sampled at intervals over the following 120 min for measurements of plasma GLP-1 and PYY concentrations. Gastrointestinal sensations were assessed using 100 mm visual analogue scales. Data are means ± SEM. P < 0.05 was considered significant.
Results: TCA stimulated secretion of both PYY (iAUC 729.2 ± 121.6 pmol/l•min-1 after TCA vs. 31.4 ± 17.8 pmol/l•min-1 after control, P < 0.001) and GLP-1 (iAUC 145.6 ± 35.9 pmol/l•min-1 after TCA vs. 57.1± 18.3 pmol/l•min-1 after control, P = 0.007). Probenecid reduced responses to TCA for PYY (iAUC 446.0 ± 144.1 pmol/l•min-1 for TCA + probenecid, P = 0.029; Figure), but not GLP-1 (iAUC 121.3 ± 48.4 pmol/l•min-1 for TCA + probenecid, P = 0.3). Neither DB nor DB with probenecid had any effect on plasma PYY or GLP-1.
Conclusion: In healthy humans, rectal administration of TCA stimulates PYY and GLP-1 secretion, mediated at least in part by bitter taste signalling. However, rectal administration of a non-nutritive bitter taste flavouring alone is not sufficient to induce GLP-1 or PYY secretion.

Clinical Trial Registration Number: ACTRN12618000093280
Supported by: NHMRC project grant (Australia)
Disclosure: C. Xie: Employment/Consultancy; Tongzhi Wu is supported by The Hospital Research Foundation Mid-Career Fellowship. Grants; NHMRC project grant (APP1147333).
440
Effect of metformin on incretin secretion in patients with type 2 diabetes and chronic heart failure
J. Kopecky jnr.1, E. Hošková1, J. Veleba1, V. Melenovský1, J. Kopecký sr2, T. Pelikánová1;
1Institute for Clinical and Experimental Medicine, Prague, 2Academy of Sciences of the Czech Republic, Prague, Czech Republic.
Background and aims: Metformin (MET) is a mainstay for treatment of type 2. diabetes (DM). Its use in patients with chronic heart failure (HF) patients is recent, associated with lower frequency of cardiovascular events and with better survival, but mechanisms of action are unclear. GLP-1 incretin is reported to have cardioprotective effects. Our aim was to assess the effects of MET on glucose metabolism, incretin secretion and cardiac function in patients with DM and HF.
Materials and methods: A randomized, double-blind, placebo-controlled, crossover study testing the effect of 3 - month usage of metformin vs placebo. Treatment naive patients with DM and HF were randomized to metformin (2 g/day) or to placebo group. At the beginning and the end of each intervention period (baseline, after MET and after placebo) panel of various metabolic tests including meal test and cardiac function tests (echocardiography, cardiopulmonary exercise test) was done.
Results: Metformin significantly reduced HbA1c. During meal test, metformin significantly reduced AUC of glucose, insulin and amylin; and increased GLP-1 and peptide YY. Details in table. There was no change in cardiac function as assessed by echocardiography and spiroergometry.
Conclusion: Metformin therapy in patients with HF improves diabetes compensation and has no significant effect on cardiac function. Improvement might be partly mediated by alteration of gut endocrine function.

Clinical Trial Registration Number: NCT 01690091
Supported by: VZ 00023001 IKEM
Disclosure: J. Kopecky jnr.: None.
441
Serum bile acids after an oral glucose load in Chinese healthy individuals and patients with type 2 diabetes: relationships with glycaemia
X. Wang1, C. Chen2, C. Xie3, M. Horowitz3, K.L. Jones3, C.K. Rayner3, Z. Sun1, T. Wu1,3;
1Department of Endocrinology, Zhongda Hospital, Southeast University, Institute of Diabetes, School of Medicine, Nanjing, China, 2Chongqing Medical University, Institute of Life Sciences, Chongqing, China, 3University of Adelaide, Adelaide Medical School and Centre of Research Excellence in Translating Nutritional Science to Good Health, Addelaide, Australia.
Background and aims: Bile acids (BAs) are recognised as important signalling molecules in glucose metabolism. It is uncertain whether the postprandial serum BA response is altered in type 2 diabetes (T2D) and, if so, how this relates to postprandial glycaemic excursions. We evaluated serum BA and plasma glucose concentrations before and after an oral glucose load in health and T2D.
Materials and methods: 40 Chinese healthy subjects (29 female; age 56.8 ± 1.0 years; BMI 27.5 ± 0.4 kg/m2; HbA1c 5.4 ± 0.1%) and 40 treatment-naïve Chinese T2D subjects (28 female; age 57.1 ± 1.2 years; BMI 27.9± 0.6 kg/m2; HbA1c 6.8 ± 0.1%) underwent a 75 g oral glucose tolerance test (OGTT) following an overnight fast. Plasma glucose and serum BA profiles (including CA, CDCA, DCA, GCA, GCDCA, GDCA, TCA, TCDCA and TDCA, analysed by liquid chromatography-mass spectrometry) were evaluated immediately before and 2h after OGTT. Total BA concentrations were calculated as the sum of individual BAs, and subsequently transformed to their natural logarithms to normalise their distribution for statistical analysis. Fasting serum cholesterol, triglycerides, LDL and HDL, were also measured. Within-group and inter-group comparisons were conducted using paired or unpaired Student’s t-test, with the exception that the inter-group differences in BA profiles were evaluated using orthogonal partial least-squares discrimination analysis (OPLS-DA). Linear regression was used to evaluate relationships between variables. Data are means ± SEM; P < 0.05 was considered significant.
Results: There were no differences in age, gender, BMI, waist circumference, or fasting cholesterol, triglycerides, LDL, or HDL between the healthy and T2D subjects. HbA1c and plasma glucose levels (both fasting and 2h after OGTT) were predictably higher in the T2D group (P < 0.05 each). Fasting total BA levels were slightly lower in the healthy than T2D subjects (6.32 ± 0.10vs 6.66 ± 0.12 ln(ng/mL), P = 0.03). At 2h, total BA levels increased in the healthy subjects (6.67 ± 0.11 ln(ng/mL), P = 0.0005), but not in the T2D subjects (6.50 ± 0.09 ln(ng/mL), P = 0.12). OPLS-DA analysis of the changes in BA profile after oral glucose showed a separating tread between the two groups (ROC = 0.711), which was attributable predominantly to conjugated BAs. Both 2h glucose ((r = -0.42, P = 0.006) and the rise in plasma glucose from baseline to 2h (r = -0.36, P = 0.021) were related inversely to 2h serum total BAs in healthy, but not T2DM, subjects.
Conclusion: T2D is associated with increased fasting serum BA levels, but an impaired bile acid response to oral glucose. In health, the glycaemia in response to oral glucose is inversely related to serum BA.

Clinical Trial Registration Number: NCT03025919
Supported by: NSFC; Nanjing Science and Technology Innovation Project; Fundamental Research Funds for the Central
Disclosure: X. Wang: Grants; National Nature Science Foundation of China, Nanjing Science and Technology Innovation Project, the Fundamental Research Funds for the Central Universities.
442
Effects of a six-week intervention with glucagon-like peptide-1 receptor analogue on pancreatic volume, oedema and DNA synthesis in obese men
M.S. Svane1,2, H.H. Johannesen3, C. Martinussen1, K.N. Bojsen-Møller1, M.L. Hansen3, A.E. Hansen3, C. Deacon2, B. Hartmann2, S.H. Keller3, A. Loft3, A. Kjaer3, S. Madsbad1, J. Löfgren3, J.J. Holst2, N.J. Wewer Albrechtsen2,4;
1Hvidovre Hospital, Hvidovre, 2NNF Center for Basic Metabolic Research / Dept. of Biomedical Sciences, University of Copenhagen, Copenhagen, 3Dept. of Clinical Physiology, Nuclear Medicine and PET, Rigshospitalet, Copenhagen, 4Dept. of Clinical Biochemistry, Rigshospitalet, Copenhagen, Denmark.
Background and aims: Plasma concentrations of the two pancreatic enzymes, amylase and lipase, are increased within the normal physiological range after initiation of glucagon-like peptide-1 receptor agonist (GLP-1RA) treatment. An association between the use of GLR-1RAs and incidence of acute pancreatitis or pancreatic cancer has not been found - neither in rodent nor in preclinical studies or in the large cardiovascular outcome trials with GLP-1RAs. Rodent and acinar cell studies have suggested that the increase in concentrations of pancreatic enzymes may be explained by increased DNA or protein synthesis. However, whether this translates into humans is unknown.
Materials and methods: We investigated the effect of the GLP-1RA liraglutide on pancreatic volume, edema, cellularity, enzymes and DNA synthesis using combined [18F] fluorothymidine (FLT)-positron emission tomography (PET)-magnetic resonance imaging (MRI) and blood sampling in 14 obese men (age 38 ± 3 years, BMI 32 ± 1 kg/m2) without diabetes (HbA1c <48 mmol/mol). Analyses were made before initiation, after four weeks (during titration), and after six weeks of treatment (during steady state on maximum dose of liraglutide 3.0 mg). The primary endpoint, pancreatic volume, was determined by T1-weighted MRI sequences. Secondary endpoints included pancreatic edema, cellularity (via diffusion-weighted MRI sequences), enzymes and DNA synthesis. DNA synthesis was evaluated using PET based FLT uptake in pancreatic tissue, where both mean and maximum standardized uptake values were registered. Plasma concentrations of amylase and lipase were assessed in parallel. Paired t-tests were used to compare baseline with six weeks of liraglutide treatment and with four weeks of liraglutide treatment for the FLT uptake.
Results: Plama concentrations of amylase (+7 U/L [95% confidence intervals, 3 - 11], p<0.01) and lipase (+19 U/L [7 - 30], p<0.01) increased during liralutide from baseline to steady state of treatment after six weeks, and body weight decreased (-4.5 kg [-5.9 - -3.1], p<0.01). Pancreatic volume did not change from baseline to steady state of liraglutide treatment (+0.2 cm3 [-8 - 8] p=0.96]), no signs of pancreatic edema were seen and no change in cellular infiltration of the pancreas were found (p=0.22 for ). The mean FLT-uptake in pancreatic tissue increased after four weeks of liraglutide treatment during the titration compared with baseline (+0.08 [0.000 - 0.17], p=0.05) and the maximum FLT-uptake also increased during the titration period (+0.3 [0.08 - 0.43], p<0.01).
Conclusion: Six weeks of treatment with the GLP-1RA liraglutide did not affect pancreatic volume or cellularity in obese individuals without diabetes, and no signs of pancreatic edema was seen. Increased FLT-uptake in the pancreatic tissue, indicative of enhanced cell DNA synthesis, was seen after four weeks of liraglutide treatment and may be responsible for the increase in pancreatic enzymes.
Clinical Trial Registration Number: NCT03520062
Supported by: Novo Nordisk Foundation & Rigshospitalet
Disclosure: M.S. Svane: None.
443
Serum levels of the Zonulin family of peptides in individuals from the PREVADIAB 2 cohort, a role in metabolic dysfunction
I. Sousa-Lima1,2, R.S. Patarrão1, M. Meneses1,3, A.F. Pina1,3, M. Coelho2, J.F. Raposo4, R.T. Ribeiro4, L. Gardete-Correia4, R. Duarte4, J. Boavida4, I. Correia4, R. Andrade4, J. Medina5, J.G. Jones2, M. Macedo1,4;
1NOVA Medical School, Lisbon, 2Center for Neuroscience and Cell Biology, Coimbra, 3ProRegeM PhD Programme, NOVA Medical School, Lisboa, 4Associação Protectora dos Diabéticos de Portugal - Education and Research Center, Lisbon, 5Portuguese Society for Diabetes, Lisbon, Portugal.
Background and aims: Profound changes in eating habits and lifestyle contributed to the rise in metabolic diseases, such as Non-Alcoholic Fatty Liver Disease (NAFLD) and Type 2 Diabetes. NAFLD comprises a variety of conditions, from fatty liver (NAFL) to steatohepatitis (NASH). Progression to NASH may reflect the liver’s exposure to intestinal endotoxins and pro-inflammatory agents, a result of impaired permeability. Zonulin (ZON) binds to a specific receptor, at the surface of the intestinal epithelia, promoting a series of biochemical events, leading to tight-junction disassembly and increased gut permeability. The latter will allow the inward flow of pro-inflammatory molecules and immune response activation (e.g. complement system). Our aim was to determine the serum levels of the ZON family of peptides in individuals from the Portuguese prevalence diabetes study (PREVADIAB).
Materials and methods: 492 individuals (247 normoglycemic; 33 impaired fasting glucose-IFG; 139 impaired glucose tolerance-IGT, 22 IFG+IGT, and 51 T2D) were evaluated. The ZON family of peptides were determined using a commercially available ELISA kit (IDK, Germany) and correlated with anthropometric and blood-borne parameters.
Results: Analysis of the ZON family of peptides, considering the individuals’ glycemic phenotype, showed no difference. When individuals were divided according to their fatty liver index (FLI) the peptides increased from FLI<30 to >60 (40,01±0,914ng/mL, n=122 vs. 42,53±0,686ng/mL, n=217; p<0,01). Moreover, considering the range of circulating ZON family of peptides (17,61 to 70,69ng/mL) we considered 4 quartiles (Z1 - N=33, Z2 - N=145, Z3 - N=87 and Z4 - N=16) that we analyzed further. FLI analysis for each quartile showed that this index is significantly different in Z1 vs Z3 (46,4±5,66 vs 63,6±3,25; p=0,0289) and Z2 vs Z3 (49,9±2,73 vs 63,6±3,25; p=0,0098). For all 4 quartiles glycemia at 0’ and 120’ post-OGTT was unchanged. Interestingly, at 30’, glycemia is significantly different for Z1 vs Z3 (148,1±4,94mg/dL vs 169,2±3,12mg/dL; p=0,0001) and Z2 vs Z3 (155,8±2,53mg/dL vs 169,2±3,12mg/dL; p=0,0188). Accordingly, HbA1c (5,5±0,03 vs 5,7±0,05%; p=0,0047) and the insulin sensitivity index (66,9±1,58 vs 58,8±1,90; p=0,0089) were also significantly different between Z2 and Z3.
Conclusion: These results show that the ZON family of peptides is increased in individuals with FLI>60, depicting a possible role in fatty liver disease. Moreover, by dividing the individuals into quartiles we observed that, quartiles corresponding to higher ZON had higher FLI, further supporting a role for these proteins in the pathophysiological mechanism of the disease. Moreover, circulating peptides seem to correlate with dysglycemia. In fact, individuals with increased ZON family of peptide levels have increased blood glucose levels during the OGTT, increased HbA1c and decreased insulin sensitivity. Thus, our work suggests a role for the ZON family of peptides as a putative biomarker for dysglycemia and fatty liver.
Supported by: PTDC/BIM/MET/4265/2014, iNOVA4Health - UID/Multi/04462/2013, ISIC
Disclosure: I. Sousa-Lima: None.
444
Dietary N-acyl amines modulate secretion of insulin and GLP-1 as GPCR agonists
A.K. Drzazga, M. Koziołkiewicz, E. Gendaszewska-Darmach;
Institute of Molecular and Industrial Biotechnology, Lodz University of Technology, Lodz, Poland.
Background and aims: N-acyl amines (NAAs), representing conjugates of long-chain fatty acids with amino acids, are widely occurring natural signalling molecules produced by microbiota and, independently, present in cooking oils. Although NAAs are a large and functionally diverse class, little is known about their biological significance and structure-related effectiveness. Therefore, we decided to investigate the efficiency of various NAAs as substances potentiating insulin and glucagon-like peptide-1 (GLP-1) production via activation of GPR40, GPR55 or GPR119. The three G protein-coupled receptors (GPCRs) received considerable attention from the pharmaceutical industry, being crucial targets responsible for regulation of blood glucose homeostasis. The overall aim is to identify NAAs with the most favourable properties, which could serve as dietary supplements preventing the development of diabetes.
Materials and methods: N-acyl-3-hydroxypalmitoyl-glycine (commendamide; CMD), N-acyl glycines (G), N-acyl serinols (S) and N-acyl taurines (T) bearing acyl chains of different length and saturation (lauroyl-L, myristoyl-M, palmitoyl-P, stearoyl-S, oleoyl-O, arachidonoyl-A) were under study. The experiments were performed in murine cell lines producing insulin (MIN6 pancreatic β cells) and GLP-1 (GLUTag intestinal enteroendocrine L cells). The workflow involved: • GPCR expression profiling; • identification of noncytotoxic NAA dosage (monitoring of mitochondrial reductases activity and lactate dehydrogenase leakage); • assessment of NAA stimulatory effect on insulin (glucose-stimulated insulin secretion, GSIS) and/or GLP-1 secretion with relation to GPCR expression; • identification of particular GPCR downstream signalling pathways evoked by NAA (monitoring of cAMP accumulation and calcium mobilization).
Results: After confirmation of GPR40, GPR55 and GPR119 expression in the studied cell lines, cytotoxicity tests were performed. All the NAA sets were nontoxic up to 25 μM. In terms of insulinotropic activity, saturated G and T significantly stimulated insulin secretion at low glucose conditions. OG, CMD, AG, PS, OT and AT enhanced favourable GSIS response (stimulation only at high glucose conditions). Application of selective receptor antagonists revealed that GPR40, GPR55 and GPR119 reduced the stimulated insulin production by ca. 80 % for OG, CMD, AG, PS, OT and by ca. 30 % for AT. GLP-1 secretion was mainly enhanced by CMD in high-glucose and by OG, OT and CMD at low glucose conditions. In this case application of selective GPCR antagonists did not affect the amount of produced GLP-1. Evoked secretion of hormones in every case was related to increased calcium flux. No significant changes in cAMP accumulation were observed.
Conclusion: Natural unsaturated NAAs modulate insulin secretion via activation of GPR40, GPR55 and GPR119. In the case of GLP-1 secretion, other receptor targets are likely to be responsible for the NAA-mediated stimulation apart from the three receptors under study. Major downstream signalling pathways involve Gq but not Gs or Gi/o. OG, CMD, AG, PS, OT and AT are the most potent insulin secretion stimuli whereas CMD is the most potent GLP-1 secretion stimulus. Hence, the compounds serve as potential candidates for diet supplementation to regulate carbohydrate metabolism.
Supported by: SONATINA grant no. 2018/28/C/NZ9/00171 (National Science Centre, Poland)
Disclosure: A.K. Drzazga: Grants; SONATINA grant no. 2018/28/C/NZ9/00171 (National Science Centre, Poland).
445
Duodenum Nesfatin-1 signalling regulates hepatic glucose metabolism via melanocortin-4 receptor mediated AMPK pathway
S. Geng1,2, L. Li1, G. Yang2;
1Department of Clinical Biochemistry, College of Laboratory Medicine, Chongqing Medical University, Chongqing, 2Department of Endocrinology, the Second Affiliated Hospital, Chongqing Medical University, Chongqing, China.
Background and aims: Obesity and insulin resistance (IR)-related diseases (e.g. type 2 diabetes mellitus) are increasing rapidly worldwide, but underlying mechanisms are unknown. Nesfatin-1, the N-terminal fragment of nucleobindin 2 (NUCB2), has been proposed as a potential anti-obesity peptide.It has been reported that Duodenum Nesfatin-1 expression was reduced at a state of IR. Melanocortin 4 receptor (Mc4r/MC4R) is a G-Protein coupled receptor that is is widely expressed in the hypothalamus, gastrointestinal etc,and implicated in body weight control.Previous studies documented that MC4R protein expression increased after intestinal perfusion of nesfatin-1.However, the effects of duodenum nesfatin-1 on glucose homeostasis and insulin signaling in liver are still unclear. Furthermore, the relationship between nesfatin-1,MC4R remains poorly understood. The main objective of our studies was to characterize the effects of duodenum nesfatin-1on hepatic glucose metabolism and reveal the mechanism both in vivo and in vitro.
Materials and methods: In vivo, the rate of glucose infusion (GIR) and lowering HGP were examined in nesfatin-1 knockout (NUCB2-/-) and WT rats, which accepted standard diet (SD)-,3-days High fat diet(HFD)- or 10-weeks HFD fed,to assess the effects of gut nesfatin-1 signal on IR after feeding with different diets and infusion with different nutrients. NUCB2-/- rats were generated to investigate whether the effects of nesfatin-1 on glucose homeostasis depend on the MC4R mediated AMPK pathway or Gut-Brain-Liver Axis.In vitro, Both the effects of up-regulation and down-regulation of Nesfatin-1and MC4R on the glucose metabolism and IR in mouse intestinal endocrine cells (STC-1) cells and 293T cells were evaluated. Additionally, MC4R-Nesfatin-1 interaction was detected by Co-immunoprecipitation (Co-IP).
Results: After the clamp experiment, we observed that the insulin sensitivity significantly decreased after 10-weeks HFD(P<0.01), and the insulin sensitivity was worse in Nucb2-/- rats than in SD rats(P<0.01). Our results demonstrated that gut infusion of nesfatin-1 may interact with MC4R which promote cAMP phosphorylation to activate PKA, p-AMPKα and enhance release of hormones such as GLP-1 from intestinal L cells, leading to reduced HGP, and increased insulin signaling in the liver of rats.The opposite effects were observed in NUCB2-/- rats with gut infusion of saline.The effects of gut nesfatin-1 were also negated by coinfusion with tetracaine, treatment of MK801 (NMDA receptor inhibitor),SH9119(MC4R receptor inhibitor),EX-9(GLP-1 receptor inhibitor)or adenovirus expressing the shMC4R within the gut, or hepatic vagotomy in rats.Additionally,MC4R- nesfatin-1 interaction was indispensable for the gut nesfatin-1-mediated regulation of HGP and IR.
Conclusion: Collectively, our results indicate that nesfatin-1 acts as a regulator of MC4R to control hepatic insulin activity and glucose homeostasis through AMPK Pathway.A gut-brain-liver neural axis mediated by NMDA receptor is suggested to be involved in this mechanism.
Supported by: NAFC(No.81670755)
Disclosure: S. Geng: None.
PS 28 The fundamentals of insulin resistance
446
Circulating FSTL-1 are correlated to newly diagnosed type 2 diabetes and regulated by exercise
D. Han1, L. Ling1, Y. Gangyi2;
1Key Laboratory of Diagnostic Medicine (Ministry of Education) and Department of Clinical Biochemistry, Chongqing Medical University, Chongqing, 2Department of Endocrinology, the Second Affiliated Hospital, Chongqing Medical University, Chongqing, China.
Background and aims: Follistatin-1 (FSTL-1), originally identified as a TGF - β 1-inducible gene, belongs to the secretory extracellular glycoprotein of FST SPARC family, and its amino acid sequence contains a follistatin like domain. FSTL-1 has been considered to be an adipo-myokine and may be a potential metabolic regulator. The aim of this study is to investigate circulating FSTL-1 and its relationship to metabolism and insulin resistance (IR) in patients with type 2 diabetes mellitus (T2DM).
Materials and methods: A total of 500 participants ( 267 women and 233 men; mean age 40-75 years) were included in the study, including 298 newly diagnosed patients with T2DM and 202 age-matched healthy controls. The diagnosis of T2DM is based on the diagnostic criteria of the World Health Organization in 1998. All patients were newly diagnosed, without lifestyle intervention and medication. Serum FSTL-1 levels were measured by ELISA in 298 newly diagnosed patients with T2DM and 202 healthy controls. The changes of circulating FSTL-1 concentration was observed during the oral glucose tolerance test (OGTT), Euglycemic-hyperinsulinemic clamp (EHC), acute exercise, lipid infusion and cold-exposure test.
Results: These data show that circulating FSTL-1 levels were significantly increased in patients with T2DM and overweight/obese subjects and were related to IR. In the intervention study, a 45-min of exercise significantly increased the circulating FSTL-1 concentration in young, healthy subjects, whereas hyperinsulinemia during the EHC and acute elevated free fatty acid (FFA) levels induced by lipid infusion decreased FSTL-1 levels. However, no change in circulating FSTL-1 levels was detected in response to an oral glucose challenge or cold exposure.
Conclusion: These results suggest that FSTL-1 may be an adipo-myokine which is related to IR and circulating FSTL-1 levels are increased in newly diagnosed patients with T2DM.
Clinical Trial Registration Number: CHICTR-OCS-13003185
Supported by: NSFC of China(81570752,81873658)
Disclosure: D. Han: None.
447
Inhibition of NOD1 signalling protects against saturated-fat induced insulin resistance
F. Shoaib, Y. Tan, A. Giacca;
Physiology, University of Toronto, Toronto, Canada.
Background and aims: The innate immune system and inflammation have been proposed to be involved in the development of insulin resistance (IR) and type 2 diabetes (T2D). Individuals with obesity are at a high risk of developing IR, which is a characteristic feature of T2D, and interestingly, these individuals also have a chronic state of low-grade inflammation. However, the direct mechanisms linking obesity, inflammation and T2D are still under investigation. Recent studies have implicated the role of pattern recognition receptors (PRRs) in the development of IR. Of interest to us, is the nucleotide binding oligomerization domain (NOD) 1 receptor. NOD1 signals through RIPK2 and initiates a chronic low-grade inflammatory response. NOD1 can be activated by peptidoglycan fragments found in gram negative bacteria, however, in vitro studies have shown that NOD1 can also be activated by saturated fatty acids (sFAs). This is relevant since individuals with obesity have an elevated level of plasma FFAs. The purpose of our study was to determine whether palmitate, the most common sFA, induces NOD1-mediated IR, and whether whole-body NOD1 KO mice are protected from IR. Furthermore, we also examined whether GSK583, a RIPK2 inhibitor, protects against fat-induced IR.
Materials and methods: Whole body 12-14 week old NOD1 KO and WT (C57BL/6J background) mice were surgically cannulated in their jugular veins and were infused with ethylpalmitate (EtP), which is hydrolyzed to palmitate and ethanol in plasma, or ethanol (EtOH) control for 48h (direct palmitate infusion is toxic). Furthermore, WT mice were infused with EtP or EtOH with either GSK583 in DMSO or DMSO control for 48h. After infusion, the mice were subjected to a hyperinsulinemic-euglycemic clamp to assess their insulin sensitivity.
Results: The glucose infusion rate (GIR; mg/kgmin) of WT mice treated with EtP (36+8, mean+SEM) was significantly lower than that of WT mice treated with EtOH (70+8). However, NOD1KO mice had similar GIR regardless of treatment (EtOH=78+6; EtP =79+7). This indicates that EtP induces whole-body insulin resistance, and that NOD1KO mice are protected against EtP-induced IR. Furthermore, mice treated with EtP and GSK583 had significantly higher GIR (50+8) than mice treated with EtP and DMSO vehicle (20+6). This suggests that GSK583 treatment prevents fat-induced IR.
Conclusion: Overall, our data suggest that infusion of sFAs can induce IR in vivo and both genetic and pharmacological inhibition of NOD1 signaling are protective against whole-body IR. Future studies will involve examining the role of tissue-specific NOD1 knockouts in sFA induced IR, as well as examining the role of NOD1 specific inhibitors. This research is clinically relevant as it highlights NOD1 as a potential therapeutic target for IR and T2D.
Supported by: CIHR Project grant
Disclosure: F. Shoaib: None.
448
Totum-63 reduces body weight and improves insulin sensitivity in obese mice through pleiotropic effects on various metabolic organs
B. Guigas1, H.J.P. van der Zande1, A. Zawistowska-Deniziak1, J.M. Lambooij1, F. Otto1, L. Lantier2, O.P. McGuinness2, V. Chavanelle3, Y. Otero3, S.L. Peltier3, P. Sirvent3;
1Leiden University Medical Center, Leiden, Netherlands, 2Vanderbilt University, Nashville, USA, 3Valbiotis SA, Perigny, France.
Background and aims: The worldwide prevalence of obesity, metabolic syndrome and type 2 diabetes (T2D) is reaching epidemic proportions that urge the development of new therapeutic strategies. Totum-63 is a plant-based active principle, and has recently been shown to reduce body weight, fasting glycemia, glucose intolerance and fatty liver index in a Phase II clinical trial conducted in prediabetic obese subjects. In the present study, we aimed to investigate the effects and underlying mechanism(s) of Totum-63 on metabolic homeostasis in insulin-resistant obese mice.
Materials and methods: Male C57Bl6/J mice were fed a high-fat diet (HFD) for 12 weeks followed by supplementation with or without Totum-63 (2.7% w/w) for 4 additional weeks. Whole-body metabolic homeostasis was assessed by glucose/insulin tolerance tests and hyperinsulinemic-euglycemic clamp. Tissue-specific insulin sensitivity, expression of key genes involved in nutrient metabolism and immune cell phenotypes were determined in metabolic organs by western blot, RT-qPCR and flow cytometry, respectively.
Results: Totum-63 decreased body weight and fat mass in HFD-fed obese mice (-10% and -24% versus control, respectively; P<0.05), an effect associated with a transient reduction in food intake during the first days of supplementation, but without affecting lean mass and locomotor activity. Both epididymal and inguinal white adipose tissue (WAT) masses and adipocyte size distribution were not affected, although a significant reduction in pro-inflammatory CD11c+ macrophages was observed in eWAT (-12%; P<0.05). Interestingly, brown adipose tissue (BAT) mass and brown adipocyte mean diameter were significantly reduced (-35% and -23%, respectively; P<0.05), and expression of thermogenic genes (Ucp1, Dio2, Cox8b) was increased, all suggesting BAT activation. Hepatic macrovesicular steatosis and liver triglyceride levels were also markedly decreased (-72% and -33%, respectively; P<0.05), which was associated with a potent reduction in the expression of key genes involved in fatty acid uptake (Cd36, Fabp1), de novo lipogenesis (Acaca, Fas, Scd1), inflammation (Ccl2, Tnf, Il1b) and fibrosis (Acta2, Col1a1). At the systemic level, Totum-63 reduced fasting plasma glucose, insulin and leptin levels (-9%, -62% and -43%, respectively; P<0.05), and improved both insulin sensitivity (+20%; P<0.05) and glucose tolerance (+23%; P<0.05). Hyperinsulinemic-euglycemic clamp indicated that T63 promoted peripheral (+30%; P<0.05) rather than hepatic insulin sensitivity (-9%; P=0.88). In line with this, expression of insulin receptor β and insulin-induced phosphorylation of Akt/PKB were significantly increased by Totum-63 in both eWAT (+1080% and +120%, respectively; P<0.05) and skeletal muscle (+54% and +86%, respectively; P<0.05).
Conclusion: Our results show that Totum-63 reverses insulin resistance in obese mice, likely through pleiotropic effects on various metabolic organs. Altogether, supplementation with plant-derived Totum-63 might constitute a promising novel nutritional approach for alleviating metabolic dysfunctions in established T2D.
Disclosure: B. Guigas: None.
449
Positive correlation between levels of lipoprotein associated phospholipase A2 and insulin resistance in newly diagnosed type 2 diabetes
M. Sun1, X.L. Zhou1,2;
1The First Affiliated Hospital of Nanjing Medical University, Nanjing, 2Maanshan People's Hospital Department, Maanshan, China.
Background and aims: To explore the relationship between lipoprotein-associated phospholipase A2 (Lp-PLA2) and insulin resistance in newly diagnosed type 2 diabetes mellitus
Materials and methods: A total of 219 newly diagnosed T2DM patients were selected. Lp-PLA2 levels, total cholesterol(TC), triacyl glycerin(TG), high-density lipoprotein cholesterol(HDL-C), low density lipoprotein cholesterol (LDL-C), Uric acid(UA),fasting plasma glucose and fasting plasma insulin were measured,respectively.Postprandial venous blood samples were collected at 30 and 120minutes after OGTT to test glucose and insulin levels. IR was assessed by HOMA-IR and Matsuda insulin sensitivity index (Matsuda ISI).The patients were divided into normal group(<200 ng/mL) and high group(≥200 ng/mL) according to Lp-PLA2 levels,then the difference of insulin resistance in two groups and the correlation between Lp-PLA2 and insulin resistance were analyzed.
Results: Compared with the normal group, BMI, ALT, AST, TG, INS0, INS30, INS120, HOMA-IR and HOMA-β increased in the high group while HbA1c, HDL-C and Matsuda ISI decreased ,and these data all had statistical significance (P<0.05). There was no statistical significance in gender and age between the two groups (P>0.05). Correlation analysis showed that the Lp-PLA2 levels were positively correlated with HOMA-IR(r=0.366,P<0.001) and negatively correlated with Matsuda ISI (r=-0.386,P<0.001).Multiple linear regression analysis after correction for BMI,FPG,120 min PG,TG,HDL-C and UA step by step in three models showed that Lp-PLA2 was an important predictor for HOMA-IR and Matsuda ISI(P <0.05).
Conclusion: Lp-PLA2 level is closely related to T2DM insulin resistance. Lp-PLA2, as a simple and feasible indicator, can be useful for evaluating both cardiovascular risk and insulin sensitivity in T2DM.

Disclosure: M. Sun: None.
450
Alterations in basal insulin- and mTOR-dependent signallings are closely related to impaired incretin profile and type 2 diabetes among obese patients
I. Stafeev1, I. Sklyanik2, K. Yah'yaev3, E. Shestakova2, A. Yurasov3, M. Menshikov1, A. Vorotnikov1, Y. Parfyonova1, M. Shestakova2;
1National Medical Research Centre for Cardiology, Moscow, 2Endocrinology Research Centre, Moscow, 3Central Clinical Hospital #1 of LLC Russian Railways, Moscow, Russian Federation.
Background and aims: Activity of insulin and mTOR-dependent signaling pathways is the main driver of the nutrient distribution and the regulation of systemic metabolism. Nevertheless, question about basal state of these signaling pathways and their relationships with patient’s clinical parameters remains unclear. In our study we have compared the basal state for insulin- and mTOR-dependent signaling pathways in subcutaneous adipose tissue of obese T2DM vs. obese subjects with normal glucose tolerance (NGT). We aimed to investigate relations of insulin- and mTOR signaling to clinical parameters of carbohydrate metabolism and incretins secretion profiles
Materials and methods: 22 patients with long (>10 years) and morbid (BMI > 35 kg/m2) obesity, 12 of which had NGT and 10 had T2DM were enrolled in this study. Hyperinsulinemic-euglycemic clamp test and HOMA-IR were used to measure insulin resistance. Blood samples taken at 0, 30 and 120 min of food load test were used to assess incretin profile, insulin and glucose levels. Amount of total and visceral fat was determined by bioelectrical impedance analysis. Subcutaneous fat biopsies were obtained during bariatric surgery for all patients and signaling pathways state was analyzed by western blot.
Results: As assessed by western blots of insulin receptor substrate (IRS), Akt, Raptor, Rictor, mTOR and S6K1, insulin and mTOR-dependent signaling have comparable activation level in NGT and T2DM groups. Nevertheless, phosphorylation of AS160 (Ser318) was significantly lower and phosphorylation of SGK (Ser422) was significantly higher in T2DM group. During our work we have found statistically significant correlations between the changes in incretins secretion profile, glucose metabolic parameters and phosphorylation level of AS160 and SGK1 proteins. Among these correlations in context of carbohydrate metabolism phosphorylation levels of AS160 and SGK had opposit correlations with the level of HbA1c (r = -0.576 and r = 0.361 respectively, p<0.05) and the delta insulin level between 30 min and 0 min during food load test (r = 0.486 and r = -0.381 respectively, p<0.05). Also among correlations of incretins secretion profile phosphorylation levels of AS160 and SGK have opposit correlations with baseline levels of GIP (r = -0.42 and r = 0.502 respectively, p<0.05) and glucagon (r = -0.471 and r = 0.365 respectively, p<0.05).
Conclusion: According to our investigation, altered inhibitory phosphorylation of AS160 and activative phosporilation of SGK1 are associated with obese T2DM phenotype and impaired incretin profile. Elevated activation of AS160, one of the main inhibitors of GLUT4 translocation in adipocytes, confirms previous studies, whereas the role of decreased SGK1 activity in the development of insulin resistance is not well characterized and requires additional research. These results force to reconsider the signaling-dependent adipose tissue nutrient consumption regulation. We suggest that AS160 and SGK1 phosphorylations are possible essential markers of the prediabetes-to-diabetes transition.
Supported by: This work was supported by Russian Science Foundation grant #17-15-01435
Disclosure: I. Stafeev: Grants; This work was supported by Russian Science Foundation grant #17-15-01435.
451
Ebselen enhances insulin sensitivity by inhibiting SHIP2 and protects diabetic mice from oxidative stress and inflammation
Z. Polianskyte-Prause1, T.A. Tolvanen2, S. Lindfors1, K. Kon3, L.C. Hautala1, H. Wang2, T. Wada3, H. Tsuneki3, T. Sasaoka3, S. Lehtonen1,2;
1Research Program for Clinical and Molecular Metabolism, University of Helsinki, Helsinki, Finland, 2Department of Pathology, University of Helsinki, Helsinki, Finland, 3Department of Clinical Pharmacology, University of Toyama, Toyama, Japan.
Background and aims: Increased oxidative stress and chronic inflammation have been implicated in the development of insulin resistance and progression of type 2 diabetes. Lipid phosphatase SHIP2 (Src homology 2 domain-containing inositol-5-phosphatase 2) suppresses the insulin signaling pathway and is upregulated in peripheral tissues of diabetic rodent models. Thus, SHIP2 is an excellent target to treat insulin resistance in type 2 diabetes. Ebselen, an organoselenium compound with antioxidant and anti-inflammatory properties, has been recently recognized as a potential treatment for diabetes-related disorders. However, the direct molecular target and the underlying mechanisms by which ebselen regulates metabolic pathways remain uncharacterized.
Materials and methods: To discover new SHIP2 inhibitors, we performed in silico structure-based virtual screening of small molecule chemical libraries and identified ebselen as a potential SHIP2 inhibitor. The ability of ebselen to inhibit SHIP2 was validated by using recombinant SHIP2 fusion protein, cultured cells and diabetic db/db and SHIP2 overexpressing (SHIP2-Tg) mice.
Results: We found that ebselen inhibits the catalytic activity of the recombinant SHIP2 phosphatase domain by 100% and SHIP2 in cultured myotubes and hepatoma cells by around 45%. Ebselen inhibited the catalytic activity of SHIP2 in skeletal muscle and liver of db/db mice by 25-50%, and in liver of SHIP2-Tg mice by 25%. Ebselen slightly increased insulin-induced glucose uptake in myotubes, and enhanced insulin sensitivity in db/db and SHIP2-Tg mice. We observed that SHIP2 overexpression abrogates the insulin-mimetic properties of ebselen in myotubes. Furthermore, we found that ebselen reduces cytokine levels, macrophage infiltration and the expression of lipid peroxidation markers in liver of db/db mice.
Conclusion: Ebselen inhibits the activity of SHIP2 in vitro and in vivo, enhances insulin-induced glucose uptake in cultured myotubes, and increases insulin sensitivity in both SHIP2-Tg and db/db mice. In addition, decreased lipid peroxidation and inflammation markers in liver of db/db mice indicate that ebselen acts as an antioxidant and anti-inflammatory agent possibly by reducing SHIP2 activity. Our data proposes a novel molecular mechanism by which ebselen ameliorates insulin resistance and highlights the potential of SHIP2 as a drug target to treat metabolic disorders.
Supported by: Erkko and Jusélius Foundations, HiLife/University of Helsinki, EFSD/Boehringer Ingelheim Programme, EFSD Albert Renold Travel Fellowship Programme
Disclosure: Z. Polianskyte-Prause: None.
452
The role of IL-4/STAT6 signalling in regulation of adipocytes glucose metabolism
S. Michurina1, I. Stafeev1, A. Arfanyan2, I. Beloglazova1, E. Shevchenko1, M. Menshikov1, Y. Parfyonova1;
1National Medical Research Center of Cardiology, Moscow, 2Lomonosov Moscow State University, Moscow, Russian Federation.
Background and aims: Inflammation in adipose tissue, observed in obese individuals, participates in pathophysiological progress of insulin resistance (IR) and type 2 diabetes mellitus (T2DM). Previous studies demonstrated the essential role of anti-inflammatory cytokine IL-4 in systemic glucose tolerance improvement, regulation of oxidative metabolism in the liver and lipid storage in adipocytes. We therefore aimed to investigate participation of IL-4/STAT6 axis in regulation of glucose metabolism in adipocytes.
Materials and methods: Adipocytes 3T3-L1 were treated with recombinant IL-4 (50 ng/ml) or transduced with IL-4 gene. Knock-down of STAT6 was achieved by delivery of lentiviral construction, expressing shRNA specific to STAT6 mRNA. The model of IR was obtained using exposure to 1 mM palmitate. Glucose transport and insulin sensitivity were determined by [3H]-2-deoxyglucose consumption and activation of insulin signaling (phosphorylation of IRS-1 (Y612), Akt (S473, T308), AS160 (S318)) in response to IL-4 and insulin. Influence of IL-4 on protein expression in adipocytes was evaluated by shotgun proteomic study using HPLC-MS system and analyzed in TRUST, PANTHER and BioGRID databases.
Results: We identified activation of basal and insulin-dependent glucose uptake in adipocytes induced by IL-4. In IR model IL-4 restored insulin signaling activity. Furthermore, effect of IL-4 to promote glucose consumption was abolished by STAT6-specific shRNA. Proteomic data indicated that IL-4 regulates metabolic processes in adipocytes (45 genes), especially, upregulates essential mitochondrial proteins (7 genes). Analysis of transcription factor regulation revealed that genes are possibly regulated by NFE2L2, HIF1a, GABPA, PPARa, Jun, responsible for antioxidant defense system and mitochondrial respiration. Moreover, among transcriptional regulators factors interacting with STAT6 were determined (NFE2L2, Jun, TP53, NFkB).
Conclusion: These data support that IL-4 enables STAT6 to increase adipocytes glucose consumption. We hypothesize that IL-4 promotes glucose utilization in adipocytes through enhancement of mitochondria catabolic efficiency. Activation of antioxidant enzymes expression may point out a potential mechanism of insulin sensitization by IL-4 in lipid-induced IR model through maintenance of mitochondrial function under metabolic overload conditions.
Supported by: These work was supported by RFBR grant #20-015-00100
Disclosure: S. Michurina: None.
453
Up-regulation of IL-8, osteonectin and myonectin mRNAs by intermittent hypoxia via OCT1- and NRF2-mediated mechanisms in skeletal muscle cells
S. Takasawa, R. Shobatake, A. Itaya-Hironaka, M. Makino, S. Sakuramoto-Tsuchida, T. Uchiyama, H. Ota, A. Yamauchi;
Nara Medical University, Kashihara, Japan.
Background and aims: Sleep apnea syndrome (SAS) is a highly prevalent disease characterized by upper airway narrowing or collapse during sleep that leads to a cessation of airflow. Recurrent short cycles of oxygen desaturation followed by rapid reoxygenation (intermittent hypoxia [IH]), which are typical features of SAS, contribute to the development of impaired glucose tolerance/insulin resistance. We have investigated the mechanisms by which IH induces impaired insulin secretion and insulin resistance using pancreatic β cells, hepatocytes, adipocytes, neuronal cells, and enteroendocrine cells. Recent researches have demonstrated that IH causes skeletal muscle inflammation/dysfunction leading to insulin resistance; however, the detailed mechanism remains unknown. In the present study, we investigated IH-induced changes of myokine levels and their regulation mechanisms.
Materials and methods: Human RD and mouse C2C12 myocytes were exposed either to 70 cycles/24 h of IH (5 min hypoxia [5% CO2, 1% O2]/10 min normoxia [5% CO2, 21% O2]), mimicking SAS patients, or normoxia for 24 h. After the treatment, the mRNA levels of IL-6, IL-8, IL-15, CCL2, TNFα, myostatin, BDNF, irisin, decorin, osteonectin, myonectin, NOX2, GLUT4, MAPK14, PI3KR2, and sirtuin 2 were measured by real-time RT-PCR, and the levels of IL-8, osteonectin, and myonectin in the culture medium were measured by ELISA. Reporter plasmids were prepared by inserting the promoter fragments of human IL-8, osteonectin, and myonectin upstream of a firefly luciferase reporter gene in pGL4.17 vector. After the reporter plasmids were transfected into RD cells, the cells were exposed either to IH or normoxia for 24 h, and lysed, and the promoter activities were measured. To clarify the role of octamer binding transcription factor 1 (OCT1) and nuclear factor erythroid 2-related factor 2 (NRF2), siRNA(s) for OCT1 and NRF2 were introduced into RD cells just before IH/normoxia exposure, and the mRNA and protein levels of IL-8, osteonectin, and myonectin were measured by real-time RT-PCR and ELISA.
Results: (1) The mRNA levels of IL-8, osteonectin, and myonectin in human RD cells were significantly increased (P=0.0007,P=0.0103, and P=0.0210, respectively). (2) The mRNA levels of IL-8, osteonectin, and myonectin in mouse C2C12 cells were significantly increased (P=0.0454, P=0.0062, and P=0.0019, respectively). (3) The levels of IL-8, osteonectin, and myonectin in IH-treated RD cell medium were significantly increased (P<0.0001, P<0.0001, and P=0.0079, respectively). (4) The promoter activities of IL-8, osteonectin, and myonectin were increased by IH, and deletion analyses revealed that -152~-151 in IL-8, -105~-99 in osteonectin, and -3741~-3738 in myonectin promoter(s) were responsible for the activation by IH. (5) The promoters contain consensus transcription factor binding sequences for OCT1 in IL-8 and myonectin, and for NRF2 in osteonectin, respectively. (6) The introduction of siRNA for OCT1, and NRF2 abolished the increases of mRNAs for IL-8 and myonectin, and osteonectin, respectively.
Conclusion: These results could well explain a mechanism of glucose intolerance, insulin resistance, and diabetes in SAS patient because IL-8, osteonectin, and myonectin are reported to be myokines and associated with glucose intolerance and insulin resistance.
Disclosure: S. Takasawa: None.
454
Inhibition of high-mobility group box 1 release via up-regulation of SIRT1 improved hepatic insulin resistance
R. Meng1, B. Feng2, Y. Bi1, D. Zhu1;
1Endocrinology, Nanjing Drum Tower Hospital, Nanjing, 2Endocrinology, The First Affiliated Hospital of Soochow University, Suzhou, China.
Background and aims: The aims of the present study are to investigate the effect of SIRT1/high-mobility group box 1 (HMGB1) pathway in hepatic insulin resistance and to explore whether it is the potential therapeutic target for insulin resistance.
Materials and methods: HepG2 cells were exposed to palmitic acid (PA) to induce insulin resistance. Pharmacological inhibition and small interfering RNA (siRNA) technology was used to reduce SIRT1 or HMGB1 level. And silymarin was used to up-regulate SIRT1 in HepG2 cells. Both cytoplasmic and nuclear HMGB1 were measured by western blot. Acetylated HMGB1 was analyzed by immunoprecipitation. C57BL/6 mice were fed with high fat diet (HFD) for 12 weeks, and treated orally with vehicle saline or silymarin daily for 30 days. The intravenous glucose tolerance test (IVGTT) test was performed to investigate insulin sensitivity. Levels of cytokines were detected by ELISA. Western blot was employed to measure the expression levels of the molecules involved in insulin signaling pathway and inflammation signaling pathway.
Results: In HepG2 cells, the levels of cytokines TNF-α and IL-6 were increased and insulin signaling pathway were impaired after PA treated (all p<0.05). HMGB1 is a central and necessary inflammatory mediator. The levels of acetylated HMGB1 were significantly increased (p=0.012). And the translocation of HMGB1 from the nucleus to the cytoplasm and the release of HMGB1 into the supernatants of HepG2 cells were dramatically elevated after PA treatment (p=0.023, p=0.036 respectively). HMGB1 siRNA improved insulin resistance and decreased the levels of cytokines after PA treated (all p<0.05). These findings elucidated that HMGB1 plays a critical role in the development of PA-induced inflammation and insulin resistance. SIRT1 expression was reduced after PA treatment (p=0.021). Silymarin significantly up-regulated SIRT1 and consequentially reversed the secretion of cytokines and improved insulin signaling pathway (all p<0.05), whereas the silymarin-mediated protection was significantly blocked by SIRT1 inhibition Ex527(all p<0.05).These results suggested that silymarin induced protection against PA-induced inflammation and insulin resistance was mediated by SIRT1 up-regulation. Furthermore, silymarin significantly reduced the levels of acetylated HMGB1 (p=0.031), then inhibited the translocation and release of HMGB1(p=0.042), while Silymarin mediated inhibition was significantly blocked by Ex527 (p=0.029). These results indicated that silymarin inhibits the acetylation and the nuclear translocation and release of HMGB1 via up-regulation of SIRT1. In vivo, HFD mice were treated by silymarin. We found that silymarin significantly improved insulin resistance and reduced inflammation induced by HFD (all p<0.05). Furthermore, silymarin significantly inhibited HMGB1 nuclear translocation and release, accompanied by SIRT1 elevation in the liver (all p<0.05).
Conclusion: Our results demonstrated that the SIRT1/HMGB1 pathway is a therapeutic target for the amelioration of hepatic insulin resistance. Silymarin conferred protection against PA- and HFD-induced insulin resistance through SIRT1-mediated HMGB1 deacetylation.
Supported by: NSFC
Disclosure: R. Meng: None.
455
Vitamin D deficiency impairs mTorc2/Akt signalling through down regulating Sirt1 and results in increased hepatic gluconeogenesis
Q. Yuan, J. Yang, M. Sun, S. Tang, M. Dong, L. Mao;
the Affiliated Huaian No.1 People's Hospital of Nanjing Medical University, Huaian, China.
Background and aims: 1,25(OH)2D3 as an active form of vitamin D is involved in the development of many metabolic-related diseases including diabetes. While prospective epidemiological studies have shown that vitamin D deficiency is implicated in the regulation of glucose metabolism, the specific mechanism still remains unclear.
Materials and methods: Here, we generated 1α(OH)ase-null mice and discovered that these mice developed hepatic glucose overproduction and hepatic insulin resistance accompanied by decreased expression of Sirt1. ChIP and Luciferase assay confirmed that 1,25(OH)2D3 activating vitamin D receptor (VDR) directly interacts with one vitamin D response element located in Sirt1 promoter to up-regulate its transcription, triggering a cascade of phosphorylation of Akt at S473 and FOXO1 at S256 and resulting in decreased transcription of the gluconeogenic genes glucose-6-phosphatase (G6pase) and phosphoenolpyruvate carboxykinase (PCK1), eventually hepatic glucose overproduction.
Results: We have identified a signaling pathway involving VDR, Sirt1, Rictor (a component of mTOR complex 2 [mTorc2]), Akt, and FoxO1 that regulates gluconeogenesis, and identified Sirt1 and FoxO1 as key modulators of increased gluconeogenesis induced by vitamin D deficiency.
Conclusion: Our work demonstrates a novel mechanism of 1,25(OH)2D3 deficiency-induced hyperglycemia mediated through Sirt1 downregulation.

Supported by: National Natural Science Foundation of China (81400789)
Disclosure: Q. Yuan: None.
PS 29 Studies on insulin resistance
456
Dynamics of insulin resistance assessed by two methods (HOMA and hyperinsulinaemic euglycaemic clamp) during 12 months after bariatric surgery in type 2 diabetes patients
I. Sklyanik1, E. Shestakova1, I. Stafeev2, K. Yah'yaev3, A. Yurasov3, M. Menshikov2, A. Vorotnikov2, Y. Parfyonova2, M. Shestakova1;
1Endocrinology Research Centre, Moscow, 2National Medical Research Center for Cardiology, Moscow, 3Central Hospital #1 of LLC Russian Railways, Moscow, Russian Federation.
Background and aims: There are two ways for insulin resistance (IR) assessment: the HOMA-IR calculator (the indirect screening method) and hyperinsulinemic euglycemic clamp test (the gold standard for the accurate IR estimation). The focus of our interest was the early (1 and 3 mo) and delayed (6 and 12 mo) dynamics of IR measured by both methods following bariatric surgery in T2DM patients.
Materials and methods: The study included 42 patients with T2D and obesity (median BMI (kg/m2) 42.3 [38.9; 48.1]). The dynamics of M value, mg/kg/min (hyperinsulinemic euglycaemic clamp-test) and HOMA IR were analyzed by the Friedman test. SPSS v. 23.0 was used for statistical analysis.
Results: BMI significantly decreased in all periods of observation: 37.41 [34.2; 42.2], 34.3 [32.3; 38.9], 32.1 [29.5; 36.0] and 29.1 [27.2; 33.0] in 1, 3, 6 and 12 mo respectively. All patients had severe IR before surgery (median M-index 1.54 [0.97; 2.18], HOMA-IR 10.0 [6.8; 15.3]). According to HOMA index IR decreased significantly in early period: 1 and 3 mo after surgery (4.55 [3.27; 6.96] and 2.81 [2.27; 4.11], p<0.05 respectively) and did not significantly change 6 and 12 mo later (2.59 [2.19; 3.28] and 2.76 [1.77; 3.28], respectively). According to M-value IR didn’t change in 1 mo (1.68 [1.15; 2.51]), significantly decreased in 3 and 6 mo (3.37 [2.61; 4.29] and 5.01 [4.13; 5.31], p<0.05, respectively) and stay stable till 12 mo (5.60 [5.10; 5.99], p> 0.05).
Conclusion: The presented methods show a different assessment of IR in the early stages after bariatric surgery. In the first mo after surgery M value remained unchanged despite BMI decreasing. It could mean, that cells ability for glucose uptake does not change at a very early period after bariatric surgery. In addition, the time to reach the final IR value was different in two methods. Using HOMA-IR to determine the level of IR in the early stages after surgery is likely to lead to an inaccurate assessment.
Supported by: Grant 17-15-01435 RSF
Disclosure: I. Sklyanik: None.
457
Exogenous ATP promotes glucose uptake and utilisation in skeletal muscle cells but does not alter glucose clearance in vivo
A.M. Cruz, C. Beall;
Institute of Biomedical and Clinical Science, University of Exeter, Exeter, UK.
Background and aims: Hyperglycaemia observed in Type 2 diabetes is largely a consequence of inadequate insulin action. Insulin-stimulated glucose uptake into skeletal muscle accounts for ~80 % of total glucose disposal and loss of muscle glucose clearance is a major contributor to the impairment in total body glucose utilisation observed in diabetes. It, therefore, remains critical to identify strategies to enhance or recover glucose uptake into metabolically active tissues in insulin-resistant states. Extracellular adenosine triphosphate (ATP) has emerged as an important immunometabolic signalling moiety, having demonstrated regulatory roles in energy metabolism in multiple tissues. Extracellular ATP may represent an important therapeutic tool/target to bypass insulin resistance.
Materials and methods: C2C12 murine myotubes were treated acutely (100 μM, 15 minutes) or chronically (16 hrs) with ATPγS (a non-hydrolysable analogue of ATP) and glucose uptake (luminescence 2-DG assay), phosphorylation of intracellular signalling proteins (PKB and ERK1/2 by Western Blotting) and glycolysis (extracellular acidification rate using the Agilent Seahorse metabolic flux analyser) measured. Glucose tolerance tests (2 g/kg; i.p.) were performed on healthy, male (200-300 g) Sprague-Dawley rats treated with a single dose of ATPγS (1 mg/kg; i.p.) or vehicle (saline).
Results: In the absence of insulin, ATPγS significantly enhanced phosphorylation of PKB at serine 473 and ERK1/2 at Thr202/Tyr204 which was prevented by pre-incubation with broad-spectrum purinergic receptor antagonists, PPADs and suramin, but not by specific P2X4 or P2X7 receptor blockade using 5-BDBD and A-438079, respectively. ATPγS increased glucose uptake in C2C12 myotubes and both acute and long term (16 hr) treatment with ATPγS enhanced the extracellular acidification rate (ECAR), a marker of glycolysis. In healthy rats, acute treatment with ATPγS did not alter the blood glucose excursion or the clearance of blood glucose.
Conclusion: ATPγS demonstrated insulin mimetic roles by activating proteins in the insulin signalling pathway and promoting glucose uptake and utilisation in skeletal muscle cells. However, a single dose of ATPγS (1 mg/kg; i.p.) did not alter glucose clearance in male Sprague Dawley rats. It remains to be determined whether systemic administration of ATPγS generates sufficient interstitial fluid levels to modulate skeletal muscle purinergic receptors at this dose or whether chronic supplementation is required in vivo. Moreover, whether extracellular ATP can stimulate glucose uptake during hyperglycaemia and in insulin-resistant states (particularly lipid-induced insulin resistance) needs to be determined. In future, it will be important to establish whether ATP or P2 receptor modulation can be used as a therapeutic target for the treatment of Type 2 diabetes.
Supported by: University of Exeter CMH/CLES; Diabetes UK; NDMF
Disclosure: A.M. Cruz: None.
458
The effect of saccharin consumption on microbiota composition and insulin sensitivity: a clinical, experimental open label pilot study
K. Kalin1, K. Rådholm2, M. Wennberg1, V. Tremaroli3, H. Brolin3, M. Woodward4, F. Bäckhed3, O. Rolandsson1;
1Department of Public Health and Clinical Medicine, Umeå University, Umeå, Sweden, 2Department of Health, Medicine and Caring Sciences, Linköping University, Linköping, Sweden, 3The Wallenberg Laboratory, Department of Molecular and Clinical Medicine, Sahlgrenska Academy, University of Gothenburg, Gothenburg, Sweden, 4The George Institute for Global Health, University of New South Wales, Sydney, Australia.
Background and aims: In a previous study it was suggested that consumption of saccharin, a non-caloric artificial sweetener (NAS), often consumed by individuals with type 2 diabetes mellitus, increases the risk of developing glucose intolerance in rodents and humans through microbiota alterations. However, the study was small and did not use insulin clamp, the gold standard for measuring insulin sensitivity in humans. Thus, our aim was to further investigate whether NAS affect insulin sensitivity and gut microbiota in humans.
Materials and methods: We recruited 14 participants (8 women and 6 men) who were non-diabetic, 60.0 (IQR 56.8-64.0) years of age with a body mass index of 27.9 (IQR 27.1-28.5). The study was an open label study where participants acted as their own control. Their insulin sensitivity was measured before and after exposure of 240 mg saccharin/day for three months. Insulin sensitivity was assessed by hyperinsulinemic-euglycemic clamp and the ‘M value’ was calculated by dividing the glucose infusion rate during the last 60 minutes of the clamp by body weight (mg/kg/min). Stool samples were collected before and after saccharin consumption. Microbiota was analyzed by sequencing of the 16S rRNA gene.
Results: Thirteen of the 14 participants completed the study. There was no change in insulin resistance after exposure to saccharin (mean M value difference (ΔM) 0.0 (SD 1.6). ΔM was not related to age or sex . Individual M values from the first and second insulin clamp are shown in Figure 1 and indicate some individual responses. During the study 6 participants reduced their HbA1c ≥ 3 mmol/mol. Overall, there was no change in composition or richness of the gut microbiota as a result of saccharin consumption. Furthermore, there was no change in microbiota at end of follow-up for participants with a HbA1c reduction compared to participants without a HbA1c reduction of 3 mmol/mol or more. However, there were small differences in gut microbiota between HbA1c reducers and non-reducers at baseline, with lower gut microbiota diversity in reducers. The reducer group was mainly men who tended to lose more weight than non-reducers; the weight loss was, however, not statistically significant. Statistical analyses of study data were performed by using Student’s t-test.
Conclusion: In contrast to prior studies we did not find an effect of NAS on insulin sensitivity. Furthermore, NAS consumption did not alter microbiota composition in these overweight, middle aged adults without type 2 diabetes.

Disclosure: K. Kalin: None.
459
Effect of a hypercaloric and hypocaloric diet on insulin-induced microvascular recruitment, whole-body glucose uptake and adipose tissue lipolysis
A.L. Emanuel, R.I. Meijer, D.H. van Raalte, M. Diamant, M.H.H. Kramer, M.J. Serlie, E.C. Eringa, E.H. Serné;
Amsterdam University Medical Center, Amsterdam, Netherlands.
Background and aims: In mice fed a high-fat diet impairment of insulin signaling in endothelium is an early phenomenon that precedes decreases in insulin sensitivity of skeletal muscle, adipose tissue and liver. We assessed in humans whether short-term overfeeding affects insulin-induced microvascular recruitment in skeletal muscle and adipose tissue, before changes occur in whole-body glucose uptake and adipose tissue lipolysis.
Materials and methods: Fifteen healthy males underwent a hypercaloric and subsequent hypocaloric diet intervention. Before, during (after ~8 days), and after the hypercaloric diet (~29 days), and upon return to baseline weight (~63 days), all participants underwent 1) a hyperinsulinemic-euglycemic clamps to determine whole-body glucose uptake and insulin-induced suppression of free fatty acids as a measure of adipose tissue lipolysis 2) contrast-enhanced ultrasonography to measure insulin-induced microvascular recruitment in skeletal muscle and adipose tissue. We also assessed insulin-induced vasodilation of isolated skeletal muscle resistance arteries by pressure myography after the hypercaloric diet in study participants and healthy controls (n=5).
Results: The hypercaloric diet increased body weight (mean increase: 3.5kg; p<0.001) and fat percentage (mean increase: 3.5%; p<0.001), but did not affect glucose uptake nor lipolysis. The hypercaloric diet increased adipose tissue microvascular recruitment (p=0.041), and decreased the ratio between skeletal muscle and adipose tissue microvascular blood volume during hyperinsulinemia (p=0.019). Insulin-induced vasodilation of isolated skeletal muscle arterioles was significantly lower in participants compared with control participants (p<0.001). The hypocaloric diet reversed all of these changes, except the increase in adipose tissue microvascular recruitment.
Conclusion: In lean men, short-term overfeeding reduces insulin-induced vasodilation of skeletal muscle resistance arteries and shifts the distribution of tissue perfusion during hyperinsulinemia from skeletal muscle to adipose tissue without affecting whole-body glucose uptake and adipose tissue lipolysis.
Clinical Trial Registration Number: NCT02628301
Disclosure: A.L. Emanuel: Grants; ICAR-VU, AstraZeneca (unrestricted grant).
460
Accessible indices of insulin resistance: exploring the associations with hepatic and intramuscular fat accumulation
K. Bowden Davies1, V.S. Sprung2, J.A. Norman3, A. Thompson3, J.P.H. Wilding3, G.J. Kemp3, D.J. Cuthbertson3;
1Newcastle University, Newcastle Upon Tyne, 2Liverpool John Moores University, Liverpool, 3University of Liverpool, Liverpool, UK.
Background and aims: Epidemiological data demonstrate that cellular accumulation of ‘ectopic’ fat (i.e. in liver and skeletal muscle) is associated with insulin resistance and the development of type 2 diabetes. Gold standard measurements of insulin resistance and ectopic fat require expensive equipment and specialised expertise. The aim of this study was to investigate if accessible clinical assessments of insulin resistance were associated with hepatic and intramuscular fat measures derived from magnetic resonance spectroscopy (MRS).
Materials and methods: Seventy-two participants (41 female and 31 males; age 38±11 years; BMI 24.9±4.3 kg/m2) underwent a 2-h OGTT (used to calculate indices of whole-body insulin resistance (HOMA-IR) and sensitivity (Matsuda index), hepatic insulin resistance and skeletal muscle insulin sensitivity, alongside MRS measurements of intrahepatocellular lipid (IHCL) and intramyocellular lipid (IMCL). Univariate linear regression was used to explore the relation of each insulin-related index with body composition assessments (BMI, waist circumference, IHCL and IMCL). Statistical significance was taken as P<0.05. Where significant univariate associations were identified, that measure of body composition was included in a multivariate regression model for each insulin-related index.
Results: Univariate linear regression revealed significant associations between IHCL (hepatic fat) and all insulin-related indices except muscle insulin sensitivity. Muscle insulin sensitivity was not significantly associated with any assessments of body composition, and IMCL (intramuscular fat) was only associated with Matsuda index (whole-body insulin sensitivity). Multivariate regression analysis revealed that both HOMA-IR and hepatic insulin resistance index were significantly associated with IHCL but not BMI or waist circumference (Table 1). Matsuda index is significantly associated with both IHCL and IMCL.
Conclusion: In this cross-sectional study of healthy, young non-obese adults, hepatic fat accumulation was associated with increased hepatic insulin resistance index (derived from 2-h OGTT) and HOMA-IR (fasting samples). This finding is of clinical significance given the time efficiency of HOMA-IR in the clinical setting. Hepatic insulin resistance index is proposed as a useful, accessible, tool for monitoring ectopic fat accumulation in the liver, which is pivotal to the development of type 2 diabetes.

Supported by: Diabetes UK (13/0004719) with additional support from CIMA, UK.
Disclosure: K. Bowden Davies: None.
461
Insulin resistance in muscle tissue during early diabetic ketoacidosis
F. Fisker;
Department of Endocrinology and Internal Medicine, Medical Research Laboratories, AUH, Aarhus University Hospital, Aarhus, Denmark.
Background and aims: During Diabetic ketoacidosis (DKA), muscle tissue develops a profound insulin resistance. We used skeletal muscle biopsies from a previously published study to investigate insulin signaling during euglycemia and incipient DKA following total insulin withdrawal (IW).
Materials and methods: Muscle biopsies originated from a previously conducted study. The study was a randomized, controlled, crossover trial involving nine patients with type-1-diabetes. They were investigated over 2 days for 5 hours followed by a 2.5 hour high-dose insulin clamp: (1) insulin-controlled euglycemia (control) and (2) total insulin withdrawal for 14 hours. 12 proteins involved in insulin signaling, glucose transport and glucose metabolism were investigated with western blot analysis and calorimetry data.
Results: During both study days, insulin treatment increased phosphorylation of proteins involved in insulin signaling (Akt, AS160, mTOR and 4eBP1) and glucose metabolism (GSK3), while GS phosphorylation decreased as a sign of activation. No differences in phosphorylation of the insulin-independent AMPK were observed. IW was not associated with any differences in the amount of glucose transport proteins (GLUT4 and hexokinase) or mitochondrial proteins (SDHA and PHB1). Calorimetry data revealed a reduced glucose oxidation during IW compared to the control day (p=0.027).
Conclusion: Despite profound inhibition of insulin-mediated glucose uptake in skeletal muscle during incipient DKA, insulin signal transduction at protein level remains intact. It is possible that a reduced glucose oxidation or GLUT4 translocation is involved in the observed insulin resistance.
Supported by: SDCA, AUH
Disclosure: F. Fisker: None.
462
Simvastatin profoundly impairs energy metabolism in primary human muscle cells
S. Mäkinen1,2, N. Datta1,2, Y.H. Nguyen1,2, P. Kyrylenko1,2, M. Laakso3, H.A. Koistinen1,2;
1Minerva Foundation Institute for Medical Research, Helsinki, 2University of Helsinki, Department of Medicine, Helsinki University Central Hospital, Helsinki, 3Internal Medicine, Institute of Clinical Medicine, University of Eastern Finland, Kuopio, Finland.
Background and aims: Simvastatin use is associated with muscular side effects, and increased risk for insulin resistance and type 2 diabetes. In clinical use, simvastatin is administered in inactive lipophilic lactone-form, which is then converted to active acid-form in the body. The direct effects of these different forms on insulin action and energy metabolism in skeletal muscle are not completely understood. Here, we investigated if lactone- and acid-form simvastatin differentially affect glucose metabolism and mitochondrial respiration in primary human skeletal muscle cells.
Materials and methods: Primary muscle cell cultures were established from m. vastus lateralis biopsies from 14 non-diabetic men. Myoblasts were differentiated into myotubes that were exposed separately to lactone- and acid-form simvastatin for 48 h. After pre-exposure, glucose uptake and glycogen synthesis were measured using radioactive tracers; insulin signalling targets were detected with western blotting; and glycolysis, mitochondrial oxygen consumption and ATP production were measured with Seahorse analyzer. The data were analyzed using 2-way ANOVA with Sidak’s post hoc test for multiple comparisons.
Results: Lactone-form simvastatin increased glucose uptake and glycogen synthesis, whereas acid-form simvastatin did not affect glucose uptake and decreased glycogen synthesis. Phosphorylation of AS160 and GSK3β was upregulated with lactone-, but not with acid-form simvastatin. Both forms of simvastatin led to a decrease in glycolysis and glycolytic capacity, as well as to a decrease in mitochondrial respiration and ATP production. Phosphorylation of AMP-activated protein kinase (AMPK) was increased with lactone-, but not with acid-form simvastatin.
Conclusion: Lactone- and acid-form simvastatin exhibit differential effects on non-oxidative glucose metabolism, as lactone-form elevates, and acid-form impairs glycogen synthesis. Exposure to either form of simvastatin, however, profoundly impairs oxidative glucose metabolism and energy production in human skeletal muscle cells. These effects may contribute to muscular side effects and risk for type 2 diabetes observed with simvastatin use.
Supported by: DSHealth/Clinical Research programme, Finnish Diabetes Research Foundation, Finska Läkaresällskapet
Disclosure: S. Mäkinen: None.
463
Dicarbonyl stress marker, D-lactate, correlates with hyperinsulinaemic-euglycaemic clamp measure of insulin resistance in overweight and obese subjects with type 2 diabetes
P. Thornalley1, M. Xue1, K. Weston2, R. Ali Alsiddig3, A. Diane1, I. Abdalhakam3, M. Alkasem3, M. Shraim3, H. Rustom3, A. Hashish3, M. Dehbi1, M. Skarulis Young3;
1Diabetes Research Center, Hamad Bin Khalifa University, Doha, Qatar, 2School of Health and Life Sciences, Teesside University, Middlesborough, UK, 3Qatar Metabolic Research Institute, Hamad Medical Corporation, Doha, Qatar.
Background and aims: Methylglyoxal (MG) is a reactive glucose-derived dicarbonyl metabolite and glycating agent. It is metabolized to D-lactate by the cytoplasmic glyoxalase system. Formation of MG is increased in type 2 diabetes mellitus (T2DM) for which plasma D-lactate is a surrogate marker. Increased MG, the abnormal metabolic state of dicarbonyl stress, has high prevalence in patients with T2DM. Functional genomics studies in animal models and clinical intervention study with a glyoxalase 1 inducer suggested that dicarbonyl stress is a risk factor for development of insulin resistance and plasma D-lactate may thereby be a biomarker of insulin resistance. In the Cohort study on Diabetes and Atherosclerosis Maastricht (CODAM) study, plasma D-lactate concentration was independently associated with insulin resistance, as assessed by the Homeostatic Model Assessment of Insulin Resistance (HOMA-IR). The aim of this study was to assess if serum D-lactate correlated with the reference method of measurement of insulin resistance, hyperinsulinemic-euglycemic clamp, in patients with T2DM in an exercise intervention study.
Materials and methods: Patients with T2DM were recruited at Hamad Medical City, Doha, Qatar where outcome assessments and exercise sessions took place. A 10-week exercise intervention was implemented, consisting of thrice weekly sessions of high-intensity aerobic interval training and whole-body resistance exercises. Pre- and post-exercise tests included oral glucose tolerance test and clamp insulin resistance. Serum D-lactate was assayed by endpoint enzymatic assay with fluorimetric detection. Data are mean ± SD. Correlation analysis was by the non-parametric Spearman method.
Results: Serum D-lactate was analyzed in 14 patients at baseline and 7 post-intervention (2 responders, 5 non-responders). At baseline, participants had age 41 ± 8 years (11 male/3 female), duration of T2DM, 26 ±17 months, BMI 29 ± 4 kg/m2 and A1C 6.6 ± 0.3%. Overall serum D-lactate was 30.1 ± 15.2 μM (n = 21) [cf. 9.7 ± 4.3 μM typical for healthy controls] and there was no significant change post-exercise intervention. Serum D-lactate correlated negatively with clamp M-value (r = - 0.55, P<0.01) and M-value/Fat-free mass (r = - 0.53, P<0.05), and positively with BMI (r = 0.43, P <0.05). There was no significant correlation with HOMA-IR and oral glucose insulin sensitivity index (OGIS) in this study. In multiple regression analysis, clamp M-value was the only explanatory value linked to serum D-lactate (P<0.05). The regression equation was: serum D-lactate (μM) = - 2.45 x Clamp M (mg/kg/min) + 46.1.
Conclusion: Serum D-lactate correlated with the clamp measure of insulin resistance. With further validation, it may be a simple biomarker of insulin resistance in type 2 diabetes.
Clinical Trial Registration Number: NCT04081064
Supported by: Qatar National Research Fund
Disclosure: P. Thornalley: None.
464
Uraemic toxins are not adversely associated with estimates of beta cell function and insulin sensitivity in patients with end-stage kidney disease
T. Ebert1, S. Hobson1, A. Witasp1, S. Arefin1, K. Kublickiene1, H. de Loor2, P. Evenepoel2,3, P. Stenvinkel1;
1Div. of Renal Medicine, Karolinska Institutet, Huddinge, Sweden, 2Nephrology and Renal Transplantation Research Group, KU Leuven – University of Leuven, Leuven, Belgium, 3Department of Nephrology and Renal Transplantation, University Hospitals Leuven, Leuven, Belgium.
Background and aims: There is an increased risk for incident diabetes mellitus in patients with chronic kidney disease (CKD) but the pathomechanisms are not fully understood, so far. Uremic toxins accumulating in CKD might link CKD with an impaired glucose homeostasis. However, no study has investigated the association of a large panel of 14 uremic retention solutes derived from endogenous and colonic microbial metabolism (uremic toxins) with different estimates of beta cell function and insulin sensitivity in patients with end-stage kidney disease (ESKD) stratified by renal replacement therapy (RRT).
Materials and methods: The study population consisted of 88 non-diabetic ESKD patients (median age: 46 years, 38% male, 61% on dialysis) undergoing renal transplantation. In all subjects, a panel of 14 well-established uremic toxins was measured in serum by ultra-performance liquid chromatography-tandem mass spectrometry method. Uremic toxins were correlated with homeostasis model assessment of beta cell function (HOMA2-%B), insulin sensitivity (HOMA2-%S), and insulin resistance (HOMA2-IR), as well as QUICKI, fasting Belfiore, and triglyceride and glucose index. Significant associations were further scrutinized by multivariate linear regression analysis.
Results: Circulating levels of six uremic toxins significantly differed between ESKD patients on RRT compared to non-RRT subjects, i.e. phenyl glucuronide, indoxyl sulphate, p-cresyl sulphate, hippuric acid, kynurenic acid, and phenyl acetyl glutamine (all p<0.05). In the entire cohort, p-cresyl glucuronide was positively correlated to HOMA2-%S, QUICKI, and fasting Belfiore, whereas there was a negative correlation with HOMA2-IR. Indoxyl sulphate positively correlated with HOMA2-%B (all p<0.05). In multivariate regression models, the associations between p-cresyl glucuronide and HOMA2-%S/HOMA2-IR, as well as indoxyl sulphate and HOMA2-%B, remained significant after adjusting for age, sex, as well as markers of obesity, inflammation, malnutrition, and renal function (p<0.05).
Conclusion: Uremic toxins are not adversely associated with different estimates of beta cell function and insulin sensitivity in ESKD. In contrast, p-cresyl glucuronide was related to a reduced insulin resistance, whereas indoxyl sulphate associated with an improved ß-cell function.
Supported by: Novo Nordisk; Njurfonden; Swedish Heart and Lung Foundation; SRP Diabetes KI; ALF
Disclosure: T. Ebert: Employment/Consultancy; TE was supported by a Novo Nordisk postdoctoral fellowship run in partnership with Karolinska Institutet, Stockholm, Sweden, as well as by the Swedish Kidney Foundation.
PS 30 Treatment of hyperglycaemia in pregnancy
465
Foetal abdominal obesity in women with screening test positive but negative or having one abnormal value on diagnostic test for gestational diabetes
Y. Kim1, W. Kim1, W. Park1, S. Park2;
1Endocrinology and Metabolism, CHA Gangnam Medical Center, CHA University, Seoul, Republic of Korea, 2Biostatistics and Data Science, University of Texas, Health Science Center at Houston, Houston, USA.
Background and aims: We previously reported that fetal abdominal obesity was detected already at diagnosis of GDM and persisted until delivery despite of treatment. In this study we aimed to investigate fetal abdominal growth in women with hyperglycemia at lower level than GDM.
Materials and methods: We retrospectively reviewed the medical records of 7820 singleton pregnant women who had been universally screened using a 50-g glucose challenge test (GCT) at 24-28 weeks of gestation, and underwent a 3-h 100-g oral glucose tolerance test (OGTT) if GCT were ≥140mg/dl. GDM, one value abnormality (OVA), and normal glucose tolerance (NGT, NGT1: GCT-, NGT2: GCT+OGTT-) were diagnosed using the Carpenter-Coustan criteria. HOMA-IR (insulin resistance) was calculated by homeostasis model assessment. Fetal abdominal obesity was investigated by assessing the fetal abdominal overgrowth ratios (FAORs) of the ultrasonographically estimated gestational age (GA) of abdominal circumference(AC) per actual GA by the last menstruation period (LMP), biparietal diameter (BPD) or femur length (FL), respectively. Fetal abdominal obesity (FAO) was defined as FAOR ≥ 90th percentile.
Results: 1) Prevalence of GDM, OVA, and NGT2 was 5.1%, 3.3%, and 7.3% respectively. 2) Maternal age and pre-pregnancy BMI were significantly higher in women with OVA than women with NGT2 and lower than women with GDM. 3) Plasma glucose values on 100-g OGTT and HbA1C for women with OVA were all between those of women with GDM and NGT2 and were significantly different from those of the two groups. 4) HOMA-IR was significantly higher in women with OVA than women with NGT2 and was not different from that of women with GDM. 5) FAORs of women with NGT1 were not different from those of women with NGT2. 6) In women with GDM, FAORs were significantly higher than those of women with NGT1 and NGT2. 7) FAORs of women with OVA (GA-AC/GA-LMP: 1.035±0.042, GA-AC/GA-BPD: 1.019±0.044, GA-AC/GA-FL: 1.010±0.045) were between those of women with GDM (1.041±0.044, 1.021 ±0.047, 1.020±0.046) and NGT2 (1.030±0.038, 1.009±0.043, 1.010±0.041), but there was no significant difference from the ratios of these two groups. 8) Also, risk of FAO in women with OVA (OR: 1.311, CI (0.822, 2.090)) was between those of women with NGT2 (OR: 1.145, CI (0.825, 1.589) and GDM (OR: 2.145, CI (1.568, 2.934)) in comparison with NGT1. 9) Although infant birth weight of women with OVA was not significantly different from those of women with GDM and NGT, cesarean delivery rate was significantly higher in women with OVA (42%) than in women with NGT (32.2%, p<0.05) but was not different from the rate in women with GDM (46.8%).
Conclusion: Clinical and biochemical characteristics as well as fetal abdominal overgrowth of women with OVA were located between those of women with NGT and GDM. These results suggest that OVA, a level of hyperglycemia lower than GDM requires adequate treatment during pregnancy.
Disclosure: Y. Kim: None.
466
Pregestational diabetes and the offspring: comparing the effects according to the type of maternal diabetes and with paternal type 1 diabetes
C. Valverde Tercedor1, N. Perdomo Ugarte1, Y. García Delgado1,2, Y. Nóvoa Medina1,2, A. Expósito Montesdeoca1, A. González Lleó1,2, Y. Brito Casillas1, G. Rodríguez González1, B. Vega Guedes1,2, A.M. Wägner1,2;
1Instituto de Investigaciones Biomédicas y Sanitarias, Universidad de Las Palmas de Gran Canaria, Las Palmas de Gran Canaria, 2Complejo Hospitalario Universitario Insular Materno-Infantil de Gran Canaria, Las Palmas de Gran Canaria, Spain.
Background and aims: Pregestational diabetes (DM) is associated with an increased risk of obesity and diabetes in the offspring. The aim of this project is to compare the differences between children of mothers with DM1 and DM2, children of fathers with DM1 and healthy mothers.
Materials and methods: In this longitudinal, prospective study, women with diabetes who delivered in 2012-2016 and accepted were contacted for follow-up. As controls, healthy mothers with a partner with DM1 and healthy mothers with a partner without diabetes were studied. In the offspring, breastfeeding, eating habits (KidMed questionnaire), physical activity (Enkid test), anthropometric measurements, body composition (impedance, Akern Nutrilab), blood pressure and HbA1c (Alere Afinion AS100) were recorded. Blood samples were collected to analyse insulin resistance and immunity markers (Luminex-200 Bio-Plex Assays 171A7001M and 171AL003M; Bio-Rad Laboratories). A descriptive statistical analysis was performed [SPSS 15 (IBM-Spain)]. Differences between groups were compared (chi square, Studentʼs t or Mann-Whitneyʼs U test) and univariate correlations were assessed. A two-tailed p <0.05 was considered significant.
Results: 85 women with their children were evaluated by telephone. The Enkid questionnaire gave 6 (1-9) points (most children should improve their physical activity) and the Kidmed questionnaire 8 (3-12) points (most children follow a Mediterranean diet), with no differences between groups. Breastfeeding was more frequent in children of fathers with DM1 (13/15) than of mothers with DM1 (16/29) p<0.05. From June 2019 to January 2020, 52 mothers and their children (46.2% girls) were examined [20 with DM1, 17 DM2, 11 from fathers with DM1 and 4 from healthy parents], at age 72 ± 10 months. They had a BMI percentile of 75 (3-97), waist of 56 (41-86) cm, hip of 65 ± 7 cm, systolic blood pressure of 101 ± 13 mmHg diastolic blood pressure of 58 ± 12 mmHg and HbA1c of 5.2 ± 0.3%. There were no differences between groups for any of these variables, though the proportion of children with blood pressure >the 90th percentile was higher in offspring of mothers with DM (9/25 vs 0/15, p= 0,042). Although mothers with DM1 delivered more large for gestational age children than those with DM2, their weight percentile at 6 years did not differ. Gestational weight gain (in DM2) and preconceptional HbA1c (in DM1) correlated with present offspring weight (R=0.611, p=0.012 and R=0.559, p=0.038, respectively). Analysis of impedance data and markers of insulin resistance and immunity are pending.
Conclusion: In this small, prospective, cohort study, no differences were found in lifestyle questionnaires, basic anthropometry or blood pressure in offspring of women with DM1 as compared with maternal DM2 or paternal DM1, except for a higher frequency of breastfeeding in children of fathers with DM1. Analysis of impedance and markers of insulin resistance and immunity might identify more subtle differences between groups. Gestational weight gain and preconceptional HbA1c were associated with offspring weight at 6 years of age.
Supported by: The authors receive funding from ISCIII (PI16/00587, partially funded by ERDF)
Disclosure: C. Valverde Tercedor: None.
467
Patient features and outcomes at a multidisciplinary, preconceptional care clinic
A. González-Lleó1,2, B. Vega-Guedes3, A. López-Alonso3, A. Wägner Fahlin1,4;
1Endocrinología y Nutrición, Complejo Universitario Materno Insular de Gran Canaria, Las Palmas de Gran Canaria, 2Instituto Universitario de Investigaciones Biomédicas y Sanitarias, Universidad de Las Palmas de Gran Canaria, Las Palmas de Gran Canaria, 3Ginecología y Obstetricia, Complejo Universitario Materno Insular de Gran Canaria, Las Palmas de Gran Canaria, 4Instituto Universitario de Investigaciones Biomédicas y Sanitarias, Universidad de las Palmas de Gran Canaria, Las Palmas de Gran Canaria, Spain.
Background and aims: Pregestational diabetes is associated with an increased risk of maternal and foetal complications, but preconceptional care can reduce this risk. The aim of this study was to describe the patients who attend preconceptional care at our centre and their outcomes.
Materials and methods: We reviewed the clinical histories of the women with pregestational diabetes who were followed in our preconceptional clinic between 2014 and 2019. Those who were already pregnant at their first visit were excluded. Quantitative results are expressed as median (interquartile range) or average +/- standard deviation, and qualitative results as percentages. Comparisons were made between women according to their type of diabetes (Student’s t, Mann-Whitney U, or Chi-square).
Results: 112 women have been followed in our pre-conceptional clinic, 54.5% with type 1-DM1, with a baseline HbA1c of 6,9% (6.2-8.0). Women with DM1 were younger (32.7 +/- 5.7 vs 36.0+/- 4.4 years, p =0.001), had longer diabetes duration (15.8+/-8.7 vs 5.8+/-4.8 years, p =0.000), lower BMI (26.9 +/-6.3 vs. 32.1+/-6.4Kg/m2 p= 0.000) and worse baseline glycaemic control (HbA1c 8 +/-1.5 vs 6.6+/-1.6 p = 0.000) than those with type 2 diabetes (DM2); 19.7% were treated with an insulin pump at their first visit and 52.8% were referred by their endocrinologist. Women with DM2 were more frequently referred by the human reproduction unit and obstetrics section (40.9%, p=0.000), where they had come for infertility or previous abortions, respectively. Regarding their outcomes, 49.2% of the women with DM1 were given “green light” for gestation in 4 (2-6) months, with an HbA1c of 6.6% (6.1-6.9%), and a weight gain of +1.65Kg (-0.3-2.7); 50.0% of them became pregnant in 8.5 +/-5.5 months. In comparison, 65.2% of the women with DM2 received green light in 2 (1-3) months (p = 0.004), with an HbA1c of 5.8% (5.6-6.3 p=0.000) and a weight gain of 0.5Kg (-2.0-0.4; p = 0.003); 40% of them became pregnant (p=0.456), in 11.7+/-10.9 months (p = 0.660). Of the DM1 pregnancies, 7.1% ended as abortions (vs 44.4% of DM2; p = 0.151). There were no significant differences in neonatal weight between the offspring of DM1 (p91.0 [51-100]) and DM2 women (p59.5 [19-90.5]); p = 0.254). Overall, 19.6% of the women abandoned follow-up in 3 (1-6.3) months, 10.7% were discharged without pregnancy at 7.5 (1.3-18.8) months and 8% became pregnant before green light was given.
Conclusion: Around half of the women attending preconceptional care obtained green light for pregnancy in a few months. Women with DM1 who attended our clinic had worse glycaemic control and longer duration of diabetes at entry. DM2 women were older, had higher BMI and suffered more often from infertility, but green light was achieved sooner than DM1 with lower HbA1c and less weight gain.
Disclosure: A. González-Lleó: None.
468
Does hypoglycaemia affect pregnancy outcome in insulin treated gestational diabetes?
P. Thomakos1, O. Kepaptsoglou1, C. Barreto1, A. Korantzis2, A. Trouva3, I. Sklavounos3, I. Taraoune1, D. Trouvas3, C.S. Zoupas1;
1Diabetes Center & Clinic Hygeia General Hospital, Marousi, Athens, 2Iaso Maternity Hospital, Marousi, Athens, 3Mitera Maternity Hospital, Marousi, Athens, Greece.
Background and aims: Tight metabolic control is fundamental to minimize adverse outcomes in pregnancies complicated by GDM. However, risk of hypoglycaemia is the major limiting factor in achieving near-normal glycaemic targets. Moreover, international medical consensus recommends that hypoglycaemia should be strictly avoided. The effects of hypoglycaemia on the fetus remains controversial. The aim of our study is to evaluate the effect of maternal hypoglycemia in GDM pregnancies on the fetus.
Materials and methods: A cross-sectional study was conducted in 150 total singleton pregnancies. This included 50 GDM mothers who experienced a minimum average of one hypoglycaemic episode (BG level <54 mg/dL) per week during the follow up period (a), 50 GDM pregnancies without hypoglycaemia episodes (b) and 50 normal pregnancies (c). All three groups were matched for age and BMI. Both FBG and 1-h PP BG for each participant was determined by the average of their SMBG readings. All subjects performed SMBG at least 4 times daily. The clinical characteristics of the study groups are (Mean ± SD): age: 35.9 ±4 vs 36.4 ±4 vs 36.6 ±3 years, p=NS; BMI: 24.6 ±5 vs 24.5 ±4 vs 24.9 ±3 kg/m2, p=NS; HbA1c: 5.2 ±0.6 vs 5.2 ±0.5 vs 4.9 ±0.3 %, p<0.001 (a vs c) (b vs c); Fasting Blood Glucose: 82.9 ±7 vs 85.8 ±8 vs 78.2 ±8 mg/dl, p <0.001 (a vs c) (b vs c), 1-h postprandial BG: 108.1 ±11 vs 107.6 ±11, p=NS; week of diagnosis GDM: 21.8 ±7 vs 24.2 ±7, p=NS; week of starting insulin: 22.2 ±7 vs 24.6 ±7, p=NS; insulin dose: 62.2 ±27 vs 41.3 ±15 iu/day, p<0.001 (a vs b); smoking history: 26 vs 28 vs 26%, p=NS; range of maternal hypoglycaemia episodes: 1-4 episodes/week.
Results: The summary of obstetric and neonatal history between the groups are: Maternal weight gain: 12.3 ±4 vs 10.9 ±4 vs 11 ±3 kg, p=NS; week of delivery: 37.4 ±1 vs 38.1 ±2 vs 38.4 ±1, p=0.001 (a vs c) p=0.04 (b vs c); neonatal birth weight: 2895 ±364 vs 2913 ±508 vs 3068 ±348 g, p=NS; SGA: 6 vs 14 vs 2%, p=0.027 (b vs c); LGA: 2 vs 6 vs 2%, p=NS; pre-eclampsia rate: 4 vs 6 vs 2%, p=NS; Respiratory Distress Syndrome: 8 vs 12 vs 10%; Neonatal hypoglycemia: 10 vs 8 vs 4%, p=NS; Neonatal Intensive Care Unit admittance: 14 ± vs 12 vs 10%, p=NS; Caesarean Section: 68 vs 64 vs 58%, p=NS. There were no cases of severe maternal hypoglycemia. There were no cases of perinatal mortality in neither group. Increased 1-h PP BG was associated with maternal-fetal complications (r=269, p=0.009).
Conclusion: Maternal hypoglycaemic episodes did not affect the outcome of GDM pregnancies. Strict postprandial metabolic control with early insulin therapy limits adverse pregnancy outcomes. Further studies are needed to clarify the role of hypoglycaemia on pregnancy outcomes in GDM.
Disclosure: P. Thomakos: None.
469
Prognosis associated with initial care of increased fasting glucose in early pregnancy: a retrospective study
E. Cosson1, E. Vicaut2, N. Berkane1, T. Ciunganu3, C. Baudry1, J. Boujenah4, P. Valensi3, L. Carbillon4;
1Diabetology-Endocrinology-Nutrition, AP-HP, Université Sorbonne Paris Nord, Bobigny, 2Unité de recherche Clinique, AP-HP, Paris, 3Diabetology-Endocrinology-Nutrition, AP-HP, Université Sorbonne Paris Nord, Bondy, 4Gynecology-Obstetrics, AP-HP, Université Sorbonne Paris Nord, Bondy, France.
Background and aims: To evaluate whether immediate vs no immediate care for women with fasting plasma glucose level (FPG) ≥ 5.1 mmol/L in early pregnancy is associated with pregnancy outcomes.
Materials and methods: We retrospectively selected the women without known diabetes seen in our department (2012-2016) with a FPG level between 5.1 and 6.9 mmol/L before 22 weeks of gestation (WG) and separated them into two groups: (i) 255 who had immediate care; (ii) 268 who did not and performed an oral glucose tolerance test (OGTT) at 22 WG or later, with subsequent care if hyperglycaemia was present. We compared the occurrence of multiple outcomes including a composite adverse pregnancy outcome (large for gestational age infant, shoulder dystocia, preeclampsia).
Results: Among women without immediate care for hyperglycemia in early pregnancy, 134 had hyperglycemia after 22 WG. Women not receiving immediate care were less likely than women who did to be insulin-treated (20.9 vs 58.0 %, -37.1% [95% confidence interval -44.9% - -29.4%], p<0.00001) and had a higher gestational weight gain (10.8±6.1 vs 8.6±5.4 kg, +2.2 kg [1.2 - 3.2], p<0.00001). After propensity score modeling and accounting for covariates, the rate of the composite outcome was similar in both groups (14.6 and 13.7% in women without and with immediate care respectively, adjusted odd ratio 1.030 [0.716-1.481], p=0.87); however, when initial FPG was ≥ 5.5 mmol/L (n=137), the rates were respectively 17.7 and 8.0 %, aOR 0.332 [0.129-0.858], p=0.02.
Conclusion: Immediate care of women with FPG ≥ 5.5 mmol/L in early pregnancy might improve pregnancy outcomes.
Disclosure: E. Cosson: None.
470
Gestational diabetes: an evolving metabolic condition
S. Parrettini, L. Ranucci, A. Caroli, V. Bini, R. Calafiore, E. Torlone;
Department of Medicine, Division of Endocrinology and Metabolism, University of Perugia, Hospital and Clinics, Perugia, Italy.
Background and aims: Prevalence of Gestational Diabetes (GDM) is increasing, such as obesity and Type 2 Diabetes in the general population, with an increasing risk of adverse maternal-foetal outcomes and persistence of post-partum impaired glucose tolerance. We aimed to examine, in a large case series of pregnant women with GDM followed in our Clinic from 2013 to 2018, either the metabolic and anthropometric characteristics with respect to Oral Glucose Tolerance Test (OGTT) diagnostic values, or the maternal-foetal outcomes, or the post-partum persistence of impaired glucose tolerance. We also wished to determine if metabolic features would change over the time.
Materials and methods: We conducted a retrospective analysis on 610 pregnant women with GDM, followed in our Diabetes and Pregnancy Unit from diagnosis to childbirth. Anthropometric parameters (age, pre-gestational BMI, Gestational Weight Gain-GWG at the 1st visit and at the end of pregnancy) and glyco-metabolic control (HbA1c, plasma total/HDL cholesterol, triglycerides) including the OGTTs (blood sugar at time 0', 60', 120', and period of screening, according to IADPSG criteria) were assessed. Nutritional or drug (ie, insulin) prescriptions, along with nutritional and insulin requirements, were examined. Furthermore, both maternal (hypertension, pre-eclampsia, oligo- or poly-hydramnios, post-partum bleeding) and neonatal (delivery modality, weight, new-born percentile, neonatal complications or malformations) outcomes were examined. Last, post-partum follow-up OGTTs were collected. We compared data of GDM pregnant women followed from 2013 to 2015 (Period A) vs those managed in 2016-2018 (Period B).
Results: There were no differences in age, ethnicity, BMI or GWG between the two periods. During Period B, the number of early diagnostic curves (16-18 weeks of gestation) significantly increased, along with pathological fasting blood glucose (FPG) (for both early and late OGTTs), as compared to Period A. In Period B a significant increase in mean FPG (5.12 ± 0.48 vs 4.93 ± 0.58 mmol/l) and a significant reduction of the average 1 h and 2 h post-load BG (p <0.05) were detected in comparison with Period A. A significant increase in plasma LDL-cholesterol was noticed in Period B, while there were no differences in maternal and neonatal outcomes (p> 0.05). Two months after delivery, 30.8% of mothers in Period A and 42.2% in Period B attended the scheduled follow up OGTT, with no differences in prevalence of Impaired Glucose Tolerance (IGT) or Impaired Fasting Glucose (IFG) between the two periods.
Conclusion: Although the observation time was relatively short, the differences in the OGTTs could express a progressive change in the metabolic characteristics of GDM women. The metabolic features of pregnant women, which are mirrored by the OGTT values, must be considered since the beginning of patients care, and require an individualized management of pregnancy complicated by GDM and the provision of strategies for the future health, aiming to reduce the risk for progression towards any form of post-pregnancy hyperglycaemia.
Disclosure: S. Parrettini: None.
PS 31 Pancreatic hormones
471
Pancreatic hormone and incretin responses to mixed meal test in chronic pancreatitis and related type 3c diabetes
L. Qi1, Y. Dai2, X. Su3, L. Li1, S. Pandol4;
1Department of Endocrinology, Zhongda Hospital, School of Medicine, Southeast University, Nanjing, Jiangsu, China, 2Nanjing Foreign Language School, Nanjing, Jiangsu, China, 3Department of Endocrinology, Changji Branch, First Affiliated Hospital of Xinjiang Medical University, Xinjiang, China, 4Departments of Medicine, David Geffen School of Medicine at UCLA, Los Angeles, USA.
Background and aims: Chronic pancreatitis (CP) will accompany with different degrees of endocrine and exocrine insufficiency as the disease progresses, and more than 1/3 of them will eventually develop into diabetes, which classified as type 3c diabetes mellitus (T3cDM). The study was aimed to investigate the pancreatic hormone and incretin responses to mixed meal test in CP-DM, and compared with non-diabetic CP or healthy controls.
Materials and methods: There were 10 individuals with CP-DM, 10 non-diabetic CP and 5 age-and sex-matched healthy controls recruited in the study. All participants (after fasting for at least 10h) were given 12 oz. of BOOST drink and blood samples were collected before and after stimulation to measure C-peptide (C-P), insulin (INS), glucagon (GCG), pancreatic polypeptide (PP), glucagon like peptide-1 (GLP-1) and gastric inhibitory peptide (GIP). Indices of insulin sensitivity (HOMA-IR) and β-cell function (HOMA-β) were calculated. Repeated measures analysis of variance was conducted for statistical analysis.
Results: During the test, participants with CP and CP-DM exhibited a similar reaction trends of C-P and INS responses, which were significantly lower than controls (p=0.001 and p<0.001, respectively). Compared with CP and control groups, individuals with CP-DM showed hyperactive responses of GCG and PP (p=0.026 and p=0.035, respectively). The GIP and GLP-1 responses in CP patients were blunted compared to control group (p=0.045 and p=0.017, respectively), while those in CP-DM reserved.
Conclusion: Subjects with non-diabetic CP is characterized by decreased levels of C-P, INS, GIP and GLP-1, whereas increased GCG and PP levels and retained incretin response characterize CP-DM. The above findings, when confirmed in larger studies, may help identify and manage potential T3cDM patients early in the CP population.
Clinical Trial Registration Number: ChiCTR1800018247
Supported by: NSFC (No.81970717)
Disclosure: L. Qi: None.
472
Role of HDL and apolipoprotein A1 in the modulation of pancreatic alpha cell function
E. Mancuso1, G.C. Mannino1, R. Spiga1, C. Averta1, F. Andreozzi1, G. Sesti2;
1Medical and Surgical Sciences, University of Magna Graecia, Catanzaro, 2Clinical and Molecular Medicine, University of Rome-Sapienza, Rome, Italy.
Background and aims: Previous studies have demonstrated that subjects with low levels of HDL and Apolipoprotein A-1 (ApoA1) have increased risk to develop Type 2 diabetes (T2DM). Additionally, lower levels of HDL have been shown to be an independent predictor of β-cell function deterioration over time, and to positively modulate β-cell function in vitro and ex vivo studies. T2DM is characterized by defects in both β-cell and α-cell function, but the effect of HDL and ApoA1 on α-cellular function is unknown.
Materials and methods: We analyzed the association of HDL levels with circulating fasting glucagon in a cohort of 127 Italian non-diabetic subjects. To assess the effects of HDL and ApoA-1 on glucagon secretion in vivo, we treated 10 weeks old CD1 mice with HDL or ApoA1 for 3 consecutive days and measured circulating glucagon levels. To test the effects of HDL and ApoA-1 in vitro and to explore the signaling pathway employed, pancreatic α-TC1 clone 6 cells were treated with HDL (50μg/ml) or ApoA-1 (20μg/ml) for 24h, and then, were exposed to low glucose levels to stimulate glucagon synthesis and secretion. Pre-proglucagon gene expression was determined by RT-PCR, glucagon concentration was measured by ELISA assay, and the phosphorylation status of the PI3K/Akt/FoxO1 signaling pathway was estimated via Western blot.
Results: A significant negative correlation (r=-0.207, p=0.02) between circulating fasting glucagon and HDL cholesterol levels was observed, even after adjusting for age, sex and BMI. In a multivariable regression analysis including age, gender, BMI, fasting and 2h-post load glucose, fasting insulin and HDL levels, HDL cholesterol was the best independent contributor to glucagon levels (β=-0.235, P<0.03). CD1 mice treated with HDL or ApoA1 showed a reduction in circulating glucagon levels following insulin-induced hypoglycemia compared to controls by 32% (P<0.001) and 23% (P<0.05), respectively. Treatment of pancreatic αTC1 cells with HDL or ApoA1 for 24h under low glucose conditions resulted in a significant reduction of both glucagon expression (P<0.04) and secretion (P<0.01), as well as stimulation of Akt and FoxO1 phosphorylation. Pre-treatment with the Akt inhibitor VIII, the PI3K inhibitor LY294002, and the HDL receptor SR-B1 inhibitor BLT-1 restored αTC1 cell response to low glucose levels.
Conclusion: These results support the notion that HDL and ApoA1 negatively modulate glucagon expression and secretion by binding their cognate receptor SR-B1, and activating the PI3K/Akt/FoxO1 signalling cascade. Overall, the data suggest a new role for HDL and ApoA-1 in the regulation of glucose homeostasis mediated by their effect on α-cell function.
Disclosure: E. Mancuso: None.
473
Selective optogenetic activation of pancreatic delta cells in dynamic insulin and glucagon secretion
C. Santos, M. Muratore, P. Rorsman;
Physiology and Neuroscience, University of Gothenburg, Gothenburg, Sweden.
Background and aims: The delta cell of the pancreatic islets is an important player in insulin and glucagon secretion and exhibits a regulatory role over the action of alpha and beta cells when the islet is stimulated by glucose. The specific actions of the delta cell in dynamic insulin and glucagon secretion are still not completely clear. This study establishes an optogenetic based approach to target and activate selectively delta cells in the pancreas during dynamic secretion under different glucose stimuli. We use an in-house mouse model expressing light sensitive channel rhodopsin in delta cells (sst-ChR2 expressing mouse).
Materials and methods: We performed in situ pancreas perfusion to obtain insulin and glucagon fractions over two periods of 20 minutes and 10 minutes for 1 mM and 20 mM glucose respectively. The fractions were collected each minute. During pancreas perfusion the animals were kept in the dark and there were two periods with a strong light stimuli (with 450 nm light) of the pancreas for two minutes at a time. Glucagon and Insulin concentrations were determined by use of Mercodia ELISA kits.
Results: During the two-minute light stimulation periods of delta cells, there were differences in both glucagon and insulin secretion under both glucose concentrations. After light stimulation, the light sensitive animals recover to normal hormone levels, to similar secretion levels as the controls. At 1 mM glucose, light activation of delta cells resulted on an average decrease of 34.5% secretion of glucagon with little effect on insulin secretion (which was low). At 20 mM Glucose, insulin secretion was stimulated by 1385% and glucagon inhibited by 872%. Under these conditions, light activation reduced the light period induced a further ~15% decrease of glucagon secretion and whilst not affecting insulin secretion. Interestingly, there was a delayed inhibitory effect of insulin secretion after light stimulation was discontinued.
Conclusion: Activation of the delta cells during dynamic secretion shows a larger and prompter effect on glucagon secretion than insulin secretion. The inhibitory effect on glucagon secretion of light activation of delta-cells was particularly pronounced at low glucose. Our data suggest that intra-islet somatostatin levels might be sufficiently elevated at high glucose to exert inhibitory paracrine effects and light-activation produce little additional effect. At low glucose, the delta-cells are not spontaneously active and under these conditions and light activation therefore leads to stimulation of somatostatin release. Our data also suggest that alpha cells are in closer proximity to the delta cells than the beta-cells explaining why glucagon secretion is promptly suppressed whereas the inhibition of insulin secretion develops with a 2-min delay.
Supported by: Swedish Research Council
Disclosure: C. Santos: None.
474
Glucagon induces the hepatic expression of acute-phase proteins and pro-inflammatory cytokines
R. Spiga1, G.C. Mannino1, E. Mancuso1, C. Averta1, F. Andreozzi1, G. Sesti2;
1Department of Medical and Surgical Sciences, University Magna Graecia of Catanzaro, Catanzaro, 2Department of Clinical and Molecular Medicine, University of Rome-Sapienza, Roma, Italy.
Background and aims: Glucagon exerts multiple hepatic action including stimulation of glycogenolysis, and gluconeogenesis. The liver has also a crucial role in chronic inflammation being involved in the synthesis of cytokines, and acute phase proteins, and hepatic inflammation is thought to contribute to insulin resistance and hyperglycemia. However, whether glucagon affects hepatic expression of pro-inflammatory cytokines and acute-phase reactants is unknown.
Materials and methods: To address this issue, we evaluated 132 adults not-affected by type 2 diabetes, who underwent anthropometrical and biochemical evaluation, and a 75-g OGTT. To estimate the expression levels of inflammatory markers and the phosphorylation status of intracellular pathways, we employed HepG2 cells treated with increasing concentrations of glucagon for 24h.
Results: Herein, we report a positive relationship between fasting glucagon levels and circulating cytokines IL-1β (r=0.252, p=0.042), and IL-6 (r=0.230, p=0.026) and acute phase proteins fibrinogen (r=0.193, p=0.031), complement C3 (r=0.227, p=0.024), and hsCRP (r=0.230, p=0.012), in individuals without diabetes. Furthermore, we found that glucagon dose-dependently stimulated expression of IL-1β, and IL-6 (p<0.002, for both) along with fibrinogen (p<0.01), complement C3 (p<0.01), and CRP (p<0.01) in vitro. The glucagon-induced increase in cytokines expression was inhibited by preincubating cells with the glucagon receptor antagonist GRA-II. Glucagon stimulated activation of NLRP3 inflammasome (p<0.01) and its downstream effector caspase-1 (p<0.05), which are involved in activation of proIL-1β. Moreover, we found that glucagon stimulated TRAF2 phosphorylation leading to NF-κB activation (p<0.01), which is the canonical pathway involved in IL-6 expression.
Conclusion: These results suggest that glucagon has pro-inflammatory effects that may help to elucidate the mechanism by which glucagon contributes to hyperglycemia in addition to the well known stimulatory effect on hepatic gluconeogenesis.
Disclosure: R. Spiga: None.
475
Lack of melatonin type 1 receptor results in dysregulated alpha cell function and metabolism
C.L. Lyons, A. Hamilton, D. Grajales, L. Shcherbina, A. Lindqvist, E.E. Cowan, N. Wierup, H. Mulder, M. Fex;
Department of Clinical Sciences, Lund University, Malmö, Sweden.
Background and aims: Melatonin, a hormone mediating sleep and wake cycles, is associated with dysregulated metabolism. A single nucleotide polymorphism mapping to melatonin type 1B receptor (MTNR1B/Mt2 in murine) locus results in increased fasting glucose, impaired insulin secretion and an increased risk of developing type 2 diabetes. However, less is known about the other melatonin type 1A receptor (MTNR1A/Mt1) which is localised to the murine alpha cells in the pancreas. Thus, the aim of the project was to investigate the role of melatonin signalling, through Mt1, on islet biology and whole-body metabolism.
Materials and methods: Mice with a lack of the melatonin type 1 receptor (Mt1KO) and wildtype (WT) controls, on a C3H/He background, underwent an IVGTT (1g/kg glucose, n=13-30 mice, 12-14 weeks). Islets from Mt1KO and WT mice were isolated, starved for 1h and stimulated with various secretagogues for 1h to assess their hormone secretory capacity (n=6-15 mice, 12-14 weeks) as measured by ELISA. Alpha cell function was assessed using a Gluc-Venus x Mt1KO cross model whereby isolated islets were incubated with plasma membrane potential indicator (PMPi) and measured by live-cell microscopy.
Results: Increasing concentrations of glucose from 1 to 6 and 16.7 mmol/L result in inhibition of glucagon secretion from WT islets, but there was a significant increase in glucagon secretion (*p<0.05) and a lack of glucagon suppression by glucose in the Mt1KO islets. Importantly whilst both genotypes secrete the same amount of glucagon during an IVGTT, those which lack Mt1 have increased basal (16.6 ± 3.6 vs. 10.1 ± 1.79 pg/ml) and final (10.5 ± 1.04 vs. 8 ± 0.65 pg/ml, *p<0.05) glucagon secretion compared to WT mice. Furthermore, even though Mt1KO mice display increased insulin secretion in vivo (*p<0.01), both genotypes responded with similar levels of insulin secretion in vitro. There was no difference in the glucose levels during the IVGTT between the two genotypes. Inclusion of arginine and high potassium normalised the hyperglucagonemia in Mt1KO islets indicating a disturbance at the plasma membrane level. PMPi measurements demonstrate that islets from Mt1KO mice are less responsive to a rise glucose in glucose concentration, which is in line with the secretion data.
Conclusion: Mice with a lack of melatonin type 1 receptor display hyperglucagonemia both in vitro and in vivo. The Mt1KO mice can compensate in vivo through increased insulin secretion, thus maintaining glucose homeostasis. Islets from Mt1KO mice stimulated with high glucose display a lack of inhibition with respect to glucagon secretion but have normal insulin secretion. All of this data points to perturbed alpha cell function, and our data indicate that the plasma membrane potential may in part be mediating this effect. Ongoing work is trying to fully elucidate the role of melatonin type 1 receptor in alpha cell function and will address how melatonin signalling can influence islet biology and metabolism.
Supported by: EFSD/Lilly Young Investigator Award, VR Exodiab, LUDC-IRC, Påhlsson, Craaford, T2D systems
Disclosure: C.L. Lyons: None.
476
Cardiovascular effects of high-dose glucagon: a randomised clinical trial
K.M. Petersen1, S. Bøgevig1, T. Riis1, N.A.W. Andersson1, K.P. Dalhoff1, J.J. Holst2, F.K. Knop3, J. Faber4, T.S. Petersen1, M.B. Christensen1;
1Department of Clinical Pharmacology, Bispebjerg Hospital, University of Copenhagen, Copenhagen, 2Department of Biomedical Sciences, Faculty of Health and Medical Sciences, University of Copenhagen, Copenhagen, 3Department of Clinical Medicine, Faculty of Health and Medical Sciences, University of Copenhagen, Copenhagen, 4Department of Medicine, Herlev Hospital, University of Copenhagen, Copenhagen, Denmark.
Background and aims: High-dose intravenous glucagon is recommended as an antidote against beta-blocker poisonings, but clinical effects of this intervention are unclear. We therefore investigated efficacy and safety of high-dose glucagon with and without concomitant beta-blockade.
Materials and methods: In a randomised crossover trial, ten healthy male participants received combinations of the beta-blocker esmolol, glucagon (50 μg/kg) and identical volumes of saline placebos on five separate days (day A: Saline+saline; B: Esmolol+saline; C: Esmolol+glucagon bolus; D: Saline+glucagon infusion; E: Saline+glucagon bolus). Esmolol or placebo was administered intravenously from -15 to 30 minutes. Glucagon or placebo was administered from baseline (time 0 minute) as a 2-minute intravenous bolus or as a 30-minute infusion. Endpoints were haemodynamic changes and adverse effects compared between days with glucagon and corresponding placebo.
Results: Compared with placebo, the glucagon bolus increased average heart rate 13 beats per minute (bpm) (95% confidence interval (CI): 8-18 bpm; p<0.001), systolic blood pressure 16 mmHg (95% CI: 8-23 mmHg; p=0.002), diastolic blood pressure 9 mmHg (95% CI: 6-13 mmHg; p<0.001), and cardiac output 18 % (95% CI: 10-27 %; p=0.003) after five minutes on days without beta-blockade. Similar haemodynamic effects of glucagon bolus occurred on days with beta-blockade. Glucagon infusion exerted comparable increases in haemodynamic endpoints to glucagon bolus but these occurred 10-30-minutes after start of infusion. Haemodynamic and adverse effects of glucagon boluses were short-lived, and effects reflected the pharmacological plasma glucagon concentrations. No serious adverse effects occurred.
Conclusion: Intravenous, high-dose glucagon exerted significant stimulatory effects on haemodynamics regardless of beta-blockade and without causing serious adverse effects.
Clinical Trial Registration Number: ClinicalTrials.gov NCT03533179.
Disclosure: K.M. Petersen: None.
477
Glucagon promotes hepatic autophagy by AMPK-mediated mTORC1 inhibition
K.D. Galsgaard1, J. Lee2, B.T. Hubbard2, X.-M. Zhang2, G.W. Cline2, A.R. Nasiri2, J.J. Holst1, N.J. Wewer Albrechtsen1, K.F. Pertersen2, G.I. Shulman2,3;
1Department of Biomedical Sciences, University of Copenhagen, Copenhagen, Denmark, 2Department of Internal Medicine, Yale School of Medicine, New Haven, USA, 3Department of Cellular & Molecular Physiology, Yale School of Medicine, New Haven, USA.
Background and aims: Glucagon plays an important role in hepatic glucose metabolism as well as protein metabolism but detailed knowledge about glucagon’s role in hepatic autophagy is limited. We hypothesized that glucagon regulates hepatic protein metabolism through activation of AMP-kinase (AMPK) that in turn lead to inhibition of mammalian target of rapamycin complex1 (mTORC1) and activation of Uncoordinated-51 like autophagy activating kinase-1 (ULK1) resulting in increased autophagy providing substrates for gluconeogenesis and ureagenesis.
Materials and methods: In order to test this hypothesis, we infused chronically catheterized awake mice with [13C5]-glutamine [0.225 mg/(kg-min)] for 120 min, then infusions of somatostatin [4 μg/(kg-min)] and insulin [0.1 mU/(kg-min)], with (n=7) or without glucagon [10 ng/(kg-min)] (n=6) were added for 90 min. Hepatic AMPKThr172, RaptorSer792, ULK1Ser555, and Microtubule-associated protein 1A/1B-light chain 3 (LC3)-II accumulation were assessed by immunoblotting and hepatic 13C glucose enrichment was measured by GC-MS. In parallel studies, liver slices were obtained from overnight fasted male rats (n=6) and incubated in Krebs-Henseleit bicarbonate buffer supplemented with [3-13C]-alanine (1 mM) with or without glucagon (250 μM). Rates of glucose and urea production were calculated from the enzymatic measurements of glucose and urea concentrations in the buffer. Glucose and urea production were normalized to total protein levels as measured by Pierce™ BCA Protein Assay Kit. Leucine concentrations were measured using GC-MS. Results are presented as mean±SEM.
Results: Plasma glucagon concentrations were increased ~18-fold in mice receiving glucagon infusion compared to control (235.5±32.3 vs. 13.5±4.1 pmol/L, unpaired t-test, P<0.0001). Glucagon infusion increased phosphorylation of hepatic: AMPKThr172, RaptorSer792, and ULK1Ser555 (P=0.03, P=0.03, and P=0.06, respectively, by unpaired t-test), and resulted in hepatic LC3-II accumulation (P=0.02, by unpaired t-test), a marker of autophagy, compared to control. Glucagon treatment increased the hepatic 13C glucose enrichment (m+3) (1.1± 0.2 vs. 0.5±0.06 atom percentage enrichment, unpaired t-test, P<0.0001), indicating increased conversion of glutamine to glucose. Glucagon infusion also increased plasma urea concentrations compared to control (8.2±0.5 vs. 6.5±0.4 mmol/L, unpaired t-test, P=0.04). In rat liver slices glucagon treatment increased: glucose production (1.1±0.3 vs. 0.6±0.02 nmol/mg protein/min, P=0.01), urea production (1.6±0.2 vs. 0.5±0.05 nmol/mg protein/min, P=0.0005), and intracellular levels of leucine (0.5±0.07 vs. 0.3±0.07 nmol/mg protein, P=0.045) compared to control by unpaired t-test.
Conclusion: Our data suggest that glucagon promotes hepatic proteolysis by AMPK-mediated suppression of mTOC1 activity, leading to increased hepatic autophagy and glucose and urea production.
Disclosure: K.D. Galsgaard: None.
PS 32 Insulin secretion in mice and men
478
The incretin effect in subjects with normal glucose tolerance and type 2 diabetes: a systematic review and meta-analysis
E. Grespan, A. Mari;
CNR Institute of Neuroscience, Padova, Italy.
Background and aims: The incretin effect (IE) is an important mechanism to maintain normal glucose tolerance. The IE is impaired in type 2 diabetes (T2D), but the estimated degree of impairment varies considerably between studies and the reasons of this impairment are still unknown. To understand the factors underlying this variability we have performed a systematic review of the studies assessing the IE using the gold-standard protocol employing an OGTT and an intravenous glucose infusion at matched glucose levels.
Materials and methods: We included studies in subjects with normal glucose tolerance (NGT) and T2D. We retrieved from the studies the IE and the variables that were more frequently reported (age, BMI, fasting glucose, insulin and C-peptide, GIP and GLP-1, diabetes duration in T2D). We considered IE indices calculated from both insulin (IEins, N=49) and C-peptide (IEcpep, N=42). IE indices were transformed on a homogenous scale from the original non-uniform data. We applied random-effects models for the primary meta-analysis and random-effects meta-regression to test factors potentially associated with the IE.
Results: We found 30 studies satisfying the criteria, of which 13 tested both NGT and T2D. The variability of the incretin effect across studies was remarkable (IEins range 41-83% in NGT and 4.4-49.5% in T2D). In the studies with both NGT and T2D, the range of the difference was 5-83% for IEins and -8-65.3% for IEcpep. Meta-analysis revealed that IEins was systematically greater than IEcpep (overall difference 9.9%, CI 7.5-12.2, p<0.0001). In the studies with both NGT and T2D, meta-analysis confirmed a reduction of both IEins and IEcpep in T2D subjects (overall difference 30%, CI 18-41, p<0.0001 for IEins and 24%, CI 14-35, p<0.0001 for IEcpep). In meta-regression in all studies, glucose tolerance (NGT vs T2D) and BMI were confirmed as independent covariates of IEins (p<0.05). However, for IEcpep BMI did not reach statistical significance (p=0.23). Fasting glucose, as a continuous index of glucose tolerance, was not an additional significant factor (for both IEins and IEcpep). A positive correlation was observed between BMI and fasting C-peptide. Fasting C-peptide in place of BMI was a significant independent covariate for both IEins and IEcpep (p<0.05). This suggests that increased fasting insulin secretion rather than BMI underlies the reduced incretin effect.When added to the model with glucose tolerance and fasting C-peptide, no further factor was significantly associated with the IE, in particular, age, incretin hormones (fasting values and OGTT response), diabetes duration and age at T2D diagnosis (in T2D only).
Conclusion: This systematic review: a) shows that IEins overestimates IEcpep; b) confirms in meta-analysis the IE reduction in T2D; c) confirms the dependence of IE on BMI, but suggests that this is secondary to a dependence of IE on fasting insulin secretion, as assessed by fasting C-peptide; d) does not identify further relevant factors explaining the IE variability; e) shows that the confirmed predictors of IE are not sufficient to explain the difference between NGT and T2D.
Disclosure: E. Grespan: None.
479
Drug-induced blockade of the voltage-gated potassium channel Kv11.1 (hERG-channel) decreases glucose-stimulated insulin secretion and increases insulin sensitivity
C. Juhl, J. Burgdorf, C. Knudsen, S. Veedfald, J. Holst, J. Kanters, S. Torekov;
Department of Biomedical Sciences, University of Copenhagen, Copenhagen, Denmark.
Background and aims: The voltage-gated potassium channel Kv11.1 (hERG-channel) encoded by the KCNH2 gene is found in several cells. Inheritable mutations or drug-induced dysfunction may cause long QT syndrome (LQTS), due to impaired cardiac repolarization. Patients with Long-QT syndrome (LQTS) because of a loss-of-function mutation in KCNH2, encoding the hERG channel, displays an increased glucose-stimulated insulin secretion, defective glucagon secretion, and hypoglycemia. Recently, patients with LQTS have been associated with an increased risk of type 2 diabetes. We aimed to investigate the effect of a drug-induced (moxifloxacin) blockade of the hERG-channel on insulin and glucose regulation.
Materials and methods: We conducted a randomized, double-blinded, crossover study with 40 healthy participants who underwent two 6-hours oral glucose tolerance tests (OGTT) (3 weeks washout period) with either the selective hERG-blocker (the antibiotic moxifloxacin 800 mg/day) or placebo given for four consecutive days, last dose two hours before the OGTT. The two testdays consisted of a 6-hour oral glucose tolerance test with ECG measurements, blood samples and continuous glucose monitoring.
Results: A total of 39 participants finished the intervention per protocol (49% females, age 25.7 ± 0,7 and BMI 23.6 ± 0.4). The QTcF interval were significant prolonged at the moxifloxacin testday. The insulin AUC for the whole testday were significant lower on the moxifloxacin testday compared to the placebo testday (-1368 mu/ml ,95% CI -1855:-880, p-value = 1.835e-06). The glucose AUC were not sigficant different between the moxiflocaxin testday and placebo testday. Matsuda index increased 1.16 (95% CI -1.9; -0.4, p-value = 0.004) from the placebo testday to moxifloxacin testday. HOMA-IR were similar -0.1 (95% -0.3: 0.1, p=0.2).
Conclusion: Acute drug-induced hERG blockade by moxifloxacin unexpectedly decreases insulin secretion, with a similar glucose response, thereby increasing insulin sensitivity in healthy young participants.
Clinical Trial Registration Number: NCT03868657
Supported by: Independent Research Fund Denmark, Lundbeck Foundation and the Danish Heart Association
Disclosure: C. Juhl: Grants; Independent Reasearch Fund, Denmark.
480
Serpina3c protected against high fat diet induced pancreatic dysfunction
J. Ji;
Cardiology, Southeast University, Nanjing, China.
Background and aims: SerpinA3 is a member of the serine protease inhibitor family, and is involved in the inflammatory response. In this study, we investigated serpinA3c on pancreatic function in hypercholesterolemia mice.
Materials and methods: To investigate the role of serpinA3c, serpinA3c knockdown mice were generated by Cre/LoxP-mediated gene targeting in Apoe-/- mice. C57 (NC), serpinA3c-/- (S-/-), Apoe-/- (A-/-), and Apoe-/-serpinA3c-/- (A-/-S-/-) mice were under normal feeding, and another two groups, A-/- and A-/-S-/- mice were under high fat diet (HFD) treatment. After feeding for 3 months, the mice were monitored for body weight, blood glucose, and glucose tolerance; enzyme linked immunosorbent assay (ELISA) and immunohistochemistry were used to detect the insulin and glucagon expression. CD68 staining of the pancreas was also detected by immunohistochemistry.
Results: The blood glucose and glucose tolerance were no significant abnormalities among the groups. SerpinA3c counteracted blood lipids abnormalities in mice under HFD treatment. The insulin secretion was decreased in A-/-S-/- mice compared with A-/- mice under normal feeding. In addition, A-/-S -/-mice increased insulin and glucagon expression after three months of HFD treatment, but insulin secretion was decreased in A-/-S-/- mice comparing with A-/- mice after the fifth month HFD condition. Further, serpinA3c knockout significantly up regulated the number of CD68 positive macrophgas in pancreas under HFD.
Conclusion: The results showed that serpinA3c could play a protective role in insulin secretion partly under HFD condition.

Supported by: National science foundation of China (6590000221)
Disclosure: J. Ji: None.
481
Microvascular dysfunction is associated with beta cell function in the fasting state: The Maastricht Study
W. Li1, M. Schram1, S. Sep1, T. Berendschot2, C. Webers2, A. Kroon1, C. van der Kallen1, R. Henry1, S. Eussen3, N. Schaper1,4, P. Dagnelie1, M. van Greevenbroek1, C. Schalkwijk1, C. Stehouwer1, A. Houben1;
1Internal Medicine, Maastricht University Medical Center+, Maastricht, 2Department of Ophthalmology, Maastricht University Medical Center+, Maastricht, 3Department of Epidemiology, Maastricht University, Maastricht, 4School for Public Health and Primary Care (CAPHRI), Maastricht University, Maastricht, Netherlands.
Background and aims: Islet microvascular dysfunction (MVD) may be a potential target to attenuate the progression of beta-cell dysfunction. Recent experimental studies suggest that dysfunction of islet microcirculation may lead to insufficient delivery of oxygen and nutrients to the islet as well as an attenuated insulin’s entry into the circulation, which may impair beta-cell function. However, at present no in vivo human data are available. We therefore investigated the association of generalized MVD with fasting insulin secretion as well as glucose-stimulated insulin secretion in a population-based cohort study.
Materials and methods: In 2275 participants without a history of type 2 diabetes in The Maastricht study (47.6% men, aged 59.0±8.2 years, including n=112 newly-diagnosed type 2 diabetes), we performed an OGTT to assess beta-cell function in fasting state (C-peptide to glucose ratio t0 (CP0/G0)), and glucose-stimulated insulin secretion in the early phase (C-peptide to glucose ratio t30min (CP30/G30)) and the late phase (C-peptide to glucose ratio t120min (CP120/G120)). We also determined generalized MVD as measured by plasma biomarkers of MVD (Von Willebrand factor, soluble E-selectin, soluble intercellular adhesion molecule-1, and soluble vascular cell adhesion molecule-1), urinary albumin excretion, retinal microvascular diameters (central retinal arteriolar equivalent (CRAE), central retinal venular equivalent (CRVE)), flicker light-induced retinal microvascular dilation (Dynamic Vessel Analyzer), and heat-induced skin hyperemia (laser-Doppler flowmetry). Associations were adjusted for age, sex, insulin sensitivity (Matsuda index), waist circumference, systolic blood pressure, smoking status, alcohol intake, lipid profile, and use of antihypertensive and/or lipid-modifying drugs.
Results: Multivariable adjusted analyses showed that higher plasma biomarkers of MVD (standardized beta (stB)=0.12, 95%CI (0.09 to 0.15), p<0.001), urinary albumin excretion (stB=0.04 (0.01 to 0.07), p=0.010), CRAE (stB=0.03 (0.001 to 0.07), p=0.044) and CRVE (stB=0.03 (0.0005 to 0.07), p=0.047) were significantly associated with higher CP0/G0 in fully adjusted analyses. With regard to glucose-stimulated insulin secretion, only higher plasma biomarkers of MVD (stB=0.08 (0.04 to 0.12), p<0.001) and urinary albumin excretion (stB=0.05 (0.01 to 0.09), p=0.018) were associated with higher CP120/G120. MVD was not associated with CP30/G30.
Conclusion: Generalized MVD is associated with higher insulin secretion in the fasting state in individuals without a history of type 2 diabetes, independently of insulin sensitivity and other cardiometabolic risk factors. The interpretation of these findings remains unclear, but may involve compensation for islet MVD, disturbed intra-islet cell communication, and/or enhanced insulin delivery.
Clinical Trial Registration Number: NL31329.068.10
Supported by: ERDF; Stichting De Weijerhors; PSI Diabetes; CARIM; CAPHRI; NUTRIM; Stichting Annadal; HFL
Disclosure: W. Li: None.
482
Relationship between insulin secretion and action and glucose variability in early stages of glucose intolerance
R. Dimova1, N. Chakarova1, S. Del Prato2, T. Tankova1;
1Department of Endocrinology, MU, Sofia, Bulgaria, 22Department of Clinical and Experimental Medicine, University of Pisa, Pisa, Italy.
Background and aims: It is still largely unknown whether glucose variability may increase in pre-diabetic states and whether this could be related to worsening of insulin secretion and insulin action. To address these questions, we have assessed insulin secretion and insulin sensitivity, and daily glucose variability (GV) in the early stages of dysglycemia.
Materials and methods: Twelve subjects with normal glucose tolerance (NGT; age 44.4±11.1 yrs; BMI 31.4±6.9 kg/m2), 16 with NGT and 1h-OGTT >8.6 mmol/l (1hPG; 45.9±9.7 yrs; 33.3±5.3 kg/m2), and 32 with impaired glucose tolerance (IGT; 49.2±11.8 yrs; 31.4±5.6 kg/m2) underwent a 75 g OGTT and a Mixed Meal Tolerance Test (MMTT) for assessment of glucose and insulin secretion. CGM was performed with blinded FreeStyle Libre Pro sensor for 24 hours under a standard meal plan and moderate physical activity. Parameters of beta-cell function, insulin sensitivity and glucose variability were calculated (Table).
Results: Overall insulin secretion and action indexes as well as GV parameters progressively worsened across glucose tolerance categories. On a matrix analysis, all GV parameters were inversely related to insulin sensitivity (ISSI-2; r= -0.24 to -0.45; all p<0.02 or less) as well as to beta-cell function (insulinogenic index; r=-0.24 to -0.45; all p<0.002 or less with the exception of J-index and HBGI).
Conclusion: Our results show that daily glucose variability worsens already with mild impairment of glucose tolerance. The increase in glucose variability is inversely related to insulin secretion and insulin action.

Supported by: EFSD Future Leaders Mentorship Programme
Disclosure: R. Dimova: None.
PS 33 Something more about obesity
483
Glycaemic effects and plasma exposure of steviol administration in type 2 diabetic mice
C. Simoens1,2, C. Wuyts1, K. Philippaert1, K. Beunen1,2, L. Khodaparast3, L. Khodaparast3, S. Goscinny4, J. Van Loco4, B. Van der Schueren2,5, R. Vennekens1;
1Laboratory of Ion Channel Research, Department of Cellular and Molecular Medicine, KU Leuven / VIB Center for Brain and Disease Research, Leuven, 2Clinical and Experimental Endocrinology, Department of Chronic Diseases, Metabolism and Ageing, KU Leuven, Leuven, 3Switch Laboratory, Department of Cellular and Molecular Medicine, KU Leuven / VIB Center for Brain and Disease Research, Leuven, 4Sciensano, Elsene, Belgium, 5Department of Endocrinology, UZ Leuven, Leuven, Belgium.
Background and aims: The TRPM5 ion channel is expressed in pancreatic β-cells where it is involved in the potentiation of glucose-induced insulin secretion. Steviol glycosides potentiate TRPM5 activity and enhance glucose-induced insulin secretion in high-fat diet-induced diabetic mice. Steviol, the core structure of steviol glycosides, potentiates TRPM5 activity in vitro. We hypothesize that steviol has similar effects as steviol glycosides at improving glucose homeostasis in vivo.
Materials and methods: C57/Bl6J mice were put on a 30% (w/w) high fat diet for 10-20 weeks to induce glucose intolerance. In these type 2 diabetic mice, the effect on glucose homeostasis is assessed with IPGTTs following acute oral (200 mg/kg; crossover), chronic oral (25 mg/kg/day; 10 weeks; control group) and i.v. (50 and 200 mg/kg; crossover) steviol administration. Plasma levels of steviol and steviol glucuronide were determined with HPLC-MS/MS following i.v. steviol administration (200 mg/kg; t=20 min and 2h) and chronic steviol administration (25 mg/kg/day; 12 weeks). Significance of the AUCGlucose (mean ± s.e.m.) was assessed with paired and unpaired t-tests.
Results: Steviol increased glucose levels (AUC0-2h(steviol) = 55.1 ± 1.3 x10³ h mg/dL; AUC0-2h(vehicle) = 50.0 ± 1.4 x10³ h mg/dL; p=0.053) 2 h following steviol administration. Following 10 weeks of daily steviol administration, steviol did not improve glucose homeostasis (AUC0-2h(steviol) = 47.1 ± 1.1 x10³ h mg/dL; AUC0-2h (vehicle) = 44.7 ± 1.8 x10³ h mg/dL; p>0.05). AUC glucose levels were also not reduced following i.v. steviol administration 50 mg/kg (AUC0-2h(steviol)= 59.4 ± 2.3 x10³ h mg/dL; AUC0-2h(vehicle)= 57.8 ± 1.6 x10³ h mg/dL, p>0.05) or 200 mg/kg (AUC0-2h(steviol) = 49.7 ± 2.7 x10³ h mg/dL; AUC0-2h(vehicle) = 49.6 ± 1.5 x10³ h mg/dL; p>0.05). Following i.v. steviol administration (200 mg/kg), however, AUC glucose levels were significant lower in the first 30 min of the GTT compared to vehicle (AUC0-30 min(steviol) = 9.2 ± 0.3 x10³ h mg/dL; AUC0-30 min(vehicle) = 12.1 ± 0.2 x10³ h mg/dL; p<0.05). At 20 min following steviol administration, plasma levels of steviol and steviol glucuronide were on average 3.8 ± 3.1 ng/mL and 252.6 ± 84.7 ng/mL, respectively. Plasma levels decreased 2 h after administration to 0.6 ± 0.3 ng/mL steviol and 99.8 ± 19.6 ng/mL steviol glucuronide. Following chronic administration, plasma levels of steviol and steviol glucuronide were respectively 1.2 ± 1.1 ng/mL and 10.7 ± 6.8 ng/mL.
Conclusion: Oral administration of steviol does not improve glucose homeostasis in type 2 diabetic mice. In the first 30 min of the IPGTT following a high dose of steviol i.v., AUC glucose levels are significantly lower compared to vehicle. Following 2h administration of steviol, exposure of steviol and steviol glucuronide in plasma is low and substantially below reported effective concentrations that exert an effect on the TRPM5 ion channel present in the insulin secreting β-cells.
Supported by: C1 TRP Research Platform Leuven (TRPLe)
Disclosure: C. Simoens: None.
484
The role of peripheral serotonin and its interaction with other hormones in male Wistar rats with obesity and obesity-induced diabetes, studied by using of LP533401
I. Bogomilov1, I. Daskalova2, V. Mihneva2, R. Nikolov3, N. Boyadjieva3;
1Military Medical Academy-Sofia/Medical University of Sofia, Sofia, 2Military Medical Academy-Sofia, Sofia, 3Medical University of Sofia, Sofia, Bulgaria.
Background and aims: 95% of serotonin is produced in the periphery, but its functions have been ignored until now. Recently it became clear that the serotonin system in the periphery regulates multiple physiological aspects independently of the brain-derived serotonin. In particular, peripheral serotonin plays a pivotal function in the regulation of glucose and lipid homeostasis by acting on different organs and cell types. In previous researches that we made, using the Tph1 inhibitor - LP533401 (peripheral serotonin inhibitor) it shows that this agent could be use for treatment of obesity and obesity-induced diabetes in male Wistar rats. LP533401 significantly reduces hyperglycemia and peripheral insulin resistance and further reducing body weight. Because of these outcomes, with current study we aimed to look more detailed in to fine mechanisms of action of serotonin related with other hormones such as ghrelin and leptin.
Materials and methods: We used forty Wistar rats separate in 2 groups- rats with induced obesity and diabetes and healthy rats (control group). Each of this groups was separated in other 2 - one with daily intraperitoneal injection of LP533401 ( 0,5 mg/kg) and one without. In 4 weeks period, we were tracking different factor- blood glucose level, insulin secretion, rats weight, blood levels of ghrelin and leptin. We measured the level of ghrelin and leptin in the beginning of the study and in the beginning of every week just before the meal. The differences in the mean values among the groups are greater than would be expected by chance; there is a statistically significant difference (P = <0.001) using SPSS program
Results: After application of LP533401, the blood levels of ghrelin starts to change. In the group with diabetic and obese rats using LP544401, the levels of ghrelin decreased of 5,4% for the first week till 12,2% in the fourth week (P<0,05), and with 9,4% (in total) in the control group. No significant dynamic of the levels of ghrelin in the groups without daily intraperitoneal injection of LP533401. Also there were significantly reduction of hyperglycemia and peripheral insulin resistance and further reducing body weight not only in the obese and diabetic rats group, but also in the control group using LP533401 and no dynamics into other groups. In the beginning of the study, the levels of leptin were around 3 times higher in the diabetic and obese rats’ groups both using LP533401 or not, most probably because of the developed leptin resistance which is known in obesity. During the study, the leptin level in the diabetic and obese rats group using LP533401 decrease with 54,4% from the start point(P<0,05). In the diabetic and obese rats group in which we were not using LP533401, the levels of leptin raised with 5,4 %, but this is not a significant change. No significant dynamic in the level of leptin in the control groups.
Conclusion: Using LP533401 inhibitor significantly decrease fasting blood level of ghrelin in rats with induced obesity and diabetes, which corresponded with their weight loss and reduction of hyperglycemias . The level of leptin in the group whit diabetic and obese rat using LP533401, also decrease significantly together with their weight loss, which leads us to the conclusion for decreasing of leptin resistance in this group.
Disclosure: I. Bogomilov: None.
485
Correlation of plasma leptin and resistin with novel subgroups of type 2 diabetes
J. Huang, Y. Yang;
Endocrinology, Tongji Hospital, Tongji Medical College, Huazhong University of Science and Technology, Wuhan, China.
Background and aims: A refined classification of diabetes has been made to provide valuable information for precision medicine and individualized treatment. There is no doubt that leptin has many distinctive advantages in lowering glucose levels but the application was limited. The function of resistin in obesity and insulin resistance remains controversial. Our study aimed to analyze the association between adipocytokines (mainly including leptin and resistin) and the novel subgroups of type 2 diabetes. This may deep our understanding about the traits of leptin and resistin from a new perspective.
Materials and methods: We used k-means analysis to cluster 541 type 2 diabetic patients into four groups: mild obesity-related diabetes (MOD), severe insulin-deficient diabetes (SIDD), severe insulin-resistant diabetes (SIRD) and mild age-related diabetes (MARD). After excluding the subjects with incomplete clinical data, we made the analysis of leptin and resistin in 285 patients. Characteristics were determined using standard laboratory techniques. The levels of plasm leptin and resistin were measured by the enzyme-linked immunosorbent (ELISA) assay.
Results: Plasm leptin showed highest level in MOD group (P<0.001) and resistin was markedly elevated in the SIRD group (P=0.024). In a multiple correlation analysis, leptin was independently associated with body-mass index (BMI) (r = 0.508, P < 0.001). There was a significant relationship between renal function and resistin, including glomerular filtration rate (r=-0.339, P<0.001) and an albumin to creatinine ratio (r=0.380, P<0.001). The logistic regression indicated that circulating resistin level was significantly associated with a higher diabetic nephropathy risk (OR=2.332, 95% CI 1.148-4.735, P=0.019). Moreover, this relationship was independent of HOMA-IR. The area under the curve (AUC) of resistin (0.748, 95% CI 0.610-0.887) was greater significance than that of HOMA-IR (0.447, 95% CI 0.280-0.614) by Receiver operating characteristic (ROC) curve analysis in SIRD group (P<0.05).
Conclusion: Our findings indicated that leptin level varied in different subgroups of diabetes. SIDD and SIRD group had lower level of leptin that may be suitable for leptin therapy. The elevated level of resistin was only found in some specify diabetes (the SIRD group ) and it was closer associated with diabetic nephropathy than insulin resistance.
Supported by: NSFC
Disclosure: J. Huang: None.
486
Hypercortisolism and altered glucose homeostasis in obese patients in the pre-bariatric surgery assessment
E. Muraca1, S. Ciardullo1,2, S. Perra1, F. Zerbini1, A. Oltolini1, R. Cannistraci1,2, E. Bianconi1, M. Villa3, G. Manzoni1, G. Lattuada1, G. Perseghin1,2;
1Department of Medicine and Rehabilitation, Policlinico di Monza, Monza, 2Department of Medicine and Surgery, Università degli Studi Milano-Bicocca, Monza, 3Clinical Psychology, Policlinico di Monza, Monza, Italy.
Background and aims: Hypothalamus-pituitary-adrenal axis hyperactivity was suggested to be associated with the metabolic syndrome, obesity and diabetes, both from a metabolic and clinic point of view. The aim of this study was to test whether hypercortisolism was associated with altered glucose homeostasis, hypertension and dyslipidemia in a homogeneous population of obese patients.
Materials and methods: Retrospective analysis of a set of data about obese individuals attending the outpatient service of a single obesity center between January 2013 and January 2020. 884 patients were segregated in two subgroups: patients with urinary free cortisol higher than normal (UFC+; n=129) or within the normal range (UFC–; n=755). They were studied according to glycemic (euglycemic, prediabetes or diabetes), hypertensive (normal, elevated or high) and dyslipidemic (normal, dyslipidemia, lipid therapy) status. The euglycemic patients were segregated into tertiles of HOMA2-IR to compare the most insulin sensitive (first tertile <1.53) with the most resistant (second and third tertiles ≥1.53).
Results: The overall prevalence of UFC+ was 14.6% and double test positivity was detected in 1.0% of patients (morning cortisol >50 nmol/L following overnight dexamethasone suppression test). Prediabetes (OR 1.74; 95%CI 1.13-2.69; p=0.012) and diabetes (OR 2.03; 95%CI 1.21-3.42; p=0.008) were associated with higher risk of UFC+, also when analysis was adjusted for confounding variables as gender, BMI, previous gastric banding, percent body fat and HOMA2-IR. Conversely, hypertension and dyslipidemia were not related to UFC+. Within the euglycemic individuals those with higher estimated insulin resistance maintained a higher risk of UFC+ (OR 2.84, 95%CI 1.06-7.63; p=0.039) compared to the most sensitive.
Conclusion: In obese patients and in a real world setting, hypercortisolism was more frequent across the entire spectrum of altered glucose homeostasis, from the earlier stages to T2DM, with a tight control of anthropometric features; this relation could not be detected for the other criteria of the metabolic syndrome, as waist, hypertension and atherogenic dyslipidemia.
Disclosure: E. Muraca: None.
487
Augmented cortisol-axis and symptom response to hypoglycaemia in individuals with overweight and insulin resistance
M.H. Lundqvist1, K. Almby1, U. Wiklund2, N. Abrahamsson1, P.G. Kamble1, M.J. Pereira1, J.W. Eriksson1;
1Department of Medical Sciences, Uppsala University, Uppsala, 2Department of Radiation Sciences, Umeå University, Umeå, Sweden.
Background and aims: An important role of the CNS in the pathogenesis of type 2 diabetes (T2D) has been suggested and is supported by animal studies. The brain senses fluctuations in systemic glucose levels and modulates glucoregulatory hormones and autonomic nerve activity to balance glucose levels. We hypothesize that the brain’s setpoint for glucose is gradually shifted upwards in the development of T2D. The aim of this study was to investigate if the neuroendocrine response to varying glucose levels differ in overweight and insulin-resistant compared to control subjects.
Materials and methods: 30 subjects with no diagnosis of diabetes were recruited and allocated into two groups based on the median BMI: LO [BMI 23.4 kg/m2(Range 18.9-26.9)] and HI [BMI 32.0 (27.0-48.7) kg/m2]. Age and gender distribution were similar. On two separate occasions and in a randomized order, stepwise hypoglycemic (nadir 2.7 mM) and hyperglycemic (max +9 mM) clamps were performed with repeated measurements of hormones (glucagon, cortisol, ACTH, growth hormone), assessment of symptoms according to the Edinburgh Hypoglycemia Symptom Scale (ESS) and monitoring of heart rate variability (HRV). Mann-Whitney U-tests were used for group-wise comparisons.
Results: In HI vs LO the response to hypoglycemia was augmented for both cortisol [∆AUC 12382 nM*min (IQR 7058;15705) vs 4792(-1200;11498, p=0.045] and ACTH [∆AUC 448.3 pM*min (373.5;702.0) vs 162.0 (125.3;397.5), p=0.015]. Subjects in HI reported higher peak ESS Scores [21 (19;23) vs 18 (14;21), p=0.045] during hypoglycemia. By contrast, subjects in HI had loss of suppression of PHF (an HRV marker of parasympathetic nerve activity) during hypoglycemia [0.035 ms2log (-0.353;0.188) vs -0.219 ms2log (-0.476;-0.132), p= 0.024]. The above perturbations were independently associated with insulin resistance but not with obesity per se according to multilinear regressions (Table). During hyperglycemia there was a trend toward higher glucagon levels in HI vs LO [AUC 539.5 pM*min (336.9;617.2) vs 390.5 pM*min (244.5;476.2), p=0.085). Subjects in HI had lower mean PLF/ PHF ratio, a marker of balance between sympathetic and parasympathetic nerve activity [0.383 (0.260;0.568) vs 0.154 (0.081;0.299), p=0.005].
Conclusion: Overweight, insulin-resistant subjects had more symptoms during hypoglycemia and this was combined with central cortisol axis overactivity via pituitary ACTH release, altogether suggesting altered CNS responses. They also had less dynamic autonomic nerve activity. These neuroendocrine alterations were associated with insulin resistance independent of obesity, supporting a role of the brain in raising the glycemic setpoint in the development of T2D.

Supported by: The Swedish Diabetes Foundation, Ernfors foundation, EXODIAB, ALF
Disclosure: M.H. Lundqvist: None.
488
Dysregulated status of neuropeptides CRH,UCN1,2 and SPEXIN with BMI in children
S. Kavalakatt1,2, A. Khadir1, D. Madhu1, J. Tuomilehto3,4, F. Al Mulla1, J. Abubaker1, A. Tiss1;
1Research Division, Dasman Diabetes Institute, Dasman, Kuwait, 2Faculty of Medicine, Doctoral Programme in Biomedicine, University of Helsinki, Finland, 3Department of Public Health, Department of Public Health, University of Helsinki, Finland, 4Department of Public Health Solutions, Department of Public Health Solutions, University of Helsinki, Finland.
Background and aims: Childhood obesity has attained critical public concern in the modern world with associated risk in endocrine, metabolic and cardiovascular comorbidities. Studies show that over 85% of type 2 diabetic children at diagnosis are either overweight or obese. Further, the SEARCH study reported that compared to boys with type 1 diabetes, boys with Type 2 Diabetes ( T2D) were 3.5 times more likely to report depression and clinically significant binge eating. The corticotropin-releasing factor (CRF) family of peptides (CRF,Urocortin (UCN) 1 and 2) and Spexin neuropeptides are involved in stress responses, energy homeostasis and feeding behavior. Our study aims at investigating the possible effect of BMI and T2D on the status of these neuropeptides in children.
Materials and methods: The study population consisted of 133 children with 13 diabetics and 120 non-diabetic children (21 normal weight, 14 overweight and 85 obese) having mean age of 12 years. Study was conducted in accordance to ethical guidelines of Declaration of Helsinki. Venous peripheral bloods were collected for anthropometric measurements and blood biochemistry analysis. Plasma levels of metabolic markers were measured using Bioplex-200 system. The circulating levels of CRF, UCN1, 2 and Spexin were assessed using ELISA assays. All analyses were done using SPSS software and statistical significance was considered at p<0.05.
Results: Circulating levels of UCN2 were significantly higher in the overweight group (1.8 μg/ml) compared to normal weight group (1.5 μg/ml),p=0.044 while UCN1 plasma levels were markedly decreased in the overweight group (15.59 pg/ml) compared to normal weights (37.71 pg/ml)p=0.038. On the other hand, in comparison to the normal weight groups, both in the obese and diabetics, there were no evident differences. Further, there were slight increase in both CRF and spexin levels when compared to normal weight groups in overweight, but minimal difference in obese or diabetic groups. Effect of age or gender between the groups were not prominent. Strong positive correlations were observed between CRH and UCN2(r = 0.516,p < 0.001) and both of them with obesity markers (Adiponectin, Leptin, NGAL, RBP4 and ZAG),r > 0.35,p < 0.001 .On the other hand CRH and UCN2 showed negative correlation with liver function enzymes( ALT,AST and Alkaline phosphatase), r > 0.3,p < 0.001 .Also, UCN1and Spexin had significant positive correlation,r=0.315,p <0.001,however, both had negative correlation with CRH and UCN2, r>0.3,p<0.001.
Conclusion: A strong correlation between obesity markers and dysregulated neuropeptide plasma levels in children indicate that increase in body mass index (BMI) impair their circulating levels.This may suggest the role of the peripheral secretion of these peptides in metabolic disorders leading to early onset of T2D. Hence, prospective studies are required to study their roles and impairment effects in the developement of obesity related comorbidities such as T2D.
Supported by: Kuwait Funding For Advancement of Sciences
Disclosure: S. Kavalakatt: None.
489
In obese patients at high risk of diabetes, cardiac autonomic dysfunction is associated with higher blood glucose levels and early insulin resistance markers
P. Valensi1, I. Banu2, E. Hamo1, S. Chiheb1, S. Chetouane1, E. Cosson3;
1Diabetology-Endocrinology-Nutrition, AP-HP, Jean Verdier Hospital, CRNH-IdF, CINFO, Paris-Nord University, Bondy, 2Diabetology-Endocrinology-Nutrition, Saint Joseph Hospital, Paris, 3Diabetology-Endocrinology-Nutrition, AP-HP, Avicenne Hospital, CRNH-IdF, CINFO, Paris-Nord University, Bobigny, France.
Background and aims: Some new metabolic indexes combining anthropometric (waist circumference, BMI) and lipid (triglycerides, HDL-cholesterol) parameters have been shown to be early markers of insulin resistance and predictors of incident type 2 diabetes. The aim of this study was to examine, in obese patients at risk of diabetes, the relationship of cardiac autonomic dysfunction (CAD) and metabolic disorders and these new indexe.
Materials and methods: We included 462 patients without known diabetes, age 37.8±14.5 years, BMI 37.2±7.1 kg/m2. CAD was defined by having one or more abnormal tests among three tests of heart rate variability depending mostly on vagal control (Valsalva, deep-breathing, lying-to-standing). The 10-years risk of diabetes was considered elevated if Findrisk score was ≥12. Total cholesterol, triglycerides and HDL-cholesterol were measured, and LDL-cholesterol was calculated (Friedewald formula). Plasma glucose (G0 and G120) and insulin were measured at fasting and 2 hours after an oral glucose challenge. The new combined metabolic indexes: visceral adiposity index (VAI), lipid accumulation product (LAP) and TyG index [log (triglycerides x fasting glucose)], several insulin resistance indexes (HOMA-IR, Matsuda, QUICKI, FIRI, Gutt, ISIT0 and ISIT120), and HOMA-insulin secretion index were calculated.
Results: CAD was present in 198 patients. Findrisk was ≥ 12 in 227 patients. Among the patients with Findrisk ≥ 12, 48.5% were CAD+. The patients were separated in 4 groups: CAD- with Findrisk < 12 (G1), CAD- with Findrisk ≥ 12 (G2), CAD+ with Findrisk < 12 (G3) and CAD+ with Findrisk ≥ 12 (G4). G0 (p=0.002), G120 (p=0.03), logHOMA-IR (p=0.01), TyG (p=0.04) and LAP (p=0.007) differed between the four groups and were significantly higher in G4 than in G1. Lipid parameters, VAI, the other insulin resistance indexes and HOMA-insulin secretion index did not differ significantly between the four groups.
Conclusion: These data indicate that in obese patients at high risk of diabetes, CAD is associated with higher glycemic levels and with early markers of insulin resistance and suggest the role of vagal defects and sympathetic predominance in these disorders.
Disclosure: P. Valensi: None.
490
The association between renal fat amount and renal threshold for glucose
J. Chen1, J. Yu1, Z. Sun2;
1Jiangsu Province Hospital of Chinese Medicine, Nanjing, 2Zhongda Hospital, Nanjing, China.
Background and aims: The role of kidney in glucose homeostasis has become an attractive research topic in the fields of pathogenesis and management of diabetes mellitus. In addition to its important role in gluconeogenesis and glucose utilization, the kidney maintains glucose homeostasis primarily through glucose reabsorption. Moreover, visceral lipid accumulation is involved in a variety of physiological aberrations. However, little is known regarding the potential role of lipid accumulation in renal glucose reabsorption. The aim of this study was to investigate the association between renal fat amount and renal threshold for glucose (RT).
Materials and methods: 20 healthy subjects and 20 subjects with diabetes were recruited in this study. We examined the renal fat amount in normal subjects and patients with diabetes using magnetic resonance imaging (MRI). RT of each subject was assessed. Clinical parameters and demographic characteristics were assessed. Pearson correlation analysis and partial correlation analysis were carried out to analyze the association between renal fat amount and RT.
Results: Subjects who failed holding their breath during MRI scanning (n = 5) or dropped out this study (n = 2) were excluded. Finally, a total of 33 subjects were included in the data analysis. As shown in Figure 1, individuals with body mass index (BMI) ≥ 24kg/m2 exhibited significantly higher renal fat fraction (RFF) than those with BMI < 24kg/m2 (3.90% ± 1.09% vs 2.90% ± 1.06%, p < 0.05). Besides, significantly increased RFF was also observed in subjects with diabetes or those with RT greater than 8 mmol/L. In addition, RFF was positively associated with BMI and waist-to-hip ration (WHR) (r = 0.372, p = 0.033; r = 0.537, p = 0.001, respectively). Moreover, significant and positive associations of BMI, WHR, and RFF with RT were found. The correlation between RFF and RT was strongest (r = 0.647, p < 0.001). However, after adjusting for mean blood glucose, age, gender, diabetes status, estimation of the glomerular filtration rate (eGFR) and blood pressure (BP), RFF was still positively associated with RT, whereas BMI and WHR were not significantly correlated with RT. Furthermore, when further controlling for BMI and WHR, the positive association of RFF with RT still remained significant (r = 0.433, p = 0.039).
Conclusion: Renal fat amount may be a crucial determinant of RT. Our study provides evidence that excessive lipid accumulation in the kidney may play an important role in increased renal glucose reabsorption.

Disclosure: J. Chen: None.
PS 34 More about metabolism
491
Insulin and muscle contraction-induced GLUT4 traffic: integration within specific phosphorylation-patterns of the downstream target TBC1D4
S. Eickelschulte1,2, S. Hartwig1,2, V. Joschko1, S. Lehr1,2, A. Chadt1,2, H. Al-Hasani1,2;
1Institute of Clinical Biochemistry and Pathobiochemistry, German Diabetes Center, Düsseldorf, 2German Center for Diabetes Research, München-Neuherberg, Germany.
Background and aims: Inactivating mutations in the Rab-GTPase-activating protein (RabGAP) TBC1D4 have been described to be associated with type 2 diabetes. TBC1D4 is a downstream target of insulin and contraction-activated kinases AKT and AMPK and phosphorylation of TBC1D4 is essential for GLUT4 translocation from storage vesicles to the plasma membrane. However, the exact phosphorylation sites and how AKT and AMPK signaling are integrated at the RabGAP level and linked to glucose transport in skeletal muscle are unknown.
Materials and methods: We expressed and purified recombinant full-length TBC1D4 in Sf9 cells via the Baculovirus system and performed kinase assays using purified AKT and AMPK in vitro. Mapping of the phosphorylation sites of TBC1D4 was performed using stable isotope technologies [γ-18O4]ATP and mass spectrometry (MS). We also conducted kinase assays employing phosphosite-specific antibodies to draw the exact TBC1D4 phosphorylation pattern and kinase target preference using non-linear curve fitting to Michaelis-Menten kinetics. To mimic the effect of exercise prior to insulin action, TBC1D4 was phosphorylated first by AMPK and then AKT to investigated whether phosphorylation of TBC1D4 in specific sites may impact (i.e. inhibit or enhance) phosphorylation of other sites.
Results: : Our MS data show that TBC1D4 is phosphorylated at Ser189, Ser324 and Thr649 by AKT and at Ser348, Thr455, Ser577 and Ser711 by AMPK while Ser595 is phosphorylated by both AKT and AMPK. Michaelis-Menten kinetics data indicate that AKT preferably phosphorylates Ser324 with a higher affinity compared to Thr649 and Ser595. On the other hand, AMPK preferably phosphorylates Ser595 and has a very low affinity towards Ser324. We also found that prior AMPK phosphorylation of TBC1D4 inhibits phosphorylation of Ser324 located in the second PTB domain of TBC1D4. This inhibitory effect was abolished when only PTB domains of TBC1D4 were used as the substrates for AKT and AMPK showing that AMPK phosphorylation outside of the PTB domains inhibits Ser324 phosphorylation.
Conclusion: Our results show for the first time comparative kinetic data on TBC1D4 phosphorylation in response to activation of AKT and AMPK. These data suggest that both insulin and contraction signaling are transduced through specific kinases, AKT and AMPK and integrated within specific phosphorylation-patterns of TBC1D4.
Disclosure: S. Eickelschulte: None.
492
Transcriptional profiling of muscle cells exposed to hyperinsulinaemia reveals novel regulators of insulin signalling genes
H. Cen, S. Wang, N. Noursadeghi, J.D. Johnson;
University of British Columbia, Vancouver, Canada.
Background and aims: Hyperinsulinemia may contribute to insulin resistance but the precise mechanisms by which high levels of insulin can cause insulin receptor and post-receptor downregulation remain poorly defined. We previously established an in vitro model wherein prolonged treatment with high insulin (2 or 200 nM) significantly blunted acute AKT and ERK signaling stimulated by 0.2 - 20 nM insulin after serum starvation. INSR protein was significantly downregulated by hyperinsulinemia in an insulin-dose-dependent manner. Mechanistically, we found that hyperinsulinemia strongly downregulated Insr transcription, which was correlated with increased threonine 24 phosphorylation of FOXO1. Here, we aimed to further investigate the transcriptomic changes during hyperinsulinemia and to identify new molecular targets using an unbiased genome-wide approach.
Materials and methods: Our in vitro hyperinsulinemia muscle cell model was established by incubating differentiated C2C12 myotubes with 200nM insulin for 16 hours, followed by 6 hours of serum starvation as an insulin removal period. We conducted RNA sequencing (RNAseq) for 5 biological replicates in 4 treatment groups (0 nM or 200 nM insulin, both before and after serum starvation) to map the effects of prolonged insulin and serum starvation.
Results: Principal component analysis of RNAseq data showed distinct clustering by hyperinsulinemia or starvation after hyperinsulinemia, but not by starvation itself. Through KEGG pathway enrichment analysis, we found that the top pathways upregulated by hyperinsulinemia were related to transcription, translation and DNA repair, while the top downregulated pathways included FOXO signaling, RAS and MAPK signaling. Many of these downregulated pathways were partially recovered by starvation. Of note, many genes of key insulin signaling proteins were downregulated by hyperinsulinemia, including Insr, Irs1, Irs2, Akt3, Pik3ca, Pik3cb, and Pik3r3. We bioinformatically predicted the upstream transcriptional regulators for insulin signaling genes during hyperinsulinemia and conducted siRNA knockdown for each predicted transcription factor. SIN3A, which is transcriptionally upregulated by hyperinsulinemia, was identified as a negative regulator of Insr mRNA levels. We also identified JUND, MAX, and MXI as positive regulators of Irs2 mRNA.
Conclusion: Our transcriptomics data revealed strong, reciprocal effects of prolonged hyperinsulinemia and insulin removal on insulin signaling genes. We identified novel transcription factors for Insr and Irs2 genes among the predicted upstream transcriptional regulators. Together, our findings shed new light on the mechanisms underlying hyperinsulinemia-induced insulin resistance in muscle cells, which are likely to be relevant in the pathogenesis of type 2 diabetes.
Supported by: CIHR
Disclosure: H. Cen: None.
493
IDE-driven impairment in hepatic insulin clearance impacts glucose uptake
D.O. Borges1, N. Duarte2, C. Penha-Gonçalves2, M.P. Macedo1,3;
1Metabolic Disorders Group - MEDIR, NOVA Medical School, Lisbon, 2Genetic Diseases Group, Instituto Gulbenkian de Ciência, Oeiras, 3Department of Medical Sciences, University of Aveiro, Aveiro, Portugal.
Background and aims: Impaired glucose tolerance is the most frequent feature of prediabetic subjects. At this stage, hyperinsulinemia is observed associated with an impairment in hepatic insulin clearance (HIC) and/or an increase in β-cell secretory capacity. In the case of HIC, we observed that liver-specific insulin-degrading enzyme knockout (LS-IDE KO) model suggests a role for IDE in HIC and the development of glucose intolerance. However, the exact contribution of how hepatocyte IDE deficiency impacts on liver dysmetabolism is not disclosed. Our hypothesis is that IDE-associated impairment on insulin metabolism will affect the expression of glucose transporters in the liver, reducing liver capacity to internalize glucose, and thus leading to an increase in postprandial glucose excursions.
Materials and methods: LS-IDE KO and wild type (WT) controls were used in C57Bl/6 background. Animals underwent normal chow diet (NCD) or high-fat diet (HFD) for 12 weeks. Evaluation of the main glucose transporter at the liver, GLUT2, was assessed by mRNA and protein expression. The mRNA expression of glucokinase (GCK gene) was measured as an indicator of liver capacity to retain glucose. To estimate hepatocyte glucose uptake, primary hepatocytes were isolated from WT and LS-IDE KO animals, and the internalization of a fluorescent glucose analog was tested ex vivo.
Results: LS-IDE KO presented an impairment in HIC associated with the typical glucose-intolerant phenotype. At liver of LS-IDE KO, Glut2 mRNA expression was reduced when compared to WT. A similar decrease was observed in HFD WT animals associated with an impairment in liver IDE activity. Additionally, GLUT2 protein expression followed the same reduction trend observed by mRNA levels, suggesting an impairment in hepatic glucose uptake. GCK mRNA expression was reduced in the livers of LS-IDE KO when compared to WT, suggesting less capacity to retain glucose. Finally, in primary hepatocytes of LS-IDE KO, a 40% reduction in glucose uptake was observed when compared to WT hepatocytes (P<0.0001).
Conclusion: These results suggested that liver IDE expression is crucial for postprandial glucose homeostasis. In case of insufficient IDE function (deletion or/and HFD), the compensatory hyperinsulinemia suppresses protein levels of GLUT2 and hepatic glucose uptake contribution to the maintenance of euglycemia. When IDE was completely absent at hepatocytes, an impairment in GCK was further observed, a critical sensor of glucose homeostasis. Therefore, IDE-driven impairments in HIC seems to impact in pathological progression to type 2 diabetes by coupled mechanisms.
Supported by: PTDC/BIM/MET/2115/2014
Disclosure: D.O. Borges: None.
494
Dopamine acts through distinct mechanisms in liver, adipose tissue and skeletal muscle regulating glucose uptake and insulin receptor and AMPK phosphorylation
G. Tavares1, B.F. Melo2, F.O. Martins2, P. Matafome1,3, S.V. Conde2;
1Institute of Physiology and Institute of Clinical and Biomedical Research (iCBR), Faculty of Medicine, Coimbra, 2CEDOC, NOVA Medical School, Faculdade de Ciências Médicas, NOVA University, Lisbon, 3Instituto Politécnico de Coimbra, Coimbra Health School, Coimbra Portugal, Coimbra, Portugal.
Background and aims: Dopamine is a key cellular mediator with an important role in the central nervous system control of glucose metabolism. In agreement with this role, bromocriptine (BR), a D2 receptor agonist, is an FDA approved drug for the treatment of type 2 diabetes. Dopamine production and its signalling machinery were found in several peripheral organs. In this work, we investigate the role of dopamine and the involvement of distinct dopamine receptors families on glucose uptake and phosphorylation of insulin receptor and AMPK in insulin-sensitive tissues.
Materials and methods: Glucose uptake experiments were performed in fasted male Wistar animals: 1) in vivo: in animals injected trough the tail vein with 100 nmol of dopamine and challenged by gavage with a radiolabelled glucose bolus ([3H]2-deoxyglucose (2-DG)) (100μCi/ kg body weight) and; 2) ex vivo in the liver, soleus muscle and white adipose tissues incubated with 2-DG (500nM in 1,5 ml final volume). In the ex vivo experiments tissue explants were incubated with dopamine (10μM) or bromocriptine, BR (10μM), alone or with insulin (10mU/ml) in the presence or absence of selective D2R antagonist domperidone (DOMP, 50nM) and non-selective dopaminergic antagonist haloperidol (HALO, 500nM). 2-DG uptake was assessed by liquid scintillation counting and IR and AMPK phosphorylation were analysed by Western Blot.
Results: : In vivo glucose uptake increased upon dopamine administration (100 nmol) in the liver (p<0.05), epididymal white adipose tissue (p<0.05), kidney (p<0.01), soleus muscle (p<0.01) and brown adipose tissue (p<0.05). In ex vivo experiments, dopamine increased glucose uptake in the soleus by 47% and BR increased by 48% in the liver, effects reverted by HALO and DOMP respectively. In the adipose tissue, DOMP reverted BR- and dopamine mediated potentiation of insulin-induced glucose uptake. Moreover: 1) Adipose tissue AMPK phosphorylation decreased by 44% in the presence of BR an effect reverted after DOMP incubation; IR phosphorylation increased after DOMP incubation (70% in BR + Domp + Insulin condition and 156% in dopamine + Domp + Insulin incubation); 2) In the liver AMPK phosphorylation decreased after DOMP incubation with BR (26% and 22% in BR + Domp and BR + Domp + Insulin respectively); 3) In the soleus AMPK phosphorylation increased by 90% with BR and by 47% dopamine, effects reversed after incubation with DOMP and HALO.
Conclusion: Our results suggest that different dopamine receptors are involved in glucose uptake and regulation of insulin receptor and AMPK phosphorylation in the liver, adipose tissue and skeletal muscle. Modulation of peripheral dopaminergic signalling in insulin-sensitive tissues could constitute a therapeutic target to treat metabolic disorders such as obesity, type 2 diabetes and metabolic syndrome.
Supported by: FCT (PD/BD/127822/2016), Portuguese Society for Diabetes and GIFT, CEDOC and iCBR
Disclosure: G. Tavares: None.
495
Ammonia homeostasis in mice expressing liver mutant glutamate dehydrogenase of the HI/HA syndrome
K. Luczkowska, Y. Zhou, P. Maechler;
Universite de Geneve, Genève 4, Switzerland.
Background and aims: The mitochondrial enzyme glutamate dehydrogenase (GDH), encoded by the GLUD1 gene, catalyses the reversible reaction of glutamate to α-ketoglutarate plus ammonium. Gain-of-function GDH mutations cause a rare genetic disease; the hyperinsulinism/hyperammonemia syndrome (HI/HA). Patients present with severe hypoglycemia with neonatal and early infancy-onset, accompanied by elevated plasma ammonium levels (3-5 times) presumably due to systemic expression of mutant GDH. This study aims to elucidate the contribution of the liver in the elevated circulating ammonium. Hepatocytes emerged as a main candidate playing a central role in amino acid catabolism and ammonium detoxification through urea cycle and glutamine handling.
Materials and methods: To partially recapitulate the genetic traits of the patients suffering from HI/HA syndrome we transduced in vivo the livers of HepGlud1-/-mice (liver specific GDH knock out) with adenovirus carrying mutant hGDHS445L. Mice were then challenged with IP injection of gluconeogenic substrates to promote hepatic glucose production. Additionally, the nitrogen metabolism was investigated by measurements of plasma urea, ammonium and glutamate levels. On the day of sacrifice, we evaluated the contribution of different organs (intestines, liver and kidney) on the systemic concentrations of ammonium and urea by blood sampling from aorta and portal, renal and hepatic vein. Moreover, livers were processed for cryo-section to investigate the in situ GDH activity by tetrazolium assay and immunohistochemistry analyses.
Results: The efficiency of transduction was controlled by immunoblotting and immunofluorescence, showing efficient and homogenous expression of the transgene hGDHS445L. Both alanine and glutamine IP injections induced similar blood glucose rises in HepGlud1-/-hGDHS445L and Glud1lox/loxControl mice. The mutation did not affect the gluconeogenic capacity of the animals. Unexpectedly, expression of liver mutant GDH did not induce hyperammonemia, HepGlud1-/-hGDHS445L mice exhibiting similar circulating levels of ammonium and urea compared to control mice. On the contrary, plasma glutamate concentrations were significantly increased in HepGlud1-/-hGDHS445L mice; suggesting bidirectional GDH fluxes and, in case of the mutant form, operating predominantly towards the production of glutamate. Preliminary data on liver cryo-sections showed higher in situ GDH activity in HepGlud1-/-hGDHS445L mice compared to Glud1lox/loxControl.
Conclusion: In vivo expression of the HI/HA activating mutation hGDHS445L in the liver of mice modified hepatic glutamate handling. This was not translated into altered blood ammonia homeostasis, pointing to the contribution of other organs for the hyperammonemia associated with the HI/HA syndrome.
Supported by: Swiss National Foundation
Disclosure: K. Luczkowska: None.
496
Metabolic effects of beta-lactoglobulin, casein and whey supplementations during controlled catabolic inflammation in humans
M. Mose1, N. Møller2, N. Jessen2, U.R. Mikkelsen3, B. Christensen4, E. Raakvaag1, J.J. Holst5, J.L. Jørgensen1, N. Rittig2;
1Aarhus University, Aarhus N, 2Steno Diabetes Center Aarhus, Aarhus University Hospital, Aarhus N, 3Arla Foods Ingredients, Viby, 4Arla Foods amba, Skejby, 5Department of Biomedical Science, University of Copenhagen, Copenhagen, Denmark.
Background and aims: Infectious disease is associated with insulin resistance and muscle loss, resulting from a combination of inflammation, bed rest, and malnutrition. Dairy protein supplements are insulinotropic and preserves muscle mass, and we therefore aimed to investigate the metabolic effects of β-lactoglobulin (BLG), casein (CAS) and whey (WHE) protein supplements during controlled catabolic conditions.
Materials and methods: We used a randomized double-blinded crossover design to investigate nine male participants. Before each trial day participants were exposed to lipopolysaccharide (LPS, 1 ng/kg) combined with 36 hours of fasting + bed rest to mirror a typical infectious episode. During each trial day, participants were investigated at baseline and following BLG, CAS, and WHE ingestion. We used the forearm model to quantify muscle protein kinetics
Results: Consumption of BLG, CAS and WHE all improved the net balance of phenylalanine (NBPhe) in forearm muscle from baseline (p<0.05) without differences between interventions. The incremental area under the curve (iAUC) for serum insulin was 62% higher following BLG compared with CAS (p <0.001) and 29% higher compared with WHE (p<0.001). In line with this finding, plasma concentrations of insulinotropic glucose-dependent insulinotropic peptide (GIP) increased 70% in BLG compared with CAS (p=0.007). Baseline glucose concentrations were low (4.2 mmol/L) and increased upon dairy consumption without differences between interventions (p>0.05).
Conclusion: The dairy protein supplements BLG, WHE, and CAS have similar anabolic effects on muscle during controlled catabolic conditions. BLG showed insulinotropic properties, which is of great interest within the field of nutritional research aiming to combat post-prandial glucose fluctuations (e.g. pre-meal servings for type 2 diabetes patients).
Clinical Trial Registration Number: NCT03319550
Supported by: AU, Arla Foods for Health and -Ingredients, Beckett- , A.P. Møller-, and Emil Hertz Foundation
Disclosure: M. Mose: None.
497
Reasons for treatment discontinuation in type 2 diabetes: results from an online patient survey in the UK and US
A. Roborel de Climens1, E. Pain2, A. Boss3, A. Shaunik3;
1Sanofi, Lyon, France, 2Carenity, Paris, France, 3Sanofi, Bridgewater, USA.
Background and aims: Type 2 diabetes (T2D) is a chronic condition that requires long-term treatment to achieve and maintain glycaemic control. However, up to 50% of people with T2D discontinue treatment by 1 year.
Materials and methods: To better understand the cause of treatment discontinuation, an online questionnaire was presented to people with T2D in the UK (n=72) and US (n=89) on the PatientLive® platform, a global online patient community. For those who discontinued at least one of their T2D treatments within the last 6 months, open-ended questions aimed to assess the reasons why, how it could have been prevented, and what would have improved the experience with the discontinued treatment. Thematic qualitative analysis was performed on respondents’ answers to these open-ended questions.
Results: Overall, oral antidiabetics were the main type of treatments discontinued (93/161) followed by insulin (40/161) and other injectable antidiabetics (13/161). The main reasons for treatment discontinuation were side effects (57/161), mostly gastrointestinal side effects and weight gain. Drug efficacy issues was the second most reported reason (42/161). In the US, cost of treatment plays an important role (14/89). For the respondents, key factors to prevent discontinuation would have been an improved care pathway (45/161) and more efficacious treatments with fewer side effects (41/161). In the US, a lower price was also noted as an improvement factor (12/89). More information about T2D and associated treatments (56/161), help on how to manage T2D (24/161), and better informing of doctors of patients’ needs (12/161) would have been helpful for many respondents in both the UK and US. Notably, however, many respondents confirmed that they were sufficiently informed (64/161).
Conclusion: The survey results emphasise the need for focused education and improved communication to enhance patient experience and prevent treatment discontinuation, and highlight the importance of therapies that better fit the needs and preferred attributes of people with T2D.
Supported by: Sanofi
Disclosure: A. Roborel de Climens: Employment/Consultancy; Sanofi. Stock/Shareholding; Sanofi.
PS 35 Inflammation in type 2 diabetes
498
Indole 3 propionic acid regulates inflammation and metabolic pathways
M. Mavilio, M. Ballanti, L. De Angelis, V. Casagrande, R. Menghini, M. Federici;
University of Rome Tor Vergata, Rome, Italy.
Background and aims: Several studies identified the gut microbiota as an environmental factor able to affect host’s homeostasis through the modulation of different metabolic pathways. The interaction between microbiota and intestinal metabolism plays a role in maintaining metabolic homeostasis. Indole 3 propionic acid (IPA) is a microbial-derived metabolite, produced by Clostridium Sporogenes, that exerts anti-oxidative and anti-inflammatory properties acting, at least in part, through the binding with the nuclear receptor PXR. Our preliminary unpublished study, based on a multi-omics approach in humans, indicates that genes expression, metabolites and metagenomics clusters, are modulated in obese (BMI>35) compared to normal weight subjects (BMI<25). In particular, we have found that Phosphoenolpyruvate carboxykinase 1 (PCK1) mRNA expression, IPA level and Clostridium sp. population negatively correlate with BMI, insulin resistance (IR) and inflammatory cytokines, such as TNF alpha and Resistin. In this study, we aimed to investigate the pathophysiological relationship between IPA, PXR and PCK1 and their role in inflammation and glucose metabolism by in vitro and in vivo studies.
Materials and methods: 6 weeks old C57BL/6 mice were fed a High Fat Diet (HFD) for 8 weeks and then treated with IPA (20mg/Kg) or placebo (PBS) by oral gavage for 4 consecutive days. Intraperitoneal glucose tolerance test (IPGTT) and Homeostatic Model Assessment of Insulin Resistance (HOMA-IR) were tested. In in vitro studies, human epithelial colorectal adenocarcinoma cells (Caco-2) were co-treated with IPA (1uM) and Indole (1mM); the expression of genes related to inflammation (TNF alpha, CXCL11, CCL2), metabolism (PCK1, G6Pase, FoxO1), regulation of epithelial barrier function (ZO-1) and antimicrobial function (Def3b) were analyzed by RT-PCR. To evaluate whether the effect of IPA on metabolism and intestinal inflammation requires the nuclear receptor PXR, siRNA-mediated knockdown on Caco-2 cells was performed.
Results: In animal models, IPA administration significantly improved fasting glucose levels, IPGTT (p<0.01) and insulin resistance determinate by HOMA-IR (p<0.05). Moreover, increased expression of PCK1, PXR (p<0.01), genes involved in metabolic control, such as FoxO1 e Foxa2 (p<0.05) and genes related to intestinal barrier function such as ZO-1 and Muc-2 (p<0.05) were observed in colon but not in liver tissue. In Caco-2 cells, IPA treatment was associated to increased expression of PCK1 (p<0.05), FoxO1 (p<0.0001) and Foxa2 (p<0.001) and decreased expression of inflammatory cytokine, such as CXCL11 e CCL2 (p<0.01), compared to vehicle treated cells. Surprisingly, the PXR-knockdown led to an increase of IPA- mediated expression of PCK1 (p<0.05) and FoxO1 (p<0.01) while decreased the expression of inflammatory markers particularly TNF alpha and CXCL11 (p<0.05).
Conclusion: Taken together, our results suggest that IPA may regulate, through a mechanism only partially mediated via PXR, the host's homeostasis by activating different transcription factors, including FoxO1. In conclusion, the intestinal microbiota through the production of metabolites such as IPA, may control inflammation and metabolic alterations associated to pathological conditions such as obesity, thus representing a novel therapeutic target for the treatment and prevention of metabolic diseases.
Disclosure: M. Mavilio: None.
499
Glucagon-like peptide-2 exerts a strong anti-inflammatory response on isolated human islets
K. Maedler1, T. Klein2;
1University of Bremen, Bremen, 2Boehringer Ingelheim Pharma GmbH & Co. KG, Biberach, Germany.
Background and aims: While the robust protective effect of GLP-1 on beta-cell survival and function is well-known and established in the therapy for T2D as well as recently also for T1D, much less is understood about the production of GLP-2 and its efficacy in human islets. As the DPP-4 inhibitor linagliptin enhanced GLP-2 synthesis in human islets, we performed a large screening for the effect of the GLP-2R agonist Teduglutide and its antagonist GLP-2(3-33) on the inflammatory response in human islets under chronic diabetogenic conditions.
Materials and methods: Isolated human islets from healthy donors were plated onto ECM-coated dishes and exposed to the mixture of high glucose and palmitate (22.2 mM HG + 0.5 mM Pal; glucolipotoxicity) or Lipopolysaccharide (LPS) for 72 hours, the GLP-2R agonist Teduglutide and the antagonist GLP-2(3-33) were added 2 hours prior to the treatments and maintained throughout the culture. To evaluate the effect of GLP-2 agonism and antagonism on the inflammatory response under diabetogenic conditions, an array of 46 inflammatory biomarkers were measured using the quantitative, multiplexed Myriad Human InflammationMAP® immunoassay.
Results: Human islets cultured under chronic gluco-lipotoxic conditions or LPS showed an increased secretion of 19 out of 46 measured inflammatory markers (among them are IL-6, IL-8, MIP1alpha and MIP1beta), which were almost fully normalized under the GLP2-agonist Teduglutide. While the GLP-2 antagonist GLP-2(3-33) reversed the protective effect of GLP-2 under glucolipotoxicity, inflammatory markers remained unaffected by GLP-2(3-33) under LPS treatment. Intra-islet production of GLP-2, its increase by a diabetogenic milieu as well as the beta-cell specific expression of GLP-2R was confirmed in human islets in this study.
Conclusion: These results suggest a powerful effect of GLP2 on the inflammatory response in human islets under a chronic diabetogenic milieu. While the effect of GLP2 is modulated through GLP-2R expressed on beta-cells, the anti-inflammatory response could be rather beta-cell-indirect through infiltrating immune cells. The observed anti-inflammatory effect of GLP-2 needs to be further investigated in order to establish possible GLP-2 directed therapies for diabetes.
Supported by: Boehringer Ingelheim
Disclosure: K. Maedler: Grants; Boehringer paid the assay costs.
500
Baricitinib counteracts metaflammation thus protecting against diet-induced metabolic abnormalities in mice
D. Collotta1, W. Hull2, R. Mastrocola3, F. Chiazza1, A. Cento3, C. Murphy2, R. Verta1, G. Ferreira Alves1, G. Gaudioso4, F. Fava4, M. Aragno3, K. Tuohy4, C. Thiemermann2, M. Collino1;
1Department of Drug Science and Technology, University of Turin, Torino, Italy, 2Queen Mary University of London, Centre for Translational Medicine and Therapeutic;William Harvey Research Institute, Barts and the London School of Medicine and Dentistry, London, UK, 3Department of Clinical and Biological Sciences, University of Turin, Torino, Italy, 4Edmund Mach Foundation, San Michele all'Adige, Italy.
Background and aims: Low-grade, chronic inflammatory response, known as “metaflammation”, exerts a key role in promoting diet-related metabolic disorders. Recent evidence suggests a substantial pathogenic role for the Janus kinase (Jak)/signal transducer and activator of transcription (Stat) pathway as a potential master regulator in the signaling events involving more than 50 cytokines, many of which play a pivotal role in the pathophysiology of metaflammation. Here we investigated the effects of the Jak1/2 inhibitor baricitinib, recently approved for the treatment of rheumatoid arthritis, in a murine model of high-fat-high-sugar diet (HD).
Materials and methods: 4-week old male C57BL/6 mice were randomly fed with a normocaloric diet (ND), a HD for 22 weeks, and a HD enriched in baricitinib (10 mg/kg die, p.o.) for the last 16 weeks (HD+Bar). Body weight, food/water intake, and fasting glucose were recorded. The plasma lipid profile was determined using reagent kits. Plasma hormones and inflammatory cytokines were measured by Bio-Plex Multiplex Immunoassay System. Western blotting analysis was used to evaluate the activation of insulin signaling in liver and skeletal muscle and JAK/STAT pathway in skeletal muscle and kidney. Faeces were collected for the 16SrRNA analysis through Illumina MiSeq using V3-V4 targeted primers. Kidney histopathological examination was carried out on formalin-fixed-paraffin-embedded samples stained with hematoxylin and eosin or periodic-acid Schiff.
Results: Mice exposed to HD displayed higher body weight increase (P<0.05), increased levels of serum triglycerides, cholesterol and LDL (P<0.05), higher blood glucose levels (P<0.05) and an impairment in OGTT, when compared to ND group. HD resulted in increased leptin, resistin and insulin plasma levels (P<0.05), paralleled by impaired insulin signaling transduction and in reduced GIP, GLP-1 (P<0.05) and ghrelin (P<0.05). HD also led to increased systemic proinflammatory markers: IL-1β, INF-γ; TNF-α (P< 0.05), and to reduced anti-inflammatory IL-10 and IL-6 (P< 0.05). Despite HD+Bar did not change the diet-induced microbiota imbalances, the metabolic abnormalities were reverted and in association with improvement of diet-induced myosteatosis, mesangial expansion and associated proteinuria. The tissues protection was related to on-target effects, being the local Jak2/Stat2 pathway inhibited by baricitinib, resulting also in significant reduction in systemic proinflammatory cytokines.
Conclusion: In summary, our data suggest that the inflammatory Jak2/Stat2 pathway may represent a novel candidate for the treatment of diet-related metabolic derangements, with potential for the EMA- and FDA-approved Jak inhibitors to be repurposed for the treatment of type 2 diabetes and/or its complications.
Supported by: 777HDHL INTIMICK nowledge Platfo -1170HDHL INTIMIC METADIS-SALIVAGES, ERA HDHL-Ricerca Locale Ex-60%
Disclosure: D. Collotta: None.
501
Inhibition of histone deacetylase 3 prevents free fatty acid-induced insulin resistance and inflammation through the regulation of mitochondrial metabolisms
J. Jeon1, M. Song1, H. Lee1, S.-E. Choi2, Y. Kang2, T. Kim3, H. Kim1, S. Han1, N. Lee1, K.-W. Lee1;
1Endocrinology and Metabolism, Ajou University School of Medicine, Suwon, 2Physiology, Ajou University School of Medicine, Suwon, 3Internal Medicine, Seoul Medical Center, Seoul, Republic of Korea.
Background and aims: Histone deacetylase 3 (HDAC3) inhibitors, which regulate diverse genes expression by inhibition of deacetylation of histones and nonhistone proteins, have been reported to have diverse biological effects on anti-cancer, anti-obesity, anti-diabetes, anti-cardiovascular diseases. However, the effects of HDAC3 inhibition on free fatty acid-insulin resistance (IR) and inflammation in C2C12 myotubes has not been well studied. In this study, we investigated the protective molecular mechanisms of HDAC3 inhibition under free fatty acid-induced insulin resistance and inflammation in C2C12 myotubes.
Materials and methods: We used differentiated C2C12 myotubes and treated free fatty acid for inducing insulin resistance and inflammation. Intracellular ROS was measured by DCF-DA staining. Metabolism-related genes and proteins were analyzed by immunoblotting and qPCR. To investigate the effects of HDAC3 inhibition, HDAC3 was inhibited by pharmacological HDAC inhibitor, MS275 or HDAC3 siRNA, and then we measured metabolic parameters.
Results: Free fatty acid increases HDAC3 protein levels and at the same time induces insulin resistance and inflammatory cytokines in muscle cells. Treatment of MS275 dramatically inhibited free fatty acid-induced insulin resistance and reduced inflammatory cytokines expressions such as such as TNF-α, IL-6 and IL-1β. MS275 dramatically reduced free fatty acid-induced intracellular ROS and activation of JNK and NF-kB. MS275 ameliorated free fatty acid-induced insulin resistance through improved insulin signaling such as AKT and GSK in muscle cells. Inhibition of HDAC3 using siRNA also ameliorated FFA-induced insulin resistance and reduced inflammatory cytokines levels. Inhibition of HDAC3 dramatically increased PGC1 alpha and FFA-oxidation related genes expression.
Conclusion: In this study, we investigated fatty acid induced HDAC3 expressions, insulin resistance, and inflammatory cytokines expressions. Inhibition of HDAC3 with pharmacological HDAC inhibitor or HDAC siRNA significantly decreased insulin resistance through metabolic genes regulation. Therefore, regulation of HDAC3 may play a crucial role in controlling metabolic diseases such as insulin resistance and diabetes.
Supported by: NRF 2020M3A9E8024904
Disclosure: J. Jeon: None.
502
Anti-inflammatory effects of second-generation antipsychotics on human macrophage-adipocyte communication
A. Sarsenbayeva1, P. Dipta2, M. Lundqvist1, K. Almby1, B. Tirosh2, J.W. Eriksson1, M.J. Pereira1;
1Uppsala University, Uppsala, Sweden, 2Department of Pharmacology, Hadassah Medical Centre, Jerusalem, Israel.
Background and aims: Up to 50% patients on second-generation antipsychotics (SGAs) develop metabolic complications, including obesity and even diabetes. The risk of metabolic side effects varies between individual drugs, e.g. olanzapine (OLA) is a high-risk drug, while aripiprazole (ARI) is more neutral. Adipose tissue (AT) inflammation and macrophage infiltration are hallmarks of obesity and it is unclear whether SGAs can directly induce adipose tissue inflammation. Therefore, we aimed to study the direct effect of SGAs on macrophage phenotype switch and on macrophage to adipocyte communication in vitro.
Materials and methods: Needle biopsies were taken from abdominal subcutaneous AT from 12 healthy subjects (7F/5M; age: 22-64 yr; BMI: 21.8-29.6 kg/m2), and mature adipocytes were isolated. THP-1-human monocytic cell line was differentiated and polarised into M0 (naïve), M1 (classically activated), and M2 (alternatively activated) macrophages. The phenotype was confirmed by measuring gene expression of specific markers: M1 - TNFA, IL6, IL1B, and M2 - IL10, CD206. The macrophages were pre-treated for 24h with or without therapeutic and supra-therapeutic concentrations of OLA (0.2 μM and 2.0 μM), ARI (1.0 μM and 10 μM) and its active metabolite dehydroaripiprazole (dARI) (0.4 μM and 4.0 μM). The drugs were removed after 24h and, then macrophages were co-cultured with isolated mature adipocytes for 24h. Adipocytes and macrophages were collected before and after co-culture for mRNA expression analysis of genes involved in inflammation.
Results: In M2 macrophages ARI 10 μM markedly reduced the expression of IL6 and IL10 by 60-70% (p<0.05), while ARI 1.0 μM reduced IL10 expression by 29% (p<0.05). None of the SGAs at therapeutic concentration had significant effect on other cytokines (IL1B, TNFA, IL6) expression. In M1 macrophages ARI 10 μM suppressed the expression of IL1B and IL10 by 23% and 56%, respectively (p<0.05). The data suggest that overall SGAs have an anti-inflammatory effect in macrophages, but mostly at supra-therapeutic concentrations. SGAs pretreatment of macrophages (all three types) did not significantly affect subsequent expression of the pro-inflammatory cytokines IL1B, IL6, and TNFA in adipocytes co-incubated with the macrophages. Similarly, drugs had no significant effect on IL1B and TNFA expression in macrophages after their co-incubation with adipocytes. Interestingly there was a significant downregulation of IL6 expression by ca 50% in M2 macrophages (p<0.05) and by 25-30% in M1 macrophages (p>0.05) in the presence of all the SGAs following co-incubation with adipocytes.
Conclusion: The data indicate that therapeutic concentrations of SGAs do not have a strong direct effect on polarised THP1 macrophages phenotype switch. By contrast, the drugs seem to affect macrophage-adipocyte communication, via a significant reduction in IL6 expression in macrophages. However, they do not alter the expression of other pro-inflammatory cytokine genes in adipocytes after co-incubation. Therefore, our previous findings and the present data suggest that SGAs have no direct effects on human adipose tissue metabolism or on macrophage-mediated inflammation. Other organs, central nervous system, liver etc are more important for metabolic dysfunction induction.
Supported by: H2020 Marie Sklodowska Curie Innovative Training Network TREATMENT
Disclosure: A. Sarsenbayeva: Grants; H2020 Marie Sklodowska Curie Innovative Training Network TREATMENT.
503
NK cells invisceral adipose tissue contribute to obesity-associated insulin resistance through macrophage polarisation and low grade inflammation
K. Wouters1,2, Y.H.A. Kusters1,2, M. Bijnen3, S. Wetzels4,2, X. Zhang1,2, Pauline Linssen, Katrien Gaens, A.J.H. Houben1,2, E. Kooi5,2, C.J.H. van der Kallen1,2, Kenneth Verboven, Johan Jocken, Ellen E Blaak, Peter J Joris, Jogchum Plat, Ronald P Mensink, Femke AI Ehlers, Lotte Wieten, Jan Willem Greve, Sander S Rensen, C.D.A. Stehouwer1,2, C.G. Schalkwijk1,2;
1Dept. of Internal Medicine, Maastricht University Medical Centre +, Maastricht, Netherlands, 2Cardiovascular Research Institute Maastricht (CARIM), Maastricht, Netherlands, 3Centre d'Immunologie de Marseille-Luminy, Marseille, France, 4Dept. of Pathology, Maastricht University Medical Centre +, Maastricht, Netherlands, 5Dept. of Radiology and Nuclear Medicine, Maastricht University Medical Centre +, Maastricht, Netherlands.
Background and aims: Obesity induces NK cell accumulation in mice, leading to an enhanced ratio of inflammatory “M1” to regulatory “M2” macrophages in visceral adipose tissue (vAT), contributing to insulin resistance and consequent type 2 diabetes. We investigated whether NK cells also contribute to inflammatory adipose tissue macrophage polarization and mediate the relationship between obesity, chronic inflammation, and insulin resistance in humans.
Materials and methods: NK cells were analysed using flow cytometry in both blood and adipose tissue biopsies (study 1) or in blood only (study 2 & 3). Whole body glucose disposal (WBGD) was measured by means of a euglycemic hyperinulinemic clamp (study 2). Adipose tissue volumes were determined by magnetic resonance imaging (MRI) and plasma cytokine levels with the multiplex MSD system (study 2 and 3). Finally, NK cells were isolated from lean or obese women and co-cultured with primary macrophages from a lean donor (study 4).
Results: In blood and vAT biopsies from 17 lean and 27 obese men (study 1), CD11B expression on blood NK cells (NK-CD11B) reflected vAT NK cell numbers (r=0.598, p<0.001) and was associated with M1/M2 ratio in vAT (r=0.364, p<0.05). In the second study, including 53 abdominally obese and 25 lean men, NK-CD11B was associated with vAT volume (r=0.292, p<0.05), plasma TNF (r=0.459, p<0.001) and was inversily associated with insulin sensitivity (WBGD) (r=-0.255, p<0.05). Multiple mediation analysis showed that the association between vAT volume and WBGD (β=-1.575, p<0.001) was partially explained by the NK cell-TNF axis (β=-0.063; -0.072 to -0.008). In the third study, a population-based cohort of 839 individuals, vAT volume was associated with NK cell accumulation in vAT, as assessed by NK-CD11B (β=3.2, p=0.006). Moreover, NK-CD11B was associated with insulin resistance (β=2212, p=0.013). Finally, compared to lean individuals, cultured NK cells from obese individuals produced more TNF (184 ± 19 vs. 124 ± 22 MFI; p=0.002) and induced inflammatory macrophage polarization (p=0.04).
Conclusion: Our results suggest an important contribution of vAT NK cell accumulation to human obesity-associated insulin resistance through macrophage polarisation and subsequent low-grade inflammation.
Clinical Trial Registration Number: NCT02598544; NL30502.096.09; NL41397.068.12; NL31329.068.10
Supported by: NWO 916.12.056; NHS 2013T143; FP7 CIG 322070; TIFN CH001
Disclosure: K. Wouters: None.
504
Endothelial glycocalyx profile in type 2 diabetes
B. DellaValle1, N.J. Jensen1, C. Hempel1, M. Svart2, N. Møller2, J. Rungby1;
1Bispebjerg and Frederiksberg Hospital, Copenhagen, 2Department of Endocrinology, Aarhus University Hospital, Aarhus, Denmark.
Background and aims: The endothelial glycocalyx is a dense, complex and largely overlooked structure. In type II Diabetes, numerous disease mechanisms exact major change to organ systems throughout the body. Since the endothelial glycocalyx is the first interaction between an organ and the blood, we were interested in investigating endothelial health in type 2 diabetics by profiling glycocalyx shedding in blood. We have developed a panel and have previously shown that the glycocalyx is shed in specific patterns during different inflammatory states. In this study, we investigate 14 markers of the glycocalyx in plasma samples of diabetic patients and healthy individuals.
Materials and methods: A glycocalyx panel spanning 14 glycosaminoglycans and proteoglycans, were assayed in plasma from 18 type 2 diabetic patients and 9 healthy individuals. Each marker was detected with an optimized immunoassay.
Results: 6 of 14 glycocalyx markers and glial fibrillary acidic protein were significantly increased in diabetic patients versus controls (p<0.05) and were able to significantly differentiate between case and control (ROC analysis; p<0.05). Two glycocalyx markers had an AUC of >90%, one of which was >99%. Furthermore, correlational mapping of these glycocalyx markers showed significant shifts in their relationships, from minor relationships in healthy individuals to strong, positive relationships in diabetics.
Conclusion: In this study we present the first, to our knowledge, glycocalyx profile in a cohort of type 2 diabetics. These data point to new markers of interest and suggest the glycocalyx be investigated further as a site of significant pathophysiological change.
Clinical Trial Registration Number: NCT03657537
Disclosure: B. DellaValle: Employment/Consultancy; GLX ANALYTIX.
505
BVR-A expression in human vat and associations with metabolic and inflammatory alterations
V. Ceccarelli1, F.A. Cimini1, I. Barchetta1, L. Bertoccini1, F. Leonetti1, D. Capoccia1, G. Silecchia2, C. Di Cristofano2, C. Chiappetta2, M.G. Baroni1, M. Pierluigi3, E. Barone3, M.G. Cavallo1;
1Experimental Medicine, Sapienza University, Rome, 2Medical-Surgical Sciences and Bio-Technologies, Sapienza University, Rome, 3Biochemical Sciences “A. Rossi-Fanelli”, Sapienza University, Rome, Italy.
Background and aims: Biliverdin reductase A (BVR-A) is an enzyme with pleiotropic functions, involved in both heme metabolism and in the regulation of insulin signalling. Experimental mouse models knocked-out for hepatic BVR-A, on high fat diet (HFD), developed worse glucose impairment and more severe fatty liver than wild type. Moreover, the loss of adipocyte BVR-A in murine models of obesity was associated with increased local inflammation and adipocyte size. We previously demonstrated that obese people have significantly reduced BVR-A levels in PBMC than non-obese individuals and that lower BVR-A levels were associated with the hyper-activation of the insulin signalling pathway, presence of metabolic syndrome (MS), NAFLD and visceral adipose tissue (VAT) inflammation. However, BVR-A expression in human VAT has never been investigated. Therefore, aims of this study were to evaluate the expression of BVR-A in VAT of obese subjects and to investigate the association with markers of metabolic impairment and VAT inflammation.
Materials and methods: For these purposes, we recruited thirty-eight consecutive obese patients referring to our outpatient clinics, Italy, for clinical and metabolic evaluations before bariatric surgery. Study participants underwent clinical work-up, routine biochemistry and intra-operative omental biopsy; VAT inflammatory markers and BVR-A expression were evaluated by real-time PCR.
Results: 32 out of 38 study participants (84%) showed detectable BVR-A mRNA expression in VAT. Patients with lower VAT BVR-A expression had significantly higher expression of VAT IL-8, WISP1 and Caspase 3 than individuals with higher VAT BVR-A expression. In the entire study population, BVR-A expression, when considered as a continuous variable, was associated with features of VAT inflammation such as increased VAT IL-8 and Caspase 3 expression and with histological diagnosis and severity of NAFLD. No association was found between VAT BVR-A expression and other clinical/biochemical parameters, although a trend towards an association between lower VAT BVR-A expression and higher GGT was found. The prevalence of NAFLD among individuals with lower VAT BVR-A expression was 95% compared to 68% in subjects with the higher BVR-A expression. Thus, having lower VAT BVR-A expression was associated with an increased risk of NAFLD, with a RR of 1.38 (1.02 - 1.9, χ2 test).
Conclusion: In obesity, lower VAT BVR-A expression is associated with signs of metabolic impairment and VAT inflammation. Our findings suggest a possible involvement of BVR-A in regulating VAT homeostasis and inflammatory processes in presence of obesity.
Disclosure: V. Ceccarelli: None.
PS 36 Models of prediabetes and diabetes
506
Glycaemic variability in normal mice: Is there any justification for not using females?
M.R. Kennard, A.J.F. King, M. Nandi;
King's College London, London, UK.
Background and aims: Blood glucose concentrations are a vital endpoint measurement in preclinical diabetes research. Current ranges and cut-offs for normoglycaemia and hyperglycaemia are often determined by single blood glucose measurements which cannot capture glycaemic variability. Animal models are essential in diabetes research with experiments primarily undertaken on male mice, partly due to the perceived increased glycaemic variability associated with the estrous cycle in females. Using continuous blood glucose telemetry, we aimed to identify sex differences in blood glucose variability and further explore the effect of commonly used in vivo procedures on blood glucose concentrations.
Materials and methods: Seven male and female C57Bl/6J mice were implanted with HD-XG glucose telemetry devices with the sensor placed in the aortic arch. After a seven-day recovery from surgery, blood glucose concentrations were continuously measured in unrestrained mice with averages recorded every 10 seconds. A normal target range for each animal was determined by calculating 25% above and below the median 24h blood glucose concentration. Within-day glycaemic variability was determined using various measures including standard deviation (SD) and mean amplitude of glycaemic excursions (MAGE) with between-day glycaemic variability being measured using mean of daily differences (MODD).
Results: The average normal target range in normoglycaemic C57Bl/6J mice was 5.0-8.4mM in males and 4.5-7.6mM in females. Overall blood glucose, measured by mean and median blood glucose as well as total area under the curve, were all significantly higher in male vs female mice (6.7±0.1 vs 6.1±0.1mM, 6.7±0.1 vs 6.1±0.1mM and 58068±774 vs 53061±807mM.sec, p<0.01, t-test, n=7). Within-day glycaemic variability was significantly higher in males as shown by increased SD and MAGE (0.96±0.09 vs 0.57±0.06mM and 1.29±0.12 vs 0.90±0.08mM, p<0.01). Between-day glycaemic variability, as measured by MODD, was also significantly higher in males vs females (1.14±0.11 vs 0.67±0.09mM, p<0.01). There was no significant difference in mean blood glucose regardless of estrous stage (proestrous-estrous vs metestrous-diestrous = 6.0±0.2 vs 6.1±0.1mM, paired t-test). All in vivo techniques, including disturbance, tail handling, estrous swabbing and glucometer measurements increased blood glucose for 15-30min in females. Disturbance in males also increased blood glucose for 15-30min but blood glucose at 15, 30 and 60min post-disturbance was significantly higher in males vs females (8.1±0.1 vs 6.4±0.1, 7.9±0.3 vs 6.3±0.2 and 6.4±0.4 vs 5.7±0.1mM, p<0.05, two-way ANOVA, n=7). Similarly, tail handling in males increased blood glucose for 30-60min with blood glucose at 15-30min being significantly higher than females (8.5±0.7 vs 7.1±0.2mM and 8.0±0.4 vs 6.6±0.4mM, p<0.05). Handling and glucometer measurements increased blood glucose for 60-90min in males with blood glucose at 60min being higher than females (7.3±0.3 vs 6.0±0.3, p<0.05).
Conclusion: The higher between-day glycaemic variability in male mice suggests that the estrous cycle in females has no significant effect on variability and, consequently, this is arguably not a suitable reason to exclude female mice from diabetes research. Furthermore, blood glucose following in vivo procedures increased to a greater extent and for longer periods in male mice. Overall, continuous glucose monitoring is favourable as it allows comprehensive analysis of glycaemic variability and responses to in vivo procedures.
Disclosure: M.R. Kennard: None.
507
The KINGS mouse, a novel model of ER stress induced diabetes
L.F. Daniels Gatward, A.L.F. Austin, A.J.F. King;
Department of Diabetes, King’s College London, London, UK.
Background and aims: Males within a C57Bl/6J mouse colony unexpectedly and spontaneously developing hyperglycaemia were recently discovered at King’s College London. Hyperglycaemia in these mice was dominantly inherited and found to be caused by a mutation in Ins2 which results in a glycine to serine substitution in the B chain of preproinsulin (position 32). These mice were subsequently named the ‘KINGS’ (KCLINS2G32S) mice. We aimed to characterise the phenotype of these mice further and investigate the impacts of this mutation on the beta cell.
Materials and methods: Glycaemic control was assessed through non-fasted blood glucose monitoring, glucose tolerance tests and insulin tolerance tests. Beta cell and islet ultrastructure was investigated through scanning electron microscopy and immunofluorescence. Beta cell proliferation was investigated through immunofluorescent staining for the proliferation marker, Ki67, and the expression of endoplasmic reticulum (ER) stress markers was investigated through Western blotting.
Results: Male KINGS mice showed significantly higher blood glucose than WT littermates from 23 days of age (two-way ANOVA, Sidak’s post-hoc, p<0.05, n=3-12) and mice became overtly diabetic (>16.7mmol/l) between 5-6 weeks. Blood glucose continued to increase, and at 10 weeks average blood glucose was 27.5+1.1mmol/l compared to 8.9+0.4mmol/l in WT mice (p<0.0001, n=8-11). In contrast, female KINGS mice maintained a blood glucose just above normoglycemia (maximum average = 12.7+0.7mmol/l, n=9) but had impaired glucose tolerance (10-week AUC = KINGS:3015+178.6 vs. WT:1400+62.5, unpaired T-test, p<0.0001, n=6-15). Transmission electron microscopy revealed impaired glucose homeostasis is likely driven by beta cell pathology, with beta cells showing clear signs of ER stress, including enlarged mitochondria and swollen ER, as well as marked degranulation. Supporting this, Western blotting data indicate increased protein levels of the ER stress markers Bip (binding immunoglobulin protein) and spliced XBP1 (X-Box binding protein-1) in KINGS islets, as well as increased phosphorylation of eIF2-alpha (eukaryotic initiation factor 2 alpha). Finally, proportions of Ki67 expressing beta cells was comparable between WT and KINGS mice of both sexes at 4 weeks (male: WT:5.7+0.7 vs. KINGS:4.2+0.6, female: WT:3.3+0.5 vs. KINGS:3.7+0.6), 10 weeks (male: WT:0.3+0.2 vs. KINGS:0.9+0.4, female: WT:1.1+0.3 vs. KINGS:1.0+0.1) and 20 weeks (male: WT:0.7+0.1 vs KINGS:0.8+0.2, female: WT:0.5+0.2vs. KINGS:0.3+0.1) (two-way ANOVA, Sidak’s post-hoc, p>0.2, n=3-5). This suggests that differences in beta cell proliferation in response to ER stress is not driving sex differences in the KINGS phenotype.
Conclusion: The KINGS mouse may represent a novel model of mild ER-stress induced diabetes. Furthermore, considering the stark sex differences in phenotype in the KINGS mouse, it may provide a model for studying sex differences in diabetes.
Supported by: MRC
Disclosure: L.F. Daniels Gatward: None.
508
Preventative N-acetyl-L-cysteine treatment improved metabolic and beta cell function in HFD type 2 diabetes model
M. Schuurman1,2, M. Wallace1, G. Sahi1,2, M. Barillaro1,2, J. Li1,2, R. Wang1,2;
1Children's Health Research Institute, Lawson Health Research Institute, London, Canada, 2Physiology and Pharmacology, University of Western Ontario, London, Canada.
Background and aims: Obesity plays a major role in type II diabetes mellitus (T2DM) progression because it applies metabolic and oxidative stress. Over time, these stressors result in dysfunctional beta-cells which can be characterized by reduced expression of markers associated with beta-cell identity including, PDX-1 and MafA. Additionally, oxidative stress activates pancreatic stellate cells (PaSCs). PaSCs are myofibroblast-like cells which, in their quiescent state, play an important role in extracellular matrix (ECM) turnover. However, chronically activated PaSCs have been attributed to pancreatic islet inflammation and fibrosis via excessive cytokines and ECM production, and impaired beta-cell function. The antioxidant N-acetyl-L-cysteine (NAC) has been shown to inhibit PaSCs activation, in vitro. In this study, we examined whether treatment with NAC is able to improve metabolic outcomes and PaSC activation and maintain beta-cell identity in vivo.
Materials and methods: Male C57BL/6 mice at 6 weeks of age were fed either normal (ND) or high-fat diet (HFD) for 22 weeks and were given 50 mM NAC in drinking water as prevention (pNAC) or intervention (iNAC) treatment. NAC concentration in drinking water was determined using a previous study. pNAC treatment started one week prior to diet start and iNAC was introduced 12 weeks after diet start. Controls consisted of age-matched HFD or ND without NAC. Metabolic tests for glucose tolerance and insulin secretion were performed. Histological analyses of islet morphology were assessed by determining beta-cell size, and beta- and alpha-cell mass. Beta-cell identity was assessed by analyzing expression of transcription factors PDX-1 and MafA. PaSC activation and islet fibrosis was assessed using α-SMA and trichrome staining, respectively.
Results: At the end of 22 weeks, HFD-pNAC but not HFD-iNAC mice showed significantly improved glucose and insulin tolerance (p<0.05) with normal fasting blood glucose compared to HFD mice. HFD mice displayed high plasma insulin levels with associated beta-cell hypertrophy which were significantly improved in HFD-pNAC and HFD-iNAC (p<0.05). HFD mice lost PDX-1 nuclear localization, this was normalized in HFD-pNAC and significantly improved in HFD-iNAC (p<0.05 vs. HFD). Islet oxidative stress, assessed by 8-OHdG expression, was significantly improved in HFD-pNAC compared to HFD (p<0.05) with no differences between ND and ND-pNAC. Interestingly, intra-islet αSMA+ labeling was significantly decreased in HFD-pNAC (p<0.05 vs. HFD) but not HFD-iNAC groups. Additionally, reduced islet fibrosis was observed in HFD-pNAC vs. HFD.
Conclusion: These results suggest NAC treatment is beneficial in preventing beta-cell over-compensation associated dysfunction and improving metabolic outcomes in a diet-induced obesity T2DM mouse model. Furthermore, these benefits appear to be enhanced when NAC is given as a preventative treatment. Both timing and dosage are important considerations with NAC administration. To account for this, a study extending the iNAC treatment for 22 weeks, which is matched in treatment length to the pNAC treatment group, has been ongoing.
Supported by: CIHR
Disclosure: M. Schuurman: None.
509
Impact of hepatic elovl3 on sleep deprivation induced hepatic steatosis and glucose intolerance
F. Shigiyama, A. Fuchigami, T. Hirose, N. Kumashiro;
Toho University, Tokyo, Japan.
Background and aims: Sleep deprivation is associated with increased risk for type 2 diabetes. Previously, we reported that single six hours sleep deprivation caused hepatic steatosis and insulin resistance in C57BL/6J mice, and hepatic gene expression of elongation of very long chain fatty acids-like 3 (elovl3) was significantly increased by sleep deprivation. The aim of this study was to investigate the effects of down-regulation of hepatic elovl3 on hepatic lipid accumulation and glucose metabolism during sleep deprivation.
Materials and methods: High fat diet and high sucrose water were loaded to 11-weeks old C57BL/6J male mice for two weeks, then single 6 hours sleep deprivation was performed by gentle handling method. In order to suppress the expression of elovl3 in liver, elovl3 specific siRNA was injected to mice through tail vein (elovl3 group), and non-coding siRNA was injected to control mice (control group).
Results: Although elovl3 mRNA expression was increased by 2.7 fold by single six hours sleep deprivation, the increase was completely cancelled by elovl3 siRNA after 48 hours. Hepatic triglyceride content was significantly reduced in elovl3 group compared to control group (3.1 ± 1.5 vs 10.4 ± 4.2 mg/g-tissue, elovl3 vs control, respectively, each n=8, p<0.01) after single 6 hours sleep deprivation in fasted and moving-restricted condition. Although no significant difference was observed regarding hepatic gluconeogenesis assessed by pyruvate challenge test, the blood glucose level at 30 minutes in intraperitoneal glucose tolerance test was significantly lower in elovl3 group (319.6 ± 78.0 mg/dL vs 391.0 ± 31.7 mg/dL, p<0.05). These data suggest that the suppression of elovl3 may ameliorate the sleep deprivation induced hepatic steatosis, but its effects on glucose metabolism is limited.
Conclusion: Elovl3 may be a potential therapeutic target for the sleep deprivation induced hepatic steatosis but additional intervention is necessary for the glucose intolerance.
Supported by: MEXT/JSPS KAKENHI Grant Number JP18K16213 and Suzuken Memorial Foundation
Disclosure: F. Shigiyama: None.
510
Insulin-sensitising and anti-inflammatory effects of palmitoleic acid on visceral adipose tissue in a model of prediabetes
D. Miklankova1, M. Hüttl1, I. Markova1, B. Stankova2, H. Malinska1;
1Institute for Clinical and Experimental Medicine, Prague, 24th Department of Internal Medicine, First Faculty of Medicine, Charles University, Prague, Czech Republic.
Background and aims: Type 2 diabetes mellitus (T2DM) is associated with elevated plasma NEFA levels and alterated NEFA composition, which can lead to insulin signaling and glucose metabolism. The effect of palmitoleic acid (POA) is still inconsistent, although monounsaturated fatty acids can prevent and have therapeutic implications on chronic complications associated with metabolic syndrome (MS) and T2DM. In recent studies, POA can regulate glucose homeostasis and suppresses cytokine production leading to the metabolic abnormalities improvement. On the other hand, higher proportion of POA in plasma phospholipids (PL) are associated with increased risk of dyslipidemia, insulin resistance and hepatic steatosis. In our study we investigated the effect of POA supplementation on glucose and lipid metabolism, insulin sensitivity (IS) parameters and inflammation in a model of MS and prediabetes - Hereditary Hypertriglyceridemic rats (HHTg).
Materials and methods: HHTg rats exhibiting genetic fixed hypertriglyceridemia, insulin resistance and fatty liver, were fed standard diet. POA (cis 16:1n7) or oleic acid (OA) was administrated intragastrically in dose 100 mg/kg bwt for four weeks. After POA supplementation, cis 16:1n7 proportion in serum NEFA was markedly increased (31%, p<0.01).
Results: Compared to OA, POA supplemetation did not affect body weight, adiposity or non-fasting glucose. On the other hand, serum insulin was slightly increased while glucagon was decreased after POA administration. In addition, POA-treated rats exhibited reduced NEFA level (-17%) that were associated with decreased lipolysis and increased fatty acids (FA) reesterification in visceral adipose tissue. IS in skeletal muscles and adipose tissue, measured by incorporation of 14C-U glucose into glycogen or lipids, was significantly increased (p<0.05) after POA supplementation. To IS improvement can contribute markedly increased adiponectin levels (p<0.05) and alterations in FAs composition in membrane PLs in visceral adipose tissue. POA-treated rats exhibited increased profile of α-linolenic acid (p<0.01) and linoleic acid (p<0.01) and decreased profile of arachidonic (p<0.01) and dihomo-γ-linoleic acid (p<0.05) that can influence membrane fluidity and regulate cellular signalling. Further in adipose tissue, POA supplementation slightly reduced SCD-1 mRNA expression and increased FADS1 mRNA expression that can also improve IS. In addition, decreased production of pro-inflammatory parameters - MCP-1 (p<0.01), resistin (p<0.05) and TNFα (p<0.05) in visceral adipose tissue and decreased circulating levels of MCP-1 and hsCRP (p<0.05) can contribute to anti-inflammatory properties of POA.
Conclusion: Our results revealed that POA supplementation ameliorated tissues IS and decreased proinflammatory cytokines in a model of MS and prediabetes. The POA beneficial effect mechanisms can include changes in adipocytokines secretion, increased FADS1 gene expression as well as alterations in FAs profile in adipose tissue membrane PLs.
Supported by: MH CZ – DRO grant (IKEM, IN 00023001)
Disclosure: D. Miklankova: None.
511
Cotadutide, a GLP-1/Gcg receptor co-agonist improves insulin sensitivity and restores normal insulin secretory capacity in DIO mice
R.C. Laker1, L. Lantier2, O.P. McGuinness2, S. Will1, K. Kuszpit3, A. Alfaro3, N. Bhagroo1, L. Jermutus4, C.J. Rhodes1;
1Bioscience Metabolism, Research and Early Development, Cardiovascular, Renal and Metabolism, BioPharmaceuticals R&D, AstraZeneca, Gaithersburg, 2Mouse Metabolic Phenotyping Center, Vanderbilt University, Nashville, 3Imaging and Data Analytics, Clinical Pharmacology and Safety Sciences, AstraZeneca, Gaithersburg, 4Projects, Research and Early Development, Cardiovascular, Renal and Metabolism, BioPharmaceuticals R&D, AstraZeneca, Gaithersburg, USA.
Background and aims: Cotadutide (MEDI0382) is a peptide with targeted GLP-1/glucagon (Gcg) receptor activity that has beneficial effects on type 2 diabetes (T2D) and obesity in humans and mice, and shows marked improvements in NAFLD/NASH in mice. We performed hyperinsulinemic clamps in diet induced obese (DIO) mice to understand whether improved insulin sensitivity and β-cell function are responsible for the improved glycemia in clinical studies.
Materials and methods: Following 28 days of daily dosing with Cotadutide (10 nmol/kg), Liraglutide (5 nmol/kg; GLP-1 agonist), g1437 (5 nmol/kg; Gcg analog) or vehicle, mice underwent continuous infusion of 4mU/kg/min insulin and [3H]-glucose to assess glucose turnover. Tissue-specific glucose uptake was assessed using 14C-2-deoxyglucose and confirmed in a separate study of [18F]FDG uptake by PET imaging. β-cell insulin secretion was assessed in isolated islets subject to perifusion with basal (2.8 mmol/L) and stimulatory (16.7 mmol/l) glucose media.
Results: We observed lower (p < 0.05) body weight in all groups vs vehicle, with g1437 eliciting the largest response (~-36%) and Liraglutide the least (~-9%). Fasting glucose was higher (p < 0.05) in g1437 treated mice vs vehicle (158.4 ± 7.73 vs. 137.8 ± 3.01 mg/dL, respectively). Fasting insulin was dramatically lower (p < 0.001) in Cotadutide and g1437 groups vs vehicle (1.07 ± 0.47, 0.79 ± 0.15 and 8.68 ± 1.98 ng/mL, respectively). Despite an equal rate of insulin infusion during the clamp, the total insulin levels remained significantly lower (p < 0.001) in Cotadutide and g1437 treated mice vs vehicle (4.87 ± 1.05, 2.03 ± 0.21 and 20.24 ± 4.15 ng/mL, respectively). The glucose infusion rate (GIR), to maintain euglycemia ~130 mg/dL, was significantly higher (p < 0.01) in Cotadutide treated mice in line with increased (p < 0.05) glucose disposal rate (Rd) vs vehicle (GIR AUC: 1754 ± 158.9 vs. 943 ± 161; Rd: 47 ± 2.83 vs. 35.38 ± 1.79 mg/kg/min, respectively). Hepatic glucose production was suppressed to similar levels in all groups (Vehicle 9.50 ± 1.32; Cotadutide 10.86 ± 0.77; g1437 10.14 ± 1.20; Liraglutide 8.60 ± 0.73 mg/kg/min), despite the significantly lower insulin in Cotadutide and g1437 treated mice. Glucose uptake was elevated (p < 0.01) in brown adipose tissue by Cotadutide vs vehicle, assessed by both 14C-2-deoxyglucose (249.2 ± 24.02 vs. 130.1 ± 20.29 μmol/100g tissue/min, respectively) and [18F]FDG uptake (7.52 ± 1.38 vs. 1.37 ± 0.10 %ID/g, respectively). Insulin secretion from isolated islets was dramatically reduced (p < 0.0001) by Cotadutide vs vehicle (AUC 71128 ± 3649 vs. 261563 ± 14977, respectively), despite similar levels of total pancreas insulin content (264716797 ± 29477986 vs. 283513794 ± 48052951 pg insulin/g pancreas).
Conclusion: This data shows that Cotadutide improves insulin sensitivity in concert with reduced insulin demand, resulting in recovery of endogenous β-cell function.
Supported by: NIH - DK059637
Disclosure: R.C. Laker: Employment/Consultancy; Employee of AstraZeneca.
512
Dasiglucagon is a novel stable glucagon analogue with fast glucose response following subcutaneous injection in hypoglycaemic rats
F. Macchi, C. Wenander;
Zealand Pharma A/S, Søborg, Denmark.
Background and aims: Severe hypoglycemia is a serious, life-threatening event that requires fast intervention by caregivers. Glucagon as a powder for reconstitution has been available as a treatment option for several years, but its tendency for aggregation in solution has hampered development of easy-to-use emergency devices that provide fast recovery. Dasiglucagon is a novel glucagon analog, here characterized for its propensity to form aggregates in aqueous solutions, potency on the glucagon receptor and effect on blood glucose following subcutaneous injections in hypoglycemic rats.
Materials and methods: The aggregation tendency of dasiglucagon was investigated by an accelerated stability assay run at 40°C under shaking conditions and by a one year rotation study at room temperature on pre-filled syringes. An in vitro study was performed to compare the receptor potency of dasiglucagon to glucagon and a rat hypoglycemia model was used to investigate the effect of dasiglucagon on blood glucose following subcutaneous injections.
Results: An accelerated stability assay demonstrated that dasiglucagon did not form aggregates over 14 days, while glucagon was fully aggregated within the first day. A long term stress study with dasiglucagon drug product confirmed that aggregates did not develop even following continuous rotation at room temperature for one year. In vitro studies demonstrated that dasiglucagon has similar receptor potency on the human glucagon receptor as glucagon. Furthermore in a rat hypoglycemia model, subcutaneous injection of dasiglucagon and native glucagon in aqueous solution demonstrated a fast and comparable dose-dependent increase in blood glucose.
Conclusion: Dasiglucagon is a 29 amino acid glucagon analog. Seven amino acid substitutions were introduced to increase physical and chemical stability. The propensity of glucagon to form aggregates in aqueous solutions was prevented, while maintaining potency for the glucagon receptor and a fast absorption following subcutaneous injections.

Disclosure: F. Macchi: None.
PS 37 Models of obesity and insulin resistance
513
Full body Nr4a3 deletion induces obesity and glucose intolerance
J.S. Tessem1, H. Yang1, J.A. Herring2;
1Nutrition, Dietetics and Food Science, Brigham Young University, Provo, 2Microbiology and Molecular Biology, Brigham Young University, Provo, USA.
Background and aims: Nr4a3 is currently an orphaned nuclear receptor with no known ligand. We have shown that Nr4a3 is critical for controlling expression of various genes essential for glycolysis, TCA cycle and the electron transport chain. While a ligand is currently undefined, we and others have recently demonstrated that Nr4a3 activity is impeded by fatty acids. Nr4a3 is expressed in various metabolic tissues, including adipose, skeletal muscle, kidney, liver and beta cells. Loss of Nr4a3 in beta cells impairs mitochondrial respiration and insulin secretion. Nr4a3 is downregulated in the adipose and skeletal muscle of ZDF rats, STZ treated rats, ob/ob mice and db/db mice. Nr4a3 expression is also downregulated in islets from diabetic human donors. Given these data, we sought to determine the effect of Nr4a3 knock out under conditions of standard and high fat chow feeding on body weight, glucose tolerance and mitochondrial respiration of various metabolic tissues.
Materials and methods: Female and Male Nr4a3-/- and Nr4a3+/+ litter mate controls were fed a standard or high fat chow diet for 25 weeks starting at weening. Weekly blood glucose and body weights were measured. Glucose tolerance and insulin tolerance tests were conducted every four weeks. At study completion tissue was harvested for high-resolution respirometry, histology and biochemical assays.
Results: Here we present data demonstrating that male and female Nr4a3 -/- mice fed a standard diet have a ~22% increase in body mass, and a ~30% increase in body mass when fed a high fat diet. The increased body weight corresponds with significantly increased adipose mass. Nr4a3-/- mice present elevated blood glucose and impaired glucose tolerance. Nr4a3 -/- mice fed a standard diet presented no difference in liver or muscle respiration, however adipose respiration was significantly impaired regardless of sex. Animals fed a high fat diet presented with impaired adipose, liver and muscle respiration.
Conclusion: These data begin to demonstrate that Nr4a3 is necessary for whole-body glucose homeostasis, that loss of Nr4a3 predisposes animals to obesity and glucose intolerance, and that high fat feeding worsens the observed phenotypes. These data serve as a step toward understanding the role that Nr4a3 plays in Type 2 Diabetes disease progression.
Disclosure: J.S. Tessem: None.
514
Genetic deficiency of ectonucleotide pyrophopshatease-6 ameliorates high-fat-diet-induced visceral obesity and diabetes
R. Wang, K.E. Schraut, S.P. Webster, N.M. Morton;
Centre for Cardiovascular Science, The University of Edinburgh, Edinburgh, UK.
Background and aims: Despite the continuing global rise in prevalence of obesity and consequent type 2 diabetes, few effective medicines are available to ameliorate these diseases. Ectonucleotide pyrophosphatase/phosphodiesterase (ENPPs) family enzymes have recently emerged as potential mechanistically distinct therapeutic targets for metabolic and vascular diseases. Of these, ENPP6, a lysophospholipase C-type enzyme expressed predominantly in newly formed oligodendrocytes, liver sinusoidal endothelial cells and kidney proximal tubule cells, was linked to excessive hepatic lipid accumulation as a result of local choline deficiency. To better understand the role of ENPP6 in nutrient metabolism, we characterised the Enpp6 gene knockout mice (Enpp6-/- mice) and tested the hypothesis that choline deficiency provided an underlying mechanism for their metabolic phenotype.
Materials and methods: Enpp6-/- and control Enpp6+/+ mice on a mixed 129S6/B6 genetic background were fed a high-fat-diet (58% fat and 0.08% standard choline content) for 7 weeks, followed by either a 2% choline-supplemented high-fat-diet or a 0% choline-deficient high-fat-diet for 2 weeks. Pre and post-diet glucose tolerance, longitudinal fat mass by time-domain nuclear magnetic resonance (TD-NMR), liver triglyceride content and necropsy organ weights were assessed.
Results: After high-fat-diet feeding, Enpp6-/- mice exhibited selectively reduced visceral fat, improved glucose tolerance and were protected from fatty liver compared to Enpp6+/+ mice. Enpp6-/- and Enpp6+/+ mice displayed comparable energy expenditure, respiratory exchange ratio and activity. Choline supplementation normalised visceral fat gain, glucose tolerance and liver fat accumulation without altering food intake in Enpp6-/- mice. Choline deficiency reduced further fat mass gain in Enpp6-/- mice relative to Enpp6+/+ mice without further improving glucose tolerance.
Conclusion: Enpp6-/- mice are resistant to high-fat-diet-induced visceral obesity and diabetes. The improved metabolic phenotype of Enpp6-/- mice is reversed by choline supplementation, but is not further impacted by short-term dietary choline deficiency. ENPP6 inhibition is a potential novel therapeutic approach for visceral obesity and diabetes.
Supported by: WT Enhancement Award 100981/Z/13/A to NMM and a Principals PHD Scholarship to RW
Disclosure: R. Wang: None.
515
Inhibition of cardiac hyaluronan deposition improves cardiac function in high-fat diet-induced insulin-resistant mice
V. Musale, A. Hasib, C.K. Hennayake, C.E. Murdoch, L. Kang;
School of Medicine, University Of Dundee, Dundee, UK.
Background and aims: The expansion of the extracellular matrix (ECM) is strongly associated with insulin resistance. ECM hyaluronan is a glycosaminoglycan component known to activate CD44, a major cell surface hyaluronan receptor. PEGylated human recombinant hyaluronidase PH-20 enzyme (PEGPH20) demonstrated a dose-dependent decrease in ECM hyaluronan deposition in skeletal muscle and improved muscle glucose uptake in diet-induced insulin-resistant mice. We further expanded this study to investigate the role of ECM hyaluronan on cardiac function.
Materials and methods: Male mice fed a high-fat diet (HFD) for 12 weeks received either vehicle (10 mmol/L histidine, 130 mmol/L NaCl at pH 6.5) or PEGPH20 (1 or 10 mg/kg body weight) via the tail vein, once every 3 days for 24 days. An additional group fed on chow diet was used as lean controls. At the end of the treatment, Pressure-Volume (PV) loop analysis (Transonic) was performed to measure left ventricular cardiac dynamics using PV conductance catheter in closed-chest preparation. Moreover, immunohistochemical analysis was performed to assess changes in the ECM hyaluronan and endothelial markers (CD31 and von Willebrand factor).
Results: HFD significantly increased hyaluronan deposition in the heart and impaired cardiac function in mice as evidenced by increased systolic arterial blood pressure, left ventricular (LV) end-systolic pressure (Pes) and LV end-diastolic pressure (Ped). Also, HFD impaired cardiac contraction (dp/dtmax) and relaxation (dp/dtmin). Administration of PEGPH20 to HFD-fed mice significantly (P<0.05) lowered hyaluronan deposition in the heart compared to vehicle controls. PEGPH20 lowered systolic (P<0.01) and diastolic (P<0.01) blood pressure, as well as pulse pressure (P<0.01), without altering body weight or body composition in HFD-fed mice when compared with vehicle controls. Increased LV Pes and Ped in HFD-fed mice were reversed by PEGPH20, suggesting improved cardiac function. Moreover, impaired dp/dtmax and dp/dtmin were also restored by PEGPH20 in HFD-fed mice. End-systolic pressure-volume relationship (ESPVR), end-diastolic pressure-volume relation (EDPVR) and preload recruitable stroke work (PRSW) were not significantly different among the groups. Improved cardiac function in PEGPH20-treated mice was associated with increased expression of endothelial markers in the heart (CD31 and von Willebrand factor).
Conclusion: Pharmaceutical inhibition of hyaluronan deposition in the heart improves cardiac function in obese insulin-resistant mice, accompanied by improved vascularisation of the heart. These findings contribute to understandings of how the ECM can modify cardiac function, highlighting a potential therapeutic target in obesity-induced cardiac dysfunction.
Supported by: British Heart Foundation
Disclosure: V. Musale: None.
516
WITHDRAWN
517
SGLT2 inhibitor (empagliflozin) markedly improves diabetes-related phenotype in Diabetes with Enlarged Kidneys (DEK) rats
A. Domon, Y. Tochigi, T. Sato, K. Katayama, H. Tazaki, H. Suzuki;
Veterinary, Nippon Veterinary and Life Science University, Musashino-shi Tokyo, Japan.
Background and aims: Sodium glucose co-transporter 2 inhibitors (SGLT2i) decrease blood glucose level by inhibiting glucose reabsorption in renal tubules. SGLT2i also have pleiotropic effect, which are partly independent of lowering of blood glucose, such as renoprotective effect and systemic metabolism improvement. However, the effects of SGLT2i vary across patients in human and also across animal models. Recently, we established a novel rat strain, Diabetes with Enlarged Kidney (DEK), showing non-obese type 2 diabetes mellitus, progressive insulin deficiency, and kidney enlargement with age. Here, we investigated the effect of SGLT2i on blood glucose, metabolism and renal function in DEK rats.
Materials and methods: Male diabetic DEK rats over 15 weeks of age (>300mg of non-fasting blood glucose) were given with chow containing empagliflozin (ep-DEK, 300mg/kg in standard chow) or standard chow (st-DEK) for 12 weeks. Blood glucose level was monitored via tail vein. At the end of experiment, water and food intake, urinary volume and organ weight were measured. Biochemical parameters in plasma and urea were measured by Dri-Chem 3500V. Amino acids in plasma were analyzed by GC-MS and subjected to principal components analysis (PCA). Renal tissues were evaluated with PAS staining.
Results: Blood glucose level was dramatically decreased at the next day of starting empagliflozin treatment (404.6±72.6mg/dl to 136.4±14.7mg/dl, p<0.05) and kept under 300mg/dl until the end of experiment in ep-DEK. Body weight of ep-DEK significantly increased (pre: 409.4±46.5g vs post:465.4±30.0g, p<0.05), while body weight of st-DEK was not changed (pre: 365.2±48.9g vs post: 376.8±46.7g). Water intake and urinary volume for 24h in ep-DEK were decreased to almost 50% of those in st-DEK. Food intake was also significantly decreased in ep-DEK. Empagliflozin did not attenuate kidney enlargement (ep-DEK: 2.4±0.3g vs st-DEK:2.2±0.2g, ns) and histological alternation such as the dilation of renal tubule. However, empagliflozin led to increased fractional excretion of glucose (ep-DEK: 100±31% vs st-DEK:24±1%, p<0.05) and decreased excretion of urea nitrogen (ep-DEK: 401.3±40.6mg vs st-DEK:483.0±31.3mg, p<0.05) without changing creatinine clearance. Characteristically decreased levels of total cholesterolin DEK rats were increased by empagliflozin (ep-DEK: 79.0±9.1mg/dl vs st-DEK:62.0±4.3mg/dl, p<0.05) as well as total protein (4.4±0.2g/dl vs 4.0±0.05g/dl, p<0.05). Empagliflozin changed the concentration of some amino acids and aggregated scattered individual data into one cluster similar to normal rats.
Conclusion: Treatment of DEK with SGLT2i kept blood glucose levels in normal range, dramatically attenuated polyuria and polydipsia, and improved several metabolic parameters in plasma. Effects of SGLT2i observed in DEK rats were clearly different from those of other animal models. Our data suggested that DEK rats have unique features for responsiveness to SGLT2i, and is useful model for studying the multiple roles of SGLT2i in diabetic condition.
Disclosure: A. Domon: None.
518
Mitochondrially targeted tamoxifen improves diet-induced obesity and diabetes and reduces adipose tissue senescence in experimental mice
J. Trnovska1, E. Davidova2, P. Svoboda1, H. Kratochvilova1, M. Mraz1, S. Hubackova2, J. Neuzil2,3, M. Haluzik1;
1Center for Experimental Medicine, Institute for Clinical and Experimental Medicine, Prague, Czech Republic, 2Biotechnology and Biomedicine Centre of the Academy of Sciences and Charles University, Vestec, Czech Republic, 3Griffith University, Queensland, Australia.
Background and aims: Diabetes and ageing are mutually linked and senescent cells might be involved in the development of obesity and type 2 diabetes mellitus (T2DM). Recent studies have shown that senolytic agents may improve diabetes-related pathologies. To this end we have tested our novel anti-cancer agent with senolytic properties, mitochondrially targeted tamoxifen (MitoTam), in a mouse model of T2DM.
Materials and methods: Obesity and diabetic metabolic profile were induced by high fat diet (HFD) feeding in 20 C57BL/6J male mice for 6 months with another group fed a standard diet (SD) serving as controls. Subsequently, both groups were divided into 2 subgroups (n=10 each) treated either with MitoTam (2μg/1g of body weight dissolved in 4% ethanol in corn oil) or the excipient given i.p. twice a week for a period of 4 weeks.
Results: In HFD animals, MitoTam (MT) decreased body weight already after 2 weeks of treatment, with most pronounced reduction of visceral adipose tissue (VAT, P<0.001), whereas it had no effect on body weight in SD group. MitoTam also reduced fasting glucose (HFD+MT: 6.2±0.4 vs. HFD: 9.8±0.4 (mmol/l); P<0.001) as well as postprandial glucose AUC (HFD+MT: 1517±57 vs. HFD: 2309±111 (mmol/l x min); P<0.001) of HFD mice to levels comparable with SD group. This glucose-lowering effect was accompanied by a decrease in serum triglycerides (P<0.002), insulin (P<0.002), leptin (P<0.001) and glucose-dependent insulinotropic peptide (GIP, P<0.03) together with reduction of mRNA expression of leptin in epididymal adipose tissue (EAT, P<0.001), EAT adipocyte size and lipid accumulation in the liver (P<0.002). HFD-induced obesity and T2DM phenotype was associated with elevated levels of senescent markers p16 and β-gal in EAT (P<0.001 for p16 and P<0.03 for β-gal vs. SD), both of which were markedly reduced by MitoTam treatment (P<0.001 for p16 and P<0.002 for β-gal vs. HFD).
Conclusion: In conclusion, our results suggest that MitoTam significantly improves HFD-induced obesity and diabetes in mice and that this effect might be in part mediated by alleviated senescence in adipose tissue.
Supported by: Czech Science Foundation GA 18-02550S; MH CZ - DRO (IKEM, IN 00023001)
Disclosure: J. Trnovska: None.
PS 38 Lipid metabolism
519
Plasma lipidomic signature of epicardial fat volume: Rotterdam study
F. Ahmadizar, M. Bos, D. Bos, A. Ikram, M. Ghanbari, M. Kavousi;
Erasmus University Medical Center, Rotterdam, Netherlands.
Background and aims: Recent evidence highlights a link between larger epicardial fat volume (EFV) and an unfavorable cardio-metabolic profile. We explored the association of plasma lipid metabolites with EFV among the general population. We also performed the analyses in a subset of subjects with type 2 diabetes (T2D).
Materials and methods: Plasma samples were collected between 2002 and 2005 and the levels of metabolites were measured by proton nuclear magnetic resonance (1H-NMR) spectroscopy (Nightingale Health Ltd). The assessment of EFV was through ECG-gated cardiac multidetector computed tomography (MDCT), quantified in milliliters. Linear regression analysis adjusted for age, sex, BMI, lipid-lowering medications and smoking and corrected for multiple testing (P-value 0.05/142 independent lipid metabolites = 3.5 × 10⁻⁴) was used to assess cross-sectional associations between 202 lipid metabolites and EFV.
Results: We included a total of 695 participants from the population-based Rotterdam Study. As shown in Figure 1, after correction for multiple testing, 102 lipid metabolites were independently associated with EFV; the strongest positive association was shown with phospholipids in large VLDL (beta: 0.1; SE: 0.01; p-value: 9.9 × 10⁻¹⁶), triglycerides, and lipids in VLDL subclasses. Higher levels of circulating phospholipids in large VLDL were significantly associated with larger EFV in individuals with T2D (beta: 0.07; SE: 0.03, p-value:1.6 × 10⁻⁴). In individuals free of diabetes, the lipid profile was similar to the general population, except for phospholipids where the association was not significant.
Conclusion: Increased levels of circulating lipid metabolites mainly phospholipids in large VLDL were associated with the larger epicardial fat volume. Phospholipid metabolism has shown a central role in the pathogenesis of metabolic disease and is associated with insulin resistance and type 2 diabetes. Association of lipidomic signature to fat deposit may provide more biological insights into risk stratification for metabolic outcomes.

Disclosure: F. Ahmadizar: None.
520
Palmitate-enriched fat ingestion acutely induces insulin resistance likely via lipid-mediated PKCε activation in skeletal muscle of healthy humans
T. Sarabhai1, C. Koliaki1, L. Mastrototaro1, S. Kahl1, D. Pesta1, M. Apostolopoulou1, M. Wolkersdorfer2, A. Bönner1, P. Bobrov3, D. Markgraf1, C. Herder1, M. Roden1,4;
1AG Energy, German Diabetes Center, Düsseldorf, Germany, 2Department of Production, Landesapotheke Salzburg, Salzburg, Austria, 3German Diabetes Center, Düsseldorf, Germany, 4Division of Endocrinology and Diabetology, Düsseldorf, Germany.
Background and aims: Hypercaloric high-fat diets cause dyslipidemia and insulin resistance. Nevertheless, the degree of dietary fatty acid (FA) saturation seem to differently affect the risk of type-2 diabetes and cardiovascular disease, with saturated FA (SAFA) considered to be harmful compared to polyunsaturated FA (PUFA). This may result from different effects on glucose metabolism and mitochondrial function.
Materials and methods: We aimed at comparing acute metabolic effects of 1.2 g/kg body weight palm oil (PO, SAFA-rich) and safflower oil (SO, PUFA-rich) vs. control (CO, water) in glucose-tolerant volunteers (10 men / 6 women; age 24±2 years; BMI 23.1±0.9 kg/m2). The three interventions were spaced by 3-week intervals. Whole-body glucose disposal (Rd) was assessed with [6,6-2H2]glucose before and during hyperinsulinemic-euglycemic clamps. Skeletal biopsies were performed to assess intramyocellular concentrations of diacylglycerols (DAG), ceramides by targeted metabolomics, protein kinase C (PKC) ε/θ activities from cytosolic-to-membrane translocation before, at 2 and 4 hours (pre-clamp) and at 7 h (hour one of the clamp) after each intervention.
Results: Only PO increased palmitic acid by 54%, while both SO and PO increased plasma oleic acid by 53% and 44%, respectively (p<0.05 to CO). During the pre-clamp period, only PO decreased Rd by 28%. At 4 h, muscle cytosolic DAG and ceramide content increased after both PO and SO (p<0.05 to CO). Membrane DAG, but not ceramides, rose by 100% after PO and 85% after SO (iAUC p<0.05 to CO). While PKCθ translocation increased after both interventions, PKCɛ activity rose by 57% after PO only (p<0.05). During the subsequent clamp, insulin-stimulated Rd decreased by 38% after PO and by 26% after SO (all p<0.05 to CO), but non-oxidative glucose disposal was lower after PO than after SO (p<0.05).
Conclusion: While acute lipid ingestion generally decreases whole-body glucose disposal, acute palmitate-rich lipid ingestion specifically rapidly decreases insulin-sensitive non-oxidative glucose disposal. This is preceded by lipid-mediated activation of PKCɛ translocation, which may cause insulin resistance via inhibiting proximal insulin signalling.
Clinical Trial Registration Number: NCT01736202
Supported by: Science/Research Ministry, Health Ministry, Federal Research Ministry, Research-Foundation, Diabetes
Disclosure: T. Sarabhai: None.
521
Predictive values of ANGPTL8 on risk of all-cause mortality in diabetic patients: from REACTION study
H. Zou, X. Yu;
Division of Endocrinology, Department of Internal Medicine, Tongji Hospital, Tongji Medical College, Huazhong University of Science and Technology, Wuhan, China.
Background and aims: ANGPTL8, an important regulator for glucose and lipid metabolism, was increased in diabetes and associated with insulin resistance. However, the role of ANGPTL8 for outcomes of diabetes remains unclear. The study aimed to investigate circulating levels of ANGPTL8 in participants with and without diabetes and its potential association with death, cardiovascular and renal outcomes in a 5-year cohort study.
Materials and methods: Propensity-matched cohorts of subjects with and without diabetes from Risk Evaluation of Cancers in Chinese Diabetic Individuals: a longitudinal (REACTION) study were generated on the basis of age, gender and body-mass index at baseline. Primary outcome was death from any cause. Secondary outcome was a composite of new-onset major adverse cardiovascular events, hospitalization for heart failure and renal dysfunction. Comparisons between groups were performed by Kruskal-Wallis test for continuous variables and Ξ2 test for categorical variables. Logistic regression and restricted cubic splines were used to detect associations between ANGPTL8 and risk of outcomes. Receiver-operator characteristic (ROC) curves were drawn to assess the predictive value of ANGPTL8 on risk of outcomes.
Results: Serum ANGPTL8 levels were elevated in patients with T2DM (N=769) compared to subjects in control group (618.82 ± 318.08 vs. 581.20 ± 299.54, p = 0.03). Furthermore, increasing quartiles of ANGPTL8 were associated with an increased all-cause mortality in both control and diabetes group (all p values < 0.05). Binary logistic regression analysis showed that elevated ANGPTL8 level was associated with a greater risk ratio (RR) of death (RR in quartile 4 vs quartile 1, 3.47; 95% CI 1.30 - 9.29) and renal dysfunction (RR in quartile 4 vs quartile 1, 10.50; 95% CI 1.32 - 83.60) in diabetic patients. Multivariable-adjusted restricted cubic spline analyses suggested a significant linear relationship between ANGPTL8 and all-cause mortality in diabetic patients (p for non-linear trend = 0.99, p for linear trend = 0.01) but not in control group (p for non-linear trend = 0.26, p for linear trend = 0.80). According to ROC curves, in combination with ANGPTL8, QMortality and QFrailty score showed a better performance in predicting for death, especially in subjects with diabetes.
Conclusion: In conclusion, serum ANGPTL8 levels were associated increased risk for all-cause mortality and renal dysfunction in subjects with diabetes. Furthermore, ANGPTL8 had a good performance on predicting all-cause mortality in diabetic patients, which may contribute to early detection of individuals of diabetes in higher risk group.

Supported by: National Natural Science Foundation of China (81570740, 81974109)
Disclosure: H. Zou: None.
522
Hepatic output of palmitic and oleic acids during weight loss and remission of type 2 diabetes
S. Melhem1, G. Lietz2, N. Sattar3, M.E.J. Lean4, R. Taylor1, A. Al-Mrabeh1;
1Translational and Clinical Research Institute, Magnetic Resonance Centre, Newcastle University, Newcastle upon Tyne, 2Human Nutrition Research Centre, Population Health Sciences Institute, Newcastle University, Newcastle upon Tyne, 3Institute of Cardiovascular & Medical Sciences, Glasgow University, Glasgow, 4School of Medicine, Dentistry and Nursing, Glasgow University, Glasgow, UK.
Background and aims: Saturated fatty acids and related lipid intermediates contribute to the pathogenesis of type 2 diabetes. It is widely considered that saturated fatty acids are toxic whereas monounsaturated fatty acids are beneficial to insulin signaling and beta cell function, but little in vivo evidence exists. We assessed the change in hepatic output and plasma levels of palmitic and oleic acids, the most abundant saturated and monounsaturated fatty acids respectively, following weight loss and remission of type 2 diabetes.
Materials and methods: 54 participants from the Tyneside cohort of The Diabetes Remission Clinical Trial were studied over 2 years (25/29 F/M, 53.1±1.0 years, and 101.0±2.4kg). Hepatic output of palmitic and oleic acids were assessed from the increment in plasma VLDL-TG concentration following competitive blocking of uptake and subsequent quantification by GC-MS of the rate of accumulation of fatty acids in the VLDL-TG fraction.
Results: At baseline, hepatic output of palmitic and oleic acids was higher in diabetes versus non-diabetic controls (0.57±0.04 vs. 0.45±0.04 mg/min; p=0.025, and 0.69±0.06 vs. 0.52±0.05 mg/min; p=0.038, respectively).Fasting plasma VLDL-palmitic acid was high in diabetes compared with the non-diabetic controls (11.3±0.8 vs. 7.7±0.8mg/l, p=0.002) whereas VLDL-oleic acid was similar to controls (13.4±1.0 vs. 11.1±1.5mg/l, p=0.24).There was a major fall in hepatic output of palmitic acid after weight loss (to 0.37±0.4 mg/min, p<0.0001) associated with a decrease in fasting plasma VLDL-palmitic acid (to 9.4±1.0mg/l, p=0.034). Fasting plasma VLDL- oleic acid did not change significantly after weight loss (to 11.2±0.04mg/l, p=0.07), despite the fall in oleic acid output (to 0.50±0.03 mg/min, p=0.003). The fall in fasting VLDL-palmitic acid was only significant in those who achieved remission of diabetes (p<0.05) whereas VLDL palmitic acid output decreased irrespective of remission (p<0.005). At baseline, there was a strong correlation between fasting palmitic acid and oleic acid (r=0.96, p<0.0001), and between hepatic output of both fatty acids (r=0.89, p<0.0001). Palmitic and oleic acids were both correlated negatively with HDL cholesterol (r=-0.51, p<0.0001 and r=-0.49, p<0.0001), and positively with visceral fat volume (r=0.41, p=0.004, and p=0.47, p=0.001), respectively.At 24 months, those who initially achieved remission of diabetes then relapsed to a diabetic state were characterized by higher fasting VLDL-palmitic and oleic acids than those remaining in remission (17.1±2.4 vs. 7.6±1.1mg/l, p=0.002 and 20.2±2.5 vs. 10.6±1.9mg/l, p=0.007, respectively).
Conclusion: These data highlight the importance of considering the balance between palmitic acid and oleic acid on VLDL-TG metabolism in type 2 diabetes. Remission of type 2 diabetes was associated with fall in hepatic output and plasma levels of VLDL-palmitic acid, but discordance in hepatic output and plasma level of oleic acid. These changes are potentially of pathogenic importance and further work on the effects of ambient diet and on hepatic fatty acid synthesis is required.
Supported by: Diabetes UK
Disclosure: S. Melhem: None.
523
Glucocorticoids impair HDL-mediated cholesterol efflux but paradoxically increase HDL-cholesterol concentration
B. Bouillet1, T. Gautier2, D. Denimal2, M. Samson3, D. Masson2, J.-P. Pais de Barros2, G. Maquart2, M. Xolin2, H. Dalle4, A. Grosfeld4, M. Moldes4, B. Fève4, B. Vergès1;
1Endocrinology, Diabetes and Metabolic Disorders, Dijon University Hospital, Dijon, 2INSERM Unit LNC UMR1231, Universite Bourgogne-Franche Comté, Dijon, 3Internal Medicine and Clinical Immunology, Dijon University Hospital, Dijon, 4INSERM, Saint-Antoine Research Center, UMR_S938, Sorbonne Université, Paris, France.
Background and aims: Glucocorticoids (GC) are associated with increased cardiovascular morbidity but increased HDL-C concentration. HDL-mediated cholesterol efflux, a major anti-atherogenic property of HDL particles, is inversely associated with CVD risk. We aimed to determine whether HDL-mediated cholesterol efflux is influenced by GC.
Materials and methods: In this prospective and observational study, lipid parameters, HDL composition, HDL-mediated cholesterol efflux, CETP, PLTP and LCAT activities were determined in 10 patients with giant cell arteritis before and 3 months after GC introduction and in 7 control subjects. HDL concentration and composition, HDL-mediated cholesterol efflux and LCAT activity were determined in GC-treated mice. In vivo kinetic study of HDL was also performed in GC-treated mice.
Results: HDL-C concentration in GC-treated patients was higher than in patients before treatment (p=0.002). In mice, HDL-C level was significantly increased after GC exposure (p=0.04). CETP activity in patients after GC treatment was significantly lower than in patients before GC treatment (p=0.03). CETP activity did not correlate with lipid parameters, CRP and HDL-mediated cholesterol efflux. In a kinetic experiment, plasma fluorescence decay curves of bodipy labelled HDL were not significantly different between mice treated or not with GC. GC-treated patients had higher cholesteryl ester content in HDL, higher HDL2-to-HDL3 ratio and higher LCAT activity than before GC treatment (p=0.008, p=0.02, and p=0.004, respectively). HDL-mediated cholesterol efflux was decreased in GC-treated Patients (p=0.008) and GC-treated mice (p=0.04), and was negatively associated with proportion of cholesteryl ester in HDL (p=0.04), independently of CRP.
Conclusion: We report for the first time that HDL-mediated cholesterol efflux is impaired by GC despite an increased HDL-C level in patients with giant cell arteritis and in GC-treated mice. This impaired HDL functionality could contribute to the increased CVD risk observed in GC-treated patients. HDL enrichment in cholesteryl ester may play a role in the GC-induced impairment of HDL functionality. Our data suggest that the rise in HDL-C concentration observed under GC is not explained the decreased clearance of HDL. GC-treated mice had increased HDL-C level, despite the lack in CETP protein, suggesting that modulation of CETP activity is not a main driver of plasma HDL-C level under GC treatment. Further studies are needed, in larger populations, to get further into the effect of GC on HDL.
Clinical Trial Registration Number: NCT02158208
Supported by: INSERM, Sorbonne University, University of Bourgogne, SFD, FRM
Disclosure: B. Bouillet: None.
524
Which is the best formula to estimate LDL cholesterol: Friedewald or Martin formula? Comparative study in the e_COR study population
C. Ferrinho1, A. Alves2, M. Bourbon2, J. Sequeira Duarte1;
1Hospital Egas Moniz, Lisboa, 2Instituto Nacional De Saúde Doutor Ricardo Jorge, Lisboa, Portugal.
Background and aims: The LDL cholesterol (c-LDL) is a key factor in assessing the risk of cardiovascular disease, so accuracy of the estimated values is important. The Friedewald formula has been used for decades, but several authors point out some limitations. Martin et al. suggested a similar formula in which the impact of high triglyceride concentrations is minimized, allowing, according to this author, a better accuracy in the estimation of LDL cholesterol. Our aim was to apply the Martin formula and compare with the Friedewald formula and evaluate which is the closest to direct determination of c-LDL concentration.
Materials and methods: Cross-sectional study. A total of 1689 participants who participated in the e_COR study were included (a random sample stratified by gender and age from five regions of Portugal). We applied the Martin and Friedewald formulas for the estimate of c-LDL (LDL-M and LDL-F, respectively). Friedewald formula was not applied in 12 cases due to triglycerides ≥ 400 mg/dL. We evaluated 32 variables, including the lipid profile that contained the direct determination of c-LDL concentration (LDL) by the direct colorimetric method on Roche's Cobas Integra 400 equipment. We used Spearman's coefficient ρ (ρ) and linear regression (r2) to compare and verify the accuracy of the formulas. The results are presented in median and interquartile range (IQR). The level of significance accepted was p-value<0.05.
Results: The median age of the 1689 participants was 51 (34) years and 50.2% were male. Of all participants, 48.5% had hypertension, 28.1% were taking medication for dyslipidemia, 11.7% were diabetic and 2.5% had a history of acute myocardial infarction. The median LDL cholesterol was 117.0 (44.0) mg/dL, LDL-M was 114.6 (43.7) mg/dL and LDL-F was 113.8 (43.2) mg/dL. In the correlation between LDL and LDL-M, we obtained ρ=0.987, p-value<0.001; between LDL and LDL-F we obtained ρ=0.983, p-value<0.001. In linear regression, we found for LDL/LDL-M r2=0.977 and for LDL/LDL-F r2=0.969, p-value<0.001 in both cases. This correlation was maintained when we applied only in group with Diabetes (LDL/LDL-M ρ=0.987; LDL/LDL-F ρ=0.978, p-value<0.001 in both cases). In the 12 cases with triglycerides ≥ 400 mg/dL, we found for LDL/LDL-M ρ=0.916 and r2=0.955, p-value <0.001.
Conclusion: In this study it was possible to verify that Martin formula correlates strongly with direct c-LDL allowing an accuracy close to 100% in the c-LDL estimate. We showed its applicability in general sample and in group with diabetes, allowing an accuracy superior to Friedewald formula. In a small subgroup of hypertriglyceridemia, the data suggest that, in cases of triglycerides ≥ 400 mg/dL, Martin formula may be of interest in estimating c-LDL.
Disclosure: C. Ferrinho: None.
525
Major decreases in the lipidome following liraglutide treatment
A. Wretlind1,2, E.H. Zobel1, R.S. Ripa3, B.J. von Scholten1, T. Suvitaival1, T.W. Hansen1, H. Vestergaard2,4, A. Kjaer3, C. Legido-Quigley1,5, P. Rossing1,3;
1Steno Diabetes Center Copenhagen, Gentofte, Denmark, 2University of Copenhagen, Copenhagen, Denmark, 3Dept of Clinical Physiology, Nulear Medicine & PET and Cluster for Molecular Imaging, Rigshospitalet and University of Copenhagen, Copenhagen, Denmark, 4Bornholms Hospital, Roenne, Denmark, 5King's College London, London, UK.
Background and aims: Treatment with human glucagon-like peptide-1 (GLP-1) analogues can reduce risk of cardiovascular disease in type 2 diabetes, however the mechanisms behind this cardiovascular benefit is still debated. We investigated changes in the plasma lipidome following treatment with liraglutide in order to explore the downstream metabolic changes.
Materials and methods: In a double-blind placebo-controlled trial, we randomized 102 persons with type 2 diabetes to liraglutide (up to 1.8 mg once daily) or placebo for 26 weeks. Fasting blood plasma was collected at baseline and after 26 weeks and the lipidome was measured using untargeted liquid-chromatography-coupled mass spectrometry. Linear mixed effect modeling was used to compare lipid levels at baseline vs. 26-weeks of treatment and treated vs. placebo adjusted for change in body weight and multiple testing using the Benjamini-Hochberg procedure. The results were visualized with lipidome-wide heatmaps using the lipidomeR package in R. The lipids were ordered by headgroup, with the tail length on the x-axis and the number of tail double bonds on the y-axis.
Results: 102 persons were included in the trial and all were included for lipidomic analysis. The baseline clinical characteristics of the 51 participants receiving placebo (P) and 51 receiving liraglutide (L) were balanced mean (SD): age P=66.9(7.8), L=65.9(8.6) years; body mass index P=29.3(3.8), L=30.5(5.3) kg/m2; diabetes duration P=12.6(8.2), L=13.3(9.1) years; HbA1c P=58(10.6), L=58.7(9.6) mmol/mol; LDL P=2.2(0.6), L=2.1(0.7) mmol/L; Cholesterol P=4.1(0.8), L=4.1(0.8) mmol/L; and P=19.6, L=11.8 % were women. In total, 363 lipids were identified covering 11 families (Cer - Ceramides, DG - Diglycerides, HexCer - Hexosyl Ceramides, LacCer - Lactosyl Ceramides, LPC - Lysophosphatidylcholines, LPE - Lysophosphatidylethanolamines, PC - Phosphatidylcholines, PE - Phosphatidylethanolamines, PI - Phosphatidylinositoles, SM - Sphingomyelins and TG - Triglycerides). Significant decrease (p<0.05) in TG, PC and Cer after liraglutide treatment (figure), no significant changes were observed in the placebo group. The strongest differences between the liraglutide and placebo groups at follow-up were in large TGs, namely TG(58:8), TG(60:9), TG(58:9) and TG(58:3) with adjusted p-values of 0.02, 0.02, 0.02 and 0.04 respectively.
Conclusion: Compared to placebo, liraglutide treatment led to major lipidomic changes. A significant downregulation was found in the TG, Cer and PC families, which all are linked to risk of cardiovascular disease. This lipid regulating effect of liraglutide may contribute to the cardiovascular benefits seen in outcome studies.

Clinical Trial Registration Number: NCT03449654
Supported by: Novo Nordisk
Disclosure: A. Wretlind: Employment/Consultancy; BJS is employed by Novo Nordisk, PR has served as a consultant for Bayer, AstraZeneca, Astellas, Boehringer Ingelheim, AbbVie and Novo Nordisk (all honoraria to his institution). Grants; PR received research grants from AstraZeneca and Novo Nordisk. Lecture/other fees; PR received lecture fees (to his institution) from Bayer, Novo Nordisk, AstraZeneca and Boehringer Ingelheim. Stock/Shareholding; BJS, PR and TWH have equity interest in Novo Nordisk.
526
Short-term bezafibrate treatment affect glucose tolerance by directly acting on insulin sensitivity and insulin secretion
A. Mengozzi1, D. Tricò2, L. Nesti1, M. Masoni2, M.T. Scozzaro2, S. Baldi2, A. Mari3, A. Natali2;
1School of Internal Medicine, University of Pisa, Pisa, 2University of Pisa, Pisa, 3National Research Council, Padua, Italy.
Background and aims: Prospective studies show that hypertriglyceridemia predicts the deterioration of glucose homeostasis and pathophysiological studies mainly focused on the action of NEFA or obesity. Whether triglycerides directly affect insulin secretion or sensitivity is unknown.
Materials and methods: Twenty subjects affected by mild hypertriglyceridemia (<5.7 mmol/L) without any relevant comorbidity underwent a 3-hours OGTT at baseline and after a 5-week treatment with bezafibrate 400 mg/die, a peroxisome proliferators-activated receptors (PPARs)-α agonist with partial PPAR-β and - γ activity. β-cell function was assessed by modelling of C-peptide and glucose during an OGTT, obtaining four major variables: 1) glucose sensitivity, 2) potentiation factor (PFR); 3) rate sensitivity (RS); 4) insulin secretion rate. Fasting and stimulated insulin sensitivity was assessed through HOMA-IR and Oral Glucose Insulin Sensitivity (OGIS), respectively.
Results: Study population characteristics were: age 49±13 years old, BMI 27.4±3.9 Kg/m2, fasting plasma glucose 5.5±0.2 mmol/L, 2-h plasma glucose 8.1±0.5 mmol/L (nine subjects matched IGT criteria), HbA1c 37±4 mmol/mol, fasting triglycerides 5.0±3.6 mmol/L, LDL and HDL cholesterol 3.0±1.1 and 0.9±0.2 mmol/L. After 36±13 days of treatment, BMI and LDL cholesterol did not change, and HDL cholesterol showed a small increase (+24%, p=0.006). Bezafibrate markedly reduced plasma triglycerides levels (-54%, p=0.0018) showing only a modest effect on NEFA (-24%, p=0.0001). At follow-up OGTT we observed a significant reduction of both fasting and 2-h plasma glucose (-0.2 and -0.7 mmol/L, p<0.04 for both), incremental glucose AUC (-7%, p=0.014) (Figure 1a). Among β-cell function parameters, PFR showed a positive trend (+15%, p=0.11). Insulin sensitivity improved at fasting (HOMA-IR -32%, p=0.0004) paired with a positive trend for OGIS (+8%, p=0.11). The induced changes in glucose AUC showed a strong negative correlation to variations of RS (R2=0.55, St.β -0.74, p=0.0006) (Figure 1b); however, no significant difference in RS before and after the treatment was appreciate. No other relevant correlation was found; particularly neither fasting or post-load triglycerides nor NEFA were related to the outcome or to the variations of HOMA-IR, PFR and OGIS.
Conclusion: Short-term bezafibrate treatment ameliorate glucose tolerance in healthy subjects with modest hypertriglyceridemia. This effect is observed together with an improvement in insulin sensitivity and shows a strong correlation with induced variations of RS, independent from the induced changes in fasting and triglycerides and NEFA. It’s plausible that the attuenuation of 24-hours lipotoxicity, not assessed in our study, has an impact on RS.

Disclosure: A. Mengozzi: None.
PS 39 Adipokine signalling
527
Differential release of miRNAs by visceral adipose tissue from obese patients with various metabolic status
J. Laget1, F. Galtier2, A. Nouvel1, M. Morille3, P. Géraud2, D. Nocca4, N. Builles5, S. Rebuffat1, A. Lajoix1;
1BC2M, University of Montpellier, Montpellier, 2Centre for Clinical Investigation, University Hospital of Montpellier, INSERM, Montpellier, 3ICGM, University of Montpellier, Montpellier, 4Department of Digestive Surgery, University Hospital of Montpellier, Montpellier, 5Biological Resources Center, University Hospital of Montpellier, Montpellier, France.
Background and aims: Type 2 diabetes (T2D) is characterized by a chronic hyperglycaemia resulting from both a defect in pancreatic β-cell function and an insulin resistance of peripheral tissues (skeletal muscles and adipose tissue) and the liver. T2D is often associated with overweight and obesity, and the increased visceral adipose tissue is a major source of pro-inflammatory cytokines involved in the pathogenesis of the disease. In the present study, we investigated whether human visceral adipose tissue can secrete extracellular vesicles (EVs) with differentially expressed miRNAs according to the metabolic status of the patients and thereby may affect the function of other tissues involved in glucose homeostasis.
Materials and methods: Fifteen morbidly obese patients were included in the clinical research protocol “COMET” conducted by our University Hospital. Five of them were insulin sensitive (IS; HOMA IR<3), insulin resistant (IR; HOMA IR≥3), or recently diagnosed type 2 diabetic (T2D) patients and were matched with age and sex. Visceral adipose tissue was obtained during bariatric surgery and used to produce conditioned media after 24 hours culture. Extracellular vesicles (EVs) were isolated by precipitation using the Total Exosome Isolation kit. The size of the vesicles was analyzed by Dynamic Light Scattering (DLS) on a Zetasizer Nano ZS. RNA content of EVs was purified and used to construct a small RNA bank using the NEXTflex Small RNA-Seq kit. miRNAs content were identified and quantified by small RNA sequencing (HiSeq 2500, Illumina).
Results: Isolated EVs analyzed by DLS revealed an average size of 80 nm, with a population of higher size, probably reflecting the presence of vesicle aggregates. Analysis of markers of EVs by Western blotting revealed the presence of tetraspanins CD63, CD9 and CD81, and also the soluble proteins Hsp-70 and β-actin. After extraction of RNAs from EVs, we identify the presence of a population of miRNAs with an average length of 20nt on Bioanalyzer small RNA chip. The presence of miRNAs was confirmed with real-time PCR by the selective amplification of miR15a, miR30a, and RNU6B. Small RNA sequencing revealed the presence of 9 miRNAs differentially expressed between IS and DT2 patients, 18, between IR and DT2 patients, and 11, between IS and IR patients. Among miRNAs identified, miR-155-5p and miR-150-5p were found overexpressed in T2D patients as compared to IS (respectively by 11.83 and 4.29-fold) or IR subjects (respectively by 7.58 and 7.25-fold) (P< 0.05). Another miRNA-X, having no homolog in rodents, was diminished by 114-fold in diabetic patients as compared to IS and IR subjects (P<0.05). An additional miRNA-Y, having a homolog in rats, was at the opposite, overexpressed by 4.73 and 3.9-fold in diabetic patients as compared to IS and IR respectively (P<0.05).
Conclusion: In the present study, we have demonstrated that visceral adipose from obese patients displaying different metabolic status, can secrete small EVs. Pattern of differentially expressed miRNAs has been identified, that could be involved in the pathogenesis of T2D.
Clinical Trial Registration Number: NCT02861781
Disclosure: J. Laget: None.
528
Type 2 diabetes patients have low CDKN2C expression in adipose tissue and this is associated with reduced lipid storage capacity and elevated free fatty acid levels
M.J. Pereira1, S. Skrtic2,3, P.G. Kamble1, M. Vranic1, P. Katsogiannos1, J. Kullberg4, J.W. Eriksson1;
1Rudbecklaboratoriet hus R3, vaning 2, Uppsala University, Uppsala, 2AstraZeneca R&D, Mölndal, 3University of Gothenburg, Gothenburg, 4Rudbecklaboratoriet hus R3, vaning 2, Uppsala University, Dept. of Surgical Sciences, Uppsala, Sweden.
Background and aims: CDKN2C/18S (Cyclin-Dependent Kinase Inhibitor 2C) is a cell growth regulator that controls cell cycle progression and has previously been associated with beta-cell differentiation and murine 3T3-L1 adipocyte cell differentiation. A recent integrative genome-wide analysis study (GWAS) also implicates CDKN2C as a putative effector gene associated with insulin resistance phenotypes, increased risk for type 2 diabetes (T2D) and reduced peripheral adipose tissue (AT) storage capacity. This study aims to explore CDKN2C as a possible mediator for lipid storage defects in T2D subjects.
Materials and methods: Subcutaneous AT (SAT) samples were obtained by abdominal needle biopsies to measure mRNA of CDKN2C and genes related to lipid storage and adipogenesis in 20 healthy control and 20 metformin-treated T2D (HbA1c 6.6 ± 0.3%, mean±SD) subjects matched for gender, age (58 ± 11 vs 58 ± 9 y) and BMI (30.8 ± 4.6 vs 30.7 ± 4.9 kg/m2). Magnetic resonance imaging was performed for body fat measurements. Furthermore, CDKN2C expression was measured in paired samples of SAT and visceral AT (VAT) (15F/8M) and in human subcutaneous pre-adipocytes during differentiation into adipocytes (n=8).
Results: CDKN2C mRNA expression in SAT was down-regulated by 30% in the T2D group compared with the control group (P<0.05). In the T2D group, CDKN2C expression was negatively correlated with FFA AUC during OGTT (r=-0.57, P<0.01), insulin resistance markers (HbA1C, glucose AUC during OGTT, QUICKI; all P<0.05) and obesity markers (WHR, VAT volume, VAT/SAT ratio and liver fat percentage; all P<0.01). In the control group, only VAT volume (P=0.001) and VAT/SAT (P<0.05) were negatively correlated with CDKN2C expression. Following multivariate analyses, VAT/SAT (st beta coeffi= -0.674, P<0.001) and FFA AUC (st beta coeffi = -0.486, P<0.001) negatively predicted CDKN2C expression (P<0.001, adjusted R2 for model=0.79) in the T2D group. This suggests a link between lower CDKN2C expression in SAT and higher circulating levels of FFA, as well as preferential fat deposition in visceral rather than subcutaneous stores. Furthermore, CDKN2C expression in SAT positively correlated with the expression of genes promoting lipid storage (e.g. FASN, FABP4, PPARG, LPL, LIPE; all P<0.01) in the T2D group. In pair-wise samples, CDKN2C expression is higher in SAT, compared with VAT by 1.5-fold (p<0.05). CDKN2C mRNA expression was up-regulated during the in vitro differentiation of human pre-adipocytes into adipocytes by about 7-fold (day 14), p<0.01. Preliminary results suggest that the addition of a CDKN2C inhibitor (p18IN011) to the differentiation cocktail, inhibited pre-adipocytes differentiation into adipocytes.
Conclusion: CDKN2C gene expression in SAT is down-regulated in T2D and this is associated with elevated plasma fatty acids and visceral adiposity. Our findings suggest that CDKN2C might be an important regulator of human adipocyte differentiation and lipid storage. Its downregulation in T2D might contribute to insulin resistance, impaired SAT lipid storage and redistribution of AT from subcutaneous to visceral depots.
Supported by: AstraZeneca R&D, H2020 Marie Sklodowska Curie TREATMENT; SSMF; EXODIAB; UU ALF
Disclosure: M.J. Pereira: Grants; AstraZeneca, S.A.
529
In vitro lipid accumulation particularities for human subcutaneous adipose derived stem cells in obese bariatric patients-metabolic dysfunction correlations
I. Hristov1, A. Tiron2, C. Tiron2, D. Timofte3, B. Mihai4, V. Mocanu1;
1Pathophysiology, University of Medicine and Pharmacy "Gr.T.Popa" Iasi, Iasi, 2TRANSCEND Research center, Regional Institute for Oncology, Iasi, 3Surgery, University of Medicine and Pharmacy "Gr.T.Popa" Iasi, Iasi, 4Diabetes and Nutrition, University of Medicine and Pharmacy "Gr.T.Popa" Iasi, Iasi, Romania.
Background and aims: The adipocyte expansion is a critical process with implications in the pathogenesis of metabolic syndrome and insulin resistance associated to obesity. Impaired adipogenesis leads to disfunctional, hypertrofic adipocytes, chronic low-grade inflammation and peripheric insulin resistance. We assessed the relationship between the adipogenic differentiation capacity and metabolic syndrome criteria or insulin-resistance in obese patients.
Materials and methods: Our experimental study included 28 obese patients (18 females and 10 males ) with a mean age of 38.76 ± 8.89 years and a mean body mass index of 46.06 ± 6.48 kg/m2 , referred for Laparoscopic Sleeve Gastrectomy procedure. Multipotent mesenchymal stem cells were isolated from subcutaneous adipose tissue samples (ASCs), and their proliferation and differentiation to mature adipocytes in adipogenic culture medium followed specific in vitro cell culture protocol. Progression towards ASCs confluence was evaluated using an inverted optical microscope for a medium duration of 16±3 days and complete adipogenic differentiation was obtained after 21 days. The adipogenic differentiation capacity of pre-adipocytes was quantified by specific Oil Red O lipid staining and spectrophotometric measurement at 492 nm . Using the metabolic syndrome IDF criteria we defined 2 subgroups of obese patients: Metabolic healthy obese, without metabolic syndrome criteria (MHO)-9 patients and metabolic unhealthy obese, meeting the metabolic syndrome criteria (MUHO)-19 patients and we compared the obtained experimental data.
Results: Lipid accumulation mean level was found significantly lower in MUHO (0.461 vs. 0.668; p = 0.001) compared with MHO, showing adipogenic differentiation dysfunction in MUHO patients. By drawing the ROC curve, Oil Red absorbance can be a good predictor for the metabolic syndrome (AUC = 0.973; IC95: 0.913-1.033); Significant negative correlations between lipid accumulation in adipogenic differentiated ASCs and plasma concentrations of triglycerides (p<0.05), insulin (p<0.05), C peptide (p<0.01), HOMA-IR (p<0.05) were found in the studied obese group.
Conclusion: In severely obese patients, the abnormal adipogenesis is related to insulin resistance and metabolic dysfunction. The abnormal lipid accumulation could be a valuable predictor for later development of type 2 diabetes mellitus for obese patients and may also determine the post-bariatric surgery metabolic outcome for obese patients .
Supported by: UMF"Gr.T.Popa" Iasi 29032/28.12.2016 and number 30340/28.12.2017.
Disclosure: I. Hristov: Grants; "Grigore T.Popa" University of Medicine and Pharmacy Iasi, Romania, through the grants Ideas-Teams contract number 29032/28.12.2016 and 30340/28.12.2017.
530
Comparison between in vitro differentiation of pancreatic and subcutaneous adipocytes of subjects with normal glucose tolerance
M. Barroso Oquendo1,2, E. Lorza-Gil1,2, F. Gerst1,2, F. Fend3, A. Königsrainer4, R. Wagner1,2, M. Heni1,2, H.-U. Häring1,2, A.L. Birkenfeld1,2, S. Ullrich1,2, D. Siegel-Axel1,2;
1Division of Endocrinology, Diabetology and Nephrology, University Hospital Tübingen, Tübingen, 2German Center for Diabetes Research (DZD e.V.) and Institute for Diabetes Research and Metabolic Diseases of the Helmholtz Center Munich at the Eberhard Karls University of Tübingen, Tübingen, 3Institute of Pathology and Neuropathology, University Hospital Tübingen, Tübingen, 4Department of General, Visceral and Transplant Surgery, University Hospital Tübingen, Tübingen, Germany.
Background and aims: Increased visceral and ectopic fat mass is a major risk factor for the development of type-2 diabetes mellitus. The role of adipocyte infiltration into the pancreas is largely unknown and controversially discussed. In this study, we compared the secretome and function of pancreatic and subcutaneous fat cells during in vitro differentiation.
Materials and methods: Human preadipocytes (5 x 10⁴ cells/well) isolated from pancreatic or subcutaneous fat depots of humans with normal glucose tolerance were differentiated during 14-day-culture. Triglyceride content was visualized with oil red. Lipolysis was performed with differentiated adipocytes incubated in KRH-buffer and FFA were measured colorimetrically. Growth factor, cytokine and adipokine secretion were measured using a Bio-Plex assay.
Results: Human pancreatic adipocytes (pADI) showed significantly lower de novo lipogenic capacity than subcutaneous adipocytes (scADI). Addition of unsaturated long chain fatty acids during differentiation increased lipid accumulation in both pADI and scADI. Stimulation of adenylyl cyclase by forskolin increased lipolysis 12-fold in scADI, but only 1.5-fold in pADI. During differentiation of scADI, secretion of leptin and adiponectin increased at day 3 and 7, respectively. Low levels of adiponectin were also secreted by pADI, while leptin remained below detection level. VEGF, IL-6 and MCP-1 secretion was reduced during differentiation of both scADI and pADI. Interestingly, the angiogenic factor HGF was transiently increased during differentiation of pADI, but not of scADI.
Conclusion: These results suggest that pADI are less responsive than scADI in regard to insulin-induced lipogenesis, cAMP-induced lipolysis and adipokine secretion supporting the notion of different metabolic roles of pADI and scADI.
Supported by: This project received funding from BMBF (grant 01GI0925) and IMI 2 JU (RHAPSODY grant 115881).
Disclosure: M. Barroso Oquendo: Grants; BMBF (grant 01GI0925), IMI 2 JU (RHAPSODY grant 115881).
531
Ctrp3, a new anti-inflammatory and cardioprotective adipokine in patients with cardiovascular diseases and type 2 diabetes
H. Kratochvílová1,2, B.J. Kasperová3, Z. Lacinová1,2, I. Laňková3, J. Trnovská1, I. Netuka4, P. Ivák4, J. Mahrík5, D. Hlaváček5, M. Mráz2,3, M. Haluzík2,3;
1Centre for Experimental Medicine, Institute for Clinical and Experimental Medicine, Prague, 2Institute of Medical Biochemistry and Laboratory Diagnostics, First Faculty of Medicine, Charles University in Prague and General University Hospital, Prague, 3Diabetes Centre, Institute for Clinical and Experimental Medicine, Prague, 4Department of Cardiovascular Surgery, Institute for Clinical and Experimental Medicine, Prague, 5Department of Anesthesiology and Resuscitation, Institute for Clinical and Experimental Medicine, Prague, Czech Republic.
Background and aims: Coronary artery disease (CAD) is the most common cause of morbidity and mortality in patients with type 2 diabetes mellitus (T2DM). C1q TNF-related protein (CTRP3) is an adipokine secreted from adipose tissue that improves insulin sensitivity, reduces inflammation and acts cardioprotectively. The aim of our study was to analyze serum levels and gene expression of CTRP3 in subcutaneous and epicardial adipose tissue in patients with cardiovascular disease and T2DM undergoing planned cardiac surgery.
Materials and methods: 34 patients with CAD without T2DM (CAD group), 22 patients with CAD and T2DM (T2DM group) and 18 patients with a valve defect without CAD and T2DM (nonCAD group) were included into the study. Peripheral blood, subcutaneous (SAT) and epicardial adipose tissue (EAT) were examined at the beginning and end of elective cardiac surgery. mRNA expression was determined using qRT-PCR. Serum concentrations were supplemented by a group of 21 healthy subjects (C group).
Results: At baseline anthropometric and biochemical parameters were comparable in all groups except for higher fasting blood glucose (5.8±0.2 vs. 5.5±0.2 vs. 5.0±0.1 vs. 8.7±0.3 mmol/l for CAD vs. nonCAD vs. C vs. T2DM, p<0.001) and HbA1C (38.4±0.9 vs. 34.2±1.6 vs. 35.1±0.6 vs. 52.6±1.8 mmol/mol for CAD vs. nonCAD vs. C vs. T2DM, p<0.001) in T2DM group and lower age and BMI in the control group. Compared to controls, all 3 groups of cardiac patients showed a lower systemic CTRP3 concentration (67.4±2.2 vs. 69.3±4.7 vs. 65.1±3.3 vs. 90.8±3.7 ng/ml for CAD vs. nonCAD vs. T2DM vs. C, p<0.001). Serum concentrations of CTRP3 negatively correlated with age and HbA1c and positively with total cholesterol, while no correlation was observed with BMI and triglycerides. In EAT, we found reduced mRNA expression of CTRP3 in T2DM compared to nonCAD group (0.61±0.27 vs. 6.61±2.33, p=0.009) and similar, albeit non-significant, trend in CAD group (1.55±0.32, p=0.132), while similar changes have not been found in SAT. Cardiac surgery resulted in a marked decrease in serum CTRP3 concentrations in all patients without affecting mRNA expression in EAT or SAT.
Conclusion: Decreased serum levels of CTRP3 in patients with cardiovascular diseases together with reduced mRNA expression in EAT in diabetics with CAD indicate a possible role of CTRP3 in the pathogenesis of cardiovascular complications of diabetes.
Supported by: MH CZ – DRO (IKEM, IN 00023001), RVO VFN64165 and MH CZ - grant n.NV 19-02-00118
Disclosure: H. Kratochvílová: None.
532
Increased expression of Granzyme B in adipose tissue of obese subjects associated with sick fat
F. Cimini1, I. Barchetta1, C. Chiappetta1, L. Bertoccini1, A. Di Biasio1, V. Ceccarelli1, C. Di Cristofano1, G. Silecchia1, F. Leonetti1, A. Lenzi1, F. Velotti2, M. Cavallo1;
1Sapienza University of Rome, Rome, 2Tuscia University, Viterbo, Italy.
Background and aims: Granzyme B (GrB) is a serine protease, secreted in chronic inflammatory conditions by cytotoxic lymphocytes and inflammatory macrophages, able to promote numerous processes, such as pro-apoptotic activity, extracellular matrix remodeling and inflammation. Data showed that GrB circulating levels were associatedwith insulin-resistance, atherosclerosis, increased cardiovascular risk and obesity-related low grade inflammationin type 2 diabetes subjects. In addition, in a study conducted on murine model of obesity GrB expression in adipose tissue (AT) was associated with local inflammation and fibrotic rearrangement. Despite these findings suggest a potential role of GrB in the inflammatory and reactive processes occurring in AT in course of obesity, currently there is no data in humans. Aims of this study were to explore the expression of GrB in the AT of obese subjects and investigate the possible correlations with features of AT inflammation and circulating GrB levels.
Materials and methods: For this purpose, we recruited ninety consecutive obese patients referring to our outpatient clinics at Sapienza University of Rome, Italy forclinical and metabolic evaluations before bariatric surgery. Study participants underwent clinical work-up, routine biochemistry and intra-operative omental biopsy. GrB expression in AT was detected by real-time PCR and, for the evaluation of the local inflammation, UNC5B, IL8, MIP1α, MIP2, TIMP1, WISP-1, CASP3, CASP7 and HIF1αwere detected by the same method.AT inflammation has been also evaluated by histology and immuno-histochemical analysis. In a sub-group of forty obese subjects, GrB circulating levels were measured on serum by Elisa Affymetrix EBIO.
Results: Our obese population showed adipocytes expression of GrB and its increased expression levels associated with the presence of AT inflammation. In particular, GrB in AT positively correlated with local expression of mediators and markers of hypoxia, apoptosis and inflammation, as Caspase 3 (r= 0.39, p=0.015), Caspase 7 (r= 0.28, p=0.018), TIMP-1 (r= 0.37, p=0.019), MIP-1(r= 0.6, p=0.0001), MIP-2 (r= 0.39, p=0.015), IL-8 (r= 0.35, p=0.031) and WISP-1 (r= 0.62, p=0.002). In addition, the overexpression of GrB in AT was significantly associated with higher circulating GrB levels and glyco-matabolic alterations.
Conclusion: Obese subjects with sick fat showed increased GrB expression in AT, greater GrB circulating levels and a worse metabolic profile, suggesting that GrB may play an important role as mediator of the inflammatory processes occurring in AT in course of obesity and it may become a novel marker of AT dysfunction.
Disclosure: F. Cimini: None.
533
Apelin levels associate with pubertal development, but not with insulin sensitivity, in overweight-obese children: a 6.5 years follow-up evaluation
L. Bertoccini1, F. Sentinelli1, M. Incani2, D. Bailetti1, I. Barchetta1, F.A. Cimini1, V. Ceccarelli1, S. Loche3, E. Cossu2, M.G. Cavallo1, M.G. Baroni4;
1Experimental Medicine, Sapienza University, Rome, 2Department of Medical Sciences and Public Health, University of Cagliari, Cagliari, 3Pediatric Endocrine Unit, Regional Hospital for Microcitemia, Cagliari, 42Department of Clinical Medicine, Public Health, Life and Environmental Sciences (MeSVA), University of L’Aquila, L'Aquila, Italy.
Background and aims: In recent decades obesity in children and adolescents has emerged as a serious health issue worldwide. Obesity in youth is associated with increased risk of metabolic disorders. Adipose tissue hormones (adipokines) are involved in body-weight regulation. Among these, apelin is highly expressed in adipocytes and is released by both human and mouse white adipose tissue and it is recognised as an insulin-sensitizer adipokine. Data on apelin levels in obese children and its relation to insulin-sensitivity are limited. We aimed to evaluate apelin levels in relation to obesity and insulin-sensitivity in a large cohort of overweight/obese children and adolescents. Furthermore, these youths were re-evaluated after a median 6.5 years of follow-up, thus allowing assessing changes in apelin levels in relation to increasing age and weight changes.
Materials and methods: Clinical data in 909 children and adolescents were collected between 2007-2010. 201 were re-examined at a median 6.5 years of follow-up. All subjects at baseline and at follow-up underwent an OGTT. Apelin levels were measured on sera by ELISA method.
Results: Subjects in the study cohort had a mean age of 10.3 ± 3.2 years, 429 were males and 480 females. At baseline, lower apelin levels were associated with increasing age and puberty (Tanner ≥II 0.67±0.96 ng/mL vs. Tanner I 0.89±1.13 ng/mL, p<0.002), but not with body-weight. After a median 6.5 years of follow-up, apelin levels in the 201 subjects re-examined were significantly lower than at baseline (0.45±0.77 ng/mL at follow-up, 0.68±0.95 ng/mL baseline, p<0.001), confirming the effects of age and puberty. Body-weight again did not affect apelin levels. Multiple regression analysis confirmed that sex and puberty were associated with lower apelin levels, independently from age and insulin-sensitivity.
Conclusion: Apelin levels decrease significantly with pubertal development, whilst body-weight in children and adolescents did not determine changes in apelin. Reduced levels of apelin in children and adolescents may therefore represent a necessary response to maintain the “physiological” insulin-resistance of puberty.
Supported by: Grant RAS 2012; Foundation Banca d'Italia; Avvio alla Ricerca
Disclosure: L. Bertoccini: None.
534
Circulating FSTL-1 is a marker for metabolic syndrome in middle-aged and old population
W. Hu1,2, L. Li1, G. Yang2;
1Department of Clinical Biochemistry, The Key Laboratory of Laboratory Medical Diagnostics in the Ministry of Education and Department of Clinical Biochemistry, College of Laboratory Medicine, Chongqing Medical University, Chongqing, 2Department of Endocrinology, the Second Affiliated Hospital of Chongqing Medical University, Chongqing, China.
Background and aims: The follistatin like 1 (FSTL-1) gene, also known as TGFB stimulated clone 36 (TSC-36) and FLIK , belongs to the follistatin family and is a secretory glycoprotein family. Follistatinlike -1 is considered to be associated with metabolic diseases. The potential use of circulating FSTL-1 as a biomarker for MetS needs further investigation. We performed a cross-sectional study to investigate the associated of circulating FSTL-1 with the MetS and analyzed the gene microarray of FSTL-1 from public gene expression datasets.
Materials and methods: A cross-sectional study was performed in 487 Chinese people, including 256 patients with MetS and 231 normal controls from the outpatients attending the department of endocrinology, community. Bioinformatics analysis was used to determine the protein and pathways associated with FSTL-1. Serum FSTL-1 concentrations were determined by an ELISA assay. The association of FSTL-1 with MetS components and IR was assessed.
Results: Serum FSTL-1 levels were markedly higher in patients with newly diagnosed MetS than in controls [5.8 (5.0-7.7) vs. 7.5 (5.6-9.2)μg/L, p < 0.01)]. According to bioinformatics analysis, the top five high degree genes were identified as the core genes, including SPARCL1, CYR61, LTBP1, IL-6, and BMP2, etc. For BP, these proteins were involved in post-translational protein modification, regulation of trans-membrane receptor (serine/threonine kinase) and BMP signaling pathway, response to BMP, etc. and were mainly enriched in pathways including TGF-ß signaling pathway, basal cell carcinoma, cytokine-cytokine receptor interaction, AGE-RAGE signaling pathway in diabetic complication, etc. Furthermore, serum FSTL-1 levels were positively associated with fasting blood glucose (FBG), waist circumference (WC), blood pressure, and triglyceride levels. independent factors affecting serum FSTL-1 included DBP, FBG, and HDL-C .We found that serum FSTL-1 levels were markedly associated with MetS and IR by binary logistic regression analysis, even after limiting for anthropometric variables.
Conclusion: We conclude that FSTL-1 may be a novel cytokine related to MetS and IR.

Clinical Trial Registration Number: ChiCTR1800019776
Supported by: NSFC
Disclosure: W. Hu: None.
PS 40 Drugs and environment in obesity
535
Comparative effects of medications for type 2 diabetes on body weight: a systematic review and network meta-analysis of 394 trials
P. Kakotrichi1, T. Karagiannis1, I. Avgerinos1, C. Mantsiou1, G. Tousinas1, A. Manolopoulos1, A. Liakos1, K. Dimitrakopoulos1, K. Malandris1, A. Tsapas1,2, E. Bekiari1;
1Clinical research and Evidence-Based Medicine Unit, Aristotle University of Thessaloniki, Thessaloniki, Greece, 2Harris Manchester College, University of Oxford, Oxford, UK.
Background and aims: Evidence from individual trials suggests that treatment effect on body weight varies among different antidiabetic drugs in patients with type 2 diabetes. We conducted a systematic review and network meta-analysis to assess the comparative effects of all antidiabetic medications on body weight.
Materials and methods: We searched Medline, Embase, and Cochrane Central until December 2019 for randomised controlled trials of more than 24 weeks in patients with type 2 diabetes. We performed a frequentist random-effects network meta-analysis to summarise all evidence for change in body weight. We assessed study quality with the revised Cochrane risk of bias tool and graded overall confidence in each effect estimate.
Results: 394 studies (250,976 patients) assessing 21 treatments contributed data to the network meta-analysis. Patients’ mean age was 56.4 years and mean body weight at baseline was 85.3 kg. Compared to placebo, body weight was reduced with GLP-1 receptor agonists (mean difference -1.98 kg, 95% confidence interval -2.22 to -1.73), SGLT2 inhibitors (-1.81 kg, -2.09 to -1.53) and metformin (-0.63 kg, -1.00 to -0.26). Among individual GLP-1 receptor agonists, weight reductions versus placebo ranged from -3.79 kg (-4.44 to -3.13) for subcutaneous semaglutide to -0.71 kg (-1.29 to -0.12) for dulaglutide, while individual SGLT2 inhibitors conferred weight reductions ranging from -2.01 kg (-2.50 to -1.52) for empagliflozin to -1.72 kg (-2.55 to -0.89) for ertugliflozin (Figure). DPP-4 inhibitors and a-glucosidase inhibitors had a neutral effect, whereas insulin regimens, pioglitazone, sulphonylureas and meglitinides increased body weight (Figure). Based on between-treatment comparisons, GLP-1 agonists, SGLT2 inhibitors and metformin were superior to other drug classes, with subcutaneous semaglutide being more efficacious compared to all other GLP-1 receptor agonists and SGLT2 inhibitors. No differences were evident among individual SGLT2 inhibitors. The confidence in effect estimates was generally moderate to high. Sensitivity analyses restricted to trials at low risk of bias (n=261) and to trials over 52 weeks (n=122) yielded similar results.
Conclusion: In patients with type 2 diabetes, treatment with GLP-1 receptor agonists, SGLT2 inhibitors or metformin reduced body weight. Subcutaneous semaglutide was the most efficacious among all agents, including other GLP-1 receptor agonists.

Supported by: EFSD-PACT Programme supported by AstraZeneca
Disclosure: P. Kakotrichi: None.
536
Insulin receptor isoforms in human adipogenesis: possible role in the onset of adipose tissue expansion
V.A. Genchi, A. Cignarelli, S. Perrini, S. Porro, C. Caccioppoli, A. Natalicchio, L. Laviola, F. Giorgino;
University of Bari Aldo Moro, Bari, Italy.
Background and aims: Adipose tissue (AT) is an endocrine organ able to store lipid overload deriving from excess of energy intake. In this regard, insulin favors the generation of new adipocytes (adipogenesis) and accumulation of triglyceride (lipogenesis) by activating its tyrosine-kinase receptor. Insulin receptors (IR) consist of two isoforms, a short isoform (IRa) involved in tissue growth and development, and a long isoform (IRb) mainly expressed in adult cells with prevalent metabolic activity. The contribution of these isoforms to the physiological and pathological AT accumulation is still poorly understood. For this purpose, we investigated the expression of IRa and IRb in human adipose-derived stem cells (ASC), in vitro differentiated adipocytes (dASC) and whole AT.
Materials and methods: Biopsies of abdominal subcutaneous AT (S-AT) and visceral AT (V-AT) were obtained from subjects with different levels of BMI. ASC were also isolated from both AT depots and were analyzed before and after differentiation into adipocytes (dASC). Gene expression analysis was carried out by Real-time PCR in ASC, dASC and AT. Both ASC and dASC were analyzed according to protein levels of IR together with Nile red (NR) staining by flow-cytometry assay.
Results: mRNA levels of IRa were 2-fold higher than IRb in both S-ASC and V-ASC. In addition, the S-ASC showed total IR, IRa and IRb mRNA levels 2-fold higher than V-ASC, as well as greater insulin responsiveness (~4-fold) in terms of Akt activation. IRa expression showed a positive correlation with BMI (r = 0.53; p = 0.009) and waist circumference (r = 0.51; p = 0.02) in S-ASC but not in V-ASC, in which an inverse correlation with BMI (r = -0.36; p = 0.02) was noted. Adipocyte differentiation was associated with increased mRNA levels of total IR, IRa and IRb (~3-fold) in both S-dASC than in V-dASC, with higher expression levels in S-dASC as compared to V-dASC (~3-fold). Coherently with ASC, mRNA levels of IRa were 2-fold and 3-fold higher compared to IRb in S-AT and V-AT, respectively. Flow cytometric analysis showed a time-dependent and tissue-specific increase of differentiated adipocytes (Nile Red positive, NR+: 58% in S-dASC and 20% in V-dASC). However, only a fraction of NR+ cells expressed IR, particularly in S-dASC (day 16, NR+/IR+: 61%; day 30, NR+/IR+: 71%). On the other hand, V-dASC showed a high proportion of IR+ cells in the early phases of adipogenesis (day 16, NR+/IR+: 81%), while a consistent reduction of the percentage of lipid-filled cells expressing IR was observed in the late phases (day 30, NR+/IR+: 44%).
Conclusion: mRNA levels of IR, particularly IRa, increase with adipocyte differentiation especially in S-ASC. S-ASC cells display greater activation of insulin signaling and adipogenic phenotype as compared to V-ASC. However, a relevant percentage of V-dASC express IR in early adipogenesis, while in the late phase, the percentage of lipid-filled cells not-expressing IR increases consistently. IRa expression levels are associated with AT expansion, particularly with higher BMI, and adipocyte differentiation, tipically in S-AT. The role of IR in V-AT expansion, particularly in the early phase of ASC commitment to adipocytes, needs further clarification.
Disclosure: V.A. Genchi: None.
537
Beneficial effects of a novel long-acting glucagon analogue, HM15136, on obesity and obesity related metabolic disorders in animal models
S. Lee, J. Lee, J. Choi, E. Park, J. Lee, S. Lee, S. Bae, D. Kim, I. Choi;
Hanmi pharm. Co., Ltd, Seoul, Republic of Korea.
Background and aims: Obesity is an increasing problem worldwide. Hence, it is a major risk factor for a number of metabolic disorders such as hyperlipidemia, glucose intolerance and type 2 diabetes. Recent researches have indicated a stimulatory effect of glucagon (GCG) on energy expenditure and appetite inhibition, suggesting the utilization of GCG as a novel therapeutic strategy for obesity. In line with this, we previously observed that chronic treatment of HM15136, a novel long-acting glucagon analog, conferred efficient body weight loss (BWL) in diet induced obesity (DIO) mice. Since BWL is highly associated with the improvement of various metabolic disorders, HM15136 might also provide additional benefits such as blood lipid lowering and improvement of glucose tolerance. Here, we further investigated the potential therapeutic effects of HM15136 on obesity-related metabolic disorders.
Materials and methods: To investigate the potential benefits of HM15136 in obesity-related metabolic disorders, time-course change (at day 2, 7, 11, and 17) of BWL, fat mass, liver triglyceride (TG), blood TG, fasting blood glucose (FBG), and HOMA-IR were measured during HM15136 treatment. HM15136 was subcutaneously administered into DIO mice and the human equivalent dose tested was 2.0 nmol/kg, once every 2 days (Q2D). To investigate the potential effect of HM15136 on post-prandial glucose (PPG) control, time course oral glucose tolerance test (oGTT) was performed at day 2, 8, and 14 during chronic treatment of HM15136 in DIO mice.
Results: In DIO mice, time-course change in BWL, fat mass, liver TG, and FBG was determined. Chronic treatment of HM15136 was associated with progressive BWL (-37.5% vs. vehicle at day 17) and fat mass reduction with little effect on lean mass, demonstrating that fat mass reduction mainly drives its potent anti-obesity effect. Interestingly, despite marginal BWL (-1.8% and -13.7 vs. vehicle at day 2 and 7) during initial drug treatment period, significant reduction in blood TG (-56.5% vs. vehicle at day 2) and subsequent liver TG (-41.5% vs. vehicle at day 7) was rapidly achieved, and maintained thereafter. Moreover, the TG lowering both in blood and liver was followed by sustainable FBG lowering, suggesting that rapid depletion of lipid, the main sources for gluconeogenesis, might contribute to FBG normalization even after chronic treatment of HM15136. To evaluate the potential effect of HM15136 on PPG control, oGTT was performed in DIO mice, and reduced BG level during oGTT was observed as BWL occurred. Time-dependent reduction in HOMA-IR further evidenced the insulin sensitivity improvement by HM15136, which was well correlated with improvement of FBG and PPG control by HM15136 treatment.
Conclusion: To our knowledge, this is the first study demonstrating the potential benefits of chronic GCG engagement in the management of body weight, blood lipid, and even BG. Based on these results, HM15136 might be a novel therapeutic option for the management of obesity and related metabolic disorders. Human study of HM15136 is ongoing for the clinical relevance of these findings.
Disclosure: S. Lee: None.
538
Postprandial thermogenesis is reduced in obesity
A. Vosseler, L. Fritsche, J. Hummel, C. Dannecker, N. Stefan, A.L. Birkenfeld, H.-U. Häring, A. Fritsche, R. Wagner, M. Heni;
Department of Internal Medicine, Division of Diabetology, Endocrinology and Nephrology, Eberhard K, Institute for Diabetes Research and Metabolic Diseases of the Helmholtz Center Munich at the Univers, Tübingen, Germany.
Background and aims: Postprandial thermogenesis is thought to be important for the control of metabolism. This process could be reflected by minute changes in body temperature after glucose load. In this study, we measured body temperature before and its change during a glucose challenge and investigated the relationships with anthropometric and glycemic traits.
Materials and methods: We prospectively studied 383 volunteers (251 females, 132 males) with a mean age of 46.6 (SD ± 16) years and a BMI of 27.9 kg/m2 (SD ± 5.9). All participants underwent a 75 g oral glucose tolerance test (OGTT) and repeated bilateral measurements of intra-auricular temperature at time points 0, 30 and 120 minutes during the OGTT using a tympanic thermometer (Covidien Genius 2).
Results: Baseline temperature was 0.17°C lower in males compared to females (p = 0.001) and inversely associated with age (p < 0.0001). During the OGTT, there was a significant increase in body temperature (0.18 ± 0.34°C). This response was present in females and males. BMI was negatively associated with the increase of temperature during the OGTT (p = 0.0147). Participants with higher BMI displayed higher fasting temperatures, but less increase of temperature during the OGTT. Body temperature was not associated with glycemia, insulin sensitivity or insulin secretion, neither in females nor males.
Conclusion: There is a robust increase in body temperature during a glucose load that can be captured by intra-auricular temperature measurements. We did not detect any associations of the body temperature with glucose metabolism, arguing against a major contribution of the variability of body temperature in the pathogenesis of diabetes. However, the rise in temperature in response to oral glucose is reduced in obesity and might therefore be involved in body weight regulation.
Supported by: DZD 01GI0925
Disclosure: A. Vosseler: None.
539
The influence of substitution therapy with levothyroxine for hypothyroidism on physiological mechanisms determining body weight
B.B. Medici1, B. Nygaard2, J.L. La Cour3, M. Krakauer4, A. Brønden5, M.P. Sonne3, T. Vilsbøll5, J. Faber2, F.K. Knop5;
1Internal Medicine, Center for Clinical Metabolic Research, Farum, 2Internal Medicine, University of Copenhagen, Herlev, 3Internal Medicine, Department of Internal Medicine, Herlev, 4Department of Clinical Nuclear Physiology, University of Copenhagen, Herlev, 5Internal Medicine, Center for Clinical Metabolic Research, Gentofte, Denmark.
Background and aims: When initiating levothyroxine (L-T4) substitution therapy for hypothyroidism, overweight patients typically expect body weight loss from L-T4-induced acceleration of adipose tissue combustion. However, despite the increase in resting energy expenditure (REE) observed after L-T4 treatment, it rarely causes body weight loss. This prompted us to investigate changes in appetite sensations and food intake during the first 6 months of L-T4 therapy in hypothyroid patients.
Materials and methods: Eighteen newly diagnosed hypothyroid women with thyroid-stimulating hormone (TSH) >10 mU/l were investigated on three separate experimental days: at diagnosis, after normalisation of TSH (<4.0 mU/l) and after six months of treatment. The primary endpoint was ad libitum food intake, and key secondary endpoints included appetite and satiety sensations (as assessed by visual analogue scales (0-10 cm)), REE, body weight, body composition, 24-hour physical activity and pulse rate. Eighteen healthy controls matched for sex, age and BMI, were subjected to a single experimental visit.
Results: In eighteen women with a mean age of 44.4 (SD 6.4) years and a mean BMI of 29.0 (SD 13.4) kg/m2, TSH decreased (p<0.001) from a median of 46.9 (IQR 12.4;83.8) mU/l at diagnosis to 1.2 (IQR 0.2;3.2) mU/l after 1 month and remained normal after 6 months (1.6 (0.5;2.1) mU/l). REE increased (p=0.006) from 1,380 (SD 171) kcal/day to 1,519 (SD 258) kcal/day and remained higher than baseline after 6 months (1,524 (SD 225) kcal/day). Daily physical activity increased significantly after 6 months. Body weight was unchanged (80.6 (IQR 72.2;91.4), 80.2 (IQR 72.2;89.8) and 81.0 (IQR 71.3;88.3) kg at baseline and after 1 and 6 months, respectively). Fat-free mass decreased by a mean of 0.8 kg (p<0.05) while fat mass was unchanged (0.09 kg p=0.87). Sensation of hunger in the fasted state increased (p=0.048) after 6 months whereas the observed increase in ad libitum food intake of 28 g did not reach statistical significance (p=0.18).
Conclusion: In these hypothyroid women, L-T4 treatment increased mean REE by 144 kcal/day corresponding to a combustion of 2.9 kg fat over 6 months; but body weight and fat mass remained unchanged after 6 months of treatment. As the daily level of physical activity increased in the same period, we propose that the increased sensation of hunger in the fasting state (combined with accompanying increased food intake) may constitute a culprit in the lack of body weight loss from substitution therapy with L-T4 in patients with hypothyroidism.
Clinical Trial Registration Number: NCT02993562
Disclosure: B.B. Medici: None.
540
Diet-induced weight loss improves sleep quality and the improvements are sustained after 1 year weight maintenance with exercise and liraglutide: the S-LITE randomised trial
C. Janus1, S.B.K. Jensen1, J. Lundgren1, L.M. Olsen1, C.R. Juhl1, B.M. Stallknecht1, J.J. Holst1,2, S. Madsbad2, S.S. Torekov1;
1Department of Biomedical Sciences, University of Copenhagen, Copenhagen N, 2Department of Endocrinology, Hvidovre University Hospital, Copenhagen, Denmark.
Background and aims: Obesity is associated with short sleep duration and poor quality of sleep. The aim was to explore the impact on sleep habits of a diet-induced weight loss followed by three weight maintenance strategies: Exercise training, GLP-1 receptor agonist (liraglutide), and the combination of both treatments.
Materials and methods: Exploratory analyses from the randomized weight maintenance trial S-LITE (NCT 04122716). Participants with obesity (BMI 32-43 kg/m2) were included to 8 weeks on a very low-calorie diet (VLCD) of 800 kcal/day followed by 1-year of treatment with 1) exercise 150 min/week + placebo (EX), 2) liraglutide 3 mg/day (LIRA), 3) liraglutide 3 mg/day + exercise 150 min/week (LIRA + EX), or 4) placebo (PLA). Sleep duration and sleep efficiency (sleep time/time in bed * 100) were measured by 7-days wrist-worn accelerometry (GENEactiv) at inclusion, after weight loss at randomization, and after the intervention. Self-reported sleep quality was assessed by the validated Pittsburgh Sleep Questionnaire Index (PSQI) with higher scores denoting worse sleep. Statistical analyses were performed on the intention-to-treat population by linear mixed models.
Results: The VLCD resulted in a mean weight loss of 13.1 kg in 195 participants (64% women, mean (SD) age 42 (12) yrs) and improved sleep: Longer sleep duration (increased by 14.5 min/night, 95% CI: 6.9 to 22.2), higher sleep efficiency (increased by 2.1%, 95% CI: 1.2 to 3.0), and improved self-reported sleep quality (-0.76, 95% CI: -1.16 to -0.37). After one year, exercise and liraglutide treatment groups maintained weight loss or further reduced weight and maintained the improvements in self-reported sleep quality. This was in contrast to the placebo group, which regained weight and relapsed to poor sleep quality (impaired by 1.2, 95% CI: 0.3; 2.1).
Conclusion: A large, rapid diet-induced weight loss exerts improvements in sleep duration and self-reported sleep quality, and weight loss maintenance with exercise and/or liraglutide treatment sustains the self-reported sleep quality for 1 year in contrast to relapse with placebo treatment.
Clinical Trial Registration Number: NCT 04122716
Supported by: NNF
Disclosure: C. Janus: None.
541
Peripheral combination treatment of leptin and SGLT2 inhibitor improved glucose metabolism in insulin-dependent diabetes mice
H. Yaginuma1, R. Banno1,2, R. Sun1, K. Taki1, M. Sugiyama1, T. Tsunekawa1, H. Takagi1, Y. Ito1,3, H. Arima1;
1Department of Endocrinology and Diabetes, Nagoya University Graduate School of Medicine, Nagoya, 2Research Center of Health, Physical Fitness and Sports, Nagoya University, Nagoya, 3Department of CKD Initiatives/Nephrology, Nagoya University Graduate School of Medicine, Nagoya, Japan.
Background and aims: Insulin-dependent diabetes mellitus (IDDM) is mainly observed in type 1 diabetes. Insulin is essential for the treatment of IDDM, and options for other therapeutic agents are scarce. However, the insulin therapy for IDDM is sometimes difficult to treat because there are several kinds of adverse events such as life-threatening hypoglycemia, insulin antibody and insulin allergy. Recently, it has been reported that central administration of leptin, a hormone secreted from adipocyte, could normalize glucose metabolism in the rodent of IDDM models independent of the mechanism via insulin receptor signaling, and is expected to be applied in clinical use for patients of IDDM. On the other hand, when leptin is administered from the periphery, the effect of improving glucose metabolism is limited and is considered to be a problem for clinical application. The aim of this study is to determine whether if peripheral combination treatment of leptin and SGLT2 inhibitor improves glucose metabolism in IDDM model mice.
Materials and methods: 12-week-old male C57BL6 mice were intraperitoneally administered with a high dose of 150 mg/kg of streptozotocin (STZ) to produce IDDM in which endogenous insulin secretion was depleted. IDDM mice were divided into five groups ;(1) leptin treatment alone, (2) SGLT2 inhibitor treatment alone, (3) leptin and SGLT2 inhibitor co-treatment, (4) IDDM mice with no treatment, and (5) healthy mice group. The blood glucose level after the end of the dark cycle was measured twice a week from 3 days after administration of the drugs and compared among five groups (1) - (5). A glucose tolerance test (GTT) of 2 mg/kg body weight was performed and compared between (3) and (5). In addition, blood ketone body concentrations were measured and compared between (3) and (5) as well. Leptin was peripherally administered at 20 μg/day using an osmotic pump, and the control group was similarly administered saline peripherally with an osmotic pump. As an SGLT2 inhibitor, Ipragliflozin was orally administered at 3 mg/kg/day.
Results: One week after the STZ administration, we confirmed that the serum insulin concentration was less than 0.1 ng/ml and blood glucose (BG) was more than 400 mg/dl, which was consistent with IDDM. The hyperglycemia associated with STZ administration was significantly improved on all measurement days in mice of (1), (2) and (3) group compared to those in (4) group. While there were significant differences in BG between (1) or (2) group and (5) group, there were no significant difference in BG between (3) group and (5) group on all measurement days. GTT in (3) group was also improved to the same levels as (5) group. In addition, no significant difference was observed in blood ketone body concentrations between (3) group and (5) group
Conclusion: Peripheral combination treatment of leptin and SGLT2 inhibitor improved glucose metabolism in IDDM mice without the use of insulin.
Supported by: Astellas Pharma Inc.
Disclosure: H. Yaginuma: Grants; Astellas Pharma Inc..
542
Metabolic and immuno-phenotype of rare lipomatoses: Dercum disease and Roch-Leri mesosomatic lipomatosis
M. Lemaitre1, L. Humbert1, S. Boury2, G. Lion3, M.-C. Vantyghem1;
1Endocrinology, Diabetology, Metabolism and Nutrition, Lille University Hopital, Lille, 2Radiology, Lille University Hopital, Lille, 3Nuclear Medicine, Lille University Hopital, Lille, France.
Background and aims: Besides lipodystrophy syndromes, which are characterized by a limited capacity of subcutaneous adipose tissue to store triglycerides, lipomatosis is a condition in which multiple lipomas are present on the body, without associated lipoatrophy. Dercum’s disease (DD) and Roch-Leri mesosomatic lipomatosis (LMS) are two of them. The diagnosis is clinical, Dercum’s disease (adiposis dolorosa) being characterized by painful lipomas, in contrast with LMS. The aim of the present study was to identify any specific metabolic and immune phenotype of these two forms of rare lipomatoses, in comparison with control subjects.
Materials and methods: This monocentric retrospective case-control study was conducted over a decade (2009-2019), including 38 patients: 9 Dercum’s disease, 11 LMS and 18 healthy controls. Metabolic and immuno-hematological characteristics of each group were compared.
Results: The median age of the patients was similar in the 3 groups (around 31 years old). The following parameters, expressed as % or median, differed significantly between DD and LMS: sex-ratio (majority of women in Dercum's group (3M/6F) vs. men in LMS group (7M/4F) (p<0.05), the presence of pain (DD vs. LMS: 100% vs. 0%; p<0.05) and the predominance of lipomas on forearms and arms in the LMS group (DD vs. LMS: 56% vs. 82%; p<0.05). The following parameters, were significantly higher in each group of lipomatosis as compared to the healthy control group (DD/LMS vs. controls) respectively: weight (88 / 100 vs. 69 Kgs; p<0.05), BMI (32 / 31 vs. 22 kg/m2; p<0.01), systolic (130 / 140 vs. 115 mmHg; p<0.05) and diastolic blood pressure (78 / 79 vs. 72; p<0.05), gamma-GT (83 / 74 vs. 18 UI/L; p<0.01), leptin (48 / 28 vs. 5 ng/mL; p<0.01), fasting insulin (8 / 3.5 vs. 4 μUI/L; p<0.05), and C-peptide (3.2 / 2.6 vs. 1.8 ng/ml; p<0.05) levels as well as the fat mass percentage measured by DEXA (39% / 41% vs 23%; p<0.05) and the intra/total abdominal fat ratio (0.36 / 0.31 vs. 0.19; p<0.05). Compared to the control group, the DD group had higher FBG level (1.00 vs. 0.86 g/L; p<0.01), LDL-c level (1.46 vs. 1.16 g/L; p<0.05), platelets (266, 000 vs. 210, 000/mm3; p<0.05), leukocytes (7,800 vs. 5,400/mm3; p<0.05), basophils cells count (100 vs. 0/mm3; p<0.01), with a lower NK cells count (207 vs. 292/mm3; p<0.05). Compared to the control group, the LMS group had a lower number of CD3 (867 vs. 1444/mm3; p<0.05), CD4 (636 vs. 866/mm3; p<0.05), and CD8 (227 vs. 596 /mm3; p <0.01) lymphocytes. The LMS group had a history of auto-immune and inflammatory disease in 45 % of cases vs. 9% in the LMS group.
Conclusion: This case-control study is the first on these rare diseases. The results suggest that lipomas occur on a common background of obesity and metabolic profile with diabetes, hypertension, hyperinsulinism and increased visceral fat mass. Interestingly, the immuno-hematological profile of the two types of lipomatosis was distinct. A higher number of leukocytes and platelets was found in DD patients, in addition to a basophils activation profile that could participate to pain. T lymphocyte depletion was present in LMS, in association with more immunoinflammatory disease. If confirmed, these findings could open specific therapeutic approaches, especially in the painful DD.
Clinical Trial Registration Number: NCT01784289
Supported by: PHRC
Disclosure: M. Lemaitre: None.
PS 41 Weight loss interventions
543
Obese have blunted subcutaneous adipose tissue perfusion responses to GIP or meal, which improve after bariatric surgery
T. Saari1, J. Koffert1,2, H. Honka1, J. Teuho1, S. Kauhanen3, E. Löyttyniemi4, R. Parkkola1,5, V. Oikonen1, A. Lindqvist6, N. Wierup6, K.A. Virtanen1,7, L. Groop6, P. Nuutila1,8;
1Turku PET Centre, Univeristy of Turku, Turku, Finland, 2Department of Gastroenterology, Turku University Hospital, Turku, Finland, 3Division of Digestive Surgery and Urology, Turku University Hospital, Turku, Finland, 4Department of Biostatistics, Univeristy of Turku, Turku, Finland, 5Department of Radiology, Turku University Hospital, Turku, Finland, 6Department of Clinical Sciences, Lund University Diabetes Centre, Malmö, Sweden, 7University of Eastern Finland, Kuopio, Finland, 8Department of Endocrinology, Turku University Hospital, Turku, Finland.
Background and aims: Glucose dependent insulinotropic peptide (GIP) increases subcutaneous adipose tissue (SAT) blood flow during hyperinsulinemia in healthy subjects. Effects of GIP on visceral adipose (VAT) and SAT blood flow (BF) in obesity is less known. Our aim was to investigate these effects in obese before and after bariatric surgery and compare those to lean controls.
Materials and methods: We recruited 10 morbidly obese subjects (BMI 40.8±5.9 kg/m2) with T2DM who were scheduled for a bariatric surgery and 10 healthy lean subjects (BMI 22.9±2.1 kg/m2). All were studied first in two different sessions, once after received a mixed meal and during GIP-infusion. SAT, VAT and abdominal muscle blood flows were measured using 15O-H2O and dynamic PET-MRI imaging at three time points: baseline, 20min and 50min after the meal or starting of GIP-infusion. Obese subjects were studied also two months after the bariatric surgery.
Results: Both interventions enhanced SATBF, but the postprandial response in obese was lower from baseline (controls 105%, obese 29% increase from baseline, p=0.012) and during GIP-infusion (controls 385%, obese 119% increase from baseline, p=0.007) compared to controls. In contrast, VATBF increased similarly between the groups in response to meal (controls 91%, obese 48% increase from baseline) or GIP-infusion (control 234%, obese 105% increase from baseline). Neither VATBF response nor VATBF response over time differed between pre-surgery and control subjects after meal ingestion or GIP-infusion. Two months after the surgery, obese subjects had lost weight (ΔBMI -5.64±1.7 kg/m2, p<0.001) and insulin sensitivity had improved (HOMAIR from 7.1 ± 4.7 to 3.1±1.9 fraction, p=0.007). SATBF after meal ingestion was similar between controls and operated subjects (p=0.25). Flow response during GIP infusion remained lower in operated than control subjects (143% and 385% increase from baseline, respectively, p=0.016), but change over time was not significantly different from control subjects (p=0.07). Mixed meal slightly increased abdominal erector spinae muscle flow but less in obese than in controls (43% and 60% increase from baseline, respectively, p=0.031). GIP-infusion increased erector spinae flow more in controls than obese (131% and 42% increase from baseline, respectively, p=0.001). Surgery did not influence muscle flow responses.
Conclusion: The vasostimulatory effect of GIP and meal are blunted in subcutaneous but not in visceral adipose tissue in morbidly obese subjects. Bariatric surgery normalizes subcutaneous effects within two months.
Clinical Trial Registration Number: NCT01880827
Supported by: SA, SLS, SKS, V-S Regional Fund
Disclosure: T. Saari: None.
544
Reduction of oxidative stress on DNA and RNA in obese patients after Roux-en-Y gastric bypass surgery: an observational study of changes in urinary markers
E.R. Carlsson1,2, M. Fenger2, T. Henriksen3, L.K. Kjaer3, D. Worm4, D.L. Hansen5, S. Madsbad6, H.E. Poulsen3;
1Department of Clinical Biochemistry, Nordsjaellands Hospital, University of Copenhagen, Hilleroed, 2Department of Clinical Biochemistry, Copenhagen University Hospital Hvidovre, Hvidovre, 3Department of Clinical Pharmacology, Bispebjerg Frederiksberg Hospital, Copenhagen University Hospital, Copenhagen, 4Department of Medicine, Amager Hospital, Copenhagen, 5Steno Diabetes Center Copenhagen, Gentofte, 6Department of Endocrinology, Copenhagen University Hospital Hvidovre, Hvidovre, Denmark.
Background and aims: Increased oxidative stress in obesity and diabetes is associated with morbidity and mortality risk. Levels of oxidative damage to DNA and RNA can be estimated through measurement of 8-oxo-7,8-dihydro-2’-deoxyguanosine (8-oxodG) and 8-oxo-7,8-dihydroguanosine (8-oxoGuo) in urine. Both markers have been associated with type 2 diabetes, where especially 8-oxoGuo is prognostic for risk of mortality. We hypothesized that Roux-en-Y gastric bypass (RYGB) surgery might be working through mechanisms that reduce oxidative stress, thereby reducing levels of the urinary markers.
Materials and methods: The content of 8-oxodG and 8-oxoGuo was analyzed with LC-MS/MS in urinary samples from 356 obese patients (69.1 % women) treated with RYGB. Mean age (SD) was 44.2 (9.6) years, BMI was 42.1 (5.6) kg/m2 and 96 (27 %) of the patients had type 2 diabetes. Excretion levels of 8-oxodG and 8-oxoGuo were compared longitudinally and cross-sectionally, as estimates of the total 24-hour excretion, using a physiological model based on GFR, plasma- and urinary creatinine. Altogether, 1254 urine samples were included, of which 356 samples were collected before surgery, and 269, 232, 229 and 168 samples were collected 3, 6, 12 and 24 months after RYGB, respectively. Spearman’s correlations were calculated between excretion levels of the urinary markers and BMI, and to routine markers of glucose- and lipid metabolism.
Results: Two years after RYGB and a mean weight loss of 35 kg, decreased hyperglycemia and insulin resistance, excretion levels of both markers were reduced by approximately 12 % (P < 0.001). For both markers, excretion levels were about 30 % lower in the female subgroup (P < 0.0001). In this subgroup, excretion levels of 8-oxodG were significantly lower in patients with than without diabetes. For 8-oxodG, the strongest correlations were seen for HbA1c (rs = -0.319, n = 164, P < 0.0001) and HDL-cholesterol (rs = -0.188, n = 227, P < 0.01) 12 and 24 months after RYGB, respectively. For 8-oxoGuo, the strongest correlations were to BMI (rs = 0.235, n = 168, P < 0.01), insulin (rs = 0.208, n = 152, P < 0.05), C-peptide (rs = 0.186, n = 164, P < 0.05) and HOMA-IR (rs = 0.203, n = 162, P < 0.01) 24 months after RYGB, and to HDL-cholesterol (rs = -0.193, n = 354, P < 0.001) before surgery. No positive correlation was seen between 8-oxoGuo and HbA1c. None of the markers showed any association to LDL-cholesterol.
Conclusion: In summary, this study confirms associations between 8-oxoGuo and obesity but questions associations between 8-oxoGuo and diabetes/HbA1c, pointing more towards a connection to hyperinsulinemia and insulin-resistance. We conclude, that there is a reduction of oxidative damage to nucleic acids two years after RYGB-surgery and major weight loss. This indicates that reduced oxidative stress could be contributing to the many long-term benefits of RYGB-surgery in obesity and type 2 diabetes.
Supported by: The study was partially funded by the MInistry of Higher Education and Science (the UNIK-project)
Disclosure: E.R. Carlsson: Grants; The study was partially funded by The Ministry of Higher Education and Science (the UNIK project).
545
Effects of bariatric surgery on the incidence of heart failure and atrial fibrillation in patients with type 2 diabetes and obesity
G. Höskuldsdottir1, N. Sattar2, M. Miftaraj3, I. Näslund4, J. Ottosson5, S. Franzén3, A.-M. Svensson3, B. Eliasson1;
1Department of Molecular and Clinical Medicine, University of Gothenburg, Gothenburg, Sweden, 2The Institute of Cardiovascular and Medical Sciences, University of Glasgow, Glasgow, UK, 3National Diabetes Register, Centre of Registers, Gothenburg, Sweden, 4Department of Surgery, University of Örebro, Örebro, Sweden, 5Department of Surgery, University of Örebro, Gothenburg, Sweden.
Background and aims: To study the effects of obesity treatment with gastric bypass surgery on hospitalization for heart failure (HF) and atrial fibrillation (AF) in patients with type 2 diabetes (T2D) and obesity. We also studied the effects of gastric bypass surgery on mortality in a subgroup of individuals with preexisting heart failure.
Materials and methods: In this register-based nationwide cohort study we compared individuals with T2D and obesity that underwent Roux-en-Y gastric bypass surgery (RYGB) with matched individuals with T2D and obesity that did not undergo surgery. Data was gathered by linking the Swedish National Diabetes Register and Scandinavian Obesity Surgery Registry. Matching of individuals for age, gender, BMI and calendar time was done using a time updated propensity score. The main outcome measures were hospitalization for HF and/or AF, and mortality in patients with preexisting HF. The risk for heart failure, AF and death were assessed using a Cox-proportional hazards regression model that addressed measured confounding.
Results: We identified 5321 individuals with T2D and obesity that had undergone RYGB between January 2007 and December 2013 and 5321 matched controls. The individuals included were between 18 and 65 years old and had a BMI > 27.5 kg/m2. The follow-up time for hospitalization was until the end of 2015 (mean 4.5 years) and the end of 2016 for death. Our results show a 73% lower risk for HF (HR 0.27 (0.19, 0.38) p <0.001), 41% for AF (HF 0.59 (0.44, 0.78) p < 0.001), and 77% for concomitant AF and HF (HR 0.23 (0.12, 0.46) p < 0.001) in the surgically treated group. In patients with preexisting HF we observed significantly lower mortality in the group that underwent surgery (HR 0.23 (0.12, 0.43) p < 0.001).
Conclusion: Bariatric surgery may reduce risk for HF and AF in patients with T2D and obesity, speculatively via positive cardiovascular and renal effects. Obesity treatment with surgery may also be a valuable alternative in selected patients with T2D and HF.

Supported by: Regional support
Disclosure: G. Höskuldsdottir: None.
546
Gut hormone release after one anastomosis gastric bypass vs Roux-en Y gastric bypass : similar GLP-1 decrease secretion of GIP
C. Carette1,2, D. De Bandt1, D. Bergerot2, M. Le Gall3, J. Lacorte4, S. Czernichow1, A. Blanchard5, J.-M. Chevallier6, C. Rives-Lange1, T. Poghosyan6, J. Le Beyec - Le Bihan4,3;
1Nutrition, Hôpital Européen Georges Pompidou, APHP.Centre - Université de Paris, Paris, 2Centre d'Investigation Clinique 1418-Inserm, Hôpital Européen Georges Pompidou, APHP.Centre - Université de Paris, Paris, 3UMR1149, Inserm, Université de Paris, Paris, 4Biochimie Endocrinienne et Oncologique, Hôpital Pitié-Salpêtrière, APHP - Sorbonne Université, Paris, 5Centre des Investigations Cliniques, Hôpital Européen Georges Pompidou, APHP.Centre - Université de Paris, Paris, 6Chirurgie digestive, Hôpital Européen Georges Pompidou, APHP.Centre - Université de Paris, Paris, France.
Background and aims: The Roux-en Y gastric bypass (RYGB) is a recognized long-term effective treatment for obesity. Its success in term of weight loss and comorbidities improvement, especially diabetes, is partly associated with change in secretion of pancreatic and gut hormones (i.e. GLP-1⋯). One anastomosis gastric bypass (OAGB) introduced more recently, has been increasingly carried out. While the safety of this procedure is debated, OAGB is described to be at least as effective as RYGB regarding weight loss and diabetes remission at 2 years. Nevertheless, there are no data on gut hormone secretions (fasting or postprandial) after OAGB. The aim of this study was to compare fasting and postprandial secretions of pancreatic and gut hormones in OAGB versus RYGB patients.
Materials and methods: Thirty patients,15 OAGB- and 15 RYGB-operated at 2 years post-surgery, underwent a liquid mixed-meal tolerance test. Blood was sampled at baseline and 15, 30, 60, 90 and 120 min after the meal for plasma measurement of glucose, C-peptide, insulin, glucagon, GLP-1, GIP, GLP-2, PYY and ghrelin. Areas under curve (AUC) were calculated. Results are expressed as mean ± SEM and statistical analysis used non parametric tests.
Results: The pre-operative weight and the average percentage of weight loss 2 years after surgery were not different between the two groups (32.4% of weight loss for OAGB vs 31.2 % for RYGB, p = 0.45). The fasting and postprandial blood glucose levels were similar and the mean glycemic AUC values were 713.6 mM.min and 809.7 mM.min for respectively OAGB and RYGB (p = 0.87). Fasting and postprandial peak levels of C-peptide (or insulin) were significantly lower in OAGB vs RYGB patients (1.1 vs 1.5 μg/l for fasting level and 8.1 vs 10 μg/l for peak level, p<0.05). Accordingly, the HOMA index was 2 times lower in the OAGB group (0.73 vs 1.46 in RYGB, p <0.01). Strong postprandial secretion of intestinal hormones was measured in the 2 groups of patients but no difference was observed between OAGB and RYGB groups for GLP-1, GLP-2 or PYY AUC values. Postprandial secretion of GIP was lower in OAGB compared to RYGB patients (707 vs 1166 pg/ml for postprandial peak concentrations, p<0.05).
Conclusion: This is the first clinical study analyzing the secretions of intestinal hormones in OAGB-operated patients in comparison to RYGB-operated patients. Our results show that, as observed after RYGB, the OAGB procedure allow to restore high postprandial secretions of intestinal hormones, in particular GLP-1. The lower GIP postprandial secretion observed in OAGB patients could be explained by their longer proximal intestinal segment excluded from the nutrient passage. Indeed, GIP is mainly produced in the proximal part of the small intestine. Whether the lower postprandial secretion of GIP is responsible of the lower postprandial insulin peak observed in OAGB patients remains to be determined.
Clinical Trial Registration Number: NCT03482895
Supported by: Prix ANTADIR-SFNEP
Disclosure: C. Carette: Grants; Prix ANTADIR-SFN. Honorarium; AstraZeneca, Novartis, Novo Nordisk, MSD, Lilly, Servier. Lecture/other fees; Publicis Health. Non-financial support; MSD, Novartis, Novo Nordisk, Lilly, Sanofi, AstraZeneca, Servier, BMS, Abbott, Amgen, Vifor, Vitalaire, Fresenius Kabi.
547
Two-year follow-up after gastric bypass surgery: sustained beneficial effect on metabolic health and hormonal dynamics in subjects with type 2 diabetes
K.E. Almby1, P. Katsogiannos1, P. Kamble1, M.J. Pereira1, U. Wiklund2, J.W. Eriksson1;
1Department of Medical Sciences, Uppsala Universitet, Uppsala, 2Umeå Universitet, Umeå, Sweden.
Background and aims: Gastric bypass surgery (GBP) not only reduces weight but improves glycaemic control in type 2 diabetes (T2DM) patients as well. To explore the mechanisms behind this, we studied the metabolic effects of GBP over time using an integrative approach.
Materials and methods: We conducted a prospective study of 13 subjects with T2DM since 4 ±3 years, treated with oral glucose lowering drugs (GLD), recruited before their GBP surgery (3M/10F, age 51 ± 9 years). Subjects were assessed at preoperative baseline (BL) and four weeks (4W), six months (6M) and two years (2Y) post-operatively. During visits, fasting hormone and metabolite levels were measured, as well as resting heart rate variability (HRV) followed by subcutaneous adipose tissue (AT) biopsies, a 30 min 5 gram IV-arginine challenge (ARG) and a 180 min oral glucose tolerance test (OGTT).
Results: All but one subject discontinued their GLD after surgery and remained without antidiabetic drugs at 2Y follow-up. HbA1c was reduced after surgery and remained at non-diabetic levels at 2Y (see Table. SD=standard deviation. SEM=standard error of the mean. P-value from Student’s T-test). Fasting insulin was reduced significantly 4W after surgery (28.0 ±10.8 mE/L vs 14.4 ±10.8 mE/L) and even lower at 6M (8.9 ±5.6 mE/L) and 2Y (8.0 ±6.2 mE/L). Fasting cortisol was significantly lower than BL at 4W, but significantly increased relative to BL levels at 6M. ACTH was lower than BL at 4W and 6M (borderline significant), but returned to BL levels at 2Y. Insulin excursions after arginine stimulation were markedly reduced 4W after surgery and remained so at 6M and 2Y (data not shown). At all time points after surgery, peak p-glucose during OGTT occurred earlier, as did the consequent drop in glucose levels. The secretion of insulin during OGTT mirrored this pattern. Total GLP-1 levels during OGTT (area under the curve=AUC) increased significantly 4W after surgery and remained increased at 6M and 2Y. AUC for GIP during OGTT had decreased significantly 4W after surgery and continued to do so for 6M and 2Y. Both GLP-1 and GIP however showed an earlier peak in secretion. HOMA-IR improved after surgery (see Table) and remained so at 2Y. Total body fat decreased with GBP (Table), as did adipocyte cell size vs BL (diameter 110.7±11.2 μm) at 4W (94.9±13.1 μm, p=0.013), 6M (101.6±13.1 μm, p=0.0035) and 2Y (93.1±12.7 μm, p<0.001).
Conclusion: GBP improves glucose control in T2DM and reduces the need for GLD. Beneficially effects on metabolic parameters and adipocyte morphology are still seen after 2Y of follow-up. A marked increase in AUC for GLP-1 whereas AUC for GIP decreases after surgery, although both have an earlier peak in secretion during OGTT. A decrease in morning cortisol is seen at 4W after GBP, but no concomitant rise in ACTH, suggesting a central mechanism might affect cortisol and in turn contribute to early improvements in glucose homeostasis.

Clinical Trial Registration Number: NCT02729246
Supported by: The Swedish Diabetes Foundation, EXODIAB, The Ernfors Foundation, ALF grants
Disclosure: K.E. Almby: None.
548
Low-calorie intake: a key mechanism contributing to the metabolic impacts of Roux-en-Y gastric bypass surgery
Q. Chen, K. Alexiadou, B. Jones, C. Sands, M.R. Lewis, S.R. Bloom, T. Tan, J. Li;
Department of Metabolism, Digestion and Reproduction, Imperial College London, London, UK.
Background and aims: Roux-en-Y gastric bypass (RYGB) is the most common type of bariatric surgery, and the most efficacious treatment for obesity and type 2 diabetes. Proposed mechanisms for RYGB include calorie restriction, gut hormone modulation, and gut microbial changes. Subcutaneous infusion of gut hormone combination “GOP” composed of glucagon-like peptide 1, oxyntomodulin and peptide YY to simulate post prandial elevations seen after RYGB has been shown to improve glycaemic profiles and reduce body weight. The objective of this study was to compare the metabolomic changes resulting from a very low calorie diet (VLCD), GOP infusion versus RYGB.
Materials and methods: A total of 68 patients were recruited and stratified into four groups: (1) VLCD, ~800 kcal/day, (n=22) for four weeks; (2) daily subcutaneous infusion of GOP (n=14) and (3) saline (n=11) for four weeks; (4) RYGB (n=21). Fasting plasma and urine samples were collected pre-intervention and at four weeks post-intervention and analysed using 1H NMR spectroscopy-based metabolic profiling. The resulting spectral data were modelled using principal component analysis and orthogonal partial least squares-discriminant analysis based on auto-scaled data in MATLAB. The quantified small metabolites and lipids from the matched pairs (pre- vs. post- from the same patient) were analysed using paired Wilcoxon signed-rank test in R Studio. The Benjamini-Hochberg procedure was used to control the false discovery rate in both full resolution spectral data and quantified metabolite data.
Results: Quantified data showed significantly reduced plasma levels of glucose and apolipoprotein A1 after all the three interventions. While GOP did not share any additional changes with RYGB, HDL subfractions of cholesterol, apolipoprotein and phospholipids, and VLDL-5 of triglycerides and phospholipids were reduced by both VLCD and RYGB. Significantly reduced plasma levels of valine, leucine, tyrosine, alanine and pyruvate, together with significantly elevated levels of ketone bodies (i.e. 3-hydroxybutyrate, acetoacetate and acetone) and citrate were observed in VLCD and RYGB groups post intervention. VLCD and RYGB induced significant urinary metabolite changes, but not GOP. Quantified data showed significantly elevated urinary levels of acetoacetate, acetone and citrate in VLCD and RYGB, together with significantly elevated levels of 4-cresyl sulfate based on the full-resolution data.
Conclusion: Low-calorie intake post RYGB contributed to the metabolic changes at four weeks postoperatively, reflected by increased levels of ketone bodies and decreased plasma HDL subfractions and VLDL-5. In addition, VLCD and RYGB both induced host-microbial metabolic changes as indicated by the increase in 4-cresyl sulfate. These findings suggest that RYGB and VLCD may share a common mechanism based on caloric restriction; however, GOP infusion could exert its metabolic effect through different mechanisms.
Clinical Trial Registration Number: NCT01945840
Supported by: MRC Experimental Medicine Challenge Grant
Disclosure: Q. Chen: Grants; U.K. Medical Research Council (MRC) Experimental Medicine Challenge Grant (MR/K02115X/1).
549
Differences in adipose tissue-derived molecules in obese patients in the absence or presence of renal dysfunction and impact of bariatric surgery
R. Vila-Bedmar1, M. Martín-Taboada1, B. Lanzón1, I. González de Pablos2, L. Torres1, P. Gomez-Rodriguez3, E. Rodríguez-Cuellar3, A.E. Rodriguez-Rodriguez4, S. Luis-Lima5,6, E. Porrini6,5, E. Morales2, G. Medina-Gomez1;
1Ciencias Básicas de la Salud, Universidad Rey Juan Carlos, Alcorcon (Madrid), 2Servicio de Nefrología, Instituto de Investigación Hospital 12 de Octubre (UCM), Madrid, 3Servicio de Cirugía General y Aparato Digestivo, Hospital 12 de Octubre, Madrid, 4Servicio de Investigación, Hospital Universitario de las Islas Canarias, La Laguna, Tenerife, 5Instituto Tecnologías Biomédicas (ITB), Universidad de la Laguna, Tenerife, 6Servicio de Nefrología, Hospital Universitario de las Islas Canarias, La Laguna, Tenerife, Spain.
Background and aims: Obesity is an important risk factor for the development of chronic kidney disease (CKD). The secretion pattern of adipose tissue (AT)-derived molecules, including lipids, cytokines and adipokines, altered during obesity, may underlie the pathogenesis of obesity-related CKD. Weight loss can improve renal function, with bariatric surgery (BS) as the most effective option. The aim of this study was to analyze the differences in AT-derived molecules in morbid obese patients with/ without CKD and undergoing BS.
Materials and methods: 12 morbid obese patients without renal injury (control group) and 12 morbid obese patients with CKD, which underwent BS were included. Serum and urine samples were obtained prior and 12 months after the surgery. AT biopsies from subcutaneous and visceral depots were collected during BS, and histologically studied. Metabolic status and renal function were characterized by biochemical parameters and the analysis of estimated (eGFR) and measured glomerular filtration rate (mGFR), through iohexol plasma clearance method. Lipidomic analysis (LC-MS) of serum samples was performed. Circulating adipocytokines were analyzed using Bioplex system.
Results: Morbid obese patients with CKD (proteinuria: 2,63± 2,98 g/24h; albuminuria: 1882,66±2344 mg/24h; serum creatinine: 1,13±0,43 mg/dl; eGFR-MDRD: 71.6±30,5 ml/min/1.73m2) showed an increase in circulating adipokines (adipsin, visfatin) and pro-inflammatory cytokines (IL-1β, IL-6, MCP-1, TNFα), and in the pro-fibrotic factor TGF-β, compared to the control group (p<,05). AT biopsies did not show major differences between groups. After 12 months of BS, patients with CKD showed an important reduction of proteinuria (1,04±0,99 g/m2/day, p<,05) and albuminuria (781,18±1024,83 mg/24h, p<,05). eGFR increased (72.6 to 83.1 ml/ min, p<,001), whereas there was a reduction of mGFR (91.2 to 77.4 ml/min) (p<,001). There was a decrease in adipokines related to renal injury (leptin, vifastin) and an increase in the levels of adiponectin, protective for renal function. Inflammatory cytokines (IL-1β, IL-6, MCP-1, TNFα) and other circulating factors (VEGF, TGF-β) were lower in the serum of patients after BS (p<,05). Lipidomic analysis revealed a general increase in lipid species including TG and ceramides in patients with CKD, whereas the lipid profile improved after BS at the expense of HDL-cholesterol and a reduction in TG.
Conclusion: Morbid obese patients with CKD display a circulating pattern compatible with obesity-associated metabolic disturbances compared to the control group. BS may be an effective option to prevent kidney damage in obese subjects with CKD, through the modulation of AT secretion pattern regarding adipokines, lipid species and pro-inflammatory cytokines.
Clinical Trial Registration Number: NCT02644928
Supported by: BFU2016-78951-R, B2017/BMD-3684, BFU2017-90578-REDT; AYUDA PUENTE 2019, URJC
Disclosure: R. Vila-Bedmar: None.
550
Physical activity levels in elderly type 1 and type 2 diabetes patients and their association with body mass index
Š. Volčanšek, M. Lunder, A. Janež;
University Medical Centre Ljubljana, Ljubljana, Slovenia.
Background and aims: Physical inactivity and sedentary lifestyle are increasing across all age groups despite proven health benefits of regular physical activity (PA) in patients with chronic conditions. The aim of the study was to examine self-reported PA and sitting time (ST) in elderly type 1 diabetes (T1D) and type 2 diabetes (T2D) patients. We further evaluated the possible association of PA or ST with body mass index (BMI).
Materials and methods: This cross-sectional study recruited 120 consecutive insulin treated diabetes patients, that were aged above 60 years and completed the International Physical Activity Questionnaire (IPAQ). Independent sample t-test and chi-square test was used to compare variables by diabetes types or PA level. Possible associations of PA and sitting time (ST) with BMI were calculated using Pearson Correlation. Results were reported as mean ± SEM.
Results: The average age of patients was 71.6 ± 8.3 years, 75% of patients had T2D. The recommended 150 minutes of moderate weekly activity was reached by 52%. T1D patients were active 162 ± 32 minutes weekly and sedentary 4.4 ± 0.7 hours daily, while T2D patients were active 72 ± 12 minutes weekly and sedentary 6.7 ± 0.9 hours daily (both P <0.01). Further significant differences between T1D and T2D patients were observed in intensity of PA (low/moderate/high: T1D 34%/28%/38% vs. T2D 49%/44%/7%, P<0.01). The T1D were overweight in 62% and obese in 18%. BMI of T1D patients was significantly lower (27.1 ± 5.6 kg/m2) compared to T2D diabetes patients, who were on the average obese with BMI 30.4 ± 6.1 kg/m2 and reached the criteria for being overweight or obese in 80 %. An inverse relationship between PA and BMI was proven in T1D (R -0.5, P<0.01), see Graph 1. Sitting time of T2D patients was positively associated with BMI (R 0.3, P<0.05). T2D and T1D patients, who were very active (achieving >1500 MET minutes of PA weekly) had significantly lower BMI (31.1 ± 6.4 vs. 26.2 ± 3.8; P<0.01).
Conclusion: Elderly T1D patients engaged in more intensive PA of longer duration compared to their T2D counterparts, who very more sedentary. Moreover, in T1D regular physical activity was inversely associated with BMI. Regarding bodyweight control, avoiding sedentary behaviour was efficient in T2D; however, low to moderate levels of PA were not sufficient to impact body weight.

Disclosure: Š. Volčanšek: None.
PS 42 Brain matters
551
Detection of diabetes from whole-body magnetic resonance imaging using deep learning
R. Wagner1,2, B. Dietz3, J. Machann4,5, P. Schwab6, J. Dienes2, S. Reichert2,1, A.L. Birkenfeld2,5, H.-U. Haering5, F. Schick4,5, N. Stefan2,5, M. Heni2,5, H. Preissl7,5, B. Schoelkopf3, S. Bauer3, A. Fritsche2,5;
1Institute for Diabetes Research and Metabolic Diseases of the Helmholtz Center Munich at the University of Tuebingen, Tuebingen, Germany, 2University Hospital Tuebingen, Tuebingen, Germany, 3Max Plack Institute for Intelligent Systems, Tuebingen, Germany, 4Eberhard-Karls University Tuebingen, Tuebingen, Germany, 5German Center for Diabetes Research, Neuherberg, Germany, 6ETH Zurich, Zurich, Switzerland, 7Eberhard Karls University Tübingen, Tuebingen, Germany.
Background and aims: Obesity is one of the main drivers of the globally rising prevalence of type 2 diabetes (T2D). Yet, obesity is not uniformly associated with metabolic consequences. The location of fat accumulation is critical for metabolic health. Specific patterns of body fat distribution, such as an increased ratio of visceral to subcutaneous fat, are closely related to insulin resistance which is crucial in the pathogenesis of T2D. There might be further, hitherto unknown features of body fat distribution which could additionally contribute to the disease.
Materials and methods: We used a machine learning approach with dense convolutional neural networks (DCNN) to detect diabetes related variables from 2371 T1-weighted whole-body magnetic resonance image (MRI) data sets. Each single measurement was labelled by sex, age, BMI, insulin sensitivity, HbA1c and prediabetes or incident diabetes. The result was compared to conventional models using segmented body fat compartment volumes. Anatomical labels were assigned to locations in the DCNN gradient heatmaps that are critical for discrimination.
Results: The AUC-ROC was 0.87 for the discrimination of diabetes and 0.68 for prediabetes. Classification performance was superior to conventional models. Mean absolute regression errors were comparable to those of the conventional models. Heatmaps clearly showed that lower visceral abdominal regions were most critical in diabetes classification, while other significant areas comprised upper legs, arms and the neck region.
Conclusion: Our results show that diabetes is detectable from whole-body MRI without any blood glucose measurement. Our technique of heatmap visualization unravels plausible anatomical regions and highlights the leading role of fat accumulation in the lower abdomen in the pathogenesis of T2D.
Supported by: BMBF to DZD
Disclosure: R. Wagner: Lecture/other fees; Novo Nordisk. Other; Travel Grant from Lilly.
552
A plant-based meal affects thalamus perfusion differently than an energy- and macronutrient-matched conventional meal in type 2 diabetes, obese, and healthy men
M. Kudláčková1, H. Kahleová2,1, J. Tintěra1, M. Klementová1, L. Thieme1, J. Veleba1, H. Malinská1, M. Mráz1, M. Haluzik1, R. Pavlovičová1, M. Hill3, T. Pelikanova1;
1Institute for Clinical and Experimental Medicine, Prague, Czech Republic, 2Physicians Committee for Responsible Medicine, Washington, USA, 3Institute of Endocrinology, Prague, Czech Republic.
Background and aims: Reward circuitry in the brain plays a key role in weight regulation. The aim of this study was to test the effects of a plant-based meal on brain regions.
Materials and methods: A randomized crossover study tested the effects of two energy - and macronutrient-matched meals: a vegan (V-meal) and a conventional meat (M-meal) on brain activity, gastrointestinal hormones, and satiety in participants with type 2 diabetes (T2D, n=20), obese participants (O, n=20), and healthy controls (H, n=20). Brain perfusion was measured, using arterial spin labelling functional brain imaging; satiety was assessed using a visual analogue scale; and plasma concentrations of gut hormones were determined at 0, and 180 min. Repeated-measures ANOVA was used for statistical analysis.
Results: Thalamus perfusion was the highest in patients with T2D, lower in healthy controls and the lowest in obese individuals (p=0.001). Thalamus perfusion decreased after ingestion of the M-meal in men with T2D (p=0.04) and overweight/obese men (p=0.004) and significant decreasement after ingestion of V-meal in healthy controls (p<0.001) has been noticed. The effect size for men with diabetes was - 0.41 (95% CI, -1.14 to 0.31; p=0.26), for obese men was -0.72 (95% CI, -1.48 to 0.01; p=0.26) and for healthy men was 0.82 (95%CI, 0.09 to 1.59; p=0.03). Changes in thalamus perfusion after ingestion of both meals correlated with changes in satiety (r= +0.68; p<0.01), fasting plasma insulin (r= +0.40; p<0.01), C-peptide (r= +0.48; p<0.01) and amylin (r= +0.55; p<0.01), insulin secretion (r= +0.77; p<0.05).
Conclusion: While men with T2D and overweight/obese men experienced a decrease in thalamus perfusion after the M-meal, we observed the opposite in healthy controls whose thalamus perfusion decreased after the V-meal. The changes correlates with changes in satiety and insulin secretion.
Clinical Trial Registration Number: NCT02474147
Supported by: MH CZ-DRO (IKEM, IN 00023001)
Disclosure: M. Kudláčková: None.
553
Short-term HFD increases FGF21 mRNA expression in hypothalamic tanycytes and POMC neurons: consequences on the early onset of neuronal inflammation and insulin resistance
C. Alexandre1, S. Al-Rifai1, G. Poizat1, M. Imbernon2, V. Prevot2, M. Taouis1, Y. Benomar1;
1UMR9197 CNRS, Institut NeuroPSI, Orsay, 2Development and Plasticity of the Neuroendocrine Brain, Inserm U1172, Lille, France.
Background and aims: Obesity induced by high fat (HF) feeding is closely linked to several metabolic disorders including hypothalamic inflammation and insulin resistance, which constitute risk factors for type 2 diabetes (T2D). The Fibroblast growth factor (FGF) 21, a metabolic hormone predominantly produced by liver, has beneficial effects on glucose and lipid metabolism. This hepatokine also protects against HF diet (HFD)-Induced inflammation and insulin resistance. Recently, it has been reported that FGF21 is also produced by the hypothalamus. However, the role of hypothalamic FGF21 remains poorly understood. Here we aim to characterize the hypothalamic nuclei and neural cells expressing FGF21 and its receptors (FGFR1/KLB) and to establish their temporal regulation by HF feeding. This study also aims to investigate the potential protective role of FGF21 against the development of neuronal inflammation and insulin resistance.
Materials and methods: C57BL/6J mice were fed with regular chow diet or HFD for 3 and 8 days. Metabolic phenotyping, in situ hybridization (ISH) / immunohistochemistry (IHC), and biochemical analyses were performed to assess the impact of HFD on the hypothalamic expression of FGF21 and the development of hypothalamic inflammation, reactive gliosis and insulin resistance. Mouse (mHypo) and human (SH-SY5Y) neuronal cells as well as primary culture of tanycytes were also used to evaluate the potential protective effects of FGF21 against inflammation and impairment of insulin signaling induced by palmitate or insulin overexposure.
Results: Using combined ISH/IHC analysis, using FGF21-specific riboprobe and specific markers of tanycytes, neurons, astrocytes and microglia cells ; we show a marked expression of FGF21 in tanycytes and arcuate POMC neurons. Additionally, we report that FGF21 receptors (FGFR1/KLB) are expressed in neurons, tanycytes, microglia cells and astrocytes of the mediobasal hypothalamus (MBH). Interestingly, short-term HFD exposure significantly increases the hypothalamic expression of FGF21 and its receptors FGFR1 and KLB, specifically within MBH tanycytes and ARC POMC neurons (p<0.05 Kruskal Wallis test). These changes positively correlate with HFD-induced hypothalamic inflammation, reactive gliosis and glucose intolerance (p<0.05 Mann-Whitney test). Importantly, in vitro studies, using neuronal cells and primary cultures of tanycytes show that FGF21 treatment prevents inflammatory responses and the impairment of insulin signaling induced by palmitate or insulin overexposure (p<0.05 Mann-Whitney test).
Conclusion: In summary our findings demonstrates, for the first time, that acute consumption of HFD increases FGF21 mRNA expression within MBH tanycytes and ARC POMC neurons. Interestingly, FGF21 treatments prevent the development of neuronal inflammation and insulin resistance. These data suggest that tanycytes and POMC neurons-derived FGF21 could play a crucial role in preventing neuronal inflammation and insulin resistance. Further investigations are, however, needed to establish the direct link between hypothalamic FGF21 and HFD-induced hypothalamic inflammation and related neuronal and metabolic dysfunctions.
Disclosure: C. Alexandre: None.
554
The regulation of glucose metabolism by astrocytes in diet induced obesity mice
M. Sugiyama1, R. Banno2, R. Sun1, H. Yaginuma1, K. Taki1, H. Takagi1, Y. Ito1, K. Yamanaka2, H. Arima1;
1Nagoya University Graduate School of Medicine, Nagoya, 2Nagoya University, Nagoya, Japan.
Background and aims: There are several lines of evidence that the brain directly regulates peripheral glucose metabolism. Not only the neurons but also glial cells in the brain participate in the regulation of glucose metabolism. Astrocytes are the most abundant in glial cells, and leptin, insulin and inflammatory signaling in astrocytes regulate glucose metabolism. Protein tyrosine phosphatase 1B (PTP1B) is a non-receptor tyrosine phosphatase that is widely expressed in the body, and negatively regulate both insulin and leptin receptor signaling in the brain. Recently, PTP1B also has been implicated to regulate inflammatory signaling in the brain especially under a high fat diet (HFD) condition. In this study, we investigated the effects of PTP1B in astrocytes on glucose metabolism under HFD condition.
Materials and methods: We generated astrocyte specific PTP1B deficient (KO) mice or wild-type (WT) mice by crossing PTP1B loxP/loxP mice with GFAP-Cre heterozygous mice. Body weights were examined in mice placed on either HFD or a chow diet (Chow) at weaning. We also examined insulin tolerance test (ITT), glucose tolerance test (GTT) and evaluated hypothalamic inflammation in WT and KO.
Results: Body weights of KO mice were significantly lower than those of WT mice on HFD after 15 and 18 weeks of age (male and female, respectively). In contrast, on Chow, male and female mice showed no significant differences in body weight between genotypes. ITT and GTT were performed in male mice at the age of 13 and 14 weeks of age respectively when there were no differences in body weight between genotypes on HFD, and we found GTT was improved in KO mice compared to WT mice but there were no differences in ITT between genotypes. Hypothalamic inflammation was significantly decreased in KO mice compared to WT mice (male and female) at the age of 21 weeks on HFD.
Conclusion: PTP1B in astrocytes regulates glucose metabolism independent of body weight changes, and also regulates hypothalamic inflammation on HFD.
Disclosure: M. Sugiyama: None.
555
Semaglutide 2.4 mg once weekly reduces appetite, reduces energy intake, and improves control of eating in subjects with obesity
D. Skovgaard1, A. Breitschaft2, A. Wizert1, S. Tadayon1, M. Friedrichsen1;
1Novo Nordisk A/S, Søborg, Denmark, 2Parexel International GmbH, Berlin, Germany.
Background and aims: Semaglutide, a glucagon-like peptide-1 analogue, is currently available at the dose s.c. 1.0 mg once weekly for the treatment of type 2 diabetes and is under development for chronic weight management at the dose s.c. 2.4 mg once weekly (semaglutide 2.4 mg). GLP-1RAs can lead to delays in gastric emptying, which may be important for the uptake of other drugs. This trial investigated the effect of semaglutide 2.4 mg on gastric emptying, energy intake, appetite and control of eating in subjects with obesity.
Materials and methods: Adults aged 18-65 years, with a BMI 30-45 kg/m2 and HbA1c <6.5%, were randomised in a double-blind, parallel-group trial to treatment with semaglutide 2.4 mg (dose-escalated: 0.25, 0.5, 1.0 and 1.7 mg for 4 weeks each; 2.4 mg for 5 weeks) or placebo. Gastric emptying (paracetamol [para] absorption test, 1.5 g with standardised breakfast) was assessed (endpoints: AUC0-5h,para [primary], and AUC0-1h,para, peak concentration [Cmax,para], and time to Cmax [tmax,para] [secondary]) during in-house visits at baseline and at week 20. Postprandial appetite was evaluated using visual analogue scales pre-meal and during a standardised breakfast; and followed by assessment of energy intake during an ad libitum lunch meal. Control of eating and food cravings were evaluated by the Control of Eating Questionnaire (CoEQ). Safety was also evaluated.
Results: In total, 72 subjects were randomised (44 males, mean age 42.8 years, BMI 34.4 kg/m2); 70 completed the study. Paracetamol AUC0-5h,para was modestly increased by 8% (p<0.01) with semaglutide 2.4 mg (5% increase when corrected for bodyweight at week 20; p=0.12) and no effect was seen on AUC0-1h,para, Cmax,para or tmax,para. Mean energy intake during ad libitum lunch at week 20 was significantly lower by 35% with semaglutide 2.4 mg vs placebo (1,736 vs 2,676 kJ); estimated treatment difference (ETD) 940 kJ; p<0.0001. Overall appetite score showed significant reduction in appetite with semaglutide 2.4 mg vs placebo (p=0.001); individual appetite components showed significant reductions in ‘hunger’ and ‘prospective food consumption’ and increases for ‘fullness’ and ‘satiety’ (p<0.02) (Figure). In general, CoEQ indicated fewer and weaker food cravings, notably reduced cravings for savoury foods, and better control of eating with semaglutide 2.4 mg vs placebo (p<0.02). No new safety signals were seen.
Conclusion: In subjects with obesity, semaglutide 2.4 mg suppressed appetite, and reduced the frequency and strength of food cravings. Ad libitum lunch energy intake at week 20 was 35% lower with semaglutide 2.4 mg vs placebo. There was also no clinically relevant effect on gastric emptying with semaglutide 2.4 mg at steady state, measured by paracetamol uptake.

Clinical Trial Registration Number: NCT03842202
Supported by: Novo Nordisk A/S
Disclosure: D. Skovgaard: Employment/Consultancy; Novo Nordisk A/S. Stock/Shareholding; Novo Nordisk A/S.
556
Tirzepatide, a dual GIP and GLP-1 receptor agonist, mediates its anorexigenic effect in mice due to a reduction in homeostatic and reward-related feeding
R. Samms, R. Cosgrove, M. Antonellis, B. Droz, W.C. Roell, K.W. Sloop, J.S. Moyers, M. Matthew, P.J. Emmerson, T. Coskun;
Eli Lilly and Company, Indianapolis, USA.
Background and aims: Tirzepatide (TZP), a novel dual GIP and GLP-1 receptor agonist, has demonstrated clinically meaningful weight loss in type 2 diabetes mellitus (T2DM) patients. Preclinical data indicate that TZP lowers body weight due to a reduction in caloric intake; however, associated effects on feeding behavior have not been studied.
Materials and methods: To investigate how TZP affects homeostatic feeding, we examined its effect on markers of satiation (meal size), satiety (meal frequency) and hunger (time-interval between meals) in obese mice. Furthermore, to determine whether the anorexigenic action of TZP is associated with reward-related feeding, we exposed lean and obese animals to two-choice diet paradigms ((low-fat (6% of kcal from fat) vs high-fat (40% or 60% of kcal from fat) diets).
Results: Chronic treatment with TZP dose-dependently lowered body weight and food intake in high-fat fed mice. This reduction in total daily caloric intake was underlined by a reduction in meal size and frequency throughout a 14-day treatment period. Indicating that TZP’s effect on total energy intake is associated with reduced hunger and increased satiety. One driver of the current obesity epidemic is the consumption of highly palatable/calorically dense foods. Importantly, we found that while TZP decreased total calories consumed, it also altered macronutrient preference by increasing the intake of a low-fat diet and reducing intake of a high-fat diet. Furthermore, when exposed to a series of two-choice bottle tests, TZP reduced the consumption of nutritive (fructose and sucrose) and non-nutritive (sucralose) tastants, suggesting that TZP’s anorexigenic action may be linked to the taste and caloric content of food.
Conclusion: Taken together, these data indicate that TZP’s ability to lower daily energy intake is mediated by both a reduction in homeostatic and reward-driven food intake.
Disclosure: R. Samms: Employment/Consultancy; Eli Lilly and Company.
PS 43 SGLT-2 inhibitors: clinical aspects
557
Sodium glucose transporter 2 inhibitors might have proportional treatment effect to slow down estimated GFR decline in Japanese patients with type 2 diabetes
K. Kashima1, H. Shimizu2, M. Yamada3;
1Kiryu Kosei General Hospital, Kiryu, 2Maebashi Hirosegawa Clinic, Maebashi, 3Department of Medicine and Molecular Science, Gunma University, Maebashi, Japan.
Background and aims: Prevention of end stage renal disease (ESRD) is one of the priorities in diabetes management. But very few data are available in using sodium glucose transporter 2 inhibitor (SGLT2i) at advanced diabetic kidney disease (DKD). Once renal decline started, it continues to decline in steady rate. We assessed annual eGFR decline rate (slope) in patients with type 2 diabetes before and after adding SGLT2i.
Materials and methods: A total of 74 patients with chronic kidney disease (CKD) stage 3-4, treated by SGLT2i (empagliflozin 65% and others), were analyzed. The age and duration of diabetes of patients at the time of recruitment (middle in 2019) were as follows: stage 3A (eGFR 45-59 ml/min/1.73m2 (n=28); 69.4±9.6 year-old, 11.8±5.5 years, stage 3B; eGFR 30-44 ml/min/1.73m2 (n=28); 71.6±13.4 year-old, 19.9±12.3 years, and stage 4; eGFR<30ml/min/1.73m2 (n=18); 70.4±14.3 year-old, 13.8±8.5 years. Liraglutide was used to optimize blood glucose control in 39% (11/28), 64% (18/28) and 39% (7/18) respectively. Linear slopes were calculated from 46±21 month period before adding SGLT2i. In general, eGFR initially drops at 1st month and slopes after adding SGLT2i were calculated from 23.7±7.9 month period. Efficacy was compared based on individual eGFR decline rate in different CKD stages.
Results: 1) Initial eGFR drops on the average were as follows; stage 3A; 58.6±9.7 to 55.6±9.7 ml/min/1.73m2 (P<0.05), stage 3B; 43.2±7.1 to 40.9±6.5 ml/min/1.73m2 (P<0.01), stage 4; 30.6±10.2 to 28.7±9.4ml/min/1.73m2 (P<0.01). 2) eGFR decline slopes were improved from -6.6±9.2 to -1.6±3.9ml/min/1.73m2/year (P<0.0001) in whole patients. In different stages, annual eGFR slopes were improved in stage 3A: -4.7±4.2 to -1.3±4.7ml/min/1.73m2/year (P<0.01) and in stage 3B; -4.8±3.7 to -1.7±2.7ml/min/1.73m2/year (P<0.01). More pronounced improvement was found in stage 4; -12.3±16.3 to -2.0±4.3ml/min/1.73m2/year (P=0.01). The proportion of responders, whose eGFR decline slope obviously reduced after the start of SGLT2i, was more frequently observed in advanced stages: stage 3A; 64% (18/28), stage 3B; 79% (22/28), stage 4; 83%; (15/18). Improvement of eGFR slopes in those responders (55/74) was as follows, -8.0±10.2 to -0.4±3.3ml/min/1.73m2/year (P<0.0001). 3) Rapid eGFR decliners (>10 ml/min/1.73m2/year) existed in 19% (14/74) of whole patients. The age of those patients was 60.0±13.8 year-old and duration of diabetes was 11.7±8.1 years and had nephrotic syndrome in 43% (6/14) and micro- and normo-albuminuria DKD existed 36% (5/14). In those patients, individual eGFR slopes were remarkably improved from -18.7±15.8 to -0.5±3.6ml/min/1.73m2/year (P<0.001).
Conclusion: Renal protective effect is more pronounced in advanced stages of DKD or in rapid decliners. SGLT2i might have proportional rather than uniform treatment effect. eGFR slope analyses are needed to monitor and prevent the progression to ESRD.
Clinical Trial Regsitration Number: 1-K023
Disclosure: K. Kashima: None.
558
Effects of canagliflozin on cardiovascular death and hospitalisation for heart failure by eGFR: integrated analyses of the CANVAS Program and CREDENCE
K.W. Mahaffey1, G. Bakris2, J. Blais3, C. Cannon4, D. Cherney5, C.V. Damaraju3, J. Gogate3, T. Greene6, H.J.L. Heerspink7,8, J.L. Januzzi9, M. Kosiborod7,10, A. Levin11, I. Lingvay12, M. Weir13, V. Perkovic7;
1Stanford University School of Medicine, Stanford, USA, 2University of Chicago Medicine, Chicago, USA, 3Janssen Scientific Affairs, LLC, Titusville, USA, 4Brigham & Women’s Hospital and Baim Institute for Clinical Research, Boston, USA, 5University of Toronto, Toronto, Canada, 6University of Utah, Salt Lake City, USA, 7The George Institute for Global Health, UNSW Sydney, Sydney, Australia, 8University of Groningen, Groningen, Netherlands, 9Massachusetts General Hospital and Baim Institute for Clinical Research, Boston, USA, 10Saint Luke’s Mid America Heart Institute and University of Missouri – Kansas City, Kansas City, USA, 11University of British Columbia, Vancouver, Canada, 12University of Texas Southwestern Medical Center, Dallas, USA, 13University of Maryland School of Medicine, Baltimore, USA.
Background and aims: People with type 2 diabetes mellitus (T2DM) have a greater risk of cardiovascular (CV) disease, including hospitalization for heart failure (HHF), a complication that is more common as renal function declines. The sodium glucose co-transporter 2 (SGLT2) inhibitor canagliflozin (CANA) reduced the risk of HHF in patients with T2DM and high CV risk or nephropathy in the CANVAS Program and CREDENCE trials, respectively.
Materials and methods: This post hoc analysis included integrated, pooled data from the CANVAS Program and the CREDENCE trial. The effects of CANA compared with placebo on CV death or HHF, HHF, and CV death were assessed in subgroups defined by baseline eGFR (<45, 45-60, and >60 mL/min/1.73 m2). Hazard ratios (HRs) and 95% CIs were estimated using Cox regression models, with subgroup by treatment interaction terms added to test for heterogeneity. Interaction P values were calculated by including treatment group and baseline eGFR in the model.
Results: A total of 14,543 participants from the CANVAS Program (N=10,142) and CREDENCE (N=4,401) were included, with mean age, 65 y; 65% male; 75% white; mean eGFR 70.3 mL/min/1.73 m2. 1919 (13.2%) participants had baseline eGFR <45 mL/min/1.73 m2 (mean, 36.7 mL/min/1.73 m2), 2972 (20.4%) participants had eGFR 45-60 mL/min/1.73 m2 (mean, 53.1 mL/min/1.73 m2), and 9649 (66.3%) participants had eGFR >60 mL/min/1.73 m2 (mean, 82.3 mL/min/1.73 m2). Rates of CV death or HHF, HHF, and CV death increased as eGFR declined (Figure). CANA significantly reduced the risk of CV death or HHF and HHF compared with PBO, with consistent effects observed across subgroups.
Conclusion: CV death or HHF, HHF, and CV death event rates increased with lower baseline eGFR. CANA significantly reduced the risk of CV death or HHF, jointly and individually, in participants with T2DM and high CV risk or CKD in the CANVAS Program and the CREDENCE trial, with consistent benefits observed regardless of baseline eGFR.

Clinical Trial Registration Number: NCT02065791; NCT01032629; NCT01989754
Supported by: Janssen Research & Development, LLC
Disclosure: K.W. Mahaffey: Employment/Consultancy; Abbvie, Astellas, AstraZeneca, Boehringer Ingelheim, Fresenius, Gilead, Janssen, Merck, Mitsubishi-Tanabe. Grants; Abbvie, AstraZeneca, Boehringer Ingelheim, Janssen.
559
Implications of initial eGFR response to empagliflozin treatment effects
B.J. Kraus1,2, M.R. Weir3, G.L. Bakris4, M. Mattheus5, D.Z.I. Cherney6, N. Sattar7, H.J.L. Heerspink8, I. Ritter9, M. von Eynatten9, B. Zinman10, S.E. Inzucchi11, C. Wanner1, A. Koitka-Weber1,9;
1Department of Internal Medicine I, University Hospital Würzburg, Würzburg, Germany, 2Comprehensive Heart Failure Centre, University of Würzburg, Würzburg, Germany, 3Division of Nephrology, Department of Medicine, University of Maryland School of Medicine, Baltimore, USA, 4Department of Medicine, Am. Heart Assoc. Comprehensive Hypertension Center, University of Chicago Medicine, Chicago, USA, 5Boehringer Ingelheim Pharma GmbH & Co.KG, Ingelheim, Germany, 6Department of Medicine and Department of Physiology, Division of Nephrology, University Health Network, University of Toronto, Toronto, Canada, 7Institute of Cardiovascular and Medical Sciences, University of Glasgow, Glasgow, UK, 8Department of Clinical Pharmacy and Pharmacology, University of Groningen, University Medical Center Groningen, Groningen, Netherlands, 9Boehringer Ingelheim International GmbH, Ingelheim, Germany, 10Lunenfeld-Tanenbaum Research Institute, Mount Sinai Hospital and University of Toronto, Toronto, Canada, 11Section of Endocrinology, Yale University School of Medicine, New Haven, USA.
Background and aims: In EMPA-REG OUTCOME, empagliflozin (EMPA) reduced the risk of CV death by 38% in T2D patients (pts) with CV disease. EMPA induces an initial, reversible dip in estimated glomerular filtration rate (eGFR). We investigated whether this transient initial renal hemodynamic effect was influenced by baseline characteristics or had an impact on the EMPA-induced risk reduction in CV death.
Materials and methods: In a post hoc analysis, the 6,668 pts randomized to EMPA 10 mg, 25 mg or placebo [PBO] with eGFR available, were categorised by initial percentage eGFR change from baseline to Week 4. Multivariate logistic regression was used to identify baseline characteristics predictive of ‘eGFR dip’ >10%. The impact of an ‘eGFR dip’ >10% on the risk reduction in CV death was assessed using Cox regression.
Results: 28.3% of EMPA pts vs 13.4% PBO experienced an initial ‘eGFR dip’ >10% from baseline to Week 4. Diuretic use and/or higher KDIGO risk category at baseline were predictive of an ‘eGFR dip’ of >10% in EMPA vs. PBO. The overall odds ratio [OR; 95% CI] for an ‘eGFR dip’ >10% with EMPA was 2.7 [2.3-3.0]. In subgroups with a dipping odds ratio below or equal vs. above, beneficial treatment effects with EMPA on CV death were consistent (panel A). Also, an ‘eGFR dip’ >10% did not affect empagliflozin-induced risk reduction for CV death (panel B). Serious adverse event rates were generally lower or similar in EMPA vs. PBO, regardless of baseline predictive factors for an ‘eGFR dip’.
Conclusion: T2D patients with more advanced kidney disease and/or on diuretic therapy were more likely to have an ‘eGFR dip’ >10% with EMPA. EMPA treatment was safe and reduced CV death, regardless of these baseline predictive factors, or an initial ‘eGFR dip’ >10%.

Clinical Trial Registration Number: NCT01131676
Supported by: Boehringer Ingelheim & Eli Lilly and Company Diabetes Alliance
Disclosure: B.J. Kraus: Grants; Boehringer Ingelheim. Honorarium; Boehringer Ingelheim.
560
Acute declines in eGFR during treatment with canagliflozin and its implications for clinical practice: insights from CREDENCE
H.J.L. Heerspink1,2, M. Oshima1,3, M.J. Jardine1,4, R. Agarwal5, G. Bakris6, D.M. Charytan7, D. de Zeeuw2, A. Levin8, K.W. Mahaffey9, B. Neal1,10, C. Pollock11, N. Rosenthal12, D.C. Wheeler1,13, H. Zhang14, V. Perkovic1;
1The George Institute for Global Health, UNSW Sydney, Sydney, Australia, 2Department of Clinical Pharmacy and Pharmacology, University of Groningen, University Medical Center Groningen, Groningen, Netherlands, 3Department of Nephrology and Laboratory Medicine, Kanazawa University, Kanazawa, Japan, 4Concord Repatriation General Hospital, Sydney, Australia, 5Indiana University School of Medicine and Veterans Affairs Medical Center, Indianapolis, USA, 6Department of Medicine, University of Chicago Medicine, Chicago, USA, 7Nephrology Division, NYU School of Medicine and NYU Langone Medical Center, New York, USA, 8Division of Nephrology, University of British Columbia, Vancouver, Canada, 9Stanford Center for Clinical Research, Stanford University School of Medicine, Stanford, USA, 10The Charles Perkins Centre, University of Sydney, Sydney, Australia and Imperial College London, London, UK, 11Kolling Institute of Medical Research, Sydney Medical School, University of Sydney, Royal North Shore Hospital, St Leonards, Australia, 12Janssen Research & Development, LLC, Raritan, USA, 13Department of Renal Medicine, UCL Medical School, London, UK, 14Renal Division of Peking University First Hospital, Beijing, China.
Background and aims: Canagliflozin (CANA) slows progression of chronic kidney disease (CKD) in people with type 2 diabetes. CANA also induces a reversible acute decline in estimated glomerular filtration rate (eGFR), which is believed to be a hemodynamic effect. Predictors of the initial decline and its association with long-term eGFR trajectories and safety outcomes are unknown.
Materials and methods: This post hoc study of the CREDENCE trial included 4289 patients with type 2 diabetes and CKD who had eGFR measured at both baseline and week 3. Participants were categorized by percentage decline in eGFR at week 3: >10%, ≤10% to >0%, and ≤0%. Baseline characteristics associated with acute eGFR declines >10% were evaluated using logistic regression. Long-term eGFR decline and safety outcomes were estimated in each eGFR decline category by linear mixed effects models and Cox regression after adjustment for laboratory measures and medication use.
Results: More participants in the CANA (956 [45%]) versus placebo (PBO) group (450 [21%]) had an acute eGFR decline >10% (p <0.001). A >30% decline occurred infrequently (89 [4%] with CANA and 39 [2%] with PBO; p <0.001). In the CANA but not in the PBO group, older age (OR CANA 1.17, 95% CI 1.05-1.31; per 10 years) and history of heart failure (OR CANA 0.77, 0.59-0.99) were associated with a higher and lower likelihood of an acute eGFR decline >10%, respectively (both p for interaction <0.05). Following the initial eGFR change, long-term eGFR trajectories as well as overall safety profiles were similar across eGFR decline categories (all p values >0.05). Results were consistent when other decline thresholds (>20%) were used and in subgroup analysis by baseline eGFR (30-<45, 45-<60, and 60-<90 mL/min/1.73 m2).
Conclusion: Although acute eGFR declines >10% occurred in nearly half of all patients following initiation of CANA, the benefit of CANA compared with placebo was observed regardless of the acute eGFR decline and safety profiles were similar.
Clinical Trial Registration Number: NCT02065791
Supported by: Janssen Research & Development, LLC
Disclosure: H.J.L. Heerspink: Employment/Consultancy; Abbvie, Astellas, AstraZeneca, Boehringer Ingelheim, Fresenius, Gilead, Janssen, Merck, Mitsubishi-Tanabe. Grants; Abbvie, AstraZeneca, Boehringer Ingelheim, Janssen.
561
Cardiorenal and metabolic outcomes of dapagliflozin vs placebo in patients at high cardiovascular risk without established cardiovascular disease: analyses from the DECLARE-TIMI 58 study
A. Cahn1, I. Raz1, L.A. Leiter2, O. Mosenzon1, S.A. Murphy3, D.L. Bhatt3, D.K. McGuire4, J.P.H. Wilding5, I.A.M. Gause-Nilsson6, A. Langkilde6, M. Sabatine3, S.D. Wiviott3;
1Hadassah Hebrew University Hospital, Jerusalem, Israel, 2Li Ka Shing Knowledge Institute, Toronto, Canada, 3TIMI Study Group, Boston, USA, 4University of Texas Southwestern Medical Center, Dallas, USA, 5Institute of Ageing and Chronic Disease, Liverpool, UK, 6BioPharmaceuticals R&D, AstraZeneca, Gothenburg, Sweden.
Background and aims: Current guidelines recommend prescribing SGLT-2 inhibitors (SGLT2i) to patients with type 2 diabetes (T2D) and established atherosclerotic cardiovascular disease (ASCVD) or with multiple risk factors (MRF) - at high risk for ASCVD or renal disease in order to reduce cardiovascular, heart failure and renal risk. The definition of ‘high risk’ varies among guidelines and more data on the impact of treatment with SGLT2i in different risk categories of MRF patients are needed.
Materials and methods: The DECLARE-TIMI 58 study randomized 17,160 patients with T2D and established ASCVD (40.6%) or MRF (59.4%) to dapagliflozin 10 mg vs. placebo, followed for a median of 4.2 years. MRF patients included men age ≥55 or women ≥60 with ≥1 additional ASCVD risk factor (hypertension, dyslipidemia or current smoking). In the MRF population dapagliflozin led to significant reduction in hospitalization for heart failure (HHF) and in the renal specific outcome (sustained decrease of ≥40% in eGFR to <60 ml/min/1.73m2, new end stage renal disease, or renal death). We thus studied these outcomes in the MRF population within clinically relevant sub-groups for treatment effect and subgroup-based treatment interaction. Metabolic outcomes (mean ± SD) were analyzed as well.
Results: 10,186 MRF patients were included in these analyses. The HR (95% CI) for HHF was 0.64 (0.46-0.88) and for the renal specific outcome was 0.51 (0.37-0.69) with dapagliflozin vs. placebo in the overall MRF group and was consistent across subgroups shown (Figure). At 48 months, patients randomized to dapagliflozin vs. placebo had lower HbA1c (7.8±1.2 vs. 8.0±1.4%), weight (86.8±19.7 vs. 88.4±20.4 kg), systolic blood pressure (132.8±14.6 vs. 135.1±15.0 mmHg), and urinary albumin creatinine ratio (92.9±437.5 vs. 130.0±483.8 mg/gr), and had higher eGFR (77.7±16.8 vs. 76.8±17.3 mL/min/1.73m2) p<0.05 for difference in change from baseline for dapagliflozin vs. placebo for all parameters.
Conclusion: The MRF population in the DECLARE-TIMI 58 study experienced significant reduction with dapagliflozin vs. placebo in HHF and in the renal specific outcome regardless of age, BMI, diabetes duration, HbA1c, eGFR, history of HF or number of additional risk factors. Metabolic outcomes improved as well. These analyses support the benefit of dapagliflozin on important outcomes in this high-risk primary prevention population.

Clinical Trial Registration Number: NCT01730534
Supported by: AstraZeneca
Disclosure: A. Cahn: None.
562
The add-on effect of SGLT2 inhibitor or thiazolidinedione in patients with type 2 diabetes inadequately controlled with triple oral antidiabetics
H. Kim1, Y.-E. Kim1, S. Lee1, J. Bae1, M. Lee1, J. Huh2, B.-W. Lee1;
1Internal Medicine, Yonsei University College of Medicine, Seoul, 2Internal Medicine, Yonsei University Wonju College of medicine, Seoul, Republic of Korea.
Background and aims: Majority of patients with longstanding type 2 diabetes (T2D) need to intensify the combination therapy of oral antidiabetic agents (OADs) over time. Nevertheless, large proportion of patients with T2D cannot achieve or maintain their target glycemic goals using triple combination OADs. The current study aimed to evaluate the effectiveness of SGLT2i (sodium glucose cotransporter 2 inhibitor)- or TZD (thiazolidinedione)-based quadruple therapy in patients with inadequately controlled type 2 diabetes with triple OADs.
Materials and methods: In this prospective, open-label, multicenter 24-week clinical trial, we randomly assigned 58 patients with type 2 diabetes into two groups of receiving SGLT2i or TZD who failed to achieve glycemic control (7%< HbA1c ≤ 10%) with conventional triple OADs including metformin, sulfonylurea and dipeptidyl peptidase-4 inhibitor. The primary end point was mean change of HbA1c between two groups from baseline to 24th week.
Results: In total, 58 patients were enrolled with SGLT2i (n = 29) and TZD (n = 29), respectively. The mean age of study subjects was 62.3 years and the mean duration of T2D was 14.3 years. After 24 weeks, both groups demonstrated significant reductions in HbA1c (-1.08 ± 0.83 % in the SGLT2i group and -0.58 ± 0.91 % in the TZD group), and the reductions were greater in the SGLT2i group (p = 0.036). In addition, SGLT2i group revealed a significant body weight reduction compared with the TZD group (p < 0.01). Safety profiles were similar in both groups.
Conclusion: The present study demonstrates that SGLT2i or TZD could be a valid option as a fourth OAD for treatment of patients with T2D inadequately controlled with triple OADs and not accepting injectable therapies.
Clinical Trial Registration Number: 4-2019-0393
Supported by: Yuhan Corporation
Disclosure: H. Kim: None.
563
Comparison of SGLT2 inhibitor and GLP-1 receptor agonist as addition metformin or metformin plus sulfonylurea: systematic review with indirect comparison meta-analysis
C. Jung1, Y. Cho2, J. Lee1, H. Kim1, J. Kang2, C.-Y. Park3, J.-Y. Park1, W. Lee1;
1Internal Medicine, Asan Medical Center, Seoul, 2Internal Medicine, Hallym University Sacred Heart Hospital, Anyang, 3Internal Medicine, Kangbuk Samsung Hospital, Seoul, Republic of Korea.
Background and aims: The aim of the present study was to quantitate the hypoglycaemic and weight-reducing effects of sodium glucose cotransporter 2 inhibitors (SGLT2i) and glucagon like peptide-1 receptor agonists (GLP-1 RA) as add-on treatments to metformin (MET) or MET plus sulfonylurea (SU) in patients with type 2 diabetes mellitus (T2DM).
Materials and methods: We searched PubMed, EMBASE, and the Cochrane Central Register of Controlled Trials and ClinicalTrials.gov through August 2019. Randomized controlled trials published in English that compared SGLT2i or GLP-1 RA with placebo addition to MET or MET plus SU in type 2 diabetes mellitus patients were included. We compared the efficacy in reducing HbA1c and body weight between SGLT2i add-on and GLP-1 RA add-on indirectly.
Results: A total of 20 randomized controlled trials comparing 9,944 participants were included (12 SGLT2i and 8 GLP-1 RA studies). Meta-analysis showed that both the SGLT2i add-on group (weighted mean difference [WMD] -0.53%, 95% confidence interval [CI]: -0.60 to -0.45%; P < 0.001) and GLP-1 RA add-on group (WMD -0.63%, 95% CI: -0.74 to -0.53%; P < 0.001) were associated with a greater reduction of HbA1c than the respective placebo group. The adjusted indirect comparison showed that SGLT2i add-on achieved similar reductions in HbA1c with GLP1 RA add-on (WMD 0.03%, 95% CI -0.13 to 0.19%; P = 0.696). With regard to body weight, both SGLT2i add-on and GLP-1 RA add-on groups demonstrated a greater body weight reduction (WMD -1.61kg, 95% CI: -1.80 to -0.42kg; and WMD -1.57%, 95% CI: -1.76 to -1.39kg, respectively) compared to the placebo group. SGLT2i add-on and GLP-1 RA add-on were also similarly effective in lowering body weight (WMD -0.22%, 95% CI -0.74 to 0.29%; P = 0.393).
Conclusion: Both SGLT2i and GLP-1 RA are feasible adjunctive agents to pre-existing MET or MET plus SU therapy in individuals with inadequately controlled T2DM.
Disclosure: C. Jung: None.
564
Effects of empagliflozin, diet, or both on physical activity and sedentary behaviour in people with type 2 diabetes: analyses from the SEESAW trial
J.A. Sargeant1,2, J.A. King3,2, E.L. Baldry1,2, D.H. Bodicoat4, C.L. Edwardson1,2, K. Khunti1,5, D.J. Stensel3,2, D.R. Webb1,2, J.P.H. Wilding6, T. Yates1,2, M.J. Davies1,2;
1Diabetes Research Centre, University of Leicester, Leicester, 2NIHR Leicester Biomedical Research Centre, Leicester, 3School of Sport, Exercise and Health Sciences, Loughborough University, Loughborough, 4Simplified Data, Leicester, 5NIHR Applied Research Collaboration East Midlands, Leicester, 6Institute of Ageing and Chronic Disease, University of Liverpool, Liverpool, UK.
Background and aims: Empagliflozin lowers glucose and body weight in people with type 2 diabetes (T2D) by promoting glucosuria. However, weight loss (WL) is less than predicted by modelling glucose excretion. We report exploratory analyses of changes in physical activity/sedentary behaviour after initiating empagliflozin, diet-induced WL (DIWL), or both, in people with T2D enrolled in a recent placebo-controlled trial.
Materials and methods: 68 adults with T2D (65% male; median (IQR) age 63 (57 - 69) y, BMI 31 (29 - 35) kg/m2, HbA1c 6.9 (6.5 - 7.1) %), were randomised (1:1:1:1) to placebo (PLA), empagliflozin 25mg/day (EMPA), placebo plus DIWL (DIET), or empagliflozin 25mg/day plus DIWL (EMPA+DIET) for 24 wk. DIET and EMPA+DIET were supported to lower energy intake by 1500kJ/day. Mean WL at 24 wk was 0.4, 2.2, 1.9 and 5.7 kg in each group, whilst HbA1c was reduced in EMPA and EMPA+DIET only (mean change ~0.4% in each). No compensatory changes in appetite or appetite-related hormones (trial primary research question) were apparent. Participants wore a hip-worn accelerometer for 7 d at 0, 6, 12 and 24 wk, to assess total ambulatory activity (steps/day), time spent sedentary, and time in light- (LIPA) and moderate to vigorous-intensity physical activity (MVPA). Generalised estimating equations (GEE) explored differences between groups across follow-up, with pairwise comparisons of each group vs PLA. Generalised linear models (GLM) compared each group vs PLA at 6, 12 and 24 wk. Models were adjusted for baseline, BMI, age and accelerometer wear time. Statistical significance was deemed p < 0.05.
Results: Valid accelerometer data were available for 68, 58, 62 and 58 individuals at 0, 6, 12 and 24 wk. Baseline activity/sedentary time were similar between groups (full cohort; steps 4965 (3867 - 7729) per day, sedentary time 582 (529 - 656) min/day, LIPA 267 (221 - 328) min/day, MVPA 18 (9 - 32) min/day). GEE modelling revealed a difference in daily steps between groups across follow-up (p = 0.046), with steps significantly lower in EMPA vs PLA (Table). GLM suggested that this was primarily driven by a reduction in steps at 6 wk. Sedentary time, LIPA and MVPA were unchanged.
Conclusion: Alongside improvements in glycaemic control and weight loss, we observed a reduction in overall physical activity volume, measured by daily steps, after initiation of empagliflozin in people with T2D. Whether reduced physical activity-related energy expenditure contributes to the less-than-modelled WL with empagliflozin warrants further investigation.

Clinical Trial Registration Number: NCT02798744
Supported by: Boehringer Ingelheim investigator-initiated grant and in-kind support from NIHR Leicester BRC
Disclosure: J.A. Sargeant: Grants; The study was funded by an investigator-initiated study grant from Boehringer Ingelheim.
565
Empagliflozin reduces the total burden of all-cause hospitalisations (ACH) and mortality in EMPA-REG OUTCOME
S.E. Inzucchi1, B. Zinman2, C. Wanner3, D. Fitchett4, S.D. Anker5, S. Pocock6, S. Kaspers7, J.T. George7, O.E. Johansen8, W. Jamal7, S. Hantel9, S.S. Lund7;
1Section of Endocrinology, Yale University School of Medicine, New Haven, USA, 2Lunenfeld-Tanenbaum Research Institute, Mount Sinai Hospital, University of Toronto, Toronto, Canada, 3Würzburg University Clinic, Würzburg, Germany, 4St Michael's Hospital, Division of Cardiology, University of Toronto, Toronto, Canada, 5Department of Cardiology (CVK); and Berlin Institute of Health Center for Regenerative Therapies (BCRT); German Centre for Cardiovascular Research (DZHK) partner site Berlin; Charité – Universitätsmedizin Berlin, Berlin, Germany, 6Department of Medical Statistics, London School of Hygiene & Tropical Medicine, London, UK, 7Boehringer Ingelheim International GmbH, Ingelheim, Germany, 8Boehringer Ingelheim Norway KS, Asker, Norway, 9Boehringer Ingelheim Pharma GmbH & Co. KG, Biberach, Germany.
Background and aims: In EMPA-REG OUTCOME, empagliflozin (EMPA) reduced hospitalization for heart failure risk and cardiovascular (CV) mortality in patients (pts) with type 2 diabetes (T2D) and established atherosclerotic cardiovascular disease (ASCVD). We assessed the effect of EMPA on total (first and recurrent) events of ACH and all-cause mortality (ACM).
Materials and methods: Pts were randomized to EMPA 10 mg, EMPA 25 mg, or placebo (PBO). We assessed the effect of EMPA pooled vs PBO on total events of a composite of ACH or ACM using a negative binomial model.
Results: Among 7,020 pts (mean [SD] age 63 [9] years), there were 5,399 total events of ACH and ACM. The most frequent hospitalizations were cardiac disorders (1,339), infections and infestations (841), and nervous system disorders (511); ACM: n=463. EMPA reduced the risk of total events of ACH or ACM by 19% vs PBO (event rate ratio (95% CI): 0.81 (0.74, 0.89), p<0.0001) (Figure); ACH alone 0.83 (0.76, 0.91), ACM alone 0.69 (0.57, 0.83). Across most hospitalization categories, a numerically smaller proportion of pts experienced events with EMPA vs PBO. The estimated number of total ACH or ACM events prevented with EMPA was 793.3; number of pts needed to treat (NNT) over 3 years to prevent one event was 5.4 (3.8, 9.3).
Conclusion: EMPA reduced risk of the total burden of ACH and mortality in pts with T2D and ASCVD, with a clinically relevant number of events prevented and a low NNT.

Clinical Trial Registration Number: NCT01131676
Supported by: Boehringer Ingelheim & Eli Lilly and Company Diabetes Alliance
Disclosure: S.E. Inzucchi: Honorarium; Boehringer Ingelheim. Lecture/other fees; Boehringer Ingelheim.
566
Patient phenotypes and SGLT-2 inhibition in type 2 diabetes: insights from the EMPA-REG OUTCOME trial
A. Sharma1, A.P. Ofstad2, T. Ahmad3, B. Zinman4, I. Zwiener5, D. Fitchett6, C. Wanner7, J.T. George8, S. Hantel8, N. Desai3, R.J. Mentz9;
1McGill University Health Centre, Montreal, Canada, 2Boehringer Ingelheim Norway KS, Asker, Norway, 3Section of Cardiovascular Medicine, Yale University School of Medicine, New Haven, USA, 4Lunenfeld-Tanenbaum Research Institute, Mount Sinai Hospital, University of Toronto, Toronto, Canada, 5Boehringer Ingelheim Pharma GmbH & Co. KG, Ingelheim, Germany, 6St Michael's Hospital, Division of Cardiology, University of Toronto, Toronto, Canada, 7Würzburg University Clinic, Würzburg, Germany, 8Boehringer Ingelheim International GmbH, Ingelheim, Germany, 9Duke University School of Medicine, Durham, USA.
Background and aims: In EMPA-REG OUTCOME, empagliflozin reduced risk of cardiovascular (CV) death by 38% and hospitalization for heart failure (HHF) by 35% in patients with type 2 diabetes (T2D) and CV disease. We aimed to identify phenotypes of patients with different risk of outcomes and to explore treatment effects across these groups.
Materials and methods: Overall, 7020 patients were treated with empagliflozin 25 mg, 10 mg or placebo. For this post hoc analysis, patients were randomly separated into training (2/3) and validation sets (1/3 of patients). Latent class analysis identified 3 clusters using 6639 patients with complete data. The association of clusters to CV death and CV death/HHF, and treatment effect of empagliflozin versus placebo across clusters was explored by Cox regression.
Results: Cluster 1 included younger patients with shorter T2D duration. Cluster 2 included more women with non-coronary atherosclerotic disease (CAD), and Cluster 3 older patients with advanced CAD. In the training set, risk of CV death varied across clusters (Cluster 2 vs 1 HR 1.83 [95% CI 1.23, 2.71], Cluster 3 vs 1 HR 1.86 [1.30, 2.67]) with similar pattern for CV death/HHF. Treatment effect of empagliflozin was consistent across clusters (Figure). Results were replicated in the validation set.
Conclusion: We identified 3 phenotypes of patients with varying risk of outcomes. The consistent treatment effect across clusters reaffirms the robustness of CV death/HHF reduction with empagliflozin.

Clinical Trial Registration Number: NCT01131676
Supported by: Boehringer Ingelheim & Eli Lilly and Company Diabetes Alliance
Disclosure: A. Sharma: Other; Junior 1 clinician scientist program - Boehringer Ingelheim.
PS 44 Different aspects of SGLT-2 inhibitors
567
Acid-base changes during diabetic ketoacidosis in type 1 diabetes with/without SGLT2 inhibitor
I. Mursic1, E. Svehlikova1, W. Regittnig1, M. Urschitz1, M. Wolf1, M. Brunner2, T. Augustin3, C. Magnes3, A. Eberl3, T. Heise4, O. Klein4, H. Sourij5,1, T. Pieber1,3;
1Division of Endocrinology and Diabetology, Medical University of Graz, Graz, Austria, 2CF-Clinical Trials Unit, Center for Medical Research, Medical University of Graz, Graz, Austria, 3HEALTH – Institute of Biomedicine and Health Sciences, Joanneum Research, Graz, Austria, 4Profil, Neuss, Germany, 5CBmed - Center for Biomarker Research in Medicine, Graz, Austria.
Background and aims: To evaluate the effect of SGLT2 inhibitors (SGLT2i) on the development of diabetic ketoacidosis (DKA) during insulin depletion in type 1 diabetes mellitus (T1DM).
Materials and methods: Sixteen male, C-peptide negative T1DM subjects were enrolled in this open, randomized, crossover, bicentric trial with two 7-day treatment periods (with/without SGLT2i). At the end of each treatment period, insulin was withdrawn for a maximum of 12h, followed by recovery phase (12h). Participants had mean±SD age of 34.6±8.73 years, T1DM duration 19.1±10.5 years, and HbA1c 7.2±0.6 %.
Results: SGLT2i led to significantly lower plasma glucose (PG) values during insulin depletion (PGmax with/without SGLT2i: 174±40 (mean±SD) vs. 302±48 mg/dL; 95% CI for ratio: 0.51-0.60), but to higher beta-hydroxybutyrate (BHB) values (Figure) and a steeper BHB increase (delta BHB: 8.1±2.0 vs. 6.0±1.7 μmol/L/min; 95% CI for ratio: 1.22-1.49). pH, bicarbonate and base excess during insulin depletion were comparable. Baseline glucagon (7.8±2.5 vs. 5.0±1.6 pmol/L; 95% CI for ratio: 1.26-1.95) and FFA levels (0.65±0.27 vs. 0.43±0.31 mmol/L; 95% CI for ratio: 1.08-2.28) were higher with SGLT2i, but data indicate that after increase during insulin depletion comparable concentrations were reached for both.
Conclusion: SGLT2i keeps PG in near normal ranges during DKA development and recovery, potentially impeding DKA diagnosis. While SGLT2i leads to higher ketone levels, increased baseline glucagon and FFA, an effect on pH and acidosis was not demonstrated. Further tracer studies could contribute to better understand metabolic changes during DKA development.

Clinical Trial Registration Number: 2018-001193-17
Disclosure: I. Mursic: None.
568
Dapagliflozin induces kidney augmentation: potential mechanism for SGLT2 inhibitor induced nephroprotection
X. Wu1,2, Y. Zhang2, K. Thai2, L. Nghiem2, K.A. Connelly1,2, R.E. Gilbert1,2;
1University of Toronto, Toronto, 2St. Michael's Hospital, Toronto, Canada.
Background and aims: The kidney responds to an increase in workload by increasing its mass. This physiological adaptation is seen following kidney donation. In this setting a combination of early tubular cell hyperplasia and subsequent hypertrophy lead to an increase in kidney size so that GFR is reduced by only 25-30% rather than the expected 50%. Diabetes, on the other hand, also leads to kidney growth and glomerular hypertrophy but with a supranormal GFR that is viewed as maladaptive. The present study sought to investigate the effects of SGLT2 inhibition on kidney structure and function, hypothesizing that the changes might more closely resemble those of kidney donation rather than diabetes.
Materials and methods: 11-12 week male Sprague Dawley rats were randomised to receive either dapagliflozin (0.5mg/kg) or vehicle control by twice daily oral gavage for either 2 days, the predicted time of maximal hyperplasia or 6 weeks. Kidney weight was indexed to both body weight and tibial length, the latter to mitigate against the effects of SGLT2 inhibitor-induced weight loss. GFR was measured by FITC-inulin clearance indexed to body surface area. Glomerular volume was assessed using the Weibel Gomez method and cell proliferation was quantified by Ki67 immunostaining.
Results: When compared with vehicle-treated rats, the kidneys of those that had received dapagliflozin displayed a >2-fold increase in Ki67 labelled cell proliferation at Day 2 (2.11±0.08 versus 0.95±0.08, %, mean±SEM, p<0.001) that was no longer present at 6 weeks. After 6 weeks, animals that had received dapagliflozin had larger kidneys than vehicle-treated animals (5.19±0.25 versus 4.07±0.19, g) that was still evident when indexed to either body weight (7.40±0.33 versus 5.30±0.16, mg/g) or tibial length (111.53±5.21 versus 86.48±4.07, mg/mm), p<0.001 for all. GFR, indexed to either body weight or surface area, however, was similar in both groups, as were glomerular volumes.
Conclusion: The SGLT2 inhibitor, dapagliflozin, induces an early increase in cell proliferation, followed by later hypertrophy that together substantially augment kidney mass. Unlike the kidney growth that follows uninephrectomy or accompanies diabetes, there was no evidence of either glomerular enlargement or hyperfiltration. We speculate that this unique form of kidney tissue augmentation may bolster the kidney’s resistance to both chronic and acute injury.
Disclosure: X. Wu: Employment/Consultancy; Fibrocor. Grants; Fibrocor, AstraZeneca, Boehringer Ingelheim. Honorarium; AstraZeneca, Boehringer Ingelheim, Janssen. Lecture/other fees; AstraZeneca, Boehringer Ingelheim. Stock/Shareholding; Fibrocor, Occurx, Certa.
569
Effect of empagliflozin on cardiorenal outcomes and mortality across BMI categories: subgroup analysis of the EMPA-REG OUTCOME trial with a focus on Asian patients
Q. Ji1, L. Ji2, Y. Mu3, J. Zhao4, B. Zinman5, C. Wanner6, J.T. George7, I. Zwiener8, K. Ueki9, K. Yokote10, W. Ogawa11, O.E. Johansen12;
1Department of Endocrinology, Shaanxi Aerospace Hospital, Xi'an, China, 2Department of Endocrinology and Metabolism, Peking University People's Hospital, Beijing, China, 3Department of Endocrinology, Chinese PLA General Hospital, Beijing, China, 4Shandong Provincial Hospital, Shandong University, Jinan, China, 5Lunenfeld-Tanenbaum Research Institute, Mount Sinai Hospital, University of Toronto, Toronto, Canada, 6Department of Medicine, Wuerzburg University Clinic, Wuerzburg, Germany, 7Boehringer Ingelheim International GmbH, Ingelheim, Germany, 8Boehringer Ingelheim Pharma GmbH & Co KG, Ingelheim, Germany, 9Department of Molecular Diabetic Medicine, Diabetes Research Center, National Center for Global Health and Medicine, Tokyo, Japan, 10Department of Endocrinology, Hematology, and Gerontology, Chiba University Graduate School of Medicine, Chiba, Japan, 11Division of Diabetes and Endocrinology, Department of Internal Medicine, Kobe University Graduate School of Medicine, Kobe, Japan, 12Boehringer Ingelheim Norway KS, Asker, Norway.
Background and aims: Epidemiology studies show a J- or U-shaped relationship between body-mass index (BMI) and mortality where individuals at the lower end of the BMI distribution, as well as those who are overweight/obese, have increased risk of mortality. Although obesity characteristics differ between Caucasian and Asian populations, such a relationship is observed in both populations. We explored the association between differing BMI at baseline, according to World Health Organization categories (<25, 25 to <30, ≥30 kg/m2), and mortality and cardiorenal outcomes with empagliflozin (EMPA), a sodium-glucose co-transporter-2 inhibitor, in the EMPA-REG OUTCOME trial.
Materials and methods: In EMPA-REG OUTCOME, patients with type 2 diabetes (T2D) and prior cardiovascular (CV) disease were treated with EMPA or placebo (PBO) (median follow-up: 3.1 years). We used Cox regression to analyse post hoc the effects of EMPA vs PBO on all-cause mortality, the composite of CV death (excluding fatal stroke) or hospitalisation for heart failure (HHF), and incident or worsening nephropathy across baseline BMI categories (<25, 25 to <30, ≥30 kg/m2) overall and in patients of Asian race.
Results: Of the 7020 patients overall, 934 (13.3%) had BMI <25 kg/m2 and 3621 (51.6%) had BMI ≥30 kg/m2; a total of 1517 (21.6%) were of Asian race. EMPA reduced all-cause mortality, CV death/HHF, and incident/worsening nephropathy in patients across BMI categories, with benefits being consistent between those with BMI <25 kg/m2, 25 to <30 kg/m2 and ≥30 kg/m2. The cardiorenal protective effects of EMPA were similar in Asians (Figure).
Conclusion: This subgroup analysis of EMPA-REG OUTCOME, in which 934 patients had BMI <25 kg/m2 and 1517 were Asian, suggests that the beneficial cardiorenal effects of EMPA are not affected by BMI, either overall or in Asian patients specifically.

Clinical Trial Registration Number: NCT01131676
Supported by: Boehringer Ingelheim and Eli Lilly and Company Diabetes Alliance
Disclosure: Q. Ji: None.
570
Patient preferences for newer oral therapies in type 2 diabetes
G. Savarese1, A. Sharma2, C. Pang3, R. Wood3, J.T. George4, N. Soleymanlou5;
1Division of Cardiology, Department of Medicine, Karolinska Institute, Stockholm, Sweden, 2Division of Cardiology, McGill University, Montreal, Canada, 3dQ&A, The Diabetes Research Company, San Francisco, USA, 4Boehringer Ingelheim International GmbH, Ingelheim, Germany, 5Boehringer Ingelheim Canada Ltd/Ltée, Burlington, Canada.
Background and aims: ADA/EASD guidelines emphasise the importance of patient engagement in therapy decisions. Beyond glycaemic effects of type 2 diabetes (T2D) therapies, only SGLT2 inhibitors and GLP-1 receptor agonists have cardiovascular (CV) benefits. Key attributes of such therapies may influence their use/adoption. We evaluated patient preferences towards three oral T2D therapies using conjoint analysis.
Materials and methods: This analysis used an online survey, completed by 553 respondents with T2D in the US (mean age ±SD was 64±9; 55% had CV risk; 27% had CV disease), to present 7 hypothetical, blinded pair-wise drug profile comparison choices composed of different benefit-risk attributes and effect ranges (levels). Attributes/levels were derived from combinations of phase 3 trial data for empagliflozin 25mg (a SGLT2 inhibitor), oral semaglutide 14mg (a GLP-1 receptor agonist) and sitagliptin 100mg (a DPP-4 inhibitor). The predicted therapy preference outcomes and the relative importance of one attribute relative to another were calculated (in %).
Results: The preference outcome was highest for the profile matching empagliflozin, ranked first by 56% (z-test, p<0.05), versus 38% for sitagliptin and 6% for oral semaglutide. Results were overall consistent in subgroup analyses. Genital infection risk was the most important perceived attribute with a relative score of 19% (z-test, p<0.05). Second and similarly important were fasting requirements (15%), weight reduction (15%), risk of vomiting (14%) and CV benefit (12%). Next was risk of nausea (11%). Last were HbA1c reduction (8%) and ability to take medication with other drugs (6%). While blinded to drug name/dose, respondents were also asked to choose explicitly between drug profiles similar to empagliflozin (chosen by 41%), sitagliptin (31%), oral semaglutide (11%), and ‘none of the options’ (17%).
Conclusion: The drug profile comparable to empagliflozin was the preferred agent; however, CV benefit was not the top patient priority. A shared physician-patient decision model and increased patient education are needed to ensure optimal use of guideline directed therapies in T2D.
Supported by: Boehringer Ingelheim and Eli Lilly and Company Diabetes Alliance
Disclosure: G. Savarese: Employment/Consultancy; Dr Savarese is a fellow of the Cardiovascular Clinical Trialists Forum, which received an unrestricted grant from Boehringer Ingelheim. Grants; Boehringer Ingelheim.
571
Glucose kinetics during oral glucose challenge following administration of exenatide and dapagliflozin alone and in combination in type 2 diabetes
M. Alatrach1, C. Agyin1, J. Adams1, O. Lavrynenko1, N. Laichuthai2, E. Cersosimo1, C. Triplitt1, A. Gastaldelli1, M. Abdul-Ghani1, R. DeFronzo1;
1Medicine/Diabetes, UT Health San Antonio, San Antonio, USA, 2Division of Endocrinology and Metabolism, Department of Medicine, Faculty of Medicine, Excellence Center in Diabetes, Hormone, and Metabolism, Bangkok, Thailand.
Background and aims: To examine the effect of SGLT2i on endogenous glucose production (EGP), tissue glucose disappearance (Rd), and urinary glucose excretion (UGE) following glucose ingestion.
Materials and methods: : 28 type 2 diabetes [T2D] patients (Age= 51±2 y; BMI=31.2±0.7; A1C=7.9±0.2%) received 8-hour 3-3H-glucose infusion after an overnight fast. Previously shown, EGP suppression by dapagliflozin (DAPA) compared to placebo (PCB) (Δ=-0.02±0.02 vs -0.45±0.03, p<0.01 mg/kg.min) was impaired. On a separate day, subjects were randomized to receive 5-hour double-isotope (IV 3-[3H]-glucose and oral [14C]-glucose) OGTT (75-g) preceded by PCB, DAPA 10 mg, EXEN 5 μg, or DAPA+EXEN. Oral [RaO], EGP, Total &Tissue Rd, and UGE were calculated.
Results: During 0-300-min, RaO was 65 g in DAPA, 59 g in PCB, 46 g in EXEN, and 48 g in DAPA+EXEN. UGE was 31±4 g in DAPA and 30±4 g in DAPA+EXEN, but only 3±1 g in EXEN and 10±3 g in PCB (p<0.001 vs. DAPA & DAPA+EXEN).
Conclusion: : The post-OGTT rise in PG was significantly reduced after DAPA+EXEN vs. each drug alone. This resulted from lower oral glucose appearance with greater UGE. During the OGTT, EGP suppression with DAPA (Δ = -0.8±0.1 mg/kg.min) was less than with PCB, EXEN, and DAPA/EXEN (p<0.05-0.01), while EGP suppression with DAPA/EXEN was similar to PCB but required a higher rise in insulin (p<0.05). Tissue glucose clearance was unchanged by any therapy.

Clinical Trial Registration Number: NCT03331298
Supported by: NIH
Disclosure: M. Alatrach: None.
572
Empagliflozin facilitates sustained insulin dose reductions in patients with type 2 diabetes and cardiovascular disease: the EMPA-REG OUTCOME trial
M. Vaduganathan1, N. Sattar2, D. Fitchett3, A. Ofstad4, M. Brueckmann5,6, J.T. George5, S. Verma3, M. Mattheus7, C. Wanner8, S.E. Inzucchi9, B. Zinman10, J. Butler11;
1Brigham and Women’s Hospital, Harvard Medical School, Boston, USA, 2University of Glasgow, Glasgow, UK, 3St. Michael's Hospital, University of Toronto, Toronto, Canada, 4Boehringer Ingelheim KS, Asker, Norway, 5Boehringer Ingelheim International GmbH, Ingelheim, Germany, 6University of Heidelberg, Mannheim, Germany, 7Boehringer Ingelheim Pharma GmbH & Co KG, Ingelheim, Germany, 8University Hospital Würzburg, Würzburg, Germany, 9Yale University School of Medicine, Yale-New Haven Hospital, New Haven, USA, 10Mount Sinai Hospital, University of Toronto, Toronto, Canada, 11University of Mississippi, Jackson, USA.
Background and aims: Many patients with T2D require insulin therapy and reducing insulin requirements is attractive to both patients and practitioners. Limited data are available regarding the effects of SGLT-2 inhibitor initiation on background insulin doses.
Materials and methods: In EMPA-REG OUTCOME, 7,020 patients were treated with empagliflozin (EMPA) 10, 25mg, or placebo (PBO). This analysis focuses on the 3,387 (48%) patients treated with insulin at baseline. After the first 12 weeks, changes in background antihyperglycemic therapy were permitted. We assessed treatment effects of pooled EMPA arms vs. PBO on time to sustained total daily insulin dose reduction from baseline by 10%, 20%, and 30% for at least 2 consecutive study visits by Cox regression adjusting for baseline risk factors. Dose reductions were considered appropriate if they were accompanied by no subsequent change (defined as <0.2% increase) or a decrease in subsequent HbA1c.
Results: EMPA significantly increased the proportion of patients achieving sustained and appropriate (without increases in HbA1c) insulin dose reductions by >20% from baseline compared with PBO after accounting for key covariates (adj. HR 1.87 [95% CI: 1.39-2.51]; P<0.0001; Figure). Similarly, consistent benefits were observed when considering sustained insulin dose reductions of >10% from baseline in EMPA vs. PBO (14.0% vs. 7.5%; adj. HR 1.91 [95% CI: 1.50-2.43]; P<0.0001) or >30% from baseline (5.6% vs. 3.3%; adj. HR 1.68 [95% CI: 1.17-2.43]; P=0.0055).
Conclusion: Among insulin-treated patients with T2D and CVD, EMPA facilitates meaningful, sustained, and appropriate reductions in insulin requirements.

Clinical Trial Registration Number: NCT01131676
Supported by: Boehringer Ingelheim and Eli Lilly and Company Diabetes Alliance
Disclosure: M. Vaduganathan: None.
573
Effects of intensive exercise, combined with dapagliflozin on body composition in type 2 diabetes: a randomised controlled trial
R. Bouchi1,2, N. Sonoda3, J. Itoh3, Y. Ono4, T. Fukuda2, T. Takeuchi2, J. Kishimoto3, T. Yamada2, Y. Ogawa3,2;
1National Center for Global Health and Medicine, Tokyo, 2Tokyo Medical and Dental University, Tokyo, 3Kyushu University, Fukuoka, 4Takagi Hospital, Fukuoka, Japan.
Background and aims: Sodium-glucose cotransporter (SGLT)2 inhibitors can reduce body fat including visceral and hepatic fat accumulation. In contrast, it is also reported that non-fat mass is reduced by these drugs. As SGLT2 inhibitors can substantially reduce the risk of heart failure in elderly patients with type 2 diabetes who are at an extremely high risk of sarcopenia/frailty, strategies to preserve muscle mass and function are to be established when using SGLT2 inhibitors. This study was aimed to investigate whether intensive exercise including resistance training, combined with a SGLT2 inhibitor can reduce the risk of reduction in muscle mass in type 2 diabetes.
Materials and methods: This study is a 24-week multicenter, open-label, parallel-group, randomized controlled trial in patients with type 2 diabetes. Patients were randomly assigned to either dapagliflozin (DAPA) 5 mg daily with intensive exercise therapy including resistance training (IT) or DAPA 5 mg daily with usual care (CT). Patients were allowed to increase DAPA up to 10 mg if HbA1c was more than 7.0%. Patients in IT were encouraged to walk 8,000 or more steps daily with physical exercise of 3.0 metabolic equivalents (Mets) or more for 30 min or longer per day. In addition, they underwent supervised resistance training (6 items) in three sets of 10 repetitions daily. The training was practicable without any assistance of trained person. Patients in CT were encouraged to walk 6,000 or more steps daily. The total and regional fat mass and fat-free mass were measured using whole-body DXA. The primary outcome was the change in limb fat-free mass from baseline to 24 weeks. The group-difference was analyzed using ANCOVA adjusted for weight, age, and gender.
Results: 146 participants (mean age; 58±10 years old, 63% male) were enrolled and randomized (74 in IT and 72 in CT) and 131 completed the study. There were no significant differences in characteristics, anthropometric and laboratory data between the groups. Steps and activity time with 3.0 Mets or more (median) in IT and CT were 8747 and 6854 (p=0.006) and 20.9 and 15.6 min/day (p=0.038). The achievement rate of resistance training was 44.4% in the first 4 weeks and was gradually decreased to 23.6% in the last 4 weeks. At 24 weeks, weight was significantly reduced by -2.7 kg and -2.2 kg in IT and CT, respectively. HbA1c levels were also significantly reduce by -0.5% in both groups. Limb fat-free mass was not significantly reduced by DAPA (-0.3 ± 0.9 kg in IT and -0.2 ± 0.9 in CT) and the least square mean difference (95% CI, p value) was -0.2 (-0.4 - 0.1, p=0.249). In contrast, fat mass, especially abdominal fat mass was more decreased in patients in IT (-1.5 kg) than those in CT (-0.9 kg) (p=0.018). The achievement rate of resistance training was significantly correlated with the reduction of fat mass and was marginally correlated with the changes in HbA1c and high-sensitive CRP.
Conclusion: Administration of DAPA may not increase the risk for sarcopenia/frail and the addition of intensive exercise which is practicable without any assistance of trained person to DAPA can more reduce abdominal fat accumulation, presumably leading to the more improvement of hyperglycemia and chronic inflammation than DAPA alone in type 2 diabetes.
Clinical Trial Registration Number: jRCTs071180050
Supported by: AstraZeneca K.K. and Ono Pharmaceutical Co.
Disclosure: R. Bouchi: Grants; received research support from AstraZeneca outside of the submitted work.
574
Empagliflozin decreases fasting and postprandial hyperglycaemia in totally pancreatectomised patients: a randomised, double-blinded, placebo-controlled study
A. Lund1, M. Baekdal1,2, S.W. Nielsen1, C.P. Hansen3, J.H. Storkholm3, B. Hartmann4,5, J.J. Holst4,5, T. Vilsbøll1,6, F.K. Knop1,6;
1Center for Clinical Metabolic Research, Gentofte Hospital, Hellerup, 2Department of Clinical Medicine, University of Copenhagen, Copenhagen, 3Department of Surgery, Rigshospitalet, Copenhagen, 4Department of Biomedical Sciences, University of Copenhagen, Copenhagen, 5Novo Nordisk Foundation Center for Basic Metabolic Research, University of Copenhagen, Copenhagen, 6Steno Diabetes Center Copenhagen, Gentofte, Denmark.
Background and aims: Insulin remains the only glucose-lowering treatment modality recommended in totally pancreatectomised (PX) patients. We investigated the effects of the sodium glucose transporter 2 (SGLT2) inhibitor empagliflozin on fasting and postprandial glucose concentrations in PX patients and matched healthy controls (CTRLs).
Materials and methods: In a randomised, double-blinded, placebo-controlled crossover study, 10 PX patients (age 65.7±6.4 [mean±SD] years; BMI 23.8±4.3 kg/m2; HbA1c 63.3±2.8 mmol/l (10.1±0.4%) [mean±SEM]) and 10 CTRLs (age 65±7.8 years; BMI 24.3±3.5 kg/m2; HbA1c 35±1.3 mmol/l (6.0±0.9%)) underwent a 3-hour liquid mixed meal test (MMT) preceded by two doses of 25 mg empagliflozin (administered the night before and on the morning of the MMT) and placebo, respectively. Basal insulin was administered as usual in PX patients, but no bolus insulin was administered during study days.
Results: Compared to placebo, empagliflozin lowered fasting plasma glucose (4.3 [3.8;6.6] vs 8.1 [5.0;9.6] mmol/l (median [IQR]), p=0.001) and postprandial plasma glucose excursions as assessed by baseline-subtracted AUC (1090 [732;1231] vs [1192 1036;1411] min × mmol/l, p=0.004) in the PX patients (Figure). In CTRLs, empagliflozin lowered fasting plasma glucose compared to placebo (5.1 [5.0;5.3] vs 5.5 [5.3;5.9] mmol/l, p=0.02) but it did not affect postprandial glucose excursions significantly (Figure). Empagliflozin’s effects on fasting and postprandial plasma glucagon concentrations were similar to those of placebo in both groups. PX patients had lower fasting plasma glucagon concentrations (0.8 [0.1;2.1] vs 6.1 [3.7;7.6] mmol/l, p=0.01) but exhibited greater postprandial glucagon responses compared to CTRLs (276 [153;600] vs 25 [58;86] min × pmol/l, p=0.007).
Conclusion: Empagliflozin acutely and effectively decreases fasting plasma glucose and attenuates postprandial hyperglycaemia in PX patients.

Clinical Trial Registration Number: H-19000992
Disclosure: A. Lund: None.
575
Luseogliflozin protects pancreatic beta cells via improving mitochondrial metabolism
Y. Yamauchi1, A. Nakamura1, K. Takahashi1, S. Kawata1, K. Tsuchida1, K. Omori1, H. Nomoto1, H. Kameda1, K.Y. Cho1, T. Yokota2, T. Anzai2, H. Miyoshi1,3, Y. Terauchi4, T. Atsumi1;
1Department of Rheumatology, Endocrinology and Nephrology, Faculty of Medicine and Graduate School of Medicine, Hokkaido University, Sapporo, 2Department of Cardiovascular Medicine, Faculty of Medicine and Graduate School of Medicine, Hokkaido University, Sapporo, 3Division of Diabetes and Obesity, Faculty of Medicine and Graduate School of Medicine Hokkaido University, Sapporo, 4Department of Endocrinology and Metabolism, Graduate School of Medicine, Yokohama City University, Yokohama, Japan.
Background and aims: We previously showed a sodium glucose co-transporter 2 (SGLT2) inhibitor, luseogliflozin, maintained insulin secretion by increasing beta cell mass and improving beta cell function in db/db mice, but the mechanism has remained unclear. In this study, we investigated the mechanism of favorable effects of luseogliflozin on beta cells.
Materials and methods: Six-week-old db/db mice were fed to standard chow (Control group) or standard chow containing 0.01% luseogliflozin (Luseo group). After 4 weeks, the gene expressions in isolated islets were evaluated by DNA microarray and real-time PCR analyses. Metabolites extracted from the islets were subjected to capillary electrophoresis mass spectrometry. Mitochondrial respiratory capacity and reactive oxygen species (ROS) generation were measured by a respirometer and spectrofluorometer. Immunohistochemistry and electron microscopy were performed.
Results: Microarray analysis showed 934 genes were expressed more than 1.5-fold or less than 0.67-fold in Luseo islets vs Control islets (p < 0.05). Among them, 300 were upregulated but 634 downregulated. Pathway analyses showed significant changes in glycolysis and tricarboxylic acid (TCA) cycle. Real-time PCR analysis showed significantly increased gene expressions of solute carrier family 2 member 2 (Slc2a2) related to glucose uptake and pyruvate carboxylase (Pcx) related to glucose metabolism in the Luseo group. Gene expressions related to TCA cycle and the electron transport system in mitochondria were increased in the Luseo group. Gene expressions of Nkx6.1, Mafa, and Ccnd2 were also significantly increased in the Luseo group. In metabolome analysis, the concentrations of citric acid and aconitic acid, metabolites in the TCA cycle, were significantly higher in the Luseo group compared with the Control group (citric acid: 210.6 ± 34.1 nmol/g vs. 144.8 ± 36.3 nmol/g, p < 0.05; aconitic acid: 1.2 ± 0.6 nmol/g vs. 0.2 ± 0.1 nmol/g, p < 0.05). The Luseo group had lower mitochondrial respiratory capacity in complex I, but higher capacity in complex II compared with the Control group. The Luseo group had lower ROS generation compared with the Control group. Immunohistochemistry showed the mitochondrial network extended throughout beta cells in the Luseo group, while the network was disrupted in the Control group. The mitochondrial area in the Luseo group was significantly larger than that in the Control group (59.3 ± 8.5 μm2 vs. 41.8 ± 9.0 μm2, p < 0.01). Electron microscopy showed enlarged mitochondria in the Control group, while the mitochondrial size was normalized in the Luseo group.
Conclusion: Relief of glucotoxicity by luseogliflozin may reduce ROS generation and increase gene expression related to beta cell proliferation and maturation, including Nkx6.1. Elevated expressions of these genes represent to improve glucose uptake and metabolism, resulting in protection of beta cells.
Supported by: Taisho Pharma
Disclosure: Y. Yamauchi: Honorarium; Sanofi, Mitsubishi Tanabe Pharma, Daiichi Sankyo, Eli Lilly Japan, MSD, Novo Nordisk Pharma, Novartis Pharma, AstraZeneca, Takeda Pharmaceutical, Astellas, Kowa Pharmaceutical, Ono Pharmaceutical, Dainippon Sumitomo Pharma, Nippon Boehringer Ingelheim, Kissei Pharmaceutical, Taisho Pharmaceutical, Chugai Pharmaceutical, Otsuka Pharmaceutical.
576
Differential effects of SGLT2 inhibitors on mitochondrial oxidative phosphorylation, glucose uptake, cell energy level and metabolism in HepG2 cells and HUVECs
E. Zügner1, S. Hagvall2, C.S. Elmore2, H. Sourij3, P. Kotzbeck4, R. Esterline5, S. Moosmang2, H.-C. Yang2, C. Magnes1;
1Bioanalytics and Metabolomics, Joanneum Research, Graz, Austria, 2AstraZeneca, Göteborg, Sweden, 3Medical University Graz, Graz, Austria, 4Joanneum Research, Graz, Austria, 5AstraZeneca, Gaithersburg, USA.
Background and aims: The SGLT2 inhibitors (SGLT2i) canagliflozin (cana), dapagliflozin (dapa) and empagliflozin (empa) show differential effects, e.g. on mitochondrial oxidative phosphorylation (MOX) in various cell lines that do not express SGLT2. Whether these reported effects at therapeutic levels are mediated via SGLT2i on energy metabolism demand further investigations, especially regarding cell-type dependencies. We aimed to investigate the effects of the 4 FDA approved SGLT2i’s cana, dapa, ertugliflozin (ertu) and empa on MOX, glucose uptake and cell energy level in HepG2 cells and HUVECs. We further studied downstream effects of cana, dapa and ertu on cellular metabolism in HUVECs.
Materials and methods: All treatments were performed in culture media containing 2% FBS. Oxygen consumption rate (OCR) and extracellular acidification rate (ECAR) was done on SEAHORSE bioanalyzer with rotenone as control. Cellular glucose uptake (GU) was determined with 14C-deoxyglucose as tracer. ADP/ATP ratio was determined with Abcam ADP/ATP Ratio Assay Kit. Metabolomics of HUVECs was performed with LC-HighRes MS. Each SGLT2i was tested at 1X and 10X of maximal plasma concentrations using approved therapeutic doses.
Results: In HUVECs, cana inhibited OCR, ECAR and GU concentration-dependently. Ertu inhibited ECAR and GU at 39 and 85 μM (IC50 values). Dapa and empa (100 μM) showed less than 15% inhibition of OCR and ECAR and did not inhibit GU. Dapa did not affect the ADP/ATP ratio, but ertu showed weak, concentration-dependent effects. In HepG2 cells, cana (100 μM) inhibited OCR by 60%, while empa and ertu (both 100 μM) inhibited OCR by 20-30%. Cana and ertu evoked ECAR elevation in HepG2 cells but not in HUVECs. Cana elicited statistically significant, dose-dependent increase of ADP/ATP ratio in both cell types. Metabolomics indicated reduced glycolysis, elevated levels of glucogenic amino acids supplying the citric acid cycle and a trend towards enhanced beta-oxidation in cana-treated HUVECs. Further, AMP, ADP and other energy metabolites were increased in cana-treated cells compared to controls. Dapa and ertu treatment did not significantly influence glycolysis, citric acid cycle and beta-oxidation compared to controls. However, in comparison to cana and controls, cells treated with dapa and ertu exhibited trends towards downregulation of metabolites from purine/pyrimidine pathways.
Conclusion: Cana in contrast to ertu, empa and dapa showed distinct effects on the ADP/ATP ratio, ECAR and GU of HUVECs and HepG cells. ECAR elevation was observed for cana and ertu in HepG2 cells, but not in HUVECs. The response difference between HUVECs and HepG2 cells is likely due to a different set of glucose transporters in these cells. Cana-treatment triggers anaerobic respiration and beta-oxidation in HUVECs. HUVECs have depleted cellular energy state, which could mean that cana only affects the cellular metabolism and not the transcription for transport proteins.
Disclosure: E. Zügner: None.
PS 45 Basic aspects of incretin-based therapies
577
Dulaglutide improves kidney fibrosis biomarker levels in patients with type 2 diabetes and moderate-to-severe chronic kidney disease
K.R. Tuttle1, J.M. Wilson2, Y. Lin2, H.-R. Qian2, K. Kelly-Boruff2, F. Genovese3, M. Karsdal3, K.L. Duffin2, F.T. Botros2;
1Providence Health Care, Spokane, USA, 2Eli Lilly and Company, Indianapolis, USA, 3Nordic Bioscience, Herlev, Denmark.
Background and aims: The AWARD-7 clinical trial demonstrated that once-weekly dulaglutide slowed the decline in estimated glomerular filtration rate (eGFR) and decreased urine albumin/creatinine ratio compared to insulin glargine in patients with type 2 diabetes and moderate-to-severe chronic kidney disease (CKD). Lower levels of urinary C3M (a marker for type III collagen degradation) and increased levels of plasma PRO-C6 (a marker for type VI collagen formation) have been reported to correlate with CKD progression and lower eGFR.
Materials and methods: This exploratory analysis evaluated changes in urinary C3M and plasma PRO-C6 in response to treatment with dulaglutide 1.5 mg compared to insulin glargine in AWARD-7.
Results: At baseline, urinary C3M and serum PRO-C6 levels were comparable between the dulaglutide 1.5 mg and insulin glargine groups. At weeks 26 and 52 of treatment, urinary C3M levels were significantly higher and serum PRO-C6 levels were significantly lower in the dulaglutide 1.5 mg group compared with insulin glargine group, respectively (Table).
Conclusion: Dulaglutide was associated with decreased levels of biomarkers for type VI collagen formation and increased type III collagen degradation, suggesting a potential effect to reduce kidney fibrosis. These anti-fibrotic effects could be a potential mechanism for the beneficial effects observed with dulaglutide treatment on CKD in type 2 diabetes.

Clinical Trial Registration Number: NCT01621178
Disclosure: K.R. Tuttle: Employment/Consultancy; Eli Lilly and Company, Boehringer Ingelheim, AstraZeneca, Gilead, Goldfinch Bio, Novo Nordisk, Bayer.
578
In vivo PET imaging of the gastric inhibitory polypeptide receptor in pancreas
O. Eriksson1, I. Velikyan2, T. Haack3, M. Bossart3, A. Evers3, I. Laitinen3, O. Plettenburg3, G. Antoni2, L. Johansson1, S. Pierrou1, M. Wagner3;
1Antaros Medical AB, Mölndal, Sweden, 2Uppsala University, Uppsala, Sweden, 3Sanofi, Frankfurt, Germany.
Background and aims: The Gastric Inhibitory Polypeptide (GIP) is an incretin hormone released in response to nutrient intake, and stimulates insulin secretion from the beta cells via the GIP receptor (GIPR). Targeting of the GIPR is an emerging strategy in anti-diabetic drug development, often as part of bi- and tri-specific peptide agonists also engaging the GLP-1 receptor and the glucagon receptor. The aim of the study was to develop a Positron Emission Tomography (PET) radioligand for the GIPR, to enable assessment target distribution and drug target engagement in vivo.
Materials and methods: The GIPR selective peptide S02-GIP was conjugated to a chelator and radiolabeled by Gallium-68. The resulting PET tracer [68Ga]S02-GIP-T4 was evaluated for affinity, specificity and internalization to HEK293 cells overexpressing human GIPR (huGIPR). HuGLP1R HEK293 cells were used as negative control. In vivo biodistribution and dosimetry was evaluated in rats (n=16). The in vivo in pancreas GIPR targeting of [68Ga]S02-GIP-T4, as well as the occupancy of a drug candidate with GIPR activity, was assessed by dynamic PET/CT in non-human primates (NHP).
Results: [68Ga]S02-GIP-T4 bound to huGIPR with an affinity of Kd=0.87±0.11 nM (n=3). [68Ga]S02-GIP-T4 binding could be inhibited by co-incubation with either endogenous GIPR peptide (>80% inhibition) or unlabelled S02-GIP-T4 peptide (>90% inhibition), but not GLP-1 peptide (n=5). No binding of [68Ga]S02-GIP-T4 was seen in huGLP1R HEK293 cells. [68Ga]S02-GIP-T4 was stable in NHP plasma (>90% intact) and exhibited rapid clearance from most tissues in NHP. Excretion occurred both via the liver and kidney. Pancreatic binding could be dose dependently inhibited (>75% decreased) by co-injection of unlabelled [68Ga]S02-GIP-T4 (n=5). Subcutaneous pre-treatment with a high dose (50μg/kg) of a drug candidate with GIPR activity incurred a decreased pancreatic binding of [68Ga]S02-GIP-T4 corresponding to a GIPR drug occupancy of 88.7±7.9% (n=3). [68Ga]S02-GIP-T4 demonstrated a safe dosimetric profile in both rat and NHP, allowing for repeated studies in humans.
Conclusion: [68Ga]S02-GIP-T4 is a potential novel PET biomarker for safe, non-invasive, and quantitative assessment of GIPR target distribution and drug occupancy.
Supported by: The study was sponsored by Sanofi.
Disclosure: O. Eriksson: Employment/Consultancy; Antaros Medical AB.
579
Role of endogenous glucagon-like peptide-1 in the serum triglyceride response to intraduodenal fat infusion in type 2 diabetic patients on vildagliptin
T. Wu1,2, C. Xie1, X. Wang1,2, M.J. Bound1, J. Grivell1, K.L. Jones1, M. Horowitz1, T.J. Little1, C.K. Rayner1;
1University of Adelaide, Adelaide, Australia, 2Southeast University, Nanjing, China.
Background and aims: Although glucagon-like peptide-1 (GLP-1) receptor agonists and dipeptidyl peptidase-4 (DPP-4) inhibitors have been shown to improve hyperlipidaemia in patients with type 2 diabetes (T2DM), the effect of GLP-1-signalling on lipid metabolism has not been well defined. We evaluated the effect of GLP-1 signalling on the serum triglyceride response to an intraduodenal fat infusion in T2DM patients treated with vildagliptin, using a GLP-1 receptor antagonist, exendin(9-39).
Materials and methods: Fifteen patients with T2DM, who were relatively well managed by diet and/or metformin T2DM (10 male and 5 female, mean age 68.8 ± 2.2 years, BMI 30.2 ± 1.3 kg/m2, HbA1c 6.7 ± 0.2%, and duration of known diabetes 6.6 ± 1.5 years)were studied on three occasions (twice with vildagliptin and once with placebo) in a double-blind, randomised, crossover fashion. On each day, vildagliptin (50 mg) or placebo was given orally, followed by intravenous exendin(9-39) (600 pmol/kg/min, on one of the two vildagliptin treatment days) or 0.9% saline over 210 min (t = -60-150 min). Between 0-120 min, a fat emulsion was infused intraduodenally at 2 kcal/min, followed by a standardised mixed meal (t = 150-180 min). Serum triglycerides were evaluated at frequent intervals from t = -60-180 min).
Results: Serum triglyceride levels increased on all three days following intraduodenal fat and the meal (all P < 0.05). On the two intravenous saline days, serum triglycerides did not differ between vildagliptin and placebo. On the two vildagliptin days, serum triglycerides were higher during intravenous exendin(9-39) vs. saline (P < 0.001).
Conclusion: In T2DM patients on vildagliptin, blockade of GLP-1 signalling by exendin(9-39) markedly augmented the serum triglyceride response to intraduodenal fat infusion and a mixed meal, although a single dose of vildagliptin had little on serum triglycerides. These observations support a major role of endogenous GLP-1 in the regulation of postprandial lipid metabolism.

Clinical Trial Registration Number: ACTRN12614001117606
Supported by: Novartis
Disclosure: T. Wu: Employment/Consultancy; The Hospital Research Foundation Mid Career Fellowships. Grants; Novartis investigator-initiated project grant.
580
The GLP-1 receptor agonist GL0034 activates central regions controlling glucose homeostasis and feeding behaviour
A. Picard1, D. Tarussio1, R. Thennati2, V. Burade2, B. Thorens1;
1Center for Integartive Genomics, University of Lausanne, Lausanne, Switzerland, 2Sun Phamarceutical Industries Limited, Vadadora, Gujarat, India.
Background and aims: GL0034 is a novel glucagon-like peptide-1 receptor (GLP-1R) agonist showing glucose-lowering effects with increased and C-peptide levels, reduced plasma glucagon levels, long-term reduction in HbA1C, and reduced body weight when tested in type 2 diabetic mice. At equivalent doses, these effects were significantly higher than those obtained with other GLP-1R agonists used clinically. We evaluated whether GL0034 administration activated brain regions involved in the control of energy homeostasis, which could explain the beneficial effects of this agonist.
Materials and methods: C57BL/6 mice received SC injections of saline, GL0034 (12 or 24 nmol/kg), or semaglutide (12 or 24 nmol/kg). The mice were euthanized 2 hours after dosing and their brains were fixed with paraformaldehyde. Cryosections were prepared from the entire brain; c-fos expression was assessed by immunohistochemistry.
Results: We observedinduction of c-fos expression in response to GL0034 SC injections in the area postrema and the nucleus tractus solitarius of the dorsal vagal complex and in the parabrachial nucleus and locus coeruleus. Lower levels of c-fos expression were detected in the central amygdala, subfornical organ, vascular organ of the lamina terminalis, and ventromedial preoptic nucleus. No significant staining could be observed in the hypohalamus, including the arcuate nucleus and the dorsomedial hypothalamus. These results were qualitatively comparable after GL0034 and semaglutide SC injections.
Conclusion: These results indicate that SC injection of GL0034 activates several central brain regions, which control energy homeostasis through regulation of autonomic nervous activity and feeding behaviour, potentially impacting food preference and motivated feeding behaviour.These central effects may combine with the direct stimulation of pancreatic beta cells and insuli secretion by GL0034 to ensure efficient control of glucose homeostasis.
Disclosure: A. Picard: None.
581
Liraglutide in combination with metformin improves insulin processing machinery during first phase insulin secretion: a randomised trial
C. Anholm1, P. Kumarathurai2, M.G.J. Skytte3, O.W. Nielsen4, O.P. Kristiansen5, P. Barker6, K. Burling6, M. Fenger7, S. Madsbad8, A. Sajadieh5, S.B. Haugaard3;
1Dept. of Internal Medicine, Copenhagen University Hospital (CUH) Amager-Hvidovre, Glostrup, Denmark, 2Dept. of Cardiology, CUH, Bispebjerg (BBH), Copenhagen (CPH), Denmark, 3Dept. of Endocrinology, CUH BBH, CPH, Denmark, 4Dept of Cardiology, CUH BBH, CPH, Denmark, 5Dept. of Cardiology, CUH BBH, CPH, Denmark, 6Core Biochemical Assay Laboratory, Cambridge University Hospitals, Cambridge, UK, 7Dept. of Clinical Biochemistry, CUH Amager-Hvidovre, Hvidovre, Denmark, 8Department of Endocrinology, CUH Amager-Hvidovre, Hvidovre, Denmark.
Background and aims: Insulin hypersecretion associates to obesity and type 2 diabetes (T2DM). Increased secretion of intact and 32-33 split proinsulin is a risk marker for the development of T2DM and coronary artery disease (CAD). The glucagon-like peptide-1 receptor agonist liraglutide increases insulin secretion but the effect on insulin processing including analyses on both intact and split proinsulin has not been done. We investigated the effect of liraglutide combined with metformin on secretion of intact and 32-33 split proinsulin in patients with established CAD and newly diagnosed well-controlled T2DM on metformin treatment.
Materials and methods: A randomized, double-blind, placebo-controlled, cross-over trial in 12 + 12-weeks periods with ≥2-weeks wash-out before and between intervention periods. Intervention: liraglutide/metformin vs. placebo/metformin. Biochemical analysis was done at the beginning and end of each 12-weeks periods. We report data from the first phase insulin and C-peptide secretion during an intravenous glucose tolerance test. Insulin, C-peptide, glucose, 32-33 split and intact proinsulin were measured at time: 0,2,4,6 and 10 min. Ratio of AUC split+intact-proinsulin to insulin or to C-peptide was normalized by logarithm to obtain normality.
Results: Of 41 patients randomized data from 31 patients were available for paired analysis. First phase AUC-insulin was increased 3-fold (P = 0.0001) and AUC-C-peptide almost 2-fold (P=0.0001) during liraglutide and metformin treatment leaving significant difference between treatments (P =<0.001) for both insulin and C-peptide. There was no difference between AUC-glucose during first phase between the treatments (P = 0.6). AUC-intact proinsulin was borderline significantly reduced by liraglutide and metformin (P = 0.05), whereas change in AUC-32-33-split proinsulin showed a trend for reduction (P = 0.09). AUC-intact+32-33split proinsulin was significantly reduced by liraglutide and metformin (P < 0.02), the change in the placebo period showed a trend (P = 0.06) with no difference between treatments (P = 0.7). The ratio of AUC-intact + split proinsulin to AUC-insulin was markedly reduced during liraglutide and metformin therapy from 19 (16) % to 4.6 (3.3) % (P < 0.0001), and highly significant (P < 0.001) between treatments. The ratio of AUC-intact + split proinsulin to AUC-C-peptide was significantly reduced during liraglutide metformin therapy (P<0.0001) but not significantly more than during placebo and metformin therapy (P=0.14).
Conclusion: In patients with CAD and newly diagnosed T2DM liraglutide in combination with metformin improved beta-cell insulin processing machinery with relatively reduced proinsulin secretion during first phase insulin secretion following intravenous glucose stimulation.
Clinical Trial Registration Number: https://clinicaltrials.gov/ NCT01595789
Supported by: NN investigator initiated studies
Disclosure: C. Anholm: Grants; Novo Nordisk.
582
A novel long-acting GLP-1 agonist (GL0034) demonstrates remarkable efficacy on HbA 1c , weight loss and triglycerides in a model of type 2 diabetes, the db/db mouse
R. Thennati1, V. Burade1, T. Vilsbøll2, B. Thorens3, G.A. Rutter4;
1Sun Pharmaceutical Industries Limited, Vadodara, India, 2Steno Diabetes Center Copenhagen, University of Copenhagen, Denmark, 3Centre for Integrative Genomics, Lausanne, Switzerland, 4Section of Cell Biology and Functional Genomics, Division of Diabetes, Endocrinology and Metabolism, Department of Metabolism, Digestion, Reproduction, Imperial College London, London, UK.
Background and aims: GL0034 is a novel long-acting human glucagon-like peptide-1 (GLP-1) receptor agonist, which selectively activates GLP-1 receptor. GL0034 was evaluated in db/db mouse model for its anti-diabetic potentials.
Materials and methods: GL0034, a synthetic peptide, was evaluated for functional assay on GLP-1 receptor expressing cells. Effect on HbA1c, body weight change, triglyceride and glucagon was studied in type 2 diabetes model of db/db mouse.
Results: Glucagon-like peptide-1 receptor agonists (GLP-1RA) provide substantial reductions in HbA1c and significant body weight loss in patients with type 2 diabetes (T2D). GL0034 is a novel long-acting, human GLP-1RA. In cellular cAMP assays GL0034 has a half-maximal effective concentration of 80 pM on GLP-1R expressing cells, but no effect on cells expressing the GIPR or the glucagon receptor. Upon SC dosing in the db/db mouse (T2D-model) every other day for 4 weeks, GL0034 doses of 1.5, 3 and 6 nmol/kg lowered HbA1c by 1.6%, 3.2% and 3.4%, respectively; demonstrating greater activity than that achieved with a higher dose of semaglutide (2.8%) or dulaglutide (2.0%) (Table). At 6 nmol/kg dose, GL0034 also induced a significant decrease in body weight and further plasma triglycerides and glucagon were significantly reduced by ~74% and ~41%, respectively. These effects of GL0034 treatment were greater than those induced by semaglutide or dulaglutide.
Conclusion: Together, our study demonstrates that GL0034 is a potent, selective, long-acting GLP-1RA, which displays improved control of glucose homeostasis, body weight, and dyslipidemia in a diabetic mice as compared with GLP-1RAs used for the treatment of T2D. GL0034 may serve as a promising new GLP-1RA for T2D and obese patients with T2D.

Disclosure: R. Thennati: None.
583
Association between fasting serum glucose-dependent insulinotropic polypeptide and carbohydrate antigen 19-9 in type 2 diabetes
L. Huang, H. Huang;
Division of Endocrinology and Metabolic Diseases, Second Affiliated Hospital of Fujian Medical University, Quanzhou, Fujian, China.
Background and aims: Type 2 diabetes mellitus(T2DM) and pancreatic cancer(PC) have a bidirectional and complex relationship. T2DM may be an early manifestation of the PC, and long-standing T2DM is a risk factor for PC. In T2DM patients, fasting serum glucose-dependent insulinotropic polypeptide(GIP) levels are significantly higher than non-diabetic subjects. In addition to stimulating secretion of insulin, glucagon-like peptide-1 and glucagon, GIP has been ascribed an important role in growth and antiapoptotic factor for β cells. Carbohydrate antigen 19-9(CA19-9) is a biomarker of damaged pancreatic β cell function, which is also associated with insulin resistance, glycemic control state and complications in T2DM. Considering the backgroud mentioned above, it is reasonable to speculate that there is an association between GIP and CA19-9. However, no reports have described the interrelation ship of GIP and CA19-9 so far. Therefore, we conducted this study to investigate the relationship among fasting serum GIP, CA19-9 and other clinical parameters in T2DM.
Materials and methods: A cross-sectional study was performed in 272 T2DM patients without malignant diseases in our endocrine ward in order to investigate the relationship among fasting serum GIP, CA19-9 and other clinical parameters using t-test, correlation and multiple stepwise regression analysis.
Results: Among the 272 T2DM patients without malignant diseases, the median fasting serum GIP levels were 421.00pg/ml, which interquartile range were respectively 322.90~567.78pg/ml. Serum CA19-9 levels were higher in high-levels of GIP compared with those in low-levels of GIP(17.56U/ml versus 14.85U/ml, P=0.049). Correlation analysis showed that fasting serum GIP was positively correlated with CA19-9(r=0.125, P=0.039) and TBIL(r=0.145, P=0.016). The correlation between fasting serum GIP and CA19-9 was also significant in both obese population(BMI≥24.00kg/m2)(r=0.171, P=0.034) and well glycemic control(Hb1Ac<8.00%) (r=0.213, P=0.047). Multiple stepwise regression analysis showed that CA19-9 and TBIL were independently associated with fasting serum GIP levels(CA19-9:β=0.121, 95%CI:0.003~0.239, P=0.044 and TBIL:β=0.142, 95%CI:0.024~0.260, P=0.018) even when adjusted for age, gender, duration, BMI, HbA1c, FPG, DBIL, IBIL, TC, TG and UA.
Conclusion: Based on the results obtained in the present study, we conclude for the first time that CA19-9 is positively and independently associated with fasting serum GIP in T2DM patients without malignant diseases. The exact mechanism by which higher GIP levels are associated with CA19-9 remains unclear, the possible explanation may be related to pancreatic cellular dysfunction. Our findings indicate that elevated serum CA 19-9 levels in T2DM were risk factors for increased fasting serum GIP levels, GIP resistance should be vigilant when CA19-9 is elevated in T2DM patients. Additionally, we hypothesize that elevated levels of fasting serum GIP may be contribution to prediction of pancreatic malignancies, which needs further studies to determine.
Disclosure: L. Huang: None.
584
The effect of tirzepatide on gastric emptying (GE) delay in obese mice is abolished with chronic treatment, while the impact on body weight reduction is maintained
Z. Milicevic, S. Urva, L. O'Farrell, E. Beebe, A. Haupt, T. Coskun;
Diabetes and Complications, Eli Lilly and Company, Indianapolis, USA.
Background and aims: Glucagon-like peptide-1’s (GLP-1) effect on gastric emptying (GE) delay is a key determinant of the post-prandial glucose excursion following a meal. GE has also been linked to weight loss efficacy through suppression of food intake. It has been reported that a selective GLP-1 receptor agonist’s (GLP-1RA) effect on GE was transient in contrast to its long-lasting effect on body weight loss. In this study, we aimed to study the acute and chronic effects of tirzepatide, a dual GIP (glucose-dependent insulinotrophic polypeptide)/GLP-1RA, and a selective GLP-1RA semaglutide on GE and body weight.
Materials and methods: A long-acting GLP-1 receptor agonist (LA-GLP-1RA), semaglutide, a long-acting GIP receptor agonist (LA-GIPRA), and a long-acting GIP/GLP-1 receptor dual agonist, tirzepatide, were evaluated in diet-induced obese (DIO) C57/B6 male mice. In acute experiments, the compounds were administered subcutaneously (s.c.) 16 hours prior to an orally administered semi liquid meal. The GE delay was evaluated 2 hours after semi-liquid meal, as the percent food remaining in the stomach versus amount of food administered. After assessing the acute dose response effect of each peptide on gastric emptying delay, efficacious doses of tirzepatide or semaglutide on GE delay were selected and administered to DIO mice daily (QD) for 14 days. GE delay was measured at the end of 14-day chronic treatment.
Results: Tirzepatide or semaglutide resulted in a GE delay in a dose responsive manner in acute experiments. Maximum delay was noted at a dose of 10 nmol/kg. LA-GIPRA did not impact GE up to a dose of 3000 nmol/kg. The combination of ascending doses of LA-GIPRA with fixed dose of semaglutide (10 nmol/kg) had no effect on LA-GLP-1RA-induced GE delay. The acute inhibitory effect of semaglutide or tirzepatide on GE delay was abolished after 14-day chronic treatment. However, tirzepatide treatment still caused more weight loss (-27.1±1.8%) than semaglutide (-15.7±1.3%) at 10 nmol/kg dose compared to the vehicle group (-1.1±1.7%).
Conclusion: These data suggest that novel dual GIP and GLP-1RA, tirzepatide has acute (GE delay) and chronic (tachyphylaxis of GE) effects on GE similar to semaglutide in DIO mice. Tirzepatide caused more body weight reduction than semaglutide at the same dose level. The GE delay effect goes through tachyphylaxis and is not the key driver of body weight loss efficacy observed by semaglutide or tirzepatide.
Disclosure: Z. Milicevic: Employment/Consultancy; Eli Lilly and Company.
PS 46 Clinical outcome of incretin-based therapies
585
Effect of dulaglutide on kidney function-related outcomes in type 2 diabetes: post hoc analysis from the REWIND trial
J. Shaw1, F.T. Botros2, R.E. Malik2, C.M. Atisso2, H. Colhoun3, H. Gerstein4;
1Baker Heart and Diabetes Institue, Melbourne, Australia, 2Eli Lilly and Company, Indianapolis, USA, 3University of Edinburgh, Edinburgh, UK, 4Population Health Research Institute, Hamilton, Canada.
Background and aims: In participants with type 2 diabetes (T2D) in the REWIND trial, dulaglutide (DU) use for a median follow-up of 5.4 years was associated with a reduction in the composite renal outcome, defined as first occurrence of new macroalbuminuria, sustained decline in estimated glomerular filtration rate (eGFR) of ≥30%, or chronic renal replacement therapy. The objective of this post hoc analysis was to evaluate the effect of dulaglutide on renal outcomes related to kidney function that are typically used in renal outcomes studies, defined as the composite endpoint of sustained eGFR decline ≥40%, end-stage renal disease (ESRD), or all-cause death.
Materials and methods: Participants with T2D and cardiovascular (CV) disease or CV risk factors were randomised (1:1) to DU 1.5 mg once-weekly or placebo. This post hoc analysis used Cox proportional hazards modeling for time-to-first-event to determine the risk of renal outcomes. Two additional sensitivity analyses were conducted by replacing the “all-cause death” component initially with “CV or renal death” component, or “renal death only” component.
Results: At baseline, treatment groups had similar eGFR (mean±SD: DU=77.2±22.7; placebo=76.6±22.8). The incidence rate of the composite endpoints was significantly lower for the DU group compared with placebo with 17% risk reduction when including all-cause death, 18% risk reduction when including CV or renal death, and 28% risk reduction when only including renal death (Table). This effect was mainly driven by the significantly lower proportion of participants with sustained eGFR decline ≥40% in the dulaglutide group compared to placebo.
Conclusion: Treatment with dulaglutide 1.5 mg was associated with a 17% risk reduction in kidney function-related outcomes, suggesting potential delay in progression of diabetic kidney disease in patients with T2D and established CV and CV risk factors.

Clinical Trial Registration Number: NCT01394952
Disclosure: J. Shaw: Lecture/other fees; AstraZeneca, Sanofi, Novo Nordisk, MSD, Eli Lilly and Company, Abbott, Mylan, Boehringer Ingelheim.
586
Patient-reported outcomes in patients with type 2 diabetes treated with investigational dulaglutide doses added to metformin (AWARD-11)
D. Cox, Z. Yu, A. Bethel, K.S. Boye, R. Mody;
Eli Lilly and Company, Indianapolis, USA.
Background and aims: Dulaglutide (DU) is approved at doses of 0.75 and 1.5 mg for treatment of type 2 diabetes (T2D). The AWARD-11 trial showed that higher DU doses (3.0 mg and 4.5 mg) were superior to DU 1.5 mg dose at 36 weeks in reducing HbA1c levels as well as body weight (BW) with a safety profile consistent with currently approved doses of dulaglutide in patients with T2D inadequately controlled with metformin monotherapy. We evaluated patient-reported outcomes (PROs) measuring health status, self-perceptions impacted by BW, physical activity, and device experience in this study.
Materials and methods: Patients were randomized (1:1:1) to once weekly DU 1.5 mg (N=612), DU 3.0 mg (N=616), and DU 4.5 mg (N=614). The primary efficacy endpoint was defined at Week 36, with a total treatment period of 52 weeks. The following PRO measures were administered at baseline, 36 week, and 52 week: EQ-5D-5L included UK index and visual analog scale (EQ-5D-5L VAS), Impact of Weight on Self-Perceptions Questionnaire (IW-SP), and Ability to Perform Physical Activities of Daily Living (APPADL). The Diabetes Injection Device Experience Questionnaire (DID-EQ) was measured at week 12. Higher PRO scores indicate better outcomes. PRO analyses included patients while they were on-treatment and without initiation of rescue medication.
Results: The EQ-5D-5L UK index, EQ-5D-5L VAS, IW-SP, and APPADL scores improved significantly from baseline to the 36-week endpoint for all DU doses (p<0.05). The DU 3.0 mg and 4.5 mg groups significantly improved in their IW-SP score at week 36 as compared with DU 1.5 mg group (p<0.05). Mean scores on a 4-point scale for the three dulaglutide dose groups on the three DID-EQ global items ranged from 3.76 to 3.78 for overall satisfaction, 3.78 to 3.80 for ease-of-use, and from 3.74 to 3.77 for convenience. The DID-EQ device characteristics score showed high positive perception of the injection device used in the study with no significant difference between the three dulaglutide doses at week 12. Scores at the exploratory 52-week endpoint showed similar trends to those at 36 week, with numeric improvements in IW-SP and APPADL scores, and significantly greater improvements in the EQ-5D-5L UK index value for the DU 3.0 mg and 4.5 mg doses versus DU 1.5 mg at 52 week (p<0.05 for both).
Conclusion: The improvement in scores on the weight-related PROs suggest that the weight loss observed with the investigational DU doses are clinically relevant to the patients’ self-perceptions as well as physical functioning. The DID-EQ scores representing high satisfaction, ease-of-use, and confidence to use the injection device are important as these benefits may potentially translate to better treatment adherence and ultimately better outcomes.

Clinical Trial Registration Number: NCT03495102
Supported by: This study was sponsored by Eli Lilly and Company.
Disclosure: D. Cox: Stock/Shareholding; Employee and stockholder of Eli Lilly and Company.
587
Cardio protection with dulaglutide is not depending on baseline therapy with metformin: a subgroup analysis of the REWIND trial
G. Ferrannini1, H.C. Gerstein2, H.M. Colhoun3, G.R. Dagenais4, R. Diaz5, L. Dyal2, M. Lakshmanan6, L. Mellbin1, J. Probstfield7, M.C. Riddle8, J.E. Shaw9, L. Rydén1;
1Karolinska Institutet, Stockholm, Sweden, 2Population Health Research Institute, McMaster University and Hamilton Health Sciences, Hamilton, Canada, 3University of Edinburgh, Edinburgh, UK, 4Institut Universitaire de Cardiologie et Pneumologie, Université Laval, Québec City, Canada, 5ECLA, Estudios Clínicos Latinoamérica. Instituto Cardiovascular de Rosario, Rosario, Argentina, 6Eli Lilly and Company, Indianapolis, USA, 7Department of Medicine, University of Washington, Seattle, USA, 8Department of Medicine, Oregon Health & Science University, Portland, USA, 9Baker Heart and Diabetes Institute, Melbourne, Australia.
Background and aims: The 2019 ESC/EASD Guidelines for Diabetes, Prediabetes and Coronary Artery Disease introduced a paradigm shift in managing patients with type 2 diabetes (T2D) at high risk for or already established cardiovascular (CV) disease by recommending a glucagon-like peptide-1 receptor agonist (GLP-1 RA) as first-line glucose lowering therapy. This has been questioned since outcome trials of GLP-1 RA were conducted with metformin as background therapy. The aim of this report is to determine whether the effect of dulaglutide on CV events varies according to baseline metformin therapy. It was tested by a subgroup analysis of the Researching Cardiovascular Events with a Weekly Incretin in Diabetes (REWIND) trial.
Materials and methods: In REWIND, a multicentre, double-blind, placebo-controlled trial (n=9901; women: 46.3%, mean age 66.2 years), patients with T2D and either a previous CV event (31%) or high CV risk (69%) were randomised (1:1) to either sc. dulaglutide (1.5 mg/weekly) or placebo in addition to standard of care. The primary outcome was the first of a composite of non-fatal myocardial infarction or stroke or CV death. Secondary outcomes were a microvascular composite endpoint, all-cause death and heart failure. The effect of dulaglutide on outcomes in patients with and without baseline metformin was evaluated by a Cox regression hazard model with baseline metformin, dulaglutide assignment and their interaction as independent variables. Adjusted HR and 95% CI were estimated by a Cox regression model with additional adjustments for factors that differed at baseline between people on vs. not on baseline metformin selected by a backward regression model. A p<0.05 was considered significant.
Results: Patients without metformin at baseline (n=1864; 19%) were older, leaner and had a higher proportion of female participants, prior CV events, heart failure and renal disease than patients with metformin (n=8037; 81%). During a median follow-up of 5.4 years (IQR 5.1-5.9), the primary outcome occurred in 976 (12%) participants with baseline metformin and in 281 (15%) without metformin. There was no difference in the effect of dulaglutide on the primary outcome in the groups with vs. without metformin at baseline (HR 0.93 [CI 0.82-1.06] vs. 0.78 [CI 0.61-0.99]; p for interaction=0.16). The effect of dulaglutide on the secondary outcomes was also not modified by baseline metformin (all interaction p>0.1).
Conclusion: This exploratory analysis suggests that the cardioprotective effect of dulaglutide does not depend on baseline metformin therapy. This supports the recommendation of using agents with proven cardioprotective efficacy without metformin in patients with diabetes and additional cardiac risk factors.
Clinical Trial Registration Number: NCT01394952
Supported by: Eli Lilly and Company
Disclosure: G. Ferrannini: None.
588
Cardiovascular outcomes in patients with type 2 diabetes and reduced eGFR and albuminuria: a REWIND post hoc subgroup analysis
H. Colhoun1, R. Malik2, F. Botros2, C. Atisso2, H. Gerstein3;
1University of Edinburgh, Edinburgh, UK, 2Eli Lilly and Company, Indianapolis, USA, 3McMaster University, Hamilton, Canada.
Background and aims: Diabetic kidney disease affects up to 40% of people with diabetes and is associated with higher cardiovascular (CV) risk. REWIND was a multicentre, randomised, double-blind, placebo-controlled trial with a primary outcome of first occurrence of the composite endpoint of CV death, nonfatal myocardial infarction, or nonfatal stroke (Major Adverse Cardiovascular Event [MACE]-3). Dulaglutide treatment reduced the incidence of MACE-3 in patients with type 2 diabetes (T2D) with or without established CV disease. This REWIND post hoc subgroup analysis evaluated the effect of dulaglutide on MACE-3 in patients with an eGFR<60 and ≥60 mL/min/1.73m2 and patients with micro-/macro-albuminuria (UACR ≥30 mg/g) or normoalbuminuria (UACR <30 mg/g).
Materials and methods: Eligible patients were those ≥50 years old with T2D who had either a previous CV event or CV risk factors. Patients were randomised (1:1) to dulaglutide 1.5 mg or placebo, both in addition to standard of care. A Cox proportional hazards model with treatment, eGFR subgroup (<60 and ≥60 mL/min/1.73 m2), and treatment by eGFR subgroup interaction was used to analyze time to the first occurrence of MACE-3. These analyses were also conducted for albuminuria subgroups (micro-/macro-albuminuria or normoalbuminuria). Estimates of hazard ratios (HR) with 95% confidence intervals (CI) were calculated for each subgroup.
Results: At baseline, 2,199 of 9,901 patients (22.2%) had an eGFR <60 mL/min/1.73 m2, 2,676 (27.0%) had microalbuminuria, and 791 (8.0%) had macroalbuminuria. This post hoc subgroup analysis showed that the reduction in MACE-3 with dulaglutide treatment was of consistent magnitude and direction in patients with eGFR <60 and ≥60 mL/min/1.73 m2 (HR [95% CI]: 0.93 [0.76-1.13] and 0.86 [0.75-0.99], respectively; interaction p=0.545). Similarly, MACE-3 risk reduction was consistent in patients with micro-/macro-albuminuria or normoalbuminuria (HR [95% CI]: 0.84 [0.72-0.99] and 0.93 [0.79-1.10], respectively; interaction p=0.374).
Conclusion: Regardless of baseline eGFR or albuminuria status, dulaglutide reduces MACE-3 outcomes in patients with T2D and established CV disease or multiple CV risk factors.
Clinical Trial Registration Number: NCT01394952
Disclosure: H. Colhoun: Grants; AstraZeneca LP, Regeneron, Pfizer Inc, Novo Nordisk. Honorarium; Eli Lilly and Company, Novartis Pharmaceuticals, Regeneron, Sanofi-Aventis, Novo Nordisk. Lecture/other fees; Eli Lilly and Company, Novartis Pharmaceuticals, Regeneron, Sanofi-Aventis, Novo Nordisk. Stock/Shareholding; Roche Pharmaceuticals.
589
Efficacy of investigational dulaglutide doses overall and by baseline HbA1c and BMI: exploratory subgroup analyses of the AWARD-11 trial
E. Bonora1, J. Frias2, L. Nevarez Ruiz3, Z. Yu4, Z. Milicevic4, R. Malik4, A. Bethel4, D. Cox4;
1University of Verona, Verona, Italy, 2National Research Institute, Los Angeles, USA, 3Hospital Angeles, Chihuahua, Mexico, 4Eli Lilly and Company, Indianapolis, USA.
Background and aims: Dulaglutide (DU) is approved at doses of 0.75 and 1.5 mg for treatment of type 2 diabetes (T2D). The AWARD-11 trial assessed whether higher DU doses (3 mg and 4.5 mg) provide further improvements over the 1.5 mg dose in glucose and body weight (BW) control with an acceptable safety profile in patients (pts) with T2D inadequately controlled with metformin monotherapy. Exploratory prespecified subgroup analyses assessed the effect of DU on HbA1c and BW reduction by baseline HbA1c (<8.5% or ≥8.5%) and BMI (< or ≥ median [34.2 kg/m2]).
Materials and methods: 1,842 pts were randomised (1:1:1) to once-weekly DU 1.5 mg (n=612), DU 3 mg (n=616), and DU 4.5 mg (n=614). All pts initiated once-weekly DU 0.75 mg for 4 weeks (wks), followed by step-wise dose escalation every 4 wks to the randomised dose. The primary objective was to demonstrate superiority of DU 3 mg and/or 4.5 mg to DU 1.5 mg for HbA1c change from baseline at 36 wks. Secondary objectives (controlled for multiplicity) included change in BW and % of pts achieving HbA1c <7% at 36 wks. Analyses using data collected up to initiation of rescue medication or premature treatment discontinuation were defined as primary for all efficacy analyses.
Results: At baseline pts had a mean age of 57.1 yrs, HbA1c of 8.6%, and BW of 95.7 kg. At the 36-wk primary endpoint, both the DU 3 mg and 4.5 mg doses were superior to the DU 1.5 mg dose for HbA1c change (1.5 mg, -1.5%; 3 mg, -1.7% [p=0.003]; 4.5 mg, -1.9% [p<0.001]), % of patients achieving HbA1c <7% (1.5 mg, 57%; 3.0 mg, 65% [p=0.006]; 4.5 mg, 71% [p<0.001]) and BW (1.5 mg, -3.1 kg; 3 mg, -4.0 kg [p=0.001]; 4.5 mg, -4.7 kg [p<0.001]). Treatment group differences in HbA1c change favoured the higher doses vs the 1.5-mg dose in each HbA1c subgroup, with dose-related HbA1c improvements being larger in the higher baseline HbA1c subgroup (Figure, A). BW reduction was dose related in each baseline HbA1c subgroup but was larger among pts with lower baseline HbA1c (Figure, B). Treatment effects on HbA1c were similar between baseline BMI subgroups (Figure, C). Absolute BW reduction was larger across dose groups in the higher baseline BMI subgroup, but treatment group differences were similar between subgroups (Figure, D). Common adverse events were similar between HbA1c and BMI subgroups.
Conclusion: In pts with T2D and inadequate glycaemic control on metformin, escalation from DU 1.5 mg to DU 3 mg or DU 4.5 mg once-weekly provided clinically relevant, dose-related improvements in HbA1c and BW overall and in subgroups of baseline HbA1c and BMI. Consistent with results from other GLP-1 agonists, dose-related improvements in HbA1c were larger among pts with higher baseline HbA1c, whereas dose-related BW reduction was larger among pts with lower baseline HbA1c.

Clinical Trial Registration Number: NCT03495102
Disclosure: E. Bonora: Honorarium; Eli Lilly and Company.
590
Liraglutide and semaglutide reduce cardiovascular events in patients with type 2 diabetes and peripheral arterial disease
S. Verma1, S. Rasmussen2, H.A. Saevereid2, M. Sejersten Ripa2;
1St. Michael's Hospital and University of Toronto, Toronto, Canada, 2Novo Nordisk A/S, Søborg, Denmark.
Background and aims: The LEADER and SUSTAIN 6 cardiovascular (CV) outcomes trials demonstrated CV risk reduction for the human glucagon-like peptide-1 (GLP-1) analogues liraglutide and semaglutide in patients with type 2 diabetes (T2D) and high CV risk. This post hoc analysis evaluated effects of liraglutide and semaglutide on CV outcomes by peripheral arterial disease (PAD) at baseline.
Materials and methods: LEADER (median follow-up 3.8 years, N=9340) and SUSTAIN 6 (median follow-up 2.1 years, N=3297) randomised patients with T2D and high CV risk to liraglutide or semaglutide vs placebo, all in addition to standard of care. In both trials, the primary outcome was a composite of CV death, nonfatal myocardial infarction, or nonfatal stroke (major adverse CV event, MACE). The key secondary expanded outcome (expanded MACE) also included hospitalisation for unstable angina or heart failure, or revascularisation. We evaluated the efficacy of liraglutide and semaglutide by medical history of PAD at baseline using a Cox regression model adjusted for important CV risk factors.
Results: Overall, 12.5% (n=1167/9340) patients from LEADER and 13.7% (n=453/3297) from SUSTAIN 6 had PAD at baseline. Patients with a history of PAD had longer diabetes duration than those without. Other baseline characteristics were similar between subgroups by PAD history, and across treatment groups. In both trials, irrespective of treatment, a higher risk of MACE (LEADER: HR 1.35; 95% CI 1.17, 1.57; SUSTAIN 6: HR 1.31; 95% CI 0.93, 1.81) and expanded MACE (LEADER: HR 1.27; 95% CI 1.12, 1.44; SUSTAIN 6: HR 1.72; 95% CI 1.36, 2.15) was observed in patients with PAD at baseline vs those without. Liraglutide and semaglutide reduced CV risk vs placebo in those with and without PAD at baseline (Figure).
Conclusion: In patients with T2D, a history of PAD is associated with increased MACE risk. The GLP-1 analogues liraglutide and semaglutide lowered the risk of CV events in patients with and without PAD.

Clinical Trial Registration Number: LEADER (NCT01179048) and SUSTAIN 6 (NCT01720446)
Supported by: Novo Nordisk A/S
Disclosure: S. Verma: Non-financial support; Abstract supported by Novo Nordisk.
591
Interrelationship between hypoglycaemia and cardiovascular and mortality outcomes in the CAROLINA trial
N. Marx1, J. Rosenstock2,3, D.K. McGuire2, B. Zinman4, M.A. Espeland5, J.T. George6, M. Mattheus7, O.E. Johansen8, for the CAROLINA investigators;
1Department of Internal Medicine I, University Hospital Aachen, RWTH Aachen University, Aachen, Germany, 2Dallas Diabetes Research Center at Medical City, Dallas, USA, 3University of Texas Southwestern Medical Center, Dallas, USA, 4Lunenfeld-Tanenbaum Research Institute, Mount Sinai Hospital, University of Toronto, Toronto, Canada, 5Department of Biostatistics and Data Science, Wake Forest School of Medicine, Winston-Salem, USA, 6Boehringer Ingelheim International GmbH, Ingelheim, Germany, 7Boehringer Ingelheim Pharma GmbH & Co. KG, Ingelheim, Germany, 8Boehringer Ingelheim Norway KS, Asker, Norway.
Background and aims: Severe hypoglycaemia is associated with higher cardiovascular (CV) and mortality risk. The CAROLINA® trial evaluated the CV safety of linagliptin and glimepiride in 6033 subjects with relatively early type 2 diabetes (T2D) and elevated CV risk (mean age 64.0 years, HbA1c 7.2%, median T2D duration 6.3 years) and demonstrated non-inferiority for 3P-MACE and no difference for CV and mortality outcomes. However, a significant lower rate of hypoglycaemia was observed with linagliptin vs glimepiride regardless of severity classification. In this post hoc analysis, we assessed the association of hypoglycaemia with CV and mortality outcomes.
Materials and methods: The associations that severe hypoglycaemia (requiring assistance to administer carbohydrate, glucagon or other resuscitative actions) and/or documented hypoglycaemia (blood glucose <54 mg/dl) had with CV and mortality outcomes were assessed using Cox regression models.
Results: In 6014 participants, severe hypoglycaemia and documented hypoglycaemia occurred in 109/3014 (3.6%) and 537/3000 (17.9%) patients in the linagliptin and glimepiride groups, respectively (HR 0.19 [95% CI 0.15, 0.23]). Hypoglycaemia events preceded CV outcomes in 0.0-3.6% of all events with linagliptin and in 8.0-26.2% events with glimepiride, however when multivariably adjusted, occurrence of hypoglycaemia was only associated with higher rates for all-cause mortality (HR 1.49 [1.16, 1.92]), and non-CV mortality (HR 2.16 [1.57, 2.97]) (Fig A) but not CV death. The relative effect of linagliptin vs glimepiride on any CV or mortality outcome (Fig B) was not influenced by antecedent hypoglycaemia.
Conclusion: Preceding hypoglycaemia was associated with higher risk for all-cause and non-CV mortality, but not with any other outcomes in a relatively early T2D population at elevated CV risk.

Clinical Trial Registration Number: NCT01243424
Supported by: Boehringer Ingelheim & Eli Lilly and Company Diabetes Alliance
Disclosure: N. Marx: Grants; Boehringer Ingelheim. Honorarium; Boehringer Ingelheim, Lilly. Other; Boehringer Ingelheim.
592
Asian subpopulations may exhibit greater cardiovascular benefit from long-acting glucagon-like peptide I receptor agonists
W. Lee1, Y. Cho2, J. Lee1, H. Kim1, J. Kang2, C.-Y. Park3, J.-Y. Park1, C. Jung1;
1Internal Medicine, University of Ulsan College of Medicine, Seoul, 2Internal Medicine, Hallym University Sacred Heart Hospital College of Medicine, Seoul, 3Internal Medicine, Sungkyunkwan University School of Medicine, Seoul, Republic of Korea.
Background and aims: In 2019, we presented a meta-analysis of cardiovascular outcome trials (CVOTs) concerning long-acting glucagon-like peptide-1 receptor agonists (GLP-1RAs). After our report, three other CVOTs were published. We synthesized previous and recent CVOTs to examine the overall effect of long-acting GLP-1RAs on major adverse cardiovascular events (MACEs) and to confirm subpopulations exhibiting the greatest CV benefit.
Materials and methods: Six CVOTs were included: LEADER (liraglutide), SUSTAIN-6 (semaglutide), EXSCEL (exenatide once weekly), HARMONY (albiglutide), REWIND (dulaglutide) and PIONEER 6 (oral semaglutide). Overall effect estimates were calculated as relative risks (RRs) and 95% confidence intervals (CIs) using the random-effects model; subgroup analyses reported in the original studies were similarly analyzed.
Results: Overall, significant risk reductions in MACE and CV death were observed. Evaluation of patients on the basis of race showed trends of MACE risk reductions in subjects of White race (RR, 0.89; 95% CI, 0.82 to 0.96) and Asians (RR, 0.50; 95% CI, 0.29 to 0.86). Black race did not show the statistically significant CV benefit from long-acting GLP-1 RAs (RR, 0.95; 95% CI, 0.67 to 1.37). Although the test for racial difference showed no statistically significant difference (P=0.289), post hoc analysis using Tukey method revealed that Asians exhibited a significantly greater CV benefit compared with black subjects (P=0.042).
Conclusion: Long-acting GLP-1 RAs reduced risks of MACE and CV deaths in high-risk patients with type 2 diabetes mellitus. Our findings from synthesized data including recently published CVOTs support a particularly effective reduction in CV events with GLP-1 RA in Asian populations.
Disclosure: W. Lee: None.
PS 47 Glycaemic control and incretin-based therapies
593
Glycaemic and body weight responses to oral semaglutide in the PIONEER trial programme
L. Mellbin1, E. Christiansen2, C.L. Hertz2, M.A. Nielsen2, T. Vilsbøll3, V.C. Woo4, K.M. Dungan5;
1Department of Medicine, Solna, Karolinska Institutet, Stockholm, Sweden, 2Novo Nordisk A/S, Søborg, Denmark, 3Steno Diabetes Center Copenhagen, University of Copenhagen, Copenhagen, Denmark, 4Section of Endocrinology and Metabolism, University of Manitoba, Winnipeg, Canada, 5Division of Endocrinology, Diabetes and Metabolism, The Ohio State University, Columbus, USA.
Background and aims: The global PIONEER phase 3 programme investigated the efficacy and safety of the once‑daily glucagon-like peptide-1 analogue oral semaglutide. This post hoc analysis assessed the proportions of patients who responded to oral semaglutide vs comparators at the end of treatment in the PIONEER programme (week 26 [PIONEER 1 and 5], week 52 [PIONEER 2, 4 and 8] or week 78 [PIONEER 3]).
Materials and methods: Data were included from all patients who participated in the PIONEER 1-5 and 8 trials. In these PIONEER trials, patients with type 2 diabetes were randomised to once-daily oral semaglutide (3, 7 or 14 mg), or a comparator: placebo (PIONEER 1, 4, 5 and 8), empagliflozin 25 mg (PIONEER 2), sitagliptin 100 mg (PIONEER 3) or liraglutide 1.8 mg (PIONEER 4). Background treatment was diet and exercise (PIONEER 1), metformin (PIONEER 2), metformin ± sulphonylurea (PIONEER 3), metformin ± sodium-glucose cotransporter 2 inhibitor (PIONEER 4), metformin or sulphonylurea, or both, or insulin ± metformin (PIONEER 5), or insulin ± metformin (PIONEER 8). Treatment response was assessed as any reduction in HbA1c (%) and/or body weight (%), and whether a patient achieved a clinically relevant composite endpoint of HbA1c reduction ≥1% and body weight loss ≥5%, with oral semaglutide 14 mg vs comparators at study end. Data for the trial product estimand (on trial product without rescue medication) were analysed using a logistic regression model with treatment, strata (PIONEER 3-8), interaction strata (PIONEER 5 and 8), and region as categorical fixed effects and baseline value as covariate.
Results: Across trials, any reduction in HbA1c was observed in greater proportions of patients with oral semaglutide 14 mg (89-95%) than with placebo (51-64%), sitagliptin 100 mg (82%), empagliflozin 25 mg (86%) or liraglutide 1.8 mg (88%). A simultaneous reduction in both HbA1c and body weight was seen in 72-86% of patients treated with oral semaglutide 14 mg (Figure). The composite outcome of HbA1c reduction ≥1% and body weight loss ≥5% was achieved by 27-41% of patients with oral semaglutide 14 mg, 1-8% of patients with placebo, 11% with sitagliptin 100 mg, 18% with liraglutide 1.8 mg and 20% with empagliflozin 25 mg. Within each trial, the odds of achieving an HbA1c reduction of ≥1% and body weight loss of ≥5% with oral semaglutide 14 mg were significantly greater vs all comparators (p<0.0001).
Conclusion: These results demonstrate that oral semaglutide 14 mg was more effective vs comparators for providing any HbA1c reduction, or both an HbA1c reduction ≥1% and body weight loss ≥5%.

Clinical Trial Registration Number: NCT02906930, NCT02863328, NCT02607865, NCT02863419, NCT02827708, NCT03021187
Supported by: Novo Nordisk A/S
Disclosure: L. Mellbin: Employment/Consultancy; Novo Nordisk A/S. Honorarium; Novo Nordisk A/S. Lecture/other fees; Novo Nordisk A/S.
594
LIRA-PRIME: a randomised trial in primary care settings of liraglutide versus OAD for glycaemic control in patients with type 2 diabetes not in control on metformin
M. Zoghbi1, M.S. Kaltoft2, D. Kolhe3, J.K. Panda4, M. Sargin5, B. Wolthers2, J. Unger6;
1Middle East Institute of Health University Hospital, Jdeideh, Great Beirut, Lebanon, 2Novo Nordisk A/S, Søborg, Denmark, 3Novo Nordisk Service Centre India Private Ltd., Bangalore, India, 4Medicine, SCB Medical College, Cuttack, India, 5Faculty of Medicine, Istanbul Medeniyet University, Istanbul, Turkey, 6Unger Concierge Primary Care Medical Group, Ranch Cucamonga, USA.
Background and aims: Most patients with type 2 diabetes (T2D) are treated in primary care, but data to guide evidence-based, shared decision making in this setting are scarce. LIRA-PRIME was a randomised, open-label, active-controlled trial in a primary care setting, comparing efficacy and safety of liraglutide vs an oral antidiabetic drug (OAD) in patients with T2D inadequately controlled with metformin.
Materials and methods: Patients aged ≥18 years, with HbA1c 7.5-9.0%, recruited from nine countries (219 sites), were randomised 1:1 using an interactive web response system to liraglutide or an OAD (α-glucosidase inhibitor, dipeptidyl peptidase-4 inhibitor [DPP-4i], meglitinide, sodium-glucose transport protein-2 inhibitor [SGLT-2i], sulphonylurea [SU] or thiazolidinedione, chosen by their physician) on top of metformin, for up to 104 weeks. Primary endpoint: time to inadequate glycaemic control, defined as HbA1c >7.0% at two consecutive visits after the first 26 weeks of treatment. Key secondary endpoints: time to premature treatment discontinuation, including for inadequate glycaemic control, and occurrence of adverse events (AEs).
Results: From Mar 2016 to Aug 2017, patients were randomised to liraglutide (N=996) or OAD (N=995; 48% SGLT-2i, 40% DPP-4i, 11% SU). Liraglutide significantly reduced the risk of inadequate glycaemic control vs OAD (416/996 [42%] vs 547/995 [55%] patients, respectively; HR [95% CI] 0.58 [0.51;0.66]; p<0.0001) and of premature treatment discontinuation (532/996 [53%] vs 624/995 [63%], respectively; p<0.0001). Median time to inadequate glycaemic control (109 vs 65 weeks; p<0.0001) and premature treatment discontinuation (80 vs 52 weeks; p<0.0001) was longer with liraglutide vs OAD. Rates of serious AEs and hypoglycaemic episodes were similar, but more patients discontinued due to gastrointestinal AEs with liraglutide vs OAD (54/980 [6%] vs 9/984 [1%], respectively).
Conclusion: Within global primary care settings, LIRA-PRIME demonstrated longer lasting glycaemic control with liraglutide than with an OAD, when added to metformin.
Clinical Trial Registration Number: NCT02730377
Supported by: Novo Nordisk A/S
Disclosure: M. Zoghbi: Non-financial support; Abstract supported by Novo Nordisk.
595
Effects of teneligliptin on continuous glucose monitoring-derived time-in range and glycaemic variability in patients aged 65 years and older with type 2 diabetes
G. Kim1, J. Bae2, J. Won3, S. Kwak4, B. Hyun5, J. Cha5, J. Kim1;
1Samsung Medical Center, Seoul, 2Samsung Changwon Hospital, Changwon, 3Sanggye Paik Hospital, Seoul, 4Seoul National University Hospital, Seoul, 5Handok Inc., Seoul, Republic of Korea.
Background and aims: Elderly patients are generally at greater risk of micro- or macrovascular complications and hypoglycemia. In these patients, the selection of antihyperglycemic medication to control hyperglycemia without increasing hypoglycemia by reducing glycemic fluctuation is important to prevent diabetic complications. However, few studies have investigated the effect of diabetes medication in older patients using continuous glucose monitoring (CGM). This study aimed to evaluate the effects of teneligliptin on CGM-derived time-in-range (TIR) and glycemic variability (GV) in older patients with type 2 diabetes (T2D).
Materials and methods: In this randomized, double-blind, placebo-controlled trial, sixty-five subjects (HbA1c 7.0-9.0%, fasting plasma glucose [FPG] < 270 mg/dL) who were treatment-naïve or had been treated with stable doses of metformin were randomized to receive either placebo or teneligliptin 20 mg once daily for 12 weeks. The randomization was stratified by previous treatment (yes/no metformin), HbA1c level (<7.5% or ≥7.5%) and glucose standard deviation (SD; ≤35 mg/dL or >35mg/dl) in CGM. CGM (iPro2, Medtronic) was performed for 5 days at baseline and at week 12. The main study end points were changes in HbA1c, FPG, CGM-derived TIR and other core metrics including the mean amplitude of glucose excursion (MAGE), SD, coefficient of variation (CV), mean blood glucose (MBG) and from baseline to week 12.
Results: After 12 weeks of treatment, the teneligliptin group showed significant reductions from baseline in HbA1c (-0.76% of least-squares mean [LSM], p < 0.0001 vs placebo group) and FPG concentration (-14.1 mg/dL of LSM, p < 0.0001 vs placebo group). The analysis of CGM demonstrated that the reduction in GV was also significantly greater in the teneligliptin group than in the placebo group: the difference in LSM between groups was significant for MAGE (-27.5 mg/dL, p < 0.0001), SD (-12.5 mg/dL, p < 0.0001), CV (-4.6%, p = 0.0012) and MBG (-19.1 mg/dL, p = 0.0006). A significant increase in TIR (70-180 mg/dL) from 62.7% to 82.0% (13.3%, p = 0.0006), and thus a marked reduction in time-above-range (TAR) hyperglycemia was observed in the teneligliptin group compared with placebo (TAR 180-250 mg/dL -13.8 mg/dL, p = 0.0016 and TAR > 250 mg/dL -6.7 mg/dL, p = 0.0039, respectively). Moreover, time-below-range (TBR) of hypoglycemia in the teneligliptin group did not differ from that in the placebo group (TBR 54-70 mg/dL -0.0 mg/dL, p = 0.9215 and TBR < 54 mg/dL -0.1 mg/dL, p = 0.1747, respectively).
Conclusion: Teneligliptin (20 mg/day) effectively reduces HbA1c and improves TIR and glucose variability without increasing TBR hypoglycemia. Therefore, it could be a good therapeutic choice in older patients with T2D.

Clinical Trial Registration Number: NCT03508323
Supported by: Handok Inc.
Disclosure: G. Kim: None.
596
Optimal treatment intensification for glycaemic control in patients with type 2 diabetes on two oral agents: real world comparison of GLP-1, OADs and insulin
C. Desouza1, A. Ross Kirk2, K. Kant Mangla3, M. Lyng Wolden2, I. Lingvay4;
1University of Nebraska Medical Center, Omaha, USA, 2Novo Nordisk A/S, Søborg, Denmark, 3Novo Nordisk Service Centre India Pvt. Ltd., Bangalore, India, 4Department of Internal Medicine, UT Southwestern Medical Center, Dallas, USA.
Background and aims: Healthcare providers have many options for achieving glycaemic control in individuals with type 2 diabetes (T2D) requiring treatment intensification. In this analysis from the PATHWAY study we address the question of optimal treatment choice, comparing intensification with additional oral antidiabetic drug (OAD), glucagon-like peptide-1 (GLP-1) analogues or insulin in individuals on 2 OADs.
Materials and methods: Electronic medical records and claims data were from IBM MarketScan Explorys Claims-EMR (IBM Watson Health, Cambridge, MA, USA) (index period: 1 Mar 2013-31 Oct 2018). Inclusion required ≥ 1 claim for 2 different OADs in the 180 days pre-index and ≥ 1 claim for another OAD/GLP-1/insulin (day 0; index date). Individuals with evidence of pregnancy or gestational diabetes during the entire study period (01 Sept 2012-31 Dec 2018), or type 1 diabetes, receipt of injectables or receipt of index treatment in the pre-index period, were excluded from the analysis. For outcome assessment, individuals required ≥ 1 HbA1c and weight measurement 180 days post-index (+/− 90 days), and ≥ 1 baseline HbA1c and weight measurement. Baseline HbA1c was taken between days -180 and +15, and baseline weight between days -180 and 0; measurements closest to day 0 were taken as baseline. Cohorts for GLP-1s vs OADs and vs insulin were propensity score matched pairwise by: age; sex; baseline weight; comorbidities; adapted Diabetes Complications Severity Index (aDCSI) score and Quan-Charlson Comorbidity Index (QCI) score; index year; payer type and health plan; and baseline antidiabetic medications. Exact matching was performed by HbA1c category for the endpoint of reaching a target of < 7% HbA1c and by HbA1c category and BMI for the endpoint of reaching a target of < 7% HbA1c with no weight gain.
Results: Cohorts were well balanced across all baseline characteristics after matching. GLP-1 cohorts were significantly more likely to reach target HbA1c < 7%, and HbA1c < 7% with no weight gain, than those receiving either OADs or insulin (Figure).
Conclusion: Our results support clinical decision-making at treatment intensification, indicating that individuals on 2 OADs are more likely to achieve targets with GLP-1s than with further OAD or insulin. Note: Data accepted for presentation at the American Diabetes Association 80th Scientific Sessions, 12-16 June 2020, Chicago, IL, USA.

Supported by: Novo Nordisk A/S
Disclosure: C. Desouza: Employment/Consultancy; CD has performed consultancy for AstraZeneca, Bayer AG and Novo Nordisk A/S.
597
Efficacy and safety of once-weekly dulaglutide versus insulin glargine in Chinese patients with type 2 diabetes and different baseline glycaemic patterns
J. Hou1, B. Zhang1, Q. Li2;
1Lilly Suzhou Pharmaceutical Co. Ltd., Shanghai, 2The First Affiliated Hospital of Chongqing Medical University, Chongqing, China.
Background and aims: HbA1c level is influenced by both fasting glucose (FG) and postprandial glucose (PPG). Long-acting insulin analogue, insulin glargine (IGlar), lowers FG level mainly through inhibiting hepatic glucose production, whereas GLP-1 receptor agonist, dulaglutide (DU), decreases both FG and PPG through stimulating insulin secretion, reducing glucagon level and slowing gastric emptying. Considering the distinct mechanisms of IGlar and DU, we aimed to investigate whether these two drugs showed different glucose-lowing effects in Chinese T2DM patients with varied baseline glycemic patterns.
Materials and methods: In the AWARD-CHN2 study, a total of 607 Chinese T2DM patients uncontrolled on metformin and/or a sulfonylurea with hemoglobin A1c (HbA1c) ≥7.0% and ≤11.0% were randomly assigned 1:1:1 to receive once-weekly DU 1.5 mg, DU 0.75 mg or IGlar for 26 weeks. Data from DU 1.5 mg (n = 186) and IGlar (n = 188) groups were included in the post-hoc analysis. Patients were categorized by the median baseline values of self-monitored FG (8.9 mmol/L) and PPG (12.5 mmol/L) into 4 subgroups: low FG&low PPG, low FG&high PPG, high FG&low PPG and high FG&high PPG. Changes in glycemic parameters, including HbA1c, central laboratory-assessed FG and self-monitored PPG, and safety parameters at 26 weeks were evaluated.
Results: Significant decreases in HbA1c were observed in all subgroups receiving DU and IGlar at 26 weeks (Table). Compared to IGlar, DU provided statistically greater decrease in HbA1c in all subgroups, even in high FG subgroups, except in low FG&high PPG subgroup with only a numerically greater decrease. Larger proportions of patients in all subgroups reached HbA1c ≤6.5% with DU (p <0.05 for all). FG decreased significantly in all subgroups, and each subgroup had comparable decreases resulting from DU and IGlar. Significant decreases in PPG were observed in all subgroups except for low FG&low PPG subgroup treated with IGlar. Compared to IGlar, DU resulted in significantly greater decrease in PPG only in high FG&high PPG subgroup. In all subgroups, body weight was decreased from baseline with DU, but was increased with IGlar. DU showed significantly better control on body weight compared to IGlar in all subgroups. Comparatively, DU resulted in numerically lower incidence of total hypoglycemia in all subgroups except for low FG&high PPG subgroup.
Conclusion: Overall, the post-hoc analysis reveals that both DU and IGlar improved glycemic control in Chinese T2DM patients regardless of baseline FG and PPG. DU provided equal or superior glucose-lowering effect compared to IGlar with less hypoglycemia in most baseline glycemic patterns. DU led to weight loss in all subgroups while IGlar caused weight gain.

Clinical Trial Registration Number: NCT01648582
Disclosure: J. Hou: Employment/Consultancy; Lilly Suzhou Pharmaceutical Co. Ltd.
598
Dulaglutide reduces HbA1c irrespective of antihyperglycaemic agents, duration of diabetes, BMI and weight loss: a post hoc analysis from the REWIND trial
D. Xavier1, A. Kwan2, H. Gerstein3, J. Basile4, J.M. Maldonado2, S. Raha2, M. Konig2;
1Division of Clinical Research and Training, St. John's Medical College, Bangalore, India, 2Eli Lilly and Company, Indianapolis, USA, 3Population Health Research Institute, Hamilton, Canada, 4Medical University of South Carolina, Charleston, USA.
Background and aims: In the REWIND cardiovascular (CV) outcomes trial, the addition of dulaglutide 1.5 mg (DU) vs placebo (PL) to standard of care reduced the composite risk of CV death, nonfatal myocardial infarction, and nonfatal stroke in patients with type 2 diabetes and prior CV disease or CV risk factors. DU also reduced HbA1c and weight (LSM difference -0.61% and -1.46 kg, respectively). This post hoc analysis assessed the effect of DU on HbA1c change when adjusting for the effects of key time-dependent and baseline characteristics and within-trial weight loss in the REWIND trial.
Materials and methods: Change from baseline in HbA1c was assessed through 72 months using MMRM models both unadjusted and adjusted for concomitant antihyperglycaemic medication use, duration of diabetes, comorbidities (nephropathy and retinopathy), BMI and by the degree of weight loss achieved.
Results: Overall, the treatment difference remained significant after adjustment for each of the characteristics tested (Table). The overall HbA1c change from baseline through 72 months in DU-treated patients was significant compared to PL-treated patients (LSM treatment difference p<0.001) when adjusting for the characteristics tested. A significant reduction in HbA1c from baseline was observed in DU-treated patients when adjusting for concomitant antihyperglycaemic medication use, duration of diabetes, comorbidities, BMI, and weight loss (p<0.001). Similar HbA1c reductions were observed in the unadjusted analysis (p<0.001).
Conclusion: Dulaglutide treatment was associated with a durable decrease in HbA1c through 72 months, irrespective of concomitant antihyperglycaemic medication use, duration of diabetes, comorbidities, BMI, and weight loss. Long-term use of dulaglutide 1.5 mg in adults with type 2 diabetes not only reduces the risk of major adverse cardiovascular events in primary and secondary prevention populations but also provides durable glucose lowering over 6 years of treatment.

Clinical Trial Registration Number: NCT01394952
Disclosure: D. Xavier: Grants; Cadila, Boehringer Ingelheim, AstraZeneca, Sanofi-Aventis, Pfizer, Bristol-Myers Squibb, UK Medical Research Council, Wellcome Trust.
599
Prominent effects of SGLT2 inhibitor canagliflozin combined with DPP-4 teneligliptin on postprandial hyperglycaemia at breakfast and dinner
K. Cho1,2, H. Nomoto1, S. Kawata1, K. Tsuchida1, K. Omori1, A. Nakamura1, T. Atsumi1, H. Miyoshi1,3;
1Department of Rheumatology, Endocrinology and Nephrology, Hokkaido University, Sapporo, 2Clinical Research and Medical Innovation Center, Hokkaido University Hospital, Sapporo, 3Division of Diabetes and Obesity, Hokkaido University, Sapporo, Japan.
Background and aims: We recently reported superiority on mean amplitude of glycemic excursions (MAGE) for the combination of SGLT2 inhibitor (SGLT2i) canagliflozin and DPP-4 inhibitor (DPP-4i) teneligliptin compared with each monotherapy in patients with type 2 diabetes (T2DM) in the CALMER study. Here, we investigated the effects of the same combination on changes in other continuous glucose monitoring (CGM) metrics and the differences in reduction of post-prandial glucose elevation after individual meals.
Materials and methods: This study was a sub-analysis of the CALMER study, which was a multicenter, open-label, prospective, randomized, parallel-group comparison trial using meal tolerance tests (MTTs). Ninety-nine patients with T2DM were randomly assigned to switch from teneligliptin (20 mg/day) to canagliflozin (100 mg/day; SWITCH group) or to add canagliflozin (100 mg/day) to teneligliptin (COMB group). Daily glycemic control was monitored by CGM for 14 consecutive days. The first MTT was performed at consecutive meals (breakfast, lunch, and dinner) while the patient took teneligliptin. The allocated medication (canagliflozin or combination) was then started instead of teneligliptin in each group. After 7 days, the second identical MTT was performed. The changes in percentage of time per day within target glucose range (TIR), time below range (TBR), time above range (TAR), and mean glucose were investigated as core CGM metrics. The difference between pre-prandial and 120 min post-prandial glucose levels (Δ0-120) were analyzed for each meal during the MMTs.
Results: All 99 participants (mean age: 62.3 years; mean HbA1c: 7.4%) completed the trial. Mean glucose and TAR decreased significantly in both groups, but the extent of the reduction was significantly larger in the COMB group compared with the SWITCH group (mean glucose: −22.3 mg/dL vs. −10.6 mg/dL, p=0.002; TAR: −14.8% vs. −7.5%, p=0.011). TIR and TBR increased significantly in both groups, but the extent of the increase was similar between the COMB group and the SWITCH group (TIR: +11.5% vs. +5.8%, p=0.06; TBR: +3.3% vs. +1.7%, p=0.08). Δ0-120 at breakfast and dinner was significantly decreased in the COMB group (−14.3 mg/dL and −22.4 mg/dL, respectively), while that in the SWITCH group did not change (−0.7 mg/dL and +10.6 mg/dL, respectively). The difference in Δ0-120 at dinner reached statistical significance between the two groups (p<0.01). Δ0-120 at lunch did not change in both groups.
Conclusion: The present findings demonstrated that SGLT2i combined with DPP-4i strongly reduced the periods of high glucose exceeding 180 mg/dL and post-prandial hyperglycemia at breakfast and dinner in T2DM patients without increasing hypoglycemia, compared with SGLT2i or DPP-4i monotherapy.
Clinical Trial Registration Number: UMIN000029628
Supported by: Mitsubishi Tanabe Phama Corporation
Disclosure: K. Cho: None.
PS 48 Various clinical aspects of incretin-based therapies
600
Very low dose gliclazide lowers blood glucose by increasing incretin effect and beta-cell glucose sensitivity
R.L.M. Cordiner1, A. Mari2, A. Tura2, E.R. Pearson1;
1School of Medicine, University of Dundee, Dundee, UK, 2Institute of Neuroscience - National Research Council, Padova, Italy.
Background and aims: The global prevalence of type 2 diabetes (T2DM) will surpass 600 million by 2035. It is therefore imperative to readdress our use of cheaper generic therapies such as sulphonylureas (SU) to ease the economic burden worldwide. Negative effects of SU, particularly hypoglyacemia, weight gain and reduced durability may be avoided by using them at low dose. Studies in neonatal diabetes show that, in patients with activating mutations in one of the genes encoding the KATP channel, high dose SU works to normalise blood glucose by enabling incretin action. These studies suggest that a dose of SU that closes some KATP channels may be sufficient to enable incretin action with little or no direct effect on insulin secretion; we hypothesise that in T2DM this can be achieved with a low dose of SU. If correct, this would support a rationale for use of very low dose SU to achieve glucose regulated insulin secretion and minimise the risk of hypoglycaemia. To test this hypothesis, we undertook isoglycaemic clamps to investigate the incretin effect in patients with T2DM, with and without treatment with very low dose SU.
Materials and methods: 20 participants with T2DM (HbA1c <64mmol, <8.0%) treated with diet or metformin monotherapy were recruited to a single-centre, proof-of-concept study based on an OGTT and an isoglycaemic clamp to assess the incretin effect (IE). Participants acted as their own controls completing two clamps in the presence and absence of low dose gliclazide. Phase 1 (n=8) randomised to either 10mg (n=4) or 20mg (n=4) gliclazide to identify the most effective dose for augmentation of the IE. Phase 2 utilised the identified dose in further participants (n=12). Main analysis included all participants who received the identified effective dose of gliclazide (n=16). Beta cell function was analysed through modelling of the relationship between insulin secretion and glucose concentration.
Results: All participants: 10 male, and 10 female, 12 metformin and 8 diet-controlled, age 55-76, median (IQR) duration of T2DM 8 years (5.5), BMI 32 kg/m2 (7.8), HbA1c 50.0 mmol/mol (19.0) completed the study. Wilcoxon analysis showed 20mg gliclazide to cause significant reduction in mean glucose (Control 12.01 +/- 2.2, Gliclazide 10.8 +/- 2.0 mmol/l (p=0.0006)) whilst augmenting the classical IE of both insulin and c-peptide IEINSULIN (Control 22.9 +/- 37.6, Gliclazide 33.9 +/- 48.0 nmolx4h (p<0.05)), IE C-peptide (Control 90.5 +/- 139.2, Gliclazide 123.7 +/- 165.1 nmolx4h (p<0.05)). Glucose sensitivity increased by 50% (Control 22.61 +/- 3.94 vs Gliclazide 33.11 +/- 7.83 (p=0.01)). Beta-cell modelling revealed incretin potentiation to be significant in late-phase secretion: AUC/time from 180 to 210 minutes (11+/-5 min AUC/time (p=<0.05)).
Conclusion: Very low dose gliclazide is effective in reducing plasma glucose through increased beta-cell glucose sensitivity and augmentation of the classical incretin effect particularly in late phase. Further research is required to investigate beta-cell physiology using SU at such low dose and its potential for future clinical application, including potential synergy with DPP-4 inhibitors.
Clinical Trial Registration Number: NCT03705195
Supported by: This research is funded by the Wellcome Trust New Investigator Award held by ERP
Disclosure: R.L.M. Cordiner: None.
601
Safety and efficiency of the combination of basal insulin with liraglutide in hospitalised patients with type 2 diabetes
S. Papantoniou;
1st Department of Internal Medicine, General Hospital of Piraeus "Tzaneio", Moschato, Greece.
Background and aims: Accroding to current guidelines, it is strongly reccomended to use basal-bolus insulin therapy for the glycemic control of hospitalized patients with type 2 diabetes (T2D). However, there are premature results from studies showing an association between the use of basal insulin combined with GLP1 agonist for the glycemic control of hospitalized patients with better outcomes at surgery departments. Therefore, theaim of this study was to investigate the safety and efficiency of the combination of basal insulin and a GLP1 agonist, liraglutide, as a treatment choice for hospitalized patients with T2D.
Materials and methods: 78 patients [48 on basal-bolus insulin therapy(group A) and 30 on combination of basal insulin with liraglutide (group B)]. There were no significant differences between the two study groups in terms of sex, whereas there was asignificantdifference among age (group A: 79.5±7.6 versus group B: 65.7±15.3 years). Daily glucose measurements (fasting and post meal), systolic (SBP) and diastolic (DBP)blood pressure and a complete laboratory test during the first and last day of hospitalizationwas performed for all study patients. Then glucose and blood pressure variability were calculated according to the SD formula.
Results: Daily glucose variability was not different between the study groups (P=0.42). Moreover, there was no difference between the daily variability of SBP and DBP between the study groups (P=0.11 and P=0.52, respectively). About 70% of patients of group A achieved glycemic control(70-180mg/dl) comparing with 68,1% for group B (P=0.61). 12 episodes of hypoglycemia were recorded, 8 episodes of nausea and 4 episodes of vomiting at group A. On the other hand, no episodes of hypoglycemia were recorded on group B (P=0.05). On the other hand, 3 episodes of nausea (P=0.43) and 6 episodes of vomiting(P=0.32) were recorded at group B. There was no significant difference in the duration of hospital stay between the two study groups(group Α:7.5±4.4 versus group Β:6.3±3.2days, Ρ=0.34) as well as mortality rates(group Α:1 versus group Β:4 deaths, Ρ=0.73).
Conclusion: Our study shows that the combination of basal insulin and liraglutide is as safe and effective choice for the achievement of glycemic control in hospitalized patients with T2D.
Disclosure: S. Papantoniou: None.
602
Renal impairment has no impact on the clinical pharmacokinetics of tirzepatide
S. Urva, T. Quinlan, J. Landry, J. Martin, C. Loghin;
Eli Lilly and Company, Indianapolis, USA.
Background and aims: Novel dual GIP and GLP-1 receptor agonist, tirzepatide (TZP), is being developed as a potential weekly treatment for type 2 diabetes mellitus (T2DM), weight management, and nonalcoholic steatohepatitis. This study evaluated the pharmacokinetics (PK) and tolerability of TZP in subjects with renal impairment (with or without T2DM) vs healthy subjects with normal renal function.
Materials and methods: Subjects in this single-dose study were categorised by renal impairment defined by baseline estimated glomerular filtration rate (eGFR, MDRD equation): 14 with normal renal function (≥90 mL/min/1.73m2), 8 with mild impairment (60-89 mL/min/1.73m2), 8 with moderate impairment (30-59 mL/min/1.73m2), 7 with severe impairment (<30 mL/min/1.73m2), and 8 with end stage renal disease (ESRD) requiring dialysis. All subjects received a single subcutaneous dose of 5 mg TZP. Blood samples were collected to determine TZP plasma concentrations to estimate PK parameters. Adverse events were monitored to assess safety and tolerability. Log-transformed AUC0-∞, AUC0-tlast, and Cmax were evaluated by analysis of variance, and 90% CI of the ratio between groups was estimated. Additionally, the relationship between TZP PK parameters and eGFR (MDRD and CKD-EPI) and creatinine clearance (Cockcroft-Gault) was assessed by regression analysis.
Results: PK parameters were similar between subjects with severe renal impairment and healthy subjects (geometric LSM ratios [90% CI] of 1.03 [0.836, 1.27], 1.04 [0.841, 1.28], and 1.23 [0.966, 1.56] for AUC∞, AUC0-tlast, and Cmax, respectively). Similar results were observed when comparing the PK parameters of mild, moderate, and ESRD groups vs healthy subjects. There was no statistically significant relationship at the two-sided 10% significance level between exposure and eGFR. No notable differences in safety profiles were observed.
Conclusion: There were no clinically relevant effects of renal impairment on TZP PK. Thus, patients with renal impairment treated with tirzepatide may not require dose adjustments.
Disclosure: S. Urva: Employment/Consultancy; Eli Lilly and Company. Stock/Shareholding; Eli Lilly and Company.
603
Short-acting exenatide and markers of cardiovascular disease in type 1 diabetes: a randomised double-blinded placebo-controlled trial
N.J. Johansen1,2, T.F. Dejgaard1,2, A. Lund1, C. Schlüntz1, E.L. Larsen3, H.E. Poulsen3,4, J.P. Goetze5, H.J. Møller6, T. Vilsbøll1,2, H.U. Andersen2, F.K. Knop1,2;
1Center for Clinical Metabolic Research, Gentofte Hospital, Hellerup, 2Steno Diabetes Center Copenhagen, Gentofte, 3Department of Clinical Pharmacology, Bispebjerg Hospital, Copenhagen, 4Department of Clinical Medicine, University of Copenhagen, Copenhagen, 5Department of Clinical Biochemistry, Rigshospitalet, Copenhagen, 6Department of Clinical Biochemistry, Aarhus University Hospital, Aarhus, Denmark.
Background and aims: In type 2 diabetes, some glucagon-like peptide 1 receptor agonists (GLP-1RAs) reduce the risk of major adverse cardiovascular events. Whether GLP-1RAs have any effect on cardiovascular disease risk in patients with type 1 diabetes remains to be elucidated. We tested the effect of adding the short-acting GLP-1RA exenatide to insulin treatment on markers of cardiovascular risk in type 1 diabetes.
Materials and methods: In a randomised, double-blinded, parallel-group trial, 108 individuals with type 1 diabetes aged ≥18 years on multiple daily insulin injection therapy with BMI >22.0 kg/m2 and HbA1c 59-88 mmol/mol (7.5-10.0%) were randomised (1:1) to preprandial s.c. injection of 10 μg short-acting exenatide or placebo three times daily over 26 weeks as add-on treatment to existing insulin therapy. Reported data were secondary endpoints and analysed in a baseline-adjusted linear mixed model in the intention-to-treat population.
Results: Exenatide changed total fat mass by -2.6 kg (95% CI -3.6;-1.6, p<0.0001) and lean body mass by -1.1 kg (95% CI -1.9;-0.4, p=0.01) compared with placebo as assessed by dual-energy X-ray absorptiometry. Central and peripheral fat mass reductions were similar. Exenatide did not change levels of interleukin 2 or 6; tumour necrosis factor alpha; C-reactive protein; N-terminal prohormone of brain natriuretic peptide; or 8-oxo-7,8-dihydroguanosine (RNA oxidation marker) and 8-oxo-7,8-dihydro-2’-deoxyguanosine (DNA oxidation marker).
Conclusion: Short-acting exenatide added to insulin therapy in type 1 diabetes for 26 weeks resulted in body weight loss primarily from fat mass reduction but had no effect on circulating biomarkers of cardiovascular disease risk.
Clinical Trial Registration Number: NCT03017352
Supported by: AstraZeneca
Disclosure: N.J. Johansen: None.
604
Exercise alone and in combination with liraglutide improves cardiorespiratory fitness and physical functioning during weight loss maintenance
S.B.K. Jensen1, C. Janus1, J.R. Lundgren1, C.R. Juhl1, M.B. Blond2, B.M. Stallknecht1, J.J. Holst1, S. Madsbad3, S.S. Torekov1;
1Department of Biomedical Sciences, University of Copenhagen, Copenhagen, 2Steno Diabetes Center Copenhagen, Gentofte, 3Department of Endocrinology, Hvidovre University Hospital, Hvidovre, Denmark.
Background and aims: Poor cardiorespiratory fitness is associated with a high risk of cardiovascular disease and all-cause mortality. For each metabolic equivalent (3.5 ml/min/kg) increment in cardiorespiratory fitness, the associated improvement in survival is 10-25%. The aim of this study was to explore changes in physical fitness during weight loss maintenance with the glucagon-like peptide-1 receptor agonist liraglutide, an exercise program, and a combination of both.
Materials and methods: Women and men with obesity (18-65 years, BMI 32-43 kg/m2) who achieved ≥ 5 % weight loss during an eight-week very low-calorie diet run-in were randomly allocated to one of four study groups for 52 weeks: placebo (n=49), exercise 150 min/week plus placebo (n=48), liraglutide 3 mg/day (n=49), and the combination of exercise 150 min/week plus liraglutide 3 mg/day (n=49). Cardiorespiratory fitness was measured as peak V̇O2 using indirect calorimetry during an incremental bicycle test. Physical functioning was evaluated as time to ascend/descend an 11-step stairway twice.
Results: A total of 195 study participants completed the run-in phase resulting in a mean weight loss of 13.1 kg (109.8 to 96.7 kg), accompanied by increased peak oxygen consumption (23.0 to 24.9 ml/min/kg) and decreased (improved) time on the stair climb test (15.9 to 15.0 s). Changes from randomization to week 52 were assessed by linear mixed model analyses on the intention-to-treat population. At week 52, the placebo group had regained 5.9 kg, the exercise group had maintained weight loss (mean change, 1.7 kg; difference from placebo, -4.2 kg; 95% CI, -8.0 to -0.4), the liraglutide group had maintained weight loss (mean change, -1.3 kg; difference from placebo, -7.1 kg; 95% CI, -10.9 to -3.4), and the combination group had further reduced weight (mean change, -3.4 kg; difference from placebo, -9.3 kg; 95% CI, -13.0 to -5.6). At week 52, the exercise group had increased peak V̇O2 more than the placebo group (3.5 vs. -0.4 ml/min/kg; difference, 3.9 ml/min/kg; 95% CI, 1.8 to 6.0) and the liraglutide group (3.5 vs. 1.1 ml/min/kg; difference, 2.3 ml/min/kg; 95% CI, 0.3 to 4.4). The combination group increased peak V̇O2 by 4.8 ml/min/kg for a difference from placebo of 5.2 ml/min/kg (95% CI, 3.2 to 7.2) and difference from liraglutide alone of 3.6 ml/min/kg (95% CI, 1.6 to 5.6). The exercise group improved on the stair climb test compared to the placebo group (difference, -0.9 s; 95% CI, -1.6 to -0.2) and compared to the liraglutide group (difference, -1.3 s; 95% CI, -2.0 to -0.7). Similarly, the combination group improved on the stair climb test compared to placebo (difference, -0.8 s; 95% CI, -1.5 to -0.2) and compared to liraglutide alone (difference, -1.2 s; 95% CI, -1.9 to -0.6). Neither of the fitness measurements differed between the exercise group and the combination group.
Conclusion: Exercise alone and in combination with liraglutide exert clinically relevant improvements in cardiorespiratory fitness and improve physical functioning. Adding liraglutide does not interfere with the ability to improve fitness with exercise, supporting the combined use in weight management.
Clinical Trial Registration Number: NCT04122716
Supported by: Novo Nordisk Foundation Excellence grant, Novo Nordisk Foundation CBMR grant, Novo Nordisk Foundation Immunometabolism grant, Helsefonden grant
Disclosure: S.B.K. Jensen: Grants; NNF immunometabolism grant (NNF15SA0018486), NNF excellence grant (NNF16OC0019968), Helsefonden grant, NNF CBMR synergy grant.
605
Gastrointestinal adverse events with once-weekly semaglutide: risk predictors and effect on semaglutide response
F.K. Knop1, S. Harring2, I. Holst2, K. Kvist2, I. Lingvay3, T. Vilsbøll4;
1Gentofte Hospital, University of Copenhagen, Hellerup, Denmark, 2Novo Nordisk A/S, Søborg, Denmark, 3University of Texas Southwestern Medical Center, Dallas, USA, 4Steno Diabetes Center Copenhagen, Gentofte Hospital, University of Copenhagen, Hellerup, Denmark.
Background and aims: Gastrointestinal adverse events (GI AEs) are common with glucagon-like peptide-1 receptor agonists (GLP-1RAs). We aimed to identify risk predictors for GI AEs with once-weekly (OW) s.c. semaglutide to support clinicians identifying high-risk patients, and to explore the effect of the presence or absence of GI AEs on change in HbA1c and body weight (BW) with OW semaglutide.
Materials and methods: Data for a total of 9,680 subjects from SUSTAIN 1-10 and two Japanese SUSTAIN trials were used to assess the effects of age, region, ethnicity, diabetes duration, sex, renal function, smoking status, HbA1c, BW, alanine aminotransferase and bilirubin on the incidence of GI AEs with OW semaglutide vs non-GLP-1RA comparators (exenatide extended release, dulaglutide and liraglutide were excluded). Univariate and multivariate logistic regression analyses, adjusting for covariates, were performed to identify any associations. Changes in HbA1c and BW were assessed in individuals receiving OW semaglutide (data pooled for 0.5 or 1.0 mg) according to whether they experienced GI AEs.
Results: A higher age, moderate/severe renal impairment, previous/current smoking and female sex were all associated with a higher risk of GI AEs compared with a lower age, no/mild renal impairment, never smoking and male sex, respectively, regardless of treatment with or without a GLP-1RA. For OW semaglutide specifically, a lower baseline BW was significantly associated with a higher risk of experiencing a GI AE during treatment; however, the model had low predictive power and could not accurately distinguish subjects experiencing GI AEs from those that did not (area under the ROC curve: 0.6). None of the other factors evaluated were associated with GI AE risk. Across all trials included in the analysis, OW semaglutide use resulted in a reduction in HbA1c and BW from baseline, regardless of whether GI AEs were experienced (range across trials: -1.1 to -1.9 %-point [-12 to -21 mmol/mol] and -2.8 to -6.4 kg, respectively) or not experienced (range across trials: -1.3 to -1.9 %-point [-14 to -21 mmol/mol] and -1.8 to -5.2 kg, respectively) experienced during treatment (Figure).
Conclusion: GI AEs may be more common in individuals with a higher age, moderate/severe renal impairment, and/or current/prior smoking status than in those without these risk factors, regardless of treatment with or without semaglutide. For OW semaglutide specifically, individuals with a lower baseline BW may be at higher risk for GI AEs. It is notable that the reductions in HbA1c and BW in individuals treated with semaglutide were similar for those with and without GI AEs.

Clinical Trial Registration Number: NCT02054897; NCT01930188; NCT01885208; NCT02128932; NCT02305381; NCT01720446; NCT02648204; NCT03136484; NCT03086330; NCT03191396; NCT02207374; NCT02254291
Supported by: Novo Nordisk A/S
Disclosure: F.K. Knop: None.
606
Effect of liraglutide treatment on weight parameters in children and adolescents with type 2 diabetes: post hoc analysis of the ellipse trial
M.O. Bensignor1, E.M. Bomberg1, C.T. Bramante1, T.V.S. Divyalasya2, P.M. Hale3, C.K. Ramesh2, K. Rudser4, A.S. Kelly1;
1University of Minnesota Medical School, Minneapolis, USA, 2Novo Nordisk, Bangalore, India, 3Novo Nordisk Inc., Plainsboro, USA, 4University of Minnesota Medical School and University of Minnesota School of Public Health, Minneapolis, USA.
Background and aims: In the ellipse trial, the glucagon-like peptide-1 receptor agonist liraglutide improved glycaemic control vs placebo (both added to metformin±basal insulin treatment) in children and adolescents with type 2 diabetes (T2D). This post hoc analysis of the trial evaluated the effects of liraglutide, including its dose dependency, on weight-related parameters.
Materials and methods: Ellipse was a phase 3a, placebo-controlled, multinational and multicentre trial, which randomised participants with T2D 1:1 to liraglutide (1.8 mg/day or maximum tolerated dose) or placebo for 26 weeks double-blinded, followed by a 26-week open-label extension. Key inclusion criteria: age 10-17 years, BMI >85th percentile and HbA1c 7.0-11.0% (if diet- and exercise-treated) or 6.5-11.0% (if treated with metformin, basal insulin or both). This post hoc analysis examined weight-related parameters including absolute BMI, percent change in BMI, percentage of the 95th percentile for BMI (%BMIp95) and waist circumference (WC) by liraglutide overall and by liraglutide dose (0.6, 1.2 and 1.8 mg/day; participants were categorised by dose taken for the longest time during the maintenance period [double-blind and open-label]), all vs placebo.
Results: In total, 134 participants (mean±SD: age 14.6±1.7 years) were treated in the ellipse trial (66 and 68 with liraglutide and placebo, respectively) and included in this analysis. All but eight patients had severe obesity (BMI ≥120% of the 95th percentile) at baseline. Between treatment groups, participants had similar BMI (34.6 and 33.3 kg/m2, for liraglutide and placebo, respectively), %BMIp95 (175.3 and 168.8, respectively) and WC (106.1 and 104.3 cm, respectively) at baseline. Significant differences between liraglutide overall and placebo were found for change in absolute BMI, percent change in BMI and %BMIp95 change from baseline to Week 52, but not for WC (Table). Comparing the three liraglutide doses vs placebo, there were no significant differences observed in the change in these four weight-related parameters from baseline to Week 26 (Table). At Week 52, liraglutide 1.2 mg differed significantly from placebo for change in absolute BMI, percent change in BMI and %BMIp95 change (Table).
Conclusion: Liraglutide significantly reduced BMI (absolute and percent) and %BMIp95 vs placebo at Week 52, with no significant dose-dependency effects observed, in this post hoc analysis

Clinical Trial Registration Number: NCT01541215
Supported by: Novo Nordisk A/S
Disclosure: M.O. Bensignor: Non-financial support; Abstract supported by Novo Nordisk.
607
Superior effect of 1-year treatment with GLP-1 receptor agonist and exercise on weight loss maintenance and body composition after a very low-calorie diet: the S-LITE trial
S.S. Torekov1, C. Janus1, J. Lundgren1, S.B.K. Jensen1, C.R. Juhl1, M.B. Blond2, L. Olsen1, R.M. Christensen1, M.S. Svane3, T.Q. Bandholm3, K.N. Bojsen-Møller3, J.-E.B. Jensen3, B.M. Stallknecth1, J.J. Holst1, S. Madsbad3;
1University of Copenhagen, Copenhagen, 2Steno Diabetes Center, Copenhagen, 3Hvidovre Hospital, Copenhagen, Denmark.
Background and aims: Weight loss decreases energy expenditure and increases appetite, leading to weight regain. Energy expenditure can be targeted with exercise and appetite with the glucagon-like peptide-1 (GLP-1) receptor agonist, liraglutide. The objective was to investigate 1-year weight loss maintenance and change in body composition with liraglutide, exercise, and the combination in individuals with obesity after a very low-calorie diet (VLCD).
Materials and methods: This was a double-blinded, randomized placebo-controlled trial. Following 8-weeks of VLCD (800 kcal/day), inducing a body weight loss of ≥ 5%, the participants were randomized to 1-year of treatment with 1) liraglutide 3 mg/day (LIRA), 2) exercise 150 min/week + placebo (EX), 3) exercise 150 min/week + liraglutide 3 mg/day (LIRA + EX), or 4) placebo (PLA). Results are presented as the estimated mean change (95% CI). Primary endpoint was change in body weight and secondary endpoint was change in body fat percentage from randomization to end of 1-year treatment. Data are shown for intention-to-treat analyses using linear mixed model. Data was hierarchically tested.
Results: Participants with obesity were included (n = 215, 64% women, age 42 years (IQR 30.7 to 51.9), BMI 36.6 kg/m2 (34.5 to 39.2)). 195 participants completed the VLCD with a mean weight loss of -13.1 kg (95 % CI -12.4 to -13.7) and were randomized to intervention. 166 participants completed the intervention with 15% lost to follow-up. The combined treatment of liraglutide and exercise (LIRA + EX) was superior to both placebo treatment (PLA) (-9.3 kg, -13.0 to -5.6, p < 0.001) and exercise alone (EX) (-5.1 kg, -8.8 to -1.5, p = 0.007) and numerically better to liraglutide treatment alone (LIRA) (-2.2 kg, -5.8 to 1.5, p = 0.2) for maintaining the weight loss and further reducing weight after 1 year. Furthermore, the combination treatment (LIRA + EX) was superior to liraglutide treatment (LIRA) (-1.9%, -3.4 to -0.5, p = 0.008) and to exercise alone (EX) (-1.7%, -3.2 to -0.3, p = 0.02) for reducing body fat percentage after 1 year. See Table 1
Conclusion: The combination of liraglutide and exercise was superior to placebo and exercise alone, and numerically better to liraglutide, in weight loss maintenance and further weight reduction. Reduction in body fat percentage with the combined treatment was superior to liraglutide and exercise alone, supporting combined treatment for healthy weight loss maintenance.

Clinical Trial Registration Number: NCT 04122716
Supported by: Novo Nordisk Foundation
Disclosure: S.S. Torekov: Grants; Novo Nordisk Foundation, Danish Diabetes Academy, Helse Fonden. Non-financial support; Cambridge Weight Plan, Novo Nordisk.
608
Effects of lixisenatide versus liraglutide (short- and long-acting GLP-1 receptor agonists) on oesophageal and gastric function in patients with type 2 diabetes
D.R. Quast1, N. Schenker1, B.A. Menge1, M.A. Nauck1, C. Kapitza2, J.J. Meier1;
1Division of Diabetology, St. Josef-Hospital Bochum, Bochum, 2Profil, Neuss, Germany.
Background and aims: When used as long-term treatment, short-acting GLP-1 receptor agonists (GLP-1 RAs) still markedly delay gastric emptying whereas long-acting GLP-1 RAs have only little effects on gastric motility due to tachyphylaxis. Delayed gastric emptying is a risk factor for gastroesophageal reflux disease (GERD). It was our aim to measure esophageal reflux and function and gastric motility and acid secretion with short- (lixisenatide) and long-acting (liraglutide) GLP-1 RAs.
Materials and methods: 57 subjects with type 2 diabetes mellitus were randomized to a 10-week treatment with liraglutide (maintenance dose 1.8 mg q. d.) or lixisenatide (20 μg q. d.), injected 30 minutes before breakfast in a double-blind manner. Primary endpoint was a change from baseline in the number of reflux episodes during 24-hour pH registration in the lower esophagus, secondary endpoints were lower esophagus sphincter pressure, gastric emptying (13C-sodium octanoate acid breath test) and gastric acid secretion (13C-calcium carbonate breath test). Data was analyzed for pooled and for each GLP-1 RA alone.
Results: After 10 weeks of treatment, there was no statistically significant difference in the number of reflux episodes (33.7 ± 4.1 vs. 40.1 ± 5.3, p = 0.17) or the extent of gastroesophageal reflux (DeMeester score) (35.1 ± 6.7 vs. 39.7 ± 7.5, p = 0.61) after treatment with the GLP-1 RAs. These results were similar, when the lixisenatide and liraglutide groups were analysed separately. No significant changes from baseline in other parameters of esophageal motility and lower esophageal sphincter function were observed with both GLP-1 RA or lixisenatide and liraglutide alone. Gastric emptying half-time was delayed by 52 min (16, 88) min with lixisenatide (p = 0.0065) and by 25 min (3, 46) with liraglutide (p = 0.025). The 13C-calcium carbonate breath test indicated a significant reduction of gastric acidity with the GLP-1 RAs by -20.7 (- 40.6, -0.8) % (p = 0.042), but this effect was not significant for any single agent alone.
Conclusion: After 10 weeks of treatment, neither lixisenatide, nor liraglutide had significant effects on esophageal gastroesophageal reflux or motility. Lixisenatide tended to exert a more pronounced influence on gastric emptying after breakfast than liraglutide. Gastric acid secretion appears to be slightly reduced by GLP-1 RAs. The present results reassure regarding the overall gastrointestinal safety profile of GLP-1 RAs.
Clinical Trial Registration Number: NCT-number: NCT02231658
Supported by: Novo Nordisk
Disclosure: D.R. Quast: None.
609
Effect on beta cell function in newly diagnosed type 2 diabetes patients after treatment with vildagliptin and metformin: results from the VERIFY study
P.M. Paldánius1, S. Del Prato2, M. Stumvoll3, D.R. Matthews4;
1Children’s Hospital, Helsinki University and Helsinki University Hospital, Helsinki, Finland, 2Department of Clinical and Experimental Medicine, Section of Metabolic Diseases and Diabetes, University of Pisa, Pisa, Italy, 3Division of Endocrinology and Diabetes, University Hospital Leipzig, Leipzig, Germany, 4Oxford Centre for Diabetes, Endocrinology and Metabolism, Oxford, UK.
Background and aims: The long-term glycaemic durability with early combination approach using vildagliptin and metformin compared with metformin monotherapy was demonstrated in the VERIFY study in newly diagnosed patients with type 2 diabetes (T2D). Here, we present the effect of treatment on β‐cell function from the VERIFY study.
Materials and methods: In this study, patients with newly diagnosed T2D (≤2 years) with HbA1c 6.5-7.5% were randomised 1:1 either to the early combination treatment group (vildagliptin plus metformin) or metformin monotherapy group. The primary endpoint was time to initial treatment failure, defined as HbA1c ≥7.0% at two consecutive scheduled visits after randomisation. The change in β-cell function (prespecified analysis) was assessed by HOMA model (homeostasis model assessment for the β-cell) from baseline to confirmed initial treatment failure. HOMA-B is calculated as a function of fasting plasma glucose and fasting insulin.
Results: Of the total 2001 patients, 998 in the combination and 1003 patients in the monotherapy group received treatment. Among these, the change in β-cell function was evaluated in 747 vs. 676 patients in combination and monotherapy groups, respectively. The mean (SE) HOMA-B at baseline was 120.1 (3.49) and 114.1 (3.20) in combination and monotherapy groups, respectively. The change in HOMA-B from baseline to confirmed initial treatment failure was 17.21 (9.04) in the combination group and −2.02 (9.02) in the monotherapy group. The difference in adjusted mean change between the combination and the monotherapy groups was 19.23 (95% CI: 8.42, 30.03; p<0.001). The change in HOMA-B values are consistent with greater reductions in HbA1c in the combination group compared to patients in the monotherapy group.
Conclusion: The early combination treatment with vildagliptin and metformin in patients with newly diagnosed T2D showed improvement in β-cell function compared with metformin monotherapy. This is consistent with the improved glycaemic control and durable HbA1c response observed in VERIFY study.
Clinical Trial Registration Number: NCT01528254
Supported by: Novartis
Disclosure: P.M. Paldánius: Employment/Consultancy; Novartis. Lecture/other fees; Novartis.
PS 49 Various aspects of nutrition and diet
610
Effects of quantified tableware use on glycaemic control in patients with type 2 diabetes
C.-H. Leung1, C.-Y. Tsai2, S.-C. Liu1, P.-H. Hsu3, S.-M. Chuang1, M.-S. Tzeng2;
1Division of Endocrinology and Metabolism, Department of Internal Medicine, Mackay Memorial Hospital, Taipei, 2Department of Nutritional Science, Fu Jen Catholic University, New Taipei City, 3Department of Dietetics, Mackay Memorial Hospital, Taipei, Taiwan.
Background and aims: The increased prevalence of diabetes places a substantial economic burden worldwide. Target goals for HbA1c, blood pressure (BP) and lipids are recommended to reduce mortality due to complications of diabetes. Nutrition therapy is important in managing diabetes. Quantified tableware (QTW) use by diabetic patients enhances their knowledge of food portion size. However, studies on the use of portion control to achieve glycemic targets in diabetics are scarce. This study examined the effect of 12 months use of QTW on glycemic control in type 2 diabetic (T2DM) patients.
Materials and methods: In this prospective, randomized, observational study, 77 adult T2DM patients, 36 males, age 59.2 (±11.1) years (mean±SD), with HbA1c >53 mmol/mol were recruited from the Diabetes Shared Care Network and randomly assigned to control and intervention groups. All were followed up at the out-patient clinic and received medication and scheduled dietary consultations. Patients in the intervention group were given a set of QTW comprising of a four-compartment divided plate, a bowl, a mug and a spoon and instructed how to use these. The objective was to consume food in appropriate amounts and control portion size. HbA1c, BP and serum LDL cholesterol goals were defined as HbA1c <53 mmol/mol, BP <140 mmHg systolic and <90 mmHg diastolic, and LDL cholesterol <2.6 mmol/l. Paired t-test was used to compare the change in metabolic parameters in the two groups
Results: Table shows the metabolic parameters at baseline and after 12 months in the control and intervention groups of T2DM patients, presented as mean±SD. After 12 months, only the intervention group (34/77) had significantly decreased fasting glucose (AC), p=0.012, 2-hour post prandial glucose (PC), p=0.025) and LDL cholesterol (p=0.008) compared to baseline. Achievement of HbA1c (p<0.001) and LDL cholesterol goals (p=0.017) significantly increased in the intervention group after 12 months of QTW use, but not in the control group. All ABC goals were achieved by 21.2% (7/34) in the intervention group and 12.5% (5/43) in the control group.
Conclusion: Use of quantified tableware, a low-cost nutritional intervention for 12 months improved AC, PC, HbA1c and LDL cholesterol levels in T2DM patients. This suggests that portion control should be encouraged in T2DM patients to achieve glycemic targets.

Supported by: Taiwan Association of diabetes Educators (TADE).
Disclosure: C. Leung: Grants; Grant from Taiwan Association of diabetes Educators (TADE).
611
Higher habitual intake of dietary dicarbonyls is associated with higher concentrations of plasma dicarbonyls and with skin autofluorescence: The Maastricht study
K. Maasen1,2, J.L.J. Scheijen1,2, S.J.P. Eussen2,3, C.J.H. van der Kallen1,2, P.C. Dagnelie1,2, C.D.A. Stehouwer1,2, M.M. van Greevenbroek1,2, C.G. Schalkwijk1,2;
1General Internal Medicine, Maastricht University, Maastricht, 2Cardiovascular Research Institute Maastricht (CARIM), Maastricht University, Maastricht, 3Epidemiology, Maastricht University, Maastricht, Netherlands.
Background and aims: Dicarbonyls are highly reactive sugar-derived compounds, and major precursors of advanced glycation endproducts (AGEs). Both dicarbonyls and AGEs are associated with the development of diabetic complications. Dicarbonyls are formed endogenously but also during food processing. We composed a novel dicarbonyl database that consists of a wide selection of foods and drinks that are commonly consumed in a Western diet. In this study, we evaluated the association of habitual intake of dicarbonyls with concentrations of dicarbonyls and AGEs in the body, in a large human cohort.
Materials and methods: The dicarbonyls methylglyoxal (MGO), glyoxal (GO), and 3-deoxyglucosone (3-DG) were quantified in 223 foods and drinks with ultra-performance liquid-chromatography tandem mass spectrometry (UPLC-MS/MS). Dicarbonyl intake was estimated by combining this database with a Food Frequency Questionnaire. Subsequent analyses were performed in a human observational cohort (The Maastricht Study, n=2652, 60±8 years, 26% Type 2 Diabetes [oversampled]). Dicarbonyls were measured in fasting plasma by UPLC-MS/MS. Skin autofluorescence (SAF), an estimate of tissue AGEs, was measured using the AGE-reader. Cross-sectional associations of dicarbonyl intake (main independent variable) with plasma dicarbonyls or SAF (dependent variables, ln-transformed) were assessed by linear regression analyses (all standardized). Models were adjusted for sex, age, glucose metabolism status, eGFR, history of cardiovascular disease, BMI, smoking, alcohol intake, activity, medication, education, and energy intake.
Results: Dietary intake of MGO and GO was positively associated with their respective plasma concentrations in fully adjusted models (standardized β=0.10, 95%CI [0.04; 0.15], p<0.001, β=0.10 [0.04; 0.16], p=0.001). Moreover, dietary intake of MGO and 3-DG was positively associated with SAF (β=0.11 [0.08; 0.16], p<0.001 and β=0.07 [0.06; 0.16], p=0.001). These associations did not change after additional adjustment for individual macronutrients and the Dutch Healthy Diet Index.
Conclusion: Higher dicarbonyl concentrations in plasma and AGE accumulation in tissue were observed in individuals who had a higher consumption of dicarbonyls in their habitual diet. These data suggest that food-derived dicarbonyls might be associated with the development of diabetic complications via their contribution to plasma and tissue-AGEs. This will be explored in further studies.
Supported by: NVWA
Disclosure: K. Maasen: None.
612
Effects of whey protein and glucose intake on glycaemia and energy intake in older men
A.K. Oberoi, C. Giezenaar, R.S. Rigda, K. Lange, K.L. Jones, I. Chapman, S. Soenen;
Adelaide Medical School, CRE in Translating Nutritional Science to Good Health, The University of Ad, University of Adelaide, Adelaide, Australia.
Background and aims: A strategy to reduce the glycaemic response to oral carbohydrate in younger adults with type 2 diabetes (T2D) is to combine carbohydrate with whey protein; oral ingestion of 50g protein with 50g glucose by non-elderly adults with T2D increases insulin and reduces blood glucose concentrations (by 34%) compared to oral glucose alone. It is not clear whether this strategy works in older adults with or without T2D. The aim of the study is to determine the impact of age and the presence of T2D on the acute effects of whey protein and glucose intake, alone or combined, on blood glucose concentrations and subsequent ad libitum energy intake in younger and older men, with and without T2D. The study is in progress. Results for older men without T2D are presented.
Materials and methods: In randomized, double-blind order, after an overnight fast, 10 older healthy men (age 78±2yrs; body mass index 26.3±0.4kg/m²) ingested drinks containing either (i)control (2kcal), (ii)30g/120kcal protein, (iii)30g/120kcal glucose, (iv)30g protein plus 30g glucose(240kcal) on separate study days. Blood glucose concentrations were assessed by the glucose oxidase method (t=0-180min), and energy intake at a buffet-style meal (t=180min) was determined. Data were analyzed using repeated-measures ANOVA with Bonferroni correction with P<0.05 indicating significance.
Results: Blood glucose concentrations were not affected by the ingestion of either control or protein alone. Glucose concentrations were higher following glucose or protein plus glucose vs. control or protein intake alone (P<0.01), and glucose vs. protein plus glucose (P<0.01) (AUC0-180: control 1057±96mmol/L, protein 960±27mmol/L, glucose 1156±44mmol/L, protein plus glucose 1092±37mmol/L). Following glucose intake, the glucose concentrations increased rapidly from fasting values to a peak of 9±0.29mmol/L by 45min and decreased to baseline at 120min. When glucose and protein were co-administered, the glucose concentrations peaked at 7.4±0.35mmol/L at 45min, significantly lower than after glucose intake alone (P<0.01, drink by time interaction at 30, 45 and 60min P<0.01), and returned to baseline by 180min (Fig 1). There was no difference in ad libitum energy intake following the test drinks (control 1057±95kcal, protein 1063±111kcal, glucose 1080±104kcal, glucose plus protein 1084±84kcal, P=0.89).
Conclusion: Our data suggest that whey-protein-glucose co-ingestion by older men without T2D leads to substantially reduced increases in blood glucose concentrations (30-50%) compared to glucose ingestion alone. We hypothesize that this difference could be due to a more than additive increase in circulating plasma insulin concentrations after whey-protein-glucose co-administration (insulin under analysis). This suggests that moderately high whey protein intake together with carbohydrate might improve postprandial glycaemia in older people with T2D. Figure 1

Clinical Trial Registration Number: ACTRN12619000420145
Supported by: Diabetes Australia
Disclosure: A.K. Oberoi: Grants; Diabetes Australia.
613
Loss of the differential response of glucose and glucose responsive hormones with food temperature in type 2 diabetes
Y. Hu, P. Zhang, J.-H. Ma;
Nanjing First Hospital, Nanjing, China.
Background and aims: Eating behavior is a major factor in type 2 diabetes. We investigated the different responses of glucose-regulating hormones to cold and hot glucose solutions in normal subjects and patients with type 2 diabetes.
Materials and methods: Normal subjects (N=27) and patients with type 2 diabetes (N=31) were recruited and randomly assigned to a hot (50°C) or a cold (8°C) oral glucose tolerance test (OGTT). The subsequent day, they were switched to the OGTT at the other temperature. Blood glucose, insulin, glucagon, glucagon like peptide-1 (GLP-1) and cortisol were measured at 0, 5, 10, 30, 60 and 120 min during each OGTT. After the hot OGTT, all subjects ingested hot (> 42°C) food and water for that day, and ingested food and water at room temperature (≤24°C) for the day after cold OGTT. All participants had continuous glucose monitoring (CGM) throughout the study.
Results: The incremental blood glucose levels were lower with cold OGTT compared with hot OGTT in both groups (p =0.018 and 0.004, respectively). However, GLP-1 levels were lower in cold OGTT than in hot OGTT only in normal subjects (p =0.013). Hot food compared to cold food was associated with higher 24 hour mean glucose level and standard deviation measured by CGM (both p <0.05) only in normal subjects. These differences were absent in patients with type 2 diabetes (p all >0.05).
Conclusion: Food temperature is an important factor in glucose absorption and GLP-1 response. These food temperature elicited differences are lost in type 2 diabetes.

Clinical Trial Registration Number: ChiCTR-OOC-17011643
Disclosure: Y. Hu: None.
614
Reduced carbohydrate and increased protein and fat in the diet augment the positive effect of weight loss on glucose control in type 2 diabetes patients
M.N. Thomsen1, M.J. Skytte1, A. Samkani1, M.H. Carl1, P. Weber1, A. Astrup2, T.M. Larsen2, J. Frystyk3, J.J. Holst4, B. Hartmann4, H. Thomsen5, E. Chabanova1, S. Madsbad6, S.B. Haugaard1,7, T. Krarup1;
1Dept. of Endocrinology, Copenhagen University Hospital Bispebjerg, Copenhagen, 2Dept. of Nutrition, Exercise and Sports, University of Copenhagen, Copenhagen, 3Dept. of Endocrinology, Odense University Hospital, Odense, 4NNF Center for Basic Metabolic Research, and Dept. of Biomedical Sciences, University of Copenhagen, Copenhagen, 5Dept. of Radiology, Copenhagen University Hospital Herlev, Copenhagen, 6Dept. of Endocrinology, Copenhagen University Hospital Amager Hvidovre, Copenhagen, 7Dept. of Internal Medicine, Copenhagen University Hospital Amager Hvidovre, Copenhagen, Denmark.
Background and aims: We hypothesised that dietary carbohydrate reduction will add to the effect of a diet-induced 6% body-weight loss on glycaemic control and hepatic fat content in patients with type 2 diabetes (T2D).
Materials and methods: Of planned 80 participants, 44 persons of mean HbA1c 56.4 mmol/mol and 9 years of T2D were randomised 1:1 for 6-weeks full food provision, a hypo-caloric carbohydrate-reduced high-protein (CRHP) or a conventional diabetes (CD) diet (carbohydrate 30E%/50E%, protein 30E%/17E% and fat 40E%/33E%). Body-weight loss was aimed at 6% and reinforced bi-weekly by adjustment of hypo-caloric diets. Hepatic fat content was estimated by Magnetic Resonance (MR) spectroscopy and analysed by a MR research technician, blinded to the protocol.
Results: Six weeks of a hypo-caloric CRHP diet compared with a CD diet improved HbA1c (mean±SD) by further 2 mmol/mol (-8.7±4.6 mmol/mol vs -6.7±3.9 mmol/mol, p=0.04) with comparable losses of body-weight, 5.5±1.7 kg (5.6 %) and 5.6±2.2 kg (5.9 %), respectively. Hepatic fat content (median (IQR) was reduced significantly while consuming the CRHP diet (5.2% (1.3-6.9)) and CD diet (2.6% (1.6-6.5)), but with no difference between diets (p=0.40). Linear mixed-effects models including fixed effects for each time-point, a diet group by time-point interaction and changes in body-weight were used to assess between-group differences.
Conclusion: Reducing carbohydrate and increasing protein and fat adds clinical relevance to the positive effects of body-weight loss on glucose control in T2D patients.

Clinical Trial Registration Number: NCT03814694
Supported by: Danish Dairy Research Foundation, Arla Food for Health
Disclosure: M.N. Thomsen: None.
615
Effects of Lactobacillus GG supplementation in type 2 diabetes: Are mucin genes expressions important?
B. Eliuz Tipici1, E. Coskunpinar2,3, D. Altunkanat3, P. Cagatay4, B. Omer5, S. Palanduz3, I. Satman1,6, F. Aral1;
1Endocrinology and Metabolic Diseases, Department of Internal Medicine, Faculty of Medicine, Istanbul University, Istanbul, 2Department of Medical Biology, Faculty of Medicine, University of Health Sciences, Istanbul, 3Division of Medical Genetics, Faculty of Medicine, Istanbul University, Istanbul, 4High School of Health Care Professions Biostatistics, Istanbul University - Cerrahpasa, Istanbul, 5Department of Biochemistry, Faculty of Medicine, Istanbul University, Istanbul, 6The Institute for Public Health and Chronic Diseases, The Health Institutes of Turkey, Istanbul, Turkey.
Background and aims: Recent studies indicate that dysbiosis of gut microbiota and low grade inflammation are important pathogenic determinants of type 2 diabetes (T2DM). Probiotics have been used in T2DM for the modification of intestinal microbiota and anti-inflammatory effects. This study was designed to determine the effects of Lactobacillus GG (LGG) on glycemic control, lipid profile, inflammation parameters and expression of certain genes linked to T2DM.
Materials and methods: This placebo-controlled clinical trial included 34 women with T2DM aged 30-60 years who were followed in Diabetes Outpatient Clinic, Istanbul Faculty of Medicine. Subjects were randomly assigned to take either probiotic (1x10¹⁰ cfu LGG) or placebo for 8 weeks. Fasting blood samples were taken at baseline and post-treatment to measure glycemic and lipid profile, and biomarkers of inflammation. TLR2, TLR4, MUC2 and MUC3A genes expressions were investigated on stool samples at baseline and post-treatment. 3-day food records were taken at 4th and 8th weeks.
Results: There was no significant difference in daily energy intake between placebo and probiotic groups during the study; however daily fat intake, body weight, BMI, percent body fat and mass in the probiotic group were significantly decreased (p<0.05). Fasting blood glucose was significantly decreased in both groups (p<0.05), but there was no difference between the groups. HbA1c was insignificantly decreased in both groups. Fructosamine and insulin did not change in the probiotic group. Total and LDL-cholesterol levels reduced in both groups, but only total cholesterol was significant in the probiotic group (p<0.05). CRP and IL-6 did not change in both groups. In the probiotic group, expressions of MUC2 and MUC3A increased significantly (p<0.05), while the increase in TLR2 expression was not significant, and TLR4 expression levels did not change.
Conclusion: In our study, we investigated the effects of a single probiotic strain for 8 weeks in T2DM. However, there was no direct effect on the glycemic profile, LGG supplementation could be beneficial in T2DM due to inducing weight loss and increasing the expression of MUC2 and MUC3A (mucin) genes which are involved in maintaining the intestinal barrier. Before we generalize our results large, randomized-controlled prospective trials are needed to evaluate the effects of probiotics (especially LGG) in T2DM.

Supported by: Research Fund of Istanbul University
Disclosure: B. Eliuz Tipici: None.
616
Adaptive insuline and glucose metabolism upon prolonged fasting in non-obese but not in obese individuals
N.J. Tripolt1, P.N. Pferschy1, A. Obermayer1, H. Kojzar1, B. Obermayer1, M. Zanker1, C. Sourij1, T.R. Pieber1, O. Moser1, M.L. Eckstein1, R. Riedl2, H. Sourij1;
1Division for Endocrinology and Metabolism, Medical University Graz, Graz, 2Institute for Medical Informatics, Statistics and Documentation, Medical University of Graz, Graz, Austria.
Background and aims: Metabolic regulation of glucose and insulin secretion can be altered by fasting periods. The aim of our study was to examine the glucose and insulin metabolism after an overnight fast (12 hours) as well as after prolonged fasting (36 hours of fasting) in non-obese people, people with obesity and people with type 2 diabetes (T2DM).
Materials and methods: Glucose metabolism was assessed by a 75 g oral glucose tolerance test after 12 and 36 hours fasting, respectively. Area under the curve (AUC) was calculated according to the trapezoidal rule. Insulin sensitivity was estimated by using QUICKI and HOMA-IR.
Results: In total 60 participants (age 43±16 years, 38% women) were included. Fasting levels of glucose, insulin and c-peptide were significantly lower in all cohorts after 36 hours vs. 12 hours of fasting (p<0.05). However, in non-obese people mean 2h-glucose level was significant higher after prolonged fasting [108.7±31.0 mg/dL vs 79.4±18.4mg/dL after 12h fasting; p<0.05] with significantly lower 30 minutes insulin levels following prolonged fasting, while within the two other cohorts no change in this 2h-glucose was observed. Indices of insulin sensitivity improved in all groups after prolonged fasting.
Conclusion: Our data demonstrate reduced fasting glucose and insulin levels after 36 hours of fasting in healthy, obese and people with T2DM. In healthy people, the early insulin response was reduced and postprandial glucose levels increased after 36 hours of fasting as compared to 12 hours.

Clinical Trial Registration Number: DRKS00016148
Disclosure: N.J. Tripolt: None.
617
Effects of a six-month low-carbohydrate diet in patients with type 2 diabetes on glycaemic control, body composition and cardiovascular risk factors
E.M. Gram-Kampmann1, C.D. Hansen2, M.B. Hugger2, J.M. Jensen2, J.C. Brønd3, P. Hermann4, M.H. Olsen5, A. Krag2, H. Beck-Nielsen1, K. Højlund1;
1Steno Diabetes Center Odense (SDCO), Odense, 2Department of Gastroenterology and Hepatology, Odense, 3Department of Sport Science and Clinical Biomechanics, Odense, 4Department of Endocrinology, Odense, 5Department of Internal Medicine, Holbæk, Denmark.
Background and aims: Carbohydrate restricted diets have shown variable effects on glycemic control, weight and cardiovascular risk factors in patients with type 2 diabetes (T2D). However, there is evidence that the greater the carbohydrate restriction, the greater glucose lowering effect. The aim of this study was to determine the effect and safety of an isocaloric low-carbohydrate diet (LCD) feasible in clinical practice on glycemic control, body composition, and cardiovascular risk factors in patients with T2D maintaining their non-insulin antidiabetic medication and physical activity level.
Materials and methods: 71 patients with T2D were randomized 2:1 to either a LCD with a maximum of 20 % of energy (E%) from carbohydrates and minimum 50 % from fat (LCD group; n=49) or a standard diabetes care diet (placebo group, n=22). To avoid hypoglycemia insulin dose was reduced by 20% in insulin-treated patients (n=2) randomized to LCD. Examinations at enrollment and after 3 and 6 months included blood sample analyses, anthropometrics, blood pressure, accelerometer-based physical activity and online food diaries. Fat mass and fat free mass were determined by DEXA-scan before and after intervention. Longitudinal data was analyzed in a linear mixed model and the placebo-controlled mean-effect-of-intervention (beta-coefficient and SE) is reported.
Results: The LCD group decreased carbohydrate intake from 42 to 13 E%, and increased fat intake from 38 to 63 E% corresponding to placebo-controlled changes of -30±7 E% and 29±3 E%, respectively (all p<0.001). From an average of 54.3±1.4 mmol/mol, HbA1c showed a placebo-controlled decline in the LCD group after 3 months (-8.9±1.7 mmol/mol; p<0.001), which was maintained after 6 months (-7.5±1.8 mmol/mol; p<0.001). After both 3 and 6 months LCD caused a placebo-controlled reduction in BMI and waist (all p<0.01), and this was accompanied by a reduction in total fat mass after six months (-2.2±1.0 kg, p=0.027). Lean body mass was unaffected (-0.9±0.9 kg; p=0.32). No changes in cholesterols, triglycerides or blood pressure were seen after 6 months. Level of physical activity was maintained, and there were no episodes of severe hypoglycemia.
Conclusion: An isocaloric LCD high in fat has sustained beneficial effects on glycemic control and body composition, but does not seem to affect cardiovascular risk factors in patients with type 2 diabetes. Maintaining the level of physical activity and non-insulin antidiabetic medication was safe.
Clinical Trial Registration Number: NCT03068078
Supported by: Novo Nordisk Foundation, Danish Diabetes Academy, Region of Southern Denmark, A.P. Møller
Disclosure: E.M. Gram-Kampmann: None.
PS 50 Oral therapies: metformin, sensitizers and other non-secretagogues
618
The interaction between metformin and physical activity
N.S. Pilmark1, M. Lyngbæk1, L. Oberholzer1, I. Elkjær1, C. Petersen-Bønding1, K. Kofoed1, C. Siebenmann1,2, K. Kellenberger1,3, G.V. Hall4, J. Abildgaard1,5, C.A. Lauridsen6, M. Ried-Larsen1, B.K. Pedersen1, K.B. Hansen1,7, K. Karstoft1,8;
17641 Rigshospitalet, Centre for Physical Activity Research (CFAS), Copenhagen, Denmark, 2EURAC Research, Institute of Mountain Emergency Medicine, Bolzano, Italy, 3Section for Elite Sport, Swiss Federal Institute, Magglingen, Switzerland, 4Faculty of Health and Medical Science, Biomedical Science, Copenhagen, Denmark, 5Department of Growth and Reproduction, Rigshospitalet, Copenhagen, Denmark, 6Department of Diagnostic Radiology, Rigshospitalet, Copenhagen, Denmark, 7Steno Diabetes Center Copenhagen, Gentofte, Denmark, 8Department of Clinical Pharmacology, Bispebjerg hospital, Copenhagen, Denmark.
Background and aims: To assess the interaction between metformin and exercise training on postprandial glycemic control in individuals with glucose intolerance.
Materials and methods: Glucose-intolerant individuals (2-hour oral glucose tolerance test glucose of 7.8-11.0 mmol/l and/or HbA1c of 5.7-6.5% (39-47 mmol/mol) or glucose-lowering-medication naïve type 2 diabetes) were randomly allocated to placebo (PLA, n=15) or metformin (MET, n=14), and underwent 3 experimental days: BASELINE - before randomization, MEDICATION - after 3 weeks of metformin (2 g/day) or placebo treatment, and TRAINING - after 12 weeks of exercise training in combination with MET/PLA treatment. Training consisted of supervised bicycle interval sessions at ~64% of Wattmax for 45 minutes, 4 times/week. Glycemic control (mean glucose concentration) during a mixed meal tolerance test (MMTT) was assessed at each experimental day. For within-group differences, a group x time interaction was assessed using 2-way repeated measures analysis of variance. Between-group changes of the outcomes at different time points were compared using unpaired two-tailed Students t-tests.
Results: Glycemic control improved from BASELINE to TRAINING in both PLA and MET (∆PLA: -0.7[-1.4;-0.0] mmol/l, P=0.05 and ∆MET: -0.7[-1.5;-0.0] mmol/l, P=0.03), with no between-group difference (P=0.92). In PLA, the entire reduction was seen from MEDICATION to TRAINING (-0.8[-1.3;-0.1] mmol/l, P=0.01). Conversely, in MET, the entire reduction was seen from BASELINE to MEDICATION (-0.9[-1.6;-0.2] mmol/l, P=0.01) (figure). The reductions in mean glucose concentrations during the MMTT from BASELINE to TRAINING were dependent on differential time effects: In PLA, a decrease was observed at t=120 min (P=0.009), whereas in MET, a reduction occurred at t=30 minutes (P<0.001). VO2peak increased 15% (4.6 [3.3;5.9] ml/kg/min P<0.0001) from MEDICATION to TRAINING and body weight decreased (4.0 [-5.2;-2.7] kg, P<0.0001) from BASELINE to TRAINING, with no between-group differences (P=0.7 and P=0.5, respectively).
Conclusion: Metformin and exercise training results in comparable improvements in postprandial glycemic control compared to exercise training alone. The differential time effects during the MMTT suggest an interaction between the two modalities.

Clinical Trial Registration Number: NCT03316690
Supported by: No conflict of interest was reported. CFAS is supported by a grant from Trygfonden
Disclosure: N.S. Pilmark: None.
619
Effects of 1 year treatment with pioglitazione vs sulfonylurea on lipid metabolism in type 2 diabetes patients
M. Russo1,2, F. Carli1, M. Vitale3, M. Masulli3, L. Bozzetto3, G. Della Pepa3, S. Pezzica1, O. Vaccaro3, A. Rivellese3, A. Gastaldelli1;
1Institute of Clinical Physiology CNR, Pisa, 2University Of Siena, Siena, 3University of Naples Federico II, Napoli, Italy.
Background and aims: The PPAR gamma agonist pioglitazone (PIO) is the most suitable treatment to reduce lipotoxicity and glucotoxicity since significantly reduces hyperglycaemia and peripheral lipolysis promoting the increase of subcutaneous adipose tissue but significantly reducing visceral fat and liver steatosis. However, the effects of PIO vs sulphonylurea (SUL) on adipose tissue insulin resistance and lipid metabolism have been poorly studied. Accordingly, in a subset of subjects with type 2 diabetes from the TOSCA multicentre study, we evaluated the metabolic effects of chronic PIO vs SUL treatment in patients with inadequate response to metformin (MET) treatment.
Materials and methods: We studied 195 patients (aged 62 ± 6, 108M / 87F) enrolled in the Napoli center who were randomized with PIO+MET (15-45 mg, n = 98) or SUL+MET (5-15 mg glibenclamide, 2-6 mg glimepiride or 30-120 mg gliclazide, n = 97) at baseline and after 1 year. In all subjects we evaluated the effect of treatment on fasting blood glucose, HbA1c, insulin, liver enzymes (AST, ALT and GGT), lipid profile (total triglycerides, total cholesterol, LDL and HDL, non-esterified fatty acids, FFA), FFA composition (myristic, palmitoleic, palmitic, linoleic, oleic, stearic and arachidonic) through GCMS and in a subgroup of 65 patients triglyceride composition through LCMS lipidomics. Moreover, we assessed the effects of treatments on insulin resistance indices (HOMA-IR = GluxIns / 22.5 and Adipo-IR = FFAxIns).
Results: Although both treatments improved fasting glucose and HbA1c (p≤0.001), only patients treated with PIO+MET had an improvement in the lipid profile with a significant decrease in TG (-8.9%, p≤0.01 vs baseline) and FFA (-10.6%, p≤0.05 towards baseline), and an increase in HDL (+ 7.3%, p≤0.001), despite the slight increase in weight in both groups (+ 1.00kg PIO,+1.28kg SUL). FFA composition (saturated/unsaturated) was not modified by the treatments (p = ns vs baseline). TG composition showed a significant decrease in PIO+MET in TG concentrations (-56.273±21.936) containing from 0 to 3 double bonds, i.e. mainly saturated fatty acids, as well as the TG containing 4 to 11 double bonds (-25.971±15.979), i.e. mainly unsaturated fatty acids. The decrease in Adipo-IR (-16.3%) and HOMA-IR (-15.6%) was observed only in the PIO+MET group, while in subjects treated with SUL+MET IR tended to increase (+ 6.9% and+19.4% respectively, p = ns). Concentrations of liver enzymes (ALT and GGT) decreased only in the PIO+MET group.
Conclusion: The PIO+MET treatment showed an improvement in the lipid and liver profile, associated with the improvement of other metabolic parameters mainly of the Adipo-IR and HOMA-IR.
Disclosure: M. Russo: None.
620
Real-world evidence in patients with type 2 diabetes treated with gliclazide XR 60 mg during fasting in India: an analysis from the global DIA-RAMADAN study
S. Shaikh1, S. Dhand2, S. Bhattacharyya3, K. Modi4, S. Moazam5, S. Kolke6, Y. Kadam7, S. Ahmad8, T. Sivagnanam9, K. Kundan10;
1Saifee Hospital, Mumbai, 2Dhand Diabetes Clinic, Jaipur, 3Apollo Clinic, Kolkata, 4Dr. Modi’s Clinic, Hyderabad, 5Sunshine Hospital, Hyderabad, 6Dr. Kolke's Clinic, Mumbai, 7Poona Diabetes Centre, Pune, 8District Hospital, Allahabad, 9Kovai Medical Center and Hospital, Coimbatore, 10Janki Diabetes Care Center, Patna, India.
Background and aims: DIA-RAMADAN, a prospective, observational, international study that assessed the real-world safety and effectiveness of gliclazide XR 60 mg in patients with type 2 diabetes (T2D) fasting during Ramadan. The aim of the present sub-analysis was to explore the safety & effectiveness of gliclazide XR 60 mg in India
Materials and methods: DIA-RAMADAN enrolled 1214 patients in 9 countries (Bangladesh, Egypt, India, Indonesia, Kuwait, Malaysia, Pakistan, Saudi Arabia & United Arab Emirates). Adults with T2D willing to fast during Ramadan, with HbA1C<9%, already treated with gliclazide XR 60 mg for at least 90 days prior to enrolment were included. Baseline visit, conducted 6-8 weeks before Ramadan, & end-of-study visit 4-6 weeks after Ramadan. Study outcomes - proportion of patients reporting ≥1 symptomatic hypoglycemic events, changes in HbA1c, fasting plasma glucose (FPG), body weight & safety. A patient diary was provided to the patient at the beginning of the study for collecting dietary change, treatment details, hypoglycemia & adverse events during Ramadan.
Results: 246 Indian patients were enrolled in the study. Mean age was 53.0 years, mean duration of diabetes 5.8 years and 112 (45.5%) were women. 194 patients (78.9%) were at moderate/low risk as defined by IDF-DAR guidelines. At baseline, mean HbA1c was 7.3±0.8%; 69% of the patients were on gliclazide XR 60 mg monotherapy, 22% on gliclazide XR 60 mg + metformin & 9.3% on gliclazide XR 60 mg + other antidiabetic with/without metformin. Patients observed fast for 29.1±1.7 days, & for 13.9±1.9 hours/day. Gliclazide XR 60 mg treatment was received as per the prescription by 240 (97.6%) patients during Ramadan with 99.9% patients adhering to the treatment. Mean HbA1c decreased from 7.3±0.8% at baseline to 6.9±0.8% (mean reduction: -0.5%±0.8%, p<0.001). The HbA1c reduction was consistent among the various age groups (<50 years: -0.4%; ≥50 to <65 years: -0.5%; ≥65 years: -0.6%; p<0.05 for all comparisons, Table 1). Similarly, FPG decreased from 142.7±53 mg/dL at baseline to 122.3±29 mg/dL (mean difference: -21.8±59.4 mg/dL, p<0.001). No patient experienced any hypoglycemic event. The mean change in body weight was -0.3±3.7kg (p<0.001) pre- to post-Ramadan.
Conclusion: These real-world study results indicate that gliclazide XR 60 mg based treatment significantly reduced HbA1c, FPG & weight in patients observing Ramadan fast, with no reported hypoglycemic event, suggesting that Indian patients with T2D on gliclazide XR 60 mg can safely fast while maintaining optimal glycemic control during Ramadan

Clinical Trial Registration Number: NCT04132934
Supported by: SERVIER AFFAIRES MEDICALES
Disclosure: S. Shaikh: None.
621
Totum-63, a plant-based active principle, lowers fasting glycaemia in subjects with impaired fasting glycaemia and glucose intolerance: a phase IIA clinical trial
J.-M. Bard1, V. Chavanelle2, Y. Otero2, M. Bargetto2, M. Cazaubiel2, B. Pereira3, P. Sirvent2, S. Peltier2;
1Université de Nantes, Nantes, 2Valbiotis, Périgny, 3CHU Clermont Ferrand, Clermont-Ferrand, France.
Background and aims: Over 1 billion people worldwide live with prediabetes, which is defined by increased fasting blood glucose (FBG), glucose intolerance and/or higher A1c hemoglobin. Prediabetes is considered a risk factor for type 2 diabetes (T2D). We have developed Totum-63, a plant-based product designed to reduce T2D risk factors. Preclinical studies showed an improvement of glucose homeostasis in various models of obesity and type 2 diabetes. In a phase I/II clinical trial, Totum-63 had shown its safety, good tolerance and beneficial effects on post-prandial glucose control in overweight individuals. The aim of this phase IIA clinical trial was to assess the effects of Totum-63 on glucose homeostasis in individuals with impaired fasting glycemia and glucose intolerance.
Materials and methods: This multicentre, randomised and double-blind placebo-controlled phase IIA trial was reviewed by the Local Ethics Committee and was performed in accordance with the ethical standards laid down in the Helsinki Declaration. The main outcome was to show the efficacy of Totum-63 in reducing fasting blood glucose. Secondary endpoints included blood glucose change following an oral glucose tolerance test (OGTT) and anthropometric parameters. Main inclusion criteria were: abdominal obesity (waist circumference > 94 cm for men or > 80 cm for women), impaired fasting glycemia (FBG ≥ 110 mg/dl) and glucose intolerance (2h OGTT glycemia ≥ 140 mg/dl). Main exclusion criteria were: glucose-lowering drug and any medication which could affect glucose homeostasis parameters. 51 volunteers (35 females, 16 males; age: 57.1 ± 10.2 years; body mass index: 31.3 ± 5.3 kg/m2; FBG: 126 ± 17mg/dl; HbA1c: 6.0 ± 0.6%) received Totum-63 (5g/day) or placebo for 6 months.
Results: Totum-63 was very well tolerated and no change was observed in safety parameters (blood cell count, renal function, hepatic function, hemodynamics). At the end of the supplementation period, FBG was reduced in Totum-63 group compared to placebo group (placebo-corrected difference from baseline: -9.3%, p<0.05). Similarly, 2-hour OGTT glycemia was improved in Totum-63 group, vs placebo (placebo-corrected difference from pre-protocol value: -22.5%, p<0.05). Moreover, Totum-63 had a significant lowering effect on body weight (placebo-corrected difference from baseline: -1.9 Kg; p<0.05) and waist circumference (-4.5 cm; p<0.001).
Conclusion: To conclude, Totum-63 showed a good safety profile. The primary endpoint of this clinical trial was reached, Totum-63 contributed to lower FBG in individuals with impaired fasting glycemia and glucose intolerance. Moreover, the response to an OGTT was improved, as well as body weight and waist circumference. This study opens the door to larger trials and makes Totum-63 a promising candidate for T2D risk prevention.
Clinical Trial Registration Number: NCT02868177
Disclosure: J. Bard: None.
622
The impact of metformin and levothyroxine on gut microbiota of type 2 diabetic patients with hypothyroidism
K.A. Moskva1, O.P. Kikhtyak1, L.Y. Lapovets2;
1Department of Endocrinology, Danylo Halytsky Lviv State Medical University, Lviv, 2Department of Clinical Laboratory Diagnostics, FPGE, Danylo Halytsky Lviv State Medical University, Lviv, Ukraine.
Background and aims: It is known that type 2 diabetes (T2D) and/or hypothyroidism in humans is linked to the composition of gut microbiota. The aim of this study was to evaluate Bacteroidetes, Actinobacteria and Firmicutes/Bacteroidetes ratio in naïve type 2 diabetic patients with hypothyroidism before and after treatment.
Materials and methods: 19 women and 8 men with overt hypothyroidism and diabetes were included in the study. They received levothyroxine and metformin for the next four months. We collected stool samples (microbiota were analyzed by amplicon sequencing) and additionally analyzed the following data: TSH, free T3 (fT3), free T4 (fT4), fasting glucose, fasting insulin, HOMA-IR, HbA1c.
Results: Treatment results show that all patients reached euthyroidism due to a significant decrease of TSH level in comparison with baseline (2.47±0.12 vs. 13.22±0.31 μIU/ml, p<0.001). The significant difference of fT3 and fT4levels were also observed (3.42±0.08 vs. 1.32±0.05 pg/ml, P<0.001 and 1.77±0.08 vs. 0.53±0.04 ng/dl, P<0.001 respectively). HbA1c decreased after treatment from 7.48±0.24 to 6.31±0.19, P<0.05. The significant change in glucose (from 8.15±0.31 to 6.9±0.23 mmol/l (P<0.05) and insulin (from 15.70±0.83 to 12.58±0.69 μIU/ml (P<0.05) were established. HOMA-IR improved from 5.64±0.36 to 3.9±0.22 (P<0.05) after treatment. The number of Bacteroidetes increased from 41,65±2.38 to 56,85±3.18 % and the number of Actinobacteria - from 2,82±0.21 to 4,32±0.38 %. Our data showed also significantly decreased level of Firmicutes/Bacteroidetes ratio from 1,02±0.06 to 0,81±0.04 after treatment.
Conclusion: To our knowledge, it was discovered for the first time that metformin and levothyroxine administration affects the composition of intestinal microbiota by decreasing Firmicutes/Bacteroidetes ratio and increasing number of Bacteroidetes and Actinobacteria. These findings suggest that the intestinal microbiota composition differs markedly following appropriate treatment and may serve additional option of metabolic improvement.
Disclosure: K.A. Moskva: None.
623
Totum-63: a new promising approach for the management of obesity and risk reduction for developing type 2 diabetes
V. Chavanelle1, Y. Otero1, D. Ripoche1, C. Langhi1, M. Bargetto1, F. Le Joubioux1, B. Guigas2, N. Boisseau3, T. Maugard4, G. Pickering5, M. Cazaubiel1, S. Peltier1, P. Sirvent1;
1Valbiotis, Périgny, France, 2Department of Parasitology, Leiden University Medical Center, Leiden, Netherlands, 3AME2P, Clermont-Ferrand, France, 4LIENSs UMR CNRS 7266, La Rochelle, France, 5CHU Clermont Ferrand, Clermont-Ferrand, France.
Background and aims: Global prevalence of diabetes was estimated at 463 million people in 2019 and is projected to reach 700 million by 2045. We have developed Totum-63 (T63), a plant-based active principle to reduce the risk of developing type 2 diabetes (T2D). We assessed the effects of T63 in 2 rodent models of obesity and T2D. A phase I/II open clinical trial was also conducted in overweight individuals.
Materials and methods: Male db/db mice were fed for 6 weeks either a control diet or the same diet supplemented with 2.7% T63. Male C57BL6 mice were fed a High-Fat-Diet (HFD) with or without T63 supplementation (2,7%) for 16 weeks. A first Phase I/II open clinical trial was also conducted with 14 overweight (BMI: 27.7±1.9 kg/cm2) male individuals. The clinical study included an initial period of supplementation with 2.5g/day for 4 weeks followed by a 2-week wash-out period, then 4 weeks with 5g/day supplementation. Usual safety parameters were assessed at all visits. Glycemia and insulinemia were also monitored for 2h after a standardized breakfast before and after the 5g/day supplementation period.
Results: In db/db mice, T63 supplementation for 6 weeks reduced fat mass (-22%, p<0.0001) and body weight gain (-15%, p<0.001), while preventing the rise in fasting glycemia (-32%, p<0.0001). In HFD-fed mice, 16 weeks of T63 supplementation also reduced weight gain (-23%, p<0.001), total adiposity (-48%, p<0.0001) and HOMA-IR index (-52%, p<0.05). In HFD-fed mice, T63 supplementation lowered insulin during oral glucose tolerance test (p<0.05) and improved steady-state glucose infusion rate during hyperinsulinemic-euglycemic clamp (45.5±5.2 vs 29.8±4.1 mg/kg·min, p<0.05). In the inguinal fat, T63 restored the HFD-induced impairment in the insulin-stimulated phosphorylation of Akt (p<0.01). In the liver, T63 reduced macrovesicular steatosis and triglyceride content (-40%, p<0.001). This effect was associated with increased Pparδ (+314%, p<0.01) and reduced Pparγ (-64%, p<0.001) gene expression. Moreover, T63 also reduced the expression of several genes involved in hepatic lipid storage (Plin2: -40%, p<0.05; Fsp27: -90%, p<0.001; Fabp4: -52%, p<0.05). T63 also showed preventive effects on HFD-induced gut microbiota dysbiosis, assessed by 16S rRNA sequencing. In the phase I/II open clinical trial, the results did not show any detrimental effect in the various safety parameters with T63 for the two doses tested. Following the standardized breakfast, T63 decreased the maximal glycemia (p<0.01) and maximal insulinemia (p<0.05).
Conclusion: Our results showed that T63 decreases total adiposity and body weight gain and improves glucose homeostasis in two different mouse models of obesity: db/db mice and HFD-fed mice. Mechanisms involves pleiotropic effects in various tissues. In a first phase I/II open clinical study, T63 demonstrated a good safety in overweight subjects and showed a clear improvement of glucose and insulin responses to a standardized breakfast. Altogether, T63 is a promising new approach for the management of obesity and the prevention of T2D.
Clinical Trial Registration Number: NCT02790489
Disclosure: V. Chavanelle: Employment/Consultancy; Valbiotis employee.
624
Regional subanalyses of a real-world study in patients with type 2 diabetes treated with gliclazide modified-release during fasting: DIA-RAMADAN
M. Hassanein1, A. Durocher2, V. Cortese2;
1Endocrinology, Dubai Hospital, Dubai, United Arab Emirates, 2Global Medical Affairs, Servier, Suresnes, France.
Background and aims: DIA-RAMADAN was a prospective, observational, international study assessing the real-world safety and effectiveness of gliclazide modified release (MR) 60 mg in patients with type 2 diabetes (T2D) fasting during Ramadan. The present analysis aimed at comparing the safety and effectiveness of gliclazide MR 60 mg in different regions of the world.
Materials and methods: The study enrolled patients across 9 countries in 3 culturally diverse regions: R1 Indian sub-continent (India/Pakistan/Bangladesh); R2 Middle East (Egypt/Kuwait/UAE/Saudi Arabia); R3 South-East Asia (Indonesia/Malaysia). Data were collected before, during, and after Ramadan 2019. Main eligibility criteria were adult T2D patients treated at stable doses with gliclazide MR 60mg for >90 days prior to enrolment. Patients requiring insulin and HbA1c ≥9% were excluded. Primary endpoint was proportion of patients with ≥1 symptomatic hypoglycemia event (HE) during Ramadan. Secondary endpoints included proportion of patients with ≥1 confirmed HE (blood glucose ≤70mg/dL) during Ramadan, HbA1c, body weight and safety. Changes pre- to post-Ramadan were analysed using paired t-test or Wilcoxon test.
Results: In total 1214 patients were recruited; 564 (46.5%) in R1, 354 (29.1%) in R2, and 296 (24.4%) in R3. Gender and disease duration at baseline were similar in all regions. While mean age was comparable in the 3 regions, R1 had the highest proportion of patients <50 years: 42.7% vs 33.6% in R2 and only 16.2% in R3. R2 had higher mean weight and BMI, and a higher cardiovascular risk. Baseline glycemic control was poorer in R2 (34.2% HbA1c<7.5%; 39.8% HbA1c≥8 % and<9%) than in R1 (44.7% and 21.5%, respectively) and R3 (49.0% and 30.4%, respectively). Proportion of patients with very high-risk status according to IDF-DAR guidelines in R1, R2 and R3 was 0.2%, 13% and 0%, respectively. R3 had the highest rate of patients treated with 1 or 2 antidiabetic treatments (82%; 67% R1; 67% R2). Mean dose (±standard deviation) of gliclazide MR was higher in R2 (84±28.6 mg) vs R1 (69.8±24.9 mg) and R3 (69.9±24.8 mg). Globally, treatment adherence was high with a similar number of missed doses in the 3 regions. Average number of fasting days was similar in the 3 regions. Nutritional habits during Ramadan were different, with more carbohydrates consumed in R3 (21.6%; 15.2% R1; 12% R2) and more fat consumed in R1 (20%; 6% R2; 9.8% R3). The proportion of patients reporting ≥1 symptomatic HE during Ramadan (confirmed or suggestive) was globally low (1.8% R1, 2.3% R2 and 3.1% R3), as well as pre- and post-Ramadan (0.2% and 0.2% R1, 0% and 0.6% R2, 0.3% and 0.4% R3, respectively). No patients reported any severe HE. Mean HbA1c decreased in all regions (-0.4±0.9% R1; -0.3±0.7% R2; -0.1±0.9% R3). A significant (p<0.01) weight reduction was observed in all regions (-0.4±3.8kg R1; -0.7±3.8kg R2; and -0.6±4.0kg R3). No adverse events related to gliclazide MR were reported in any region.
Conclusion: This DIA-RAMADAN subanalysis showed consistently low risk of hypoglycemia in 3 diverse regions of the world, despite differences in nutritional habits, with no risk of severe hypoglycemia and maintained glycemic control and weight loss. Results were consistent despite poorer glycemic control and higher CV risk at baseline in the Middle East. These results support the safety and effectiveness of gliclazide MR in a diverse population of patients with T2D fasting during Ramadan.
Clinical Trial Registration Number: NCT04132934
Supported by: SERVIER AFFAIRES MEDICALES
Disclosure: M. Hassanein: Employment/Consultancy; Servier, MSD, Novartis, AstraZeneca, Eli Lilly, Novo Nordisk, Sanofi-Aventis.
625
Acute effects on glucose tolerance by neprilysin inhibition in patients with type 2 diabetes
N. Wewer Albrechtsen1, A. Møller2, C. Martinussen2, P. Plomgaard3, J. Gøtze1, S. Kjeldsen1, C.F. Deacon1, J.J. Holst1, S. Madsbad2, K. Bojsen-Møller2;
1Translationel Research, University of Copenhagen, Copenhagen N, 2Hvidovre Hospital, Copenhagen N, 3Rigshospitalet, Copenhagen N, Denmark.
Background and aims: A neprilysin (NEP) inhibitor-angiotensin II receptor blocker (sacubitril/valsartan) is used for treatment of heart failure. Post-hoc analyses of large randomized controlled trials have recently suggested that NEP inhibitors improve glycaemic control in patients with type 2 diabetes (T2D). Little is known about the acute effect of NEP inhibition on glucose tolerance in patients with T2D. We therefore investigated the effects of a single dose sacubitril/valsartan on postprandial glucose control in patients with T2D treated with oral antidiabetic drugs only. The primary outcome was changes in postprandial plasma glucose concentrations
Materials and methods: A cross-over clinical trial with five visits. Study participants were randomized into each of the following treatments: 1) a single dose of a NEP-inhibitor/angiotensin II receptor blocker (194 mg sacubitril / 206 mg valsartan, 30 min prior to meal), 2) a dipeptidyl peptidase-4 (DPP-4) inhibitor (sitagliptin 100mg the night before and 100mg 3 hours before the meal), 3) 194 mg sacubitril / 206 mg valsartan + sitagliptin, 4) control, and 5) valsartan (200mg). A standardized solid meal (34% carbohydrates, 45% fat, 21% protein, total caloric content of 2106kJ) was served after overnight fasting. Blood samples were obtained during 5-hour time period. Antidiabetic medicine included metformin and for two persons a DPP-4 or sodium-glucose linked transporter-2 inhibitor, all of which were paused for a minimum of three days before study days. Mixed effects analyses were performed using the control visit as fixed comparator and intervention as modifier.
Results: Eight men with T2D (HbA1c: 53±8mmol/mol, 62±5years, body mass index of 33±5 kg/m2) were included. Fasting plasma glucose was 8.8±1.5mmol/L and was not significantly different between study days. Plasma glucose peaked at 11±1.4 mmol/L ~60 minutes after the meal at the control visit, whereas after a single dose of sacubitril/valsartan the peak concentration of plasma glucose was 12.7± 1.4 mmol/L (P<0.05). Incremental glucose area under the curve (iAUC0-240min) was higher on the sacubitril/valsartan day compared to control (517±193 vs. 341±108 min* mmol/L, P=0.03) and numerically lower when sitagliptin was added to sacubitril/valsartan treatment (mean difference: -121 min* mmol/L, P=0.18). Valsartan or sitagliptin alone had no significant effect on glucose tolerance (P=0.38, P=0.24, respectively).
Conclusion: NEP inhibition does not acutely reduce blood glucose in patients with T2D but may even increase postprandial glucose concentrations. The mechanism(s) for increased blood glucose might involve altered secretion or degradation of glucose-regulating peptides including glucagon.

Clinical Trial Registration Number: NCT03893526
Supported by: Novo Nordic Foundation
Disclosure: N. Wewer Albrechtsen: None.
PS 51 Novel agents to treat diabetes and its consequences
626
Stabilising the intestinal epithelial barrier to treat diabetes: Insights gained from Roux-en-Y gastric bypass surgery
M. Hankir1, T. Langseder1, E. Bankoglu1, Y. Ghoreishi1, U. Dischinger1, M. Kurlbaum1, M. Kroiss1, C. Otto1, C.W. le Roux2, T. Arora3, F. Seyfried1, N. Schlegel1;
1University Hospital Würzburg, Würzburg, Germany, 2Univeristy College Dublin, Dublin, Ireland, 3University of Copenhagen, Copenhagen, Denmark.
Background and aims: Bariatric surgeries, typified by Roux-en-Y gastric bypass (RYGB), confer superior glycaemic control in severely obese, pre-diabetic/diabetic patients compared to currently available medicinal therapies. As such, they provide a valuable research tool for discovering novel therapeutic agents against hyperglycaemia. Attenuation of endotoxemia through stabilisation of the intestinal epithelial barrier (IEB) has been strongly implicated in the enhanced peripheral insulin sensitivity that develops following RYGB, but the underlying mechanisms remain unclear.
Materials and methods: We used an established rat model of RYGB, sham-operated controls and recipient germ-free mice to determine if gastrointestinal reconfiguration-induced shifts in the intestinal microbiota improve oral glucose tolerance by attenuating endotoxemia. Intestinal contents of RYGB-operated and sham-operated rats were then directly applied onto the apical side of confluent Caco2 cell monolayers to uniquely simulate the local intestinal microenvironments after respective surgeries, and determine if luminal factors differentially regulate IEB function and structure in a cell-autonomous manner. Plasma samples obtained from a cohort of 38 pre-diabetic/diabetic patients at baseline and 12 months after RYGB were further subjected to liquid chromatography-mass spectrometry analyses and fibroblast growth factor 19 (FGF19) measurements to evaluate the relationships between bile acids and intestinal farnesoid X receptor (FXR) signaling with endotoxemia severity, respectively.
Results: The improved glycaemic control and attenuated endotoxemia of RYGB-operated relative to sham-operated rats could be transferred through their jejunal and colonic but not their duodenal microbiota to recipient germ-free mice. Intestinal content of RYGB-operated rats markedly improved barrier function and structure in confluent Caco2 cell monolayers in an FXR-dependent manner for bile-exposed regions only. In RYGB patients, there were negative correlations between plasma cholic acid (R=-0.29, P=0.029), chenodeoxycholic acid (R=-0.31; P=0.021) and FGF19 (R=-0.32, P=0.024) levels with endotoxemia, which in turn tightly associated with fasting plasma insulin levels (R=0.34, P=0.01) and HOMA-IR values (R=0.36, P=0.009).
Conclusion: Our findings suggest that intestinal microbiota and luminal bile acids improve glycaemic control following RYGB by attenuating endotoxemia through region-specifically stabilising the IEB, and promote the use of bile-acid metabolising microbiota and intestinally-restricted FXR agonists for the effective long-term management of hyperglycaemia.

Supported by: DFG SCHGL1962/5-2
Disclosure: M. Hankir: Grants; German Research Foundation (DFG) grant number SCHL 1962/5-2.
627
Substantial cardiovascular benefit from icosapent ethyl in patients with diabetes: REDUCE-IT DIABETES
D. Bhatt1, E. Brinton2, M. Miller3, P.G. Steg4,5, T.A. Jacobson6, S.B. Ketchum7, R.T. Doyle7, R.A. Juliano7, L. Jiao7, C. Granowitz7, O. Ganda8, R. Busch9, D. Herrington10, J.-C. Tardif11, C. Ballantyne12;
1Brigham and Women's Hospital, Boston, USA, 2Utah Lipid Center, Salt Lake City, USA, 3Department of Medicine, University of Maryland School of Medicine, Baltimore, USA, 4Université de Paris, French Alliance for Cardiovascular Trials, Hôpital Bichat, Paris, France, 5Assistance Publique-Hôpitaux de Paris, INSERM Unité 1148, Paris, France, 6Lipid Clinic and Cardiovascular Risk Reduction Program, Department of Medicine, Emory University School of Medicine, Atlanta, USA, 7Amarin Pharma, Inc., Bridgewater, USA, 8Clinical Research and Adult Diabetes Sections, Joslin Diabetes Center, Harvard Medical School, Boston, USA, 9Albany Medical Center, Community Division, Endocrine Group, Albany, USA, 10Wake Forest University Health Sciences, Winston-Salem, USA, 11Montreal Heart Institute, Université de Montréal, Montreal, Canada, 12Department of Medicine, Baylor College of Medicine, Houston, USA.
Background and aims: Statin-treated patients with diabetes mellitus (DM) are at high cardiovascular (CV) risk.
Materials and methods: In REDUCE-IT, icosapent ethyl (IPE; 4 g/day) reduced CV risk vs placebo in statin-treated patients with either DM plus risk factors or established CV disease. The primary endpoint was CV death, myocardial infarction (MI), stroke, coronary revascularization, or unstable angina. The key secondary endpoint was CV death, MI, or stroke. Key DM analyses were prespecified.
Results: 58.5% of patients had DM; 91.0% on ≥1 DM medication, 49.5% on ≥2. IPE reduced primary (Figure) and key secondary first and total (first plus recurrent) events. Patients with and without DM both showed substantial benefits, but patients with DM had 1.5-fold greater rates of the primary endpoint in the placebo group, and a 7% absolute risk reduction in first and a 12.7% reduction in total events (both p<0.001) with IPE. Efficacy and safety were generally consistent with the full study, including reductions in secondary and tertiary endpoints and subgroups, and increases in atrial fibrillation/flutter (3.5% vs 2.2%; p=0.13) and bleeding (13.1% vs 10.9%; p=0.02); serious bleeding was not significant (3.2% vs 2.5%). Fasting glucose and HbA1c were stable.
Conclusion: IPE 4 g/day provides robust CV benefits in statin-treated patients with DM, with large relative and absolute risk reductions in both first and total CV events.

Clinical Trial Registration Number: NCT01492361
Supported by: The study was funded by Amarin Pharma, Inc.
Disclosure: D. Bhatt: Other; The study was funded by Amarin Pharma, Inc.
628
New data in a mouse model of sCNV support the role of Ang-2 inhibition in driving sustained vascular stabilisation and reduced fibrosis progression
J. Canonica, S. Uhles, R. Foxton, F. Revelant, N. Colé, P. Westenskow, C. Ullmer;
Roche Pharma Research and Early Development, Roche Innovation Center, Basel, Switzerland.
Background and aims: Faricimab, the first bispecific antibody for intraocular use, binds and neutralises both angiopoietin-2 (Ang-2) and vascular endothelial growth factor-A (VEGF-A), which drive angiogenesis, leakage and inflammation. Emerging clinical data supported the rationale for Ang-2 inhibition in diabetic macular edema (DME) and neovascular age-related macular degeneration (nAMD). Preclinical data supporting the vessel stabilisation potential of Ang-2 inhibition in a mouse model of spontaneous choroidal neovascularisation (sCNV) are presented.
Materials and methods: Durability of effect of faricimab 6.0 mg was observed in 3 phase 2 studies: BOULEVARD (DME); AVENUE and STAIRWAY (nAMD); total N=578. To further explore the vessel stabilisation potential of dual VEGF/Ang-2 inhibition, 7-week-old JR5558 mice, developing spontaneous neovascular lesions in both eyes, were treated intraperitoneally with mouse cross-reactive tool antibodies against Ang-2, VEGF-A or both VEGF-A and Ang-2 (bispecific antibody VA2); n=7-15 mice per group. Neovascular leakage, evaluated using fluorescein angiography (FA), and fibrosis via fibronectin (fibrosis marker) deposition on the retinal pigment epithelium (RPE)/choroid and around CNV lesions were assessed at baseline and 1 (PT1), 3 (PT2) and 5 weeks (PT3) post treatment to assess immediate and long-term effects on CNV lesion activity, respectively. Controls were untreated/IgG-exposed mice.
Results: Phase 2 studies of faricimab showed the potential of dual Ang-2/VEGF inhibition for improved vision gain and sustained efficacy. In preclinical experiments, a significant reduction of FA-evaluated CNV leakage (P<0.05 to P<0.001) was observed in mice treated with Ang-2, VEGF-A or VA2 versus controls at PT1; only Ang-2- and VA2-treated mice showed significant reduction in CNV leakage versus controls (P<0.05 to P<0.0001) at PT2/3. Lesions treated with anti-VEGF alone showed re-activation on FA at PT2, and the leakage area was no longer significantly different from the control groups. The area of fibronectin staining on RPE/choroid and around lesions was significantly reduced, by 38% with VA2 (P<0.01) and 41% (P<0.001) with Ang-2 relative to IgG control at PT1, whereas the effect of VEGF-A inhibition alone was not significant. At PT2 and PT3, only VA2 inhibition maintained statistical significance in fibronectin staining over both control groups (by 47% [P<0.01] and 54% [P<0.05], respectively).
Conclusion: Faricimab demonstrated a potential for extended durability compared with anti-VEGF monotherapy in phase 2 clinical trials for nAMD and DME. Preclinical experiments further elucidated the potential role of Ang-2 inhibition alone and in combination with anti-VEGF in driving the vascular stability that may underlie the extended durability observed with faricimab. In the mouse model, CNV leakage was suppressed for longer with dual Ang-2/VEGF-A inhibition versus VEGF-A alone. Furthermore, dual Ang-2/VEGF-A inhibition synergistically suppressed the accumulation of fibrotic markers around CNV lesions. These findings help explain the durability of faricimab observed in the phase 2 data, supporting the hypothesis that the sustained efficacy seen in patients treated with faricimab is due to vessel-stabilising effects driven by Ang-2 inhibition.
Clinical Trial Registration Number: NCT03038880; NCT02699450; NCT02484690
Supported by: F. Hoffmann-La Roche Ltd., Basel, Switzerland
Disclosure: J. Canonica: Employment/Consultancy; F. Hoffmann La Roche, Ltd.
629
At-001 a new aldose reductase inhibitor with improved selectivity and specificity protects from cellular damage
S. Shendelman1, R. Perfetti1, G. Yepuri2, N. Quadry2, R. Ramasamy2, A.F. Ghannam3;
1Applied Therapeutics, New York, 2School of Medicine, New York University, New York, 3Scientific Affairs, Applied Therapeutics, New York, USA.
Background and aims: The generation of Reactive Oxygen Species (ROS) and Advanced Glycation Endproducts (AGE’s) resulting from chronic tissue exposure to elevated levels of glucose has been identified as a key modulator of diabetic complications. Abnormal activation of the polyol pathway converts excess glucose to sorbitol, generating ROS and AGEs. This conversion is catalyzed by the enzyme Aldose Reductase. Inhibition of Aldose Reductase, the rate limiting enzyme in the polyol pathway, reduces the production of sorbitol and down-regulates the synthesis of ROS.
Materials and methods: Cultured human adult cells (NHK) were exposed to elevated glucose [25mM] to simulate hyperglycemic conditions in diabetic tissue in the presence /absence of Aldose Reductase inhibitor AT-001 [0.18nM]. AT-001 dose selection was based on previous dose response studies. Cytosolic oxidative stress was evaluated and quantified using dihydroethidium (DHE) staining and quantitated via colorimetric assessment. Mitochondrial-specific oxidative stress ROS levels were quantitated using MitoSOX staining.
Results: AT-001 prevented the production and accumulation of ROS as assessed by both DHE quantitation and MitoSOX staining, demonstrating effective inhibition of polyol pathway associated damage to these cells.
Conclusion: AT-001 effectively prevented cellular damage caused by oxidative stress under hyperglycemic conditions warranting further investigation of AT-001 in the treatment of diabetic complications. AT-001 is currently being evaluated in a pivotal phase 2/3 study; ARISE-HF, to treat Diabetic Cardiomyopathy and prevent progression to overt heart failure and also includes sub-analyses for retinopathy and DPN.
Clinical Trial Registration Number: NCT04083339
Supported by: Applied Therapeutics Inc.
Disclosure: S. Shendelman: Employment/Consultancy; Applied Therapeutics. Stock/Shareholding; Applied Therapeutics.
630
Patient-centered management of type 2 diabetes based on clinical scenarios: systematic review, meta-analysis and trial sequential analysis
L. Pinto1, D. Rados1, L. Reck1, G. Pulz1, M. Carpena2, R. Borges1, R. Marobin1, M. Beretta1, E. Pedrollo1, T. Londero1, R. Machry1, L. Janeczko1, M. Falcetta1, DRGROSS Study Group;
1Hospital de Clínicas de Porto Alegre, Porto Alegre, 2Hospital Nossa Senhora da Conceição, Porto Alegre, Brazil.
Background and aims: New antihyperglycemic medications have proven cardiovascular and renal benefits in type 2 diabetes mellitus (T2DM); however, an evidence-based rationale decision tree in specific clinical scenarios is still lacking.Aim: To compare the effect of antihyperglycemic agents on cardiovascular outcomes in different subpopulations of subjects with T2DM based on clinical settings to establish a more personalized and effective treatment.
Materials and methods: Study Selection: This is a systematic review and meta-analysis of randomized controlled trials (RCTs) with trial sequential analysis (TSA). The RCT inclusion criteria were patients with T2DM from one of these subgroups: elderly, obese, previous atherosclerotic cardiovascular disease (ASCVD), previous coronary heart disease (CHD), previous heart failure (HF) and/or previous chronic kidney disease (CKD). RCTs with at least 48 weeks of follow-up were included. Data Extraction: The main evaluated outcomes were three-point MACE [3P-MACE: cardiovascular (CV) death, nonfatal myocardial infarction and nonfatal stroke]; CV death; hospitalization due to HF; and renal outcomes in the different subgroups of interest. We performed a direct meta-analysis with the number of events in the intervention and control groups in each of the subsets, and we calculated the relative risk (RR) of events in each meta-analysis.
Results: SGLT2 inhibitors (SGLT2i) and GLP-1 receptor agonists (GLP-1 RA) were the only classes of medications related to a reduction in CV events in different populations. For obese and elderly populations, GLP-1 RA were associated with benefits in 3P-MACE; for patients with ASCVD, both SGLT2i and GLP-1 RA had benefits in 3P-MACE, while for patients with CHD, only SGLT2i were beneficial in reducing 3P-MACE. The outcome of hospitalization due to HF was assessed only in the HF subpopulation, and SGLT2i were associated with a benefit.
Conclusion: SGLT2i and GLP-1 RA were able to reduce CV events in selected populations: SGLT2i led to a reduction in events in patients with previous CHD, ASCVD and HF. GLP-1 RA led to a reduction in CV events in patients with ASCVD, elderly individuals and those with obesity. TSA shows that these findings are conclusive without the need for further investigation. This review opens a pathway towards evidence-based personalized treatment of T2DM.
Supported by: CNPq; FIPE HCPA; CAPES-PROEX; PRONEX-FAPERGS;
Disclosure: L. Pinto: None.
631
Clinical and metabolic improvements of golimumab in children with new onset type 1 diabetes: a subpopulation analysis of the T1GER study
E. Felner1, T. Quattrin2, M.J. Haller3, A.K. Steck4, Y. Li5, Y. Xia5, J.H. Leu5, F. Vercruysse6, R. Zoka7, J.A. Hedrick7, M.R. Rigby7;
1Division of Pediatric Endocrinology, Emory University School of Medicine, Atlanta, USA, 2Jacobs School of Medicine and Biomedical Sciences, University at Buffalo and JR Oishei Children’s Hospital Diabetes Center, Buffalo, USA, 3Department of Pediatrics, University of Florida, Gainesville, USA, 4Barbara Davis Center for Childhood Diabetes, University of Colorado Anschutz Medical Campus, Aurora, USA, 5Janssen Research & Development, LLC, Spring House, USA, 6Janssen Research & Development, Beerse, Belgium, 7Janssen Research & Development, LLC, Horsham, USA.
Background and aims: Tumor necrosis factor α (TNFα) appears to have a role both in the progression of autoimmunity and direct β-cell death in type 1 diabetes (T1D). Golimumab is an anti-TNFα therapeutic antibody approved for the treatment of other autoimmune conditions in children as young as 2 years of age. Existing data indicate that the progression of T1D is more rapid in younger individuals and may be associated with more aggressive insulitis and β-cell dysfunction and death. There is a significant need for therapies that slow down the progression of autoimmunity and β-cell demise in young children with new onset T1D.
Materials and methods: This Phase 2a, double-blind, placebo-controlled study randomized participants aged 6-21 years with newly diagnosed stage 3 T1D to receive subcutaneous golimumab or placebo (2:1) for 52 weeks. The primary endpoint was change in C-peptide area under the curve (AUC) at Week 52 after a 4-hour mixed-meal tolerance test. Insulin use, HbA1c, hypoglycemia rates, and other metabolic and clinical responses were also assessed. This abstract focuses on outcomes in the pediatric subset of participants (61 of 84) aged 6-17 years who completed Week 52 assessments.
Results: Of 61 participants aged 6-17 years in T1GER, 42 received golimumab and 19 received placebo. Golimumab was well tolerated without any new safety signals. At Week 52, the mean decrease from baseline of C-peptide AUC (the primary outcome) was 0.11 and 0.55 pmol/mL (P<0.0001) in the golimumab and placebo groups, respectively, which translated to a mean percent decrease from baseline in C-peptide AUC of 12% in the golimumab group compared to 68% in the placebo group. The increase in insulin use from baseline to Week 52 was 0.06 versus 0.27 U/kg/day (P=0.0012) in golimumab versus placebo, respectively. In the golimumab group, the absolute insulin use at Week 52 was about 30% lower than in the placebo group (0.53 and 0.74 U/kg/day, respectively). The average HbA1c at Week 52 was 7.41% (SD 1.558) and 7.75% (SD 1.260) with golimumab and placebo at Week 52, respectively, with an increase from baseline of 0.38% and 0.98%. In addition, golimumab was associated with improvements in hypoglycemic rates, glycemic control, partial remission/IDAA1c scores, increase or minimal loss of C-peptide, and other indicators of β-cell dysfunction.
Conclusion: From these subanalyses of the 52-week data from the T1GER Phase 2 clinical trial, children with new onset T1D appear to show a clear response to golimumab in terms of clinical and metabolic improvements. As such, additional evaluation and further consideration of this therapy as a disease modifying therapy in children is warranted.
Clinical Trial Registration Number: NCT02846545
Supported by: Janssen Research & Development, LLC
Disclosure: E. Felner: None.
632
Addressing safety and specificity with aldose reductase inhibition: development of AT-001 for diabetic cardiomyopathy
R. Perfetti1, G. Yepuri2, N. Quadry2, R. Ramasamy2, A.F. Ghannam1, S. Shendelman1;
1Applied Therapeutics, New York, 2School Of Medicine, New York University, New York, USA.
Background and aims: Diabetic Cardiomyopathy (DbCM) leading to overt heart failure is a common sequalae of both Type 1 and Type 2 Diabetes. Prior attempts to develop treatments for DbCM via inhibition of Aldose Reductase (AR) were unsuccessful, due to low AR binding affinity and off-target binding with Aldehyde Reductase (AldR), an enzyme critical for detoxification of aldehydes in the liver and normal hepatocyte function. This resulted in liver-related safety and tolerability issues with first generation ARI’s. We report on the selectivity and specificity of AT-001, a novel small molecule ARI with optimized affinity and specificity for AR and minimal to zero off-target AldR activity.
Materials and methods: AT-001 was evaluated for AR binding affinity vs zopolrestat, a prior best in class ARI, which had been plagued with liver tox issues in preclinical and clinical development.
Results: AT-001 demonstrated logarithmically improved AR inhibitory activity (IC50 of 30 pmol for AT-001 and 10 nmol for zopolrestat). Liver enzyme evaluations demonstrated that AT-001 showed no inhibition of AldR at 50x and 100x EC50 levels in assay medium, while zopolrestat inhibited Aldehyde Reductase by 50% and 60% respectively (spec activity of 2.3 and 1.9 mmol NADPH/min/ mg prot.). Additionally no elevations of ALT/AST’s were observed with AT-001 at doses up to 50X EC50, in contrast to zopolrestat which showed dose dependent release of ALT and AST (consistent with hepatocyte damage and eventual cell death). Finally, AT-001 was evaluated in a standard off-target receptor binding analysis of 87 substrates (13 enzymes, 74 binding assays); with no significant results observed.
Conclusion: The unique structure and activity of AT-001 provide potent selectivity for Aldose Reductase and lack of off-target effects. The in-vitro safety of this agent together with the positive safety data from the phase 1/2 program, supports the ongoing pivotal study in DbCM.
Clinical Trial Registration Number: NCT 04083339
Supported by: Applied Therapeutics Inc.
Disclosure: R. Perfetti: Employment/Consultancy; Applied Therapeutics. Stock/Shareholding; Applied Therapeutics, Sanofi Inc.o
PS 52 Novel glucose-lowering agents in type 2 diabetes
633
Undertreatment and overtreatment of patients with type 2 diabetes in Italian AMD Annals initiative
V. Manicardi1, G. Clemente2, S. De Cosmo3, R. Manti4, A. Rocca5, P. Pisanu6, M. Rossi7, A. Nicolucci7, A. Aglialoro8, D. Fava9, N. Musacchio10, D. Mannino11, P. Di Bartolo12, on behalf of AMD Annals Study Group;
1AMD Annals Study Group Coordinator, Associazione Medici Diabetologi, Roma, 2CNR, Istituto di Ricerche sulla Popolazione e le Politiche Sociali (IRPPS), Fisciano (SA), 3Department of Medical Sciences, Scientific Institute, S.Giovanni Rotondo, 4Metabolism and Diabetes Unit, ASL Turin 5, Torino, 55UOS Diabetology and Metabolic Disease, “G.Segalini”, ASST Nord H.Bassini Cinisello Balsamo, Milano, 6SSD Diabetology P.O.San Giovanni di Dio, Azienda Ospedaliero-Universitaria, Cagliari, 7Center for Outcomes Research and Clinical Epidemiology, Coresearch, Pescara, 8SSD Diabetology, Endocrinology and Metabolic Disease, ASL3 Genovese, Genova, 9UOSD Endocrinologia e Diabetologia, Azienda Ospedaliera S.Giovanni-Addolorata, Roma, 10AMD Past President, Associazione Medici Diabetologi, Roma, 11UOC Diabetology, Azienda Ospedaliera Bianchi Melacrino-Morelli, Reggio Calabria, 12Diabetology Clinical Network, Department of Internal Medicine, AUSL della Romagna, Ravenna, Italy.
Background and aims: In Italy, since 2004 the scientific society of diabetologists (AMD) has published the annual report of the quality of care of diabetic patients, called AMD Annals and involves one fourth of all Italian Diabetes Clinics (DC). In the last years evidence on cardiovascular and renal protection of the new classes of drugs SGLT2i and GLP1-RA were published. Aim of the present analysis was to evaluate the appropriateness of use of drugs for T2 Diabetes (T2DM) in the 2018 Annals data collection, compared to 2016.
Materials and methods: AMD Annals initiative is based on data anonymously and periodically extracted from the electronic medical records of DC. In 2018, data relative to 462,600 patients with DT2M seen in 249 DC were available (+14.8% vs. Annals of 2016). Use of different classes of anti-hyperglycemic drugs was compared. Q score, a composite indicator of overall quality of care, was evaluated: Q score correlates with the 3-year risk of incident cardiovascular (CV) events (80% excess risk if score <15, and 20% excess risk if score between 15- 25, compared to score > 25)
Results: Use of metformin increased from 61.3% to 69.4%, DPP4i from 18.2% to 21%, GLP1-RA from 3.7% to 5.8% and SGLT2i from 4.0% to 9.6%. Use of secretagogues decreased from 23.8% to 19.9%. Use of insulin, alone or in combination, was stable during the years (32%). Moreover, 60.8% of patients aged => 75 yrs had HbA1c values <= 7% (53 mmol/l) (10.9% reached HbA1c <= 6.0%) and 16.4% were treated with drugs associated with high-risk of hypoglycemia (secretagogues and/or insulin). Overall, 14% of patients had a history of cardiovascular disease. T2DM patients with Q score between 15 and 25 increased from 36.3% to 43.6%, and those with score Q < 15 decreased from 4.9% to 3.7%, leaving 60.0% of patients with Q score >25 in 2018 (vs 51,5% in 2016).
Conclusion: 2018 AMD Annals show areas for undertreatment and overtreatment in T2DM in Italy. Use of the new classes of drugs is generally low, while one fifth of patients is still treated with secretagogues. An overuse of drugs associated with high-risk of hypoglycaemia in DT2M patients aged => 75 yrs with tight metabolic control represents an urgent call to action. Despite the positive trend in overall quality of care (Q score), 40% patients still have an excess risk of CV events and deserve safer diabetes treatments.
Disclosure: V. Manicardi: None.
634
Long-term treatment with imeglimin as add-on to oral antidiabetes therapy in Japanese patients with type 2 diabetes (Times 2)
K. Kaku1, J. Dubourg2, C. Thang2, T. Kaneko3, P. Fouqueray2;
1Department of Internal Medicine, Kawasaki Medical School, Okayama, Japan, 2Poxel SA, Lyon, France, 3Poxel KK, Tokyo, Japan.
Background and aims: Imeglimin is a novel oral hypoglycemic drug under development for the treatment of Type 2 Diabetes Mellitus (T2DM). Its novel structure and mechanism of action establishes imeglimin as the first in the new class of tetrahydrotriazines called the “glimins”. Imeglimin acts on both key defects in T2DM by improving insulin secretion in response to glucose as well as insulin sensitivity via a unique mechanism of action targeting mitochondrial bioenergetics. The aim of this Phase 3 pivotal trial was to assess the long-term safety and efficacy of imeglimin for 52 weeks as add-on to other individual oral antidiabetic therapies in Japanese patients with T2DM.
Materials and methods: This study was an open-label, multicenter, Phase 3 study. Japanese patients on an alpha glucosidase inhibitor, biguanide, dipeptidyl peptidase-4 inhibitor, glinide, sodium glucose cotransporter 2 inhibitor, sulphonylurea (SU) or thiazolidinedione monotherapy for more than 12 weeks received imeglimin 1000 mg orally twice daily as add-on therapy for 52 weeks. The primary objective was to evaluate safety. Changes from baseline in glycated hemoglobin (HbA1c) and fasting plasma glucose (FPG) were secondary endpoints.
Results: The number of patients included by arm is shown in the Table 1. Adverse events were generally mild and consistent with the known imeglimin safety/tolerability profile. Adverse events were reported in 51.6-84.4% of patients. Documented symptomatic hypoglycemic events were reported in 3.9% of patients receiving imeglimin as an add-on to an SU and in 0.0 to 3.1% of patients receiving imeglimin as an add-on to other therapies. There was no severe hypoglycemia. At week 52, changes from baseline in HbA1c ranged from -0.56 ± 0.08 to -0.92 ± 0.11% in patients receiving imeglimin as an add-on therapy. At week 52, changes from baseline in FPG ranged from -12.3 ± 2.6 mg/dL to -24.4 ± 3.4 mg/dL in patients receiving imeglimin as an add-on therapy. HbA1c/FPG baselines and changes from baseline are shown in the Table.
Conclusion: In Japanese patients with T2DM, imeglimin 1000 mg twice daily as add-on to oral antidiabetic therapy for 52 weeks was well tolerated and was associated with clinically meaningful and sustained reductions in HbA1c.

Clinical Trial Registration Number: JapicCTI-173782
Disclosure: K. Kaku: None.
635
Pooled analysis of efficacy of a novel peroxisome proliferators-activated receptor pan-agonist chiglitazar in patients with type 2 diabetes in China from two phase III trials
X. Lu, Z. Ning, H. Cao, H. Yao, D. Pan;
Shenzhen chipscreen biosciences Co., Ltd, Shenzhen, China.
Background and aims: Based on recently completed two parallel pivotal phase III studies of chiglitazar (carfloglitazar) in naïve type 2 diabetes patients in china with identical study design, pooled analysis is carried out to identify potential impact factors in relation to the overall efficacy among subgroups of patients.
Materials and methods: We performed a pooled analysis on the data from two pivotal phase III clinical trials, which including a total of 1274 patients treated with chiglitazar 32 mg (n=412) and 48 mg (n=412) comparing to placebo (n=202) and dipeptidyl peptidase 4 inhibitor sitagliptin 100 mg (n=248) respectively. The primary endpoint was change in HbA1c level from baseline to week 24. The potential impact factors on glycaemic control and lipids modulation were also evaluated.
Results: Chiglitazar produced significant HbA1c lowering after 24 weeks treatment (-1.38% and -1.47% for 32 and 48 mg respectively versus -0.45% and -1.38% for placebo and 100 mg sitagliptin). HbA1c lowering was not significantly affected by sex, age, BMI, and body weight of patients. However, The HbA1c lowering effect was attenuated in sitagliptin treatment group with higher baseline level of insulin resistance (Mean difference 0.42% [95% confidence interval (CI): 0.14 to 0.70] in patients with baseline HOMA-IR ≥2.69 versus <2.69) and plasma triglycerides (TG) (Mean difference 0.36% [95% CI 0.09 to 0.63] in patients with baseline level ≥2.25 versus <2.25 mmol/L), while chiglitazar at 48 mg dose clearly demonstrated favorable efficacy over sitagliptin (Mean difference -0.32% [95% CI: -0.63 to -0.01] and -0.19% [95% CI -0.39 to 0.01] versus sitagliptin in patients with baseline TG ≥ 2.25 mmol/L and baseline HOMA-IR ≥ 2.69, respectively). Intriguingly, a dynamic change in lipids profile was observed by chiglitazar treatment. Besides of lowering plasma TG, chiglitazar also slightly increase plasma cholesterol levels. When stratifying patients with their baseline level of LDL-cholesterol (LDL-c), chiglitazar preferentially elevated LDL-c in patients with lower baseline level rather than those with higher baseline. For patients with LDL-c < 2.6 mmol/L at baseline, chiglitazar increased LDL-c level at week 12 and maintained without further increase in the following treatment period. For patients with LDL-c ≥ 2.6 mmol/L, chiglitazar did not affect LDL-c levels even slightly decreased it. By using the atherogenic index of plasma (AIP) as a surrogate parameter for particle size of LDL lipoproteins, chiglitazar significantly decreased AIP index at week 24 from baseline (-0.08 and -0.10 for 32 mg and 48 mg respectively). It suggested a size shift of LDL particles from small dense to less atherogenic larger one.
Conclusion: Chiglitazar exerts promising efficacy in glycaemic control and tend to be more effective in subgroups of patients with severe insulin resistance and elevated plasma TG which commonly seen in type 2 diabetes without satisfactory treatment so far.

Clinical Trial Registration Number: NCT02121717, NCT02173457
Disclosure: X. Lu: Employment/Consultancy; shenzhen chipscreen biosciences Co., Ltd.
636
Treatment of type 2 diabetes with a sublingual preparation of repaglinide
K. Pirkalani, Z. Talaeerad;
Internal Medicine, Mehr Medical Group, Tehran, Islamic Republic of Iran.
Background and aims: Novel preparations and pharmacokinetic study of available drugs are a legitimate field of research. Repaglinide is a very active drug in but has a series of drawbacks that reduces its role as the first choices of treatment. First, it has a very bad oral bioavailability and with empty stomach only 30% of the drug is absorbed and in most cases 90% of the drug is excreted into the feces unchanged. Second, the therapeutic window of the drug is very large and the current dose extend from 0.5mg to 16mg per day. Third, there is much patients’ inconvenience who take the drug on empty stomach and must wait an hour for meal with the current lifestyle. Based on the above we tried to treat our patients with a sublingual preparation at 0.5-1mg which will be equal to 2-4mg and has a much faster onset of effect and in fact needs not to be used 1hour before meal.
Materials and methods: After a series of preclinical studies and phase zero trials and attainment of informed consent sixty three patients were enrolled in this trial for bioassay. They received a single sublingual tablet of 1mg Repaglinide. At time zero and after 15, 30, 60 and 90 minutes BS was measured via a manual glucometer. Significant difference was studied by paired comparison. An indirect conclusion was made about pharmacokinetics at time where significance was reached. A controlled group of 32 type II diabetic patients were given placebo. In a parallel study 24 patients received 75gr of oral glucose in addition to either sublingual Repaglinide or placebo (12 examinees in each group). In a third trial, 10 patients with type I diabetes and a BS level above 200 received 1 mg of sublingual Repaglinide.
Results: Sublingual Repaglinide was superior to placebo in decreasing blood glucose level at any dose after even 15 minutes. This became increasingly significant at 30, 60 and 90 minutes study with p<0.15, p<0.03, p<0.01 and p<0.0.1 respectively. Twelve patients on Repaglinide showed complete abortion of postprandial hyperglycemia after 75 gr of oral glucose challenge whereas none of the examinees under placebo. The difference was significant at 99.5% interval with a very low p value. In both group Insulin level was measured at zero and 1h which showed a significant increase in both groups but the Repaglinide group showed a 45% higher levels of Insulin at 1 hour which means that the hypoglycemic effect of sublingual Repaglinide is through increased secretion of insulin from the islet cells. Curiously, type I patients showed a small but significant reduction of BS levels up to 37mg/dl in concordance with some of our type I patients who erroneously received Repaglinide and have shown some normalization of BS levels. This is in contradiction to current notion that Repaglinide is not effective and even contraindicated in type I diabetes.
Conclusion: Sub-repa (sublingual Repaglinide) is a very effective and extremely safe and convenient treatment for type II diabetes. It does not need to be taken 1 hour before meal, is absorbed completely at reduced doses and might have lower price. It can easily abort the hyperglycemia after oral glucose or meal challenge in an acceptable pharmacokinetic manner. Any other oral preparation has some random effect with an unpredictable increase or decrease of BS after meal. The effect on type I diabetes must be regarded as not proven but there remains two explanations; first a direct hypoglycemic effect of unknown mechanism and second a direct release of residual Beta cells through the Potassium channel. Further study on this issue is recommended.
Disclosure: K. Pirkalani: None.
637
Efficacy and safety of imeglimin in combination with insulin in Japanese patients with type 2 diabetes: results of TIMES 3 trial
J. Dubourg1, H. Watada2, C. Thang1, T. Kaneko3, P. Fouqueray1;
1Poxel SA, Lyon, France, 2Department of Metabolism and Endocrinology, Graduate School of Medicine, Juntendo University, Tokyo, Japan, 3Poxel SA, Tokyo, Japan.
Background and aims: Imeglimin is a novel oral hypoglycemic drug under development for the treatment of Type 2 Diabetes Mellitus (T2DM). Its novel structure and mechanism of action establishes imeglimin as the first in the new class of tetrahydrotriazines called the “glimins”. Imeglimin acts on both key defects in T2DM by improving insulin secretion in response to glucose as well as insulin sensitivity via a unique mechanism of action targeting mitochondrial bioenergetics. This Phase 3 pivotal study was aimed to confirm the efficacy and safety of imeglimin 1000 mg orally twice daily versus placebo in combination with insulin in Japanese T2DM patients inadequately controlled by insulin monotherapy.
Materials and methods: This study was a Phase 3 multicenter, randomized, double-blind, placebo-controlled trial in Japanese patients with T2DM inadequately controlled by insulin monotherapy. Patients were randomized 1:1 to imeglimin 1000 mg or placebo twice daily, on top of their current insulin therapy. The design of the study included a 16-week double-blind treatment period followed by a 36-week open-label extension period on imeglimin for all patients. The primary efficacy endpoint was the placebo-corrected reduction in HbA1c from baseline to week 16.
Results: A total of 215 patients were randomized. At week 16, imeglimin significantly decreased A1c (difference vs placebo: -0.60% (SE:0.10); p-value < 0.0001). In patients receiving imeglimin, reductions in A1c at week 16 were maintained to week 52 (difference vs baseline: -0.64%), while switching from placebo to imeglimin resulted in a similar reduction in A1c (difference vs baseline: -0.54%). During the double-blind treatment period, the incidence of treatment emergent adverse events was similar in the imeglimin and placebo groups, and, the number of patients experiencing hypoglycemia was balanced between groups. There were no episodes of severe hypoglycemia over the 52-week study duration.
Conclusion: When combined with insulin, imeglimin produced clinically meaningful glycemic control without the risk of exacerbating hypoglycemia. The results of this study further confirm the consistent and sustained efficacy of imeglimin as a novel therapy which could be leveraged to achieve better disease management in patients with T2DM.
Clinical Trial Registration Number: JapicCTI-183846
Disclosure: J. Dubourg: None.
638
Long-term treatment with testosterone improves glycaemic control and may result in remission of diabetes in patients with hypogonadism and type 2 diabetes in a registry
N. Penaherrera1, K.S. Haider2, A. Haider2, G. Doros3, A. Traish4, F. Saad1;
1Bayer AG, Berlin, Germany, 2Private Urology Practice, Bremerhaven, Germany, 3Boston University School of Public Health, Boston, USA, 4Boston University School of Medicine, Boston, USA.
Background and aims: Prevalence of hypogonadism has been reported as high as 50% in men with T2DM. Guidelines of the American Diabetes Association recommend assessment of hypogonadism in men with T2DM and consider testosterone treatment in men with symptomatic hypogonadism. We investigated effects of long-term testosterone therapy in men with hypogonadism and type 2 diabetes who received standard diabetes treatment in a diabetes center.
Materials and methods: In a registry of 858 men with hypogonadism, 356 men (41.5%) had T2DM. 178 received testosterone undecanoate injections 1000 mg/12 weeks following an initial 6-week interval (T-group), 178 opted against treatment (CTRL). Changes over time between groups were compared and adjusted for age, weight, waist circumference, fasting glucose, blood pressure, lipids and quality of life to account for baseline differences between the two groups.
Results: Mean follow-up 8.2±2.9, baseline age: 61.5±5.4 (T-group) and 63.7±4.9 (CTRL) years. T-group: HbA1c progressively decreased by 3.4±0.1% at 11 years (from 9.4±1.4% to 5.8±0.3%). CTRL: HbA1c increased by 3.3±0.1% (from 7.8±0.7% to 10.5±1.4%). Estimated adjusted difference between groups: 6.7% (p<0.0001 for all). Fasting glucose (mmol/L) decreased in T-group by 1.8±0.1 (from 7.8±1.2 to 5.4±0.1) and increased in CTRL by 1.7±0.1 (from 6.3±0.7 to 8.0±1.6). Difference between groups: 3.6 (p<0.0001 for all). In the T-group, 87 men (48.9%) received insulin at baseline at a mean dose of 37.8±13.4 U/d. Dose requirement declined by 25.9±1.1 U/d during the observation period. In CTRL, 69 men (38.8%) received insulin at baseline at a mean dose of 31.3±6.2 U/d. Dose requirement increased by 19.3±1.1 U/d. Difference between groups: 45.2 U/d (p<0.0001 for all). In men who never received insulin (91 in T-group, 89 in CTRL), HOMA-IR decreased from 9.8±2.0 to 2.3±0.6 by 7.0±0.3 (T-group) and increased from 7.1±1.3 to 12.8±1.9 by 5.4±0.3 (CTRL). Difference between groups: 12.4 (p<0.0001 for all). In CTRL, 20 patients were started on insulin during the observation period. 34.3% of men treated with T achieved remission of their diabetes without any relapse and 46.6% of patients achieved normal glucose regulation. 83.1% of patients in the T-group achieved HbA1c targets of <6.5% and 91.0% of <7.0%, respectively. In contrast, no remission of diabetes or reduction in glucose or HbA1c levels occurred in CTRL.
Conclusion: Long-term testosterone therapy with testosterone undecanoate in men with hypogonadism and T2DM progressively improved glycemic control. One third of testosterone-treated patients achieved remission. Diabetes-related parameters deteriorated in untreated men.
Supported by: Bayer AG provided partial funding for data entry and statistical analyses.
Disclosure: N. Penaherrera: Employment/Consultancy; Bayer AG.
PS 53 Key issues in improving outcomes in people with diabetes, education and costs
639
Evaluation of the SPECTRUM training programme for real-time continuous glucose monitoring: a multicentre prospective study in 120 adults with type 1 diabetes
G. Freckmann1, S. Schlüter2, P. Wintergerst1, L. Heinemann3, K. Lange4, CGM-TRAIN study group;
1Institut für Diabetes-Technologie Forschungs- und Entwicklungsgesellschaft mbH an der Universität Ulm, Ulm, 2Diabetesschwerpunktpraxis Northeim, Northeim, 3Science Consulting in Diabetes GmbH, Neuss, 4Dept. Medical Psychology, Hannover Medical School, Hannover, Germany.
Background and aims: Comprehensive knowledge, specific skills, and data-analysis competences are prerequisites of successful use of continuous glucose monitoring systems (CGM). SPECTRUM is a structured and manufacturer-independent training-programme for real time CGM (rtCGM) comprising one web-based introduction and six modules (each 90 minutes) of face-to-face group sessions.
Materials and methods: SPECTRUM was evaluated longitudinally among adults with type 1 diabetes from 10 diabetes centers. Outcome parameters were rtCGM-knowledge and -skills (rtCGM-Profi-Check), satisfaction with the course, technology acceptance and metabolic control. Initially 120 participants with type 1 diabetes were included (mean age 42.4±13.4 years, diabetes duration 21.6±11.6 years, 56% female, mean HbA1c 7.7±1.3%). Data were collected at study entry, after the final group session, and at six months follow-up. The study was completed by 108 patients (10% dropped out, mainly due to scheduling problems).
Results: After training rtCGM knowledge (scale 0-40) improved by 43% (from 21.2±7.6 to 30.4±4.5; p<0.001) and persisted until six months follow-up (29.4±4.5). After six months HbA1c decreased to 7.6±1.3% (p=0.04). On a scale from 0-14, practical skills were 13.1±1.3 after the program. Satisfaction with SPECTRUM was 1.4±0.5 (1 is good - 6 is bad). Satisfaction with the rtCGM system was 4.2±0.5 (scale from 1 (low) to 5 (high)) and acceptance of the rtCGM system was 6.3±0.6 (scale from 1 (low) to 7 (high)) after the training and 6.3±0.7 at follow up. This indicates a high acceptance, positive attitude, and intension to use rtCGM continuously.
Conclusion: SPECTRUM was shown to be effective in increasing the knowledge and skills about rtCGM in adults with type 1 diabetes. The effect was sustainable and independent from diabetes center and rtCGM-system used. Training participants showed an improvement in glycemic control and improved satisfaction and acceptance of rtCGM.
Clinical Trial Registration Number: DRKS00014380
Supported by: Berlin-Chemie, Dexcom, Medtronic, Roche Diabetes Care, Sanofi-Aventis, Verlag Kirchheim
Disclosure: G. Freckmann: Grants; Berlin-Chemie AG Menarini, Dexcom Deutschland, Medtronic GmbH, Roche Diabetes Care GmbH, Sanofi-Aventis Deutschland GmbH. Non-financial support; Verlag Kirchheim & Co GmbH.
640
Diabetes education and self-management in people with diabetes living in low-/middle-income countries: initial results of the cross-sectional phase of IDMPS Wave 8
J.C.N. Chan1, J.J. Gagliardino2, H. Ilkova3, F. Lavalle4, J. Mbanya5, A. Ramachandran6, M. Shestakova7, J.-M. Chantelot8, P. Aschner9;
1The Chinese University of Hong Kong, Hong Kong SAR, China, 2Facultad de Ciencias Médicas UNLP, CENEXA (UNLP-CONICET, CEAS CICPBA), La Plata, Argentina, 3Istanbul University, Istanbul, Turkey, 4Universidad Autónoma de Nuevo León, Nuevo León, Mexico, 5University of Yaounde I, Yaounde, Cameroon, 6India Diabetes Research Foundation and Dr. A. Ramachandran's Diabetes Hospitals, Chennai, India, 7Endocrinology Research Centre, Moscow, Russian Federation, 8Sanofi, Paris, France, 9Javeriana University School of Medicine and San Ignacio University Hospital, Bogotá, Colombia.
Background and aims: The International Diabetes Management Practices Study (IDPMS) is a global, real-world, observational study exploring patient profiles, management practices and patterns of care across time in people with type 1 (T1D) or type 2 diabetes (T2D) living in low-/middle-income countries. Since 2005, eight separate waves of data have been collected across 50 countries globally. Here we report the proportions of patients who received diabetes education and their self-management behaviours from Wave 8 (2018-2020).
Materials and methods: Wave 8 comprises a 2-week cross-sectional phase followed by a prospective 9-month follow-up period (ongoing). Physicians recruited the first 10 adults with T2D and the first 5 adults with T1D who made a routine clinic visit during the cross-sectional phase. Patients provided written informed consent. Initial data are shown from the cross-sectional phase only.
Results: 1104 people with T1D (100% used insulin) and 2476 with T2D (43% used insulin) were recruited from 13 countries (Argentina, Brazil, Colombia, Egypt, India, Iran, Kuwait, Mexico, Pakistan, Russia, Saudi Arabia, Turkey and the United Arab Emirates). Patient demographics are shown in the Table. Most (T1D: 90.9%/T2D: 90.7%) lived in urban areas and had secondary education (T1D: 35.1%/T2D: 36.1%) or university/higher education (T1D: 58.2%/T2D: 38.7%). Glycaemic target achievement was generally poor; common reasons (physician-reported) are shown in the Table. Overall 73.3% received diabetes education. Most patients possessed a blood glucose meter and performed self-monitoring of blood glucose (SMBG); a greater proportion of insulin-treated patients with T2D performed daily SMBG (oral glucose-lowering drug [OGLD] + insulin: 43.9%; insulin only: 49.5%) compared with the OGLD group (23.9%). Cost of test strips was a limiting factor for regular SMBG (45.0% with T1D and 44.8% with T2D).
Conclusion: Most patients received diabetes-related education but <40% from certified diabetes educators. Less than half of people with T2D performed daily SMBG. Systems changes are needed to increase access to quality diabetes-related education, which may improve self-management behaviours.

Supported by: Study sponsored by Sanofi
Disclosure: J.C.N. Chan: Other; Member of the IDMPS steering committee and has received honoraria and travelling sponsorships in relation to the IDMPS from Sanofi.
641
Impact of type 2 diabetes patients' knowledge of their individualised HbA1c goal on glycaemic control
R. Boggs1, D. Lautsch1, G. Milligan2, V. Higgins2;
1Merck & Co. Inc, Kenilworth, USA, 2Adelphi Real World, Bollington, UK.
Background and aims: Patients’ knowledge of their individualized glycemic goals is not well understood or documented. We aimed to identify the proportion of patients who were aware of their individual target and whether this had an implication on goal attainment.
Materials and methods: The 2018 Adelphi T2DM Disease Specific Programme is a survey involving 730 physicians and 8,794 patients in Germany, Spain, Italy, UK and the US. Data include physician-reported individualized targets and patient-reported satisfaction with Antihyperglycemic Agents (AHAs) attaining target, both of which are not available in most databases or clinical studies.Physicians provided HbA1c results and target goal, while patients completed a questionnaire asking about their knowledge of their goal, satisfaction with AHAs as well as adherence via the validated Adherence to Refills and Medications Scale for Diabetes (ARMS-D: Total scores range from 11-44, with higher values indicating worse outcomes).Of 8794 patients in the study, 2560 (30%) qualified for this analysis with a patient-reported questionnaire, diagnosed > 3 months, currently receiving AHAs. Chi-square and t-tests were used to compare results between those who were aware of their target and others. Multivariate regression performed controlling for age, gender, time since diagnosis, BMI, previous HbA1c measurement, Charleson Comorbidity Index (CCI, performed excluding diabetes) and number of AHAs currently used. For comparison, demographics and outcomes were also calculated for those not qualifying for this analysis.
Results: Among the 2,560 patients qualified, individualized mean glycemic goal was 6.8%. Patients had a mean age of 58.4 years and 45.5% were female. Of the qualified patients included, 1,804 (70.5%) were aware of their target. In univariate analyses, achieving target was not related to knowledge of target. Patients who were aware of their target were more satisfied with their AHA but did not differ significantly in age, gender, time since diagnosis (mean 6.3 years), Body Mass Index (BMI), most recent previous HbA1c measure, CCI or adherence (Table 1). In a model controlling for age, gender, time since diagnosis, BMI, previous HbA1c measurement, CCI and number of AHAs currently used, patients who were aware of their target were not more likely to meet it than others. Minimal differences were seen between patients qualifying for this analysis versus those who did not (Table 1).
Conclusion: Most patients were aware of their target; and patients who knew their target were more likely to be satisfied with their AHA. Patient’s awareness of target was not associated with meeting it.

Disclosure: R. Boggs: None.
642
Diabetes care and education provided by diabetes care and education specialists improve clinical, behavioural and quality of life outcomes
L.E. Kolb;
Chief Science and Practice Officer, Association of Diabetes Care & Education Specialists, Chicago, USA.
Background and aims: Diabetes self-management education and support (DSMES) programs are structured and abide by the National Standards for Diabetes Self-management education and support. Diabetes Care and Education Specialists (DCES) are the foundation of the DSMES programs. There is a formal certification process in the United States to ensure that programs provide evidenced based education and quality services. At a National level, annually, data is collected on an aggregate level related to behavioral and clinical outcome measures. The framework for the education follows the AADE7 Self-care Behaviors®. The behaviors are: Healthy Coping, Healthy Eating, Being Active, Taking Medication, Monitoring, Reducing Risks and Problem Solving. DSMES is a critical element of care for all people with diabetes. The DCES assists the person with diabetes through an ongoing process of providing education to help increase knowledge and skill building to ensure diabetes self-care and activities that assist a person in implementing and sustaining the behaviors needed to manage his or her condition on an ongoing basis. Experts suggest that DSMES should be considered at diagnosis, annually and when not meeting treatment targets, when complicating factors develop, and when transitions in life and care occur. The aim is to help the person with diabetes improve their quality of life through improved behaviors and sustained self-management of their disease.
Materials and methods: Diabetes Self-management education and support programs report their clinical and behavioral outcomes on an annual basis at an aggregate level. No persons are identified. Methods to collect this data vary at the program level. On an annual basis program submit reports to the National Accrediting Organizations (NAO). These reports were aggregated by the NAO and reported to the Centers of Medicare & Medicaid Services (CMS).
Results: According to the Association of Diabetes Care & Education Specialists, Diabetes Education and Accreditation Program (DEAP) annual status reports, aggregately programs had at least one encounter with 203,598 people with diabetes in 2019. Behavioral goals were set in all of the AADE7 Self-care Behaviors® with success rates from 53% related to Healthy Coping and Problem Solving to 80% in the behavior of Healthy Eating. Out of the 657 Programs that collected Hemoglobin A1c as their clinical outcome measure, we saw an average reduction from 8.6 to 7.3. We also saw an increase in patients receiving foot and retinal exams post education.
Conclusion: DSMES programs that follow the National Standards of Diabetes Self-Management and Support help people with diabetes self-management their disease and improve behavioral and clinical outcomes. These programs can be easily replicated. Because of the individualization provided by the diabetes care and education specialist there is not a one size fits all. The AADE7 Self-care Behaviors® should be the basis and framework for the education. Self-management of diabetes is a lifelong process and DSMES should be individualized and repeated as needed.
Disclosure: L.E. Kolb: None.
643
Awareness of ocular complications of diabetes in community-based people with type 2 diabetes: the Fremantle Diabetes Study Phase II
J. Drinkwater1, F.K. Chen2, W.A. Davis1, T.M.E. Davis1;
1The University of Western Australia, Fremantle, 2The University of Western Australia, Nedlands, Australia.
Background and aims: Ocular complications of diabetes are common and associated with significant and preventable disability. Few studies have assessed whether people with diabetes are informed as to their significance and implications. The aim of this study was to determine the level of knowledge of eye disease and its association with vision-related quality of life (VRQoL) in community-based patients with type 2 diabetes (T2D).
Materials and methods: A subgroup of 360 participants from the community-based Fremantle Diabetes Study Phase II were invited to a single study visit which comprised a detailed medical history questionnaire, physical examination including visual acuity and fundus photography, and usual-care biochemical tests. Diabetic retinopathy (DR) was graded as none, mild non-proliferative diabetic retinopathy (NPDR), moderate NPDR, or severe NPDR/proliferative diabetic retinopathy (PDR). VRQoL was assessed using the validated National Eye Institute Visual Functioning Questionnaire-39 which scores responses as percentages. A simple ophthalmic knowledge questionnaire was administered which comprised 10 multiple-choice items covering how diabetes can affect the eyes, how often ophthalmic screening should be performed, risk factors, preventive strategies, available treatments and prognosis. Data were analysed using multiple linear regression.
Results: Of those invited, 273 (76%) were recruited and 259 (93.8%; mean ± SD age 71.9 ± 9.1 years, 56.8% male, median [IQR] diabetes duration 15.3 [11.0-22.3] years) had gradable retinal photographs and completed the knowledge questionnaire. Their overall mean ± SD knowledge score (KS) out of 10 was 5.3 ± 1.7. Most (82.2%) correctly answered how they could prevent eye complications and 58.3% were aware of specific conditions affecting the eyes in diabetes, but only 13.9% knew how often a person with diabetes should have an ophthalmic assessment. Those with moderate NPDR or worse vs less severe retinopathy had a higher KS in bivariable analysis (7.0 and 5.2 respectively, P=0.001). There were no significant associations between KS and the presence of any DR, other eye complications, ophthalmic assessment in the previous year, or VRQoL (P≥0.07). In the most parsimonious linear regression model, older age was associated with lower KS (B=-0.04, P=0.001) and education beyond primary was associated with a higher KS (B=1.73, P<0.001). When moderate NPDR or worse was added, it was independently associated with an increased KS (B=1.38, P=0.008).
Conclusion: Multi-faceted knowledge of eye disease complicating diabetes in community-based people with long duration T2D appears suboptimal, especially among older participants, those who were less well educated, and those with less than moderate NPDR. These subgroups could be targeted for additional education as part of efforts to reduce the burden of diabetic eye disease.
Supported by: Edith Hearn Bequest Grant, NHMRC funding, Warren Jones UWA Research Scholarship
Disclosure: J. Drinkwater: Grants; Edith Hearn Bequest Grant awarded by Spinnaker Health Research Foundation. Other; Warren Jones UWA Postgraduate Research Scholarship, Australian Government Research Training Scholarship, Australian National Health and Medical Research Council Development Fellowship, Medical Research Future Fund Practitioner Fellowship.
644
Development of noninvasive diabetes monitoring method using tear samples
M. Aihara, N. Kubota, T. Kadowaki;
The University of Tokyo, Tokyo, Japan.
Background and aims: To prevent diabetic complications, strict glucose control and frequent monitoring of blood glucose levels are necessary. However, all currently available methods for blood glucose monitoring, including the finger prick method, are invasive. Therefore, noninvasive blood glucose monitoring approaches have been investigated, but until date, none has been found to be a suitable substitute for direct glucose measurement in blood samples. We considered monitoring of diabetes-related biomarkers in tears may be the possible methods for diabetes monitoring method. Many studies about tear glucose levels have been reported and tear glucose levels correlate with blood glucose levels. This time, we focused on glycoalbumin (GA) levels, which reflect an average of blood glucose levels over the preceding 2 weeks, and studied the correlation between GA levels in blood and tears.
Materials and methods: We recruited 100 diabetic subjects and collected blood and tear samples. GA levels in blood were measured by an enzymatic method, and GA levels in tears was measured by Liquid Chromatography / Mass Spectrometry (LC-MS/MS). All the statistical analyses were carried out using the Statistical Package for Social Sciences (SPSS) version 22.0 (IBM Corp.).
Results: The GA levels in tear samples of 99 out of 100 subjects was appropriately measured by LC-MS/MS. GA levels in blood and tear samples were significantly correlated (P <0.001). Multiple regression analysis revealed that this correlation was maintained even after adjustment for age, gender, nephropathy stage, and obesity (P <0.001).
Conclusion: GA in tears was the first measured diabetes-related biomarker. GA levels in tears were strongly correlated with those in blood, considering various factors such as age, gender, nephropathy stage, and obesity. As GA value is a ratio, GA levels in tears were not thought to be influenced by dilution or concentration of tears and showed strong correlation with those in blood. From the above, GA in tears could be a diabetes-related biomarker that can be measured noninvasively. In the future, we plan to optimize measurement conditions and develop measurement equipment, and to verify the effectiveness and usefulness of diabetes monitoring methods.
Clinical Trial Registration Number: The Research Ethics Committee of the University of Tokyo Hospital (11374-(1), 2018050NI-(1))
Supported by: Japan Agency for Medical Research and Development
Disclosure: M. Aihara: None.
645
The impact of chronic kidney disease on commercial payers in the US
S. Haldrup1, W. Wang2, A. Dillon2, H. Mikulski3, I. Singh4, J. Odegard4, C. Ringemann5, T. Kauf6;
1Roche Diabetes Care, Basel, Switzerland, 2Genesis Research, Hoboken, USA, 3Roche Diabetes Care, Sant Cugat del Vallès, Spain, 4Roche, Indianapolis, USA, 5Roche, Mannheim, Germany, 6Genesis Research, Zug, Switzerland.
Background and aims: While a large proportion of chronic kidney disease (CKD) cost in the US is borne by Medicare, most CKD patients have commercial coverage, either as primary insurance or as a Medicare supplement. This study examines the economic impact of CKD on commercial payers in the US.
Materials and methods: A retrospective cohort study using IBM MarketScan® data from January 2010 - December 2018 was conducted. Patients with ≥2 outpatient (≥30 days apart) and/or ≥1 inpatient claims containing a diagnosis code for CKD were eligible for analysis. The earliest CKD diagnosis date served as the index date. Included patients were continuously enrolled for ≥6 months pre- and post-index.Annualized progression rates and direct medical costs per patient per year (PPPY) by CKD stage were analyzed for the overall CKD population and patients with pre-existing Type 1 or Type 2 diabetes.
Results: Of 753,097 CKD patients identified, 310,837 (41.3%) had diabetes. More CKD patients with pre-existing diabetes had hypertension (81.7% vs 75.7% for overall CKD). Approximately 45% of patients in both cohorts were diagnosed at Stage 3. PPPY costs for Stages 1-5 were $19,970, $26,248, $32,687, $46,091, and $61,492, respectively. For CKD patients with pre-existing diabetes, PPPY costs were $21,028, $29,941, $37,835, $50,614, and $67,160 for Stages 1-5. The increase in Stage 5 cost over Stage 1 cost was 208% and 219% for CKD overall and CKD with pre-existing diabetes, respecitvely. Annualized CKD progression was higher for CKD patients with pre-existing diabetes compared to CKD patients overall (162 vs 130 progressions per 1000 patients in a given year).
Conclusion: Annualized rates of CKD progression are high, with the burden of CKD increasing more than 2-fold from Stage 1 to Stage 5. Earlier identification and treatment management of CKD are needed to reduce the burden of disease.
Disclosure: S. Haldrup: Employment/Consultancy; Roche Diabetes Care.
646
Increasing access to hard to reach groups in type 2 diabetes structured education
L.A. Jones, M.G. Jenkins;
Oviva, London, UK.
Background and aims: UK National Diabetes Audit (2017/18) data illustrates <10% of people newly diagnosed with Type 2 diabetes attend a diabetes structured education (DSE) course, despite 75% being offered a place. Publications show characteristics associated with non-attendance include being male, >65 years, English not their first language, and a higher HbA1c. Aim: To determine whether a 100%-remote, digitally-enabled DSE programme improves attendance rates in harder to reach groups.
Materials and methods: The 100%-remote, digitally-enabled DSE programme includes nine weeks of 1-to-1 care from a diabetes specialist dietitian via telephone and smartphone app, supported by engaging learning materials. Commissioned by 40 UK NHS Clinical Commissioning Groups, we analysed referral and attendance between 01/01/2018 and 31/7/2019. Participants often had to decline a face-to-face DSE programme to be offered this 100%-remote programme.
Results: 5,601 eligible referrals were received and 4,074 (73%) attended the programme. Of referrals (with data available on referral), 57% were men, 34% were >65 years, 22% English not their first language, 36% were BAME groups, and 20% had higher HbA1c (≥75mmol/mol). Attendance rates (with data available on referral) for men were 70% and women 73%; for people >65 were 72% and ≤65 71%; for people with English not their first language were 80% and English first language 96%; for people from BAME groups 83% and White 91%; for people with higher HbA1c (≥75mmol/mol) 73% and lower (<75mmol/mol) 72%.
Conclusion: A 100% remote digitally-enabled DSE programme has shown the ability to dramatically increase DSE attendance rates overall and in harder to reach groups. This could address England-wide low DSE uptake rates and has the potential to improve attendance figures across Europe.
Disclosure: L.A. Jones: None.
PS 54 How to improve diabetes care
647
Rates and estimated cost of primary care consultations in people diagnosed with type 2 diabetes and comorbidities: a retrospective analysis of 8.3 million consultations
S. Abner1, B. Coles1, F. Zaccardi1, S. Seidu1, C. Gillies1, M.J. Davies2, C. Hvid3, K. Khunti1;
1Leicester Real World Evidence Unit, University of Leicester, Diabetes Research Centre, Leicester, UK, 2Diabetes Research Centre, Leicester, UK, 3Novo Nordisk Region Europe Pharmaceuticals A/S, Copenhagen, Denmark.
Background and aims: Understanding past trends in healthcare utilisation for patients with type 2 diabetes (T2DM) with and without comorbidities is the first step in planning future healthcare resource needs. The objective of this study was to determine whether the rate and cost of primary care consultations for patients with T2DM differed by the number of comorbidities.
Materials and methods: This retrospective observational study used primary care information from the Clinical Practice Research Datalink for 120,409 adults with newly diagnosed T2DM from 2000 to 2018. Patients were initially grouped by the number of prevalent comorbidities from the Charlson Comorbidity Index and transitioned groups when incident comorbidities were diagnosed. All face to face consultations with a nurse or GP were obtained. Crude and sex-age adjusted annual consultation rates and corresponding costs were calculated based on the number of comorbidities at the time of consultation.
Results: During 679,704 person years of follow up (mean 5.6 [95% CI 5.2-5.7], range 1 day-19 years), there were a total of 8,334,371 consultations. The crude rate of face to face primary care consultations for patient without comorbidities was 10.3 (95% CI 10.3-10.4) per person year, compared to 12.7 (12.7-12.7) for 1 comorbidity, 15.1 (15.1-15.2) for 2 comorbidities, and 18.7 (18.7-18.8) for 3 or more comorbidities. The mean annual inflation-adjusted cost for face to face consultations was £412.70 per patient without comorbidities, compared to £516.80 for 1 comorbidity, £620.75 for 2 comorbidities, and £778.83 for 3 or more comorbidities. The age-sex adjusted face to face consultation rate changed an average of -3.3% (95% CI -4.4% to -2.3%) per year from 2000 to 2018 for patients without comorbidities, compared to -2.7% (-4.0% to -1.3%) for 1 comorbidity, -2.2% (-3.3% to -1.2%) for 2 comorbidities, and -4.3% (-8.7% to +0.3%) for 3 or more comorbidities.
Conclusion: While the consultation rate for patients with T2DM decreased from 2000 to 2018, there was a significant disparity between the consultation rates for T2DM patients with and without comorbidities. This represents a significant burden to patients that are managing not just T2DM, but also comorbid conditions. Frequent consultations that address single issues may not be the most effective or cost-efficient model of care for this patient group. Instead, these patients may require different models of service delivery.
Supported by: This project was funded by Novo Nordisk.
Disclosure: S. Abner: Grants; This project was funded by Novo Nordisk.
648
Health care costs associated with incident complications in type 2 diabetes patients: RWD study based on electronic patient information system
T. Peltonen1, J. Martikainen2, K. Nolvi3, R. Sund4;
1Medical Affairs, MSD, Espoo, 2Pharmacoeconomics and Outcomes Research Unit, University of Eastern Finland, Kuopio, 3Market Access, MSD, Espoo, 4Institute of Clinical Medicine, University of Eastern Finland, Kuopio, Finland.
Background and aims: Health economic modelling has become as a standard tool to estimate the long-term cost-effectiveness of new treatments for type 2 diabetes (T2D). In T2D, complex health economic model structures are needed to model patient trajectories over a lifetime and estimate costs of microvascular and macrovascular complications associated with elevated glycemic levels. Value-based use and reimbursement of novel T2D medication requires up-to-date cost estimates of complications associated with the disease. In Finland, there is clear need for newer complication cost estimates reflecting current treatment practices and unit cost, including costs incurred at the tertiary referral center setting. Therefore, the aim of the present study was to provide reliable and sufficiently detailed real world estimates of costs associated with different T2D complications in a university hospital.
Materials and methods: A cohort of patients living in Kuopio university hospitals’ (KUH) catchment area at the final day of year 2011 was identified from the comprehensive national FinDM diabetes database for longitudinal assessment of T2D associated complication treatment costs. Patient-level data including inpatient days, surgical procedures, ED visits, physician and nurse outpatient visits, laboratory examinations, diagnoses, medications (utilized during hospitalizations) as well as other accountable services and related detailed costing data were gathered from KUH’s information systems for the period 2012-2019 by using unique personal identity codes. Patients were screened for their first diagnoses of complications using the same national quality registry definitions as in the FinDM database. Washout-period of 10+ years was used to detect incident complication episodes. Costs and inpatient/outpatient hospital days for one-year follow-up were calculated.
Results: About 12% of T2D population at the end of 2011 had admissions at KUH during 2012-2018. Patients with hospital admissions had a longer T2D duration than others. Proportion of patients with new complication episode of all patients treated for complication was highest in cerebrovascular complications and lowest in eye complications. One-year costs were highest for cardiovascular and foot complications and lowest for eye complications. The overall costs of treatment in the tertiary center setting during the 8 years follow-up for the study cohort were 68 million euros, making it about 3500 euros annually per treated patient.
Conclusion: Number of days of hospital stays were substantial indicating a high burden of disease. Developed protocol can be incorporated into hospital information systems to provide real-time data on costs of T2D complications.

Supported by: co-funded with MSD Finland
Disclosure: T. Peltonen: None.
649
Management of glycaemic control in people with type 1 diabetes in low-/middle-income countries: Wave 8 of the International Diabetes Management Practices Study (IDMPS)
J.J. Gagliardino1, J.C.N. Chan2, H. Ilkova3, F. Lavalle4, J. Mbanya5, A. Ramachandran6, M. Shestakova7, J.-M. Chantelot8, P. Aschner9;
1Facultad de Ciencias Médicas UNLP, CENEXA (UNLP-CONICET, CEAS, CICPBA), La Plata, Argentina, 2The Chinese University of Hong Kong, Hong Kong SAR, China, 3Istanbul University, Istanbul, Turkey, 4Universidad Autónoma de Nuevo León, Nuevo León, Mexico, 5University of Yaoundé I, Yaounde, Cameroon, 6India Diabetes Research Foundation and Dr. A. Ramachandran's Diabetes Hospitals, Chennai, India, 7Endocrinology Research Centre, Moscow, Russian Federation, 8Sanofi, Paris, France, 9Javeriana University School of Medicine and San Ignacio University Hospital, Bogotá, Colombia.
Background and aims: Many people with type 1 diabetes (T1D) have poor glycaemic control, which can increase their risk of micro- and macrovascular complications. We assessed clinical management of people with T1D in low-/middle-income countries from the most recent IDMPS data.
Materials and methods: IDMPS is a large international, multicentre, non-interventional observational study, ongoing since 2005, and has collected real-world data on clinical profiles and patterns of care for people with T1D and type 2 diabetes. Data are presented on demographics, management and clinical outcomes for people with T1D for Wave 8 (2018-2020), which included people from Argentina, Brazil, Colombia, Egypt, India, Iran, Kuwait, Mexico, Pakistan, Russia, Saudi Arabia, Turkey and the United Arab Emirates. Wave 8 comprises a 2-week cross-sectional survey and a 9-month follow-up period (ongoing); initial results of the cross-sectional phase are presented here.
Results: Overall, 1104 people with T1D were enrolled. Most received basal + prandial insulin (74.6%); relatively few received premix only insulin (8.6%). Sodium-glucose cotransporter 2 inhibitor therapy was used by 25 patients. Mean HbA1c was high and few achieved an HbA1c target of <7 % or individualised physician-set targets (Table). Key physician-reported reasons for non-achievement of individualised targets are shown in the Table. Most performed self-monitored blood glucose testing, but only 63.5% did so daily. Prevalence of diabetes-related micro- and macrovascular complications was low. Over half of patients reported symptomatic hypoglycaemia in the past 3 months, with a median (interquartile range) of 2 (1:3) events per week, and 10% reported severe hypoglycaemia in the past 12 months. Around 10% of patients reported diabetic ketoacidosis in the past 12 months.
Conclusion: People with T1D living in low-/middle-income countries had poor glycaemic control; lack of insulin titration, blood glucose variability and fear of hypoglycaemia were commonly reported reasons for this. Incidence of hypoglycaemia was high and 10% reported severe hypoglycaemia or hyperglycaemia with DKA. These results highlight the need for improved access to appropriate training and the latest therapies to reduce the risk of hypoglycaemia and facilitate effective glycaemic control.

Supported by: Study sponsored by Sanofi
Disclosure: J.J. Gagliardino: Other; Member of the IDMPS steering committee and has received honoraria and travelling sponsorships in relation to the IDMPS from Sanofi.
650
Glycaemic control and characteristics of people with type 2 diabetes living in low-/middle-income countries: results of the cross-sectional phase of the IDMPS Wave 8
P. Aschner1, J.J. Gagliardino2, A. Ramachandran3, J. Mbanya4, M. Shestakova5, H. Ilkova6, F. Lavalle7, J.-M. Chantelot8, J.C.N. Chan9;
1Javeriana University School of Medicine and San Ignacio University Hospital, Bogotá, Colombia, 2Facultad de Ciencias Médicas UNLP, CENEXA (UNLP-CONICET, CEAS CICPBA), La Plata, Argentina, 3India Diabetes Research Foundation and Dr. A. Ramachandran's Diabetes Hospitals, Chennai, India, 4University of Yaoundé I, Yaounde, Cameroon, 5Endocrinology Research Centre, Moscow, Russian Federation, 6Istanbul University, Istanbul, Turkey, 7Universidad Autónoma de Nuevo León, Nuevo León, Mexico, 8Sanofi, Paris, France, 9The Chinese University of Hong Kong, Hong Kong SAR, China.
Background and aims: The International Diabetes Management Practices Study (IDPMS) is a global, real-world, observational study exploring profiles, management practices and patterns of care across time in people with type 1 (T1D) or type 2 diabetes (T2D) living in low-/middle-income countries. Since 2005, eight separate waves of data have been collected across 50 countries globally. Data on people with T2D are shown from Wave 8 (2018-2020).
Materials and methods: Wave 8 comprises a 2-week cross-sectional phase followed by a prospective 9-month follow-up period (ongoing). Physicians recruited the first 10 adults with T2D and the first 5 adults with T1D who made a routine clinic visit during the 2-week cross-sectional phase. Patients provided written informed consent. Initial data are presented for the cross-sectional phase only.
Results: 2476 people with T2D were recruited from 13 countries, 52.9% of them received oral glucose-lowering drugs (OGLDs) only, 33.3% OGLDs + insulin and 10.0% insulin only. Of OGLD-treated patients, the most common OGLD was metformin; 39% received OGLD monotherapy. Most patients using insulin used basal-only regimens. Few received glucagon-like peptide 1 receptor agonists (GLP-1 RAs, 8.3%). Clinical characteristics are shown in the Table; overall, 17.2% had renal impairment and 8.0% had macrovascular complications. Glycaemic control was poor (23.3% had HbA1c >9 %). Median duration of insulin therapy was ~2-3 years in insulin-treated patients with ~11-12 years elapsing between diagnosis and initiating insulin.
Conclusion: Glycaemic control was poor in people with T2D living in low-/middle-income countries, with 1 in 5 or fewer insulin-treated individuals achieving HbA1c <7 % despite ~3 years of insulin treatment. However, ~40% of OGLD-treated patients were on monotherapy and duration of insulin therapy was relatively short compared with the median T2D duration in insulin-treated patients. These data suggest a high level of clinical inertia in initiating/intensifying antihyperglycaemic therapies and low use of newer therapies (e.g. GLP-1 RAs). Changes are needed to overcome clinical inertia and improve access to the latest treatments for diabetes and promote/support patients’ self-management to improve glycaemic control and clinical outcomes.

Supported by: Study sponsored by Sanofi
Disclosure: P. Aschner: Other; Member of the IDMPS steering committee and has received honoraria and travelling sponsorships in relation to the IDMPS from Sanofi.
651
Is there a need for improving quality of diabetes care and diabetes support among individuals with coexisting diabetes and severe mental illness?
L. Knudsen1, D.L. Hansen1, L.E. Joensen1, R. Wibaek1, M.E. Joergensen1,2, G.S. Andersen1;
1Steno Diabetes Center Copenhagen, Gentofte, 2National Institute of Public Health, University of Southern Denmark, Copenhagen, Denmark.
Background and aims: Individuals with severe mental illness (SMI) have higher prevalence of type 2 diabetes and diabetes complications and experience greater barriers in diabetes management compared to individuals with diabetes without SMI. This study aims to examine quality of diabetes care and patient reported outcomes in individuals with co-existing diabetes and SMI.
Materials and methods: As part of a trial on effectiveness of diabetes education to psychiatric nurses, individuals (n=110) with diabetes and SMI (mean age 51, 57% men) were recruited from psychiatric outpatient clinics in the Capital Region of Denmark from August 2018 to June 2019. Clinical data from January 2017 to February 2019 were obtained from medical records and 87 participants completed a questionnaire on diabetes self-care activities, psychosocial health (self-rated general health, WHO-5, PAID-5), diabetes’ impact on everyday life (1=no impact to 10=high impact), relevance of diabetes support from psychiatric nurses (1=not relevant to 10=very relevant) and level of diabetes support from health care providers (“no”, “some”, “high”). Participants could indicate "no contact with the health care providers" (excluded from analyses). Quality of diabetes care was measured as proportion of individuals treated according to national guidelines; frequency and values of HbA1c measurements and attendance to eye- and foot examinations.
Results: The median (IQR) duration of diabetes was 10 (4 to 15) years. Of the participants 8% had not obtained a HbA1c measurement in the last year compared to 4% in the Danish background population with type 2 diabetes. The proportion reporting not to have obtained foot screening in the past year was 24% vs. 14% in the background population and 25% reported not to have received an eye examination compared to 16% in the background population. High diabetes distress, PAID≥ 8, was indicated by 51% of the participants vs. 26% of individuals with type 2 diabetes without SMI in the Capital Region of Denmark. The impact of diabetes on everyday life was reported to be high (>8) by 28% and low (<3) by 30% of the participants. More than half (59%) of the participants stated that the psychiatrist from the psychiatric out-patient clinic provided no diabetes support and 26% reported that the psychiatric nurse provided no diabetes support. One third reported it was highly relevant to receive diabetes support from the psychiatric nurses (>8) and 18% reported it was of little relevance (<3).
Conclusion: A high proportion of individuals with diabetes and SMI had low quality of diabetes care, high diabetes distress and did not receive diabetes support as part of psychiatric care and a third expressed a wish to receive diabetes support from the psychiatric nurses. This implies a need for interventions aiming to improve quality of diabetes care and promote diabetes support from the psychiatry.

Clinical Trial Registration Number: ISRCTN15523920
Supported by: Jascha Foundation
Disclosure: L. Knudsen: None.
652
Improving the uptake of postpartum glucose screening following a gestational diabetes pregnancy
N. Periyathambi1, N. Sukumar1, D. Parkhi2, J. Plester3, T. Ritchie3, J. Wilson3, S. Selvamoni3, Y. Weldessalasie1, P. Saravanan1;
1University of Warwick, Coventry, 2Division of Health Science, University of Warwick, Coventry, 3Diabetes, George Eliot Hospital NHS Trust, Nuneaton, UK.
Background and aims: Gestational diabetes mellitus (GDM) is defined as hyperglycaemia diagnosed during pregnancy, and affects 5-20% of all pregnancies worldwide, depending on the type of screening done and diagnostic methods used. Women with GDM have 7-20 fold increased risk of developing type 2 diabetes (T2DM) and up to 50% develop T2DM within five years. The National Institute of Health and Care Excellence (NICE) 2015 recommends a postpartum OGTT screening between 6 to 13 weeks, if not either a fasting plasma glucose (FPG) or HbA1c at ~13 weeks after delivery, but 23-58% fail to return for this postpartum screening. As per NICE criteria 2-hour glucose level at antenatal OGTT identifies >65% of women with GDM. George Eliot Hospital (GEH) NHS Trust, Nuneaton, United Kingdom recommends a postnatal OGTT screening for all the GDM women in order to avoid missing the GDM women who have higher 2-hour antenatal glucose. One of our team members also calls the women who did not attend the postpartum OGTT. This study aims to compare the characteristics of women with GDM, who did and did not attend postpartum screening.
Materials and methods: A retrospective audit from electronic database records of postpartum OGTT screening at 6-13 weeks after delivery was conducted in a NHS Trust hospital between January 2016 and December 2019. All the 607 women with GDM who delivered and scheduled for postpartum OGTT screening for T2DM were included. Two tailed t test for continuous and chi squared test for categorical variables were used to compare the antenatal and delivery details of women who did and did not receive the postpartum screening. Logistic regression model was used to obtain the odds ratio using SPSS (Statistical Package for the Social Sciences) version 26.0.0.
Results: Of 607 women with GDM, only 55.7% (n=338) attended the postpartum screening. Full data was available for n=210 of these non-attenders. Their mean age at delivery was 30±6.1 years (vs. 32±5.04 years; p-value <0.001) and mean antenatal booking BMI was 32.09±7.39 kg/m2 (vs. 29.48±6.61; p-value <0.001). Lower proportion of women with history of smoking during pregnancy (27.2 vs 72.8%; n=81; odds ratio 4.014, 95% CI 2.360, 6.827), and lower proportion of multiparous women (≥2 living children) attended postpartum screening compared to primiparous women (50.4 vs 61.1%; odds ratio 1.604, 95% CI 1.098, 2.344).
Conclusion: Our results show that younger, multiparous women with higher booking BMI who continued to smoke during pregnancy did not attend the postpartum screening. Identifying these women antenatally and encourage them to attend the postpartum screening may improve the uptake. In addition, simpler screening such as FPG or HbA1c may improve the uptake. Although employment of specific coordinator in other units have improved outcome, this does not seem to be the case in our population. Explicit, written guidelines to the women and their GP of their future risk may also encourage them to attend postpartum screening.
Supported by: UoW Chancellor's International Scholarship
Disclosure: N. Periyathambi: None.
653
Housing insecurity and glycaemic control among people with type 2 diabetes
T. Thomas1, A. Anton2, W. Dyer1, A. Adams1, J. Schmittdiel1;
1Kaiser Permanente Northern California Division of Research, Oakland, 2Midwestern University, Downers Grove, USA.
Background and aims: In 2017, over 4.5 million housing units in the United States reported inability to pay all or part of their rent or mortgage. Previous studies in the homeless population identified unique barriers to glycemic control such as difficulty prioritizing long-term disease management over need to find shelter, lack of safe places to store medication, and absence of routine. However, there has been little research to quantitatively study the relationship between housing insecurity, which is broader than outright homelessness, and glycemic control. The aims of this study were to identify and operationalize measures of housing insecurity within existing electronic health record (EHR) and to quantify the association between housing insecurity and glycemic control.
Materials and methods: We used a novel measure to potentially identify housing insecurity in EHR data by quantifying the number of address changes in 2018, with at least one address change considered potentially housing insecure. We used chi-square tests to assess the bivariate association between housing insecurity and HbA1c and multivariable logistic regression to analyze the association between address change and HbA1c while adjusting for race/ethnicity, gender, and age.
Results: We identified a cross sectional cohort of 25,614 adults (≥18 years) with Type II diabetes who were East Bay (Oakland, Richmond, Alameda, Pinole) members of Kaiser Permanente Northern California, a large, integrated health care delivery system, in 2018. Six percent (n=1,569) of the cohort had at least one address change. Women were 50% of the cohort. Approximately 80% of the cohort was over 50 years old with a mean age of 62.05 years. The cohort was 20.8% Hispanic, 22.3% White, 23.0% Asian, and 29.8% Black. In univariate analyses, we found that one or more address changes was associated with increased prevalence of poor glycemic control (HbA1c>9) (27.2% vs. 21.4%, p=0.0001) and decreased prevalence of good glycemic control (HbA1c<8) (61.1% vs. 67.2%, p=0.0001). We also found that that one or more address changes were associated with increased prevalence of emergency department visits (40.9% vs. 27.0%, p=.0001) and decreased prevalence of having a flu shot (49.2% vs. 57.2%, p=.0001). These relationships remained significant after adjustment via logistic regression, with address change associated with greater risk of HbA1c>9 (RR: 1.14, 95% CI: 1.05,1.25), lower risk of HbA1c<8 (RR: 0.94, 95% CI; 0.90, 0.97), greater risk of emergency department visits (RR: 1.44, 95% CI: 1.35, 1.53), and lower risk of having a flu shot (RR: .92, 95% CI: .88, .97) when compared to no address change.
Conclusion: Patients with Type II diabetes and address change are more likely to have uncontrolled and less likely to have well controlled A1c. They were also more likely to have an emergency department visit and less likely to have a flu shot. These changes in address could negatively affect glycemic control, emergency department utilization, and use of preventive services in patients with diabetes. Interventions to screen patients with address changes for housing insecurity may be needed to better identify patients who may need additional support. Identifying patients with housing insecurity and providing resources aimed at continuity of care and stable healthcare access could potentially mitigate the risk of uncontrolled A1c even when housing is insecure.
Supported by: Kaiser Permanente Northern California Community Benefit
Disclosure: T. Thomas: None.
654
The cost of diabetes care in an Irish public hospital
K.M. Friel1, P. Gillespie2, C. McCauley1, M. O'Kane3, M. McCann4, V. Coates1;
1Ulster University, Derry, UK, 2National University of Ireland - Galway, Galway, Ireland, 3Western Health and Social Care Trust, Derry, UK, 4Letterkenny Institute of Technology, Letterkenny, Ireland.
Background and aims: To estimate and examine the cost of inpatient diabetes care in an Irish public hospital.
Materials and methods: A retrospective audit of inpatient admissions (2013-2017) at an Irish public hospital was undertaken and data analysed to estimate and examine the burden of diabetes-related admissions. Costs were calculated for each admission by applying the relevant unit price per Diagnosis Related Group based on the Health Service Executive Activity-Based Funding 2019 Admitted Patient Price List. Further analysis was undertaken to explore the leading causes of inpatient admissions and costs related to these admissions.
Results: 5,405 patients were admitted with a primary, secondary or tertiary diagnosis of diabetes with an average length of hospital stay of 6.4 days. The majority of admissions were those age >=60 years with admissions for male patients notably higher than females. Over 89% were emergency admissions and 94% receiving health care through the public health care system. Estimated costs of these admissions exceeded €22.6million with type 2 diabetes making up the majority of costs with an excess of €20.25 million. Poor control was a leading cause of admissions across primary, secondary and tertiary groups with costs over €6.1 million. Diabetes without complication and features of insulin resistance are leading causes in secondary and tertiary with related costs greater than €8million and €6.7million respectively.
Conclusion: Diabetes related complications pose a significant cost burden for public hospitals. This paper showcases the valuable role that real world evidence can play in highlighting inpatient costs of diabetes to the Irish health system and the potential scope for cost savings arising from improvements in glycaemic control and prevention of type 2 diabetes.
Supported by: INTERREG VA
Disclosure: K.M. Friel: None.
655
Prescription cost and patterns of cardiovascular risk management in type 2 diabetes during the last 20 years: a survey in Greek outpatient diabetes centres
M. Ziori1, K. Athanasakis2, A. Papazafiropoulou3, A. Koutsovasilis4, S. Driva1, E. Prodromiadou1, A. Sotiropoulos4, I. Georgopoulos3, D. Gougourelas4, A. Melidonis3, S. Bousboulas4, S. Liatis1;
11st Department of Propaedeutic Internal Medicine, Medical School, Laiko General Hospital, National and Kapodistrian University, Athens, 2Department of Health Economics, National School of Public Health, Athens, 31st Department of Internal Medicine and Diabetes Center, Tzaneio General Hospital, Piraeus, 43rd Department of Internal Medicine and Diabetes Center, General Hospital of Nikaia, Athens, Greece.
Background and aims: The cost of type 2 diabetes (T2DM) drug treatment has recently increased. We aimed to evaluate the prescription cost of cardiovascular risk management in T2DM during the last 20 years in relation to the treatment pattern used for this purpose and the level of achieved cardiovascular risk control.
Materials and methods: Data from four surveys, using the same methodology during the last 20 years (1998, 2006, 2012, 2018) were analyzed. The medical records of T2DM outpatients attending three diabetes centers of the Greek national health system, at least twice each year, were examined. Annual costs of prescription were calculated per treated patient by using the nominal retail prices of pharmaceuticals, after adjustment for 2018 price levels.
Results: A total of 4066 patients were included (Table 1). The proportion of patients achieving the targets of HbA1c<7%, systolic BP<140mmHg and LDL-C<100mg/dl increased over the years. A significant number of patients started using new classes of glucose-lowering drugs. The proportion of patients using antihypertensive and lipid-lowering medications increased, while antiplatelet use decreased, after 2012. The total prescription cost increased continuously up to 2018, as did the cost of glucose-lowering drugs. The cost of antihypertensive and lipid-lowering treatment declined gradually after 1998, while antiplatelet treatment cost decreased only after 2006.
Conclusion: Over the past 20 years, the prescription cost of cardiovascular risk reduction in T2DM is continuously increasing, due to the increasing prescription cost of glucose-lowering drugs. In parallel, an overall improvement in cardiovascular risk factor control has been observed.

Disclosure: M. Ziori: None.
PS 55 The impact of new basal insulins
656
Insulin icodec: an insulin analogue suited for once-weekly dosing in type 2 diabetes
U. Hövelmann1, L. Brøndsted2, N.R. Kristensen2, R. Ribel-Madsen2, J.H. DeVries1, T. Heise1, H. Haahr2;
1Profil, Neuss, Germany, 2Novo Nordisk, Søborg, Denmark.
Background and aims: Insulin icodec* is a novel basal insulin analogue designed for single once-weekly subcutaneous injection. The aim of this trial was to investigate the pharmacokinetics, pharmacodynamics and safety of insulin icodec.
Materials and methods: In this randomised, double‑blind, double‑dummy trial, 50 individuals with type 2 diabetes (insulin treated±metformin; 43 men; mean±SD age 57±5 years, BMI 30.1±2.7 kg/m2, HbA1c 7.4±0.6%) received once-weekly insulin icodec (12, 20 or 24 nmol/kg) plus once‑daily placebo (N=13, 13, 12) or once-daily insulin degludec (0.4 U/kg) plus once-weekly placebo (N=12) for 5 weeks in 3 dose level cohorts. The pharmacodynamic properties were investigated at close to steady state in 24-h glucose clamps on days 2 and 7 after the last insulin icodec dose. The glucose‑lowering effect over a weekly dosing interval was derived from the observed pharmacokinetic and pharmacodynamic data using an established pharmacokinetic/pharmacodynamic model. Full-week glucose infusion rate data were modelled for each participant based on insulin icodec pharmacokinetic data from the first dose until 36 days after the last dose and 24-h glucose clamp data obtained from both glucose clamps.
Results: The median time to maximum serum insulin icodec concentration (tmax,insulin icodec) was 16 h and the geometric mean half-life (t½,insulin icodec) was 196 h, with no systematic differences between dose levels. The glucose-lowering effect showed a close to even distribution over the 7 days across all dose levels (Figure). The adverse event incidence did not increase with increasing insulin icodec dose (100%, 69%, 75% of participants, respectively). There were no serious or severe adverse events, severe hypoglycaemic episodes or injection site reactions.
Conclusion: Insulin icodec was safe and well-tolerated and showed pharmacokinetic and pharmacodynamic properties supporting once‑weekly administration at clinically relevant dose levels. * Proposed INN

Clinical Trial Registration Number: NCT02964104 (ClinicalTrials.gov)
Supported by: Novo Nordisk
Disclosure: U. Hövelmann: Grants; Novo Nordisk.
657
Efficacy and safety of switching to insulin icodec, a once-weekly basal insulin, vs insulin glargine U100 in patients with type 2 diabetes inadequately controlled on OADs and basal insulin
H. Bajaj1,2, J. Isendahl3, A. Gowda3, K. Stachlewska3, J. Rosenstock4;
1LMC Diabetes & Endocrinology, Toronto, Canada, 2Leadership Sinai Centre for Diabetes, Mount Sinai Hospital, Toronto, Canada, 3Novo Nordisk A/S, Bagsværd, Denmark, 4Dallas Diabetes Research Center at Medical City, Dallas, USA.
Background and aims: Insulin icodec* (icodec) is a novel basal insulin analogue in development as the first once-weekly insulin. This trial investigated a switch from previous basal insulin to icodec or insulin glargine U100 (IGlar U100).
Materials and methods: This 16-week, randomized, open label, treat-to-target, phase 2 trial compared the efficacy and safety of once-weekly icodec with and without a loading dose (LD) vs once-daily IGlar U100 in patients with T2D insufficiently controlled (HbA1c 7.0-10.0%) with oral antidiabetic drugs and once/twice-daily insulin, to inform phase 3 trial designs. A unit to unit switch (or a 20% reduction for those receiving twice-daily basal insulin or IGlar U300 prior to randomisation) with and without an initial 100% LD of icodec were investigated. Insulin doses were titrated weekly based on the lowest (if below target) or the mean of 3 pre-breakfast self-measured blood glucose values to a target of 4.4-7.2 mmol/L (80-130 mg/dL). The primary endpoint was time in range (TIR) 3.9-10.0 mmol/L (70-180 mg/dL) based on continuous glucose monitoring (Dexcom G6®) during weeks 15 and 16. Secondary endpoints included HbA1c and body weight (BW) changes from baseline to week 16, weekly insulin dose during weeks 15 and 16, and hypoglycaemic episodes.
Results: Patients (N = 154) were randomized 1:1:1 to icodec + LD (n = 54), icodec (n = 50) or IGlar U100 (n = 50). Mean baseline characteristics appeared similar across groups: age 61.7 years, diabetes duration 15.1 years, BMI 29.8 kg/m2 and HbA1c 7.9% and FPG 8.0 mmol/L. TIR during weeks 15 and 16 was statistically significantly greater for icodec + LD than for IGlar U100 (72.9 vs 65.0%, estimated treatment difference [ETD]: 7.88%; p = 0.01) and similar between icodec and IGlar U100 (66.0 vs 65.0%; ETD: 1.01; p = 0.75) (Figure). For icodec + LD, icodec and IGlar U100, respectively, the estimated mean changes from baseline in HbA1c were: -0.77, -0.47 and -0.54%-points; estimated mean weekly insulin doses during weeks 15 and 16 were 191, 242 and 196 U and estimated mean changes from baseline in BW were: 0.6, 1.3 and 0.1 kg. Observed rates of combined level 2 (< 3 mmol/L or < 54 mg/dL) and 3 (severe) hypoglycaemia were similar between icodec + LD and IGlar, and numerically lower for icodec (78.0, 14.8 and 79.4 events per 100 patient years of exposure for icodec + LD, icodec and IGlar U100, respectively). There were no unexpected safety findings.
Conclusion: Switching to once-weekly insulin icodec from other basal insulins was well tolerated and efficacious. Switching to icodec with a loading dose resulted in significantly more “time in range” without an increased risk of clinically significant hypoglycaemia vs IGlar U100. *Proposed INN.

Clinical Trial Registration Number: NCT03922750
Disclosure: H. Bajaj: Lecture/other fees; Novo Nordisk A/S.
658
Effect of three different titration algorithms of insulin icodec vs insulin glargine U100 on time in range in patients with type 2 diabetes inadequately controlled on OADs
I. Lingvay1, M. Koefoed2, K. Stachlewska2, M. Hansen2, J. Rosenstock3;
1University of Texas Southwestern Medical Center, Dallas, USA, 2Novo Nordisk A/S, Bagsværd, Denmark, 3Dallas Diabetes Research Center at Medical City, Dallas, USA.
Background and aims: Insulin icodec* (icodec) is a novel insulin analogue in development as the first once-weekly basal insulin. However, there is no data on optimal titration of once-weekly insulins.
Materials and methods: This 16-week, randomized, open label, phase 2 trial compared the efficacy and safety of three titration algorithms of once-weekly icodec with once-daily insulin glargine U100 (IGlar U100) in insulin-naïve patients with T2D insufficiently controlled (HbA1c 7.0-10.0%) with oral antidiabetic drugs, to inform phase 3 trial designs. Icodec was started at 70 U/week and titrated weekly by 21 U (titration A) or 28 U (titration B and C) to a pre-breakfast self-measured blood glucose (SMBG) of 4.4-7.2 mmol/L (80-130 mg/dL) for titration A and B or 3.9-6.0 mmol/L (70-108 mg/dL) for titration C. From a starting dose of 10 U/day, IGlar U100 was adjusted weekly by 4 U to achieve an SMBG of 4.4-7.2 mmol/L. Titration was based on the lowest (if below target) or the mean of the last 3 pre-breakfast SMBGs. The primary endpoint was time in range (TIR) 3.9-10.0 mmol/L (70-180 mg/dL) measured via continuous glucose monitoring (Dexcom G6®) during weeks 15 and 16. Secondary endpoints included HbA1c and body weight changes from baseline to week 16; weekly insulin dose during weeks 15 and 16 and hypoglycaemic episodes.
Results: Patients (N = 205) were randomized 1:1:1:1 to icodec (titration algorithm A [n = 51], B [n = 51], C [n = 52]) or IGlar U100 (n = 51). Baseline characteristics appeared similar across groups; mean age was 60.7 years, diabetes duration 10.1 years, body weight 88.9 kg, BMI 31.3 kg/m2, HbA1c 8.1% and FPG 9.7 mmol/L. Estimated TIR was similar between icodec titration A (76.6%) and IGlar U100 (75.9%; estimated treatment difference [ETD]: 0.76%; p = 0.77). TIR was statistically significantly greater for titration B (83.0%) than for IGlar U100 (ETD: 7.08%; p = 0.005), and numerically greater for titration C (80.9%; ETD: 5.01%; p = 0.052) (Figure). For icodec titration A, B and C and IGlar U100, respectively, the estimated mean changes from baseline in HbA1c were: -1.0, -1.2, -1.4 and -1.0%-points; the estimated mean weekly insulin dose during weeks 15 and 16 were: 142, 176, 209 and 146 U; the estimated mean changes from baseline in body weight were: 0.87, 1.11, 1.25 and 0.63 kg. Observed rates of combined level 2 (< 3.0 mmol/mL or < 54 mg/dL) and 3 (severe) hypoglycaemia after 16 weeks were low (4.9, 14.5, 38.1 and 0.0 events per 100 patient years of exposure for icodec titration A, B, C and IGlar U100, respectively). There were no unexpected safety findings.
Conclusion: Insulin icodec, a novel once-weekly basal insulin, displayed comparable safety to once-daily IGlar U100 with improved or similar TIR depending on the titration algorithm applied. *Proposed INN.

Clinical Trial Registration Number: NCT03951805
Disclosure: I. Lingvay: Grants; Novo Nordisk. Honorarium; Novo Nordisk.
659
Insulin glargine 300 U/ml vs first-generation standard-of-care basal insulin analogues in adults with type 2 diabetes by race and ethnicity: ACHIEVE Control study
G. Umpierrez1, C. DeFedele2, J. Gill2, A. Mohamed3, E. Wright4, L. Meneghini5;
1Emory University, Atlanta, USA, 2Sanofi, Bridgewater, USA, 3IVIDATA Stats for Sanofi, Chilly-Mazarin, France, 4Charlotte AHEC, Charlotte, USA, 5University of Texas Southwestern Medical Center and Parkland Health & Hospital System, Dallas, USA.
Background and aims: ACHIEVE Control, a real world pragmatic study, showed statistical superiority of insulin glargine 300 U/ml (Gla-300) vs standard-of-care basal insulin analogues (SOC-BI; insulin glargine 100 U/ml and insulin detemir) for the primary composite endpoint of individualised glycated haemoglobin (HbA1c) target attainment (<53 mmol/mol [7%] or <64 mmol/mol [8%] if age ≥65 years or with defined comorbidities) without documented symptomatic (≤3.9 mmol/l) or severe hypoglycaemia. This post-hoc analysis explored outcomes by race and ethnicity.
Materials and methods: ACHIEVE Control was a real-life, multicentre, randomised, open-label, active-controlled, two-arm, parallel group, pragmatic trial in insulin-naïve adults with uncontrolled type 2 diabetes on two or more non-insulin antihyperglycaemic drugs. This post-hoc analysis of the composite primary outcome (individualised HbA1c target attainment [<53 mmol/mol {7%} or <64 mmol/mol {8%} if age ≥65 years or with defined comorbidities] without documented symptomatic ≤3.9 mmol/l or severe hypoglycaemia) was analysed by race (white, black or Asian) and ethnicity (Hispanic or Non-Hispanic). Secondary outcomes included change from baseline to 6 months and 12 months in HbA1c.
Results: Of 3304 participants included in the overall study population, 2565 (77.6%) were white, 489 (14.8%) were black and 175 (5.3%) were Asian. Overall, 591 (17.9%) participants identified as Hispanic vs 2713 (82.1%) as Non-Hispanic. Across subgroups, odds ratios (ORs) for both composite endpoints at 6 months showed trends favouring Gla-300 vs SOC-BI, consistent with the overall population; these trends continued at 12 months in white, Asian and Hispanic participants (Figure). ORs for HbA1c target achievement, regardless of hypoglycaemia, at 6 and 12 months trended in favour of Gla-300 in white, black and Hispanic participants, and suggested comparable benefit with Gla-300 vs SOC-BI in Asian participants. Across subgroups, ORs for hypoglycaemia endpoints at 6 and 12 months trended in favour of Gla-300. This was similar to the overall study results at both 6 and 12 months, except the point estimate for avoidance of documented symptomatic (<3.0 mmol/l) or severe hypoglycaemia at 12 months suggested similar benefit with Gla-300 vs SOC-BI in black participants.
Conclusion: The results of this subgroup analyses are consistent with the results of the overall ACHIEVE Control population, suggesting that Gla-300 may provide benefit for achieving target HbA1c without hypoglycaemia regardless of race or ethnicity; future confirmatory prospective studies are warranted.

Clinical Trial Registration Number: NCT02451137
Supported by: Writing support by Barrie Anthony, PhD, of Evidence Scientific Solutions Inc, funded by Sanofi US.
Disclosure: G. Umpierrez: Other; Investigator for Sanofi.
660
Effect of insulin degludec U100 vs insulin glargine U100 on time in range in patients with type 2 diabetes at risk of hypoglycaemia
R. Goldenberg1, V.R. Aroda2, L.K. Billings3, A.S.L. Christiansen4, A.M. Donatsky4, E. Parvaresh Rizi4, G. Podgorski5, K. Raslova6, D.C. Klonoff7, R.M. Bergenstal8;
1LMC Diabetes & Endocrinology, Concord, Canada, 2Brigham and Women's Hospital and Harvard Medical School, Boston, USA, 3Department of Medicine, NorthShore University HealthSystem/ University of Chicago Pritzker School of Medicine, Evanston, USA, 4Novo Nordisk, Søborg, Denmark, 5Greenacres Hospital, Port Elizabeth, South Africa, 6Metabolic Center Ltd, Bratislava, Slovakia, 7Diabetes Research Institute, Mills-Peninsula Medical Center, San Mateo, USA, 8International Diabetes Center, Minneapolis, USA.
Background and aims: Assessing continuous glucose profiles, including time in range (TIR), above range, and below range (TBR), provides a more comprehensive picture of glycaemia and risk of hypoglycaemia than HbA1c measurement alone in insulin-treated type 2 diabetes (T2D). We compared, using flash glucose monitoring (FGM), the effect of insulin degludec 100 U/mL (degludec) vs insulin glargine 100 U/mL (IGlar U100) on TIR in people with T2D.
Materials and methods: This was a randomised, crossover, open-label, multicentre trial using blinded FGM (Abbott Freestyle Libre Pro) comparing once-daily degludec and IGlar U100 ± oral antidiabetic drugs in people with T2D on basal insulin at baseline and with ≥1 hypoglycaemia risk factor. Each of two 18-week treatment periods consisted of a 16-week titration and two weeks maintenance in which participants used FGM. Titration was once weekly (target: 3.9─5.0 mmol/L) based on pre-breakfast self-measured plasma glucose. The primary endpoint was the percentage of TIR (3.9─10.0 mmol/L).
Results: Analyses included trial completers with ≥70% of two-week FGM data in each maintenance period (degludec, n=448/490; IGlar, n=448/484). At baseline, participants had a mean (SD) age of 62.8 (9.8) years, T2D duration of 15.1 (7.7) years, and HbA1c of 7.6 (1.0)%. Superiority was confirmed for degludec vs IGlar U100 for the primary endpoint, with a mean TIR of 72.11% for degludec vs 70.68% for IGlar 100 (ETD [95% CI]: 1.43% [0.12;2.74]; p = 0.032) (Table). More participants achieved a clinically significant ≥5% increase in TIR with degludec (39.5%) than with IGlar U100 (28.8%) (risk ratio [95% CI]: 1.37 [1.09;1.72]; post hoc). Time in tight TIR (3.9─7.8 mmol/L) favoured degludec vs IGlar U100 (Table). Degludec reduced the nocturnal TBR (defined as 3.0-3.8 mmol/L, <3.0 mmol/L or ≤3.8 mmol/L) compared with IGlar U100 (post hoc; Table). Mean glucose (ETD [95% CI]: ─0.04 [─0.18;0.11] mmol/L) and coefficient of variation (─0.47 [─0.99;0.06] %) were similar between groups. Mean HbA1c was lower with degludec (7.10%) vs IGlar U100 (7.16%) (ETD [95% CI]: ─0.06 [─0.11;─0.01]; p = 0.0163). Overall, safety was similar between groups.
Conclusion: Degludec compared with IGlar U100 provided more time in glycaemic target range, and less nocturnal TBR, using FGM, in basal insulin-experienced people with T2D at increased risk of hypoglycaemia.

Clinical Trial Registration Number: NCT03687827
Supported by: Novo Nordisk
Disclosure: R. Goldenberg: Non-financial support; Novo Nordisk.
661
HbA1c levels and rates of hypoglycaemia with insulin degludec U200 and insulin glargine U300 stratified by renal function subgroups: post hoc analysis from the CONCLUDE trial
S.R. Heller1, T.R. Pieber2, H.S. Bajaj3, T. Jia4, K. Khunti5, D.C. Klonoff6, S. Ladelund4, L.A. Leiter7, L. Wagner4, A. Philis-Tsimikas8;
1Academic Unit of Diabetes, Endocrinology and Metabolism, University of Sheffield, Sheffield, UK, 2Division of Endocrinology and Diabetology, Department of Internal Medicine, Medical University of Graz, Graz, Austria, 3LMC Diabetes and Endocrinology, Brampton, Canada, 4Novo Nordisk A/S, Søborg, Denmark, 5Diabetes Research Centre, University of Leicester, Leicester, UK, 6Diabetes Research Institute, Mills-Peninsula Medical Center, San Mateo, USA, 7Li Ka Shing Knowledge Institute, Division of Endocrinology & Metabolism, St Michael’s Hospital, University of Toronto, Toronto, Canada, 8Scripps Whittier Diabetes Institute, La Jolla, USA.
Background and aims: CONCLUDE was a randomised, open-label, treat-to-target trial in participants with type 2 diabetes who received basal insulin ± oral antihyperglycaemic drugs (OADs) and had ≥1 baseline hypoglycaemia risk factors, including moderate renal impairment. Participants were randomised to insulin degludec 200 U/mL (degludec U200; n=805) or insulin glargine 300 U/mL (glargine U300; ± OADs; n=804). CONCLUDE demonstrated no significant difference in the overall symptomatic hypoglycaemia rate with degludec U200 vs glargine U300 in the maintenance period (primary endpoint, tested for superiority). However, lower rates of nocturnal symptomatic and severe hypoglycaemia in the maintenance period (exploratory secondary endpoints) were observed with degludec U200 vs glargine U300.
Materials and methods: The current post hoc analysis investigated these hypoglycaemia endpoints and glycated haemoglobin (HbA1c) stratified by baseline eGFR subgroups (<60, 60-<90, ≥90 mL/min/1.73 m2).
Results: Change in HbA1c from baseline to end of treatment, and rates and rate ratios for all hypoglycaemia endpoints were comparable across eGFR subgroups and to the primary analyses. No statistically significant interactions were found between the subgroups for the endpoints assessed (Table).
Conclusion: Irrespective of renal function, degludec U200 and glargine U300 resulted in similar HbA1c, and hypoglycaemia rates were consistent with the primary analyses.

Clinical Trial Registration Number: NCT03078478
Supported by: Novo Nordisk
Disclosure: S.R. Heller: Non-financial support; Novo Nordisk.
662
Early postoperative basal insulin therapy for the prevention of post-transplant diabetes onset after kidney transplantation (ITP-NODAT)
E. Schwaiger1,2, S. Krenn1, A. Kurnikowski1, E. Nordheim3,4, T.G. Jenssen3,4, M. Hecking1;
1Department of Internal Medicine III, Medical University of Vienna, Vienna, Austria, 2Internal Medicine II, Med Campus III, Linz, Austria, 3Transplantation Medicine, Oslo University Hospital, Oslo, Austria, 4Faculty of Medicine, University of Oslo, Oslo, Norway.
Background and aims: New onset of hyperglycemia immediately after kidney transplantation is strongly associated with overt post-transplantation diabetes mellitus (PTDM) and increased mortality. We examined the efficacy and safety of basal insulin treatment, initiated early against postoperative hyperglycemia, hypothesizing that PTDM incidence could be reduced long-term.
Materials and methods: Adult kidney transplant recipients without previous diabetes were randomized 1:1 to postoperative capillary blood glucose monitoring and standardized intermediate-acting insulin isophane therapy at afternoon glucose ≥140 mg/dL (=treatment), versus fasting venous blood glucose measurements and short-acting insulin at morning glucose levels ≥200mg/dL (=control). Immunosuppression included tacrolimus once-daily, glucococorticosteroids (“high” versus “low”-dose) and mycophenolate mofetil or mycophenolic acid. PTDM incidence was assessed by oral glucose tolerance tests (OGTTs) at month 6 (blinded), month 12 and month 24 or requirement for antidiabetics. The primary endpoint was PTDM incidence at month 12. Secondary endpoints included PTDM incidence through month 24. Statistics included adjusted odds ratios (ORs) for PTDM incidence. Analyses were done by intention-to-treat and per-protocol (N=8 patients with severe protocol violations excluded).
Results: Among 263 participants (N=133 treatment, N=130 control at baseline), fewer participants in the basal insulin treatment group required permanent use of antidiabetics at month 12 and 24, respectively (adjusted ORs [95% CIs] =0.48[0.16-1.43] and =0.17[0.04-0.70] by intention-to-treat; =0.14[0.03-0.70] and =0.13[0.03-0.66] per-protocol). PTDM incidence, assessed by antidiabetic treatment and OGTT results was also lower in the basal insulin treatment group at month 12 and 24, respectively (adjusted ORs =0.55[0.22-1.36] and =0.45[0.18-1.10] by intention-to-treat; =0.26[0.08-0.80] and =0.35[0.13-0.92] per-protocol). Hypoglycemic events occurred 15 times in the treatment group versus 2 times in the control group, but were clinically not concerning.
Conclusion: Early basal insulin treatment is safe and can prevent the onset of overt PTDM after 12 months. Additional analyses are required to determine whether this strategy reduces cardiovascular complications.

Clinical Trial Registration Number: NCT03507829
Supported by: Subcontract 3002300292 to NIH grant NO 5-R01-DK092475-02; Astellas Pharma GmbH; Eli Lilly GmbH
Disclosure: E. Schwaiger: None.
PS 56 Insulin therapy: real world studies
663
Dosage profile of insulin glargine U100 and U300 in patients with type 2 diabetes in real clinical practice: DosInGlar study
N. Duque1, E. Artime1, I. Romera1, J. Lebrec2, S. Diaz1, A. Sicras3, J. Reviriego1;
1Medical Department, Eli Lilly and Company, Alcobendas, Madrid, Spain, 2HaaPACS GmbH, Schriesheim, Germany, 3Real Life Data, Madrid, Spain.
Background and aims: To compare the dosage profile of Insulin Glargine (InGlar) in patients with type 2 diabetes (T2D) who initiate treatment with InGlar U100 or U300 in Spain.
Materials and methods: Observational retrospective cohort study from electronic medical records in the BIG-PAC® database. Patients ≥18 years with DM2, who started treatment with InGlar U100 or U300 for the first time in 2016-2017 and remained on treatment for 18 months, were selected. Each patient who started treatment with InGlar 100U was matched (1:1) with another patient who started InGlar 300U (Propensity Score Matching), to minimize selection bias. The primary analysis compared changes in daily dose of InGlar at 6, 12 and 18 months from baseline between the matched cohorts, using paired t tests. Changes in HbA1c and weight were analysed descriptively. The daily dose (U/kg) at each time point was calculated as the mean of all prescription records within +/- 2 months intervals.
Results: A total of 1112 patients with complete data were included in the analysis (N=556 in each cohort). The matched cohorts of InGlar 100U and InGlar 300U, respectively, had the following characteristics: mean age (SD) of 63.6 (12.8) vs 63.7 years (11.9); 46.9% vs 46.9% women; mean time (SD) from diagnosis of 9.5 (1.4) vs 9.5 (1.3) years; mean (SD) baseline HbA1c of 72.6 (14.2) mmol/mol [8.8 (1.3) %] vs 71.8 (16.4) mmol/mol [8.7 (1.5) %]; and mean weight (SD) of 84.6 (16.9) vs 84.7 (17.1) kg. The mean daily dose of InGlar at baseline was 0.19 U/kg in both cohorts. A greater increase in dose of InGlar from baseline was observed in patients treated with InGlar 300U vs. InGlar 100U at 6, 12 and 18 months of follow-up (Table). At 12 months, the mean dose of InGlar (U/kg/day) was 10.3 % greater in patients treated with InGlar 300U, reaching a difference of 12.8 % at 18 months.
Conclusion: The insulin dose was higher in patients treated with InGlar 300U compared to InGlar 100U at 6, 12 and 18 months, with similar reductions in HbA1c. At equal insulin glargine price/unit in Spain, increased dose requirements of IGlar 300U would result in higher costs.

Supported by: Eli Lilly and Company
Disclosure: N. Duque: Employment/Consultancy; Eli Lilly and Company.
664
Therapy trends in initial 6 months of the first large-scale longitudinal nationwide study on management and real-world outcomes of diabetes in India (LANDMARC)
H. Thacker1, R. Ghosh2, A.K. Das3, A. Mithal4, S. Joshi5, K.M. Prasanna Kumar6, S. Kalra7, A.G. Unnikrishnan8, B. Sethi9, S. Mohanasundaram2, S. Menon2, A. Nair2, N. Rais10, S. Chowdhury11, LANDMARC study group;
1Bhatia Hospital, Mumbai, 2Sanofi India Ltd., Mumbai, 3Pondicherry Institute of Medical Sciences (PIMS), Puducherry, 4Medanta- The Medicity, Gurgaon, 5Lilavati Hospital, Mumbai, 6Centre for Diabetes and Endocrine Care, Bengaluru, 7Bharti Hospital, Karnal, 8Chellaram Diabetes Institute, Pune, 9Care Hospital, Hyderabad, 10Chowpatti Medical Centre, Mumbai, 11IPGME and R and SSKM Hospital, Kolkata, India.
Background and aims: Therapy patterns were examined across various subgroups during the first 6-months of this 3-year prospective longitudinal study (LANDMARC).
Materials and methods: During the observational period, investigators were free to modify treatment in adults with type 2 diabetes (T2D) controlled/uncontrolled on ≥2 antihyperglycaemic medications. Treatment patterns were analysed using descriptive statistics and paired t-test.
Results: From baseline to 6-months (visit 2 [V2]), glycaemic parameters analysed for 5703 participants improved significantly (p<0.001) across all treatment types (Table). This improvement was more evident in the insulin subgroup vs. insulin naïve subgroup (p<0.0001). No difference (p=0.7843) in mean HbA1c values of those receiving >3 oral anti-diabetic (OADs) vs. ≤3 OADs was noted in insulin naïve subgroup. Notably, in participants receiving insulin along with OADs, postprandial glucose improved more in basal vs. premix regimen (p=0.0023).
Conclusion: Overall, insulin regimen was more effective than OADs. Intensification of treatment with >3 OADs may not be effective in improving glycaemic parameters. In the real-world setting, adding basal insulin may be more effective than premix.
Note: Data accepted for presentation at the American Diabetes Association (ADA), 80th Scientific Sessions, 12-16 Jun 2020, Chicago, USA and permissions have been obtained from ADA to submit as encore abstract.

Clinical Trial Registration Number: CTRI/2017/05/008452
Supported by: Study funded by Sanofi
Disclosure: H. Thacker: Honorarium; Received honorarium from Sanofi as study steering committee expert.
665
Real world evidence of initiating basal insulin and GLP-1 receptor agonists in a relatively simultaneous vs sequential order: impact on glycaemic control
V. Fonseca1, F. Ampudia-Blasco2, R. Lubwama3, X.V. Peng3, A. Boss3, L. Shi4, J. Rosenstock5;
1School of Medicine, Tulane University, New Orleans, USA, 2Clinical University Hospital, Department of Medicine, University of Valencia, Valencia, Spain, 3Sanofi, Bridgewater, USA, 4School of Public Health and Tropical Medicine, Tulane University, New Orleans, USA, 5Dallas Diabetes Research Center at Medical City, Dallas, USA.
Background and aims: Injectable therapy initiation in type 2 diabetes (T2D) is often delayed. This retrospective cohort study evaluated the impact of the timing of initiating both basal insulin and GLP-1 RA in people with uncontrolled T2D (HbA1c ≥9 %) on OADs within 12 months (Optum Humedica database of electronic medical records and claims; 1/1/2011 to 30/6/2017).
Materials and methods: Study cohorts were defined by the days between initiating the first and second injectable: cohort A ≤30 (simultaneous); B 31-90; C 91-180; D 181-270; E 271-360 (sequential). Endpoints: proportion achieving HbA1c <7 % or <8 % and achieving ≥1 % or ≥2 % reduction in HbA1c at 6 and 12 months after initiating the second injectable.
Results: Baseline characteristics (N=6339): mean ± SD age 54 ± 11 years; HbA1c 10.7 ± 1.5 %; weight 108 ± 25 kg; 47% male. Despite slightly higher baseline HbA1c, cohort A had the best glycaemic outcomes at 6 and 12 months for all 4 endpoints, followed by cohort B, then no difference between C, D and E (Table). Cohorts C, D and E were significantly less likely to achieve HbA1c <7 % than cohort A (hazard ratios [95% CI]: 0.62 [0.53-0.72]; 0.62 [0.53-0.72]; 0.63 [0.54-0.73]), but cohort B was not (0.87 [0.76-1.01]).
Conclusion: In summary, despite higher baseline HbA1c, addition of a second injectable agent within 90 days of the first leads to significantly better glycaemic control at 12 months than postponing addition to later in the year in uncontrolled T2D.

Supported by: Sanofi
Disclosure: V. Fonseca: Grants; Bayer, Boehringer Ingelheim, Gilead. Honorarium; Takeda, Novo Nordisk, Sanofi, Eli, Abbott, AstraZeneca, Intarcia, Asahi. Lecture/other fees; Takeda, Novo Nordisk, Sanofi, Eli, Abbott, AstraZeneca, Intarcia, Asahi. Stock/Shareholding; Microbiome Technologies, Insulin Algorithms, BRAVO4Health Stock- Amgen.
666
Effectiveness of premix insulin in type 2 diabetes: a retrospective UK cohort study
E. Jude1, A. Ali2, R. Emral3, N. Nanda4, R. Lubwama5, K. Palmer6, A. Shaunik5, P. Raskin7, F. Gómez Peralta8, C. Trescoli9;
1Tameside Hospital NHS Foundation Trust, Ashton under Lyne, UK, 2Oakenhurst Medical Practice, Blackburn, UK, 3Department of Endocrinology and Metabolic Diseases, Ankara University School of Medicine, Ankara, Turkey, 4Farnham Road Practice, Slough, UK, 5Sanofi, Bridgewater, USA, 6Sanofi, Reading, UK, 7Department of Medicine, University of Texas Southwestern Medical Center, Dallas, USA, 8Endocrinology and Nutrition Unit, Segovia General Hospital, Segovia, Spain, 9Hospital Universitario de La Ribera, Alzira, Spain.
Background and aims: NICE guidelines suggest premix as a treatment option for people with T2D with HbA1c ≥9 % uncontrolled by ≥2 oral antidiabetic drugs (OADs). This retrospective cohort study explored real-world evidence for glycaemic control with premix.
Materials and methods: UK electronic medical record data from THIN database were captured for adults with T2D uncontrolled (HbA1c ≥9 %) on ≥2 OADs initiating premix (index date) from 1/1/2010 to 31/12/2016. Baseline data were collected 12 months pre-index and outcomes followed for 24 months. Glycaemic control was assessed by time to first achievement of HbA1c target <7.5 % and change in HbA1c over time, and evaluated by baseline characteristics.
Results: The final cohort had 974 participants (mean age 62 years; 57% male; mean BMI 31 kg/m2; 27% overweight; 44% obese; 8% Class III obese; mean HbA1c 11.3 %). Common comorbidities were hypertension (64%), dyslipidaemia (23%) and nephropathy (21%). Background medication included metformin (99%), DPP4i (51%), TZD (42%), SU (19%) and SGLT2i (0.5%). Probability of first achievement of HbA1c target <7.5 % was highest at 3-6 months (18%), 14% at 6-9 months, 15% at 9-12 months, and lower from 12 to 24 months (Figure). Target achievement differed by baseline HbA1c, but not OAD use.
Conclusion: Probability of achieving glycaemic targets on premix at 6 months was low, with little additional clinical benefit beyond 12 months, suggesting a high unmet need for early and timely therapy intensification.

Supported by: Sanofi
Disclosure: E. Jude: Honorarium; Sanofi, Novo Nordisk, Lilly, AstraZeneca, Boehringer Ingelheim. Lecture/other fees; Sanofi, Novo Nordisk, Lilly, AstraZeneca, Boehringer Ingelheim.
667
Differences in patient-reported outcomes by age and region in adults with type 1 diabetes in the SAGE study
L. Berard1, F.J. Ampudia-Blasco2, S. Brette3, D. Bruttomesso4, K. Close5, H. Ikegami6, D. Jurišić-Eržen7, F. Lauand8, A. Peters9, V. Pilorget8, B. Ramanathan10, E. Renard11, E.G. Wilmot12, A. Roborel de Climens13;
1Nurse Consultant, Winnipeg, Canada, 2Endocrinology and Nutrition Department, Clinic University Hospital Valencia, Valencia, Spain, 3Aixial, Boulogne-Billancourt, France, 4Department of Medicine, University of Padova, Padova, Italy, 5The diaTribe Foundation, San Francisco, USA, 6Department of Endocrinology, Metabolism and Diabetes, Kindai University Faculty of Medicine, Osaka-sayama, Japan, 7University of Rijeka, Rijeka, Croatia, 8Sanofi, Paris, France, 9Keck School of Medicine, University of Southern California, Los Angeles, USA, 10Kovai Diabetes Speciality Centre and Hospital, Coimbatore, India, 11University of Montpellier, Montpellier, France, 12Diabetes, University Hospitals of Derby and Burton NHS FT, Derby, UK, 13Sanofi, Lyon, France.
Background and aims: Type 1 diabetes (T1D) is a chronic disease impacting patients’ lives and psychosocial health; we explored how this may vary by age and region.
Materials and methods: SAGE was a multinational, cross-sectional observational study using data from medical records and interviews of participants (N=3858) aged ≥26 years with T1D for ≥1 year. Results from patient-reported outcomes (PROs) questionnaires (Hypoglycaemia Fear Survey [HFS-II], Problem Areas in Diabetes [PAID], Insulin Treatment Satisfaction Questionnaire [ITSQ], Audit of Diabetes-Dependent Quality of Life [ADDQoL]) were analysed by region (Asia [A], Eastern Europe [EE], Western Europe [WE], Latin America [LA], Middle East [ME]) and age group (26-<45; 45-<65; ≥65 years).
Results: HFS-II scores showed fear of hypoglycaemia was lowest in A for all age groups (Table). HFS-II scores increased with age in EE and decreased with age in LA. PAID scores showed highest levels of emotional distress in ME for all age groups. ITSQ scores showed treatment satisfaction increased with age in WE, LA and ME, and was more stable in EE and A. ADDQoL total scores showed a small negative impact of T1D on quality of life, with the highest and lowest impact in EE and ME, respectively, across all ages.
Conclusion: PROs scores indicated relatively low levels of diabetes-related impact and high treatment satisfaction. Age and regional differences may reflect variations in T1D control and management, as well as cultural and healthcare-system-related factors.

Supported by: Sanofi
Disclosure: L. Berard: Employment/Consultancy; ABBOTT; Bayer; Novo Nordisk: Eli Lilly; Sanofi; Novo Nordisk; BD; MontMed; Janssen; AstraZeneca; Boehringer Ingelheim; Quanta. Grants; Mont Med. Lecture/other fees; ABBOTT; Novo Nordisk: Eli Lilly; Sanofi; Novo Nordisk; BD; MontMed; Janssen; AstraZeneca; Boehringer Ingelheim.
668
A retrospective, observational, cohort study of the use and effectiveness of basal-bolus or premixed insulin in Japanese people with type 2 diabetes
M. Baxter1, H. Miyoshi2, T. Kimura3, M. Hattori3, Y. Morimoto4, M. Tamiwa4, D. Marinkovich5, T. Hirose6;
1Sanofi, Reading, UK, 2Hokkaido University, Sapporo, Japan, 3Real World Data, Co., Ltd., Kyoto, Japan, 4Sanofi K.K., Tokyo, Japan, 5Sanofi Australia & New Zealand, Sydney, Australia, 6Toho University, Tokyo, Japan.
Background and aims: Many people with type 2 diabetes (T2D) on oral antidiabetes drugs (OADs) cannot reach or maintain target HbA1c, but intensification to insulin regimens is often delayed. Basal insulin may help resolve fasting plasma glucose (FPG) levels; basal-bolus (BB) regimens or premixed prandial and basal insulins (premixes) may lower postprandial plasma glucose (PPG), but are more burdensome and associated with weight gain and hypoglycaemia. To characterise Japanese patients benefiting from FPG and PPG control, we analysed people initiating BB or premixes after OAD failure.
Materials and methods: This retrospective, observational cohort study using Japan’s Health, Clinic and Education Information Institute’s database (2010-2019) followed adults with T2D who initiated BB or premixes after ≥1 OAD failure for up to 360 days for HbA1c outcomes, treatment changes and hypoglycaemia. Results in those who remained on therapy throughout or switched were assessed.
Results: Of 272,813 people with T2D, 1315 and 1195 patients initiated BB or premixes, respectively. Mean baseline (SD) age, HbA1c, duration of diabetes and BMI were 64.6 (12.0) vs 65.4 (11.5) years, 9.8 (2.1) vs 9.0 (1.8) %, 5.1 (6.3) vs 6.2 (6.1) years and 24.2 (4.3) vs 23.2 (4.2) kg/m2 for BB and premix cohorts, respectively. At baseline, 53.8% of the BB cohort were on ≥2 OADs, whereas 53.1% of the premix cohort were on 1 OAD. In BB and premix cohorts, respectively, 45.8 vs 79.7% of people had no change in therapy, of whom 46.2 vs 37.0% achieved HbA1c <7% within 3 months (Table). In the BB cohort, 45.9% switched to a lower injection frequency regimen with a median time to switch of 17 days. Among people who did not switch therapy, 27% of the BB cohort and 16% of the premix cohort experienced hypoglycaemia.
Conclusion: In this population, insulin was initiated after OAD failure when HbA1c was high. Premix use was more common than usually reported and similar to BB. BB vs premix patients were younger with higher HbA1c and shorter disease duration. HbA1c reductions were higher for BB vs premix, but more people in the BB cohort experienced hypoglycaemia. Most premixes were not changed. Switches from BB to less intense regimens (mean 2 months) were numerous, not associated with regression in glycaemic control and consistent with an early aggressive approach to reduce β-cell glucose toxicity. This suggests that in a real-world Japanese population, complex BB regimens may be used for a limited duration with early, clinically important improvements in pre- and post-prandial glycaemic control before treatment is simplified. Both regimens showed good response in HbA1c reductions, which emphasises the importance of FPG and PPG control. However, benefits must always be weighed against risk of hypoglycaemia and complexity of the regimens used.

Supported by: Sanofi
Disclosure: M. Baxter: Employment/Consultancy; Sanofi.
669
Association of patient-reported outcomes scores with glycaemic target achievement in type 1 diabetes in the SAGE study
E.G. Wilmot1, F.J. Ampudia-Blasco2, L. Berard3, S. Brette4, L.E. Calliari5, E. Fitts6, K. Close6, J.J. Gagliardino7, F. Lauand8, A. Peters9, E. Renard10, A. Roborel de Climens11, J. Seufert12;
1University Hospitals of Derby and Burton NHS FT, Derby, UK, 2Endocrinology and Nutrition Department, Clinic University Hospital Valencia, Valencia, Spain, 3Nurse Consultant, Winnipeg, Canada, 4Aixial, Boulogne-Billancourt, France, 5Pediatric Endocrinology, Santa Casa School of Medical Science, Sao Paulo, Brazil, 6The diaTribe Foundation, San Francisco, USA, 7CENEXA, Center of Experimental and Applied Endocrinology (La Plata National University National Scientific and Technical Research Council), La Plata, Argentina, 8Sanofi, Paris, France, 9Keck School of Medicine, Los Angeles, USA, 10University of Montpellier, Montpellier, France, 11Sanofi, Lyon, France, 12Endocrinology and Diabetology, University Hospital of Freiburg, Freiburg, Germany.
Background and aims: Type 1 diabetes (T1D) is a chronic disease affecting both physical and psychosocial health.
Materials and methods: SAGE was a multinational, cross-sectional observational study using data from medical records and interviews of people (N=3858) aged ≥26 years with T1D for ≥1 year. The association between the achievement of general (HbA1c <7 %) or individualised HbA1c targets and patient-reported outcomes (PROs) scores was analysed by multivariate logistic regression, adjusted for region and age group. The following PROs are reported: Hypoglycaemia Fear Survey (HFS-II) worry subscore, Problem Areas in Diabetes (PAID), Insulin Treatment Satisfaction Questionnaire (ITSQ), Audit of Diabetes-Dependent Quality of Life (ADDQoL).
Results: Overall, 24.3% of people achieved the general HbA1c target; 20.9% achieved individualised targets (most common target, HbA1c 7 % to <7.5 %). Lower emotional distress (PAID score) and higher treatment satisfaction (all ITSQ scores except Lifestyle domain) were associated with achievement of general and individualised HbA1c targets (Table). Lower HFS-II worry score and higher ADDQoL total scores were associated with achievement of HbA1c general target, but neither was associated with achieving individualised HbA1c targets.
Conclusion: In people with T1D, lower diabetes-related emotional distress and higher treatment satisfaction appear to be associated with achievement of both general and individualised HbA1c targets.

Supported by: Sanofi
Disclosure: E.G. Wilmot: Lecture/other fees; Abbott Diabetes Care, Eli Lilly, Dexcom, Insulet, Medtronic, Novo Nordisk, Sanofi-Aventis. Non-financial support; Abbott Diabetes Care, Novo Nordisk, Sanofi-Aventis.
670
Effectiveness and safety of Gla-300 vs IDeg-100 evaluated with continuous glucose monitoring profile, in adults with type 1 diabetes in routine clinical practice in Spain: OneCARE study
I. Conget1, E. Delgado2, M.Á. Mangas3, C. Morales4, J. Caro5, M. Gimenez1, M. Borrell6;
1Hospital Clínic, Barcelona, 2Hospital Universitario Central de Asturias, Oviedo, 3Hospital Virgen del Rocio, Seville, 4Hospital Universitario Virgen Macarena, Seville, 5Clinica Medinorte, Valencia, 6Sanofi, Barcelona, Spain.
Background and aims: Compare the effectiveness and safety of insulin glargine 300 U/ml (Gla-300) versus degludec 100 U/ml (IDeg-100), defined as the percentage of time in the target (TIR) glucose range (70-180 mg/dl, 3.9-10 mmol/l) during a four-week period, as measured using continuous glucose monitoring (CGM) in patients with T1D in routine clinical practice in Spain.
Materials and methods: An observational, retrospective cohort, cross-sectional, multicenter study with the participation of 21 endocrinologists in Spain. Adult patients with at least 3 years of T1D diagnosis, who switched from a basal-bolus insulin treatment (first generation basal insulins) to Gla-300 or IDeg-100, 6 last months by medical criteria, with CGM System for > 3 last months (and data for 14 consecutive days of last month prior the study visit) and with glycated hemoglobin levels ≥ 7.5 % pre-switch were included.
Results: An amount of 199 patients with T1D were included: 104 patients switched to Gla-300 and 95 to IDeg-100. Mean age was 42.6 years, 50.5% were women, 50.3% presented university studies and mean time since T1D diagnosis was 18.4 years. The percentage of TIR 70-180 mg/dl was comparable between Gla-300 and degludec cohorts (52.4 ± 14.0% versus 49.3 ± 13.9%, p = 0.1191) during all day and only during night interval (24:00-06:00) a significant difference in TIR was observed: (Gla-300 52,4 ± 18,2% vs degludec 46,2 ± 18.5, p=0.0182). No statistically significant difference was observed in TIR 70-140 mg/dl: 31.9 ± 11.2% in Gla-300 vs 29.7 ± 10.2% in IDeg-100 (p=0.1558). Mean HbA1c value was also comparable between the cohorts (7.6% ± 1.1 versus 7.9% ± 1.1, p=0.1032) as was the mean glucose value in the cohort treated with Gla-300 and degludec (172 mg/dl vs 179 mg/dl, p=0.1032). Mean 24-h glucose curves for the Gla-300 group were statistically smoother (lower glycemic excursions) at night interval (24:00-06:00) than in IDeg-100 (p<0.005). No statistically significant differences in the number of reported hypoglycemic events (<70mg/dl) in the last 14 days were observed between study groups: 97.5% presented hypoglycemic events (97.1% vs 97.9%, p=0.725), mean episodes 0.96 ± 0.64 with a mean duration of 82.7 (38.6) minutes in both cohorts. Glycemic variability showed no differences between the two cohorts.
Conclusion: In terms of the achievement of glucose control recommendations of the last CGM consensus, this real-world study shows that the effectiveness and safety of insulin Gla-300 is similar to that obtained with IDeg-100 in suboptimally controlled T1D patients switching from the first generation basal insulins.

Supported by: Sanofi
Disclosure: I. Conget: None.
671
Insulin glargine 300 U/ml vs first-generation standard-of-care basal insulin analogues in adults with type 2 diabetes: impact of renal function in the ACHIEVE Control study
L. Meneghini1, A. Cheng2, P. Evenou3, J. Gill4, A. Mohamed5, G. Umpierrez6;
1University of Texas Southwestern Medical Center and Parkland Health & Hospital System, Dallas, USA, 2Trillium Health Partners and Unity Health Toronto and University of Toronto, Toronto, Canada, 3Sanofi, Reading, UK, 4Sanofi, Bridgewater, USA, 5IVIDATA Stats for Sanofi, Chilly-Mazarin, France, 6Emory University, Atlanta, USA.
Background and aims: The ACHIEVE Control study, a real-world pragmatic study showed statistical superiority of insulin glargine 300 U/ml (Gla-300) vs standard-of-care basal insulin analogues (SOC-BI; insulin glargine 100 U/ml and insulin detemir) for the primary composite endpoint of individualised Healthcare Effectiveness Data and Information Set glycated haemoglobin (HbA1c) target attainment at 6 months without documented symptomatic (≤3.9 mmol/l) or severe hypoglycaemia. This post-hoc analysis of ACHIEVE Control explored outcomes by estimated glomerular filtration rate (eGFR) at 6 and 12 months.
Materials and methods: ACHIEVE Control was a real-life, multicentre, randomised, open-label, active-controlled, two-arm, parallel group, pragmatic trial in insulin-naïve adults with uncontrolled type 2 diabetes on two or more non-insulin antihyperglycaemic drugs. The composite primary outcome was analysed by subgroups of eGFR of <60, 60 to <90 and ≥90 ml/min/1.73 m2. Secondary outcomes included change from baseline to 6 months and 12 months in HbA1c, basal insulin dose and body weight.
Results: Participants with eGFR <60 ml/min/1.73 m2 were older and had longer duration of type 2 diabetes. Within each eGFR subgroup, baseline characteristics were generally balanced between treatment groups. Within subgroups, odds ratios (OR) for clinical outcomes were generally consistent with the overall study population, which trended in favour of Gla-300 vs SOC-BI (Figure). In participants with eGFR <60 ml/min/1.73 m2, the OR point estimates for absence of documented symptomatic (≤3.9 mmol/l and <3.0 mmol/l) or severe hypoglycaemia at 6 and 12 months strongly favoured Gla-300 (OR >1.40). No clinically significant differences were observed from baseline to months 6 and 12, in change in HbA1c, or basal insulin dose across or within subgroups. No clinically relevant differences were observed between Gla-300 and SOC-BI-treated participants in change in body weight; although the greatest increases in mean body weight were observed for participants with an eGFR of ≥90 ml/min/1.73 m2 in treatment cohorts.
Conclusion: The results in patients across eGFR categories were generally consistent with the overall population. Data from this post-hoc analysis suggest a beneficial trend of Gla-300 vs SOC-BI for avoiding hypoglycaemia in adults with impaired renal function, providing added value to treatment decisions and options for patients and healthcare providers; future confirmatory prospective studies are warranted.

Clinical Trial Registration Number: NCT02451137
Supported by: Writing support by Barrie Anthony, PhD, of Evidence Scientific Solutions Inc, funded by Sanofi US.
Disclosure: L. Meneghini: Other; Consultant: Sanofi-Aventis, Applied Therapeutics; Advisory Board: Sanofi-Aventis, Novo Nordisk.
PS 57 Insulin therapy: fast acting insulin analogues
672
Effect of age on HbA 1c , postprandial glucose control, and hypoglycaemia in patients with type 2 diabetes treated with Ultra Rapid Lispro (URLi) or Lispro: PRONTO-T2D
A. Chang, T. Hardy, Q. Zhang;
Eli Lilly and Company, Indianapolis, USA.
Background and aims: URLi is a novel prandial insulin lispro formulation developed to more closely match physiological insulin secretion. PRONTO-T2D, a Phase 3, double-blind, treat-to-target study in patients with T2D, showed URLi, in a basal-bolus regimen with glargine or degludec, was non-inferior for HbA1c with superior PPG control vs. Humalog.
Materials and methods: Subgroup analyses on the efficacy and safety of URLi were performed in patients <65 vs. ≥65 years.
Results: Baseline characteristics were similar except age and duration of T2D (Table 1). With 26 weeks of study treatment, HbA1c improved in both treatment/age groups with endpoint mean HbA1c 51-52 mmol/mol. URLi significantly reduced 1- and 2-hour PPG excursions with standardized meal tests vs. Humalog in both age groups. Insulin dosing was not significantly different. Severe hypoglycaemia incidence was low. While there was no treatment difference in documented hypoglycaemia (glucose <3 mmol/L), relative rate (URLi/Humalog) was lower in patients ≥65 vs. < 65 years, with a significant treatment-by-age interaction. Nocturnal hypoglycaemia was not significantly different between groups. Incidence of overall treatment-emergent adverse events was similar between treatment/age groups.
Conclusion: URLi in a basal-bolus regimen resulted in endpoint HbA1c <53 mmol/mol and significantly lower PPG excursions vs. Humalog in both age groups, with reduced documented hypoglycaemia in older vs. younger patients.

Clinical Trial Registration Number: NCT03214380
Supported by: Eli Lilly and Company
Disclosure: A. Chang: Employment/Consultancy; Eli Lilly and Company. Stock/Shareholding; Eli Lilly and Company.
673
Technosphere insulin use in type 1 and type 2 diabetes is associated with weight loss compared to insulin analogues or insulin mixtures over 26 Weeks
A.L. Hoogwerf1, D.M. Kendall1, N.S. Zaveri1, P.M. Morey1, B.J. Hoogwerf2;
1Medical and Clinical Affairs, MannKind Corporation, Westlake Village, 2Diabetes, Endocrinology and Metabolism (Emeritus), Cleveland Clinic, Cleveland, USA.
Background and aims: Technosphere Insulin (TI) is a dry-powder formulation of recombinant human insulin adsorbed onto Technosphere microparticles for oral inhalation. Weight loss has been observed in individual clinical trials of technosphere insulin in type 1 diabetes. This analysis sought to determine the magnitude of weight change of technosphere insulin versus comparators across the pivotal phase three program in type 1 and type 2 diabetes mellitus.
Materials and methods: Three pivotal trials in type 1 diabetes mellitus (T1DM) and two pivotal trials in type 2 diabetes mellitus (T2DM) compared TI to usual forms of mealtime subcutaneous (SC) insulin. Studies in T1DM (n=1163) included either insulin lispro or aspart as comparators. Each treatment was added to basal insulin. Studies in T2DM (n=927) included one trial in which patients on basal insulin were randomized to ultra rapid-acting TI or insulin aspart. In the other trial, patients on basal insulin plus prandial TI were compared to 70/30 insulin analog mixture. Body weight and A1C were measured at 24 to 26 weeks in each study. Least squares mean (SE) and change estimates for weight and A1C were analyzed based on modified Intention to Treat (ITT) analyses.
Results: Weight changes shown in the graph demonstrate weight loss with technosphere insulin versus comparators which demonstrated weight gain. A1C results: Treatment with TI in T2DM achieved A1C non-inferiority (non-inferiority margin 4 mmol/L [0.4%]) versus aspart and 70/30. A1C change was -9 mmol/L [-0.82% (SE 0.56%)] for TI group, -12 mmol/L [-1.13 % (SE 0.98%)] for aspart group, and -9 mmol/L [-0.84% (SE [0.07%)] for 70/30 group. Treatment with TI in T1DM achieved non-inferiority versus comparator. A1C change was -1 mmol/L [-0.08% (SE 0.04%)] in TI group, and - 3 mmol/L [-0.29% (SE 0.04%)] in the comparator group.
Conclusion: In both T1DM and T2DM, ultra rapid-acting TI treatment was associated with weight loss while comparator insulin treatments were associated with weight gain. These changes appear to be independent of changes in A1C. In contrast to the weight gain generally observed with addition of SC mealtime insulin, addition of TI appears to be associated with a weight advantageous clinical profile.

Clinical Trial Registration Number: NCT00700622, NCT01445951, NCT00539890, NCT00308308, NCT00309244
Disclosure: A.L. Hoogwerf: None.
674
Dose titration and clinical effects of inhaled technosphere insulin compared to mealtime subcutaneous (SC) analogue insulin therapy in type 1 diabetes
D.M. Kendall1, J. Krueger1, M.C. Jones1, R. Abaniel2, P.M. Morey1, M. Grant1, B.J. Hoogwerf3;
1MannKind, Westlake Vlg, 2Keck Graduate Institute, Los Angeles, 3Diabetes, Endocrinology and Metabolism (Emeritus), Cleveland Clinic, Cleveland, USA.
Background and aims: Insulin dosing has been a clinical challenge since the introduction of “islet extract” in the 1920’s. Route of administration, insulin preparation and peptide modifications are known to alter clinical effects of insulin. With newer insulins, patients and clinicians must clearly understand effective dosing. Ultra rapid-acting Technosphere Insulin (TI) is a dry-powder formulation of recombinant human insulin adsorbed onto Technosphere microparticles administered by pulmonary inhalation. TI cartridges are labeled as insulin “units” (4, 8, 12 unit cartridges). With proper dose titration, TI achieves comparable glucose control, improves mealtime glucose, and lowers hypoglycemia risk vs subcutaneous mealtime insulin analogs in T1D.
Materials and methods: These analyses compare doses of TI achieved after active titration in 4 randomized trials in individuals with T1D. The ratio of TI inhalation units (based on labeled cartridge content) to SC prandial analog in the comparator group was calculated for each trial at study endpoint.
Results: See Chart
Conclusion: The current analyses across 4 unique studies support the titration of individual patients to TI doses that are approximately 1.5 - 2.0x those of their comparable SC analog insulin doses. These data show that greater “unit doses” of TI should be used to achieve glycemic control in T1D and thus, insulins should be dosed based on glycemic responses rather than “insulin units.”

Supported by: MannKind Corporation
Disclosure: D.M. Kendall: Employment/Consultancy; MannKind Corporation. Stock/Shareholding; MannKind, Eli Lilly.
675
A new concentrated U-200 formulation of Ultra Rapid Lispro (URLi) demonstrated bioequivalence to URLi U-100
H. Linnebjerg, E.S. LaBell, M.A. Dellva, S. Lim, D.E. Coutant, J. Leohr;
Eli Lilly and Company, Indianapolis, USA.
Background and aims: URLi is a novel insulin lispro formulation developed to more closely match physiological insulin secretion and improve postprandial glucose control. URLi U-200 is a concentrated formulation of URLi containing the same units of insulin in half of the volume. The URLi U-200 formulation is being developed as an option for patients requiring a higher daily mealtime insulin dose, allowing for a greater number of units to be included in each injection device.
Materials and methods: This randomised, double-blind, 4-period, replicated crossover, study assessed pharmacokinetics (PK) and glucodynamics (GD) after single 15 U subcutaneous doses of URLi U-100 and URLi U-200 in 68 healthy subjects (mean ± SD age 39.6 ± 9.6 y). The PK and GD insulin action evaluated using a euglycemic clamp were assessed up to 10-h post injection.
Results: Similar mean PK and GD profiles were observed after dosing URLi U-100 and URLi U-200. The formulations were bioequivalent (BE): the 90% CI of ratios of geometric least-square means for the maximum insulin lispro concentration (Cmax) and total insulin lispro exposure (AUC0-∞) were within BE limits of 0.80-1.25. Additionally, the 90% CI for the ratios of geometric means for maximum glucose infused (Rmax), and total glucose infused (Gtot) were within the BE limits. The time to early half Cmax (early 50% tmax) occurred at approximately the same time for both formulations. Additionally, insulin exposure within the first 15 and 30 minutes was similar for URLi U-100 and URLi U-200 formulations. The tolerability of the URLi U-200 and URLi U-100 formulations were comparable.
Conclusion: This study demonstrated that URLi U-100 and URLi U-200 formulations were BE, and the rapid insulin absorption was maintained in the URLi U-200 formulation. The GD were similar and support the ability of patients to transfer from URLi U-100 to URLi U-200 in a 1:1 unit conversion.

Clinical Trial Registration Number: NCT03616977
Supported by: Eli Lilly and Company
Disclosure: H. Linnebjerg: Employment/Consultancy; Eli Lilly and Company. Stock/Shareholding; Eli Lilly and Company.
676
Ultra Rapid Lispro (URLi) showed greater reduction in postprandial glucose (PPG) vs lispro in children, adolescents, and adult patients with type 1 diabetes
T. Danne1, R. Aronson2, H. Linnebjerg3, J. Leohr3, E.S. LaBell3, D.E. Coutant3, Q. Zhang3, R. Pollom3;
1Department of General Pediatrics and Endocrinology/Diabetology at the Children's Hospital on the Bult, Hannover, Germany, 2LMC Diabetes and Endocrinology, Toronto, Canada, 3Eli Lilly and Company, Indianapolis, USA.
Background and aims: URLi is a novel insulin lispro formulation developed to more closely match physiological insulin secretion.
Materials and methods: This 2-site, randomised, 2-period crossover, double-blind study evaluated the pharmacokinetics and glucodynamics during a liquid test meal, after a single 0.2 U/kg SC dose of URLi or Lispro in 13 children, 14 adolescents, 15 adults with T1D.
Results: Onset of insulin appearance was faster with URLi vs Lispro in children (1.1 vs 6.5 min; p=0.0002), adolescents (1.9 vs 6.4 min; p=0.001), and adults (0.9 vs 4.8 min; p=0.004). Early exposure (AUC0-15min) was greater with URLi vs Lispro: 7-fold (p<0.0001) in children, 4‑fold (p=0.0003) in adolescents, 5-fold (p<0.0001) in adults; late exposure (AUC3-7h) was reduced by 58% (p<0.0001) in children, 40% (p=0.013) in adolescents, 37% (p=0.021) in adults. Total exposure was similar in URLi and Lispro. At 1h, URLi reduced PPG by 2.3 mmol/L (p=0.008) in children, 1.1 mmol/L (p=0.195) in adolescents, 1.9 mmol/L (p=0.018) in adults, vs Lispro. At 2h, URLi reduced the PPG by 1.8 mmol/L (p=0.11) in children, 2.2 mmol/L (p=0.051) in adolescents and was not statistically different in adults, vs Lispro. URLi was well tolerated in all age groups.
Conclusion: In summary, URLi accelerated insulin lispro absorption, reduced late exposure and early PPG following a test meal vs Lispro in children, adolescents, and adults with T1D.

Clinical Trial Registration Number: NCT03465878
Supported by: Eli Lilly and Company
Disclosure: T. Danne: Lecture/other fees; AstraZeneca, Dexcom, Eli Lilly and Company, Medtronic, Novo Nordisk, Sanofi. Stock/Shareholding; DreaMed Diabetes, Ltd.
677
Effect of stratification factors and baseline postprandial glucose on glycaemic control after 26 weeks of Ultra Rapid Lispro (URLi) or Lispro: subgroup analyses of PRONTO-type 1 diabetes
J.I. Cho, J. Bue-Valleskey, T. Hardy;
Eli Lilly and Company, Indianapolis, USA.
Background and aims: Ultra rapid lispro (URLi) is a novel prandial insulin lispro formulation developed to more closely match physiological insulin secretion and improve postprandial glucose (PPG) control. In PRONTO-T1D, a phase 3, 26-week, treat-to-target study comparing URLi to Humalog in patients with type 1 diabetes (T1D) on a multiple daily injection regimen with insulin glargine or degludec, mealtime URLi was non-inferior to mealtime Humalog for change from baseline HbA1c and superior for PPG control with a similar safety profile to Humalog. Randomization to treatment was stratified by basal insulin type, baseline HbA1c and prandial insulin dosing plan (carb counting, yes/no).
Materials and methods: The impact of these randomization strata and baseline 2-hour PPG subgroup on the differential treatment effects of URLi vs Humalog on HbA1c change, insulin dose, and hypoglycaemia rates was assessed from the double-blind treatment groups: mealtime URLi (n=451) and mealtime Humalog (n=442).
Results: Significant treatment differences (p<0.05 for URLi vs. Humalog) were associated with basal insulin and baseline 2-hour PPG subgroups for some endpoints. However, none of the treatment-subgroup interactions were significant (all p>0.1) (Table 1.)
Conclusion: Numerically, results suggest that basal insulin type, starting PPG, and starting HbA1c, but not prandial dosing plan, may influence the magnitude of the HbA1c improvement and/or hypoglycaemia risk reduction among patients treated with URLi compared to Humalog.

Clinical Trial Registration Number: NCT03214367
Supported by: Eli Lilly and Company
Disclosure: J.I. Cho: Employment/Consultancy; Eli Lilly and Company. Stock/Shareholding; Eli Lilly and Company.
678
Ultra Rapid Lispro (URLi) demonstrates similar time in target range to Lispro with the Medtronic MiniMed 670G hybrid closed-loop system
B. Bode1, A. Carlson2, R. Liu3, T. Hardy3, J. Boyd1, R. Bergenstal2, S. Morrett3, D. Ignaut3;
1Atlanta Diabetes Association, Atlanta, 2International Diabetes Center, Minneapolis, 3Eli Lilly and Company, Indianapolis, USA.
Background and aims: URLi is a novel ultra rapid formulation of insulin lispro that shows improved postprandial glucose control and similar compatibility with continuous subcutaneous insulin infusion (CSII) vs. Lispro. In this study URLi was evaluated for the first time in a hybrid closed-loop system using the Medtronic MiniMedTM 670G. Primary objective was to compare URLi to Lispro with respect to the percentage of time with glucose values within target range 70-180 mg/dL (%TIR).
Materials and methods: This double-blind, crossover study included two 4-week treatment periods with URLi or Lispro. After a 2-week lead-in on insulin lispro, 42 adults with type 1 diabetes using personal MiniMed 670G pumps were randomized to 1 of the 2 treatment sequences with boluses initiated 0-2 minutes before meals.
Results: Both treatments achieved good glycemic control with mean TIR >75% (Fig 1). Mean time above and below range met consensus recommendations for both treatments. The percentage of time in Auto Mode was similar between treatments: URLi 92.0%; Lispro 91.4%. Insulin doses and pump settings were generally similar between treatments. There were no serious adverse events or early discontinuations. Overall incidence of treatment-emergent adverse events was similar between treatments.
Conclusion: URLi demonstrated comparable glycemic control and a similar safety profile to Lispro with the MiniMed 670G system in patients with type 1 diabetes.

Clinical Trial Registration Number: NCT03760640
Supported by: Eli Lilly and Company
Disclosure: B. Bode: None.
679
Ultra Rapid Lispro (URLi) accelerates insulin lispro absorption and insulin action vs Lispro: a meta-analysis of pharmacokinetic and glucodynamic data
J. Leohr, M.A. Dellva, K. Carter, E.S. LaBell, H. Linnebjerg;
Eli Lilly and Company, Indianapolis, USA.
Background and aims: URLi is a novel insulin lispro formulation developed to more closely match physiological insulin secretion and improve postprandial glucose control. This meta-analysis compared and assessed the consistency of the pharmacokinetics (PK) and glucodynamics (GD) between URLi and Lispro in healthy subjects and patients with type 1 diabetes (T1D) or type 2 diabetes (T2D).
Materials and methods: The meta-analysis included 4 randomised, double-blind, crossover, single-dose studies in a total of 190 participants ranging from 18-77 years of age. The studies included the following: healthy subjects (n=74), younger patients with T1D (18-64y; n=41), elderly patients with T1D (≥65y; n=37), and patients with T2D (n=38). These studies evaluated single subcutaneous doses of 7, 15, or 30 U URLi and Lispro. The PK and GD were assessed up to 8 to 10 h. The insulin action for the GD was evaluated using a euglycemic clamp.
Results: Meta-analysis showed a ~5 min faster (95% CI:-5.38, -4.12 min) onset of appearance with URLi vs Lispro. The early insulin exposure was ~8 times greater (95% CI:6.63, 8.51) in first 15 min and 3 times greater (95% CI:2.74, 3.22) in the first 30 min after URLi vs. Lispro. URLi reduced the late insulin exposure after 3 hours by 43% (ratio 0.57; 95% CI:0.53, 0.60) and the duration of exposure by 68 min (95% CI:-76.86, -59.53 min) vs. Lispro. URLi had a faster onset of action occurring 10 min earlier (95% CI:-12.01, -8.64 min), and early action was increased 3-fold in the first 30 min (95% CI:2.72, 3.50 min) with URLi vs. Lispro. Late insulin action (glucose infused 4 h to end of the clamp) was reduced by 35% (ratio 0.65; 95% CI:0.61, 0.70) and duration of action was 44 min shorter with URLi (95% CI:-58.60, -29.02 min). Total exposure and glucose infused during the clamp was similar between URLi vs. Lispro for each dose level and within each study population.
Conclusion: URLi had a faster insulin lispro absorption, reduced late exposure, and an overall shorter exposure duration compared to Lispro. URLi also demonstrated an earlier insulin action while reducing the late insulin action compared to Lispro. Across the studied dose range, age groups, and study populations, URLi consistently demonstrated an ultra-rapid PK and GD profile compared to Lispro.
Clinical Trial Registration Number: NCT02942654, NCT03305822, NCT03166124, NCT03286751
Supported by: Eli Lilly and Company
Disclosure: J. Leohr: Employment/Consultancy; Eli Lilly and Company. Stock/Shareholding; Eli Lilly and Company.
680
Postprandial glucose control using the Medtronic Advanced Hybrid Closed Loop System: faster-acting insulin aspart vs insulin aspart
M.H. Lee1, S. Vogrin1, B. Paldus1, D. Morrison1, D. Zaharieva2, J. Lu1, H. Jones1, E. Netzer1, C. Sims1, R.J. MacIsaac1, B. Grosman3, A. Roy3, N. Kurtz3, A. Jenkins1, D.N. O'Neal1;
1Department of Medicine, St Vincent's Hospital, University of Melbourne, Melbourne, Australia, 2Department of Pediatrics, Stanford University, Stanford, USA, 3Medtronic Diabetes, Northridge, USA.
Background and aims: Faster-acting insulin aspart (FiAsp) may improve responsiveness of closed-loop (CL) systems and provide better postprandial glucose (PPG) management due to its more rapid onset and offset compared to insulin aspart (Asp). The Medtronic Advanced Hybrid Closed Loop (AHCL) System features auto-basal and auto-bolus functions. The aim of this study was to compare PPG control using FiAsp vs. Asp delivered using AHCL.
Materials and methods: Twelve adults with T1D (median HbA1c 7.1% [IQR 6.8, 7.2]; 54mmol/mol [51, 55]) were assigned to FiAsp or Asp (unblinded) in random-order over two-stages (6-weeks duration each) using AHCL. Postprandial periods were defined using set time-blocks for breakfast (06:00-10:00); lunch (11:00-15:00); and dinner (17:00-21:00), based on conventional meal-times and meal distribution. CGM data was analyzed using signed-rank test.
Results: With all postprandial time-block data aggregated, FiAsp demonstrated greater overall time-in-range (TIR) (3.9-10mmol/L) (p=0.028) and less hyperglycaemia (p=0.041) compared with Asp (Table). TIR was greater during lunch (p=0.034) for FiAsp vs. Asp, with no difference during breakfast or dinner. Over the 6-week duration, FiAsp use trended towards greater TIR vs. Asp (82.7% vs. 80.4%, p=0.07).
Conclusion: FiAsp appears to confer an advantage compared with Asp for PPG control whilst using AHCL even in subjects with high overall TIR.

Clinical Trial Registration Number: ACTRN12619000469112
Supported by: This investigator-initiated study was supported by a grant from Medtronic.
Disclosure: M.H. Lee: Grants; Medtronic. Non-financial support; Medtronic and Novo Nordisk for material support.
681
Long-term safety and efficacy of Ultra Rapid Lispro (URLi) in PRONTO-T1D
J.M. Bue-Valleskey1, L.J. Klaff2, J. Cho1, M.A. Dellva1, N. Schloot1, J. Miura3, D. Dahl4, J. Tobian1;
1Eli Lilly and Company, Indianapolis, USA, 2Rainier Clinical Research Center, Renton, USA, 3Diabetes Center, Tokyo Women’s Medical University School of Medicine, Tokyo, Japan, 4Joint Practice Internal Medicine and Diabetes, Bad Homburg, Germany.
Background and aims: PRONTO T1D was a phase 3 study evaluating URLi in adults with type 1 diabetes (T1D) for 52 weeks.
Materials and methods: Subjects were randomised to double-blind mealtime URLi, Lispro, or open-label postmeal URLi with insulin degludec or glargine for the first 26 weeks. Subjects on URLi (n=451) and Lispro (n=442) given 0-2 minutes before meals continued for another 26 weeks to assess long-term safety and efficacy.
Results: Mean HbA1c at 52 weeks (7.47% URLi; 7.54% Lispro) increased significantly (p<0.001) from baseline in both groups (+0.13% [URLi] vs. +0.20% [Lispro]) and showed an estimated treatment difference (ETD) (95% confidence interval [CI]) (ETD: -0.06 [-0.16, 0.03]) that was similar to that previously reported at 26 weeks. Proportions of patients with HbA1c <7% at week 52 were similar (URLi, 26.8%; Lispro, 24.5%). At week 52, self-monitored blood glucose profiles showed that 1-hour (ETD: -13.5 [-19.4, -7.5]) and 2-hour (ETD: -8.4 [-14.1, -2.7]) postmeal daily mean glucose (and corresponding excursions) as well as the daily mean glucose (ETD: -6.1 [-10.6, -1.6]) were statistically significantly (p<0.01) lower during treatment with URLi than Lispro. Mean total insulin dose was 0.80 U/kg (URLi) vs. 0.78 U/kg (Lispro). No difference was observed for body weight change (+0.8 kg [URLi] vs. +0.9 kg [Lispro]; ETD: -0.1 kg [−0.5; 0.4]). Adverse events were similar between URLi and Lispro. No difference was observed for severe hypoglycaemia (12.28 events/patient-100yr [URLi] vs. 15.96 [Lispro]) or documented symptomatic hypoglycaemia rates (glucose <3.0 mmol/L) with URLi (4.84 events/patient-year) vs. Lispro (5.18) with a relative rate: 0.93 (95% CI: 0.75,1.16). No long-term safety issues were identified with URLi.
Conclusion: Overall glycaemic control and improved postprandial glucose via self-monitoring was maintained after 52 weeks with URLi vs. Lispro suggesting that the efficacy and rapid onset of action of URLi is preserved during long-term treatment in patients with T1D.
Clinical Trial Registration Number: NCT03214367
Supported by: Eli Lilly and Company
Disclosure: J.M. Bue-Valleskey: Employment/Consultancy; Eli Lilly and Company. Stock/Shareholding; Eli Lilly and Company.
PS 58 The challenges of insulin therapy in type 2 diabetes
682
Comparisons of ascending versus descending dosage styles in short-term intensive insulin treatment in patients with newly diagnosed type 2 diabetes
Z. Huang, K. Ng, Z. Zhang, J. Li, W. Deng, Y. Li;
Department of Endocrinology and Diabetes Center, The First Affiliated Hospital of Sun Yat-sen University, Guangzhou, China.
Background and aims: We’ve shown that short-term intensive insulin treatment (SIIT) in patients with newly diagnosed type 2 diabetes mellitus induced long-term drug-free remission, and that glucose level after SIIT predicted remission. We aimed to compare two SIIT styles (ascending dosage versus descending dosage) in glucose control, hypoglycemic events and weight changes.
Materials and methods: A total of 263 cases of newly diagnosed type 2 diabetes received SIIT in our hospital were retrieved from chart review. Included patients were aged 48.9 ± 11.5yr, BMI were 25.3 ± 3.5kg/m2, HbA1c were 10.3 ± 2.3%, FPG were 12.4 ± 3.7mmol/L, fasting C-peptide were 0.69 ± 0.34nmol/L.
Results: There were 170 patients in the ascending dosage group, and the descending dosage group comprised of 93 cases. No differences were found in baseline clinical characteristics including age, gender, length of stay, HbA1c and fasting C-peptide, TC, HDL-c, UA, liver and kidney function, except that the ascending dosage group had relatively higher FPG (12.9 ± 3.8 vs 11.5 ± 3.5, p<0.001), TG, whereas lower LDL-c. The total daily insulin dose at initiation (29.9 ± 8.2U vs 38.3 ± 11.3U) and on pump suspension (44.1 ± 14.2U vs 23.9 ± 9.9U) were significantly different (p<0.001). The primary relapse (FBG≥7.0 mmol/L and 2hBG≥10.0 mmol/L after pump suspension) rates in the ascending dosage vs descending dosage groups were similar (27.1% vs 18.3, p=0.111). The descending dosage group had significantly lower averaged FBG and 2hBG after each meal during SIIT. The FBG were similar, whereas 2hBG after breakfast on the next day after pump suspension was lower in the descending dosage group. There were more mild hypoglycemic events occurred and less weight gain in the descending dosage group (Table 1).
Conclusion: Both styles were effective in SIIT, while descending dosage group achieved more stringent glucose control during and after pump treatment, which might be more favorable in long-term remission.

Supported by: National Key R&D Program of China (2018YFC1314100).
Disclosure: Z. Huang: None.
683
Automated insulin delivery (AID) system performance with and without meal announcement: effect of meal macronutrient content
M. Katz1, R. Brazg2, A. Bartee1, A. LaLonde1, R. Jones1, H. Wolpert1;
1Eli Lilly and Company, Indianapolis, 2Rainier Research, Renton, USA.
Background and aims: Missed meal boluses contribute to suboptimal glucose control. There has been limited evaluation of missed boluses for complex or high glycaemic index meals while on hybrid closed loop AID systems.
Materials and methods: Ten subjects with type 1 diabetes (50% male), age 52±10 y, HbA1c 7.1±0.9%, insulin requirement 0.5±0.2 U/kg/day, used the Lilly investigational AID system (model predictive control algorithm) during a 48 h inpatient observation with 6 meals. For each subject, the 2 breakfast (pancake; [60 g carbohydrate (CHO), 15±4 g fat]) and 2 dinner (pizza; [53±3 g CHO, 20±1 g fat]) meals were identical, and were consumed with or without a pre-meal insulin bolus. Lunch meals were subject-selected (44±16 g CHO, 7±5 g fat), and appropriate pre-meal boluses were administered.
Results: Time-in-range (TIR, 3.9-10.0 mmol/L) overnight was 99.2±9.5% and following the lunches was 82.1±26.4%. In contrast, TIR following pancake and pizza challenges with bolus were 56.0±34.4% and 65.8±29.6%, and without bolus were 17.8±5.1% and 36.5±25.2%, respectively. Incremental area under the curve (0-2 h) following the pancake meal was larger than the pizza meal within both the bolused and non-bolused scenarios (Table).
Conclusion: This study highlights the importance of structured, but varied meal challenge tests in the evaluation of AID system performance. Meal macronutrient content affects AID performance in bolused and non-bolused scenarios.

Clinical Trial Registration Number: NCT03848767
Disclosure: M. Katz: Employment/Consultancy; Eli Lilly and Company. Stock/Shareholding; Eli Lilly and Company.
684
Efficacy and safety of fast-acting insulin aspart in adults with type 2 diabetes with different insulin requirements
G. Sesti1, W. Lane2, M. Ekelund3, O. Thórisdóttir3, E. Jódar4, A. Oviedo5, N. Rathor6, P. Senior7, E. Franek8;
1Department of Clinical and Molecular Medicine, Sapienza University of Rome, Rome, Italy, 2Mountain Diabetes and Endocrine Centre, Asheville, USA, 3Novo Nordisk A/S, Søborg, Denmark, 4University Hospital Quirónsalud Madrid, Universidad Europea, Madrid, Spain, 5Santojanni Hospital and Cenudiab, Ciudad Autonoma de Buenos Aires, Buenos Aires, Argentina, 6Novo Nordisk Service Centre India Private Ltd., Bangalore, India, 7Division of Endocrinology and Metabolism, University of Alberta, Edmonton, Canada, 8Mossakowski Medical Research Center, Polish Academy of Sciences, and Department of Endocrinology and Diabetology CSK MSWiA, Warsaw, Poland.
Background and aims: A previous post hoc analysis of the 26-week onset 2 trial indicated that with insulin glargine the effect of fast-acting insulin aspart (FA) vs insulin aspart (IAsp) on PPG increment (meal test) was larger for subjects on high bolus insulin doses in bolus-naïve adults with type 2 diabetes (duration ≥6 mo). This post hoc analysis of the 16-week onset 9 trial aimed to confirm this and explore efficacy and safety of FA vs IAsp, both with insulin degludec, in bolus-experienced adults with type 2 diabetes (duration ≥10 yrs) by insulin requirement.
Materials and methods: Participants were divided by meal test bolus dose at baseline: ≤10 U (n=303), 10-20 U (n=518) or >20 U (n=270).
Results: Baseline characteristics were similar across subgroups; except for BMI and daily insulin dose, which increased with meal test dose (Table). Change from baseline in HbA1c 16 weeks post randomisation was similar for FA vs IAsp across subgroups. There was a trend in favour of FA vs IAsp for change from baseline in PPG increments (meal test), but treatment differences did not depend on subgroup. There was a trend towards lower rates of severe or blood glucose-confirmed hypoglycaemia with higher insulin doses at meal test, with a benefit for FA vs IAsp in the >20 U subgroup.
Conclusion: Treatment difference (FA vs IAsp) in change from baseline in PPG increments was unaffected by bolus insulin dose; however hypoglycaemia risk may be lower with FA vs IAsp in adults with long-standing type 2 diabetes and high bolus insulin requirements.

Clinical Trial Registration Number: NCT03268005
Supported by: Novo Nordisk A/S
Disclosure: G. Sesti: Honorarium; Novo Nordisk, Eli Lilly, AstraZeneca, Boehringer Ingelheim, MSD, Sanofi, Amgen, GlaxoSmithKline, Theras, L-Nutra, Servier.
685
Diagnostic criteria for post-transplant diabetes after kidney transplantation: an analysis through 2 years in patients from the ITP-NODAT study
A. Kurnikowski1, E. Nordheim2,3, E. Schwaiger1,4, S. Krenn1, T.G. Jenssen2,3, M. Hecking1;
1Department of Internal Medicine III, Medical University of Vienna, Vienna, Austria, 2Transplantation Medicine, Oslo University Hospital, Oslo, Norway, 3Faculty of Medicine, University of Oslo, Oslo, Norway, 4Internal Medicine II, Med Campus III, Linz, Austria.
Background and aims: Post-transplant Diabetes Mellitus (PTDM) has recently been classified as drug- or chemical-induced, distinguishing it from Type 2 Diabetes (T2DM), and according to convention it should be diagnosed by an oral glucose tolerance test (OGTT). Patients with PTDM frequently have fasting glucose and HbA1c levels below the diabetic threshold, but with elevated 2-hr glucose (2hPG) ≥200 mg/dL. Here we assessed the performance of fasting plasma glucose (FPG) and HbA1c as diagnostic tools compared to 2hPG derived from an OGTT at 6, 12 and 24 months after kidney transplantation, and we also did the same comparison in non-transplanted subjects with and without T2DM.
Materials and methods: The multicentric ITP-NODAT study was a randomized controlled trial of early insulin intervention versus standard of care in kidney transplant recipients (abstract also submitted for this EASD conference). Here we included 131 ITP-NODAT study participants not on glucose-lowering drugs and analyzed their OGTT and HbA1c data by bivariate correlation and receiver operating characteristics curves for sensitivity versus specificity, in comparison to 57 general population subjects of similar age and body mass index.
Results: OGTT-derived 2hPG ≥200mg/dL occurred in 5.3%, 7.6% and 6.9% participants at 6, 12 and 24 months post-transplant, respectively (shown as orange dots in the figure). Sensitivity and specificity for HbA1c and FPG increased through 24 months and were optimal if the HbA1c threshold was lowered to 6.2% in month 12 and month 24, and if the FPG threshold was lowered to 112 mg/dL in month 6, where HbA1c was not reliable (see figure and figure legend). FPG, 2hPG and HbA1c correlated more strongly in general population subjects (all r2 ranging from 0.77 to 0.83) than in transplanted participants.
Conclusion: Conventional HbA1c and FPG thresholds for diagnosis of T2DM underestimated the incidence of PTDM characterized by OGTT-derived 2hPG ≥200 mg/dL. For PTDM diagnosis, in the absence of an OGTT, the data suggested using a slightly lower HbA1c threshold of 6.2% (combined with FPG 126 mg/dL) in posttransplant months 12 and 24.

Clinical Trial Registration Number: NCT03507829
Supported by: Subcontract 3002300292 to NIH grant NO 5-R01-DK092475-02; Astellas Pharma GmbH; Eli Lilly GmbH
Disclosure: A. Kurnikowski: None.
686
Treatment satisfaction in people with type 2 diabetes receiving basal insulin: results from real-world and randomised controlled studies with insulin glargine 300 U/ml
S. Harris1, F.J. Snoek2, L.F. Meneghini3, F. Lauand4, J. Westerbacka4, A. Roborel de Climens5, K. Khunti6;
1Western University, London, Canada, 2Medical Psychology, Amsterdam University Medical Center, Amsterdam, Netherlands, 3Internal Medicine – Division of Endocrinology, UT Southwestern Medical Center, Dallas, USA, 4Sanofi, Paris, France, 5Sanofi, Lyon, France, 6Diabetes Research Centre, University of Leicester, Leicester, UK.
Background and aims: Basal insulin (BI) analogues can help optimise glycaemic control in people with type 2 diabetes (T2D), but the patients’ satisfaction is key for acceptance and treatment adherence.
Materials and methods: ACHIEVE, REACH, and REGAIN were open-label real-world studies comparing insulin glargine 300 U/ml (Gla-300) with standard of care BI (ACHIEVE: insulin glargine 100 U/ml [Gla-100] or insulin detemir [IDet]; REACH and REGAIN: Gla-100, IDet, insulin degludec [IDeg] or neutral protamine Hagedorn). EDITION 1-3 and BRIGHT were open-label randomised controlled trials (RCTs) comparing Gla-300 with Gla-100 and IDeg, respectively. All studies were in people with uncontrolled T2D and used the Diabetes Treatment Satisfaction Questionnaire (DTSQ; Table).
Results: In RCTs and real-world studies, initiating BI in insulin-naïve participants was associated with improved treatment satisfaction after 6 months (ACHIEVE, 12 months) and a reduction in the perceived frequency of hyperglycaemia. Perceived hypoglycaemia increased slightly from low baseline values. Similar findings were found in patients switching BI, with improved patient satisfaction and reduced perceived frequency of hyperglycaemia after 6 months of treatment, and no change in perceived hypoglycaemia.
Conclusion: Initiating or switching BI in people with uncontrolled T2D can improve patient satisfaction, irrespective of baseline diabetes treatment.

Supported by: Sanofi
Disclosure: S. Harris: Employment/Consultancy; Abbott, AstraZeneca, Eli Lilly, Janssen, Merck, Novo Nordisk, Sanofi. Grants; Abbott, Applied Therapeutics Inc., AstraZeneca, Canadian Institutes for Health Research (CIHR), Eli Lilly, Health Canada/First Nations and Inuit Health Branch, Janssen, JDRF. Honorarium; Abbott, AstraZeneca, Eli Lilly, Janssen, Merck, Novo Nordisk, Sanofi.
687
Efficacy and safety of insulin glargine 300 U/ml versus glargine 100 U/ml in East Asian population with type 2 diabetes: a patient-level meta-analysis of phase 3 studies
L. Ji1, Y. Bi2, S. Ye3, Y. Huang4, X. Zhang4, S. Shang4, N. Cui4;
1Peking University People's Hospital, Beijing, 2Drum Tower Hospital Affiliated to Nanjing University Medical School, Nanjing, 3The First Affiliated Hospital of University of Science and Technology of China, Hefei, 4Sanofi, Shanghai, China.
Background and aims: Insulin glargine 300 U/mL (Gla-300) is a new second generation basal insulin analog which has a more stable and prolonged pharmacokinetic and pharmacodynamic (PK/PD) profile than insulin glargine 100 U/mL (Gla-100). The efficacy and safety of Gla-300 has been evaluated worldwide in people with type 1 and type 2 diabetes (T1DM and T2DM). Herein, we report a patient-level meta-analysis of three EDITION clinical trials (EDITION AP, JP2, and 3) where glycemic control and hypoglycemia were examined over 6 months in a large East Asian population with T2DM.
Materials and methods: All three clinical trials had similar study design and endpoints. Patient populations with T2DM included for analysis were as follows: EDITION AP (N=604) was conducted in China Mainland, Taiwan and Korea; EDITION JP2 (N=241) was conducted in Japan; EDITION 3 was conducted worldwide, however, for this analysis only participants from Japan (N=76) were included. EDITION AP and EDITION 3 included insulin naïve patients, while EDITION JP2 included patients already on basal insulin with OAD(s). In this pool, 561 patients were treated with Gla-300 and 360 patients with Gla-100.
Results: After the 6-month treatment period, mean change in HbA1c was similar for Gla-300 (−1.19 [SE 0.05] %) and Gla-100 (−1.21 [0.05] %), showing non-inferiority of Gla-300 to Gla-100 (LS mean difference 0.02 [95% CI: -0.08 to 0.12] %]). Gla-300 was associated with a reduced risk of experiencing a hypoglycemic event (BG confirmed ≤3.9mmol/L or severe) vs Gla-100 at any time of day or at night (00:00-05:59 h). The event rates of hypoglycemia were consistently lower with Gla-300 than Gla-100. Severe hypoglycemia was rare in both treatment groups (0.7% with Gla-300 vs 0.9% with Gla-100). Weight gain with Gla-300 and Gla-100 was small (mean change: 0.49 [SE 0.86] kg vs 0.75 [0.43] kg, respectively), with a trend for less weight gain with Gla-300 (−0.27 [95% CI −1.2 to 0.67] kg). Basal insulin dose increased in both groups (mean basal insulin dose at month 6: 0.35 [SD 0.18] U/kg/day with Gla-300 and 0.3 [0.14] U/kg/day with Gla-100) (Table 1).
Conclusion: Gla-300 provides comparable glycemic control to Gla-100 in East Asian T2DM patients, with consistently less hypoglycemia at any time of the day and less nocturnal hypoglycemia. These results confirm the efficacy and safety profile of Gla-300 observed in the global EDITION program.

Clinical Trial Registration Number: NCT02855684; NCT01689142; NCT01676220
Supported by: Sanofi
Disclosure: L. Ji: Lecture/other fees; Sanofi.
688
Contribution of fasting and postprandial plasma glucose to HbA1c in people with type 2 diabetes on basal-bolus insulin: a meta-analysis of insulin lispro clinical trials
B. Liao, Y. Chen, F. Chigutsa, C. Piras de Oliveira;
Eli Lilly and Company, Indianapolis, USA.
Background and aims: Management of both fasting and postprandial glucose (PPG) is essential to achieving optimal glycaemic control as measured by HbA1c. However, there is no clarity on the magnitude of the contribution of fasting plasma glucose (FPG) and PPG to overall glycaemic control, especially among patients on insulin therapy. We therefore conducted a meta-analysis to quantify the degree of contribution of FPG and PPG to HbA1c in people with type 2 diabetes (T2D) on a basal-bolus insulin regimen.
Materials and methods: Relevant studies were identified through a systematic search of an integrated database of insulin lispro clinical trials. Studies with a treatment duration ≥24 to ≤26 weeks were eligible if patients received basal and prandial insulin therapy and collected ≥7 self-monitored blood glucose (SMBG) values. A multivariate regression model was used to quantify the contribution of FPG and PPG change to the change in HbA1c (HbA1c change = FPG change + [PPG daily mean - FPG] change) (primary model). A second model was used as a sensitivity analysis (HbA1c change = FPG change + [Non-FPG SMBG daily mean - FPG] change). FPG was defined as the morning premeal SMBG value and PPG as the average of morning, midday, and evening 2-hour postmeal SMBG values.
Results: Five studies met the criteria for inclusion in the meta-analysis including 1572 patients with mean ± SD age, 57.7 ± 9.5 years; HbA1c, 8.6 ± 1.0%; BMI, 31.4 ± 5.7 kg/m2; duration of diabetes, 12.2 ± 6.4 years. Mean change from baseline HbA1c was -1.31% (±1.18) with an endpoint of 7.26% (±1.03). In the primary model, a 1 mmol/L change in FPG was associated with a 0.25% (±0.01) change in HbA1c (range 0.18-0.26%), and a 1 mmol/L change in PPG with 0.16% (±0.01) change in HbA1c (range 0.11-0.19%), all p<.0001. Similar results were obtained in the sensitivity analysis: 1 mmol/L change in FPG resulted in 0.26% (±0.01) change in HbA1c (range 0.19-0.27%); 1 mmol/L change in PPG resulted in 0.18% (±0.01) change in HbA1c (range 0.14-0.24%), all p<.0001.
Conclusion: We sought to quantify the degree of contribution of FPG and PPG to HbA1c in people with T2D on basal-bolus insulin therapy and found a statistically significant association between changes in both FPG and PPG with changes in HbA1c. Results are consistent with those reported previously in a different patient population. In people with T2D on basal-bolus insulin therapy, we saw a significant association between changes in both FPG and PPG with changes in HbA1c, reinforcing the importance of targeting both fasting and postprandial hyperglycaemia in the daily management of diabetes.
Supported by: Eli Lilly and Company
Disclosure: B. Liao: Employment/Consultancy; Eli Lilly and Company.
689
Dual I China: improved glycaemic control with IDegLira versus its mono-components in Chinese patients with type 2 diabetes uncontrolled on oral antidiabetic drugs
W. Wang1, B. Agner2, B. Luo3, L. Liu2, M. Liu4, Y. Peng5, S. Qu6, K.A. Stachlewska2, G. Wang7, Q. Zhang8, G. Ning1;
1Rui Jin Hospital, Shanghai Jiao Tong University School of Medicine, Shanghai, China, 2Novo Nordisk A/S, Søborg, Denmark, 3Novo Nordisk China Pharmaceuticals, Beijing, China, 4Tianjin Medical University General Hospital, Tianjin, China, 5Shanghai General Hospital, Shanghai Jiao Tong University, Shanghai, China, 6Shanghai Tenth People's Hospital of Tongji University, Shanghai, China, 7The First Hospital of Jilin University, Jilin, China, 8The First Affiliated Hospital of Anhui Medical University, Hefei, China.
Background and aims: Insulin degludec/liraglutide (IDegLira) is a once-daily, fixed-ratio combination of basal insulin degludec (IDeg) and liraglutide (lira), a glucagon-like peptide 1 receptor agonist. IDegLira has been extensively investigated in the global DUAL trials. DUAL I China aimed to confirm the efficacy and safety of IDegLira in Chinese patients with type 2 diabetes (T2D) uncontrolled on oral antidiabetic drugs (OADs).
Materials and methods: This phase 3, 26-week, multicentre, randomised, treat-to-target, open-label trial of IDegLira vs IDeg or lira was conducted in Chinese adults with T2D (HbA1c 7-10%) previously on metformin ± one other OAD. Primary endpoint was change from baseline to Week 26 in HbA1c. Secondary endpoints included change in weight, number of treatment-emergent severe or blood glucose (BG)-confirmed hypoglycaemic events, end-of-treatment insulin dose (all comparing IDegLira vs IDeg) and attainment of HbA1c <7%. Safety assessments were conducted.
Results: In total, 720 patients with mean baseline HbA1c 8.2% were randomised 2:1:1 to IDegLira (n=361), IDeg (n=179) or lira (n=180). At Week 26, mean HbA1c decreased by 1.7% with IDegLira, vs 1.1% with IDeg (estimated treatment difference [ETD] -0.59% [95% CI -0.73; -0.46] p<0.0001), and by 1.0% with lira (ETD -0.63% [-0.76; -0.49] p<0.0001), confirming non-inferiority of IDegLira vs IDeg and superiority vs lira. More patients attained HbA1c <7% with IDegLira (77%) vs IDeg (46%) or lira (48%). IDegLira was superior in mean change in weight vs IDeg (+0.1 vs +1.2 kg respectively, ETD -1.08 kg [-1.55; -0.62] p<0.0001). The proportions of patients experiencing hypoglycaemia were similar in both insulin groups (8.1% for IDegLira vs 8.0% for IDeg), with a non-significant numerical difference in the rate of severe or BG confirmed hypoglycaemic events (0.24 vs 0.17 episodes per patient year of exposure for IDegLira and IDeg, respectively; p=0.3008). At end-of-treatment, patients treated with IDegLira received a significantly lower daily dose of insulin vs IDeg (24.5 U vs 30.3 U respectively, ETD -5.49 U [-7.77; -3.21] p<0.0001). There were no unexpected safety issues.
Conclusion: Results confirm that IDegLira is an effective and well tolerated treatment for Chinese patients with T2D uncontrolled on OADs, consistent with the data from the global DUAL trials.

Clinical Trial Registration Number: NCT03172494
Supported by: Novo Nordisk A/S
Disclosure: W. Wang: None.
690
Dual II China: superior HbA1c reductions and weight loss with IDegLira vs insulin degludec in Chinese patients with type 2 diabetes inadequately controlled on basal insulin
Y. Pei1, B.R. Agner2, B. Luo3, X. Dong4, D. Li5, J. Liu6, L. Liu2, M. Liu7, Y. Lu8, T. Nishida9, X. Xu10, Y. Mu1;
1Chinese People's Liberation Army General Hospital, Beijing, China, 2Novo Nordisk A/S, Søborg, Denmark, 3Novo Nordisk China Pharmaceuticals, Beijing, China, 4Jinan Central Hospital, Jinan, China, 5Inner Mongolia People’s Hospital, Hohhot, China, 6Fifth People’s Hospital of Shanghai, Shanghai, China, 7Tianjin Medical University General Hospital, Tianjin, China, 8The Second Affiliated Hospital of Nanjing Medical University, Nanjing, China, 9Novo Nordisk Pharma Ltd, Tokyo, Japan, 10Fuzhou General Hospital, Fuzhou, China.
Background and aims: Insulin degludec/liraglutide (IDegLira), a once-daily, fixed-ratio combination of basal insulin degludec (IDeg) and the glucagon-like peptide 1 receptor agonist, liraglutide, has been extensively investigated in the global DUAL trials. In DUAL II China, the efficacy and safety of IDegLira was assessed in Chinese patients with type 2 diabetes (T2D) inadequately controlled on basal insulin 20-50 U/day, metformin ± one other oral antidiabetic medication.
Materials and methods: In this phase 3, 26-week, multicentre, double-blinded, treat-to-target trial, Chinese adults with T2D and HbA1c ≥7.5% were randomised 2:1 to IDegLira (max. daily dose: 50 U IDeg/1.8 mg liraglutide) or IDeg (max. 50 U/day), respectively, both in combination with metformin. Change from baseline in HbA1c was the primary endpoint. Confirmatory secondary endpoints were change from baseline in body weight, and number of severe or blood glucose (BG)-confirmed (<3.1 mmol/L) hypoglycaemic events. Total daily insulin dose and responders for HbA1c <7% were supportive secondary endpoints. All endpoints were assessed after 26 weeks, as were adverse events.
Results: In 453 randomised patients, baseline characteristics were balanced between arms. At 26 weeks, superiority of IDegLira (−1.88%) vs IDeg (−0.97%) was confirmed for reduction in HbA1c from baseline, estimated treatment difference (ETD) [95% CI]: −0.92% [−1.09; −0.75], p<0.0001 (Figure). Significantly more patients achieved HbA1c <7% with IDegLira (51.0%) vs IDeg (14.1%), estimated OR [95% CI]: 6.31 [3.78; 10.54], p<0.0001. Superiority was confirmed for weight loss with IDegLira (-0.68 kg) vs IDeg (+0.40 kg), ETD: -1.08 kg [-1.63; -0.52], p=0.0002, and for severe or BG-confirmed hypoglycaemia (0.25 vs 0.48 events/patient year of exposure, respectively, estimated rate ratio [95% CI]: 0.53 [0.30; 0.94], p=0.0297). Mean total daily insulin dose was significantly lower for IDegLira vs IDeg (34.2 U vs 37.6 U, respectively, p=0.0014). No new safety or tolerability concerns emerged in either arm.
Conclusion: IDegLira resulted in superior glycaemic control vs IDeg, with weight loss benefits, a lower daily insulin dose and a lower rate of hypoglycaemia. These findings are consistent with the global DUAL trials, and support the efficacy and safety of IDegLira as a treatment intensification option in Chinese patients with T2D inadequately controlled with basal insulin.

Clinical Trial Registration Number: NCT03175120
Supported by: Novo Nordisk
Disclosure: Y. Pei: Other; Abstract supported by Novo Nordisk.
691
Comparison of insulin degludec / insulin aspart co-formulation therapy twice-daily with free combination of liraglutide plus IDeg
Y. Aso, M. Sagara, T. Jojima, T. Iijima, T. Tomaru, I. Usui;
Dokkyo Medical University, Mibu, Japan.
Background and aims: We compared the efficacy and safety of insulin degludec/insulin aspart co-formulation (IDegAsp) twice-daily to a free combination of basal insulin degludec and GLP-1 receptor agonist liraglutide (IDeg+Lira) once-daily for patients with inadequately controlled type 2 diabetes on insulin therapy and oral antidiabetic drugs.
Materials and methods: Eligible patients were randomly allocated at a 1:1 ratio to receive either the once-daily dual-injection of IDeg+Lira (n=24) or twice-daily single-injection of IDegAsp (n=28). The primary endpoints were: HbA1c changes over 52 weeks of treatment and the percentage of participants achieving HbA1c<7.0% at week 52.
Results: After 52 weeks, HbA1c decreased by 0.3% in the IDegAsp group and by 0.7% in the IDeg+Lira group. The HbA1c reduction was greater in the IDeg+Lira group than in the IDegAsp group. 19% of patients on IDegAsp versus 40% on IDeg+Lira achieved HbA1c<7.0%. Pre-breakfast and pre-dinner blood glucose at 52 weeks were significantly lower in the IDeg+Lira group than in the IDegAsp group. The reduction in body mass index (BMI) was greater in the IDeg+Lira group than in the IDegAsp group throughout the study period. The confirmed hypoglycemia rates were 1.32 and 0.69 per patient/year of exposure to IDegAsp and IDeg+Lira, respectively.
Conclusion: In patients with inadequately controlled type 2 diabetes on insulin therapy and oral antidiabetic drugs, treatment with the once-daily dual-injection of IDeg+Lira compared to the twice-daily single-injection of IDegAsp showed no significant difference in glycemic control, but with a slightly larger reduction in HbA1c at 52 weeks, and statistically superior weight loss.
Clinical Trial Registration Number: UMIN000024865
Disclosure: Y. Aso: None.
PS 59 Different aspects of insulin therapy
692
Missing glucose measurements and failure to initiate early postoperative insulin therapy associate with PTDM and dropout-rate in the ITP-NODAT study
S. Krenn1, E. Schwaiger1,2, A. Kurnikowski1, E. Nordheim3,4, T.G. Jenssen3,4, M. Hecking1;
1Department of Internal Medicine III, Medical University of Vienna, Vienna, Austria, 2Internal Medicine II, Med Campus III, Linz, Austria, 3Transplantation Medicine, Oslo University Hospital, Oslo, Norway, 4Faculty of Medicine, University of Oslo, Oslo, Norway.
Background and aims: Failure to correctly execute the study protocol affects efficacy in clinical intervention trials and can be a consequence of clinical inertia, or non-adherence by health care providers and/or study participants. Here we aimed at exploring whether delayed insulinization and missingness of capillary blood glucose data during the first postoperative week were associated with worse outcomes and patient dropout-rates in a multicenter trial on posttransplant diabetes mellitus (PTDM) prevention after kidney transplantation.
Materials and methods: We analyzed data from 133 kidney transplant recipients studied over 2 years in the intervention group of a multicenter, randomized, controlled, clinical trial (ITP-NODAT Study, abstract also submitted for this EASD conference). The trial assessed the effects of early postoperative NPH insulin intervention, initiated once the measured afternoon capillary glucose exceeded 140 mg/dL (primary endpoint: PTDM incidence after 12 months). Here we counted the days during the first week after transplantation on which there was “failure to insulinize” (F2I) when indicated or “missing afternoon glucose” (MAG), and added the days from F2I and MAG to create a “therapy initiation score“ (TIS [in days]), harnessing synergistic effects of the former two. Values above 3 days were Winsorized (lumped into one 3+ group) for more balanced group sizes. Logistic regression analyses were performed to explore whether F2I, MAG or TIS were associated with PTDM or dropping out at months 6, 12 and 24 post-transplantation. Secondary analyses for PTDM were performed adjusting for risk factors: age, BMI, polycystic kidney disease and family history of type 2 diabetes. For secondary dropout analyses, late dropping out was assessed by excluding month 6 dropouts.
Results: Incidence of PTDM was 17.7%, 12.6% and 14.2%, while drop-out rates were 9.8%, 13.5%, and 15.8 % at months 6, 12 and 24 post-transplantation, respectively. The associations between F2I/MAG/TIS and PTDM/dropping out, respectively, are shown in the table. Additional days of F2I and MAG associated with higher odds of PTDM incidence. MAG scores also associated positively with drop-out rates, but the association was inverse and not significant for F2I scores. Risk factor adjustment resulted in higher ORs.
Conclusion: The TIS was easy to implement and associated with higher odds for PTDM and higher drop-out rates in the ITP-NODAT study. We propose that analyses of clinical inertia may provide important information in studies assessing interventions against diabetes, on top of the primary study outcomes.

Clinical Trial Registration Number: NCT03507829
Supported by: Subcontract 3002300292 to NIH grant NO 5-R01-DK092475-02; Astellas Pharma GmbH; Eli Lilly GmbH
Disclosure: S. Krenn: None.
693
Performance of the Lilly automated insulin delivery (AID) system: results of early phase feasibility study
A. Bartee1, A. LaLonde1, M. Katz1, R. Brazg2, M. Christiansen3, H. Wolpert1, R. Jones1;
1Eli Lilly and Company, Indianapolis, 2Rainier Clinical Research Center Inc., Renton, 3Diablo Clinical Research Inc., Walnut Creek, USA.
Background and aims: AID systems have led to demonstrated improvements in time in range without increasing hypoglycaemia. Further advances in performance and usability will set the stage for more widespread adoption of this technology in diabetes self-management.
Materials and methods: This inpatient early feasibility study evaluated the Lilly hybrid closed‑loop system comprising a high-accuracy pump (developed by DEKA Research & Development Corp.), Lispro insulin, pump-embedded model predictive control algorithm, Dexcom continuous glucose monitor, and smartphone-based controller. Subjects underwent two similar 2-day inpatient protocols (10 adults with type 1 diabetes per protocol) including meal-related challenges (~30% over-bolus and 1-hour delayed bolus encompassing carbohydrate coverage and hyperglycaemia correction) to simulate real-world diabetes self-management errors.
Results: Subjects (25% male) had mean age: 44.7±14.2 years, type 1 diabetes duration: 30.2±11.1 years, HbA1C: 7.2±0.8%, and insulin usage: 0.53±0.21 U/kg/day. The table below describes glucose control (percent time in different ranges [mean±SD]) while the subjects were on the AID system.
Conclusion: In this closely supervised feasibility study, the Lilly AID system demonstrated expected algorithm performance in response to simulated diabetes self-management errors and promising glycemic outcomes. Clinical trial evidence in more ‘real-world’ environments will provide additional information on the safety and effectiveness of the system.

Clinical Trial Registration Number: NCT03368807
Disclosure: A. Bartee: Employment/Consultancy; Eli Lilly and Company. Stock/Shareholding; Eli Lilly and Company.
694
The burden of mealtime insulin dosing in adults and children with type 1 diabetes
W. Lane1, E. Lambert2, J. George3, N. Rathor3;
1Mountain Diabetes and Endocrine Center, Asheville, USA, 2Ipsos MORI, London, UK, 3Novo Nordisk A/S, Bangalore, India.
Background and aims: Timely and accurate mealtime insulin dosing is an ongoing challenge for people with type 1 diabetes (T1D). This multinational study aimed to assess attitudes, behaviours and the overall impact of pre-meal (15-20 minutes) bolus insulin dosing from the perspective of adults with T1D, parents of children with T1D and physicians.
Materials and methods: Online surveys were conducted in 2711 participants (recruited from an online panel) who chose to take part across USA, Canada, UK, Japan, Spain and France between 25 Nov 2019 and 06 Feb 2020. Participants were 1401 adults aged ≥18 with T1D, 350 parents who live with children with T1D aged ≤15 years and 960 physicians who have practised for 4-40 years. Adults/children had T1D for ≥6 months and were taking a bolus insulin (excluding fast-acting insulin aspart). Physicians were responsible for starting or managing treatment for T1D and the prescription of mealtime insulin. This analysis provides a country average assuming equal sizes for each country, to give an overall indication of results across the six countries in the study.
Results: Of the surveyed adults with T1D (46% male; mean age was 43 years; mean of 19 years with T1D), 72% administered their bolus insulin by injection and 28% used an insulin pump. Continuous glucose monitoring (CGM) was used by 43% of adults. Of the parents surveyed (64% male; mean age was 10 years; mean of 4 years with T1D), 74% administered their bolus insulin by injection and 26% used an insulin pump, with 58% using CGM. The findings indicate that a majority (96%) of both adults with T1D and parents of children with T1D understood the importance of administering bolus insulin accurately. However, few adults (35%) and parents (47%) felt very confident in estimating the amount of insulin required accurately and 91% of adults and 96% of parents experienced challenge(s) with pre-meal insulin dosing. Almost all physicians (99.6%) reported that they believed their patients with T1D faced challenge(s) with pre-meal bolus insulin dosing. Of those surveyed, 25% of adults and 38% of parents forgot to administer pre-meal insulin ≥1 a week, and 70% of adults and 81% of parents reported that they/their child ate more or less than anticipated following their mealtime insulin ≥1 a week. Accordingly, 68% of adults and 79% of parents indicated that they/their child needed to take corrective action ≥1 a week by either eating more or taking more insulin. A majority of participants (82% of adults, 93% of parents) felt that administering insulin 15-20 minutes before a meal had a negative impact on their/their child’s day-to-day life; 91% of physicians concurred that this creates an extra burden in the day-to-day lives of people with T1D. When asked their preference, 73% of adults and 67% of parents preferred bolus insulin administration either immediately before (42% adults, 44% parents) or after (31% adults, 23% parents) a meal. A high proportion of adults with T1D (67%) and parents (72%) claimed that taking bolus insulin immediately before or after a meal would have a positive impact on their overall quality of life.
Conclusion: Based on the study findings, although the importance of accurate mealtime dosing was well recognised, bolus insulin dosing still poses clear challenges to most people with T1D. Given the choice, the majority of participants would prefer to administer insulin immediately prior to or following a meal, as this was perceived to improve quality of life.
Supported by: Novo Nordisk A/S
Disclosure: W. Lane: Non-financial support; Novo Nordisk.
695
Marked heterogeneity of diurnal variability of basal insulin requirements in pump-treated patients with type 1 diabetes
A.M. Lindmeyer, J.J. Meier, M.A. Nauck;
Department of Medicine I, Diabetes Division, Bochum, Germany.
Background and aims: Some pump-treated patients with type 1 diabetes achieve good glycemic control with constant basal insulin infusion rates, while others need higher insulin infusion rates during the night to address their “dawn” phenomenon. We analyzed the individual need for such different basal insulin infusion profiles.
Materials and methods: Data from 339 adult patients with type 1 diabetes on insulin pump therapy undergoing a 24 h fast as a basal rate test were retrospectively analyzed. Hourly programmed basal insulin infusion rates and plasma glucose concentrations as well as their proportions within, below, or above arbitrarily defined target ranges were assessed for specific periods of the day (e.g., 1-7 a.m., “dawn” period, 4-7 p.m., reference period 9 p.m. - 1 a.m./10 a.m. - 2 p.m.), by tertiles of a pre-defined “dawn” index (mean basal insulin infusion rate during the “dawn” divided by the reference periods).
Results: The “dawn” index varied inter-individually from 0.7 to 4.4-. Individual basal insulin infusion profiles exhibited substantial differences (p = 0.011), especially overnight. Despite higher insulin infusion rates at 4 and 6.45 a.m., patients with the most pronounced “dawn” phenomenon exhibited higher plasma glucose concentrations at those time points (p < 0.012). Patients with a marked “dawn” phenomenon exhibited a lower probability for low values (< 4.4 mmol/l) and a higher probability of high values (> 7.2 mmol/l) during the dawn period (all p values < 0.01).
Conclusion: Our results indicate a substantial inter-individual heterogeneity in the “dawn” phenomenon, with some patients doing well on an almost constant basal insulin supply, while others need an up to 4.4-fold rise in basal insulin infusions between 1 and 7 a.m. Within each “dawn” tertile, similar plasma glucose concentrations were achieved despite signicant differences in insulin delivery, indicating the individual appropriateness of empirically derived variations in basal insulin infusion profiles.

Disclosure: A.M. Lindmeyer: None.
696
Human versus analogue insulin in patients after pancreatectomy: open, prospective, randomised, intervention study
J. Jurczynska1, W. Korcz2, G. Lech2, S. Hammoud1, W. Pawlowski2, M. Slodkowski2, L. Czupryniak1;
1Department of Diabetology and Internal Medicine, Medical University of Warsaw, Warsaw, 2Department of General, Gastroenterological and Oncological Surgery, Medical University of Warsaw, Warsaw, Poland.
Background and aims: There is little evidence on the choice of insulin preparation in patients with diabetes after pancreatectomy. The aim of the study was to compare human vs analog insulin therapy in patients with diabetes after pancreatectomy performed due to pancreatic tumor. In addition, the study aimed at evaluating the relationship between subclinical inflammation and the efficacy of insulin treatment and the risk of chronic complications in subjects with diabetes after pancreatectomy.
Materials and methods: The study was designed as an open, prospective, randomized, intervention study. 93 patients aged 22-79 yrs with pancreatic tumor have been enrolled, they were randomized into two groups: Group 1 - treated with human insulin preparations, Group 2 - treated with insulin analogues. All patients who underwent total pancreatectomy were treated with insulin. The patients who had partial pancreatectomy performed were treated with basal insulin when the fasting plasma glucose was >140 mg/dl and with prandial insulin when postprandial plasma glucose was >180 mg/dl. Plasma concentration of selected cytokines (IL-6, IL-8, IL-10), vascular factors (E-selectin) and metabolic factors (adiponectin) was assessed before surgery in all patients. The clinical and metabolic assessment was carried out 3 and 6 months after surgery.The study was approved by Local Ethics Committee.
Results: The analysis was performed in 80 patients in whom complete results were available after 3 and 6 months after surgery. The most common surgical procedures were distal pancreatectomy (DP)(n=23), pylorus-preserving pancreatoduodenectomy (PPP)(n=19), Whipple procedure (WP) (n=15), total pancreatectomy (TP) (n=10). The most common histopathological diagnosis was adencarcinoma of the pancreas (n=38) and carcinoma of the ampulla of Vater (n=18). All patients after TP were treated with insulin while only 41 % after PPP or WP and only 17 % after DP required insulin therapy. The patients treated with insulin analogues (n=19) achieved better metabolic control than the patients treated with human insulin (n=14): 3 and 6 months after the surgery HbA1c was 6.4±0.81 vs 7.36±1.85 (p<0.05) and 6.52±0.76 vs 7.32±0.74% (p<0.01), respectively, the risk of hypoglycemia was similar in both groups. On hospital discharge mean daily dose of insulin (DDI) in the patients after TP was 37±13 IU and was significantly higher than after WP or PPP - 20±15 (p<0.05), and after after DP - 19±10 (p<0.01). The patients after TP had higher 3- and 6-month HbA1c values than those after WP or PPP and DP: 7.38±2.04 vs 6.37±0.74 vs 6.19±0.85 (p<0.05) and 7.14±0.85 vs 6.47±0.63 vs 6.47±0.93% (p<0.05), respectively. In patients with IgG4-related disease (n=5) higher concentration of E selectin was observed compared to other groups of patients (p<0.05). The concentration of other factors did not differ between the groups.
Conclusion: The treatment with insulin analogues is associated with better metabolic control compared to the use of human insulin with comparable risk of hypoglycemia. Over 80% of patients after DP and over 50% of patients after WP or PPP did not require insulin therapy in the first 6 months after surgery. E-selectin may be a marker of IgG4-related disease and may be useful in the planning of surgery.
Supported by: Diabetes Poland
Disclosure: J. Jurczynska: None.
697
An euglycaemic glucose clamp study to evaluate the relative bioavailability of LY2963016 to insulin glargine in healthy Chinese subjects
Y. Ji1, Y. Yu2, F. Wang1, H. Linnebjerg3, E.J. Pratt3, H. Li1, H. Liu2, L.S. Tham4;
1Lilly Suzhou Pharmaceutical Co. Ltd., Shanghai, China, 2Department of Endocrinology, West China Hospital of Sichuan University, Chengdu, China, 3Eli Lilly and Company, Indianapolis, USA, 4Lilly Centre for Clinical Pharmacology, Singapore, Singapore.
Background and aims: LY2963016 (LY IGlar) and insulin glargine (IGlar) are both long-acting human insulin analogues with identical primary amino acid sequence. LY IGlar has been approved as a biologic in the US and as a biosimilar in the EU for control of hyperglycemia in patients with T1DM or T2DM, but not yet in China. The aim of the study was to evaluate the relative bioavailability of LY IGlar compared to IGlar in healthy Chinese subjects, as well as the pharmacodynamic (PD) responses, and safety and tolerability.
Materials and methods: This was a phase 1, single-site, open-label, single-dose (0.5 U/kg, s.c.), crossover study. Healthy Chinese subjects were randomly assigned 1:1 to a treatment sequence of either LY IGlar (Period 1) followed by IGlar (Period 2), or IGlar (Period 1) followed by LY IGlar (Period 2). A between-period washout lasted for ≥ 7 days. Blood samples were collected before and up to 24 hours after dosing to assess pharmacokinetic (PK) characteristics. PD characteristics were assessed by euglycemic glucose clamp up to 24 hours after dosing.
Results: A total of 58 subjects (26 males and 32 females) aged 18-33 years participated in the study. PK and PD characteristics were comparable between LY IGlar and IGlar (Table). PK comparison of LY IGlar to IGlar exposures showed that the ratios of geometric least-squares (LS) means (90% confidence interval [CI]) were 0.961 (0.887, 1.04) and 0.941 (0.872, 1.01) for maximum observed drug concentration (Cmax) and area under the concentration versus time curve from time zero to 24 hours (AUC[0-24]), respectively. PD comparison of LY IGlar to IGlar showed that the ratios of geometric LS means (90% CI) were 0.91 (0.85, 0.98) and 0.89 (0.82, 0.97) for maximum glucose infusion rate (Rmax) and total amount of glucose infused over the clamp duration (Gtot), respectively. As for safety, the proportions of subjects reporting treatment-emergent adverse event were comparable between LY IGlar (5.4%) and IGlar (6.9%) treatment. No deaths or other serious adverse events were observed.
Conclusion: The study demonstrated that LY IGlar and IGlar were comparable in PK and PD characteristics following single-dose subcutaneous administration in healthy Chinese subjects. The relative bioavailability of LY IGlar to IGlar was 96.1% and 94.1% based on Cmax and AUC(0-24), respectively. LY IGlar was well tolerated in these subjects. These main results are comparable to those of the disclosed PK/PD study of LY IGlar in healthy non-Chinese subjects.

Clinical Trial Registration Number: NCT03555305
Disclosure: Y. Ji: Employment/Consultancy; Lilly Suzhou Pharmaceutical Co. Ltd.
698
Trends in U.S. insulin use for people with diabetes: 2009-2017
M. Perez-Nieves1, R. Juneja1, L. Fan1, E.S. Meadows1, M.J. Lage2, E. Eby1;
1Eli Lilly and Company, Indianapolis, 2HealthMetrics Outcomes Research, Delray Beach, USA.
Background and aims: We examined trends of insulin regimens, delivery devices and glucose monitoring among people with type 1 diabetes (T1D) or type 2 diabetes (T2D) in the U.S. from 2009-2017.
Materials and methods: The IBM® MarketScan® Commercial and Medicare databases were used to identify trends for insulin use over 9 years among people with T1D or T2D who filled a prescription for insulin in a calendar year. Total annual sample size ranged from 373,975 to 660,512. The analyses examined insulin regimen, method of delivery, and use of glucose monitoring systems separately for people with T1D or T2D. Generalized estimating equations were used to test whether trends were statistically significant.
Results: For people with either T1D or T2D, use of short/rapid insulin only and use of analogue insulins increased while premix insulin use decreased (all p<0.0001) from 2009 to 2017. Use of basal insulin increased only for people with T2D over the study period (p<0.0001). Among people with T1D, use of vial with pump increased significantly; the use of disposable pens increased in both cohorts (all p<0.0001). The observed use of continuous glucose monitoring (CGM) was numerically higher for patients with T1D compared to patients with T2D, although use significantly increased (both p<0.0001) over the study period for both cohorts.
Conclusion: Results suggest that insulin prescribing continues to change with advances in insulin delivery technology and glucose monitoring systems.

Supported by: Eli Lilly and Company
Disclosure: M. Perez-Nieves: Employment/Consultancy; Eli Lilly and Company. Stock/Shareholding; Eli Lilly and Company.
699
Personal characteristics influence rapid-acting insulin pharmacokinetics in individuals with type 1 diabetes treated with multiple daily injections
E.M. Coales1, A.M. Alobaid1, C. Dingena1, A. Marsh1, R.A. Ajjan2, M.D. Campbell1;
1School of Food Science and Nutrition, University of Leeds, Leeds, 2School of Medicine, University of Leeds, Leeds, UK.
Background and aims: The pharmacokinetics and pharmacodynamics of the rapid-acting insulin analogues aspart and lispro have been well-characterised and are considered comparable, with analogues displaying similarly large inter-personal variability in action-time profiles following subcutaneous injection. However, it is unknown whether, and which, personal characteristics explain inter-personal variability in rapid-acting insulin kinetics. Therefore, we compared serum insulin kinetics following subcutaneous injection of prandially-administered rapid-acting insulin in people with type 1 diabetes (T1D) treated on multiple daily injections.
Materials and methods: Thirty-two individuals (mean±SD: 31±6.89 years, 26.03±4.82 kg/m2) with T1D, treated with multiple daily injections consisting of rapid-acting insulins aspart (n=20) and lispro (n=12), and basal-insulins glargine (n=23) and detemir (n=9) were recruited. Subjects attended the laboratory on a single morning (~8am) following an overnight fast and self-administered a subcutaneous dose of rapid-acting insulin to the lower abdomen immediately before the consumption of a standardised meal. Rapid-acting insulin doses were standardised and calculated using the carbohydrate counting method; basal insulin remained unchanged. Serum insulin levels were measured for 6-hours following administration. Regression analysis was used to assess associations between serum insulin kinetics and personal characteristics.
Results: Serum insulin AUC was positively associated with age (p=0.006, 95%CI -85.6 to -15.9), duration of diabetes (p<0.001, 95%CI -70.1 to -22.6), HbA1c (p=0.001, CI -71.4 to -12.0), BMI (p=0.006, 95%CI -120.3 to -19.8), and circulating fibrinogen concentrations (p=0.002, 95%CI -0.50 to -0.12) and negatively associated with estimated glucose disposal rate (eGDR; p=0.008, 95%CI 51.4 to 231.8). Bolus dose was positively associated with age (p<0.001, 95%CI 0.141 to 0.384), duration of diabetes (p<0.001, 95%CI 0.092 to 0.278), HbA1c (p=0.001, 95%CI 0.088 to 0.287), and BMI (p<0.001, 95%CI 0.210 to 0.553) and negatively associated with eGDR (p=0.002; 95%CI -0.938 to -0.243), but not serum insulin AUC, iAUC, peak, or time to peak (p>0.05).
Conclusion: We show for the first time that inter-personal variability in rapid-acting insulin kinetics are influenced by personal characteristics including age, diabetes duration, HbA1c, BMI, eGDR, and circulating fibrinogen concentrations in people with T1D. These data yield important implications for determining patient-specific rapid-acting insulin dosing recommendations which could lead to more effective self-management strategies.
Disclosure: E.M. Coales: None.
PS 60 The continued advance of continuous glucose monitoring
700
Relationship between mean glucose and HbA1c is modulated by glycaemic variability
P. Divilly, P. Jacob, S. Amiel, P. Choudhary;
Department of Diabetes Research (Denmark Hill), King’s College London, London, UK.
Background and aims: Mean glucose is used to estimate HBA1c in people using continuous flash glucose monitoring. However, the estimated HbA1c may be affected by the duration of chosen and glycaemic variability. This may explain some of the discrepancy between measured and estimated HbA1c we sometimes see in clinic. We aimed to explore these relationships further using real world data.
Materials and methods: We included people with type 1 diabetes (T1D) who shared their Freestyle Libre data electronically with the specialist diabetes service at a large urban teaching hospital. Inclusion criteria were; age above 18 years, diagnosis of T1D, 90 days of Libre data available before an HbA1c measurement. Exclusion criteria were pregnancy or lactation during the sampling period or < 70% sensor wear at 14, 28, 60 or 90 days glucose sampling. We collected the mean glucose, standard deviation (SD) in glucose and time below, in and above the glucose range of 4-10 mmol/L at 14, 28, 60 and 90 days before HbA1c measurement. We used mean glucose data to calculate estimated HbA1c using a validated tool. Data are expressed as mean ± SD. We constructed a General Linear Models (GLM) which included HbA1c as a covariate and SD split into low (3.5) or high (>3.5) groups as a factor. Data were analysed in jamovi v1.1 (jamovi.org).
Results: 85 people met the inclusion criteria with age 41.0 ± 14.4, 55.3% (47 of 85) female and HbA1c 7.64 ± 1.13%. The mean glucose and estimated HbA1c had a strong and stable correlation with HbA1c (r2 = 0.762, 0.805, 0.829 and 0.724) at 14, 28, 60 and 90 days respectively. Only 21 people had a >10% change in mean glucose across the sampling durations. The strong relationship between mean glucose and HbA1c remained significant at 60 days in those with >10% change in mean glucose (r2 = 0.758). Proportions of time below, in and above range are summarised in the table. Our GLM fit the data well (R2= 0.844). There was a significant impact of SD, with lower measured HbA1c for the mean glucose in those with high SD (95% CI 0.207 - 0.977). Being in the high SD group was associated with a 0.59 mmol/L higher mean glucose for any HbA1c. This was similar when using estimated HbA1c instead of mean glucose in the model (95% CI 0.122 - 0.605) where the high SD group had a 0.36% higher estimated HbA1c than measured HbA1c.
Conclusion: These data confirm that there is a close relationship between mean glucose, time below range with HbA1c. The 60 day mean glucose has numerically (but not statistically) the closest relationship with HbA1c. Glycaemic variability (SD) alters the relationship between HbA1c and mean glucose. In those with SD >3.5, measured HbA1c is higher than derived from mean glucose. HbA1c estimated from mean glucose readings must be interpreted with caution, as the value may be underestimated in people with high variability.

Disclosure: P. Divilly: None.
701
Marked improvements in HbA1c following flash monitor initiation in people with type 1 diabetes: a nationwide observational study in Scotland
F. Gibb1,2, A. Jeyam3, J. McKnight4, B. Kennon5, S. McGurnaghan3, L.A.K. Blackbourn3, P. McKeigue6, H.M. Colhoun3,7, on behalf of the Scottish Diabetes Research Network (SDRN) Epidemiology Group;
1Edinburgh Centre for Endocrinology and Diabetes Royal Infirmary of Edinburgh, Edinburgh, 2Centre for Cardiovascular Science - University of Edinburgh, Edinburgh, 3MRC Institute of Genetic and Molecular Medicine, University of Edinburgh, Edinburgh, 4Edinburgh Centre for Endocrinology and Diabetes Western General Hospital, Edinburgh, 5Queen Elizabeth University Hospital, Glasgow, 6Usher Institute of Population Health Sciences and Informatics, Centre for Population Health Sciences, School of Molecular, Genetic and Population Health Sciences University of Edinburgh, Edinburgh, 7Department of Public Health, NHS Fife, Kirkcaldy, UK.
Background and aims: To investigate the effects of flash glucose monitoring (FM) on HbA1c levels in people with Type 1 diabetes in Scotland.
Materials and methods: From all patients with Type 1 diabetes registered in a national diabetes register in Scotland, we included 4,595 patients with prevalent or incident diabetes between 01 January 2004 and 31 December 2018, who started using an FM device from 2014 onwards, and had an available baseline measure of HbA1c. We described the within-person change from baseline in HbA1c over time, overall and stratifying by HbA1c control at baseline. We used linear mixed effects regression models with random effects to assess the significance of these changes, including as fixed effects age, diabetes duration and sex at and trajectory prior to FM initiation.
Results: The median overall change in HbA1c within the first year post-FM initiation was -3 mmol/mol (Interquartile Range [-10, 2]) (p<0.01). Changes differed by HbA1c group at baseline (p interaction term <0.01); being most marked in those starting with very high levels of HbA1c, with median changes of -19 [-34, -7], -8 [-16, 0], -5 [-11, 1], -3[-7, 2], and 0 [-3, 4], in those with starting HbA1c in the ranges of >84, 75-84, 69-74, 54-68 and <54 mmol/mol respectively.
Conclusion: These data from people with Type 1 Diabetes in Scotland indicate that usage of flash glucose monitoring is beneficial in terms of HbA1c reduction in those with higher HbA1c. Further work will evaluate effects on other outcomes including hypoglycaemia.
Supported by: CSO, DUK
Disclosure: F. Gibb: Other; speaker fees from Abbott Diabetes Care.
702
Unrestricted use of intermittently-scanned continuous glucose monitoring in youth is associated with high satisfaction and less absence from school
S. Charleer1,2, P. Gillard1,2, K. Casteels3,4;
1Endocrinology, University Hospitals Leuven, Leuven, 2Clinical and Experimental Endocrinology, KU Leuven, Leuven, 3Pediatrics, University Hospitals Leuven, Leuven, 4Development and Regeneration, KU Leuven, Leuven, Belgium.
Background and aims: In 2016, nationwide reimbursement of intermittently-scanned continuous glucose monitoring (isCGM) was introduced in Belgium. We undertook a 24-month prospective observational single-centre real-world trial (FUTURE) to study impact of introduction of isCGM on quality of life (QOL) and glycaemic control of children and adolescents with type 1 diabetes (T1D).
Materials and methods: Between September 2016 and November 2017, 138 children and adolescents with T1D were consecutively recruited. Demographic, metabolic, and QOL data (Diabetes Quality of Life for Youth [DQOLY] and Hypoglycaemia Fear Survey for children [HFS]) were collected at start, 6, 12, and 24 months of standard clinical follow-up. Primary endpoint was defined as evolution of QOL. Secondary outcome measures were change in HbA1c and school absenteeism. Data are mean±standard deviation, number (percentage), or mean (95% confidence interval).
Results: One hundred thirty-four (97%) and 122 (88%) participants used isCGM for at least 12 and 24 months, respectively. Of sixteen (12%) children who stopped participating in the study, 7 (5%) stopped using isCGM. Participants were 13±3 years old, had diabetes for 5±4 years, 27 (20%) were on insulin pump therapy, 12 (9%) had impaired awareness of hypoglycaemia, and in 75% of the cases at least one of the parents went to college or university. The DQOLY satisfaction subscale was significantly improved after 12 months (68.8 [67.4-70.3] at baseline vs 71.2 [69.8-72.7] at 12 months, p<0.0001), but this was not sustained until 24 months (70.2 [68.8-71.5], p=0.055 vs baseline). DQOLY impact and worry, and HFS behaviour and worry subscales did not significantly change over 24 months. Ninety-two percent found isCGM more user-friendly than finger sticks and had high treatment satisfaction after 24 months (8.0±1.4 on a scale of 10). HbA1c significantly increased from baseline to 12 months (7.2% [7.0-7.3] at baseline vs 7.6% [7.4-7.8] at 12 months, p<0.0001) and was sustained up to 24 months (7.6% [7.4-7.8], p<0.0001 vs baseline). This overall increase was mainly facilitated by the group of children with baseline HbA1c <7.0% (n=64, 46%). Their HbA1c rose from 6.3% (6.2-6.4) to 6.9% (6.7-7.1) over 24 months (p<0.0001), whereas those with baseline HbA1c ≥7% (n=74, 54%) remained stable (7.9% [7.7-8.1] vs 8.1% [7.8-8.4] over 24 months, p=0.086). The mean change in HbA1c (0.4±0.8%) was not correlated with mean scan frequency during 24 months (9.3±5.7 scans per day) (r=-0.14, p=0.137). In the year before use of isCGM, 228 days per 100 patient-years of school absenteeism were reported. After 24 months, this significantly decreased to 13 days per 100 patient-years (p=0.016). Parents of children also reported less work absenteeism, from 149 days per 100 patient-years before to 18 days per 100 patient-years after 24 months of isCGM use (p=0.011).
Conclusion: Unrestricted use of isCGM by a T1D paediatric population is associated with high treatment satisfaction and less days of absence from school. However, metabolic control was worse after 24 months. Thus, regular education on how to cope with trend arrows, lag time, and sensor errors will be imperative to teach children and parents to apply effective diabetes management.
Clinical Trial Registration Number: NCT02898714
Supported by: S.C. received SB research PhD grant and P.G. received clinical fellowship grant from FWO
Disclosure: S. Charleer: None.
703
Continuous glucose monitoring record length and minimum number of daily observations for clinical interpretation
J. Chrzanowski1,2, P. Kucharski3,1, A. Michalak1,2, K. Pagacz1, B. Mianowska2, A. Szadkowska2, W. Fendler1;
1Department of Biostatistics and Translational Medicine, Medical University of Lodz, Lodz, 2Department of Pediatrics, Diabetology, Endocrinology and Nephrology, Medical University of Lodz, Lodz, 3Instutitute of Applied Computer Science, Lodz University of Technology, Lodz, Poland.
Background and aims: Currently available Continuous Glucose Monitoring (CGM) systems provide data about interstitial glucose concentration every 5 or 15 minutes. These accumulated data can be used to investigate short- and long-term glycemic variability (GV) in patients with diabetes. Due to the device/sensor and patient-related issues CGM records are however prone to data loss. Standardized CGM data interpretation requires the minimum of 14 days with at least 70% of time CGM is active. The impact of quantity and pattern of data loss in CGM records on calculated GV indices is currently unknown. This poses a question of clinical value and comparability of CGM recordings of short duration with a high percentage or a longer ones but with a low percentage of active CGM time. Thus, the aim of the study was to determine the minimum duration and minimum active time of CGM records for a reliable short and long-term GV assessment.
Materials and methods: CGM records from pediatric patients with type 1 diabetes of at least 1 year duration, were collected between 2015 and 2019. Data were processed using Python. Calculated GV indices included: mean, median, standard deviation (SD), coefficient of variation (CV), times: below, in, and above range (TBR, TIR, TAR respectively). Duration of records for short and long-term GV assessments were identified using 180-day CGM records with at least 80% of daily observations (i.e. with 80% time when CGM was active). Minimum required duration of CGM record were investigated for which GV was similar for local (short-term) and global (long-term) GVs. These durations could reliably reflect more dynamic (short-term) changes or provide the information on GV over few months (long-term). Next, the minimum required active time for reliable GV assessment within selected durations was investigated using all available records of given duration with at least 90% of daily observations. CGM data were removed using the algorithm to reconstruct patterns of data loss in real CGM traces. For each GV and period, the required CGM active time was defined as the % of observation for which GV value stayed within 5% of the one calculated for the full data.
Results: Data from 451 patients were collected with the median time of CGM records 202 (98-368) days, i.e. 331.96 years of data were analyzed. Using 21 records, duration of CGM records required for short and long-term GV assessment was determined as 7 and 35 days respectively. From collected records, we selected 25810 of 7-day and 5047 of 35-day CGM records. The most robust GV for data loss were mean and CV, and the least robust were TBR <54mg/dL and TAR >250mg/dL. Minimum % of the active CGM time for which GVs remained within 5% from the full record were 70% for 7-days and 30% for 35-days intervals.
Conclusion: Short and long-term GV may be investigated using deficient CGM records but they have to provide data with >70% or >30% active time for 7 and 35-day recordings respectively, to prevent significant loss of information.
Disclosure: J. Chrzanowski: None.
704
Tracking haemoglobin A1c from CGM data via personalised model of haemoglobin glycation and clearance
C. Fabris1, R. Beck2, B. Kovatchev1;
1University of Virginia, Charlottesville, 2Jaeb Center for Health Research, Tampa, USA.
Background and aims: Since the landmark Diabetes Control and Complications Trial, glycated hemoglobin (A1c) has been the gold-standard metric of average glycemia and quality of glycemic control, and a key predictor of long-term diabetes complications. With the growing adoption of continuous glucose monitoring (CGM), time-in-range (TIR) has been recognized as an important metric to complement A1c. Here, we present a method to bridge these two indices and track A1c from CGM-derived TIR, thus providing daily estimated A1c (eA1c).
Materials and methods: The proposed method uses a differential equation model of hemoglobin glycation and clearance driven by a linear function of daily TIR. CGM data from the DIAMOND study were used for the analysis. The dataset included CGM traces from 153 individuals with type 1 diabetes (T1D) and 151 individuals with type 2 diabetes (T2D) collected over 24 weeks; lab A1c samples were also collected, at weeks 12 and 24. A three-parameter population model was first identified on a training data set of 50/50 randomly selected T1D/T2D subjects, and fixed thereafter. For the remaining 103/101 subjects (testing data set), the model was personalized for each individual by a one-time calibration with week-12 lab A1c, which was used to estimate one additional individual glycation rate parameter. The lab A1c value at week 24 was used to assess the model performance.
Results: In the testing data set, using personalized/calibrated vs. population model, the correlation between eA1c and lab A1c increased from 0.68 to 0.91 in T1D, and from 0.68 to 0.86 in T2D. Similarly, when using the calibrated model, the mean absolute difference between eA1c and lab A1c was decreased by 45% in T1D and by 34% in T2D, and the percent of eA1c values within 5% of lab A1c was increased by 58% in T1D and by 60% in T2D. A complete report of model performance is presented in Table 1.
Conclusion: Hemoglobin A1c is the reference metric for assessment of glycemic control and a major predictor of diabetes complications. However, CGM devices provide information-rich data that can be used to complement lab A1c measurements. Thus, we developed a method tracking A1c from daily TIR values. We found that the TIR-A1c relationship is mediated by four glycation parameters, three population and one personal, with the latter estimated using a single lab A1c value. Following this personalization, the TIR-based eA1c provides accurate tracking of A1c in both T1D and T2D for (at least) three months post calibration. Thus, eA1c can be a viable clinical alternative to frequent lab A1c, allowing daily tracking of changes in average glycemia via a dynamical model of hemoglobin glycation and clearance.

Supported by: Virginia's Strategic Investment in Diabetes, SIF Project #88 and data provided by DexCom, Inc.
Disclosure: C. Fabris: Employment/Consultancy; Consulting for The Epsilon Group.
705
Hospitalisations for acute complications before and after FreeStyle Libre® system initiation in people with type 1 and type 2 diabetes in France
B. Guerci1, R. Roussel2, E. Vicaut3, G. De Pouvourville4, B. Detournay5, C. Emery5, F. Levrat-Guillen6, J.-P. Riveline7;
1CHRU, Nancy, France, 2Bichat Hospital, Paris, France, 3Fernand Vidal Hospital, Paris, France, 4ESSEC, Cergy-Pontoise, France, 5CEMKA, Bourg-La-Reine, France, 6Abbott, Maidenhead, UK, 7Lariboisière Hospital, Paris, France.
Background and aims: Hypoglycemia and diabetic ketoacidosis (DKA) account for a significant part of all hospital admissions of people with type 1 and type 2 diabetes (T1DM/T2DM). We assessed the impact of the initiation of FreeStyle Libre® glucose monitoring system use on hospitalizations for acute diabetes complications.
Materials and methods: A retrospective study on the exhaustive French nationwide reimbursement claim database (≈66 Million people) was conducted. FreeStyle Libre system initiators (first reimbursement of FreeStyle Libre sensor or reader during the period 2017/08/01 to 2017/12/31) were selected. Participants were classified according to diabetes type and to use of self-monitoring blood glucose (SMBG) before FreeStyle Libre system initiation. Hospitalizations for hypoglycemia were identified with ICD-10 codes as main or related diagnosis: E160, E161, E162 and T383; DKA events (ICD-10 codes E101 and E111); comas (ICD-10 code E100, E110 and E140) and hyperglycemia related stays (ICD-10 code R739) were also identified one year before and after the date of FreeStyle Libre system initiation.
Results: We identified 33,165 and 40,846 people with T1DM and T2DM, respectively, initiating the FreeStyle Libre system during the selection period (88% treated with multiple daily insulin injections or insulin pump). Among them, 6.4% of patients with T1DM and 2.7% of patients with T2DM experienced at least one hospitalization for any events listed above in the year before the FreeStyle Libre system initiation vs 3.3% and 1.6% in the year after (p<0.0001 in both cases). This significant reduction in event incidence was mainly related to DKA related hospitalization in both types of diabetes (5.5% (T1DM) and 1.7% (T2DM) before vs 2.4% and 0.8%, after respectively: p<0.0001 in both cases). A slight but significant decrease was also observed for diabetes related comas (p<0.0001 for both types of diabetes) and hospitalized hypoglycemia (p<0.0001). Similar results were observed in the subgroup of patients treated with multiple insulin injections or insulin pump. In this subgroup of patients, multivariate analyses showed that before initiation of FreeStyle Libre system, the variables age (<25 years old), universal health coverage for people with low socioeconomic status and type of insulin therapy (pens vs pump) were independently associated with higher rates of hospitalizations for acute complications. After initiation, only age and universal health coverage remained independent risk factors.
Conclusion: These results confirmed in a real life setting that initiation of the FreeStyle Libre system was associated with a marked decrease in the hospitalization rate for acute diabetes complications in both type 1 and type 2 diabetes.

Disclosure: B. Guerci: Grants; Medtronic, Vitalaire, Sanofi, Eli Lilly, Novo Nordisk. Honorarium; Abbott, Sanofi, Eli Lilly, Novo Nordisk, Novartis, GSK, MSD, Boehringer Ingelheim, AstraZeneca, Abbott, Medtronic, Roche Diagnostics.
706
A comparison of methods used to analyse blood glucose under hypoglycaemic conditions
C.M. Farrell1, A.D. McNeilly1, S. Hapca2, R.J. McCrimmon1;
1Systems Medicine, School of Medicine, University of Dundee, Dundee, 2Division of Computing Science and Mathematics, University of Stirling, Stirling, UK.
Background and aims: Continuous glucose monitoring (CGM) is increasingly used in the management of people with type 1 diabetes (T1D). It provides real time data and has low glucose alarms in place to alert individuals or their carers to developing hypoglycaemia. This technology is particularly useful for those with impaired awareness of hypoglycaemia (IAH). However, there is limited evidence reporting the accuracy of these devices in the hypoglycaemic range. In an on-going clinical study of people with T1D and IAH we have compared the data collected from CGM with the arterialised venous (AV) blood analysed using a bedside plasma glucose analyser and a standard blood glucose meter (SMBG) when tested under experimental hypoglycaemic conditions.
Materials and methods: Participants with TID and IAH were recruited to a parallel group study during which they underwent a 90-minute hyperinsulinaemic hypoglycaemic (2.5mmol/l) clamp. Throughout the clamp, AV blood samples were obtained every 5 minutes via a retrograde cannula inserted in to the non-dominant hand that had been placed into a heated hand box. Each AV sample was tested using SMBG (Contour Meter, Ascensia Diabetes Care UK Ltd, Newbury, UK), before being centrifuged at 5500 RPM and plasma glucose then measured using a bed side plasma glucose analyser (Biosen C - Line GP+, EKF diagnostics, Cardiff, UK) . Each participant had CGM (Dexcom G6, Dexcom, San Diego CA, USA) in place that had been fitted at least 48 hours preceding the study, and this was maintained throughout the hypoglycaemic clamp.
Results: Fifteen hyperinsulinaemic hypoglycaemic clamp studies with complete data sets for all three glucose readings obtained were analysed. Mean (SEM) glucose at euglycaemia (4.0-6.0 mmol/l) (plasma; SMBG, CGM) was 5.09 (0.14), 4.9 (0.15) and 5.5 (0.2) mmol/l, and during stable hypoglycaemia was 2.50 (0.03), 2.4 (0.04) and 3.0 (0.10) mmol/l [mean (SEM)]. In comparison to AV plasma glucose we found SMBG of whole AV blood to report 3% lower at euglycaemia and 5% lower at hypoglycaemia. In contrast we found CGM to report 8% higher at euglycaemia and 19% higher at hypoglycaemia compared with AV plasma glucose. A generalised estimated equation was used to compare the performance of the methods over time; this has confirmed that overall, CGM overestimates glucose compared to AV plasma (p < 0.05). In addition when comparing methods over time periods throughout the hypoglycaemic clamp CGM readings are significantly higher (p <0.001).
Conclusion: These findings show that CGM overestimates glycaemia compared to AV plasma raising the possibility of a calibration error. In addition, when tested under hypoglycaemic conditions CGM report significantly higher glucose readings compared with AV plasma and AV whole blood using SMBG. This is clinically important as CGM is frequently used by people with TID and IAH and may underestimate the degree of hypoglycaemia and therefore negate the need for urgent treatment.

Clinical Trial Registration Number: ISRCTN15373978
Supported by: DUK, JDRF
Disclosure: C.M. Farrell: None.
PS 61 Insulin pump therapy
707
Usage and handling of insulin pump features by individuals with type 1 diabetes
S. Dürrbeck, G. Kramer, C. Kloos, N. Müller, G. Wolf, N. Kuniss;
Jena University Hospital, Jena, Germany.
Background and aims: The trial evaluated if individuals with diabetes type 1 and insulin pump (CSII) are able to handle advanced pump features and how often they actually made use of these. Secondly, we investigated if the use of these applications is associated with improved metabolic control and psychosocial parameters.
Materials and methods: The cross-sectional study included non-pregnant individuals of a university’s out- and inpatient clinic treated with CSII for at least 12 months (n=72, age 52.1±16.4y; diabetes duration 29.0±13.7y; 55.6% women; CSII use: 14.3±7.3y; HbA1c: 8.0±1.3%/ 63.9±13.8 mmol/mol; FGM/CGM: 56.9%; participation in a structured training and teaching programme: 100%). In structured interviews we investigated, if the participants used advanced pump functions (e.g. temporary basal rate, bolus variations). Afterwards, participants were requested to demonstrate the handling of advanced features with their own pump. In validated questionnaires we analysed well-being (WHO-5, range 0-25), treatment satisfaction (DTSQs, range 0-36) as well as social status (range 3-21).
Results: Functions used at least 3 times a week were: bolus calculator n=46/72 (63.9%), e-logbook n=27/72 (37.5%), temporary basal rate n=19/72 (26.4%), bolus variations n=8/71 (11.3%) and multiple basal rate profiles n=2/72 (2.8%). 25/72 (34.7%) participants correctly stated their pump’s range of advanced functions, 30/72 (41.7%) properly described the functionality of different types of boluses and 24/72 (33.3%) were able to handle all features. Individuals using the bolus calculator at least once a week showed higher treatment satisfaction (DTSQs: 30.2±5.5 vs. 26.2±7.4; p=0.012). Use of bolus variations at least once a week was associated with lower BMI (26.3±4.6 vs. 29.3±6.2 kg/m2; p=0.043). There was a positive association of using the e-logbook and HbA1c (≥3 times a week 7.7±0.6%/60.4±6.4 mmol/mol vs. <3 times a week 8.2±1.5%/66.0±16.5 mmol/mol; p=0.047) as well as social status (15.0±4.1 vs. 12.7±4.1; p=0.03). Severe hypoglycaemia (third-party assistance) occurred less often, if subjects changed basal rate profiles at least once a week (0 vs. 0.1±0.3; p=0.013) or variated bolus types at least 3 times a week (0 vs. 0.1±0.3; p=0.013). Otherwise, there was no association between frequency of mild hypoglycaemia and usage of pump functions. Study particiapnts who temporarily reduced their basal rate at least 3 times a week showed less wellbeing (WHO-5 14.0±4.4 vs. 16.7±4.3; p=0.037).
Conclusion: Only few individuals knew all advanced pump features and were able to master these. Higher frequency of use of bolus variations, change of basal rate profiles and e-logbook were associated with improved metabolic control and less hypoglycaemic events, whereas use of e-logbook and temporary basal rate was associated with higher social status.
Disclosure: S. Dürrbeck: None.
708
First results from PRO Solo: patient reported outcomes from a clinical trial comparing a new patch pump with MDI and an established patch pump
J.K. Mader1, N. Oliver2, I. Vesper3, T. Künsting3, K. Barnard-Kelly4,5;
1Medical University of Graz, Graz, Austria, 2Imperial College London, London, UK, 3Roche Diabetes Care GmbH, Mannheim, Germany, 4Bournemouth University, Bournemouth, UK, 5BHR Ltd, Portsmouth, UK.
Background and aims: Small patch pumps have become a relevant alternative to classic tethered insulin pumps with tubing. Patient Reported Outcomes (PROs) play a crucial role in understanding device burden alongside benefit, as well as impact on everyday living, acceptance of therapy regimens and drivers of self-management behaviours. This study aimed to investigate the effect on PROs of the newly introduced Accu‑Chek Solo micropump system compared to treatment by multiple daily injections (MDI) and an established patch pump.
Materials and methods: 181 participants were enrolled in a three-armed, randomized, controlled multinational, multi-centre trial. Individuals with type 1 diabetes naïve to insulin pump therapy (39.0 ±11.9 years old, 44% females, 15.0 ±10.8 years since diagnosis of diabetes, HbA1c 8.0 ± 0.6%) used either the Accu-Chek Solo micropump system (ACS), MDI or Insulet Omnipod (IO) for 6 months, followed by 3 months where all used ACS. The Diabetes Technology Questionnaire (DTQ, administered at baseline, 3, 6 and 9 months) was the primary endpoint. HbA1c and Problem Areas In Diabetes (PAID-5) were evaluated as secondary endpoints. Preliminary, non-cleaned data at 6 months was evaluated according to a predefined analysis plan and is presented here.
Results: 16 patients had withdrawn for various reasons (7-ACS, 3-MDI, and 6-IO respectively), leaving n=165 across study arms (55-ACS, 58-MDI and 52-IO, respectively). Mean DTQ change scores at 6 months were 105.1 ± 20.2, 94.9 ± 11.8, and 107.5 ± 17.4, where higher scores reflect more positive PROs. Hierarchical testing shows a significant increase in the PROs between ACS users and MDI users (104.4 vs. 94.5 ANCOVA, p<0.01). No such difference was observed between ACS and IO users (104.7 vs. 108.7, p=0.33). Similarly, HbA1c at 6 months was significantly improved for ACS users compared to MDI users (-0.10% vs +0.25%, p=<0.01), but not compared to IO users (-0.04% vs -0.02%, p=0.90). DTQ items each mapped to psychosocial constructs of diabetes burden and distress, hypoglycaemia (worry, fear, confidence), technology acceptance and attitudes towards device. Results show significant improvement on all constructs for ACS users vs MDI users. Specifically, confidence was high around getting the right amount of insulin during exercise, on sick days or when meals are skipped or delayed; whilst visibility of disease state and interference in daily life were both reduced. Worries about long term health and fear of nocturnal hypos reduced. PAID5 scores also reflected significant improvement for ACS users vs MDI users (6.32 vs 7.62, p=0.01), but not compared to IO users (6.00 vs 6.05, p=0.93).
Conclusion: PROs are increasingly relevant as drivers of self-management behaviours and subsequent clinical outcomes, including HbA1c. Participants switching from MDI therapy to the Accu-Chek Solo micropump system experienced a significant and meaningful positive impact in terms of sustained improvement in all psychosocial outcomes and HbA1c, with no differences between the ACS and IO users. Results indicate that ACS is an acceptable therapy choice with potential to improve biomedical and psychosocial outcomes of users.
Clinical Trial Registration Number: NCT03478969
Supported by: The study and this abstract were sponsored by Roche Diabetes Care GmbH, Mannheim, Germany
Disclosure: J.K. Mader: Lecture/other fees; Roche Diabetes Care.
709
Marked improvements in HbA1c levels following insulin pump therapy initiation in people with type 1 diabetes: a nationwide observational study in Scotland
A. Jeyam1, F. Gibb2,3, J. McKnight4, B. Kennon5, J. O'Reilly1, S. McGurnaghan1, L.A.K. Blackbourn1, P.M. McKeigue6, H.M. Colhoun1,7, on behalf of the Scottish Diabetes Research Network (SDRN) Epidemiology Group;
1MRC Institute of Genetic and Molecular Medicine, University of Edinburgh, Edinburgh, 2Edinburgh Centre for Endocrinology and Diabetes Royal Infirmary of Edinburgh, Edinburgh, 3Centre for Cardiovascular Science - University of Edinburgh, Edinburgh, 4Edinburgh Centre for Endocrinology and Diabetes Western General Hospital, Edinburgh, 5Queen Elizabeth University Hospital, Glasgow, 6Usher Institute of Population Health Sciences and Informatics, Centre for Population Health Sciences, School of Molecular, Genetic and Population Health Sciences University of Edinburgh, Edinburgh, 7Department of Public Health, NHS Fife, Kirkcaldy, UK.
Background and aims: To investigate the effects of insulin pump initiation on HbA1c levels in people with Type 1 diabetes in Scotland.
Materials and methods: From all patients with Type 1 diabetes registered in a national diabetes register in Scotland, we included 3,277 patients with prevalent or incident diabetes between 01 January 2004 and 31 December 2018, who started using a pump during this period, and had HbA1c measurements in at least one year prior to pump initiation and two years post-initiation. We described the within-person change from baseline in HbA1c over time, overall and stratifying by HbA1c control at baseline. We used linear mixed effects regression models with random effects to assess the significance of these changes, including as fixed effects age, diabetes duration and sex at and trajectory prior to pump initiation.
Results: The median overall change in HbA1c within the first year post-pump initiation was -6 mmol/mol (Interquartile Range [-12, 0]), and was sustained through time, being -5 [-13, 2] at 4 to 5 years after initiation (p<0.01). Changes differed by HbA1c group at baseline (p interaction term <0.01); being most marked in those starting with very high levels of HbA1c, with median changes of -20 [-30, -10], -12 [-18, -6], -8 [-13, -2], -4 [-8, 1], and 1 [-3, 5], in those with starting HbA1c in the ranges of >84, 75-84, 69-74, 54-68 and <54 mmol/mol respectively.
Conclusion: These data indicate that usage of insulin pumps is beneficial in terms of HbA1c reduction in those with higher HbA1c. Further work will evaluate effects on other outcomes including hypoglycaemia.
Supported by: CSO, DUK
Disclosure: A. Jeyam: None.
710
A randomised trial to compare efficacy and pharmacy budget impact between regular human and analogue insulins when delivered by a wearable insulin delivery device
P.F. Mora1, D.R. Sutton, Jr2, A. Gore3, B.S. Baliga4, R. Goldfaden5, C. Nikkel6, J. Sink II6, B. Adams-Huet7;
1Research, Dallas Diabetes Research Center, Dallas, 2Endocrinology, Northeast Florida Endocrine and Diabetes Associates, Jacksonville, 3Endocrinology, Jones Center for Diabetes and Endocrine Wellness, Macon, 4Endocrinology, East Alabama Endocrinology, Columbus, 5Research, East Coast Institute for Research, Jacksonville, 6Medical Affairs, Valeritas, Inc., Bridgewater, 7Independent Statistician, Dallas, USA.
Background and aims: Increasing insulin prices have led to a renewed debate to determine if Rapid Acting Insulin (RAI) analogs offer an advantage over less expensive Human Regular Insulins (HRI). For many, HRI provides a more affordable option for insulin therapy when compared to RAI, especially if the perceived limitations of the insulin profile can be overcome by delivering HRI by a continuous subcutaneous insulin infusion (CSII) device. V-Go® is a wearable patch-like insulin delivery device that provides a preset continuous basal rate of insulin and on-demand bolus dosing. To our knowledge, no data exists in a type 2 diabetes (T2D) population comparing RAI to HRI when delivered via CSII. The aim of this study was to compare the efficacy, safety and pharmacy budget impact between delivering RAI vs HRI with V-Go to determine if HRI proved not only non-inferior in efficacy and safety but a more cost-effective option to RAI.
Materials and methods: This 14-week multi-center, randomized, parallel, non-inferiority study was conducted in a T2D population across 3 sites in the United States. The study was conducted in a real-world practice setting under usual standard of care. Patients administering RAI with V-Go were randomized 1:1 to continue RAI or to switch to HRI. The primary endpoint assessed non-inferiority for the between group net difference in HbA1c derived from a mixed model analysis in the per-protocol population. Between group differences from baseline for insulin total daily dose (TDD), hypoglycemia (based on 7-point glucose profiles) and insulin wholesale acquisition costs were evaluated as secondary endpoints.
Results: One hundred thirteen patients (59 HRI and 54 RAI) were included in the per-protocol population. Baseline characteristics were similar between cohorts. The mean change in HbA1c with HRI was -0.60% from a baseline of 8.41% vs -0.38% from a baseline of 8.33% with RAI (estimated treatment difference [ETD]: -0.22%; 95% confidence interval [CI] -0.67% to 0.22%; non-inferiority margin <0.4% and p=0.007). The mean change in TDD with HRI was 0.8 U/day from a baseline of 61.0 U/day vs 1.8 U/day from a baseline of 61.3 U/day with RAI (ETD: -1.04 U/day; 95% CI: -3.18 U/day to 1.11 U/day; p=0.92). The absolute change in percent of patients reporting hypoglycemia (≤ 70 mg/dL) from pre-randomization to post-randomization was +5.08% with HRI vs +5.56% with RAI (ETD: -0.48%; 95% CI: -10.6% to 9.1%; p=0.91). Severe hypoglycemia was not reported in either cohort. Mean changes in 30-day insulin costs were -$250.50 from a baseline of $515.68 with HRI vs +$15.35 from a baseline of $518.31 with RAI (ETD: -$265.85; 95% CI: -$288.60 to -$243.11; p<0.0001).
Conclusion: Patients with T2D administering RAI with V-Go can safely switch to a less-expensive HRI and maintain similar glycemic control. The utilization of HRI may address the issue of affordability for many patients on insulin therapy and their insurance plans.
Clinical Trial Registration Number: NCT03495908
Supported by: Valeritas Inc. Educational Grant
Disclosure: P.F. Mora: Honorarium; Valeritas, Inc. Lecture/other fees; Valeritas, Inc.
711
Efficacy and safety comparison between U-100 human regular insulin and rapid acting insulin when delivered by V-Go insulin delivery device in an older type 2 diabetes
D.R. Sutton, Jr1, P.F. Mora2, A. Gore3, B.S. Baliga4, R. Goldfaden5, C. Nikkel6, J. Sink II6, B. Adams-Huet7;
1Endocrinology, Northeast Florida Endocrine and Diabetes Associates, Jacksonville, 2Endocrinology, Dallas Diabetes Research Center, Dallas, 3Endocrinology, Jones Center for Diabetes and Endocrine Wellness, Macon, 4Endocrinology, East Alabama Endocrinology, Columbus, 5Research, East Coast Institute for Research, Jacksonville, 6Medical Affairs, Valeritas, Inc., Bridgewater, 7Independent Statistician, Dallas, USA.
Background and aims: Older patients with T2D in need of full insulin replacement are constantly facing rising insulin prices, which may force them to choose between paying for medications or for other essential necessities. For these reasons, there is renewed debate to determine if human regular insulins (HRI) can offer a safe, effective and affordable option over newer analog insulins. Evidence demonstrates similar HbA1c efficacy between HRI and analogs utilizing traditional insulin delivery; however, to our knowledge, there is no evidence evaluating the delivery of analog insulin to HRI when delivered with a continuous subcutaneous insulin infusion device. The aim of this study was to compare the safety and efficacy of Rapid Acting Insulin (RAI) analog vs HRI when delivered by a wearable insulin delivery device that provides a preset continuous basal rate of insulin and on-demand bolus dosing in an older patient population (≥ 65 years of age).
Materials and methods: A 14-week multi-center randomized, parallel, non-inferiority study in a T2D population was conducted to compare the efficacy and safety of RAI versus HRI when delivered by V-Go® Wearable Insulin Delivery device. This study was conducted in a real-world practice setting under usual standard of care. Patients administering RAI with V-Go were randomized 1:1 to continue RAI or to switch to HRI. An exploratory post-hoc analysis evaluating efficacy and safety in a subset of older patients was conducted. Primary endpoint assessed non-inferiority for the between group net difference in HbA1c derived from a mixed model analysis. Between group differences from baseline for insulin total daily dose and hypoglycemia (based on 7-point glucose profiles) were evaluated as secondary endpoints.
Results: Patients (N=53) were randomized to either continue therapy with RAI (n=25) or to switch to HRI (n=28). Non-inferiority for change in HbA1c between groups was demonstrated in this population. Insulin dose and hypoglycemia events were similar between groups. No severe hypoglycemia or moderate or severe adverse events were reported in either group. A significant difference between cohorts was seen in change in weight, favouring HRI.
Conclusion: For patients whose insulin costs have become intolerably high, switching from analog to HRI when used in an insulin delivery device is one option to explore. Findings from this analysis demonstrate in an older population, HRI delivered by V-Go was as effective with a similar safety profile as use of RAI.

Clinical Trial Registration Number: NCT03495908
Supported by: Valeritas Inc. Educational Grant
Disclosure: D.R. Sutton, Jr: Honorarium; Valeritas, Inc. Lecture/other fees; Valeritas, Inc.
712
Patient-reported outcomes for 2,335 adults with type 2 diabetes using the Omnipod® Insulin Management System show glycaemic improvement over the first 90 days of use
L.M. Huyett1, A. Carlson2, J. Jantz1, A. Chang1, T. Vienneau1, T.T. Ly1;
1Insulet Corporation, Acton, 2International Diabetes Center at Park Nicollet, Minneapolis, USA.
Background and aims: Patient-reported outcomes are a useful tool to understand the impact of treatments in clinical application on a large scale. This retrospective study characterized patient-reported outcomes of a large cohort of adults in the United States with type 2 diabetes using a tubeless insulin pump (Omnipod® or Omnipod DASH™ Insulin Management System, Acton, MA).
Materials and methods: From Jan. 2015-Jan. 2020, patient-reported outcomes were recorded before and ≥90 days after initiating system use. Primary outcomes were change in self-reported A1C and total daily dose of insulin.
Results: Patients (N=2,335) were aged (mean±SD) 58±11y and 53% female. The percentage of users with a self-reported A1C ≤8% increased from 33% pre-tubeless pump to 64% post-tubeless pump, and the percentage with a self-reported A1C >9% decreased from 44% to 15% (p<0.001, Table). Self-reported A1C decreased from 9.2±2.7% to 7.9±2.2% (p<0.001). The self-reported total daily insulin for those with data available (n=2,130) was 33±49 U/d lower on average from pre-tubeless pump to post-tubeless pump, from 104±68 U/d to 71±40 U/d (p<0.001).
Conclusion: These patient-reported outcomes provide positive evidence that use of a tubeless insulin pump was associated with glycemic outcomes that exceed US National Healthcare Effectiveness Data and Information Set (HEDIS) standards for adequate diabetes management.

Supported by: Insulet Corporation
Disclosure: L.M. Huyett: Employment/Consultancy; Full-time employee of Insulet Corporation.
713
Glycaemic control improves over 4 month use of closed loop insulin delivery in school-age children with type 1 diabetes
M.D. Breton1, L.G. Kanapka2, R.W. Beck2, L. Ekhlaspour3, G.P. Forlenza4, E. Cengiz5, M. Schoelwer1, K. Ruedy2, C.C. Kollman2, S.A. Weinzimer5, M. DeBoer1, B.A. Buckingham3, D. Cherñavvsky1, R.P. Wadwa4, iDCL Trial Research Group;
1Center for Diabetes Technology, University of Virginia, Charlottesville, 2Jaeb Center for Health Research, Tampa Bay, 3Pediatrics, Stanford University, Stanford, 4Barbara Davis Center, University of Colorado, Aurora, 5Yale School of Medicine, New Haven, USA.
Background and aims: Glycemic control can be especially difficult in school-age children with type 1 diabetes (T1D), as shown by more than 9 in 10 children not reaching the American Diabetes Association HbA1c goal of 7% in the USA. Closed Loop Control (CLC) has been shown to improve and maintain glycemic control in adolescents and adults with T1D over several months, and preliminary studies in the 6 to 13 years old population have hinted at similar potential effects.
Materials and methods: In a 16 week randomized controlled clinical trial, 101 children 6-13 years old with T1D were assigned 3:1 to use of the t:slim X2 with Control-IQ artificial pancreas (CLC, Tandem San Diego CA) or Sensor Augmented Pump therapy (SAP), all using the Dexcom G6 factory calibrated continuous glucose monitor (CGM) (Dexcom, San Diego CA). SAP group participants on multiple daily injection were transitioned to t:slim X2 with Basal-IQ (Tandem San Diego CA), a predictive low glucose suspend system. Participants completed a 2-4 week run-in period (baseline) prior to system use for 16 weeks. Primary outcome was the percent time in the 70-180mg/dL range (TIR). Other CGM outcomes were reported per consensus guidelines; HbA1c was measured at baseline and study end.
Results: All but one participant (78 CLC / 23 SAP), age: 6-13; baseline HbA1c 5.7% to 10.1%, completed the 16 week trial (one dropout in SAP). TIR increased from 53±17% at baseline to 67±10% during follow up, and from 51+16% to 55+13%, in CLC and SAP respectively (mean adjusted difference 10.7%, equivalent to 2.6 hours per day; 95% CI 7.0 to 14.3, P<0.001). In both groups, time < 70 mg/dL was low (median 1.6% and 1.8%, CLC & SAP respectively). Daytime TIR was 63% vs. 56% and overnight TIR rose to 80% vs. 54% in the CLC and SAP groups (see figure for daily TIR profile). Median time in closed-loop mode was 93%[91-95%], and sustained w1-4: 93%, w5-8: 94%., w9-12: 94%., w13-16: 94%. Average CGM glucose was significantly lower in the CLC group: 162±18mg/dL vs. 179±26mg/dL. HbA1c decreased from 7.6% to 7.0% in the CLC group vs. 7.9% to 7.6% for SAP (p=0.076). There were no episodes of diabetic ketoacidosis or severe hypoglycemia in either group.
Conclusion: In this study, closed loop control was efficacious over 16 weeks of use in children age 6-13 years with T1D, providing superior hyperglycemia protection with minimal risk for hypoglycemia. Improvements in glycemic control were very similar to results reported in older populations with the same system. The system tested was well accepted, with a median 93% time in closed loop with no visible deterioration over time.

Clinical Trial Registration Number: NCT03844789
Supported by: Tandem; NIH NIDDK
Disclosure: M.D. Breton: Employment/Consultancy; Dexcom, Air Liquide, Hillo. Grants; Tandem Diabetes Care. Lecture/other fees; Tandem Diabetes Care, Dexcom. Non-financial support; Tandem Diabetes Care, Dexcom.
PS 62 Automated insulin delivery
714
Clinical outcomes after 6 months of use of hybrid closed loop system in children and adults
P.I. Beato Vibora1, F. Gallego-Gamero1, L. Lázaro-Martín1, M. Romero-Pérez2, F. Arroyo-Díez3;
1Badajoz University Hospital, Badajoz, 2Virgen de Macarana Hospital, Sevilla, 3Materno Infantil Hospital, Badajoz, Spain.
Background and aims: Closed loop systems represent an evolutionary step in the management of type 1 diabetes. The Medtronic 670G was the first commercially available hybrid closed loop system and it was launched in Europe in June 2018. The aim of the study was to evaluate the clinical outcomes after 6 months of real-world use of hybrid closed loop system in children and adults with type 1 diabetes and specifically in previous users of sensor augmented pump with predictive low glucose suspend function (SAP-PLGS).
Materials and methods: All the patients consecutively starting the Medtronic hybrid closed loop system 670G in 3 hospitals were prospectively evaluated. HbA1c, time in range 70-180 mg/dl, time > 180mg/dl, > 250mg/dl, < 70mg/dl and < 54 mg/dl, in 2-week downloads, were recorded at baseline, 3 months and 6 months.
Results: 58 patients were included, age: 28 ± 15 years (7-63), < 18 years: 38% (n = 22), 59% (n = 34) females, duration of diabetes: 15 ± 9 years. The previous treatment was SAP-PLGS: 60% (n = 35), pump + SMBG: 19% (n = 11), MDI + SMBG: 12% (n = 7), MDI + CGM: 9% (n = 5). The main clinical outcomes are shown in Table 1. The percentage of patients with HbA1c ≤ 7% increased from 31% at baseline to 53% and 61% at the 3-month and 6-month follow-up visits (both p < 0.001). The percentage of patients with TIR 70-180 mg/dL > 70% increased from 21% at baseline to 60% and 57% at the 3-month and 6-month visits (both p < 0.01). A significant correlation was found between baseline HbA1c and the reduction in HbA1c at 6 months (r = 0.825, p < 0.001). In a multivariate regression analysis, including age, diabetes duration and baseline HbA1c as independent variables, baseline TIR 70-180 mg/dL was the only significant predictor of improvement in TIR 70-180 mg/dL at 6 months (p < 0.001). Regarding glycaemic variability, standard deviation of glucose was 57 ± 11 mg/dl at baseline and was reduced to 50 ± 9 mg/dl and 51 ± 9 mg/dl at 3 and 6 months, respectively, and coefficient of variation was 35 ± 4% at baseline and was reduced to 33 ± 4% at 3 and 6 months, respectively (all p < 0.05 compared to baseline). Time in in Auto Mode was 85 ± 17% and 88 ± 9% at 3 months and 6 months respectively (p = 0.122). The number of exits from Auto Mode to Manual Mode were 0.6 ± 0.3 per day at 3 and 6 months. No episodes of severe hypoglycemia or diabetic ketoacidosis were observed during follow-up. The rate of discontinuation was 3% (n = 2). In the patients using SAP-PLGS before 670G (n = 35), HbA1c improved from 7.2% ± 0.8% to 6.9% ± 0.4%, (p = 0.017) and TIR 70-180 mg/dL increased from 62% ± 13% to 72% ± 8%, (p < 0.001) at 6 months. Time in hypoglycemia < 54 mg/dl and < 70 mg/dl were not significantly different, after 6 months, compared to baseline (time < 54 mg/dL: 0.50% ± 0.79% vs 0.59% ± 0.89%, p = 0.571; time < 70 mg/dL: 2.12% ± 1.59% vs 2.32% ± 2.42%, p = 0.602).
Conclusion: The use of hybrid closed-loop systems achieves a sustained improvement in glycaemic control and glycaemic variability in children and adults with type 1 diabetes.

Disclosure: P.I. Beato Vibora: None.
715
First home evaluation of the Omnipod Horizon™ Automated Glucose Control System in adults with type 1 diabetes
S.A. Brown1, B.W. Bode2, C.J. Levy3, G.P. Forlenza4, B.A. Buckingham5, A. Criego6, T.T. Ly7, Omnipod Horizon Study Group;
1Division of Endocrinology and Medicine, University of Virginia, Charlottesville, 2Atlanta Diabetes Associates, Atlanta, 3Icahn School of Medicine at Mount Sinai, New York, 4Barbara Davis Center for Diabetes, Unversity of Colorado School of Medicine, Aurora, 5Department of Pediatrics, Division of Pediatric Endocrinology, Stanford University, Standford, 6Department of Pediatric Endocrinology, Park Nicollet Clinic, International Diabetes Center at Park Nicollet, Minneapolis, 7Insulet Corporation, Acton, USA.
Background and aims: The Omnipod Horizon™ System is a hybrid closed-loop (HCL) system consisting of a tubeless insulin pump with a control algorithm linked to a Dexcom G6 sensor. The system provides automated insulin delivery with customizable glucose targets from 110-150mg/dL, adjustable by time of day to allow therapy personalization. This study is the first outpatient safety and effectiveness evaluation of the system, including use at the higher targets of 130-150mg/dL.
Materials and methods: Participants aged 14-70y with T1D>6mo and A1C<10.0% used the HCL system at home for 14 days over the winter holidays with unrestricted eating and exercise (8 participants spent first 2 days in a hotel). Participants set protocol-determined higher targets of 130, 140, and 150mg/dL for 3 days each, then could freely choose their targets from 110-150mg/dL for the last 5 days. Primary outcomes were safety measures and percent time 70-180mg/dL for the 5 days of HCL use with free choice of target, as well as for the first 9 days of HCL use stratified by target glucose.
Results: Participants thus far (n=13) had a mean±SD age of 35±13y, T1D duration 16±13y, and A1C 6.9±0.8%. Glycemic outcomes are shown in the Table. During the free choice period, participants primarily chose the 110mg/dL (59% of study time) and 120mg/dL (41%) targets. For 53 patient-days of HCL use during the free choice period, percent time from 70-180mg/dL was 74.3±7.6%. Percent time <70mg/dL was low: 0.9±1.3% overall and 0.9±2.2% overnight. At the 130, 140, and 150mg/dL targets, percent time from 70-180mg/dL was 75.6±11.6%, 66.5±8.9%, and 63.7±7.9%, respectively. Percent time <54 and <70mg/dL decreased with increasing target, without a corresponding increase in time ≥250mg/dL. There were no serious adverse events.
Conclusion: The HCL system was safe and performed well in adults with T1D when used at home for 5 days with free choice of target glucose, as well as when used with higher glucose targets. Participants were invited to continue in a 3mo outpatient study of the system, which is currently underway.

Clinical Trial Registration Number: NCT04176731
Supported by: Insulet Corporation
Disclosure: S.A. Brown: Grants; Insulet, Tandem Diabetes Care, Dexcom, Roche Diagnostics, Tolerion.
716
Investigating the safety and glycaemic control of fast-acting insulin aspart with a closed-loop delivery system in adults with type 1 diabetes
S.J. Russell1, C.A. Balliro2, M. Ekelund3, F. El-Khatib4, T. Graungaard5, R. Jafri1, N. Rathor6, J. Sherwood1, E.R. Damiano4;
1Diabetes Research Unit, Massachusetts General Hospital, Boston, USA, 2Biostatics Center, Massachusetts General Hospital, Boston, USA, 3Type 1 Diabetes & Functional Insulins, Novo Nordisk A/S, Søborg, Denmark, 4Department of Biomedical Engineering, Boston University, Boston, USA, 5Biostatistics, Novo Nordisk A/S, Søborg, Denmark, 6Medical Affairs, Novo Nordisk A/S, Søborg, Denmark.
Background and aims: Combining the bionic pancreas (iLetTM) with fast-acting insulin aspart (faster aspart) is of interest given the improved pharmacological and glycaemic profile of faster aspart versus conventional rapid-acting insulin analogues. We investigated the safety and glycaemic control of the insulin-only configuration of the iLetTM delivering faster aspart using different algorithm tmax settings in adults with type 1 diabetes.
Materials and methods: We performed a single-centre, single-blind, crossover (two 7-day treatment periods) escalation trial over three sequential cohorts in which subjects were randomised to a default tmax (t65) setting followed by a non-default tmax setting (t50 [cohort 1], t40 [cohort 2], t30 [cohort 3]), or vice versa, all with faster aspart. Each cohort randomised eight new subjects if escalation stopping criteria were not met in the previous cohort.
Results: Two subjects discontinued treatment, one due to ‘low blood glucose’ during the first treatment period of cohort 3 (t30). No severe hypoglycaemic episodes were reported and there were no clinically significant differences in adverse events between groups. Mean time in low (sensor) glucose (<54 mg/dL, primary endpoint) was <1.0% for all tmax settings (Table). Except for the default tmax setting in cohort 1, the mean time in range (70-180 mg/dL) was >70%. Mean glucose in cohorts 1 and 2 was significantly lower at non-default versus default tmax settings, with comparable insulin dosing.
Conclusion: There were no safety concerns with faster aspart in the iLetTM at non-default tmax settings. Improvements in glycaemic control at non-default tmax settings were observed.

Clinical Trial Registration Number: NCT03816761
Supported by: Novo Nordisk
Disclosure: S.J. Russell: Non-financial support; Novo Nordisk.
717
Six-months at-home hybrid closed-loop vs manual insulin delivery with finger-stick blood glucose monitoring in adults with type 1 diabetes: a randomised controlled trial
D.N. O'Neal1, S. McAuley1, S. Vogrin2, L. Bach3, N. Cohen4, P. Colman5, C. Hendrieckx6, J. Holmes-Walker7, A. Jenkins8, J. Kaye9, R. McCallum10, S. Stranks11, S. Trawley12, T. Jones13, JDRF Australia Hybrid Closed Loop Study Group;
1Department of Diabetes and Endocrinology, St Vincent's Hospital Melbourne, Fitzroy, 2University of Melbourne Department of Medicine, University of Melbourne, Parkville, 3Department of Endocrinology, The Alfred Hospital, Prahran, 4Department of Diabetes, The Baker Institute, Prahran, 5Department of Endocrinology and Diabetes, Royal Melbourne Hospital, Parkville, 6Australian Centre Behavioural Research in Diabetes, Melbourne, 7Department of Diabetes and Endocrinology, Westmead Hospital, Westmead, 8Clinical Trials Centre, University of Sydney, Camperdown, 9Department of Diabetes and Endocrinology, Sir Charles Gairdner Hospital, Perth, 10Department of Diabetes and Endocrinology, Royal Hobart Hospital, Hobart, 11Department of Diabetes, Network Director Southern Adelaide Diabetes and Endocrine Service, Oaklands Park, 12Cairnmiller Institute, Melbourne, 13Department of Diabetes and Endocrinology, Princess Margaret Hospital, Perth, Australia.
Background and aims: Few long-term RCTs compare Hybrid Closed Loop (HCL) insulin delivery to manual (non-HCL) insulin dosing in type 1 diabetes (T1D). It was our aim to examine glycaemic and psychosocial outcomes in adults with T1D using HCL vs. manual insulin dosing with self-monitoring of blood glucose (SMBG) for 6 months.
Materials and methods: Adults using multiple daily injections or pumps with SMBG were randomized 1:1 after insulin dose optimisation to 26 weeks of HCL (Medtronic 670G) or continuation of current therapy. The primary outcome was time in target range (3.9-10.0mmol/L) with masked CGM during the final 3 weeks. Secondary outcomes included other CGM metrics, HbA1c, treatment satisfaction (DTSQs) and diabetes distress (PAID). Intention to treat analysis was performed with ANCOVA or rank sum test.
Results: HCL and control groups were well balanced at baseline (Table). At 26 weeks, mean (95% CI) CGM time in range with HCL was greater by 14.8% (11.1, 18.5), with reduced high and low glucose time, and lower HbA1c. There were no between-group differences in treatment satisfaction or diabetes distress (Table).
Conclusion: HCL provided a significant and sustained glycaemic benefit compared with standard therapy. Results will inform potential users and health professionals and a cost-benefit analysis may facilitate HCL access.

Clinical Trial Registration Number: ACTRN12617000520336
Supported by: JDRF Australia
Disclosure: D.N. O'Neal: Grants; Medtronic, Novo. Honorarium; Medtronic, Novo, Merck, Abbott, Sanofi, AMSL. Lecture/other fees; Medtronic, Novo, Sanofi.
718
Patient-reported outcomes reveal the potential positive impact of hybrid closed-loop systems on users’ emotional well-being
S. Suhl, J. Rost, R. Wood;
dQ&A, San Francisco, USA.
Background and aims: Hybrid closed-loop (HCL) systems use data from continuous glucose monitors (CGM) and algorithms to automatically adjust the basal rate of insulin delivery by a pump. While the primary goal of these systems is to improve glycemic outcomes, this study sought to understand the impact different HCL systems may have on emotional well-being. There are two currently available FDA approved HCL systems: the MiniMed 670G and Control-IQ. The MiniMed 670G, when in Auto Mode, adjusts the pump's basal rate to maintain a target glucose range. Control-IQ, known as an advanced HCL system, adjusts basal insulin delivery and delivers automatic correction boluses. Control-IQ was preceded by the Basal-IQ system, which only suspends basal insulin delivery, known as predictive low glucose suspend (PLGS), and cannot adjust the basal rate. There are also two open-sourced do-it-yourself (DIY) HCL systems - Loop and OpenAPS - these systems are not FDA approved and use old out-of-warranty Medtronic pumps.
Materials and methods: Users of both pump and CGM (n=931) from an opted-in US research panel were evaluated using the World Health Organisation- Five Well-Being Index (WHO-5). Information about respondents’ use of HCL systems was recorded, and demographic and health information was also collected.
Results: Those using Control-IQ, an HCL system that also delivers automatic correction boluses, are significantly less likely than non-HCL pump and CGM users (23% vs 38%, p=.031) to have poor emotional wellbeing (as indicated by a WHO-5 score below 13). Similarly, users of Loop and OpenAPS are significantly less likely to have poor wellbeing than non-HCL users (18% vs 38%, p=.01). Contrastingly, users of the older MiniMed 670 HCL system and the Basal-IQ PLGS system have WHO-5 scores statistically similar to those of non-HCL pump and CGM users.
Conclusion: These findings suggest the potential impact of automated correction boluses on the emotional wellbeing of people with diabetes. As advancements toward fully closed-loop technology continue to develop, this study proves promising for the potential contribution this technology could have to the holistic well-being of its users. Future research should investigate the impact that these HCL systems have on time spent in the target blood glucose range (70-180 mg/dL), as well as the mechanism through which such automated systems improve emotional well-being. One hypothesis is that these systems improve overall emotional well-being through two mechanisms - improving glycemic outcomes and decreasing the burden of diabetes. HCL systems may also improve the quality and quantity of sleep, which is known to impact emotional well-being, and this relationship should be investigated further. Finally, at the time of this research, Control-IQ is a relatively novel therapy system, and it is possible that the full benefits of the system have not yet materialized. A follow-up study should evaluate HCL system tenure to investigate whether emotional well-being improves over time as patients fully adapt to living with these automated HCL systems.

Disclosure: S. Suhl: Other; dQ&A is a diabetes research company. This survey was self-funded, but subscribers to our services include diabetes device manufacturers and pharmaceutical companies.
719
Nine months experience on hybrid closed loop system in children and adolescents previously treated with multiple daily injections
G. Petrovski, J. Campbell, F. Al Khalaf, F. Umer, K. Hussain;
Endocrine and Diabetes, Sidra Medicine, Doha, Qatar.
Background and aims: The clinical improvements observed after 3 months in children and adolescents transitioning from Multiple Daily Injection (MDI) to the MiniMed 670G Hybrid Closed Loop (HCL) system using a 10-day initiation protocol have been previously reported. The clinical outcomes were further evaluated over a 9-month period, with the aim to study the sustainability of the outcomes with HCL systems in this age group.
Materials and methods: Children and adolescents aged 7 to 18 years with T1D who were transitioned from MDI to the MiniMed 670G system following the structured 10-Day initiation protocol at the Sidra Medicine-Doha, Qatar, and who had at least 9 months of data with the MiniMed 670G system were included in the analysis.. Auto Mode usage, time in the target glycemic range (70-180mg/dL) (TIR) and HbA1c, were evaluated at three, six and nine months after Auto Mode initiation.
Results: 30 children and adolescents (age 10.2±2.6 years) on MDI were transitioned to the MiniMed 670G system following the 10-day protocol. All were still using the system after nine months and were included in the analysis. Auto Mode usage was 87.2% in month 1 and 88.9% in month 9. The mean HbA1c significantly decreased from 8.2 ± 1.4% (66 ± 15.3 mmol/mol) at baseline to 6.7±0.8% (50±8.7 mmol/mol) at 3 months (p=0.021), to 6.9±0.7% (52±7.7 mmol/mol) at 6 months (p=0.027) and to 6.8±0.5% (51±5.5 mmol/mol) at 9 months (p=0.024). TIR significantly increased from baseline to the 3 first months and maintained over the 9 months (Figure 1). No severe hypoglycemia nor DKA were reported.
Conclusion: Children and adolescents with T1D, transitioning from MDI to the 670G HCL system, with a defined short protocol, maintain their improvements in glycemic control (HbA1c and TIR) over the 9 months. The results question the conventional thought that experience with technology is necessary for long lasting success with automated insulin delivery systems as Minimed 670G.

Clinical Trial Registration Number: NCT03755479
Disclosure: G. Petrovski: None.
PS 63 The varied use of technologies in type 2 diabetes
720
A comparative study based on real time analysis of physical activity and quality of sleep in early and late night eater patients with type 2 diabetes, using wearable fitness technology
S. Rastogi, D. Verma;
Department of Physiology, King George's Medical University, Lucknow, India.
Background and aims: 1. To study the effect of walking 8,000 steps five days a week on various parameters in early and late night eater diabetics. 2. To study the effect of early and late meal intake on the quality of sleep
Materials and methods: 50 patients from Out Patient Department (Endocrinology )in Lucknow, were randomly divided into 2 groups of 25 patients each.1 group of early night eaters (TRM Group) and the other late night eater group. Anthropometric parameters like height, weight, neck size, waist, hip size, waist hip ratio, BMI and biochemical parameters blood sugar fasting, post-prandial, HbA1c, blood pressure, systolic, diastolic and heart rate were measured in the first visit and then after 6 months. Patient was then, made to wear MI Fit, a wearable real time tracker of heart rate, quality of sleep, pedometer, modes of walking, swimming, training on treadmill, exercise mode which the user can change according to whichever physical activity he or she is doing. Data was received on the mobile app of MI Fit on the phone of the owner of the Fit band via blue tooth. Subjects wore the band for 10 days, then data was collected and analysed. Standard Convention Treatment of diabetes was followed by both groups of patients.
Results: Mean arterial pressure, pulse rate, diastolic blood pressure, waist and neck size were not significantly different. BMI, Hip size, systolic blood pressure, HbA1c, blood sugar (fasting and post- prandial) were significantly different (p< 0.05). The average heart rate of TRM was 86.89 beats per minute vs control group (92.46), quality of sleep in both groups was markedly different with deep sleep approximately 1and a half hour more in early night eaters.
Conclusion: Early night eaters had better control of sugar (fasting and post prandial), and HbA1c and were more consistent in their goal of walking 8000 steps daily when compared to late night eaters.

Disclosure: S. Rastogi: None.
721
Assessment of sensor performance of a blinded professional continuous glucose monitoring system in hospitalised patients with type 2 diabetes
H.C. Haberl1, T. Pöttler1, D.A. Hochfellner1, F. Aberer1, H. Ziko1, L. Bytyqi1, P. Baumann1, J. Samonigg1, P. Beck2, A. Fahrleitner-Pammer1, J.K. Mader1;
1Division of Endocrinology and Diabetology, Department of Internal Medicine, Medical University of Graz, Graz, 2decide Clinical Software GmbH, Graz, Austria.
Background and aims: Current state of the art for inpatient diabetes management is determination of glucose levels by capillary measurements using a point-of-care (POCT) device. Continuous glucose monitoring (CGM) might be useful in hospitalized patients to detect patterns of glycemia, to be alerted in case of relevant glucose excursions and to reduce workload of staff. Few data exist on sensor performance during inpatient stay. The aim of the present study was to assess sensor performance of a blinded professional CGM during hospital stay in patients with type 2 diabetes (T2D) on the general ward.
Materials and methods: 30 inpatients with T2D (gender 60% female, 100% Caucasian, age 73.9 ± 11.0 years, BMI 28.6 ± 5.6 kg/m2, diabetes duration 12.8 ± 9.5 years, HbA1c 71±23 mmol/mol) were included in the analysis. Capillary glucose values were measured 4 times per day using a POCT device connected to the laboratory information system (AccuChek Inform II, Roche Diabetes Care). Blinded CGM was performed using Abbott Libre Pro (Abbott Diabetes Care). Sensors that were removed early were replaced. Data were downloaded after sensor removal. All concomitantly available data pairs were used for the analysis. Sensor performance was assessed by calculation of median absolute relative difference (MARD) and Parks Error Grid Analysis.
Results: A total of 872 data pairs were available for analysis. Mean duration of sensor use was 7.4 ± 3.7 days. 39 sensors were used; 7 patients required more than one sensor during their inpatient stay due to exceeding the 14-days sensor runtime (n=1 sensor), accidental sensor removal (n=5 sensors) or removal prior to diagnostic procedures (n=3 sensors). The MARD during the entire glycemic range of all sensors (n=872 sensor-reference pairs) was 8.8 (3.8; 15.2)%. The MARDs within the hypoglycemic (<3.9 mmol/l; n=11), euglycemic (3.9-10.0 mmol/l; n=633) and hyperglycemic glucose ranges (>10.0 mmol/l; n=228) were 13.2 (7.8; 24.0)%, 9.3 (4.1; 15.9)% and 7.0 (3.2; 13.0)%, respectively. 99.9% of sensor - reference glucose pairs were situated in Zones A and B of Parkes Error Grid.
Conclusion: Our data suggest that CGM accuracy during hospitalization on the general ward is comparable to reported data during normal conditions. CGM might become a potential tool to monitor diabetes management during hospitalization.
Clinical Trial Registration Number: DRKS00011487
Supported by: No funding was received for the study. Sensors were provided free of charge by Abbott Diabetes Care.
Disclosure: H.C. Haberl: None.
722
UK 1st National Health Service (NHS) EndoBarrier service for uncontrolled diabesity: 2-year outcomes for all 62 treated patients
R.E.J. Ryder1, M. Yadagiri1, S.P. Irwin1, W. Burbridge1, M.C. Wyres1, R. Allden2, T. Bashir3, J.P. Bleasdale4, P. Sen Gupta5, E.N. Fogden2, M.P. Anderson2;
1Diabetes, City Hospital, Birmingham, 2Gastroenterology, City Hospital, Birmingham, 3Dietetics, City Hospital, Birmingham, 4Anaesthetics, City Hospital, Birmingham, 5Diabetes, Guy's and St Thomas' Hospital, London, UK.
Background and aims: EndoBarrier is a 60 cm duodenal-jejunal bypass liner endoscopically-implanted for up to one year and designed to mimic the by-pass part of roux-en-y bariatric surgery. We aimed to establish an NHS service providing EndoBarrier therapy and to assess the safety, efficacy and sustainability in patients with suboptimally-controlled diabesity.
Materials and methods: We provided EndoBarrier to 62 patients with type 2 diabetes and obesity, suboptimally controlled by standard therapies. We monitored outcomes during EndoBarrier therapy and for one year after removal, in a registry.
Results: All 62 patients have completed one year after EndoBarrier removal and of these 46/62 (72%) (age 51.5±7.7 years, 52% male, diabetes duration 14.5 (8-20) years, BMI 41.6±7.1 kg/m2) attended follow-up. During EndoBarrier treatment, mean ± SD HbA1c fell by 21.1±19.6 mmol/mol, from 77.1±20.0 to 56.0±11.2 mmol/mol (by 1.9±1.8 %, from 9.2±1.8 to 7.3±1.0 %) (p<0.001), weight by 17.2±8.8 kg from 121.9 ± 29.4 to 104.7±30.1 kg (<0.001), systolic BP from 139.0±14.0 to 126.0±14.6 mmHg (<0.001), serum alanine aminotransferase (marker of liver fat) from 30.0±16.9 to 18.8±11.0 U/L (p<0.001). Median (IQR) total daily insulin dose reduced from 104 (54-162) to 30 (0-62) units (n=31, p<0.001); 10/31 (32%) insulin treated patients discontinued insulin. One year after EndoBarrier removal 18/46 (39%) demonstrated sustained improvement, 18/46 (39%) partially sustained improvement and 10/46 (22%) reverted to baseline (figure). Of those deteriorating, 9/10 (90%) had depression and/or bereavement. 10/62 (16%) had early EndoBarrier removal for adverse events or symptoms; all 10 fully recovered after removal and most derived significant benefit.
Conclusion: Our data demonstrates EndoBarrier as highly effective in patients with uncontrolled diabesity, with maintenance of significant improvement one year after removal in 78%. As an endoscopic procedure it is relatively simple and non-invasive and deserves further investigation. Note: Data first presented at the American Diabetes Association 80th Scientific Sessions, 12-16 June 2020, Chicago, USA.

Disclosure: R.E.J. Ryder: Honorarium; Consultancy for GiDynamics.
723
Glycaemic variability in people with impaired glucose tolerance/prediabetes
K. Douglas1, N. Annamalai2, P. Moore3, S. Thomson4;
1Claremont Medical Practice, Exmouth, 2Albany House Medical Centre, Wellingborough, 3The Adam Practice, Poole, 4The Atherstone Surgery, Atherstone, UK.
Background and aims: The use of continuous glucose monitoring has been suggested as a method of determining glucose control in prediabetes, including understanding glucose variability, which may be a risk factor in the progression to type 2 diabetes. This pilot research study aimed to determine glycaemic variability (%CV) in people diagnosed with impaired glucose tolerance (IGT) / prediabetes.
Materials and methods: The study included people aged 18 or over, with their most recent HbA1c 39-47 mmol/mol (5.7-6.4%) recorded in medical notes in the last 12 months. Pregnant patients were excluded, as were patients with diabetes. A total of 43 participants (60.5% female) from 5 primary care sites in the UK enrolled in the 2-week single arm study, wearing a FreeStyle Libre Pro Flash Glucose Monitoring SystemTM (glucose data was not available to participants). On average, HbA1c was 42.7±2.6 mmol/mol (6.06±0.25%), age was 62.5±8.3 years, BMI was 32.1±6.6 kg/m2, average time since diagnosis was 18±19 months, average Q diabetes score was 28.4±23.7% (mean±SD).
Results: Glucose variability (%CV) was 17.3±3.8%, %CV was greater during daytime hours (06:00 to 23:00) than at night (23:00 to 06:00), 17.7±4.1% and 12.9±3.5% respectively (mean±SD). %CV was greater in those with BMI<30 kg/m2 compared to those ≥30 kg/m2; 18.9±3.3% and 15.8±3.5% respectively (mean±SD). Mean glucose was 101.2±10.0 mg/dL, time in hyperglycaemia (>10.0 mmol/L, 180 mg/dL) was 0.09±0.23 hours per day (mean±SD). Sub-group analysis by HbA1c demonstrated %CV was 17.9% for those with higher HbA1c (≥43 mmol/mol, 6.1%), compared to 16.6% for those with lower HbA1c (<43 mmol/mol, 6.1%). Similarly, mean glucose and SD glucose were also greater for those with higher HbA1c, 105.1 mg/dL and 18.8 mg/dL compared to those with lower HbA1c, 97.2 mg/dL and 16.2 mg/dL. Ten anticipated sensor insertion site symptoms were experienced by five participants: erythema (n=2, well-defined redness), pain (n=1), bruising (n=1), itching (n=2), rash (n=2), bleeding (n=1) and other (n=1, ‘skin irritation’), all were mild in severity and resolved.
Conclusion: This population, with prediabetes experienced glucose variability of 17.3% (%CV). This was greater during daytime hours and in those with lower BMI (<30 kg/m2).
Clinical Trial Registration Number: ISRCTN15304729
Disclosure: K. Douglas: None.
724
How are the relationships between hypoglycaemia over 2 weeks and glycaemic variability different for different measurement durations of glycaemic variability?
S. Takeishi, K. Miura;
Diabetes, Inuyama Chuo General Hospital, Inuyama-city, Japan.
Background and aims: Increased coefficient of variation (CV) is reported to increase the risk of hypoglycaemia. Recently, the mean absolute glucose (MAG) and glycaemic variability percentage (GVP) have been proposed as metrics that reflect both the amplitude and frequency of blood glucose variations. CV is calculated according to the following formula: standard deviation (SD) ÷ mean glucose level × 100. Regarding the relationships between glycaemic variability (GV) during a short period and hypoglycaemia during a long period, there is little information of how the differences between SD, MAG, and GVP in the calculation methods affect these relationships. We investigated how the relationships between hypoglycaemia over 2 weeks and GV are different for different measurement durations of GV.
Materials and methods: This study was conducted while patients were hospitalised. In this cross-sectional study, we analysed the glucose levels over 24 h × 13 days [from 00:00 on day 2 to 24:00 on day 14 (CGM attachment: day 1)] measured during hospitalization for type 2 diabetes treatment using a CGM (FreeStyle Libre Pro) in 168 patients with type 2 diabetes. Values for hypoglycaemia over a span of 13 days (‘total duration’) were evaluated. GV derived from varying extracted durations (increments of 1 day from day 2) was evaluated. We analysed the associations between GV derived from the ‘extracted durations’ and percentage of time in the hypoglycaemic range (<70 mg/dL) [TIR<70] derived from the ‘total duration’ [TIR<70 (total)]. Following calculation of the CV, we proposed novel GV metrics as follows: MAG ÷ mean glucose level × 100 (MAG/mean) and GVP ÷ mean glucose level × 100 (GVP/mean).
Results: The dotted black line in the figure shows the mean in all patients of the glucose levels at the same hours and minutes (Mean) over 24 h × 13 days according to the CGMs. The coloured lines in the figure show the correlation between the GV derived from ‘extracted durations’ and TIR<70 (total). For the MAG/mean and GVP/mean, the correlation between the GV derived from ‘extracted durations’ and TIR<70 (total) tended to increase with increasing ‘extracted durations’. However, the correlation between the CV derived from ‘extracted durations’ and TIR<70 (total) did not tend to increase with increasing ‘extracted durations’. The ‘extracted duration’ required to achieve a ‘correlation coefficient of the GV to TIR<70 (total)’ [‘r’] ≥ 0.95 × ‘r’ where GV was derived from ‘extracted durations’ of 13 days (‘total duration’) for the MAG/mean and GVP/mean was 6 days.
Conclusion: For the MAG/mean and GVP/mean, the correlation between the GV derived from ‘extracted durations’ and TIR<70 derived from the ‘total duration’ tended to increase with increasing ‘extracted durations’. However, the correlation between the CV derived from ‘extracted durations’ and TIR<70 derived from the ‘total duration’ did not tend to increase with increasing ‘extracted durations’.

Clinical Trial Registration Number: UMIN000034425
Disclosure: S. Takeishi: None.
725
Endobarrier in diabetes/prediabetes with obstructive sleep apnoea study: the final results
M. Yadagiri1, F.Y. Kinney2, N. Ashman3, J. Adams3, M.C. Wyres1, E.S. Sharratt3, C. Greenwood3, M.H. Lang3, J. Bleasdale4, E. Fogden5, M. Anderson5, C. Walton6, M.A. Greenstone7, R.E.J. Ryder1;
1Diabetes, City Hospital, Birmingham, 2Research, City Hospital, Birmingham, 3Respiratory Medicine, City Hospital, Birmingham, 4Anaesthetics, City Hospital, Birmingham, 5Gastroenterology, City Hospital, Birmingham, 6Diabetes, Hull Royal Infirmary, Hull, 7Respiratory Medicine, Hull Royal Infirmary, Hull, UK.
Background and aims: EndoBarrier, a 60cm endoscopically implanted proximal intestinal liner is implanted for up to one year and then removed. This response to intervention trial aim was to assess the extent to which patients with type2 diabetes or pre-diabetes, obesity (BMI 30-45kg/m²) and moderate obstructive sleep apnoea (OSA) requiring continuous positive airway pressure ventilation (CPAP) are able to discontinue CPAP following EndoBarrier-related weight loss.
Materials and methods: We assessed Apnoea Hypopnoea Index (AHI), weight and HbA1c before and during EndoBarrier treatment and following its removal in the 12 patients with moderate OSA requiring continuous positive airway pressure ventilation (CPAP) {75% female, 8/12 (66%) type 2 diabetes, 4/12 (34%) prediabetes, mean ± SD age 52.6±9.7 years, BMI 37.4±3.5 kg/m², median duration of OSA while on CPAP 9.0(7.0-15.0) months}.
Results: During the period of EndoBarrier implantation, mean ± SD HbA1c fell by 13.7±17.9 mmol/mol from 62.5 ± 17.4 to 48.8 ± 10.6 mmol/mol (by 1.26±0.7% from 7.9 ± 1.6 to 6.6 ± 0.9%) (p=0.023), weight by 10.5±4.0 kg from 103.8± 14.1 to 93.3±13.7 kg (p<0.001) and AHI fell by 9.1±5.0 events/hour from 18.9±3.8 to 9.7±3.0 events/hour (p<0.001). There was one serious adverse event in the form of small oesophagus perforation during EndoBarrier removal which was conservatively managed. During the period of EndoBarrier treatment the AHI of all 12 patients fell below 15 such that they no longer required CPAP according to NICE criteria. After EndoBarrier removal, 10/12 (83%) patients attended follow up and at 12 months after removal, AHI remained below 15 in 5/10 (50%) patients but in the other 5 the AHI rose above 15 such that restarting CPAP was recommended. Two of these 5 patients, inspired by the desire to avoid CPAP, lost the regained weight and their AHI dropped below 15 again. Thus, 7/10 (70%) of patients were able to remain off CPAP 12 or more months after EndoBarrier removal.
Conclusion: These results demonstrate major benefit of EndoBarrier in moderate OSA, allowing patients to discontinue CPAP with maintenance of improvement at follow up in 70% and confirm previously demonstrated metabolic improvements in diabesity. Note: Data first presented at the American Diabetes Association 80th Scientific Sessions, 12-16 June 2020, Chicago, USA.
Clinical Trial Registration Number: ISRCTN:33788132
Supported by: Association of British Clinical Diabetologists
Disclosure: M. Yadagiri: None.
PS 64 Novel applications of technology in diabetes
726
Accuracy of a subcutaneously inserted NIR spectrometer sensor for continuous glucose, ketone and lactate measurement in interstitial fluid: proof-of-concept in pig model
D. Stocker1, H. Huysmans1, L. Vlaminck2, S. Schauvliege2, D. Delbeke1;
1Indigo Diabetes, Ghent, 2Department of Surgery and anaesthesiology of domestic animals, Faculty of Veterinary Medicine, Ghent University, Merelbeke, Belgium.
Background and aims: While adoption of continuous glucose monitoring (CGM) is growing, more generalized use might be accelerated by lower sensor cost, user preference and incremental benefits for diabetes management, compared to currently available systems. Novel low-cost technologies hold the potential to overcome such hurdles: We investigated the feasibility and accuracy of a long-term, s.c. inserted, continuous multi-metabolite sensor in a Göttingen minipig model.
Materials and methods: Following development of a near-infrared spectroscopy-based sensor on a microchip, we inserted 2 prototypes per non-diabetic animal in the subcutaneous abdominal tissue left (sensor L) and right (sensor R). During all tests, the animals were awake, able to move freely, and exposed to near-outdoor temperature variations. For the experiments, the pigs repeatedly underwent i.v.-induced glucose, beta-hydroxybutyrate and lactate challenges over a study period of 2 months. Sensor accuracy of the continuous s.c. glucose and lactate measurements was compared to blood reference values measured with a Biosen C-line EKF Diagnostics, while s.c. beta-hydroxybutyrate measurements were compared to blood ketone values assessed with a Menarini Glucomen LX in real-time for the left- and the right-sided sensor.
Results: Mean Absolute Relative Difference (MARD) between 40 and 400 mg/dl was 6.5 % for sensor L and 6.4 % for sensor R in 765 paired data points. Continuous beta-hydroxybutyrate sensing Mean Absolute Difference (MAD) was 0.23 mM and 0.22 mM for the 2 sensors in 125 paired data points respectively. Lactate MAD was 0.53 mM and 0.44 mM for 288 paired data points. No adverse events related to surgical procedures or sensor function were observed.
Conclusion: Dynamics of s.c. ketone and lactate levels closely correlate to blood levels, similar to s.c. glucose compared to blood glucose. Measuring glucose, ketones and lactate continuously and simultaneously with a spectroscopy-based, fully invisible sensor is feasible in non-diabetic minipigs, both within and outside the physiological range, with low between-sensor accuracy variation. Further clinical research will validate accuracy of the technology in people with diabetes.

Supported by: European Union Horizon 2020 Grant 811792, VLAIO grant number HBC.2018.0342
Disclosure: D. Stocker: Employment/Consultancy; David. Stock/Shareholding; David.
727
Machine learning-based glucose prediction with use of continuous glucose and physical activity data: The Maastricht Study
Y.D. Foreman1,2, W.P.T. van Doorn2,3, N.C. Schaper1,2, H.H.C. Savelberg4, A. Koster5, C.J.H. van der Kallen1,2, A. Wesselius4, S.J.P. Eussen2,6, M.T. Schram1,2, P.C. Dagnelie1,2, B.E. de Galan1,2, O. Bekers2,3, C.D.A. Stehouwer1,2, S.J.R. Meex2,3, M.C.G. Brouwers1,2;
1Internal Medicine, MUMC+, Maastricht, 2CARIM School for Cardiovascular Diseases, Maastricht University, Maastricht, 3Clinical Chemistry, MUMC+, Maastricht, 4NUTRIM School for Nutrition and Translational Research in Metabolism, Maastricht University, Maastricht, 5CAPHRI Care and Public Health Research Institute; Social Medicine, Maastricht University, Maastricht, 6Epidemiology, Maastricht University, Maastricht, Netherlands.
Background and aims: Closed-loop dosing systems, which integrate continuous glucose monitoring (CGM) and algorithms that continuously guide insulin dosing, have been shown to improve glycaemic control. Such algorithms can be further optimized by the ability to predict future glucose values, which can be used to overcome both sensor delay (i.e., the inherent ~10-minute discrepancy between interstitially measured and actual plasma glucose values), and sensor malfunctions (i.e., periods during which no glucose values are recorded). In this proof-of-principle study, we investigated to what extent machine learning models can predict glucose values based on historical glucose measurements and physical activity data.
Materials and methods: We used data from The Maastricht Study, an observational population‐based cohort that comprises individuals with normal glucose metabolism, prediabetes, or type 2 diabetes. We included individuals who underwent at least 48h of CGM (n=851), most of whom simultaneously wore a physical activity tracker. A random subset of individuals (70%) was used to train models at predicting glucose levels at 15- and 60-minute intervals based on 30 minutes of previous (a) CGM data only, or (b) combined CGM and physical activity data. In the remainder of the participants, predicted values were compared to actual glucose values and evaluated with root-mean-square error (RMSE), Spearman’s correlation coefficient (rho) and clinical error grids (Parkes).
Results: Models trained with CGM data were able to accurately predict glucose values at 15 (RMSE: 0.19mmol/L; rho: 0.96) and 60 minutes (RMSE: 0.59mmol/L, rho: 0.72). Performance at 15 (RMSE: 0.29mmol/L, rho: 0.99) and 60 minutes (RMSE: 0.70mmol/L, rho: 0.78) was comparable in individuals with type 2 diabetes only. Incorporation of physical activity data only slightly improved glucose prediction in both the total study population (15-minute RMSE: 0.18mmol/L, rho: 0.97; 60-minute RMSE: 0.58mmol/L; rho: 0.73) and type 2 diabetes population (15-minute RMSE: 0.27mmol/L, rho: 0.99; 60-minute RMSE: 0.70mmol/L; rho: 0.79). According to Parkes error grids (zones A and B), glucose prediction was clinically safe at both 15 (100%) and 60 minutes (>99%). In general, the models tended to under- rather than overestimate the actual glucose values.
Conclusion: In this proof-of-principle study, we show that our machine learning-based models are capable of accurately and safely predicting glucose values at 15- and 60-minute intervals. As such, the prediction models can be used to improve closed-loop dosing systems by overcoming sensor delay and bridging periods of sensor malfunction. Future research should extend and validate these results in individuals with type 1 diabetes.
Supported by: ERDF, PoL, SDW, PSID, CVC, CARIM, CAPHRI, NUTRIM, SA, HFL, JCBV, NNF, SAN, MD
Disclosure: Y.D. Foreman: None.
728
The CBmeter pilot study: assessment of carotid body function aimed at early diagnosis of metabolic dysfunction
M. Lages1,2, G.C. Brito3,2, N.V. Lopes3,2, R. Fonseca-Pinto1,2, S. Feijó4,2, A. Vieira4, I. Ribeiro5, L. Carvalho5, C.G. Silva1,2, M.P. Guarino1,2;
1School of Health Sciences, Polytechnic of Leiria, Leiria, 2Center for Innovative Care and Health Technology (ciTechCare), Polytechnic of Leiria, Leiria, 3School of Technology and Management, Polytechnic of Leiria, Leiria, 4Hospital Centre of Leiria, Leiria, 5Polytechnic Institute of Castelo Branco, Castelo Branco, Portugal.
Background and aims: Carotid bodies (CB) are peripheral clusters of chemoreceptor cells that detect and respond to variations in gases and blood pH. Recently, it has been suggested that CB are important metabolic regulators, that respond to circulating insulin increasing heart rate (HR), respiratory rate (RR) and blood glucose levels, in a process mediated by the sympathetic nervous system. Early detection of dysmetabolism by recording cardiorespiratory and metabolic responses to stimuli that elevate insulin secretion, like meal ingestion, is an easy and non-invasive methodology with putative predictive value for metabolic dysfunction, based on detection of CB overactivation. To validate this hypothesis our team designed a prototype device, the CBmeter, that characterizes physiological changes in CB-mediated cardiorespiratory and metabolic parameters induced by two challenge tests: acute hyperoxia and mixed meal tolerance test in healthy and prediabetic volunteers.
Materials and methods: This interventional clinical study was performed in healthy volunteers (n=25) and prediabetic volunteers (n=8) recruited at two centres. CB activity was assessed by continuous monitoring of HR, RR, peripheral oxygen saturation (SpO2) and interstitial glucose (iGlu) in response to a hyperoxic challenge of 100% medicinal oxygen administration for 10s and during the intake of a standardized mixed meal (65% carbohydrates, 23% protein,12% lipids). The physiological signals were acquired with the CBmeter® prototype and processed using a software developed in MatLab, the CBview to look for patterns with predictive value for metabolic disease diagnosis. Data were analysed with GraphPad Prism 7. All procedures were in accordance with current European legislation.
Results: The results obtained with the CBmeter showed that the mean values of iGlu and HR, but not RR or SpO2, excursion curves were significantly different both in healthy volunteers and prediabetes patients during the experimental interventions (repeated measures ANOVA with Greenhouse-Geisser correction, F = 13.450, p = 0.006 and F = 6.415, p < 0.05, respectively). Post hoc tests using the Bonferroni correction revealed that glucose values significantly increase after ingestion of the mixed meal in both groups (p= 0.038 and p=0.013, respectively). Comparing clusters of RR values between healthy and prediabetes volunteers, we observe significant differences in RR values at time points corresponding to the hyperoxia challenge (p=0.007). Post hoc tests using the Bonferroni correction revealed that HR values increase after meal ingestion in both groups although the values were not significantly different.
Conclusion: CBmeter detects different patterns in RR, HR and iGlu variations in response to hyperoxia and to a mixed meal in healthy and prediabetic volunteers. Data suggest that CB activity is altered in prediabetes patients and that the CBmeter may be a useful tool for early diagnosis of dysmetabolism in asymptomatic patients.
Supported by: Project funded by FCT/SAITC-POL/23278/2016
Disclosure: M. Lages: None.
729
Determinants of glycaemic variability: role of diabetes type, average glycaemic control and hypoglycaemic therapy
R. Ajjan1, K. Kao2, L. Brandner2, T.C. Dunn2, Y. Xu2;
1Leeds Institute of Cardiovascular and Metabolic Medicine, Leeds, UK, 2Abbott Diabetes Care, Alameda, USA.
Background and aims: Previous real-world studies of the FreeStyle LibreTM flash glucose monitoring system have solely used device data, and therefore were unable to stratify analysis by patient groups. Our aim was to assess differences in glycaemic parameters according to diabetes type, estimated (e)HbA1c and hypoglycaemic therapy.
Materials and methods: An optional, anonymous survey was conducted for users of FreeStyle Libre readers and FreeStyle Libre software from Dec 2019 - Feb 2020 (27 countries, mostly European). Self-reported diabetes type and therapy were linked to reader data uploads available from Sept 2014 - Feb 2020. Four groups were analysed: type 1 diabetes, type 2 diabetes on intensive insulin therapy (T1Dii and T2Dii, respectively), T2D on basal insulin (T2Dbi), and T2D on non-insulin-based therapies (T2Dni). Two glycaemic variability groups were established based on co-efficient of variation (CV) (>36% and ≤36%), as well as three estimated HbA1c groups (>8%, between 7-8%, and <7%). Between therapy groups, the chi-squared and z-tests were used to compare categorical rates by groups.
Results: A total of 2263 users were linked to their reader uploads comprising 1476 individuals with T1Dii, 523 with T2Dii, 144 with T2Dbi and 120 with T2Dni. Despite largely similar eHbA1c across insulin-treated individuals (T1Dii 7.2% (55 mmol/mol), T2Dii 7.1% (54 mmol/mol) and T2Dbi 7.2% (55 mmol/mol)), over two thirds (68.5%) of those with T1Dii had CV>36% compared to 26.6% of T2Dii and 24.3% of T2Dbi (p<0.001). T2Dni had the lowest eHbA1c at 6.3% (45 mmol/mol) with only 9.2% having high CV. This pattern was maintained across the three eHbA1c groups with significant differences detected in CV comparing T1Dii and T2Dii as shown in the Table below.
Conclusion: Our data demonstrate that the rate of achieving recommended CV≤36% is very different in T1Dii and T2Dii despite similar eHbA1c and hypoglycaemic therapy. In contrast, CV does not vary significantly comparing T2D individuals on intensive or basal insulin therapy. The distribution of CV is similar across different eHbA1c levels suggesting that high or low eHbA1c does not have a significant effect on CV. The exact mechanisms for the differences in CV between T1Dii and T2Dii are not entirely clear and may be related to lifestyle choices or adherence to therapy; this remains an area for future research.

Disclosure: R. Ajjan: None.
730
The ROTO Track® device improves rotation of insulin injections in type 1 diabetes: a proof-of-concept study
R. Tjalk-Bøggild1, C.K. Klarskov2, Y.H. Hamid3, L. Tarnow4, P.L. Kristensen2;
1ROTO Health ApS, Birkerød, 2Department of Endocrinology and Nephrology, Nordsjællands Hospital, Hillerød, 3Steno Diabetes Center Copenhagen, Gentofte, 4Steno Diabetes Center Sjælland, Holbæk, Denmark.
Background and aims: Lipohypertrophy (LH), a common side effect of insulin therapy, is caused by repetitively injecting insulin into the same location. When insulin is injected into LH lesions, the absorption of insulin may be erratic and unpredictable, which can lead to unexpected hyperglycemia and hypoglycemia and increased blood glucose variability. To improve injection techniques and avoid LH, a new medical device, ROTO Track® which automatically guides the person with diabetes to rotate the abdominal insulin injections was tested. The hypothesis is that the device can reduce the number of insulin injections in the same subcutaneous
Materials and methods: In this proof-of-concept cross-over study, baseline data about injection site in the abdominal region was collected blinded for one week with a non-guiding version of the device and compared to 12 weeks of device guidance in 35 people with T1DM. The device registered injection time and location on the abdomen. Based on this a “rotation score”, the primary endpoint, was calculated. Secondary end points included number and size of LH, glycemic variability and HbA1c. LH sizes were documented by drawing on a wound care grid after palpation of the skin. Interstitial glucose was measured with a continuous glucose monitor and the coefficient of variation, CV was calculated.
Results: The rotation score improved significantly from a baseline mean of 40.2% to 49.9% after one week (CI: 2.2% - 17.2%, p=0.012) and improved further after 12 weeks to 52.2% (p<0.001). After 12 weeks, LH was reduced both in mean size from 11.9 (+/- 9.5) cm2 to 8.2 (+/- 9.7) cm2 (p=0.041) and numbers (p=0.039) and the CV of interstitial glucose was reduced from 38.6 to 35.1 (p=0.009). There were no changes in mean interstitial glucose, HbA1c or hypoglycemic events after 12 weeks.
Conclusion: This proof-of-concept study indicates that the device is safe, improves rotation, reduces LH and reduces glycemic variability.
Clinical Trial Registration Number: NCT03407677
Supported by: Innovation Fund Denmark [grant numbers 8063-00049B] and Nordic Healthcare Technology
Disclosure: R. Tjalk-Bøggild: Employment/Consultancy; ROTO Health ApS. Stock/Shareholding; ROTO Health ApS.
731
GoBolus study: faster aspart impact on glycaemic control in a real-world population with type 1 diabetes on basal/bolus therapy as multiple daily injections using flash glucose monitoring
R. Ziegler1, T. Danne2, M. Axel Schweitzer3, W. Keuthage4, S. Kipper3, Y. Kretzschmar3, J. Simon5;
1Diabetes Clinic for Children and Adolescents, Muenster, 2Children’s Hospital Auf der Bult, Hannover, 3Novo Nordisk Pharma GmbH, Mainz, 4Schwerpunktpraxis für Diabetes und Ernährungsmedizin, Muenster, 5Medizinisches Versorgungszentrum im Altstadt-Carree Fulda GmbH, Fulda, Germany.
Background and aims: Randomised trials have shown that faster aspart (FA) improves glycaemic control in patients with type 1 diabetes (T1D). Flash glucose monitoring (FGM) is widely used for patients with T1D, especially intensive bolus insulin users. This form of monitoring requires no finger-prick calibration and provides readout of comprehensive glucose data. The German observational study GoBolus collected real-world clinical and patient-reported data of patients with T1D treated with basal/bolus therapy as multiple daily injections (MDIs), who were switched from other bolus insulins to FA by their physician, and used FGM.
Materials and methods: This was a 24-week, multicentre, single-arm, non-interventional study of adults with T1D (HbA1c 7.5%-9.5%) receiving FA and using FGM in local healthcare settings for at least 6 months prior to study inclusion. Primary endpoint was change in HbA1c from baseline to Week 24 (±4 weeks). Change in FGM from baseline to Week 24 was an exploratory endpoint.
Results: Overall, 243 patients were enrolled (55.6% were male) with a mean age of 49.9 years, mean baseline HbA1c of 8.1%, mean BMI of 28.1 kg/m2 and mean diabetes duration of 18.8 years. Over 24 weeks’ FA treatment, primary endpoint (HbA1c) decreased by 0.19% (p<0.01) with no changes in insulin doses or basal/bolus insulin ratios. FGM data (Figure) showed increased ‘time in range’ (TIR, 3.9-10 mmol/L) from 46.9% to 50.1% (p=0.01) and decreased time in hyperglycaemia (>10 and >13.9 mmol/L) from 49.1% to 46.1% (p=0.03) and 20.4% to 17.9% (p=0.01), respectively, with no change for time in hypoglycaemia (<3.9 and <3.0 mmol/L). Mean interstitial and 3-hour postprandial glucose improved from 10.4 to 10.1 mmol/L (p=0.04) and 11.9 to 11.0 mmol/L (p<0.01), respectively.
Conclusion: Switching bolus insulin to FA in patients with T1D on MDIs improved glycaemic control, increased TIR and decreased time in hyperglycaemia, as demonstrated by FGM data.

Clinical Trial Registration Number: NCT03450863
Supported by: Novo Nordisk
Disclosure: R. Ziegler: Non-financial support; Novo Nordisk.
PS 65 Novel therapies to reduce hypoglycaemia
732
Incident and recurrent hypoglycaemia with linagliptin and glimepiride in the CAROLINA trial
B. Zinman1, J. Rosenstock2,3, O.E. Johansen4, M. Hoiberg4, E. Pfarr5, M. Mattheus5, T. Meinicke6, J.T. George6, M.A. Espeland7, D.K. McGuire3, N. Marx8, S. Kahn9;
1Lunenfeld-Tanenbaum Research Institute, Mount Sinai Hospital, University of Toronto, Toronto, Canada, 2Dallas Diabetes Research Center at Medical City, Dallas, USA, 3University of Texas Southwestern Medical Center, Dallas, USA, 4Boehringer Ingelheim Norway KS, Asker, Norway, 5Boehringer Ingelheim Pharma GmbH & Co. KG, Ingelheim, Germany, 6Boehringer Ingelheim International GmbH, Ingelheim, Germany, 7Department of Biostatistics and Data Science, Wake Forest School of Medicine, Winston-Salem, USA, 8Department of Internal Medicine I, University Hospital Aachen, RWTH Aachen University, Aachen, Germany, 9Division of Metabolism, Endocrinology and Nutrition, Department of Medicine, VA Puget Sound Health Care System, Seattle, USA.
Background and aims: Treatment guideline recommendations for individuals with cardiovascular (CV) disease and type 2 diabetes (T2D) focus on medications with proven CV benefits. Avoidance of hypoglycaemia remains an important consideration. We report the effects of treatment on a range of hypoglycaemia outcomes in the CARdiovascular Outcome Study of LINAgliptin Versus Glimepiride in Type 2 Diabetes (CAROLINA).
Materials and methods: CAROLINA recruited adults with relatively early T2D, HbA1c 6.5-8.5%, and elevated CV risk who were randomized to linagliptin 5 mg or glimepiride 1-4 mg once daily added to usual care. Time to first and sum of first plus recurrent hypoglycaemia were assessed using proportional hazards and negative binomial regression across the following categories: any; symptomatic with blood glucose (BG) ≤70 mg/dL or severe; BG <54 mg/dL or severe; severe; and leading to hospitalisation.
Results: 6033 participants (mean age 64.0 years, HbA1c 7.2%, median T2D duration 6.3 years, 42% with CV disease) were followed for median 6.3 years. HbA1c over time did not differ between groups, but a significantly lower frequency of hypoglycaemia events was observed with linagliptin (Fig), regardless of definition, a difference further accentuated when including recurrent hypoglycaemia.
Conclusion: Linagliptin, compared with glimepiride, has a significantly lower hypoglycaemia burden. Given the potentially harmful clinical impact of hypoglycaemia, these data may help inform therapy selection.

Clinical Trial Registration Number: NCT01243424
Supported by: Boehringer Ingelheim & Eli Lilly and Company Diabetes Alliance
Disclosure: B. Zinman: Employment/Consultancy; Boehringer Ingelheim, Eli Lilly. Grants; Boehringer Ingelheim.
733
Effect of treatment with dapagliflozin on impaired awareness of hypoglycaemia in people with type 1 diabetes
L.A. van Meijel1, C.J. Tack1, B.E. de Galan1,2;
1Department of Internal Medicine, Radboud university medical center, Nijmegen, 2Department of Internal Medicine, Maastricht University Medical Center, Maastricht, Netherlands.
Background and aims: Iatrogenic hypoglycaemia is the most frequent complication of insulin therapy in people with type 1 diabetes (T1DM). About 25% of patients with T1DM have lost the capacity to timely detect hypoglycaemia, a condition referred to as impaired awareness of hypoglycaemia (IAH). IAH can be reversed by strict avoidance of hypoglycaemic events for at least 3 weeks. Adjunctive treatment with sodium glucose cotransporter 2 (SGLT-2) inhibitors has been shown to improve glucose control without increasing the risk of hypoglycaemia. The aim of our study was to investigate the effect of treatment with the SGLT-2 inhibitor dapagliflozin on awareness of hypoglycaemia in people with T1DM and IAH.
Materials and methods: Fifteen patients with T1DM and IAH (age 49.7±14.6 years, 40% males, disease duration 24.1±14.2 years, HbA1c 58.6±8.4 mmol/mol (7.5±0.8%)) were included in this randomized double-blind, placebo-controlled cross-over trial. They were treated with dapagliflozin 10 mg once daily or matching placebo, with a washout period of 2 weeks. At the end of each treatment period, subjects underwent a modified hyperinsulinaemic normoglycaemic-hypoglycaemic glucose clamp (glucose nadir 2.5 mmol/L). Blinded continuous glucose monitors were used in the final treatment weeks.
Results: Treatment with dapagliflozin significantly reduced HbA1c (-4.1±0.9 vs. 2.3±1.4 mmol/mol, dapagliflozin vs. placebo, p=0.004), glucose variability (SD 2.6±0.2 vs. 3.1±0.3 mmol/L, p=0.029), and body weight (-2.3±0.6 vs. 0.1±0.5 kg, p=0.033), but did not affect the frequency of hypoglycaemia. During the hypoglycaemic clamp, dapagliflozin reduced the need for exogenous glucose to maintain hypoglycaemia (glucose infusion rate (GIR) 3.2±0.3 vs. 4.1±0.4 mg·kg-1·min-1, p=0.022) and increased the symptomatic response to hypoglycaemia numerically, but not significantly (mean difference from euglycaemia 8.0±3.4 vs. 5.2±1.6, respectively, p=0.31).
Conclusion: Eight weeks of treatment with dapagliflozin improved overall glucose control and some components of IAH, but did not reverse it in patients with type 1 diabetes and IAH.
Clinical Trial Registration Number: NCT03556033
Disclosure: L.A. van Meijel: None.
734
Nasal glucagon reversed insulin-induced hypoglycaemia in adults with diabetes: a pooled analysis
E. Seaquist1, K. Khunti2, X. Zhang3, Q. Wang3, Y. Takita3, C.J. Child3, Y. Nagai3, Y. Yan3, M. Matsuhisa4;
1University of Minnesota, Minneapolis, USA, 2University of Leicester, Leicester, UK, 3Eli Lilly and Company, Indianapolis, USA, 4Tokushima University, Tokushima, Japan.
Background and aims: Nasal glucagon, a ready-to-use drug-device combination for treatment of severe hypoglycaemia, contains 3 mg glucagon dry powder that is absorbed passively through the nasal mucosa. We examined the efficacy and safety of nasal glucagon compared to 1 mg intramuscular injectable glucagon in reversing insulin-induced hypoglycaemia in a global population of adults with type 1 diabetes (T1D) or type 2 diabetes (T2D). Notably, this is the first analysis including pooled T2D data.
Materials and methods: Post hoc analyses used data from 3 randomised, cross-over studies. Treatment success was defined as an increase in blood glucose to ≥70 mg/dL or an increase of ≥20 mg/dL from nadir blood glucose within 30 min of receiving glucagon. Blood glucose was measured every 5 minutes up to 30 minutes, every 10 minutes up to 60 minutes, and at varied extended time intervals thereafter. Reconstitution and preparation of injectable glucagon in the control group was not included in the time to treatment success. Tolerability was assessed using treatment-emergent adverse events and a symptom questionnaire.
Results: In the T1D+T2D pooled analysis, 99.5% (213/214) of nasal glucagon and 100% (214/214) of injectable glucagon administrations achieved treatment success in a mean (median) time of 13 (10) minutes and 11 (10) minutes, respectively. The times (mean [median]) for achieving treatment success for participants with T2D (N=41) were similar for nasal glucagon (12 [10] minutes) and injectable glucagon (11 [10] minutes). Nasal glucagon and injectable glucagon induced similar blood glucose changes (Figure). Nasal glucagon and injectable glucagon had similar incidences of nausea (20% nasal glucagon, 28% injectable glucagon) and vomiting (11% nasal glucagon, 11% injectable glucagon), with nasal glucagon having a higher rate of reported adverse events related to nasal administration [e.g., headache (13% nasal glucagon, 7% injectable glucagon), nasal discomfort (4% nasal glucagon, 1% injectable glucagon)]. Separate T1D and T2D analyses showed similar results as the pooled T1D+T2D analysis.
Conclusion: Nasal glucagon was efficacious and well-tolerated in reversing insulin-induced hypoglycaemia in adults with T1D or T2D.

Clinical Trial Registration Number: NCT03421379, NCT01994746, NCT03339453
Supported by: Eli Lilly and Company
Disclosure: E. Seaquist: Employment/Consultancy; My institution has received funds from the NIH, JDRF, Eli Lilly, Locemia to support research done in my lab. I have served as a consultant for Eli Lilly, Sanofi, Zucara, Locemia, MannKind. The work I. Grants; Eli Lilly and Locemia. Other; ERS has served as a consultant for Eli Lilly, Zucara, Sanofi, Locemia, MannKind Corporation and WebMD.
735
Ready-to-use dasiglucagon injection as a fast and effective treatment for severe hypoglycaemia
R. Aronson1, T. Pieber2, U. Hövelmann3, J. Willard4, L. Plum-Moerchel5, K.M. Knudsen6, R. Tehranchi6;
1LMC Healthcare, Toronto, Canada, 2Medical Univeristy of Graz, Graz, Austria, 3Profil, Neuss, Germany, 4ProSciento, Inc., Chula Vista, USA, 5Profil, Mainz, Germany, 6Zealand Pharma AS, Copenhagen, Denmark.
Background and aims: Severe hypoglycemia is a feared complication of insulin therapy and requires urgent assistance. Dasiglucagon is a peptide analog of human glucagon, stable in aqueous solution, in development for treatment of severe hypoglycemia via a ready-to-use auto-injector.
Materials and methods: In this pivotal Phase 3 trial, the clinical efficacy and safety of 0.6 mg dasiglucagon were compared to placebo and with reference to GlucaGen®. In total, 168 patients with T1D were randomized (2:1:1) and dosed following induced hypoglycemia. The primary endpoint was time to plasma glucose (PG) recovery, defined as first PG increase ≥20 mg/dL after treatment initiation.
Results: Data showed dasiglucagon 0.6mg rapidly increased PG. The median time to recovery was 10 min for dasiglucagon and 12 and 40 min for GlucaGen® and placebo, respectively. In the dasiglucagon arm, 65% of patients had recovered within 10 min vs 49% of patients receiving GlucaGen®. Similarly after 15 min, 99% of patients treated with dasiglucagon had recovered vs 95% of patients treated with GlucaGen®. Nausea and vomiting were reported with similar frequencies for dasiglucagon and GlucaGen® (nausea: 55% and 53%, vomiting: 23% and 19%, respectively). Injection site reactions 30 minutes post dose were reported in 2%, 7% and 5% of patients in the dasiglucagon, GlucaGen® and placebo groups, respectively.
Conclusion: In conclusion, dasiglucagon 0.6mg was demonstrated to be a fast and effective treatment for severe hypoglycemia. The stability of dasiglucagon in aqueous formulation enables further development of dasiglucagon as a treatment option in the entire spectrum of mild, moderate and severe hypoglycemia.
Clinical Trial Registration Number: NCT03378635
Disclosure: R. Aronson: Grants; Sanofi, Novo Nordisk, Janssen, AstraZeneca, Becton Dickinson Technologies, Boehringer Ingelheim, Eli Lilly, Zealand Pharma, Xeris, Medpace, Kowa, Insulet, Dexcom, Bausch Health, Tandem Diabetes, Bayer. Honorarium; Sanofi, Novo Nordisk, Janssen, AstraZeneca, Boehringer Ingelheim, Eli Lilly, Xeris. Other; Sanofi, Novo Nordisk, Janssen, AstraZeneca, Becton Dickinson Technologies, Boehringer Ingelheim, Eli Lilly, HTL Strefa, Gilead, Merck.
736
Nocturnal hypoglycaemia with insulin degludec and glargine U100 in patients with type 1 diabetes prone to severe nocturnal hypoglycaemia (HypoDEG): a CGM substudy
J. Brøsen1, R.M. Agesen1, A.C. Alibegovic2, H.U. Andersen3, H. Beck- Nielsen4, P. Gustenhoff5, T.K. Hansen6, C. Hedetoft7, T. Jensen8, C.B. Juhl9, S.S. Lerche10, K. Nørgaard3, H.-H. Parving11, L. Tarnow12, U. Pedersen- Bjergaard1;
1Dept. of Endocrinology, Nordsjællands Hospital, Hillerød, 2Novo Nordisk, Søborg, 3Steno Diabetes Center, Copenhagen, 4Dept. of Endocrinology, Odense University Hospital, 5Dept. of Endocrinology, Aalborg University Hospital, 6Health, University of Aarhus, 7Dept. of Internal Medicine, Køge Sygehus, 8Dept. of Endocrinology, Copenhagen University, Rigshospitalet, 9Dept. of Medicine, Sydvestjysk Sygehus, Esbjerg, 10Department of Diabetes and Hormonal Diseases, Lillebælt Hospital, Kolding, 11Dept. Endocrinology, Copenhagen University, Rigshospitalet, 12Endokrinologisk Forskningsenhed, Steno Diabetes Center, Holbæk, Denmark.
Background and aims: Nocturnal hypoglycaemia (NH) is a major source of concern to people with type 1 diabetes (T1D) and may result in suboptimal glycaemic control due to excessive avoidance behavior. Optimal basal insulin therapy may reduce NH. The long-acting insulin degludec (IDeg) is associated with lower risk of NH in T1D, but the effect has not been studied in people specifically prone to severe NH. We report frequencies of CGM-recorded nocturnal non-severe hypoglycaemia (symptomatic and asymptomatic) (NNSH) from the HypoDeg trial, which compared insulin degludec with insulin glargine U100 (IGlar) in people with T1D and previous severe NH.
Materials and methods: Eighty-nine people with T1D accepted participation in a substudy of 4 x 6 days of blinded CGM (Medtronic iPro) during a 2-year randomized cross-over study. Sixty- seven participants were included in analysis after fulfilling criteria of at least one CGM period in each study period and a satisfying diary of hypoglycaemic events. CGM traces were reviewed for hypoglycaemic events ≤3.9 mmol/L (level 1) and < 3.0 mmol/L (level 2) according to current international consensus. To compare rates of hypoglycaemia between groups, number of events was modeled through a Poisson log-linear model with fixed effects of treatment, treatment sequence and period (first or last CGM period in each treatment period).
Results: At level 1, a total of 128 NNSH events (E) were found with IDeg and 214 NNSH events with IGlar, respectively, at 23:00- 06:59 hours, i.e. a 36% (95% [CI]: 10%-54%; p=0.009) relative risk reduction (RRR) in treatment with IDeg (1.3 E/week) as compared to IGlar (2.0 E/week), i.e. an absolute rate reduction (ARR) of 0.85 E/week with IDeg. The RRR in NNSH was mainly due to a 32% (95% CI: 0-53%; p<0.044) RRR in asymptomatic NH with IDeg (0.9 E/week) as compared to IGlar (1.4 E/week), i.e. an ARR of 0.55 E/week with IDeg. Similar results were seen at 00:00-05:59 hours. At level 2, 60 NNSH were found with IDeg and 133 NNSH with IGlar, respectively, at 23:00-06:59 hours, i.e. a 53% (95% CI: 36%-65%; p<0.001) RRR in NNSH during treatment with IDeg (0.6 E/week) as compared to IGlar (1.3 E/week), i.e. an ARR of 0.75 E/week. The RRR was mainly due to a 52% (95% CI: 30-67%; p<0.001) RRR in asymptomatic NH with IDeg (0.4 E/person-week) as compared to IGlar (0.9 E/person-week), i.e. an ARR of 0.43 E/week. Similar results were seen at 00:00-05:59 hours.
Conclusion: People with T1D prone to severe NH have lower rates of CGM-recorded nocturnal, especially asymptomatic, hypoglycaemic events when treated with IDeg as compared to IGlar.
Clinical Trial Registration Number: NCT02192450
Supported by: Novo Nordisk unrestricted grant
Disclosure: J. Brøsen: None.
737
Dasiglucagon ameliorates postprandial hypoglycaemia after Roux-En-Y gastric bypass
C.K. Nielsen1, C.C. Øhrstrøm2, U.L. Kielgast2, D.L. Hansen3, A. Lund1, T. Vilsbøll1, F.K. Knop1;
1Center for Clinical Metabolic Research, Gentofte Hospital, Hellerup, 2Steno Diabetes Center Zealand, Zealand University Hospital, 4600 Køge, 3Steno Diabetes Center Copenhagen, 2820 Gentofte, Denmark.
Background and aims: Postprandial hypoglycaemia is a frequent and debilitating complication following Roux-en-Y gastric bypass (RYGB); and no effective treatments exist. In a proof-of-concept study, we investigated the effects of dasiglucagon, a novel, stable glucagon analogue, on postprandial hypoglycaemia after RYGB. The primary aim was to examine the effects of two doses of dasiglucagon on the postprandial nadir plasma glucose concentration (PG) and time spent in hypoglycaemia (<3.9 mmol/l) in RYGB-operated individuals with confirmed postprandial hypoglycaemia.
Materials and methods: Ten RYGB-operated individuals (two males, eight female; BMI 34.6 (21.8-39.0) kg/m2; age 46 (29-67) years; HbA1c 32 (29-42) mmol/mol; time since operation 9.3 (6-11.5) years; weight loss since operation 53.9 (25.1-92.0) kg)) with confirmed symptomatic postprandial hypoglycaemia (PG <3.5 mmol/l verified by a 6-day continuous glucose monitoring) completed a double-blinded, randomised, crossover study comprising three separate treatment days, each including a standardised liquid mixed meal test (25 kJ per kg body mass; 50% carbohydrates, 35% fat and 15% protein). A s.c. injection of either placebo, 80 or 200 μg dasiglucagon (D80μg and D200μg) was administered after the postprandial PG peak, approximately ten minutes before the projected time point where the PG returned to fasting levels using a subject-specific linear regression model. Blood sampling and assessment of hypoglycaemic symptoms (Edinburgh Hypoglycaemia Symptom Scale) were performed at fixed time intervals. Data were analysed using linear mixed models and Tuckey’s corrections model for multiple comparisons.
Results: Compared with placebo, treatment with both D80μg and D200μg significantly increased nadir PG (placebo: 3.0±0.2 mmol/l; D80μg: 3.9±0.3 mmol/l; D200μg: 4.5±0.2 mmol/l; p=0.002 and p=0.0002) and PG incremental AUC (iAUC70-240min) after drug administration (placebo: 752±19 min×mmol/l; D80μg: 917±22 min×mmol/l; D200μg: 992±28 min×mmol/l; p<0.0001 and p<0.0001) (Figure). Moreover, both doses reduced time spent in hypoglycaemia compared to placebo (<3.9 mmol/l) (placebo: 62.0±8 min; D80μg: 27.5±12 min; D200μg: 14.0±9 min; p=0.05 and p=0.003). With placebo administration, five participants experienced level 2 hypoglycaemia (<3.1 mmol/l), whereas none of the participants experienced this following administration of D200μg (time spent in level 2 hypoglycaemia (n=5): placebo: 31.0±5 min; D80μg: 7±5 min; D200μg: 0.0±0 min; p>0.05 and p=0.01). There were no significant changes in hypoglycaemic symptoms between the three study days.
Conclusion: Single dose administration of dasiglucagon effectively ameliorates postprandial hypoglycaemia representing a promising new therapeutic option for management of postprandial hypoglycaemia after RYGB.

Clinical Trial Registration Number: NCT03984370
Supported by: Zealand Pharma A/S
Disclosure: C.K. Nielsen: None.
738
Immunogenicity and other safety parameters following multiple SC doses of dasiglucagon
T. Pieber1, B. Ajala2, H. Alassad3, O. Steen4, D. Dahl5, J. White6, L. Ge-Zerbe7, K.M. Knudsen8, R. Tehranchi8;
1Medical Univeristy of Graz, Graz, Austria, 2Diabetes & Endocrinology, LMC Healthcare, Calgary, Canada, 3Diabetes & Endocrinology, LMC Healthcare, Barrie, Canada, 4Diabetes & Endocrinology, LMC Healthcare, Toronto, Canada, 5Diabeteszentrum Hamburg West, Hamburg, Germany, 6Internal Medicine, Bioclinica Research Family Medicine, Orlando, USA, 7Boise Thyroid-Endocrinology, Endocrinology, Meridian, USA, 8Zealand Pharma AS, Copenhagen, Denmark.
Background and aims: Parenteral administration of therapeutic peptides can be associated with generation of anti-drug antibodies (ADAs). The antibodies can be neutralising or non-neutralising, which is of importance for drug safety and efficacy for indications where the peptide is to be administered repeatedly. A special risk for analogues of human peptides is cross reactivity towards the endogenous peptide.
Materials and methods: In the ADA Phase 3 trial, the immunogenicity of dasiglucagon (0.6 mg) was tested. The reference product was GlucaGen® (1 mg). Patients were randomly assigned in a 1:1 ratio to receive 3 SC injections of either dasiglucagon or GlucaGen®, with 1 week between doses. Blood samples for ADA analysis were taken before each of the three doses and 35, 60 and 104 days after the first dose. In total 111 T1DM patients received at least one dose and 102 patients completed all three doses.
Results: The primary endpoint was the overall ADA incidence. No patient had any confirmed treatment-induced or treatment-boosted ADA response at any measuring time after dosing. Nausea and vomiting were the most commonly reported IMP-related AEs, reported with similar frequencies for dasiglucagon and GlucaGen® (nausea: 46% and 43%, vomiting: 21% and 15%, respectively). There were no injection site reactions after dasiglucagon administration, whereas eight injection site reactions in 6 patients were noted in the GlucaGen® group.
Conclusion: In conclusion, dasiglucagon had a low potential for generation of ADAs. The low potential for generation of ADA’s and low potential for injection site reactions are of particular importance for the chronic indications pursued with dasiglucagon.
Clinical Trial Registration Number: NCT03216226
Disclosure: T. Pieber: Employment/Consultancy; Adocia, Arecor, AstraZeneca, Eli Lilly, Novo Nordisk, Sanofi. Other; CSO CBmed – Center for Biomarker Research in Medicine.
PS 66 Mechanisms and clinical consequences of hypoglycaemia in diabetes
739
Moderate hypoglycaemia affects cognitive function in people with diabetes, irrespective of diabetes type, level of glucose control or hypoglycaemic awareness
C.E.M. Verhulst1, T.W. Fabricius2, G. Nefs3,4, R.P.C. Kessels3, C.J. Tack1, U. Pedersen-Bjergaard2,5, B.E. de Galan1,6;
1Internal Medicine, Radboudumc, Nijmegen, Netherlands, 2Endocrinology and Nephrology, Nordsjællands Hospital, Hillerød, Denmark, 3Medical Psychology, Radboudumc, Nijmegen, Netherlands, 4National treatment and research center for children, adolescents and young adults with type 1 diabet, Diabeter, Rotterdam, Netherlands, 5Clinical Medicine, Faculty of Health and Medical Sciences, University of Copenhagen, Copenhagen, Denmark, 6Internal Medicine, Maastricht University Medical Centre, Maastricht, Netherlands.
Background and aims: Hypoglycaemia is the most common adverse effect in people with type 1 or type 2 diabetes treated with insulin and creates an immediate threat for brain function. While it is evident that hypoglycaemia causes cognitive dysfunction, it is unclear how this is affected by factors like diabetes type, age, prior hypoglycaemic exposure or glycaemic control.
Materials and methods: Adults with (a) type 1 diabetes at various levels of glycaemic outcome and awareness of hypoglycaemia, (b) type 2 diabetes treated with insulin, and (c) non-diabetic individuals (matched on age, sex and BMI) were recruited to undergo a hyperinsulinaemic-hypoglycaemic glucose clamp (nadir 2.8 mmol/L). During normoglycaemia and hypoglycaemia, cognitive function was measured with the Paced Auditory Serial Addition Test (PASAT) with interstimulus intervals (ISI) of 2.8 and 2.0 seconds, respectively, and the Test of Attentional Performance (TAP; Alertness, Working memory). Paired t-test is used to compare between euglycaemia and hypoglycaemia. Results are shown as percentages or mean (±SE).
Results: An interim analysis was performed on the data of 26 participants with type 1 diabetes, 5 participants with type 2 diabetes and 15 controls (n=46 in total). For the total sample, with PASAT/ISI-2.8, the proportion of correct answers was 75±3% during normoglycaemia versus 65±3% during hypoglycaemia (p<0.001); with PASAT/ISI-2.0, the scores were 59±3% and 49±3%, respectively (p<0.001). The TAP subtest Alertness showed that reaction times increased from 294±12 ms during normoglycaemia to 327±13 ms during hypoglycaemia (p=0.002). On TAP working memory both mean omissions and errors increased from 2.8±0.5 and 2.5±0.4 to 3.4±0.4 (p=0.024) and 4.1±1.0 (p=0.040) during normoglycaemia and hypoglycaemia, respectively. Hypoglycaemia-induced cognitive declines were seen in all subgroups and were not modified by the level of hypoglycaemic awareness or glucose control.
Conclusion: Based on these pre-liminary data, moderate hypoglycaemia results in a decline in auditory information processing speed, reaction time, and working memory that appears consistent in people with diabetes irrespective of diabetes type or glycaemic parameters, and people without diabetes.
Clinical Trial Registration Number: NCT03976271
Supported by: the HYPO-RESOLVE project
Disclosure: C.E.M. Verhulst: Grants; the HYPO-RESOLVE project.
740
Attitudes to awareness of hypoglycaemia tip the balance between hypoglycaemia fear and hyperglycaemia avoidance in problematic hypoglycaemia in type 1 diabetes
R. Maclean1, P. Jacob1, S. Haywood1, P. Choudhary1, S. Heller2, E. Toschi3, D. Kariyawasam4, A. Brooks5, H. Rogers1, E.L. Smith6, L. Gonder-Frederick7, N. de Zoysa1, S.A. Amiel1;
1Diabetes Research Group, King's College London, London, UK, 2University of Sheffield, Sheffield, UK, 3Joslin Diabetes Centre, Boston, USA, 4Guy's and St Thomas' Hospital, London, UK, 5Royal Bournemouth Hospital, Bournemouth, UK, 6King's College Hospital, London, UK, 7Department of Psychiatry and Neurobehavioral Sciences, University of Virginia, Charlottesville, USA.
Background and aims: Problematic hypoglycaemia complicates insulin therapy in >25% of adults with type 1 diabetes (T1D). Previous work has identified relationships between cognitive barriers to hypoglycaemia avoidance and impaired awareness of hypoglycemia (IAH) with recurrent severe episodes (SH). We investigated the interactions between fear of hypoglycaemia, avoidance of hyperglycaemia and attitudes to awareness of hypoglycaemia in people with T1D with and without problematic hypoglycaemia.
Materials and methods: Adults with T1D (n = 148) in an outpatient setting completed the Hypoglycaemia Fear Survey II (HFS), Hyperglycaemia Avoidance Scale (HAS), Attitudes to Awareness of Hypoglycaemia (A2A) and 12 month SH recall forms. They were grouped by frequency of severe hypoglycaemia over the preceding 12 months with ≥2 episodes considered recurrent severe hypoglycaemia (RSH). Attitudes to awareness levels were cut at the median A2A score for the whole population into “low” and “high”.
Results: Demographics were (no-RSH vs. RSH): median age 52 vs. 57 yrs (NS), 52% male, diabetes duration 30 vs. 35 yrs (p = 0.03), Gold score 2 vs. 5 (p < 0.001), mean HbA1c 7.55 vs. 7.35% (NS), median annual SH rate 0 vs. 6 episodes / person (p < 0.001). Those with RSH compared to no-RSH had increased fear of hypoglycaemia scores (total HFS, p < 0.001); worry and behaviour subscales (HFS-W, p < 0.001; HFS-B, p = 0.004). Of note, within the RSH group, 18% reported low worry about hypoglycaemia despite high SH risk. In this low worry sub-group, 69% had a high A2A level vs. 45% of those with higher worry (p = 0.09). There were no between-group differences in hyperglycaemia avoidance (HAS) and attitudes to awareness (A2A). Within the RSH group, the sub-group who more strongly endorsed unhelpful attitudes (A2A) had lower concern about hypoglycaemia (total HFS, p = 0.008), including both worry (HFS-W, p = 0.03) and behaviour (HFS-B, p = 0.02) subscales. Those with higher A2A also reported higher hyperglycaemia avoidance behaviours (HAS-B, p = 0.02). Thus, those with a higher A2A score prioritised hyperglycaemia avoidance over hypoglycaemia avoidance and showed low hypoglycaemia concern despite high incidence of severe hypoglycaemia. Within the no-RSH group, however, there was no association between A2A level and either hypoglycaemia fear and avoidance (HFS) or hyperglycaemia avoidance (HAS) or any of their subscales.
Conclusion: People with problematic hypoglycaemia generally show appropriately heightened concern about hypoglycaemia. However, a subgroup with RSH show inappropriately low worry. In people with RSH, unhelpful cognitions about hypoglycaemia are associated with decreased concern and behaviours around hypoglycaemia and heightened avoidance of hyperglycaemia, a relationship not seen in those without RSH. Addressing cognitions towards hyper- and hypo- glycaemia may be beneficial in reducing severe hypoglycaemia experience in those at highest risk.
Clinical Trial Registration Number: NCT02940873
Supported by: JDRF
Disclosure: R. Maclean: None.
741
Predictors of severe hypoglycaemias in patients with type 1 diabetes: results from the disease management programmes in North Rhine-Westphalia, Germany
S. Groos, J. Kretschmann, C. Macare, A. Weber, B. Hagen;
Evaluation and Quality Assurance, Central Research Institute for Ambulatory Health Care in Germany, Cologne, Germany.
Background and aims: Events of severe hypoglycaemia (SHG) represent serious acute complications in the therapy of diabetes. In this study regional disparities in the prevalence of SHG are presented. Furthermore the association of SHG with patient related characteristics is analysed within a population of patients inscribed in disease management programmes (DMP) for type-1-diabetes.
Materials and methods: All analyses are based on documentations of a total of 43.815 adult patients with type-1-diabetes who participated in the DMPs in the German federal state of North Rhine-Westphalia in the year 2018 and who started their enrolment before 2017. Events of SHG are defined as needing external help and / or an intravenous glucose injection. Grouped by 53 counties and cities the prevalence of SHGs is presented on an aggregate level. Stratified by age, sex and HbA1c values in the previous year the prevalence of SHGs is analysed on an individual level. Predictors of SHGs are estimated by multivariate logistic regression analyses (odds ratios, OR, and 95-percent confidence intervals, CI95%, are given). Age, sex, previous HbA1c and previous events of SHG, body mass index, cardiovascular diseases, diabetic complications as well as specialisation of physician (general practitioner vs. diabetologists) are included in the model.
Results: In 2018 1,207 patients with type-1-diabetes (27.5 ‰) suffered from at least one event of SHG. The highest prevalence was shown for higher age (18 to 30 years: 22.0 ‰; older than 80 years: 41.7 ‰) and lower HbA1c levels in the previous year (HbA1c < 6.5 %: 28.5 ‰; HbA1c < 10 %: 25.3 ‰), respectively. Women showed a higher prevalence than men across almost all age groups (in total: 29.9 ‰ vs. 25.6 ‰). Regional prevalence ranged from 2.7 ‰ to 68.2 ‰ (plus one outlier value: 128.6 ‰). The regression model estimates events of previous SHG in 2017 being the most significant predictor of SHGs in 2018 (OR 11.12; CI 95% 9.53-12.97). Furthermore, the risk is slightly increased for patients suffering from diabetic complications (1.18; 1.03-1.35) or having a medium adult age (1.18; 1.01-1.39, 41 to 60 years vs. 18 to 40 years). On the contrary, the risk is reduced by being taken care of by a diabetologist (0.68; 0.58-0.80) or being male (0.84; 0.74-0.95).
Conclusion: Severe hypoglycaemias are rare events but show strong regional disparities on an aggregate level, even when ignoring one outlier region. The strong association found between previous and current events of severe hypoglycaemia confirms results which have been published earlier by other authors. The finding of a higher risk for severe hypoglycaemias in patients with diabetic complications and in those being cared of by general practitioners confirms the key role of a reliable cooperation between general practitioners and specialised physicians in the DMP regarding the therapy of type-1-diabetes.
Disclosure: S. Groos: None.
742
People with type 1 diabetes and impaired awareness of hypoglycaemia have a delayed reaction to perform a glucose scan during hypoglycaemia: a prospective observational study
M. Cigler, H. Ziko, H. Elsayed, D. Hochfellner, T. Pöttler, A. Müller, M.L. Eckstein, L. Knoll, H. Sourij, J.K. Mader, O. Moser;
Division of Endocrinology and Diabetology, Department of Internal Medicine, Medical University of Graz, Austria, Graz, Austria.
Background and aims: Considering that people with type 1 diabetes (T1D) and impaired awareness of hypoglycemia (IAH) have a delayed perception of hypoglycemia, the question arises if they perform scans later in case of hypoglycemia compared to those with normal hypoglycemia awareness (non-IAH). We assessed if the time until performing a scan after reaching hypoglycemia while using a flash glucose monitoring (Flash GM) system is different in people with T1D and IAH compared to people with T1D and non-IAH.
Materials and methods: 92 people with T1D (age of 42 ± 14 years, BMI 25.1 ± 4.0 kg/m2, HbA1c 57 ± 9 mmol/mol (7.3 ± 0.8%), 73 MDI/19 CSII) using a Flash GM system for 3 months were included. Flash GM data were downloaded and assessed for time until scan after reaching hypoglycemia level 1 (<70 mg/dL) and level 2 (<54 mg/dL) and compared for T1D with IAH versus non-IAH via unpaired t-test or Mann-Whitney-U test (p<0.05). IAH was routinely assessed by means of Gold, Clarke and Pedersen-Bjergaard Score.
Results: Significant differences were only found for the delay between reaching hypoglycemia and scan between IAH and non-IAH for both Gold Score (hypoglycemia level 1: IAH 78 min [51 - 105] vs. non-IAH 63 min [42 - 89], p=0.03; nighttime hypoglycemia level 2: IAH 140 min [107-227] vs. non-IAH 96 min [41-155], p=0.004) and Pedersen-Bjergaard Score (hypoglycemia level 1: IAH 76 min [52-97] vs. non-IAH 54 min [38-71], p=0.01; nighttime hypoglycemia level 1: IAH 132 min [79-209] vs. non-IAH 89 min [59-143], p=0.001; nighttime hypoglycemia level 2: IAH 134 min [66-212] vs. non-IAH 80 min [37-131], p=0.002).
Conclusion: These preliminary data suggest that the time until scan after reaching hypoglycemia may serve as an objective assessment tool for IAH in people with T1D.
Clinical Trial Registration Number: DRKS00013667
Disclosure: M. Cigler: None.
743
Development of a fear of hypoglycaemia screener: type 1 diabetes healthcare provider insight
B. Mitchell1, J. Bispham2, A. Hughes2, J. Liu2, M. Perez-Nieves1, J.-L. Poon1, L. Fan1, A. McAuliffe-Fogarty2;
1Eli Lilly and Company, Indianapolis, 2T1D Exchange, Boston, USA.
Background and aims: Fear of hypoglycaemia (FoH) contributes to poor behavioural and glycaemic outcomes. The American Diabetes Association (ADA) position statement on psychosocial care for people with diabetes recommends screening for FoH, with referral if positive. A clinically useful screener for FoH does not exist, hindering further actions by clinicians to address FoH in their patients.
Materials and methods: As part of a multi‑phase study to develop a validated screener for FoH, we conducted semi‑structured interviews with 10 healthcare providers (HCPs) (6 endocrinologists, 4 certified diabetes educators) who treat patients with type 1 diabetes (T1D). The objective was to understand current clinical methods of identifying, diagnosing, and/or assessing FoH, HCP perceptions of T1D patients’ fear of, and experience with, hypoglycaemia. Interviews were transcribed, de‑identified, and thematically analysed. Key themes were summarised for each interviewee and common themes across interviews were identified.
Results: All HCPs reported assessing patients for FoH through discussion. Most HCPs (7/10) did not use formal screeners for psychosocial issues. Instead, they evaluated patients with open‑ended questions about their feelings and experiences about low blood sugar. Some HCPs identified FoH behaviours based on continuous glucose monitor (CGM) and insulin pump usage data; however, this method was not applicable for patients not using these technologies. Most HCPs (9/10) were not familiar with Blood Glucose Awareness Training as a formal programme, which is recommended by the ADA to re‑establish awareness of hypoglycaemia and reduce FoH. Most HCPs made mental health referral decisions after observing anxiety, depression, or chronic poor management behaviours.
Conclusion: Results suggest that although clinicians are aware of FoH, due to the lack of a formal screening tool, most HCPs rely on subjective judgment to determine the need for further psychosocial care referral. Creation of a screener will provide a standardised tool to better implement the ADA position statement of psychosocial care on the management of FoH.
Supported by: Eli Lilly and Company
Disclosure: B. Mitchell: Employment/Consultancy; Eli Lilly and Company. Stock/Shareholding; Eli Lilly and Company.
744
Electrophysiological responses to hypoglycaemia in people with type 1 diabetes and impaired awareness of hypoglycaemia
P. Novodvorsky1,2, A. Bernjak1,3, A. Smith1, E. Downs1, M.F. Arshad1,2, A.I. Oprescu1,2, R.M. Jacques4, J. Lee2,5, I. Ahmed1,2, S.R. Heller1,2;
1Department of Oncology & Metabolism, University of Sheffield, Sheffield, 2Sheffield Teaching Hospitals NHS Foundation Trust, Sheffield, 3INSIGNEO Institute for in silico Medicine, University of Sheffield, Sheffield, 4School of Health and Related Research, University of Sheffield, Sheffield, 5Department of Infection, Immunity and Cardiovascular Disease, University of Sheffield, Sheffield, UK.
Background and aims: Hypoglycaemia leads to abnormal cardiac repolarization and is proarrhythmogenic, related in part to sympathoadrenal activation. Circumstantial evidence links ‘dead-in-bed’ syndrome to hypoglycaemia induced disturbances of cardiac rhythm at night but factors which affect risk remain obscure. We hypothesised that those with impaired hypoglycaemic awareness (IAH) may be protected since they exhibit impaired sympathoadrenal responses during hypoglycaemia. We therefore examined electrophysiological responses, heart rate variability (HRV) and arrhythmic risk during hypoglycaemia in adults with type 1 diabetes (T1D) and IAH to explore their risk of developing hypoglycaemia induced cardiac arrhythmias and ‘dead-in-bed’ syndrome.
Materials and methods: Individuals with T1D (age ≤55 years, duration of diabetes ≥4 years) and IAH (Gold score ≥4) underwent 96 hours of simultaneous ambulatory ECG and blinded continuous interstitial glucose (IG) monitoring. Parameters of HRV and cardiac repolarisation (QT interval duration corrected for heart rate (QTc), Tpeak-to-Tend interval duration (TpTend) and T wave area symmetry (Tsym)) were established during hypoglycaemia (IG ≤3.5 mmol/l, duration ≥20 min) and compared to time and person matched euglycaemia (IG 5-10 mmol/l) separately for day and night (23.00-7.00). Individual risk of cardiac arrhythmias was determined. Participants were asked to record symptomatic hypoglycaemia in a diary.
Results: Fourteen participants (10 female), mean (range) age 39 (26-55) years and mean (SD) duration of T1D 24 (9) years were examined. In total, 8 individuals experienced 35 hypoglycaemic episodes (13 at night), of which 27 (77%) were asymptomatic. Fourteen daytime and 12 nocturnal hypoglycaemic episodes with matching euglycaemia were examined for electrophysiological responses and HRV. During daytime hypoglycaemia vs euglycaemia, mean (SD) QTc was prolonged (443 (38) vs 422 (27) ms, p = 0.027), TpTend was prolonged (93 (18) vs 76 (9) ms, p = 0.001) and Tsym decreased (1.19 (0.38) vs 1.39 (0.24), p = 0.014). No changes in these parameters were observed during nocturnal hypoglycaemia, however. High frequency (HF) power of HRV decreased during daytime hypoglycaemia vs euglycaemia (1.66 (0.40) vs 1.92 (0.52), p = 0.037). Cardiac arrhythmias were few and without clinical relevance.
Conclusion: We observed significant diurnal, inter and intraindividual variability in electrophysiological responses to hypoglycaemia in a group of people with T1D and IAH. We demonstrate that in those with IAH and a diminished sympathoadrenal response, hypoglycaemia can still lead to proarrhythmogenic changes albeit during the day. This might be related to vagal withdrawal causing a relative increase in sympathetic tone. Future studies will require larger number of participants with IAH and measurement of additional factors that may influence cardiac repolarisation. These include baseline autonomic dysfunction, serum potassium during hypoglycaemia and genetic factors.
Supported by: NIHR, Univ. of Sheffield, NIHR Sheffield CRF and Dexcom Inc.
Disclosure: P. Novodvorsky: None.
745
How frequent experience people with type 1 diabetes worries about hypoglycaemia and hyperglycaemia and how are these worries associated with the course of glucose?
N. Hermanns1,2, A. Schmitt1, D. Ehrmann1,2, T. Haak1, B. Kulzer1,2;
1Reserach Institute of the Diabetes Mergentheim Academy (FIDAM), Mergentheim Diabetes Centre, Bad Mergentheim, 2Department of Clinical Psychology and Psychotherapy, Otto-Friedrich University Bamberg, Bamberg, Germany.
Background and aims: Worries about hypoglycaemia or about high glucose levels are among the most common stressors in people with type 1 diabetes. By using Ecological Momentary Assessment (EMA), we examined how often worries about hypoglycaemia and hyperglycaemia occurred in people with type 1 diabetes and how these worries were associated with glycaemic control.
Materials and methods: The study was conducted in an outpatient setting. People with type 1 diabetes used a smartphone app (Fa, Ilumivu, North Carolina, USA) to assess their worries about hypoglycaemia and hyperglycaemia on 14 consecutive evenings on a visual analogue scale ranging from 0 (minimum) to 10 (maximum worries). They also used Flash-based sensor glucose monitoring for the respective time.
Results: 166 people with type 1 diabetes (age 38 ± 12.8 yrs.; Diabetes duration 18.4 ± 11.5 yrs., 60% female, HbA1c 9.2 ± 5.7%, 76.6 ± 62.7 mmol/mol) participated in this study. The EMA included a total of 2207 outpatient surveys on an average of 13.3 days per participant. The mean worry rating was 2.1 ±2.6 for hypoglycaemica- and 4.3 ± 3.2 for hyperglycaemia-related worries. Elevated worries (score ≥5) regarding hypoglycaemia were present on 2.4 out of 13.3 days (18.0%) while elevated hyperglycaemia worries were present on 6.1 out of 13.3 days (45.8%). In hierarchical multi-level regression models, worries about hypoglycaemia were significantly positively associated with percentage of hypoglycaemic glucose values and coefficient of variation as a measure of glucose variability (all p values < 0.001. Worries about hyperglycaemia were significantly positively associated with mean glucose, percentage of hyperglycaemic glucose values and negatively associated with time in range and hypoglycaemic glucose values (all p values < 0.001). The figure depicts how the worry ratings will change per 10% increase or increase per 100 mg/dl in the respective glycaemic outcomes.
Conclusion: Worries about hyperglycaemia seem be more frequent and intense in patients’ everyday life of with type 1 diabetes. Hypo- and hyperglycaemia worries showed significant associations with glucose values out of the normoglycaemic range. This indicates a direct feedback loop between course of glucose and worries about hypoglycaemia and hyperglycaemia.

Supported by: German Center for Diabetes Research (DZD), München, Germany
Disclosure: N. Hermanns: Grants; Roche Diagnostics, AstraZeneca, Berlin Chemie. Lecture/other fees; Berlin Chemie, Abbott Diabetes Care.
746
Conversations and Reactions Around Severe Hypoglycaemia (CRASH): survey responses of people aged 65+ with type 1 diabetes and insulin-treated type 2 diabetes and caregivers
F. Snoek1, E. Spaepen2, D.M. Bushnell3, C.J. Child2, Z. Balantac3, B.D. Mitchell2, M. Peyrot4;
1Amsterdam University Medical Centers, Amsterdam, Netherlands, 2Eli Lilly and Company, Indianapolis, USA, 3Evidera, Bethesda, USA, 4Loyola University, Baltimore, USA.
Background and aims: The CRASH online survey examined the experience and treatment of a severe hypoglycaemic event (SHE) in people with type 1 diabetes (T1DM) or insulin-treated type 2 diabetes (T2DM) or their caregivers (CGs).
Materials and methods: Eligible participants experienced ≥1 SHE in the last 3 years with insulin treatment at the time of event. Reported here are results from people with diabetes (PWD) aged ≥65 years and CGs of PWD ≥65 years old from Canada, Germany, Spain, UK, and USA.
Results: Because the majority of the responses were similar between T1D PWD (N=74) and CGs (N=95) and also between T2D PWD (N=104) and CGs (N=231), results were combined for PWD and CGs and are reported as ‘T1DM’ (PWD and CGs) and ‘T2DM’ (PWD and CGs), respectively. During the last SHE, reported glucagon use was low for T1DM (9.5%) and T2DM (7.5%); primary reason reported was no prescription available or filled (T1DM 24.3%, T2DM 29.3%). Of those who ever discussed SHE at their healthcare provider (HCP) visit (T1DM 138, T2DM 243), less than half (T1DM 41.3%, T2DM 34.2%) reported discussion of SHE at every HCP visit. No discussion of the most recent SHE occurred for 34.3% (T1DM) and 31.0% (T2DM). During the most recent SHE many felt unprepared (T1DM 35.5%, T2DM 47.2%), scared (T1DM 60.9%, T2DM 64.2%), and helpless (T1DM 39.1%, T2DM 51.3%). After the last SHE, changes were reported to insulin regimens, meal plans, carrying sugar/sweets, checking blood glucose more often or using continuous glucose monitors, and increasing access to glucagon.
Conclusion: Clinical guidelines recommending discussion of hypoglycaemia at each HCP visit for PWD at risk for SHE are not being met and should occur, and CGs should be included in preparedness strategies.

Supported by: Eli Lilly and Company
Disclosure: F. Snoek: Employment/Consultancy; Eli Lilly and Company, Novo Nordisk. Honorarium; Eli Lilly and Company, Novo Nordisk, Servier.
PS 67 Emerging topics in hypoglycaemia
747
Determining the minimum duration of CGM monitoring to accurately estimate time below range
N. Camerlingo1, M. Vettoretti1, A. Facchinetti1, J.K. Mader2, P. Choudhary3, G. Sparacino1, S. Del Favero1;
1Department of Information Engineering, University of Padova, Padova, Italy, 2Division of Endocrinology and Diabetology, Medical University of Graz, Graz, Austria, 3Department of Diabetes, School of life course sciences, King's College London, London, UK.
Background and aims: Time below range (TBR), i.e., the percent of time spent with sensor glucose <70 mg/dL, is a useful metric to evaluate exposure to hypoglycaemia. However, TBR varies week-to-week, and for how long should a patient be monitored to obtain a reliable estimate of TBR is still unclear. Similarly, a measure of the accuracy of TBR estimates computed from, say, N days of continuous glucose monitoring (CGM) data is lacking in the literature. Such a measure would be desirable in order to give proper credit to possible clinical conclusions originating from the analysis of glycemic control metrics.
Materials and methods: For a CGM system with 5 min sampling rate, we proved that the formula reported in the figure provides the uncertainty, i.e., a standard deviation, of a TBR estimate based on N days of monitoring. As an example, if after 14 days of CGM monitoring TBR equals 5%, then the formula allows us to complement such an estimate with its uncertainty: 5% ± 1.5% The formula was assessed on real-world data of 25 subjects with T1D, monitored for 5 months using a Dexcom G4 Platinum sensor. For each subject, we computed the TBR over the entire trial and used it as ground truth (TBRtrue). Then, in order to simulate a shorter data collection period, we extracted portions of N days of CGM monitoring, with N ranging from 1 to 30 days, and computed TBR for each of these portions (TBR(N)). The estimation error e(N) was computed as TBR(N)-TBRtrue. Finally, we compared the standard deviation of all estimation errors with the uncertainty predicted by our formula.
Results: Each boxplot represents the estimation error e(N) of the TBR computed over windows of N samples, for all the subjects. The solid curve represents the standard deviation, while the dashed curve represents the uncertainty obtained by using the proposed equation. Notably, the 2 curves overlap well, proving that the proposed formula is suitable for describing the uncertainty of TBR estimation.
Conclusion: We derived a formula to compute the uncertainty of TBR estimates based on the number of days of CGM monitoring and the characteristics of population under analysis. In the design of a new clinical trial, the proposed equation can also be used to obtain the minimal duration of CGM recordings, ensuring a pre-determined accuracy level in the estimation of TBR. Notably, the proposed formula can be extended to any kind of time-in-range indices and different population, e.g., adults with type 2 diabetes, gestational diabetes and children.

Disclosure: N. Camerlingo: None.
748
Headwind: design and evaluation of a vehicle hypoglycaemia warning system in diabetes: a proof of principle study
T. Zueger1,2, V. Lehmann1, M. Kraus2, S. Feuerriegel2, T. Kowatsch3, F. Wortmann4, M. Laimer1, E. Fleisch2, C. Stettler1;
1Department of Diabetes, Endocrinology, Nutritional Medicine and Metabolism, Inselspital, Bern University Hospital, University of Bern, Bern, 2Department of Management, Technology, and Economics, ETH Zurich, Zurich, 3Center for Digital Health Interventions, University of St.Gallen, St.Gallen, 4Bosch Internet of Things Lab, University of St.Gallen, St.Gallen, Switzerland.
Background and aims: Despite ongoing developments in the treatment of diabetes, hypoglycaemia remains one of the most relevant acute complications associated with this disease. Hypoglycaemia has consistently been shown to be associated with an increased risk of driving mishaps and is, therefore, regarded as one of the relevant factors in traffic safety. Today’s cars continuously gather a broad spectrum of real-time information on various driving parameters. This may allow for an alternative approach to the problem of hypoglycaemia during driving. Based on alterations in driving variables expected to occur during hypoglycaemia, we aim at establishing algorithms capable of timely discriminating eu- and hypoglycemic driving patterns using artificial intelligence.
Materials and methods: In a proof of principle study we compared data regrading driving behavior of 5 individuals (3 non-diabetic and 2 with type 1 diabetes) tracking measurements in eu- and hypoglycemic condition while driving on a predefined route using a professional driving simulator (Carnetsoft BV). Over 60 driving parameters were assessed at a sampling rate of 30 Hz. Time series of car-based sensor data was then sliced into 5 minute windows and random forest machine learning classifier as well as deep neural networks were applied to build a system detecting hypoglycemia within 5 minute frames (figure 1).
Results: Car-based data provided 73'970 measurements in hypoglycemic condition (<3.9mmol/L) and 110'959 samples in euglycemic condition (4.0-10mmol/L). A simple linear logit model was used for reasons of interpretability, which confirmed statistical significance of key variables (e.g. “velocity” and “steering speed”) at the 1% level. 1-fold cross-validation on subject level (i.e. training the model on all subjects except for one, which is used for testing and repeat this until every subject has been in the testing set) using random forest from machine-learning and deep neural networks, applied because of the highly non-linear relationship resulted in a ROC-AUC in hypoglycemia prediction of 0.72 and 0.74, respectively.
Conclusion: Our preliminary evaluation applying machine learning models on driving simulator based data show between-subject predictability of hypogylcemia even in a small dataset. This confirms the effectiveness of artificial intelligence in hypoglycemia detection while driving and may represent a promising novel approach to increase traffic safety in patients suffering from diabetes.

Supported by: SNF CRII5_183569
Disclosure: T. Zueger: None.
749
Modifiable self-management practices impact morning hypo- and hyperglycaemia in type 1 diabetes
A.J. Ahola1,2, C. Forsblom1,2, V. Harjutsalo1,2, P.-H. Groop2,3;
1Folkhälsan Research Centre, Helsinki, 2Research Program for Clinical and Molecular Metabolism, Faculty of Medicine, University of Helsinki, Helsinki, 3Abdominal Centre, Nephrology, University of Helsinki and Helsinki University Central Hospital, Helsinki, Finland.
Background and aims: Night is a challenging time for diabetes management. While sleeping one cannot check and adjust the blood glucose levels. Subsequent hypoglycaemia can result in adverse acute events, while nocturnal hyperglycaemia contributes to the overall poor metabolic control. Given the consequences it is important to identify potential modifiable risk factors for nocturnal hypo- and hyperglycaemia. In this study, we investigated the association between a number of risk factors and the morning blood glucose concentrations in adult individuals with type 1 diabetes in the Finnish Diabetic Nephropathy Study.
Materials and methods: At the study visit, participants were thoroughly investigated. HbA1c was measured. Individuals with estimated glomerular filtration rate ≥60 ml/min/1.73m2 were included. From a 3-day exercise, food, insulin and blood glucose record, we selected the first two days and studied the association between self-management on the first day (dependent variables) and the fasting morning (5:00-9:59 AM) blood glucose concentrations on the second day. If the nocturnal (0:00-4:59 AM) blood glucose concentration with accompanying corrective measures (energy intake or bolus insulin) was reported, it was included instead. Generalized linear regression was used to study the association between self-management and the morning blood glucose concentrations as a continuous variable. Multinomial logistic regression analysis was applied to study whether self-management was associated with the risk of morning hypo- (<3.9 mmol/l) or hyperglycaemia (≥8.9 mmol/l). Models simultaneously included all risk factors and were further adjusted for sex, age, and age at diabetes onset.
Results: Data were available from 1019 individuals (39% men, median age 45 years). In all, 14.0% reported nocturnal or morning hypoglycaemia, 51.6% morning normoglycaemia, and 34.3% morning hyperglycaemia. No nocturnal hyperglycaemia was reported. HbA1c was positively associated [B=0.05 (95% CI 0.03 - 0.07), p<0.001], while fibre intake (as g/MJ) [-0.43 (-0.66 - -0.19), p<0.001] and physical activity [-0.01 (-0.01 - -0.01), p=0.016] were negatively associated with the morning blood glucose concentration. Hypoglycaemia [1.87 (1.23 - 2.86), p=0.004] and higher alcohol intake [in E%, 1.07 (1.02 - 1.12), p=0.005] during the previous day were associated with increased odds of morning hypoglycaemia. Higher levels of physical activity [0.99 (0.99 - 0.99), p=0.039] and fibre intake [0.82 (0.71 - 0.95), p=0.008] on the previous day were associated with lower odds of morning hyperglycaemia, while HbA1c was associated with higher odds of morning hyperglycaemia [1.03 (1.02 - 1.04), p<0.001]. Neither insulin pump use nor insulin dosing (IU/kg) exhibited any association with glycaemia.
Conclusion: Modifiable self-management practices, such as dietary intake and physical activity, impact nocturnal glycaemia. In particular, avoiding alcohol intake may help to avoid morning hypoglycaemia, while high fibre intake and physical activity reduce the risk of morning hyperglycaemia. In addition, good glycaemic control, that is the avoidance of hypoglycaemia and keeping HbA1c in control, may help maintaining normal blood glucose levels also at night-time.
Supported by: Academy of Finland; NNF; Gyllenberg foundation; Folkhälsan Research Foundation; Stockmann Foundation
Disclosure: A.J. Ahola: Employment/Consultancy; Professor Per-Henrik Groop is an advisory board member for AbbVie, Astellas, AstraZeneca, Boehringer Ingelheim, Eli Lilly, Janssen, Medscape, MSD, Mundipharma, Novartis, Novo Nordisk, and Sanofi. Grants; Academy of Finland (grant number 316664), Novo Nordisk Foundation (#NNF OC0013659), Signe and Ane Gyllenberg Foundation, Folkhälsan Research Foundation, Helsinki University Hospital Research Funds (TYH2018207), Wilhelm and Else Stockmann Foundation, Liv och Hälsa Society, Päivikki and Sakari Sohlberg Foundation, Professor Per-Henrik Groop has received grants from Eli Lilly and Roche. Lecture/other fees; Professor Per-Henrik Groop has received lecture honoraria from Astellas, AstraZeneca, Boehringer Ingelheim, Eli Lilly, Elo Water, Genzyme, Medscape, MSD, Mundipharma, Novartis, Novo Nordisk, PeerVoic.
750
Real-world estimates of severe hypoglycaemia and associated healthcare utilisation in the US: baseline results of the iNPHORM study
A. Ratzki-Leewing, S. Harris, G. Zou, B. Ryan;
Western University, London, Canada.
Background and aims: Severe hypoglycemia (SH) surveillance in the United States (US) has depended largely on data from electronic medical records or administrative claims from emergency department (ED) visits or hospitalizations. However, this approach is likely to underestimate the true magnitude of SH incidence, as it fails to account for events treated outside of the healthcare system by family members and friends. To clarify the proportion of uncaptured SH events and, thus, garner a more complete picture of SH in the real-world, our team leveraged self-reported incidence data collected as part of the iNPHORM study (2020): a 1-year, US-wide investigation of hypoglycemia burden—the largest study of its kind.
Materials and methods: A generalized cohort of Americans (≥18 years old) with type 1 diabetes mellitus (T1DM) or type 2 diabetes mellitus (T2DM) taking insulin and/or secretagogues was recruited into the iNPHORM study from a nationally representative online panel managed by Ipsos Interactive Services Ltd (Ipsos). Participant data will be collected monthly for 1 year using pre-piloted, self-administered, self-reported surveys disseminated online via the Ipsos platform. The current evaluation summarizes baseline data from the iNPHORM Wave 1 cohort. Respondents’ demographic/clinical profiles, annual self-reported retrospective incidence rates and proportions of total SH (composite of daytime and nocturnal events requiring third-party assistance) as well as SH-related healthcare utilization (HCU) have been descriptively analyzed herein.
Results: This analysis is based on a sample of 1250 baseline respondents (T1DM: 17.2%; female: 52.1%). People with T1DM were on average 42.6 (SD:13.8) years old with a median duration of diabetes of 24 (IQR: 20) years. Among respondents with T2DM (82.9%), the mean age was 52.3 (SD: 14.1) years with a median duration of diabetes of 10 (IQR: 13) years; 26.4% were on insulin and secretagogues, 36.2% were on insulin without secretagogues, and 37.5% were on secretagogues without insulin. The retrospective annual incidence proportion of SH across all respondents was 36.5% (T1DM: 51.4%; T2DM: 33.4%), while the incidence rate was 2.4 events per person-year (PPY) (T1DM: 3.5 events PPY; T2DM: 2.2 events PPY). Nearly half (47.0%) of all SH events was treated outside of the healthcare system (T1DM: 49.7%; T2DM: 46.0%). The use of remote emergency services (by a paramedic or other healthcare provider) was required in 12.0% of all SH cases (T1DM: 6.0%; T2DM: 14.1%), while 6.4% of cases (T1DM: 2.2%; T2DM: 7.9%) resulted in an ED visit. Hospital admission was required in only 3.8% of cases (T1DM: 2.0%; T2DM: 4.5%).
Conclusion: High frequencies of self-reported SH were identified. Most events were treated outside of the healthcare system. Importantly, only a minority of events necessitated the use of emergency services and less than 5% resulted in hospital admission. Thus, HCU-based SH surveillance, subject to extreme under-ascertainment and underreporting, possesses limited relevance in the real-world and may worse mask important issues of therapeutic safety. Self-reported incidence data can provide an efficient and comprehensive representation of SH in the US. Enhanced insight into the total burden of events, beyond the fraction necessitating HCU, is vital to informing epidemiological parameters as well as evidence-based decision-making and interventions targeted at forestalling the insidious effects of clinically unrecognized SH.
Clinical Trial Registration Number: NCT04219514
Supported by: Investigator-initiated grant from Sanofi
Disclosure: A. Ratzki-Leewing: Grants; Sanofi.
751
Impaired insulin secretion as an independent risk factor for unstable glycaemic variability including hypoglycaemia in patients with type 2 diabetes
A. Miya1, A. Nakamura1, T. Handa2, H. Nomoto1, H. Kameda1, K.Y. Cho1, S. Nagai2, H. Miyoshi3, T. Atsumi1;
1Department of Rheumatology, Endocrinology and Nephrology, Hokkaido University, Sapporo, 2Division of Diabetes and Endocrinology, Sapporo Medical Center NTT EC, Sapporo, 3Division of Diabetes and Obesity, Hokkaido University, Sapporo, Japan.
Background and aims: Maintenance of good glycaemic control with lower glucose variability (GV) prevents the onset and progression of diabetes-related microvascular and macrovascular complications. Although an international consensus recommends a coefficient of variation (CV) with cut-off of 36% as the continuous glucose monitoring (CGM)-based metric of stable GV in type 2 diabetes (T2DM), it remains possible that the CV thresholds in Japanese outpatients with T2DM differ from international consensus. This study aimed to identify the CV threshold for unstable GV and hypoglycaemia, and to characterise a patient population with unstable GV and hypoglycaemia among Japanese outpatients with T2DM.
Materials and methods: This was an observational study with a cross-sectional design. We prospectively identified 284 (123 female) Japanese outpatients with T2DM who consented to undergo ambulatory CGM for 14 consecutive days between April 2018 and September 2019. Patients provided CGM data and fasting blood samples as well as clinical information. The C-peptide index (CPI), calculated by the formula 100 × fasting serum C-peptide/plasma glucose, was used to represent endogenous insulin secretion. The CV threshold between stable and unstable GV was defined as the upper limit of the CV distribution in the group with patients treated without insulin secretagogues including insulin and/or sulfonylurea or glinides (NIS subgroup, n=104). The optimal CV range corresponding to time below target range (TBR) ≥4% was determined for all patients (n=284) using a receiver-operating characteristic (ROC) curve analysis. Various characteristics of patients with unstable GV and hypoglycaemia were then extracted by multivariate logistic regression analysis. All tests were two-sided, and values of P < 0.05 were considered to represent statistical significance.
Results: The overall mean age was 66.6 ± 12.1 years, and the mean BMI 25.5 ± 4.9 kg/m2. The upper limit of the CV distribution in NIS subgroup was determined to be 40. ROC curve analysis for all patients showed that CV had the best performance for area under the curves (AUCs) of GV markers including CV, standard deviation, mean amplitude of glycaemic excursions, and HbA1c (AUC: 0.84, 0.60, 0.60, and 0.64, respectively), and that the optimal CV range corresponding to TBR ≥4% was defined as CV ≥40, which was consistent with the upper limit of the CV distribution. Significant risk factors for CV ≥40 included BMI, insulin use, eGFR, and CPI. Multivariate logistic regression analysis showed that CPI was an independent risk factor for CV ≥40 (OR: 0.17; 95% CI: 0.05-0.59; P < 0.01). The optimal cut-off point for CPI to predict a CV cut-off value of 40 was 0.81 (AUC: 0.80).
Conclusion: A CV of 40 discriminates between stable and unstable GV including hypoglycaemia in Japanese outpatients with T2DM. CPI would help to identify patients at higher risk of hypoglycaemia even without CGM. Impaired insulin secretion, a characteristic of Japanese patients with T2DM, may affect unstable GV including hypoglycaemia.
Clinical Trial Registration Number: UMIN 000029993
Disclosure: A. Miya: None.
752
Predictive low glucose suspend (PLGS) necessitates less carbohydrate supplementation to rescue hypoglycaemia: need to revisit current hypoglycaemia treatment guidelines
R. Jones1, A. Bartee1, M. Katz1, A. LaLonde1, E. Dassau2,3, H. Wolpert1, J.E. Pinsker2;
1Eli Lilly and Company, Indianapolis, 2Sansum Diabetes Research Institute, Santa Barbara, 3Harvard University, Cambridge, USA.
Background and aims: Predictive low glucose suspend (PLGS) systems have been demonstrated to limit hypoglycaemia. Reduced insulin during suspensions may avoid the need for rescue carbohydrates (CHO) or lessen the amount of CHO needed.
Materials and methods: The approximately 20-hour inpatient evaluation of the investigational automated insulin delivery system’s PLGS feature, including an overnight basal up-titration period to activate the PLGS and investigator-directed administration of rescue CHO, allowed assessment of hypoglycaemia prevention and treatment requirements.
Results: Ten subjects with type 1 diabetes (40% male, mean age 39.0±13.0 years, A1C 7.2±0.6%, and insulin usage 0.6±0.2 U/kg/day) were studied. There were 59 suspensions, with all subjects experiencing suspensions during which CHO were not administered. No rescue CHO were given during or after insulin suspension for the overnight basal up-titration. Only 6 of the 59 suspensions were associated with rescue CHO, and 5 suspensions were associated with hypoglycaemia (sensor glucose <3.9 mmol/L for ≥15 minutes, see Table). Rescue CHO consisted of median 9g CHO (range: 5-16g). No episode required repeat CHO administration.
Conclusion: New hypoglycaemia treatment guidelines for PLGS users should reflect that PLGS reduces CHO requirements for hypoglycaemia rescue. This guidance will be important to minimise rebound hyperglycaemia and needless calorie intake from hypoglycaemia over-treatment.

Disclosure: R. Jones: Employment/Consultancy; Eli Lilly and Company. Stock/Shareholding; Eli Lilly and Company.
753
Glycaemic control and hypoglycaemia in high-risk subgroups of people with type 1 diabetes in the SAGE study
J. Karalliedde1, M. Haluzik2, E. Renard3, G. Bigot4, J. Westerbacka5, J. Seufert6;
1Department of Diabetes and Endocrinology, Guy's and St Thomas' NHS Trust, London, UK, 2Institute for Clinical and Experimental Medicine, Prague, Czech Republic, 3University of Montpellier, Montpellier, France, 4IVIDATA Life Sciences, Levallois-Perret, France, 5Sanofi, Paris, France, 6University Hospital of Freiburg, Medical Faculty, Freiburg, Germany.
Background and aims: In the multinational, cross-sectional Study of Adults’ GlycEmia in T1D (SAGE), glycaemic control was poor in adults with T1D. Older age, a history of severe hypoglycaemia, and renal impairment are risk factors for hypoglycaemia and its consequences; characteristics and outcomes of these high-risk subgroups were analysed.
Materials and methods: In SAGE, data were analysed from medical records and interviews of eligible participants ≥26 years of age with T1D for ≥1 year (N=3858). The primary endpoint was the proportion of people who achieved HbA1c <7 % (<53 mmol/mol) in the predefined age groups 26-44, 45-64 and ≥65 years. Individualised HbA1c target achievement and incidence of hypoglycaemia or severe hyperglycaemia leading to diabetic ketoacidosis (DKA) were also recorded. Glycaemic and hypoglycaemic outcomes in three high-risk subgroups - ≥65 years of age, severe hypoglycaemia in the previous 6 months or renal impairment (eGFR <60 ml/min/1.73 m2) - are reported.
Results: Despite identical mean HbA1c, older people with T1D were less likely to achieve HbA1c <7 % than people aged 26-44 years, but were most likely to achieve individualised glycaemic targets (Table). Incidence of hypoglycaemia (blood glucose [BG] ≤3.9 mmol/l) and severe hypoglycaemia was similar across age groups, but older people had less severe hyperglycaemia leading to DKA. Across all age groups, people who had experienced severe hypoglycaemia did not have notably different glycaemic outcomes than the overall population; however, they were more likely to have been diagnosed for ≥10 years and to have experienced hypoglycaemia and hyperglycaemia leading to DKA. Almost all participants with renal impairment had been diagnosed for ≥10 years. Across all age groups, notably fewer participants with renal impairment achieved HbA1c target <7 % with fewer younger people aged 26-44 years achieving individualised HbA1c targets, and their mean HbA1c was higher compared with the overall population. While incidence of hypoglycaemia (BG ≤3.9 mmol/l) was higher than the overall population in those with renal impairment, the proportions of people with renal impairment who experienced severe hypoglycaemia or hyperglycaemia leading to DKA were slightly lower.
Conclusion: SAGE adds to the evidence that glycaemic control for people with T1D is suboptimal across all age groups analysed. People with a history of severe hypoglycaemia appear to have an increased likelihood of further hypoglycaemic events and hyperglycaemia leading to DKA, while those with renal impairment appear less likely to reach standardised glycaemic targets and more likely to experience hypoglycaemia (BG ≤3.9 mmol/l).

Supported by: Study was sponsored by Sanofi
Disclosure: J. Karalliedde: Employment/Consultancy; Eli Lilly, Novo Nordisk, Sanofi, Napp, AstraZeneca, Boehringer Ingelheim. Grants; Sanofi, AstraZeneca. Honorarium; Eli Lilly, Novo Nordisk, Sanofi, Napp, AstraZeneca, Boehringer Ingelheim.
754
An evaluation of the safety of pilots with insulin-treated diabetes in Europe flying commercial and non-commercial aircraft
G.L. Garden1, J.L. Hine1, S.J. Mitchell2, E.J. Hutchison2, T.P. Gaffney3, V. Hofmann4, B.M. Frier5, K.M. Shaw6, S.R. Heller7, G. Koehler4,8, G.A. Roberts3,9, D.L. Russell-Jones1,2;
1Metabolism and Ageing, University of Surrey, Guildford, UK, 2Civil Aviation Authority, Crawley, UK, 3Irish Aviation Authority, Dublin, Ireland, 4Austrocontrol, Vienna, Austria, 5The Queen’s Medical Research Institute, University of Edinburgh, Edinburgh, UK, 6University of Portsmouth, Portsmouth, UK, 7Department of Oncology and Metabolism, University of Sheffield, Sheffield, UK, 8Division of Endocrinology and Diabetology, Medical University Graz, Graz, Austria, 9HRB Clinical Research Facility Cork, CRF-C University College Cork, Cork, Ireland.
Background and aims: The risk of hypoglycaemia in people with insulin-treated diabetes has debarred them from certain “safety critical” occupations, including flying commercial aircraft. Three states in Europe, led by the UK, currently have the largest number of commercial pilots in the world flying with insulin treated diabetes following the introduction of a ground breaking protocol. Certificated pilots have strict oversight including duty period blood glucose monitoring, and frequent clinical reviews. The present report evaluates the performance and safety of this protocol.
Materials and methods: An observational study of pilots with insulin-treated diabetes granted medical certification to fly commercial and non-commercial aircraft. Clinical details, pre and in-flight (hourly and 30 minutes pre-landing) blood glucose values were correlated against the protocol-specified ranges: ‘Green’ (5-15mmol/L), ‘Amber’ (low 4-4.9mmol/L, high 15.1-20mmol/L), and ‘Red’ (low <4.0mmol/L, high >20.0mmol/L) ranges.
Results: A total of 49 pilots with type 1 (84%) or type 2 (16%) diabetes who had been issued with Class 1 (61%) or Class 2 (39%) certificates were studied. Most were male (96%) with a median age of 44 years (IQR 34-56) and median diabetes duration of 10.9 years (IQR 7.3-14.9) and mean follow-up duration post certificate issue of 4.3 years (SD 2.3). Mean pre-certification HbA1C was 55.0mmol/mol (7.2%) and post-certification 55.1mmol/mol (7.2%), p=0.97. Blood glucose values (n=38,621) were recorded during 22,078 flying hours. Overall, 97.69% of measurements were within the ‘Green’ range, 1.42% within the low ‘Amber’ range and 0.75% within the high ‘Amber’ range. Only 0.12% of readings were within the low ‘Red’ range and 0.02% within the high ‘Red’ range. Out of range readings declined from 5.7% in 2013 to 1.2% in 2019. No episodes of pilot incapacitation occurred and glycaemic control did not deteriorate.
Conclusion: The protocol is practical to implement and no events compromising safety were reported. The present study represents the most extensive data set for “safety critical” occupations for people with insulin-treated diabetes which may be relevant to estimate risk in other safety critical occupations.

Disclosure: G.L. Garden: None.
755
Associations between variability in glycated haemoglobin (HbA 1c ) and glycaemic control with severe hypoglycaemia in adults with type 2 diabetes
G. Khee1, H.M. Cheen1, Y. Tan1, P. Lim1, S.-Y. Goh2, M. Teh2, J. Thumboo3, Y. Bee2;
1Department of Pharmacy, Singapore General Hospital, Singapore, 2Department of Endocrinology, Singapore General Hospital, Singapore, 3Department of Rheumatology and Immunology, Singapore General Hospital, Singapore, Singapore.
Background and aims: Despite major advancements over the past decades, hypoglycaemia remains a key challenge in the management of diabetes. Severe hypoglycaemia (SH) remains a costly impediment to diabetes care in patients with type 2 diabetes (T2DM). Glycaemic variability, or fluctuations in blood glucose, has been implicated as a driver for hypoglycaemic events. However, it is less established how variability in HbA1c is related to SH. In this study, we aim to assess the associations between SH with (a) variability in HbA1c and (b) glycaemic control.
Materials and methods: We conducted a retrospective case control study of all adult T2DM patients seen at a Singapore academic medical centre from January 2009 to December 2017. Patients above 18 years old, and had ≥ 3 HbA1c measurements within a 2-year period were included. Patients who presented with an SH, defined in this study as a hypoglycaemic event leading to hospitalization, were propensity score matched to controls who did not in a 1:1 ratio using baseline demographics as the covariates. Variability in HbA1c was captured using the standard deviation (SD) of the mean HbA1c during the study period and presented in quartiles. Logistic regression analyses were used to determine the association between the incidence of SH and (a) variability in HbA1c and (b) glycaemic control.
Results: A total of 10,998 patients with ≥ 3 HbA1c measurements within a 2-year period were identified, with 1,197 patients experiencing an SH between 2009 and 2017. After propensity score matching, a total of 2,394 patients (1,197 cases, 1,197 controls) were included in the final analyses. Age, gender, ethnic distributions, Charlson Comorbidity Index, diabetes medications, number of HbA1c readings and duration between first and last HbA1c reading were comparable between groups except mean baseline HbA1c (Cases: 8.2 ± 1.6, Controls: 7.8 ± 1.6, p<0.001). After adjustment for the covariates, patients with greater variability in HbA1c were associated with an increased risk for SH (with SD < 0.5% as referent, SD 0.5% - <0.9%: OR 1.53 [95% CI 1.17-2.01]; p=0.002, SD 0.9% - <1.5%: OR 1.44 [95% CI 1.11-1.86]; p=0.006, SD ≥ 1.5%: OR 1.52 [95% CI 1.18-1.97]; p=0.001). Patients with higher mean HbA1c were also associated with an increased SH risk (with 6% - <7% as referent, <6%: OR 0.68 [95% CI 0.48-0.96]; p=0.028, 7% - <8%: OR 1.44 [95% CI 1.13-1.84]; p=0.004, 8% - <9%: OR 1.72 [95% CI 1.33-2.22]; p<0.001, ≥9%: OR 1.79 [95% CI 1.38-2.31]; p<0.001).
Conclusion: Patients with increased variability in HbA1c or poor glycaemic control were more likely to experience an SH episode. More targeted evaluation on hypoglycaemia is warranted especially in patients with high HbA1c variability. Our analyses also suggest that more emphasis should be placed on gradual improvement in HbA1c in patients with T2DM. Prospective studies on glycaemic variability and other glycaemic parameters are also needed to confirm these findings.
Supported by: This study was supported by the Singhealth Health Services Research Center
Disclosure: G. Khee: None.
756
Hypoglycaemia: making sense of chaotic coding in primary care computerised medical records
W. Hinton1,2, M.D. Feher1,2, N. Munro2, H. Kasetty3, B.C.T. Field2, S. de Lusignan1,4;
1Nuffield Department of Primary Care Health Sciences, University of Oxford, Oxford, 2Department of Clinical and Experimental Medicine, University of Surrey, Surrey, 3Novo Nordisk Ltd., Gatwick, 4Royal College of General Practitioners (RCGP) Research and Surveillance Centre (RSC), London, UK.
Background and aims: Hypoglycaemia is one of the most important side-effects of insulins, sulphonylureas and meglitinides, and has important clinical and economic consequences for people with diabetes and their families. The recording of hypoglycaemia in primary care uses a variety of diagnostic codes. The aims of the study were to evaluate the individual codes and frequencies of use for recording any hypoglycaemia in a national primary care database.
Materials and methods: The Royal College of General Practitioners (RCGP) Research and Surveillance Centre (RSC) is a nationally representative English primary care network, which comprises 349,863 people with diabetes ever registered as of 31st December 2018 from a population of over four million. We performed a retrospective data analysis of the database to determine the frequencies of each clinical code for hypoglycaemia. We also ranked their usage and evaluated the number of codes used for severe hypoglycaemia.
Results: From 40,185 individuals (11.5% of the diabetes cohort) with a hypoglycaemia record, we ascertained that there were 96,533 separate recordings of a hypoglycaemic episode. There were 87 different clinical codes available to record descriptively the cases of hypoglycaemia, however 41 codes available were not used. Three codes accounted for 77.4% of hypoglycaemia recordings (“Last hypoglycaemia attack” 39.7%; “Hypoglycaemia unspecified” 26.5%, “Frequency of hypoglycaemia attacks” 11.3%); while 43 separate codes were used to record 22.6% of hypoglycaemia events. Descriptors for “severe hypoglycaemia” were documented by 14 separate codes comprising 7.6% of hypoglycaemia recordings.
Conclusion: Recent guidelines have been published both to standardise the recording of hypoglycaemia in clinical trials and to describe fewer categories for types of hypoglycaemia. There is an urgent need for data science to provide consistent recording of hypoglycaemia in a clinical primary care setting.
Supported by: This study was sponsored by Novo Nordisk Ltd.
Disclosure: W. Hinton: Grants; Novo Nordisk Ltd.
PS 68 Investigating diabetes distress and depression
757
Can mood and energy levels be predicted by glucose levels? The combination of continuous glucose monitoring and ecological momentary assessment
L. Priesterroth1,2, D. Ehrmann1,3, A. Schmitt1, P. Rubertus1, N. Hermanns1,3, B. Kulzer1,3;
1FIDAM - Research Institute Diabetes Academy Mergentheim, Bad Mergentheim, 2Department of Health Psychology, Johannes Gutenberg University Mainz, Mainz, 3Department of Clinical Psychology and Psychotherapy, Otto-Friedrich University Bamberg, Bamberg, Germany.
Background and aims: It is hypothesised that glucose levels and mood are associated, especially when glucose values are constantly visible. However, little is known about the immediate effects of current glucose levels on psychological outcomes. In this study of people with type 1 diabetes, we analysed whether self-reported mood and energy levels can be predicted by preceding glucose levels.
Materials and methods: In the DIA-LINK study, 152 people with type 1 diabetes were equipped with CGM and participated in a smartphone-based survey over 18 days in which daily assessment took place in participants’ daily life (Ecological Momentary Assessment). Participants briefly rated their mood and energy levels up to 4 times a day on a scale from 0 (very poor) to 10 (very good). Glucose data of the 90 minutes time frame prior to each rating were extracted and the following glucose parameters were calculated for each period: mean glucose, time in normal range (70-180 mg/dl), time in hypoglycaemic ranges (<70, <55 mg/dl), time in hyperglycaemic ranges (>180, >250 mg/dl), and mean absolute difference (MAD) of consecutive glucose values (as a marker of short-term glucose fluctuation). Multi-level regression analyses were performed to analyse the effect of each glucose parameter on the subsequent mood and energy ratings. All analyses were controlled for the respective daily average of glucose parameters and autocorrelations; participant was a nesting factor.
Results: Better mood was significantly predicted by lower mean glucose values (p=.003), more time in normal range (p=.003) and less time in hyperglycaemic ranges (>180 mg/dl: p=.021; 250 mg/dl: p=.002). Time in hypoglycaemic ranges and MAD did not predict mood ratings. Higher subjective energy was significantly predicted by lower mean glucose values (p=.012), more time in normal range (p=.001), less time in hypoglycaemic ranges (<70 mg/dl: p=.001; <54 mg/dl: p=.023), and less time in severely hyperglycaemic range (>250 mg/dl: p=.001). Lower glucose fluctuations (MAD) were associated with higher energy ratings (p=.047).
Conclusion: In this study of people with type 1 diabetes, mood and energy ratings were significantly predicted by preceding glucose levels. Hyperglycaemic glucose values seem to be more relevant regarding mood, while hypoglycaemic values appear to be more relevant with regard to subjective energy. These findings have important implications for our understanding of the daily effects of blood glucose on well-being in type 1 diabetes.
Clinical Trial Registration Number: NCT03811132
Supported by: funded by the German Centre for Diabetes Research (DZD) [82DZD01102]
Disclosure: L. Priesterroth: Grants; funded by the German Centre for Diabetes Research (DZD) [82DZD01102].
758
Diabetes distress is associated with gastrointestinal symptoms in type 1 diabetes
L.Q. Huynh1, S. Ng1, D. Xie1, M. Hargreaves2, T. Arunachala Murthy1, T. Wu1, C.K. Rayner1,3, K.L. Jones1, M. Horowitz1,2, C.S. Marathe1,2;
1Adelaide Medical School, University of Adelaide, Adelaide, 2Endocrine and Metabolic Unit, Royal Adelaide Hospital, Adelaide, 3Department of Gastroenterology and Hepatology, Royal Adelaide Hospital, Adelaide, Australia.
Background and aims: Gastrointestinal (GI) symptoms are more common in people with diabetes than the general population and affect quality of life adversely. Diabetes distress (DD), the negative emotional impact of having diabetes, distinct from depression, refers to the unique, often covert, emotional burdens and worries that are part of the spectrum of the patient experience when managing a chronic disease. We evaluated the impact of GI symptoms on DD in people with type 1 diabetes.
Materials and methods: 64 unselected people with type 1 diabetes (32 female, 32 male; mean age: 42.4 ± 2.3 yr, duration of known diabetes 20.2 ± 2.1 yr, mean HbA1c (68.8 ± 3.3 mmol/mol [8.4 ± 2.1%]) who attended outpatient diabetes clinics at a large public teaching hospital completed validated questionnaires to assess GI symptoms (PAGI-SYM), diabetes distress (Diabetes Distress Scale (DDS17), and depression, anxiety and stress (DASS21). Results are shown as mean ± SEM.
Results: 80.6% of participants reported GI symptoms (86.7% of females, 75% of males). The PAGI-SYM score was 0.64 ± 0.12 and greater in females than males (1.05 ± 0.20 vs 0.26 ± 0.07, P<0.001). While there was no significant relationship between overall GI symptoms and glycaemic control (assessed by HbA1c), there were positive relationships between lower abdominal pain (R = 0.318, P = 0.045) and heartburn/regurgitation (R = 0.318, P = 0.045), and a trend for a relationship with nausea/vomiting (R = 0.276, P = 0.085) and HbA1c. There were no relationships between GI symptoms and the duration of diabetes, or age. There was a relationship between both diabetes distress (R = 0.578, P < 0.001), and psychological stress (depression: R = 0.549, P < 0.001; anxiety: R = 0.550, P < 0.001; stress: R = 0.471, P < 0.001) with GI symptoms. There were also relationships between diabetes distress and depression (R = 0.751, P < 0.001), anxiety (R = 0.561, P < 0.001) and stress (R = 0.765, P < 0.001). The relationship between diabetes distress and depression was stronger in females than males (R = 0.847 vs. R = 0.517; P=0.012) which was also the case between diabetes distress and stress (R = 0.846 vs. R = 0.473; P = 0.006).
Conclusion: Diabetes distress is strongly associated with the presence of gastrointestinal symptoms in type 1 diabetes.

Disclosure: L.Q. Huynh: None.
759
Diabetes distress and diabetes-specific burdens in everyday life with type 1 diabetes: a longitudinal study using EMA and CGM
A. Schmitt1,2, D. Ehrmann1,2, P. Rubertus1, B. Kulzer1,2, N. Hermanns1,2;
1Research Institute of the Diabetes Academy Mergentheim, Diabetes Center Mergentheim (DZM), Bad Mergentheim, 2German Center for Diabetes Research (DZD), München-Neuherberg, Germany.
Background and aims: Diabetes-specific problems and concerns can affect psychosocial well-being, cause diabetes distress and increase the risk of mental disorders. While diabetes-related problems are usually assessed using retrospective questionnaires, ecological momentary assessment (EMA) enables a less biased and more direct collection of people’s experiences. This study aimes to characterise the most relevant daily burdens in T1DM and to analyse their associations with glucose levels and affective outcomes.
Materials and methods: The DIA-LINK Study enrolled people with T1DM with varying levels of depression (CES-D ≥ / < 22) and diabetes distress (PAID ≥ / < 40) in a 2x2 design to represent common affective conditions and distinguish potential risk groups. Participants reported perceived burden due to specific problems each day over a period of 17 days using a smartphone app. Survey items were designed or adapted from the PAID questionnaire (e.g. How much have you⋯ been burdened by high glucose levels today? ⋯felt restricted by your diabetes⋯? ⋯worried about diabetes complications⋯? ⋯felt guilty due to getting off track with your diabetes management⋯? etc.) with responses given on a ten-point Likert scale (0-“not at all” to 10-“very much”). Glucose levels were collected using CGM throughout the EMA period. Depression was measured using the CES-D questionnaire at four-week follow up. Data from 166 participants (age 38.7 ± 12.8 years; 60.8% female; diabetes duration 18.7 ± 11.6 years; HbA1c 8.7 ± 2.0%; 57.2% using pump) were analysed.
Results: The highest mean burden scores were reported for the following diabetes-related problems (desc. seq.): high glucose values (4.3±1.9), glucose fluctuations (3.5±1.8), spent mental/physical energy (3.2±2.1), feeling restricted (3.0±2.0), feeling overwhelmed (2.4±2.0), low glucose values (2.1±1.3), sensor/pump alarms (2.1±1.5), feeling guilty (due to non-adherence) (2.1±2.1), worries regarding hypoglycaemia (1.9±1.6), feeling alone (1.8±2.0) and worries regarding complications (1.7±2.2). Of these aspects, feeling guilty (r=0.32), feeling overwhelmed (r=0.26) and feeling alone (r=0.17) were significantly associated with higher mean glucose levels; all p<0.05. Feeling guilty (r=0.32) and feeling overwhelmed (r=0.26) were also associated with higher glucose variability (SD of glucose values); all p<0.05. All surveyed diabetes problems were significantly associated with higher depression levels at four-week follow-up (p<0.05), and most associations remained significant when controlling for baseline depression scores.
Conclusion: The results of this study support that significant diabetes-specific burdens are common in everyday life with T1DM. High or fluctuating glucose levels as well as specific demands of the treatment (e.g. feeling restricted, lost energy) were perceived particularly burdensome. The associations with high or fluctuating glucose levels support an interdependency between emotional problems and glycaemic control. The associations with subsequent depression levels suggest that diabetes-specific problems may contribute to the development of mental disorders.
Clinical Trial Registration Number: NCT03811132
Supported by: This study was supported by the German Center for Diabetes Research (DZD) [82DZD01102].
Disclosure: A. Schmitt: None.
760
Low levels of soluble TWEAK and HDL-cholesterol and high levels of galectin-3 were independently associated with depression in type 1 diabetes
E.O. Melin, J. Dereke, M. Hillman;
Diabetes Research Laboratory, Lund University, Lund, Sweden.
Background and aims: Depression, low levels of soluble TNF-like weak inducer of apoptosis (sTWEAK) and HDL-cholesterol, and high levels of galectin-3 and HbA1c have previously been linked to cardiovascular disease in patients with type 1 diabetes mellitus. The main aim was to explore whether low levels of sTWEAK were associated with depression in patients with type 1 diabetes mellitus. We adjusted for age, sex, galectin-3, HbA1c, HDL-cholesterol, antidepressants, and cardiovascular complications.
Materials and methods: Cross-sectional design. Adult patients with type 1 diabetes mellitus (n=287, men 56%, age18-59 years, diabetes duration 1-55 years) were consecutively recruited from one specialist diabetes out-patient clinic. Self-reported depression was defined as Hospital Anxiety and Depression Scale-Depression sub scale ≥8 points. Blood samples were collected supplemented with data from electronic health records. ELISA was used to measure sTWEAK and galectin-3. Low sTWEAK was defined as <7.1 ng/ml (<70th percentile), high galectin-3 as ≥2.562 μg/l (≥85th percentile) and high HbA1c as >70 mmol/mol (>8.6%). Non-parametric tests and multiple logistic regression analysis (Backward: Wald) were performed.
Results: In 30 depressed patients compared to 257 non-depressed, the prevalence was higher for low sTWEAK (93% vs 67%) (p = 0.003); for high galectin-3 (33% vs 13%) (p = 0.006); for cardiovascular complications (13% vs 2%) (p = 0.013); for high HbA1c (47% vs 26%) (p = 0.029); and the median (quartile (q)1, q3) for HDL-cholesterol (mmol/l) was lower (1.3 (1.2, 1.5) vs 1.6 (1.3, 1.8)) (p = 0.012). Low sTWEAK (adjusted odds ratio (AOR) 9.5 (2.0-46), p = 0.005), high galectin-3 (AOR 6.5 (2.3-18.7), p <0.001), use of antidepressants (AOR 10.3 (3.3-30.4), p <0.001), HDL-cholesterol (per mmol/l) (inversely) (AOR 0.1 (0.03-0.5), p = 0.005), and age (per year) (AOR 1.05 (1.00-1.09), p = 0.038) were associated with depression, but not high HbA1c, sex or cardiovascular complications.
Conclusion: The depressed patients with type 1 diabetes mellitus had lower levels of sTWEAK and HDL-cholesterol and higher levels of galectin-3 which indicate on-going inflammatory and metabolic changes. These disturbances might all contribute to the increased risk for cardiovascular disease and mortality previously demonstrated in patients with depression.
Supported by: RaDF of Region Kronoberg, Växjö, FORSS, Linköping.
Disclosure: E.O. Melin: None.
761
The association of hyperglycaemia and insulin resistance with depressive symptoms over 4 years of follow-up: The Maastricht Study
A.F.J. Geraets1,2, S. Köhler1,2, R. Muzambi3, C.G. Schalkwijk1,2, A. Oenema1,2, S.J.P. Eussen1,2, P.C. Dagnelie1,2, C.D.A. Stehouwer1,2, N.C. Schaper1,2, R.M.A. Henry1,2, C.J.H. van der Kallen1,2, A. Wesselius1,2, A. Koster1,2, F.R.J. Verhey1,2, M.T. Schram1,2;
1Maastricht University Medical Center+, Maastricht, Netherlands, 2Maastricht University, Maastricht, Netherlands, 3Faculty of Epidemiology & Population Health, London School of Hygiene & Tropical Medicine, London, UK.
Background and aims: Depression is twice as common in individuals with type 2 diabetes mellitus (T2DM) as in the general population. However, it remains unclear whether hyperglycemia and insulin resistance (IR) are involved in the etiology of depression. Therefore, we investigated the association of continuous markers of hyperglycemia and IR with incident depressive symptoms over 4 years of follow-up.
Materials and methods: We used data from the population-based Maastricht Study (n=3,124; mean age 59.7±8.2 years, 49.1% women). We assessed hyperglycemia by fasting and 2h post-load OGTT glucose levels, HbA1c and Skin Autofluorescence (SAF, reflecting AGEs) and IR by the HOMA index (HOMA-IR) at baseline, and clinically relevant depressive symptoms by the 9-item Patient Health Questionnaire (PHQ-9≥10) at baseline and annually over 4 years. We used Cox regression analyses, and adjusted for demographic, cardiovascular, and lifestyle risk factors.
Results: Fasting plasma glucose, 2-hour post-load glucose, and HbA1c levels were associated with an increased risk for incident depressive symptoms after adjustment for age, sex, educational level, waist circumference, office systolic blood pressure, anti-hypertensive medication, total-to-HDL cholesterol ratio, lipid-modifying medication, eGFR, history of CVD, smoking behavior and alcohol use (HR 1.20(1.08;1.33); HR 1.25(1.08;1.44); and HR 1.22(1.09;1.37) per SD, respectively), while SAF and HOMA-IR were not (HR 0.99(0.86;1.13) and HR 0.93(0.81;1.08) per SD, respectively). Additional adjustment for physical activity and healthy diet did not materially change our results.
Conclusion: These findings show that hyperglycemia precedes the development of depression, and may thus be involved in the etiology of depression in T2DM. This may suggest that hyperglycemia is also a target for the prevention of depression.

Supported by: ERDF, MUMC+, UM
Disclosure: A.F.J. Geraets: None.
762
An expression quantitative trait loci (eQTL) analysis of multiple tissues reveals novel genes and molecular pathways underlying type 2 diabetes and depression
Z. Balkhiyarova1, J. Maina2, M. Kaakinen3, A. Nouwen4, I. Prokopenko3;
1Imperial College London, London, UK, 2University of Lille, Lille, France, 3University of Surrey, Guildford, UK, 4Middlesex University, London, UK.
Background and aims: Type 2 diabetes (T2D) and depression are two common multifactorial diseases that weigh heavy on global disease burden. Genome-wide association studies have successfully identified multiple independent genetic loci that harbour variants associated with major depression and diabetes separately, but the mechanisms that underlie the association between type 2 diabetes and depression are not fully understood. Here, we investigated the role of the gene expression information across multiple human tissues using eQTL analysis.
Materials and methods: Single phenotype genome wide association studies (GWAS) on T2D and depressive symptoms in the UK Biobank (n = 488,377) was performed using the BOLT software. We then employed multi-phenotype GWAS using the MTAG software to improve power for loci detection and multiple effects suggestion such as pleiotropy. To gain biological insight into the discoveries made by single and multiple phenotype GWAS we applied functional transcriptome-wide analysis based on hypothalamus, adrenal gland, liver, pancreas, intestine, skeletal muscle, adipose, brain tissues and whole blood from prediction models in the GTEx database. We employed the Metaxcan algorithm (PrediXcan’s extension for summary statistics) to perform the test.
Results: We detected up to 95 independent signals for diabetes and depressive symptoms. The most significant genes at p <10-5 for type 2 diabetes (EIF2S2P3, NOTCH2, JAZF1, RP11-395N3.2, IRS1, HHEX, NCR3LG1, ZDHHC6, WFS1) and 10 genes for depressive symptoms (including CDKAL1, SHISA4, RNF123, SLC39A13, EIF2S2P3) were biological processes and canonical pathways (e.g. cell transformation, immune system and glucose-insulin signalling pathways) that are important for the pathogenesis of type 2 diabetes and depression.
Conclusion: Using eQTL analyses on a large-scale multi-phenotype GWAS study of T2D and depressive symptoms, we identified tissue-specific genes associated with diabetes and depression. Our results help boost our understanding of the underlying mechanisms of these two complex disorders.
Disclosure: Z. Balkhiyarova: None.
763
Associations between depression, cognitive schemas and distress: a multi-cultural study
A. Nouwen1, A.S. Mocan2, D. Dumitras3, Z. Balkhiyarova4, P. Carriedo5, L. Indelicato6, E. Starostina7, K. van Dam1;
1Department of Psychology, Middlesex University, London, UK, 2Emergency Clinical County Hospital, Cluj-Napoca, Romania, 3University of Agricultural Sciences and Veterinary Medicine Cluj-Napoca, Cluj, Romania, 4Department of Medicine, Imperial College London, London, UK, 5Instituto Nacional de Psiquiatría, Mexico City, Mexico, 6Department of Medicine, University of Verona, Verona, Italy, 7Moscow Regional Clinical and Research Institute, Moscow, Russian Federation.
Background and aims: Due to adverse early experiences, people develop maladaptive cognitive schemas (MCS) about themselves, the world and the future. These schemas, when activated by stressful life events, can result in depression. Whether these MCS are associated with depression in diabetes remains unexplored. The aim was to examine MCS according to depressive status and to assess their association with depression when diabetes distress and general distress are controlled.
Materials and methods: 568 people with type1 and type 2 diabetes from 5 countries (Turkey, Romania, Italy, Russia, Mexico) participated in the study. Participants were categorized into a never depressed group (ND; N=204), currently depressed and positive PHQ9 algorithm group (CDAlg+; N=101), currently depressed but negative PHQ9 algorithm group (CDAlg-), or remitted depression group (RD; N=169), based on psychiatric diagnosis and PHQ9 algorithm (presence/absence of DSM-V criteria of major depression according to PHQ9). Participants completed the Patient Hospital Questionnaire (PHQ9), the Young Schema Questionnaire (YSQ) assessing maladaptive cognitive schema, the Perceived Stress Scale (PSS), the Problem Areas in Diabetes (PAID) scale.
Results: Kruskal-Wallis and Duncan’s tests showed that people in the CDAlg+, CDAlg-, and RD groups scored significantly higher on the ‘disconnection and rejection’ MCS (p’s<0.05) than people in the ND group. There were no significant differences between ND and RD on ‘impaired autonomy’ (p=0.22), ‘impaired limits’ (p=0.30), ‘other directness’ (p=0.32) or ‘over vigilance’ (p=0.43) schemas. Stepwise multinomial logistic regression was used to analyse the three groups in relation to the ND. Compared to the ND, ‘disconnection/rejection’ MCS (OR=2.67, 95%CI=1.84-3.86), PSS (OR=1.2, CI=1.14-1.27), PAID (OR=1.04, CI=1.02-1.06) and number of diabetes complications (OR=1.14, CI=15-1.73) were associated with depression in CDAlg+. Similar results were observed in CDAlg- where ‘disconnection/rejection’ (R=1.51, CI=1.04-2.17), PSS (OR=1.22, CI=1.06-1.18), PAID (OR=1.03, CI1.01-1.05) and diabetes complications (OR=1.30, CI=1.11-1.61) but also HbA1c (OR=1.17, CI=1.00-1.37) were linked to depression. For the RD only PAID (OR=1.03, CI=1.01-1.04) and BMI (OR=1.04, CI=1.01-1.07) were significant predictors of depression.
Conclusion: The ‘disconnection/rejection’ MCS was associated with current and remitted diagnosis of depression in people with diabetes. This suggests that perceptions of a lack of security and empathy from others, low emotional support, and worthlessness are stronger represented in these groups than in the never depressed group regardless of symptom intensity. Diabetes distress and diabetes complications independently contributed to the presence of depression highlighting the emotional impact of diabetes. The results show the importance of MCS in people with diabetes with current and previous comorbid depression along with diabetes and general distress.
Disclosure: A. Nouwen: None.
764
The relation of depression symptoms with body fat distribution and the risk of diabetes in women
L. Witek1, A. Krentowska1, M. Szpakowicz2, N. Waszkiewicz3, J. Jamiołkowski2, K. Kamiński2, I. Kowalska1;
1Department of Internal Medicine and Metabolic Diseases, Medical University of Bialystok, Bialystok, 2Department of Population Medicine and Civilization Diseases Prevention, Medical University of Bialystok, Bialystok, 3Department of Psychiatry, Medical University of Bialystok, Bialystok, Poland.
Background and aims: According to WHO data, 4.4% of global population suffered from depression in 2015. The frequency of depressive episodes depends on age (higher in the elderly) and sex (5.1% of women and 3.6% of men). The prevalence of depression is approximately two-fold higher in type 2 diabetes compared to the general population. Psychological, hormonal and immunological factors could influence the occurrence of mood disorders. Diabetes can increase the risk of depression, but mood disorders can also be a risk factor for developing diabetes. The aim of this study was to assess the relationship of the occurrence of depression symptoms in women with the distribution of body fat and the risk of diabetes.
Materials and methods: One hundred and ten women aged 18-65 years without history of diabetes were included in the study: 47 women with depression symptoms - the study group (≥12 points in the Beck scale) and 63 women in the control group (<12 points in the Beck scale). Both groups were recruited from the BIAŁYSTOK PLUS population study. In both groups, clinical examination, biochemical tests and oral glucose tolerance test (OGTT) were performed with glucose and insulin measurements in the blood. Fat mass and fat distribution were evaluated by DXA (dual-energy X-ray absorptiometry) scan. HOMA-IR and visceral adiposity index (VAI) were calculated.
Results: The study groups did not differ in age (48±12.1 years vs. 48±13.3 years, p=0.753) and BMI (26±5.4 kg/m2 vs. 26±5.5 kg/m2, p=0.730). The group of women with symptoms of depression presented higher visceral fat mass (985.8g vs. 679.55g, p=0.033), HOMA-IR value (3.57 vs. 2.56, p=0.018), triglyceride level in the blood (105.3 mg/dl vs. 90.51 mg/dl, p=0.029) and VAI (3.53 vs 3.2, p=0.029) in comparison to the control group. Moreover, disturbances of glucose metabolism diagnosed on the basis of OGTT were significantly more prevalent in the group with depressive symptoms in comparison to the control group (59.57% vs. 38.09%, p=0.025): 12.76% of women with depression symptoms presented IGT (Impaired Glucose Tolerance), 27.66% IFG (Impaired Fasting Glucose) and 19.15% IFG and IGT.
Conclusion: Depression symptoms in women are associated with an increased frequency of prediabetes.
Disclosure: L. Witek: None.
765
Associations of food addiction with metabolic control, medical complications and depression among patients with type 2 diabetes
J. Nicolau, I. Rodríguez, K. Dotres, M. Arteaga, A. Bonet, P. Sanchís, M. Tamayo, A. Soler, R. Fortuny, L. Masmiquel;
Hospital Universitario Son Llàtzer. Health Research Institute of the Balearic Islands (IdISBa), Palma de Mallorca, Spain.
Background and aims: The term Food Addiction (FA) has been used in combination with specific eating behaviors to describe an abnormal pattern of excessive consumption. It is conceptualized as a behavioral pattern that is similar in some ways to addictions to alcohol and other substances. The prevalence of food addiction ranges from 5-10% among individuals who are normal weight, compared with 24.9% among those who are overweight/obese. However, FA has not been well studied among patients with type 2 diabetes (T2DM). We wanted to assess the prevalence of individuals with criteria for FA in a sample of patients with T2DM and to analyze whether there was any relationship between FA and metabolic control, complications related to T2DM or the presence of clinically significant depressive symptoms.
Materials and methods: 300 patients with DM2 were recruited randomly. All participants were evaluated cross-sectionally for the presence and severity of FA by completing The Spanish version of the Yale Food Addiction Scale 2.0 questionnaire (YFAS 2.0). Sociodemographic, clinical and biochemical parameters were also recorded.
Results: According to YFAS 2.0 29.3% (88/300) of subjects screened positive for FA. Subjects with FA had a greater BMI compared with T2DM without FA (33.41±7.5 vs 31.6±5.9 kg/m2; p=0.04). HbA1c was significantly higher in the group of patients with FA (7.9 ± 4.4 vs 7.6 ± 1.4%, p = 0.008). Also, fasting plasma glucose was higher among subjects with FA (164.6±72.8 vs 140.5±38.2mg/dl; p=0.034). The proportion of subjects with diabetic retinopathy, neuropathy and nephropathy was greater among patients with criteria for FA compared with T2DM patients without this condition (25% vs 13.2%, 29.5% vs 21.8% and 32% vs 22.3%; p=0.03, p=0.05 and p=0.05 respectively). The presence of hypoglycemias was lower among subjects with FA (8% vs 19%; p=0.022). The proportion of patients who had a poor adherence to diet was also higher among patients with T2DM and FA (21.6% vs 56.4%; p<0.0001). The percentage of subjects with FA with significant depressive symptoms was also greater (36.4% vs 18.5%; p=0.002).
Conclusion: The prevalence of FA among subjects with T2DM was greater than in general population. The presence of FA implies a worse glycemic control, possibly due to the greater difficulty to adhere and / or maintain healthy dietary habits. Microvascular complications and depressive symptoms were higher among subjects with FA.
Disclosure: J. Nicolau: None.
PS 69 Aspects of quality of life and well being
766
Measurement invariance of the PHQ-9 between the general population and people with diabetes: results from a US and a French-Canadian population-based data set
S. Deschênes1, A. Nouwen2, N. Schmitz3, Z. Balkhiyarova4, J. Albertorio5;
1University College Dublin, Dublin, Ireland, 2Middlesex University, London, UK, 3McGill University, Montreal, Canada, 4Imperial College London, London, UK, 5Centers for Disease Control and Prevention, Washington, USA.
Background and aims: Originally developed for use in the US general population the Patient Health Questionnaire-9 (PHQ-9) has been used extensively to assess depressive symptoms in people with diabetes across the world, with people with diabetes showing higher scores. However, to date, no study has assessed whether the PHQ-9 is scale invariant, i.e. whether the PHQ-9 items measure the same underlying factor structure in these two groups. This is important as it would indicate that the meaning of the PHQ-9 items is similar for people with and without diabetes. We aimed to determine whether the PHQ-9 is measurement invariant (MI) between people with and without diabetes using a large US and a French-Canadian sample.
Materials and methods: Data from the US National Health and Nutrition Examination Surveys (NHANES; N=6065) and a subset of the CARTaGENE (N=3243) cohort study in Canada that took part in a follow-up interview on mental health were used to determine MI between people with (NHANES N=1903; CARTaGENE N=807) and without diabetes using multiple group confirmatory factor analyses (MGCFA). In NHANES participants completed the original US PHQ-9; in CARTaGENE participants completed the French-Canadian version. Increasingly stringent model constraints (i.e. assessing Configural, Metric, Strong and Strict measurement invariance (MI)) were applied to confirm comparability of PHQ-9 items for the US and French-Canadian samples.
Results: A 1-factor model with all PHQ-9 items reflecting a single underlying factor showed good model fit to the data for the original US and the French-Canadian version of the PHQ-9 for both diabetes (NHANES: RMSEA=0.052, CFI= 0.989; CARTaGENE: RMSEA=0.036, CFI=0.994) and non-diabetes groups (NHANES: RMSEA= 0.043, CFI=0.989; CARTaGENE: RMSEA=0.044, CFI=0.991). MI testing showed that in each subsequent step goodness-of-fit indices did not exceed 0.015 RMSEA, 0.01 CFI. Strict invariance models (equal loadings, thresholds, and residuals) showed good fit to the data (NHANES: RMSEA=0.052, CFI=0.981; CARTaGENE: RMSEA=0.056, CFI=0.979). A 2-factor model including the affective/cognitive items (Factor 1) and the somatic item (Factor 2) showed excellent fit to the data for the NHANES and CARTaGENE versions (NHANES: RMSEA=0.040, CFI=0.989; CARTaGENE: RMSEA=0.040, CFI=0.990).
Conclusion: The results provide support for both the underlying 1-factor and 2-factor structure of the PHQ-9. While the 2-factor solution has a slightly better fit, the 1 factor solution is more parsimonious. Thus, depending on the research or clinical needs, both factor structures can be used. The study also found that the PHQ-9 shows full measurement invariance for diabetes for both the 1-factor and 2-factor solutions, both in the original US version and the French-Canadian version. This indicates that differences in depression scores cannot be attributed to differences in interpretation
Disclosure: S. Deschênes: None.
767
Associations between mood and mood swings with parameters of glycaemic control in people with type 1 diabetes: longitudinal analysis of daily data
D. Ehrmann1,2, A. Schmitt1, P. Rubertus1, B. Kulzer1,2, N. Hermanns1,2;
1FIDAM - Research Institute Diabetes Academy Mergentheim, Bad Mergentheim, 2Department of Clinical Psychology and Psychotherapy, Otto-Friedrich University Bamberg, Bamberg, Germany.
Background and aims: Studies on the relationship between mood and glucose control are almost exclusively limited to the retrospective assessment of depressed mood during the past 2 weeks and HbA1c, another retrospective measurment. Using daily assessments of mood in patients’ everyday life via Ecological Momentary Assessment (EMA) and daily assessments of glucose control via CGM, more real-time analyses of the associations between psychological and physiological status are possible. This analysis examined the daily interactions between mood and parameters of glycaemic control in type 1 diabetes.
Materials and methods: In the DIA-LINK study, people with type 1 diabetes rated their current mood 4 times a day on a 10-point scale (very poor - very good) over 18 days using EMA (smartphone app). Glycaemic control was assessed using CGM. Per day, mean mood values, mood swings (CV) and parameters of glycaemic control (mean glucose, glucose variability (CV), % < 70 mg/dl, % 70-180 mg/dl [normal range], % > 180 mg/dl) were calculated. Using multi-level modelling, the associations between mood and glucose parameters over 18 days were analysed, controlling for autocorrelation with participants as nesting factor.
Results: Data from 152 participants could be analysed. Over 18 days, better mood was associated with lower mean glucose (p<.001), less hypoglycaemic values (p=.006), more values in the normal range (p=.001), and less hyperglycaemic values (p=.005). Greater mood swings per day were associated with greater glucose variability (p=.047), fewer values in the normal range (p=.001), and more hyperglycaemic values (p=.004). Mood was also a significant predictor of glucose control on the next day: better mood was associated with lower glucose values (p=.004), more values in the normal range (p=.002) and fewer hyperglycaemic values (p=.003) on the day after. However, mood could not be predicted by any parameter of glycaemic control of the previous day.
Conclusion: The results support that mood as well as mood swings and parameters of glycaemic control are associated with each other on a day-to-day level. It could also be shown that mood had predictive value for the glucose control of the following day, whereas the opposite was not the case.
Clinical Trial Registration Number: NCT03811132
Supported by: funded by the German Centre for Diabetes Research (DZD) [82DZD01102]
Disclosure: D. Ehrmann: Grants; funded by the German Centre for Diabetes Research (DZD) [82DZD01102].
768
Quality of life versus glycaemic variability and time in range in people with type 1 diabetes: sub study of the RESCUE-trial
P. Gillard1, A. El Malahi2, M. Van Elsen2, S. Charleer1, F. De Ridder2,3, K. Ledeganck3, B. Keymeulen4, L. Crenier5, R. Radermecker6, B. Lapauw7, C. Vercammen8, F. Nobels9, C. Mathieu1, C. De Block2,3;
1Endocrinology, University Hospitals Leuven - KU Leuven, Leuven, 2Endocrinology-Diabetology, University Hospital Antwerp, Edegem, 3Laboratory of experimental medicine and pediatrics, University of Antwerp, Antwerp, 4Diabetology, University Hospital Brussels, Brussels, 5Endocrinology, Université Libre de Bruxelles – Hôpital Erasme, Brussels, 6Diabetes, Nutrition and Metabolic disorders, CHU Liège, Liège, 7Endocrinology, Ghent University Hospital, Ghent, 8Endocrinology, Imelda Hospital, Bonheiden, 9Endocrinology, OLV Hospital Aalst, Aalst, Belgium.
Background and aims: Living with type 1 diabetes (T1D) is challenging. Strict glucose control is necessary to avoid hypo- and hyperglycaemic spells. The advent of continuous glucose monitoring (CGM) has changed the way T1D is managed, enabling us to document glucose control 24 hours a day, and providing us with information on glucose variability and percentages of time spent in range (TIR: 70-180 mg/dL), below (TBR) or above (TAR) this range. Whether parameters of glycaemic variability such as standard deviation [SD] and coefficient of variation [%CV], and TIR would affect quality of life has not been studied in detail before.
Materials and methods: Between September 2014 and January 2017, 515 adults with T1D entered the Belgian reimbursement system for real-time CGM (RT-CGM). The following questionnaires were completed at start, after 12 months and after 24 months: Health-related quality of life questionnaire (SF-36 version 2), five item short-form of the Problem Areas In Diabetes (PAID-SF) questionnaire, and the worry subscale of the Hypoglycemia Fear Survey (HFS, version 2). The correlation between the questionnaire scores at start and glucometrics derived from the first 2 weeks of RT-CGM use after start of full reimbursement was investigated. Multiple linear regression analysis was used to assess independent risk factors related to quality of life parameters. In each model, age, diabetes duration, BMI, gender, HbA1c, and the parameters of interest in this study (SD, %CV, and TIR) were included as independent risk factors.
Results: Shorter TIR was independently correlated with more limitations due to physical problems (B=0.392; P=0.008), more limitations due to emotional problems (B=0.274; P=0.017), and lower vitality (B=0.283; P=0.006). Also, shorter TIR was independently correlated with more diabetes-related emotional distress (B=-0.063; P=0.002). In none of these models, age, diabetes duration, HbA1c, or parameters of glucose variability proved to be independently associated with quality of life measures.
Conclusion: A longer TIR was found to be correlated with a better quality of life, but surprisingly SD and %CV did not have any influence.
Clinical Trial Registration Number: NCT02601729
Disclosure: P. Gillard: None.
769
Variations in action plan quality among adults with type 2 diabetes in primary care
P. Kjaer1, M. Dedhia2, J. Parra2, L. Fisher2, M.B. Potter2, N. Ejskjaer3,4, S. Skovlund1, D. Hessler2;
1Aalborg University, Aalborg, Denmark, 2Department of Family and Community Medicine, University of California San Francisco, San Francisco, USA, 3Department of Endocrinology, Aalborg University Hospital, Aalborg, Denmark, 4Steno Diabetes Center, Aalborg, Denmark.
Background and aims: Collection of patient reported outcomes (PROs) followed by a consultation with collaborative goal-setting and action-planning have been proposed as tools to improve clinical outcomes for people with type 2 diabetes (T2D). The aim is to evaluate the quality of action plans created in a primary care setting.
Materials and methods: A two-arm cluster-randomized controlled trial compared Connection to Health (CTH) and Enhanced Engagement CTH (EE-CTH). The study included 12 primary care sites in the San Francisco Bay Area. Adults with T2D completed a PRO health survey prior to consultation. In collaboration with a health care provider, the patient made action plans focused on problem behaviors detected by the survey. In EE-CTH the providers were additionally trained in relationship building and patient engagement skills. Action plan quality was rated using an adapted version of the Goal-Setting Evaluation Tool for Diabetes (GET-D) coding system (dual coding of 20%, IRR >80%), and examined for associations with intervention arm and patient characteristics.
Results: With a mean score of 14.62 (SD=3.87) on a 0-20 quality scale (n=725) the overall quality of action plans was moderate-high. Significantly higher quality plans were created in CTH (M=15.10, SD=3.73) compared to EE-CTH (M=14.10, SD=3.96) (t(723)=3.49, p=.001). Correlations with patient characteristics were calculated using generalized linear mixed models. Patient health literacy (B=.238, 95% CI [.002, .474], p=.048), confidence in carrying out the plan (B=.050, 95% CI [.015, .086], p=.005), and having no social risks (B=.460, 95% CI [.080, .840], p=.018) were positively related to the quality of action plans, whereas gender, age, language, race, level of education, depression, general life stress, and health distress were unrelated to action plan quality (p=n.s.).
Conclusion: Both CTH and EE-CTH resulted in moderate-high quality action plans, but considerable quality variability was seen across patients in both intervention arms. Action plan quality was significantly higher in CTH compared to EE-CTH, which might in part be attributed to a more direct focus on behavior change actions in CTH. The focus of EE-CTH is on decision support exploring emotional and motivational barriers - an approach that might result in improved long term outcomes. Results suggest no link to most patient characteristics. However, low health literacy and having social risks were related to lower quality action plans, while high quality was related to a higher confidence in carrying out the plan.
Supported by: NIH DK108039
Disclosure: P. Kjaer: None.
770
Mental health and its association with glucose-lowering medical therapy in gestational diabetes pregnancy: a prospective clinical cohort study
J.J. Puder1, L. Gilbert1, A. Nikolaou2, D. Quansah1, J.-B. Rossel1, A. Horsch1,3;
1CHUV, Lausanne, 2HUG, Genève, 3IUFRS, Lausanne, Switzerland.
Background and aims: Mental health is poorer in women with gestational diabetes (GDM) and may influence glycemic control directly or through changes in lifestyle. Medical treatment, mostly insulin injection, may also impact on mental health. We therefore investigated if poorer mental health (higher depression and lower well-being scores) predicted a need for glucose-lowering medical therapy and if the need for medical therapy influenced the trajectory of mental health during pregnancy and in the postpartum period.
Materials and methods: We prospectively included 341 consecutive pregnant women with GDM presenting at a Swiss University Hospital between 2016 and 2019 and signed informed consent. Regarding mental health, the World Health Organization Well-being Index (WHO-5) was collected at the first (29 weeks of gestational age) and last (37 weeks of gestational age) GDM visit and at the postpartum visit (6 weeks postpartum) and the Edinburgh Postnatal Depression Scale (EPDS) at the first GDM and the postpartum visit. Medical therapy intake was extracted from participants’ medical records.
Results: We conducted linear and logistic regressions with the presence of clinical depression (EPDS ≥11) as an interaction factor. Overall, 25,2% of women were clinically depressed at the first GDM visit. Neither well-being nor depression symptoms predicted a need for glucose-lowering medication during pregnancy (all p ≥0.29). Mental health improved over time and was higher at the postpartum visit compared to the first GDM visit (both p ≤0.001). The need for medical therapy did not predict this change, nor did it predict well-being or depression symptoms at follow-up (all p ≥0.40). However, in women with clinical depression symptoms, medication was associated with less improvement in well-being at the postpartum visit ( p for interaction=0.013).
Conclusion: Mental health and need for medical therapy did not influence each other in an unfavourable way in this cohort of GDM women.
Supported by: Swiss National Science Foundation, unrestricted Novo Nordisk educational grant.
Disclosure: J.J. Puder: None.
771
Key differences with hypoglycaemic fear in people using insulin: the association with missed bolus doses exists for type 2 diabetes, but not type 1 diabetes
S.S. Edwards1, X. He1, J. Johnson1, E.S. Meadows1, W. Wang1, H. Wolpert1, W. Polonsky2;
1Eli Lilly and Company, Indianapolis, 2Behavioral Diabetes Institute, San Diego, USA.
Background and aims: Connected insulin pens have potential utility as diagnostic tools to objectively assess missed bolus doses (MBD) and their impact on glycemic outcomes. We determined the relationship of MBD to time-in-range (TIR) and explored the psychosocial factors associated with MBD to discover possible clues as to why people with diabetes using insulin might be missing doses.
Materials and methods: This observational study enrolled people with T1D or T2D using insulin (A1C ≥64 mmol/mol, ≥3 insulin boluses/day at enrollment). We administered the Hypoglycaemic Fear Survey (HFS) at baseline. Connected pen and blinded CGM data (21 days collection) were used to calculate MBD in an exploratory fashion with varying parameters. We observed that correction and/or meal doses could be given prior to or after the onset of an excursion; thus, we defined MBD if there was no insulin dose from 2 hrs prior to 4 hrs after the start of the glucose excursion (>3.9 mmol/L rise in glucose not preceded by hypoglycaemia [<3.9 mmol/L]). We built a negative binomial model (with MBD/day as the outcome), including all baseline factors and patient reported outcomes as potential predictor variables. Models were evaluated by regularized model selection with Bayesian information criteria (BIC). We chose the best model (smallest BIC), and reported relevant variables.
Results: Participants (n=68) had mean age 48 years and were 44% female; 65% had A1C ≥75 mmol/mol. T1D (n=40) and T2D (n=28) participants differed on age (42.5 vs. 55.2 yrs, p<0.001), BMI (27.7 vs 34.1, p<0.001), and diabetes duration (22.7 vs 16.0 yrs, p=0.015). For the total sample, participants had mean 0.72 MBD/ day (range 0-1.86). TIR was 42.6% (± 18.8%) while time above range (TAR) was 52.8% (± 21.3%). MBD was negatively associated with TIR (Spearman’s correlation coefficient [rS] = -0.28, p=0.02) and positively associated with TAR (rS =0.26, p=0.03). While there were no significant differences between T1D and T2D participants in TIR, MBD/day, or hypoglycemic fear, we did find that the two groups diverged when we examined the links between hypoglycemic fear and MBD/day. Specifically, for T2D participants, MBD/day were associated with the three HFS subscales: Worry (HFS-W), Avoidance (HFS-A), and Maintain High (HFS-MH). MBD/day were significantly more common among those with lower HFS-W (IRR=0.94, p=0.004), but with higher HFS-A (IRR=1.14, p=0.005) and higher HFS-MH (IRR=1.07, p=0.040). For T1D participants, none of the HFS subscales were significantly associated with MBD/day.
Conclusion: Reducing MBD may be a key factor in improving TIR and it is important to understand why people miss doses. The differences between T1D and T2D participants regarding the association between hypoglycemic fear and MBD frequency were unexpected, and suggest that addressing concerns about hypoglycemia, at least for T2D, may be a worthwhile first step.
Clinical Trial Registration Number: NCT03368807
Supported by: Eli Lilly and Company
Disclosure: S.S. Edwards: Employment/Consultancy; Eli Lilly and Company. Stock/Shareholding; Eli Lilly and Company.
772
Impact of real-time CGM data sharing on quality of life in adults with type 1 diabetes
A.L. Fortmann1, W.H. Polonsky2, T. Kurtukova3;
1Scripps Whittier Diabetes Institute, San Diego, 2Department of Medicine, University of California, San Diego, San Diego, 3Dexcom, San Diego, USA.
Background and aims: Though there is growing use of real-time continuous glucose monitoring (CGM) data sharing among people with type 1 diabetes (T1D) and their caregivers, little is known about how data sharing is used and how it might influence quality of life (QOL). To address this issue, we surveyed T1D adults using Dexcom G5 or G6 CGM and the SHARE feature, inquiring about their attitudes regarding SHARE, how they and their chief follower made use of SHARE, and how SHARE had influenced (both positively and negatively) their QOL and clinical outcomes.
Materials and methods: A large cohort of T1D adults who were active users of Dexcom G5 or G6 CGM and SHARE were invited to complete an online questionnaire battery examining: how the individual and follower were using SHARE data, satisfaction with SHARE and the follower’s use of SHARE, and impact of SHARE use on key outcomes. To assess retrospective change in QOL, modified versions of the Diabetes Distress Scale (T1-DDS), Hypoglycemic Confidence Scale (HCS) and WHO-5 well-being scale were developed. Analyses were conducted to describe the T1D sample, document SHARE use and satisfaction, and evaluate associations between how SHARE was being used by followers and perceived impact on QOL and clinical outcomes.
Results: Of 315 who began the survey, 302 (95.9%) completed it satisfactorily. Respondents were mostly Non-Hispanic White (88.1%), female (59.6%) and well-educated (58.3% college graduates). Mean age was 42.8 ± 12.8 years, 76.5% had been living with T1D > 10 years (76.5%) and 58.0% using CGM > 1 year. Most (80.9%) indicated their chief follower was their spouse/partner. The majority reported they and their follower had discussed how best to respond to SHARE data (69.5%), and agreed their follower: offered encouragement when needed (“encouraging”; 69.9%) and celebrated when things were going well (“celebrating”; 57.3%). However, 17.5% reported their follower was now "bugging them" too much. Most agreed SHARE contributed to peace of mind for themselves (89.1%) and their followers (94.0%) and helped them to feel less alone with diabetes (79.5%), while 41.4% felt SHARE had led to a better relationship with their follower. However, due to SHARE, 23.5% now felt more judged by their follower. Large numbers reported SHARE-derived improvements in sleep quality (52.4%), frequency of severe hypoglycemic episodes (62.2%), A1C (47.3%) and QOL markers-- hypoglycemic confidence (HCS, 89.4%), overall well-being (WHO-5, 54.3%) and diabetes distress (T1-DDS, 36.1%). Of note, reported actions by followers in response to SHARE data were linked to improved clinical outcomes and QOL: more frequent “encouraging” and “celebrating” by the follower were significantly associated with decreases in A1c (rs = -0.26, -0.26), frequency of severe hypoglycemic episodes (rs = -0.25, -0.27), and T1-DDS (rs = -0.36, -0.32), as well as increases in HCS (rs = 0.35, 0.33) and WHO-5 scores (rs = 0.28, 0.33), all ps < .05.
Conclusion: Sharing of real-time CGM data was viewed as broadly positive by this sample of T1D adults who were active users of SHARE. Respondents reported significant QOL and glycemic gains due to SHARE, and indicated their followers’ SHARE actions were mostly helpful. Followers’ specific actions were associated with reported QOL and glycemic outcomes, suggesting that educating CGM users and their followers regarding how best to talk about and use these data may be of significant value.
Supported by: We thank Dexcom for providing financial support for this project.
Disclosure: A.L. Fortmann: None.
773
Examination of time in range as a correlate of subjective well-being in glucose sensor users with type 1 diabetes
K. Wang1, C. Florissi2, C. Pang2, R. Wood2, dQ&A;
1Close Concerns, San Francisco, 2dQ&A, San Francisco, USA.
Background and aims: A1c is the traditional metric for long-term tracking of blood glucose levels but does not accurately capture acute glycemic changes. Continuous glucose monitoring (CGM) provides necessary advantages over A1c alone, offering real-time feedback on the patient’s time spent in the ideal glucose range (TIR). The current study explores the link between self-reported TIR and the subjective well-being of glucose sensor users with type 1 diabetes (T1D)
Materials and methods: Members of the dQ&A European Patient Panel completed an online, biannual survey from April to May 2019 (n=2,753; response rate 59%). 1,502 participants (1,358 adults and 144 children) with T1D reported use of a glucose sensor and were included in this cross-sectional analysis. Participants estimated the percentage of their day spent in the ideal blood glucose range (4-10mmol/L). Subjective quality of life was assessed by self-report on the WHO-5 Well-Being Index, a five-item questionnaire. On a six-point Likert Scale (0-5), participants indicated the frequency of positive mood, activity, or interest in the past two weeks. Compensation was provided for survey completion (12€). Data were collected using Qualtrics Survey Software, prepared with IBM SPSS, and analyzed in MarketSight.
Results: T1D glucose sensor users self-reported TIR in five categories: below 20% (6%), 20-40% (19%), 40-60% (37%), 60-80% (29%), and above 80% (9%). A positive trend was found between TIR and subjective well-being on 4 of 5 items of the WHO-5 Index. Higher TIR corresponded with an increased percentage of participants reporting cheerfulness/good spirits (Fig. 1), relaxation, activity/vigor, and restfulness most of the time. Across these items, the largest cumulative percent difference was found between participants reporting 40-60% TIR and 60-80% TIR. Z-tests (90% confidence level) revealed that a significantly higher percentage of participants in the 60-80% TIR group reported cheerfulness/good spirits (10%), relaxation (5%), activity/vigor (11%), and restfulness (8%) most of the time compared to those in the 40-60% TIR group. TIR did not trend with participants’ interest in daily life activities.
Conclusion: Higher self-reported TIR in T1D glucose sensor users was linked with greater subjective well-being. These findings identify TIR as a correlate of important health outcomes. Future studies may use this insight to explore the utility of using TIR as a possible alternative or supplement to A1c measurements alone.

Disclosure: K. Wang: None.
774
Functioning of families bringing up children with and without type 1 diabetes
A. Lukacs1, V.B. Zagraj1, V. Joó2, A. Kovács Bartkóné3, A. Soós3, L. Barkai1,4;
1Faculty of Health Care, University of Miskolc, Miskolc, Hungary, 2Faculty of Arts, University of Miskolc, Miskolc, Hungary, 3B.-A.-Z. County General and University Hospital, Miskolc, Hungary, 4Department of Paediatrics and Adolescent Medicine, Pavol Jozef Šafárik University, Kosice, Slovakia.
Background and aims: Bringing up a child with type 1 diabetes (T1D), the strict insulin and diet management, the frequent blood glucose monitoring and the constant worry about the blood glucose fluctuations are a challenge for the whole family. The family members need to adapt to the changed lifestyle of the child with T1D. Our study aimed to determine whether there is a difference in the functioning of families bringing up children with and without T1D, and we also aimed to determine its explanatory variables.
Materials and methods: Children with T1D were chosen from one of the biggest Pediatric Diabetes Clinic, the control peers were recruited from primary and secondary schools in two settlements. Family functioning was evaluated using the Family Functioning subscale of the PedsQL Family Impact Module. In addition, children's general quality of life, cognitive (executive) functioning and physical activity, as well as the mothers’ well-being, depression symptoms, resilience level and life satisfaction were assessed. Demographics (sex, socioeconomic background, age of mothers and children, family status), and clinical parameters of children with T1D (glycemic control expressed by HbA1c, duration of diabetes, the method of the intensive insulin therapy, and the number of hypoglycemic events) were also examined.
Results: A total of 377 families was assessed, of which 27.1% raised a child with T1D. The mean age of the children was 14.85, SD=2.66 years (8-19), 44.8% were boys. There were no significant differences in age and gender distribution, nor in the family functioning between the investigated groups. Children with T1D had reduced executive functioning; mothers raising a child with T1D had impaired well-being and life satisfaction. No other differences were observed. In the total samples, the family functioning was explained by the mothers’ well-being (t=4.81, p<0.001), depression symptoms (t=-2.13; p=0.034), life satisfaction (t=2.30, p=0.022) and the children’s executive functioning (t=7.42; p<0.001) (R=0.62; R2=0.38). When the families bringing up children with T1D were examined in addition with children’s clinical parameters, the family functioning was explained by the children’s executive functioning (t=4.98; p<0.001) and the mothers’ depression symptoms (-2.46; p=0.016) (R=0.59, R2=0.35).
Conclusion: The results of the study suggest that the diabetes management is well integrated into the daily activities of the families and accepted by the family members. Although the diabetes management is burdensome, there is no difference in functioning between families who bring up healthy children and those with T1D. The families function better if the children’s cognitive functioning and the mothers’ psychological well-being are improved. It seems that the clinical parameters have no effect. To assess the effect of long-term glycemic control on the cognitive functioning, further investigations are required.
Disclosure: A. Lukacs: None.
775
Psychological impact and care needs among 9,869 people with diabetes and caregivers in Denmark
S. Skovlund1, K. Arnskov2, N. Ejskjaer1;
1Aalborg University, Aalborg, 2Danish Diabetes Association, Aalborg, Denmark.
Background and aims: Psychological needs assessment and support is considered an essential part of team-based diabetes care in current care guidelines, yet there is a gap in knowledge regarding how People With Diabetes (PWD) and Caregivers (CG) perceive the need and wish to be supported. This study set out to characterize the psychological impact of diabetes and needs for psychological care and support needs among a nationwide sample of PWD and CG and to initiate the first national benchmarking of PWD reported access to person-centred diabetes care within a systemic care model.
Materials and methods: A national observational survey (Life with Diabetes 2019) was designed by the Danish Diabetes Association and Aalborg University using a participatory stepwise method. Final topics included 1) Daily life and impact, 2) Access to care, technologies, and support, and 3) Areas for improvement in diabetes care. Previously validated and purpose-built items were used including items from the national Patient Reported Outcome (PRO) diabetes initiative. Free text items were included as part of a mixed method qualitative design. 38.820 members of the Danish Diabetes Association were invited. Results were analysed using STATA, SPSS 26.0 and Nvivo 12.0.
Results: 9.108 adult PWD and 761 adult caregivers of PWD completed the questionnaire (results from parents of children with diabetes are reported separately). 71% of PWD had type 2 diabetes, 26% had type 1 diabetes. 51% were women. Respondents were from all regions of Denmark (28% in Capital (2.753), 24% (2.365) in Southern Denmark, 22% (2.126) in Central Denmark, 15% (1.490) in Zealand, and 11% (1.082) in North Denmark. Survey respondents did not differ from the general population in terms of age and gender (p<0.05). 19% of PWD felt diabetes was taking up too much of their life using items from the national PRO diabetes program. 18% of PWD (12% men, 24% women) had not been offered a referral to a psychologist related to their diabetes, but would like to be offered one. 36% of PWD and 21% of CG said they currently did not get the needed support for dealing with emotions and thoughts related to their diabetes, 19% reported a “major need for improved support for emotional aspects of diabetes”. 1.104 qualitative responses were coded using thematic analysis identified 12 themes with the key ones being 1) access to new technologies, 2) quality of care in primary care and 3) Psychological support.
Conclusion: Our study is the first nationwide study of its kind to demonstrate and detail a major need for better access to psychological care for PWD and CG in Denmark. Diabetes distress was found to be common and detectable using PRO diabetes items and people reported both a lack of psychological care and general attention to emotional issues in routine care. These findings provide an important foundation for co-creation of programmes to improve psychosocial support options based on the wishes and needs of PWD. The survey will be repeated biannually to evaluate progress and impact and further expand survey participation and assessment of geographical variation in support levels.
Disclosure: S. Skovlund: None.
PS 70 Digital health in type 2 diabetes
776
Development of a decision aid for primary care to predict the best glucose-lowering treatment after metformin for people with type 2 diabetes
J.M. Dennis1, L.A. Donnelly2, W.E. Henley1, A.G. Jones1, A.P. McGovern1, N. Sattar3, R.R. Holman4, E.R. Pearson2, A.T. Hattersley1, B.M. Shields1;
1University of Exeter Medical School, Exeter, 2University of Dundee, Dundee, 3University of Glasgow, Glasgow, 4University of Oxford, Oxford, UK.
Background and aims: Lack of treatment guideline clarity makes choice of treatment after metformin a clinical dilemma for many people with type 2 diabetes. We aimed to develop a decision aid to predict likely glucose-lowering (HbA1c) response for recommended post-metformin treatments.
Materials and methods: We used UK primary care data (Clinical Practice Research Datalink, n=29,772) to build an ordinal regression model using routinely available clinical data to rank the four recommended second-line drug classes (sulfonlyureas, pioglitazone, SGLT2-inhibitors, DPP4-inhibitors) by predicted 12 month HbA1c response. Model performance was evaluated by comparing HbA1c response in people prescribed the drug ranked best by the model (concordant group), with those prescribed a drug not ranked as best (discordant group). Model validation was performed in an independent population dataset (SCI-Diabetes, n=3,024).
Results: Different clinical features better predict greater response for the four drugs: obesity and female sex (pioglitazone), higher eGFR, higher ALT (SGLT2-inhibitors), male sex, lower BMI (sulfonylureas), longer diabetes duration, lower eGFR (DPP4-inhibitors). The model ranks sulfonlyureas the best drug for HbA1c change for 27% of people; pioglitazone 43%; SGLT2-inhibitors 30%; DPP4-inhibitors 0%. In CPRD the concordant group have an average 4.1 mmol/mol (95%CI 3.7;4.4) greater HbA1c reduction than the discordant group; a similar greater reduction of 3.7 mmol/mol (95%CI 2.5;4.9) is observed in SCI-Diabetes, the independent validation dataset. The model has clear clinical utility for many people: over 25% have an optimal drug predicted to give a 3 mmol/mol or more greater response than their second-best drug. Of these 25%, only one-in-five were actually prescribed their optimal drug in UK clinical practice.
Conclusion: An algorithm utilising simple clinical information can identify people likely to have a greater HbA1c improvement using one glucose-lowering therapy compared with others. There is genuine potential to deploy the model as a decision aid to contribute to more individualised choice of post-metformin treatments in primary care. An online web calculator is in development.
Supported by: MRC
Disclosure: J.M. Dennis: None.
777
Moderate-intensity activity may reduce both the body fat composition and pancreatic glucagon secretion in type 2 diabetes
M. Miuchi1, A. Hatano1, M. Takeuchi1, M. Okada2, Y. Katayama2, S. Tsuruoka3, C. Takeuchi3;
1Department of Internal Medicine, Division of Diabetes, Endocrinology & Metabolism, Osaka Central Hospital, Osaka, 2Department of Nutrition, Osaka Central Hospital, Osaka, 3Department of Pharmacy, Osaka Central Hospital, Osaka, Japan.
Background and aims: Intensive activities often reduce not only the fat composition but also the muscle composition. The reduction of the muscle composition affects that the physical activity becomes fainter. It is important to keep the muscle and reduce the fat mass selectively for the treatment in obese diabetic mellitus (oDM). Recently, the eyes of the world are upon the moderate-intensity activity which has benefits to improve the body compositions. In the moderate-intensity activities, we focused on “brisk walking”. The physical activity of the brisk walking is thought to be 3-6 metabolic equivalents ( METs ). Now, there are few reports about the effect of the brisk walking in diabetic patients with the change of their body compositions. In addition, whether those relates with both insulin and glucagon secretion from the pancreas was not reported while these hormones are involved in muscle and fat tissue. Therefore, we investigated the effect of the brisk walking as the moderate-intensity activity.
Materials and methods: We observed 178 diabetic patients ( age 54.7 ± 12.5 y, HbA1c 8.6 ± 2.1 %, duration of oDM 6.8 ± 7.6 y, BMI 27.8 ± 5.4 kg/m2 ). The muscle and fat mass were evaluated by the body composition scale, WT-B100DZ. Moderate-intensity activity was measured by the activity tracker, MT-KT02DZ which can detect amount of around 4 METs activity a day. We followed each patient who was educated to perform the brisk walking by 4 METs activity for 1-2 weeks in the hospital. The result of body composition, serum c-peptide and pancreatic glucagon were compared between before and after the treatment in the hospital.
Results: Patients whose age and duration of oDM were high could not get the sufficient 4 METs activity. Brisk walking for enough time a day ( 4 METs exercise > 20 mins a day ) benefitted the significant reduction of body weight ( p < 0.01 ) and fat composition ( p < 0.05 ) while muscle has no significant change. In patients whose fat composition was much reduced by 4 METs activity, both fasting c-peptide and pancreatic glucagon level were significantly reduced ( p < 0.05 and p < 0.001 respectively ).
Conclusion: The moderate-intensity activity could reduce the fat composition rather than muscle in oDM. It may weaken the insulin resistance and improve the abnormality of both insulin and glucagon secretion from the pancreas in diabetic patients. We believe that moderate-intensity activity is effective as one of treatments for oDM.
Clinical Trial Registration Number: OCH 18-02
Supported by: Terumo Corporation
Disclosure: M. Miuchi: Employment/Consultancy; Terumo Corporation, Takeda Pharmaceutical Company, Kyowa Kirin Co. Lecture/other fees; Roche Diagnostics K.K., Novo Nordisk Pharma, Sanofi K.K., Boehringer Ingelheim International GmbH, Kowa Pharmaceutical Co. Ltd., Daiichi Sankyo Company, Sumitomo Dainippon Pharma Co.
778
Mobile health-enabled insulin titration: patient experience
A. Bastian1, A. Philis-Tsimikas1, H. Sandoval1, A. Hottinger1, L. Parks2, T. Sheng2, M. Clements2, A. Fortmann1;
1Scripps Whittier Diabetes Institute, Scripps Health, San Diego, 2Glooko, Mountain View, USA.
Background and aims: People with type 2 diabetes (T2D) often report challenges and require support in self-titrating basal insulin (BI), or do not self-adjust at all. Mobile health (mHealth) technology may represent an efficient approach to provide the remote support needed to effectively adjust BI. However, research is warranted to investigate individuals’ comfort and satisfaction with this approach, and willingness to follow automated, app-based titration guidance.
Materials and methods: Between 5/2017 and 8/2019, N=242 adults with T2D and HbA1c 7.5 - 12.5% on BI participated in a randomized control trial to evaluate the effects of an app-based self-titration tool [Mobile Insulin Dosing System (MIDS)] vs enhanced paper titration tool (PTT) on glycemic control over 16 weeks. An ancillary (qualitative) study, conducted by independent researchers, consisted of semi-standardized telephone interviews with a subset of participants (n = 90) to understand their experience with the titration tools. Between 10/2018 and 8/2019, participants from both groups were contacted by telephone within 30 days of their parent study end date. Questions were open-ended, and progressed in specificity to address perceptions about insulin and the titration tools. Interviews were conducted and transcribed by research assistants, and coded by two independent raters; a third rater reconciled discrepancies.
Results: In the parent study, improvements were observed in diabetes distress (M∆ = -0.31 ± 0.61, -0.29 ± 0.60, ps <.05) and diabetes treatment satisfaction (M∆ = +3.60 ± 6.30, +2.76 ± 5.93, ps <.05), but not in hypoglycemic fear (M∆ = -0.02 ± 0.47, -0.07 ± 0.55, ps >.05) in MIDS and PTT over time; there were no between-group differences. Of N = 114 attempted for contact for the ancillary study, completion rates were high and similar across MIDS and PTT: n = 43 (75%) vs. n = 47 (82%). Mean age = 62.0 ± 10.9 and T2D duration = 14.1 ± 8.3 years; 54% were male and 70% non-Hispanic White. The majority reported prior BI use (81%); of those who were insulin-naïve, 41% were apprehensive about starting BI. Most MIDS (72%) and PTT (66%) users rated their self-titration experience positively; 30% of MIDS and 34% of PTT users cited their titration tool as easy to use, while 15% of PTT (0% of MIDS) users suggested it improved BI-dosing accuracy and consistency. A small number reported specific negative aspects: challenging to use/confusing (7% MIDS, 2% PTT), inconvenient to carry (6% PTT), technical difficulties (5% MIDS), burdensome/time-consuming (4% PTT), and not comfortable with dosing suggestions (2% MIDS). Overall, participants reported high confidence in adjusting BI with MIDS and PTT (9.1 ± 1.7, 9.4 ± 1.1, out of 10). The most liked MIDS feature was the blood glucose graph (37%); half reported learning something new about their blood glucose (51%, vs. 34% of PTT). Nearly 1/3rd of PTT users learned something new about insulin (32%, vs. 14% in MIDS) and said that what they liked most about PTT was that it helped them titrate BI more independently (30%, vs 23% in MIDS).
Conclusion: Adults with T2D reported high satisfaction and confidence in titrating BI via an mHealth-enabled app or PTT. User proficiency with technology versus ability/willingness to carry a physical (paper) tool, combined with preference to actively calculate doses versus receive automated dose calculations and blood glucose trend visualizations should be considered when selecting a BI titration tool.
Clinical Trial Registration Number: NCT03091712
Supported by: Glooko GL3; Novo Nordisk
Disclosure: A. Bastian: None.
779
Development of an evidence-based tool to facilitate individualised treatment decisions for patients with type 2 diabetes in the clinic
J.B. Buse1, S. Harring2, I. Holst2, A.R. Kahkoska3, F.K. Knop4, K. Kvist2, R. Pratley5;
1University of North Carolina School of Medicine, Chapel Hill, USA, 2Novo Nordisk A/S, Søborg, Denmark, 3University of North Carolina at Chapel Hill, Chapel Hill, USA, 4Gentofte Hospital, University of Copenhagen, Hellerup, Denmark, 5AdventHealth Translational Research Institute, Orlando, USA.
Background and aims: Type 2 diabetes (T2D) is a heterogeneous disease with many therapies available. Guidelines recommend individualised therapy, which could be facilitated using estimates of outcomes based on data derived from individual cases rather than populations. Our aim was to design an interactive tool that can offer data-supported individualised treatment decisions by estimating patient-specific outcomes in a user-friendly interface.
Materials and methods: We developed an interactive tool built on randomised clinical trial data that uses demographic and clinical characteristics from individual patients to predict changes in HbA1c and body weight upon initiation of different antihyperglycaemic therapies over 26-30 weeks. Input parameters include age, BMI, body weight, diabetes duration, HbA1c, current diabetes management, sex and renal function. The tool then selects the appropriate trial from a database of randomised controlled trials (e.g. all treatment arms from the SUSTAIN 1-5 and 7-10 trials of once-weekly [OW] s.c. semaglutide). Prespecified models, modified with the inclusion of additional patient characteristics, from the original trial protocols for each endpoint are used to predict patient outcomes. The predictions used the estimated coefficients from the baseline characteristics determined in the model using the totality of data.
Results: When using the tool, patient data are entered and an antihyperglycaemic treatment is selected from the list of choices in the tool. Rather than providing the change in the effect-estimate for a ‘standard’ randomised controlled trial participant as is typically reported from trials, the tool shows the predicted outcomes for the patient profile selected. Predicted outcomes may be generated in series for any number of treatment options represented in the tool’s database. The predicted effects on HbA1c and body weight after receiving OW semaglutide 1.0 mg for 6 months (including dose-escalation) in four hypothetical patients from SUSTAIN 1 or 3 are shown (Table). The finished tool will permit additional input and output parameters, including common adverse events, and effects of different antihyperglycaemic treatments to be assessed.
Conclusion: By estimating patient-specific outcomes, this interactive, data-supported tool could use existing high-quality data from contemporary trials to promote shared decision making between clinicians and patients. Furthermore, the tool could aid selection of treatment regimens based on individualised patient characteristics, values and therapy goals.

Clinical Trial Registration Number: NCT02054897; NCT01930188; NCT01885208; NCT02128932; NCT02305381; NCT02648204; NCT03136484; NCT03086330; NCT03191396
Supported by: Novo Nordisk A/S
Disclosure: J.B. Buse: Employment/Consultancy; Consultancy: Novo Nordisk. Grants; Novo Nordisk. Non-financial support; Novo Nordisk.
780
Digital nutritional therapy in patients with type 2 diabetes: a real-world outcome analysis
A. Sutter, L. Jones, A. Ghosh, M. Schenk;
Oviva AG, Zurich, Switzerland.
Background and aims: Behaviour changes to diet and activity levels are an essential treatment pillar in type 2 diabetes management. Traditionally, patients are referred into face-to-face groups or individual consultations to improve their eating habits. With ever higher prevalence rates of type 2 diabetes, effective and scalable nutritional therapy options for patients in primary care are needed. Digital health tools have the potential to scale health professionals across greater numbers of patients, but data supporting these approaches are limited.
Materials and methods: In this retrospective data analysis, the clinical outcomes (HbA1c) of 166 patients (94 M/ 72 F; age 60 ± 11 years) with type 2 diabetes under individual nutritional counseling by registered dietitians integrated in Swiss GP practices were evaluated. After referring by the doctor, patients received an initial face-to-face consultation directly in the GP practice where the baseline HbA1c value was recorded. Subsequently, patients were split according to preference, into face-to-face counseling (f-f) or a mix of face-to-face and digital counseling (hybrid) through the App, incorporating self-monitoring tools of a photo food log, weight and activity tracking, along with regular text messaging dietitian coaching and educational materials. The second HbA1c measurement was taken 3-12 months after the first measurement, according to their local diabetes review schedules.
Results: Patients receiving the hybrid counseling (n = 52; age 54 ± 11 years; BMI 33 ± 6kg/m² ) achieved a significantly higher (p <0.05) HbA1c reduction from 8.1% (SD 2.1) to 6.4% (SD 0.8), compared to the f-f patients (n = 114; age 62 ± 11 years; BMI 32.6 ± 5.3kg/m² ), who reduced their HbA1c from 7.9% (SD 1.6) to 6.9% (SD 1.2).
Conclusion: Using digital tools in addition to the individual face-to-face counseling by a registered dietitian can improve clinical outcomes of type 2 diabetes patients in Swiss GP practices.
Disclosure: A. Sutter: None.
781
Effective and safe basal-bolus insulin therapy during fasting episodes in hospitalised patients with type 2 diabetes using decision support technology
D.A. Hochfellner1, R. Rainer1, F. Aberer1, K.M. Lichtenegger1, P. Beck2, F. Fruhwald3, A.R. Rosenkranz4, L.-P. Kamolz5, J.K. Mader1, J. Plank6;
1Division of Endocrinology and Diabetology, Medical University Graz, Graz, 2HEALTH, Joanneum Research GmbH, Graz, 3Division of Cardiology, Medical University Graz, Graz, 4Division of Nephrology, Medical University Graz, Graz, 5Division of Plastic, Reconstructive and Aesthetic Surgery, Medical University Graz, Graz, 6Division of Gastroenterology and Hepatology, Medical University Graz, Graz, Austria.
Background and aims: In hospitalized patients with type 2 diabetes (T2D) on insulin therapy, scheduled or spontaneous fasting episodes represent a significant challenge to achieve and maintain safe glycemic control. Electronic decision support systems (DSS) for basal-bolus insulin treatment (BBT) of patients with T2D have proven to be effective in controlling blood glucose (BG) in the inpatient setting. Little data exist on the management of fasting episodes so far. We tested the hypothesis that DSS may be suitable for efficient and safe diabetes management during fasting episodes.
Materials and methods: We conducted a retrospective analysis of pooled data from two clinical trials, investigating inpatients with T2D in whom diabetes management was performed using an electronic DSS with an incorporated BBT algorithm. The algorithm guided administration of insulins aspart and glargine. We searched for fasting episodes during inpatient stays and compared patients’ BG levels and insulin doses on days with regular food intake to days with fasting episodes.
Results: 115 patients (33.9% female, age 68.3 ± 10.3 years, diabetes duration 15.1 ± 10.9 years, 100% caucasian, BMI 30.1 ± 5.4 kg/m², HbA1c 69 ± 20 mmol/mol, creatinine 1.6 ± 1.2 mg/dl) out of 249 study participants had documented fasting episodes during hospitalization and were included in the analysis. Overall, we identified 194 days with fasting episodes (surgery or invasive interventions n=69, diagnostic procedures n=77, illness or loss of appetite n=29, reason unknown n=19). In 178 cases single days were affected, while eight episodes extended over two days. Mean daily BG was lower on days with fasting episodes (8.3 ± 2.0 vs 9.0 ± 1.7 mmol/l, p<0.05). Percentage of BG values within the target range (3.9-10.0 mmol/l) was higher during fasting episodes compared to episodes with regular food intake (74.9% vs 66.3%, p<0.05). Total daily insulin doses were lower on days with fasting episodes (36.4 ± 21.4.7 IU vs 46.2 ± 24.7 IU, p<0.05), which was driven by the reduction of bolus insulin (14.9 ± 12.0 IU vs 25.8 ± 13.3 IU, p<0.05). In contrast, basal insulin dose was similar on days with or without fasting episodes (20.9 ± 12.5 IU vs 21.8 ± 12.7 IU, p=0.37). There were less hypoglycemic events (BG <3.9 mmol/l) during fasting days compared to days with regular food intake (1.1% vs 2.1%, p<0.05).
Conclusion: Our data suggest that well titrated basal insulin can be administered safely during fasting conditions, whereas bolus insulin should be adjusted to the current BG level in BBT during fasting episodes. Insulin dose titration by use of an electronic DSS with incorporated BBT algorithm was able to safely and efficiently manage glycemic control during fasting episodes in inpatients with T2D requiring insulin therapy.
Clinical Trial Registration Number: NCT01932775/NCT02053077
Disclosure: D.A. Hochfellner: None.
PS 71 Is telehealth the answer to improving care in diabetes?
782
Type 1 diabetes: analysis of real-world insulin injection patterns
S. Catrina1, N. Hartvig2, A. Kaas2, J. Møller2, A.-C. Mårdby3, J. Jendle4;
1Karolinska Institutet, Department of Molecular Medicine and Surgery, Stockholm, Sweden, 2Novo Nordisk A/S, Bagsværd, Denmark, 3Novo Nordisk, Malmö, Sweden, 4Institute of Medical Sciences, Örebro University, Örebro, Sweden.
Background and aims: Multiple daily insulin injections are an integral part of life for patients with type 1 diabetes (T1D). Moreover, patients’ schedules can change from day-to-day, further complicating T1D management. This study aimed to analyze daily injection patterns for patients with T1D, thereby providing insights into patients’ behaviour.
Materials and methods: This post hoc observational study included children and adults with T1D from Sweden using NovoPen® 6 with bolus insulin (primarily insulin aspart) and/or basal insulin (primarily insulin degludec). Injection data were uploaded via the Glooko® cloud system. Daily bolus and basal injection timing profiles were documented, weighting each dose relative to the total daily dose. The time difference between two consecutive basal insulin injections was used to evaluate basal timing variation.
Results: Overall, 159 adults and 47 children were included in the analysis, with a total of 38678 days of bolus injections and 17869 days of basal injections. The mean bolus daily injection profile displayed peaks at typical mealtimes, but substantial variation was observed both across patients and between adults and children (Figure 1). In those receiving insulin degludec, the timing of consecutive basal injections differed by more than 6 hr in approximately 9% of the injections for adults and 7% of those for children.
Conclusion: These real-world data provide a unique insight into the everyday bolus and basal adherence of paediatric and adult patients with T1D. Furthermore, the results illustrate the flexibility needed for basal injections to enable optimal management of T1D.

Disclosure: S. Catrina: Grants; Novo Nordisk. Honorarium; Novo Nordisk. Lecture/other fees; Novo Nordisk.
783
Predictors of ED and inpatient admissions after hypo- and hyperglycaemic events leveraging remote monitoring data of people with diabetes
W. Lu, R. James, S. Painter, B. Shah;
Livongo Health, Mountain View, USA.
Background and aims: Predictive models to identify people with diabetes mellitus (DM) at high-risk for future ED visits and inpatient admissions (IA) are an area of clinical interest. However, recently developed models do not include self-monitoring blood glucose (SMBG) levels. A remote monitoring DM platform that creates Applied Health Signals, includes cellular-enabled BG meter that allows instantaneous uploading of SMBG values into the cloud with millions of values in people with DM.
Materials and methods: Leveraging data collected via the remote monitoring DM platform merged with U.S. healthcare medical and pharmacy claims, machine learning techniques were used to identify the 25 most predictive variables of severe hypo- and hyperglycemia events (BG ≤54 mg/dL and ≥400 mg/dL, respectively) resulting in an emergency department (ED) or inpatient admission (AI) encounter within three days of the extreme value. Four models were constructed for DM (Type 1 and Type 2) and encounter (ED and IA). Participants had to be enrolled in the remote monitoring DM platform for at least 12 months with continuous medical benefits eligibility for 24 months. Variable categories included in modeling were demographics, comorbidities based on ICD-10 codes, prior health care utilization (HCU), new and current medications, 30-days SMBG patterns with mean BG levels, and months on program. Area under the curve (AUC) was used to assess model performance.
Results: There were 7,633 people meeting selection criteria. They had a mean age of 54 years, 48% were female, and 11% had Type 1 DM. In this group, 924 and 1,518 severe hypo- and hyperglycemic with ED or IA encounters occurred. Random forest models had the highest AUC with values greater than 98% and sensitivity and specificity above 93% and 99%, respectively. HCU variables were the most predictive variables in all 4 models. Mean 7-day BG level, 30-day count of BG checks, and before-breakfast checking were also highly predictive.
Conclusion: SMBG variables are independent predictors of hypo- and hyperglycemia with ED and IA encounters. Real-time BG remote monitoring programs have the capability to identify people at high-risk of costly HCU and develop interventions to improve care.
Disclosure: W. Lu: Employment/Consultancy; Employed by Livongo. Stock/Shareholding; Stock holder of Livongo.
784
Technology use by age and region in adults with type 1 diabetes in the SAGE study
S. Edelman1, D. Bruttomesso2, K. Close3, A.G.D. Vianna4, F. Lauand5, S. Brette6, E. Renard7;
1University of California, San Diego, USA, 2University of Padova, Padova, Italy, 3The diaTribe Foundation, San Francisco, USA, 4Centro de Diabetes Curitiba, Curitiba, Brazil, 5Sanofi, Paris, France, 6Axial, Boulogne-Billancourt, France, 7University of Montpellier, Montpellier, France.
Background and aims: Glycaemic control is suboptimal in many people with T1D. Diabetes technology may help improve diabetes management but data on its use in specific age groups and geographies is limited.
Materials and methods: SAGE was a multinational, cross-sectional study using data from medical records and interviews of eligible participants (N=3858) aged ≥26 years with T1D for ≥1 year. The use of diabetes technology in different regions (Asia, Eastern Europe, Western Europe [WE], Latin America and Middle East) by predefined age groups (26-<45; 45-<65; ≥65 years) was assessed by a technology use questionnaire.
Results: Overall, finger stick blood glucose meters were used most frequently (92.0%), with similar proportions of participants using them across regions and age groups. Use of continuous glucose meters (CGM; 23.2%), insulin pumps (19.5%) and blood ketone meters (11.1%) varied between regions, while usage within each region varied somewhat between age groups (Table). Overall, use of an insulin dosing app was low (4.6%) and mostly when recommended by a healthcare professional (HCP), with slightly more frequent use in those aged 26-<45 years (5.5%) compared with older age groups (45-<65 years, 3.9%; ≥65 years, 3.5%).
Conclusion: Use of CGM, insulin pump and blood ketone meter is notably higher in WE than other regions. Globally, use of an insulin dosing app is low and appears to be mostly driven by HCP recommendations. Increased use of diabetes technology may help individuals and HCPs to manage diabetes better.

Supported by: Sanofi
Disclosure: S. Edelman: Employment/Consultancy; UCSD, VA Medical Center, TCOYD. Honorarium; Astrazenica, Intarcia, Sanofi.
785
Digital intervention is effective in increasing influenza vaccination in people living with diabetes
S. Samson1, J.L. Lee2,3, R. Buzzetti4, M. Clement5, X. Cos6, L. Ji7, N. Kanumilli8, D. Kerr9, L. Martinez10, E. Montanya11, D. Müller-Wieland12, C.-G. Östenson13, N. Skolnik14, V. Woo15, L. Foschini2;
1Sanofi, Gentilly, France, 2Evidation Health, San Mateo, USA, 3Emory University, Atlanta, USA, 4Sapienza University of Rome, Rome, Italy, 5University of British Columbia, Armstrong, Canada, 6CAP Sant Marti de Provencals, Barcelona, Spain, 7Peking University People’s Hospital, Beijing, China, 8Northenden Group Practice, Manchester, UK, 9Sansum Diabetes Research Institute, Santa Barbara, USA, 10Universite Pierre et Marie Curie, Paris, France, 11Hospital Universitari Bellvitge-IDBELL, Barcelona, Spain, 12University Hospital RWTH Aachen, Aachen, Germany, 13Karolinska Institute, Stockholm, Sweden, 14Sidney Kimmel Medical College, Philadelphia, USA, 15University of Manitoba, Winnipeg, Canada.
Background and aims: Each year, 5-20% of the population of the United States contracts seasonal influenza. People living with diabetes have a greater risk of developing influenza-related complications, such as cardiovascular events and death. Annual influenza vaccination is recommended for people with diabetes, but less than two-thirds receive the vaccine. In this study, the impact of a digital intervention designed to increase influenza vaccination rates in people living with diabetes was assessed.
Materials and methods: We conducted a virtual, prospective, 1:1 randomized controlled trial of a Diabetes Digital Intervention over 6 months, designed for adults with diabetes. Participants were blinded to study participation. The intervention group received the Diabetes Digital Intervention, which consisted of monthly messages delivered through an online health platform, with information on the importance of influenza vaccination in people living with diabetes, geolocation of where to get the vaccine, and incentives to perform follow-up actions such as setting a date to get vaccinated or taking a knowledge test (in the form of points, redeemable for monetary rewards). The intervention was developed using a combination of patient focus groups and expert input. The control group received no intervention. Self-reported influenza vaccination status at months 3 and 6 was collected. The difference in influenza vaccination rates between groups after the intervention was tested using multivariable logistic regression controlling for demographics and comorbidities.
Results: A total of 10,429 participants were included and reported influenza vaccination status (5,158 intervention; 5,271 control). At the end of the 6-month intervention, 64.2% of people in the intervention arm reported receiving the influenza vaccination, versus 61.1% in the control arm (diff=3.1, OR=1.14, p<0.01).
Conclusion: The Diabetes Digital Intervention improved influenza vaccination rates in people living with diabetes, confirming that leveraging new technology to deliver knowledge and information can improve influenza vaccination rates in high-risk populations and reduce public health burden of influenza. Rapid cycle innovation could be used to determine how to maximize the effects of these digital interventions in the future.
Clinical Trial Registration Number: NCT03870997
Disclosure: S. Samson: Employment/Consultancy; Employed by Sanofi.
786
Real-world validation of a smartphone app featuring blood-glucose prediction algorithms from continuous glucose monitoring data
C. Ringemann1, U. Kösters1, T. Wörner1, D. Duke2, Y. Klopfenstein3, P. Lustenberger3, B. Petersen1;
1Roche Diabetes Care GmbH, Mannheim, Germany, 2Roche Diabetes Care Inc, Indianapolis, USA, 3IBM Switzerland AG, Zürich, Switzerland.
Background and aims: It is essential for people with diabetes (PwD) to keep their blood glucose level within the normoglycemic range to retain their long-term health and avoid critical hypoglycemic or hyperglycemic episodes. PwDs face a daily challenge where they have to make complex therapy decisions based on various factors like current and past glucose levels, insulin and carb intakes, and activity levels. Smartphone based decision support apps are an opportunity to support PwDs in their daily therapy routine by providing actionable insights and suggestions to PwDs. To this end, we have developed an App including machine learning based glucose prediction models to help PwDs manage their diabetes.
Materials and methods: To build those models, we have used machine-learning methods that are capable of handling time series data from different sources like smart wearables and glucose measurement devices. Namely, we used an Encoder-Decoder architecture with multivariate input to predict future glucose concentration over the next two hours during various therapy scenarios typically faced by PwDs. Additionally, we have built a second model based on a XGBoost Classifier that is able to estimate the risk of a nocturnal hypoglycemic event at bedtime over the next seven hours. To train those models we used data from a clinical trial with about 200 subjects wearing continuous glucose measurement devices and other wearables. To train both models we have split the data into a training, test and validation set along subject lines. Furthermore, we conducted a limited pilot of the app in three European countries to independently validate the usability and performance of our prediction models.
Results: The glucose prediction model has an accuracy (percentage of values within +/- 15 mg/dl or 15% deviation for values above 100 mg/dl) of 82%, 65% and 49% at 30, 60 and 120 minutes prediction time within the validation set of the initial training cohort. A separate analysis of the data from the pilot phase showed a comparable performance of 71%, 54% and 41% at the respective time points. For the nocturnal hypoglycemic event prediction, we achieved a classification performance measured as the area under the curve (AUC) of 0.81 in the clinical setting and 0.71 in the pilot phase. Both results demonstrate that our prediction models can be successfully transferred from the clinical setting into a real-world application, albeit with a small drop in the performance. Moreover, the feedback for our smartphone App highlighted the usability and usefulness of the application for PwDs in managing their therapy and helped to give a better understanding of opportunities for further improvements.
Conclusion: Smart features integrated into an App are a viable tool to help PwDs in their daily diabetes management routine and enable them to use the full potential of smart wearables including glucose measurement devices. Nevertheless, one has to be careful when transferring machine - learning models from a clinical research setting into real-world applications taking into account a potential drop in the achievable performance.
Clinical Trial Registration Number: NCT03478969
Disclosure: C. Ringemann: None.
787
Data accuracy and efficiency of an in-silico cloning procedure: results of cloning patients of a long-term free-living artificial pancreas study
E. Campos-Nanez, M. Gerber, S.D. Patek;
Dexcom, Inc, Charlottesville, USA.
Background and aims: Algorithms for estimating the metabolic state of a patient often rely on mathematical models, which in turn depend on the availability and quality of data. As model-based signal processing methods become more sophisticated, using other sources of information such as acknowledged carbohydrates or delivered insulin, the demand for accurate data increases. This work focuses on one such methods namely in-silico cloning. We use the term in-silico to clone to refer to a model developed for retrospective prediction, permitting “what if” analysis about historical BG. For example, a clone created to predict how a postprandial response for a patient would change with more/less mealtime insulin.
Materials and methods: Clones that are produced with accurate continuous glucose monitoring (CGM) but incomplete records of meals or insulin delivery may fail to pass internal consistency checks that confirm the usability of the clone. To measure the impact of data quality in the yield of the in-silico cloning procedure, we introduce efficiency of the cloning process defined as the percentage of historical sensor glucose samples that are deemed usable.We compare the previously reported efficiency of clones from four recent clinical studies of an artificial pancreas algorithm implemented as a cell phone “app” to the results of applying the same cloning process to data from a recently concluded long-term clinical study. This clinical trial uses a new streamlined system that directly connects an insulin pump implementing the closed-loop insulin-dosing algorithm (t:slim X2 insulin pump with Control-IQ Technology, Tandem Diabetes Care) to a continuous glucose monitor (Dexcom G6, Dexcom), removing the need for a third device (phone).
Results: The “app” based system contains additional inter-connecting parts and allows the user to switch at will between “closed-loop” and conventional CSII modes and would sometimes be switched off altogether resulting in an incomplete record of sensor glucose values, insulin data, and acknowledged meals with an overall in-silico cloning efficiency of only 43.9%. On the other hand, as a result of simplifications in the streamlined “app”-free system, fewer data quality problems were observed in terms of recorded insulin data, acknowledged meals, and less gaps in the CGM due to connectivity problems. Increases in data quality have a positive effect on the efficiency of the cloning processing which increased to 45.5%, an improvement over the cell phone "app" based studies. The effects on the quality of the models are also positive, showing improvements in the ability of the model to reproduce observed clinical data. The mean absolute relative differences (MARD) between the simulated clone and clinical data improve to 6.4% MARD down from 6.93%.
Conclusion: A simplified system architecture can ultimately lead to a smaller number of data quality problems, ultimately increasing the usability and credibility of the collected data for modeling purposes. We reach this conclusion by showing that, being the cloning procedure constant, increases in data quality will have a significant effect on the efficiency of our model-based procedure for cloning patients of a long-term free-living artificial pancreas study. Our result also suggests that other model-based data-driven approaches such as algorithm personalization and other model-based retrospective analysis tools may similarly benefit from reliable system architectures and the associated data quality.
Disclosure: E. Campos-Nanez: None.
788
Evaluating the long-term cost-effectiveness of introducing a smart insulin pen in standard-of-care treatment of type 1 diabetes in Sweden
B. Hunt1, Å. Ericsson2, J. Gundgaard3, J.B. Møller3, W.J. Valentine1, J. Jendle4;
1Ossian Health Economics and Communications, Basel, Switzerland, 2Novo Nordisk Scandinavia AB, Malmö, Sweden, 3Novo Nordisk A/S, Søborg, Denmark, 4Institute of Medical Sciences, Örebro University, Örebro, Sweden.
Background and aims: The development and application of digital technologies to healthcare is a key component in meeting the increasing demand from patients for chronic disease management. Healthcare payers need evidence to support value-based decisions on new technologies. Smart insulin pens record the timing and dose of insulin, and data can integrate with continuous glucose monitoring (CGM) to improve diabetes self-management. The present analysis assessed the cost-effectiveness of introducing a smart insulin pen from a Swedish public healthcare payer perspective.
Materials and methods: The IQVIA CORE Diabetes Model was used to project clinical outcomes and healthcare costs (2018 Swedish krona [SEK]) over patients’ lifetimes in a Swedish type 1 diabetes (T1D) population. The model projected the development of complications, mortality, HbA1c, hypoglycaemia and insulin dosing to estimate cost effectiveness. Clinical model inputs were informed by an observational study of the introduction of an NFC-enabled smart insulin pen (NovoPen® 6) in 94 adults with T1D receiving basal-bolus insulin and using CGM. Smart insulin pen use (median follow up 7 months) was associated with an additional 1.89 h/day time in range (TIR 3.9-10.0 mmol/L [70-180 mg/dL]) compared with baseline. Change in TIR was converted to change in HbA1c using a published regression equation to allow long-term outcomes to be modelled based on published risk equations. Additional TIR with the smart insulin pen translated to a 0.62% (6.8 mmol/mol) HbA1c reduction and there were 33 fewer CGM-documented non-severe hypoglycaemic events/patient/year (≥15 min <3.0 mmol/L [54 mg/dL]) relative to baseline. Baseline characteristics were taken from the study cohort or, if unavailable, adults with T1D from the Swedish National Diabetes Register. Future costs and clinical benefits were discounted at 3% annually. Costs were converted to Euros (EUR) using a 0.091 SEK exchange rate.
Results: Over patients’ lifetimes, smart insulin pen use was associated with improved mean discounted quality-adjusted life expectancy (1.13 quality-adjusted life years) and cost savings (EUR 11,091) vs standard care. Improvements in quality-adjusted life expectancy were driven by a lower frequency and delayed onset of complications predicted with the smart insulin pen relative to standard care. Higher treatment costs (due to the higher bolus insulin dose) with the smart insulin pen were offset by the lower cost of complications compared with standard care (Fig).
Conclusion: In this long-term modelling analysis, lifelong use of a smart insulin pen improved clinical outcomes at a lower cost relative to standard care in a T1D population, suggesting that the smart insulin pen represents an efficient use of Swedish public healthcare resources in this patient population.

Supported by: Novo Nordisk A/S
Disclosure: B. Hunt: Employment/Consultancy; Full-time employee of Ossian Health Economics and Communications GmbH, which received consultancy fees from Novo Nordisk to conduct the analyses. Non-financial support; Abstract supported by Novo Nordisk A/S.
789
Trends in the use of diabetes technologies in Germany
L. Heinemann1, T. Roos2, N. Hermanns3, D. Ehrmann2, B. Kulzer2;
1Science-Consulting in Diabetes, Neuss, 2Research Institute Diabetes Academy Bad Mergentheim (FIDAM), Bad Mergentheim, 3Research Institute Diabetes Academy Mergentheim (FIDAM), Bad Mergentheim, Germany.
Background and aims: Since 2018, an annual survey is conducted to assess the use of diabetes technology in Germany. The growth rates of 2018/19 and the extent of implementation of the new technologies per diabetes unit are reported.
Materials and methods: In this year’s evaluation of current use of diabetes technology, 326 diabetologists participated in the online survey. On average, the participating diabetologists reported that they had 189 people with type 1 diabetes and 850 people with type 2 diabetes in their clinical unit. We compared the use of insulin pumps (CSII), Flash Sensor-based Glucose Monitoring use (FSGM) and real-time Continuous Glucose Monitoring (rtCGM) in 2018 and 2019.
Results: In type 1 diabetes, the number of insulin pump users rose from 56 to 75 persons per clinical unit representing an increase of 34%, the number of FSGM users increased by 38% from 81 to 112 persons per clinical unit, and the number of rtCGM users rose by 76% from 33 to 58 persons per clinical unit. Per clinical unit, three users with a commercially available closed loop system and on average one user with a self-constructed closed loop system were reported. In the year 2019 the diabetologist reported that 22.3% of all persons type 1 diabetes used rtCGM; 44.2% used FSGM and 27.9% were CSII users. Overall 67% of type 1 diabetes used one of these key diabetes technologies. In type 2 diabetes, FSGM was the most common used diabetes technology. Its use increased by 38% from 81 to 112 persons per clinical unit; insulin pumps were rather rarely used with only 4 and 3 users per unit in 2018 and 2019, respectively. rtCGM was only used by 10 persons per clinical unit in 2019, representing an increase of 25% compared to 2018. In type 2 diabetes the overall the use of diabetes technology was much smaller than in type 1 diabetes; 1% were rtCGM users, 12% used FSGM and only 0.3% used CSII.
Conclusion: The use of diabetes technology is clearly more prominent in type 1 diabetes, in which 2 out of 3 persons are using at least one of the key diabetes technologies. Growth rates between 34% and 78% within only one year indicate a disruptive diffusion of new technologies.
Supported by: Berlin Chemie
Disclosure: L. Heinemann: Honorarium; Roche Diabetes, Becton Dickinson, Lifescare, Berlin Chemie, Sanofi. Lecture/other fees; Roche Diabetes, Becton Dickinson, Lifescare, Berlin Chemie, Sanofi. Stock/Shareholding; Profil Institut für Stoffwechselforschung; Neuss; ProSciento, San Diego USA.
790
Do "looper" have better glycaemic control?
T. Roos1, N. Hermanns1, D. Ehrmann1, L. Heinemann2, B. Kulzer1;
1Research Institution of the Diabetes Academy Bad Mergentheim (FIDAM), Bad Mergentheim, 2Science-Consulting in Diabetes, Neuss, Germany.
Background and aims: The aim of the study is to investigate whether people with diabetes who use a closed-loop system (CL) have better glycemic control than people with insulin pump therapy (CSII) or multiple dose injection therapy (MDI)?
Materials and methods: 2249 people with type 1 diabetes (average age 47.5 years; 23.4 years of diabetes duration; 54.5% female) and 276 parents of children with type 1 diabetes (average age 10.6 years; 4.4 years of diabetes duration; 50.7% female) were asked about their attitudes to diabetes technologies, their current diabetes treatment and their glycemic control. Of these, 42.6% use CSII therapy, 51.3% ICT and 6.2% closed-loop therapy.
Results: People with CL had significantly (p < 0.001) lower HbA1c (6.3 ± 0.7%) than people with CSII (7.1±1.0%) or ICT (7.0±1.3%). Posthoc contrasts with the Scheffe test showed significant differences between CSII and CL (p =.000), MDI and CL (p=.000), but not between CSII and ICT (p=.443). A subanalysis of children with CL and children with CSII or MDI showed similar results (CL 6.3±0.3%; CSII 7.2±1.0%; MDI 7.1±1.4%; p=.018).
Conclusion: The use of a closed-loop system is associated with better glycemic control in people with type 1 diabetes compared to therapy with MDI or insulin pump therapy alone.
Disclosure: T. Roos: None.
791
Validating a new classification method for SMBG logging habits in real world data
R. Biven1, J. Wrede1, R. Bankosegger1, J. Kober1, C. Ringemann2, T. Huschto2, B. Petersen2;
1Medical & Research, mySugr GmbH, Vienna, Austria, 2Roche Diabetes Care GmbH, Mannheim, Germany.
Background and aims: Assessing diabetes therapy performance in Real World Data (RWD) is difficult as the data quantity of self-monitored blood glucose (SMBG) measurements shows strong variability. In a previous study, we proposed a new metric, Gn/Nk <=> n out of N days : |SMBG| >= k, which ensures data quality so patients with skewed SMBG values or highly motivated users are not overrepresented. The classification separates users by logging habits, e.g. G1 ≅ 1 log a day. The aim of this study is to validate our metric with continuous glucose measurement (CGM) data and determine if more SMBG logs a day increase the accuracy of metrics.
Materials and methods: We analyzed 299 users of a data set with CGM and SMBG logs. The inclusion criteria was 70% CGM logs for one month with associated SMBG logs. Each user was classified into a G-group. The distribution was biased to the G4-G5 groups. Therefore, users were randomly selected and had logs randomly removed to create lower G-group users, providing an equal distribution. The percent errors of the users’ mean BG, standard deviation (SD), and tests-in-range (TIR) between the SMBG and CGM logs were analyzed. With random sampling the analysis was repeated and mean results used.
Results: Results had G1 users with the largest error in all metrics tested: Mean Error: BG = 8%, SD = 14.3%, TIR = 15.9%. In comparison, the resultant error in all metrics for G2 was: Mean Error: BG = 6.1%, SD = 11.4%, TIR = 10.7%. The error for G3 was: Mean Error: BG = 6.1%, SD = 11.2%, TIR = 10.9%. The error did not substantially decrease as the logs increased (correlating to a higher G-groups). Because differences were not apparent in the mean BG, SD, or TIR, t-tests were performed for each group to determine statistical differences from the other groups based on BG or SD error. The only G-group to be statistically different (p<0.05) was G1 from all higher groups.
Conclusion: Results allow separating users into two groups. The error between G2 and all higher logging groups was not significant, implying metric accuracy does not increase with more logs. The validation allows the use of metrics based on mean BG or SD to a larger portion of users while limiting the bias on users’ logging habits. Further analyses are necessary to compare values from each G-class with clinically reported metrics.
Disclosure: R. Biven: None.
PS 72 Predicting prognosis of diabetic kidney disease
792
Quantitative levels of serum N-glycans in type 1 diabetes and their role in kidney disease
I. Thoma1, M. Colombo2, A.A. Shehni3, S.J. McGurnaghan1, L.A.K. Blackbourn1, H. Wilkinson3, A. Collier4, A.W. Patrick5, J.R. Petrie6, P.M. McKeigue7, R. Saldova3,8, H.M. Colhoun1,9, on behalf of the Scottish Diabetes Research Network Type 1 Bioresource Investigators (SDRNT1BIO);
1MRC Institute of Genetics & Molecular Medicine, College of Medicine & Veterinary Medicine, Edinburgh, UK, 2Independent consultant, Lecco, Italy, 3NIBRT GlycoScience Group, Dublin, Ireland, 4School of Health and Life Sciences, Glasgow, UK, 5Royal Infirmary of Edinburgh, Edinburgh, UK, 6Institute of Cardiovascular and Medical Sciences, Glasgow, UK, 7Usher Institute of Population Health Sciences and Informatics, Edinburgh, UK, 8UCD School of Medicine, College of Health and Agricultural Science, Dublin, Ireland, 9Public Health UK, Kirkcaldy, UK.
Background and aims: In diabetes, end organ damage is associated prospectively with the degree of glycaemia. Glucose-induced tissue damage has been proposed to occur through a range of mechanisms. These include increased flux of glucose through the hexosamine biosynthetic pathway (HBP) and enzymatic glucose modification of proteins, so-called N-linked glycosylation. Altered N-glycosylation profiles are emerging as a novel risk factor contributing to complications development. We investigated how quantitative levels of the N-glycans are associated with HbA1c, renal function and renal function decline.
Materials and methods: We measured 46 total N-glycan peaks from serum samples on 1562 individuals from the Scottish Diabetes Research Network Type 1 Bioresource Study, with median 6.3 years of follow-up. Quantitation of N-glycans used labelled mannose-3 as a standard, which allowed measuring absolute abundance of each peak. Analyses were performed using linear and logistic regression models to discover cross-sectional associations of N-glycan peaks or derived measures with HbA1c, albumin-creatinine ratio (ACR) and estimated glomerular filtration rate (eGFR), and prospective associations with incident albuminuria and changes in eGFR.
Results: More complex branched tri-antennary and tetra-antennary structures were relatively more abundant when HbA1c was higher. The level of N-glycans of all types tended to increase slightly with higher HbA1c, but associations were stronger for more complex structures. Most N-glycans were more abundant with worsening ACR. The lower the eGFR, the higher the level for all N-glycans examined after adjusting for baseline eGFR, age, sex and diabetes duration. Despite several inverse associations prospectively with final achieved eGFR, cross-validated multivariable models did not improve prediction beyond clinical covariates.
Conclusion: N-glycan composition predicts incident albuminuria and worse eGFR progression, though not independently of HbA1c. Altered N-glycan profile is a feature of worse glycaemic control in type 1 diabetes that deserves more attention.
Supported by: JDRF Chief Scientist Office, Diabetes UK, SDRNT1B, SFI SIRG
Disclosure: I. Thoma: None.
793
The role of lipoprotein(a) in renal changes within patients with poor vs good glycaemic control
S. Kirana1,2, M. Poudel2, J. Vortherms1, K.-P. Mellwig2, O. Sauzet3, D. Hinse4, D. Horstkotte2, N. Bogunovic2, L. Faber2, C. Knabbe4, D. Tschöpe5, V. Rudolph2, F. van Buuren6,2;
1GP Dres. Kraus, Nolte, Vortherms & Kirana, Lage, 2Clinic for Cardiology, Heart and Diabetes Center NRW - Ruhr-University Bochum, Bad Oeynhausen, 3Bielefeld University, Bielefeld, 4Heart and Diabetes Center NRW - Ruhr-University Bochum, Bad Oeynhausen, 5Diabetes Center, Heart and Diabetes Center NRW - Ruhr-University Bochum, Bad Oeynhausen, 6Department of Cardiology, St. Martinus Hospital, Oelpe, Germany.
Background and aims: Numerous studies in the non-diabetic population have demonstrated an association between elevated Lipoprotein (a) (Lp(a)) concentration and risk for cardiovascular disease. Diabetes mellitus (DM) is known as a cardiovascular risk factor. It is also well known that poor glycemic control represents the worsening of renal function. The contribution of Lp(a) to enhanced risk of microvascular complication in this case diabetes nephropathy is not clearly defined.
Materials and methods: Lp(a) levels were measured in 52,898 consecutive patients (pts) between 2004 - 2014 who were admitted to a large cardiovascular and diabetes center. In this population we found 580 patients with Lp(a) > 150 mg/dl. We selected all patients > 18 years with HbA1c < 5,7% and HbA1c > 8,5% and reviewed the renal function. As a control group, we randomized all patients with the same criteria however with a normal level of Lp(a) < 30 mg/dl. We collected not only the renal parameters but also the cardiovascular risk factors. The statistical analyses were performed using GraphPad Prism 8 for Windows (GraphPad Software, San Diego, U.S.A.).
Results: In this study 278 patients with Lp(a) > 150 mg/dl and 206 patients with Lp(a) < 30 mg/dl were analyzed, mean age was 60.22 years. The GFR in patients with HbA1c < 5.7% and Lp(a)<30 mg/dl were higher comparing to patients in the same glycemic situation with Lp(a) > 150 mg/dl (79.88+21.86 vs 71.56+25.03, p= 0,0014). Comparing the Lp(a) groups in patients with HbA1c > 8.5%, GFR in patients with Lp(a) < 30 mg/dl were higher than patients with Lp(a) > 150 mg/dl (74.26+24.53 vs 69.55+26.07; not significant (n.s)). Comparing the HbA1c in patients with Lp(a) > 150 mg/dl, the patients with HbA1c < 5.7% tends to have a higher GFR than patients with HbA1c > 8.5% (71.56+25.03 vs. 69.55+26.07;n.s). Coronary artery disease, peripheral artery disease and carotid artery disease tends to be more common in patients with Lp(a) > 150 mg/dl and HbA1c > 8.5%.
Conclusion: The renal function might be associated with the level of Lp(a). We observed that the GFR in patient with normal glycemic status were better than in those with poor glycemic status, independent from the Lp(a) level. The data showed also that the GFR in patients with normal Lp(a) level were better than patients with extremely high of Lp(a) level. Macrovascular complications were common in patients with poor glycemic and extremely high Lp(a).

Disclosure: S. Kirana: None.
794
Urinary metabolites measured by NMR are associated with genetic variants in individuals with type 1 diabetes
E. Valo1,2, S. Mutter1,2, V. Aittomäki3, N. Sandholm1,2, C. Forsblom1,4, P. Würtz3, P.-H. Groop2,4;
1Folkhälsan Institute of Genetics, Folkhälsan Research Center, Helsinki, 2Research Program for Clinical and Molecular Metabolism, Faculty of Medicine, University of Helsinki, Helsinki, 3Nightingale Health Ltd, Helsinki, 4Abdominal Center Nephrology, University of Helsinki and Helsinki University Hospital, Helsinki, Finland.
Background and aims: Urinary metabolite concentrations have been associated with the progression of diabetic nephropathy (DN). Understanding the contribution of genetic factors to urinary metabolite concentrations can facilitate understanding of the molecular mechanisms behind diseases such as DN. We have previously reported genetic variants associated with urinary metabolite levels measured with NMR in individuals with type 1 diabetes (T1D). In this study, we expanded our previous set of metabolites from 33 to 54 metabolites and aimed to identify genetic loci associated with urinary metabolite levels in individuals with T1D.
Materials and methods: This study included 3,244 individuals with T1D from the Finnish Diabetic Nephropathy Study (FinnDiane). Individuals with end-stage renal disease were excluded from the analysis. Urinary metabolites (n=54) were measured with NMR and individuals were genotyped with the Illumina Human CoreExome chip. The genotypic data were imputed using the 1000 Genomes Phase 3 version 5 reference panel. After quality control the imputed genotypic data included approximately 6.4 million genetic variants. We divided the metabolite concentrations by the urinary creatinine concentration and performed an inverse normal transformation. We tested the association between the urinary metabolite levels and the genetic variants by using an additive model and a score test. The analysis was adjusted for sex, age, eGFR, genotyping batch, and the two first genetic principal components.
Results: The median age of the individuals included in the study was 37 years (Q1=28 years, Q3=47 years), 50% were men and median eGFR was 102 ml/min/1.72m2 (Q1=85 ml/min/1.72m2, Q3=116 ml/min/1.72m2). Altogether, 9 loci were associated with urinary metabolite concentrations at a Bonferroni corrected genome-wide significance level of p < 9.3×10⁻¹⁰. Multiple metabolites were associated with 3 of the identified 9 loci. The lead association signals for each locus were: 2-hydroxyisobutyrate (β=-0.51, p=1.0×10-61), 3-aminoisobutyrate (β=1.07, p=9.3×10-121), 4-deoxyerythronic acid (β=-0.27, p=1.2×10⁻²²), formate (β=-0.50, p=5.1×10-67), glycine (β=0.39, p=4.2×10⁻¹¹), tyrosine (β=-0.28, p=3.6×10⁻²¹; β=0.22, p=1.3×10⁻¹³), quinic acid (β=0.18, p=2.2×10⁻¹²), and xylose (β=-0.18, p=3.1×10⁻¹⁰).
Conclusion: We identified 9 loci associated with urinary metabolite concentrations in individuals with T1D. Eight of these loci have previously been associated with urinary metabolite concentrations. Interestingly, a locus we previously reported to be associated with trigonelline and HPHPA was also observed to be associated with 2-furoylglycine, 3-hydroxyhippurate and quinic acid. For this locus the strongest signal was observed for quinic acid in an intergenic variant rs4410790. This variant has been previously associated with blood metabolite traits and BMI. In addition, we identified a novel locus associated with xylose where the lead variant rs10793953 is an intergenic variant which has previously been reported to be associated with blood cell traits.
Supported by: Academy of Finland, Folkhälsan, Wilhelm and Else Stockman Foundation
Disclosure: E. Valo: None.
795
Profiling of gut microbiota and plasma metabolites in persons with type 1 diabetes and kidney disease
P. Henriksen1, S.A. Winther1,2, J.K. Vogt3, T.H. Hansen3, L. Ahonen1, T. Suvitaival1, M. Frimodt-Møller1, T.W. Hansen1, T. Hansen3, H.-H. Parving4, C. Legido-Quigley1,5, P. Rossing1,6, O. Pedersen3;
1Department of Clinical Research, Steno Diabetes Center Copenhagen, Gentofte, Denmark, 2Novo Nordisk A/S, Maaloev, Denmark, 3The Novo Nordisk Foundation Center for Basic Metabolic Research, Copenhagen, Denmark, 4Department of Endocrinology, Rigshospitalet, Copenhagen, Denmark, 5Insitute of Pharmaceutical Science, London, UK, 6University of Copenhagen, Copenhagen, Denmark.
Background and aims: Previous studies of individuals with type 1 diabetes have reported abnormal profiles in their gut microbiota and blood metabolome. This is reported both in children and adolescents with newly discovered type 1 diabetes as well as in adults with type 1 diabetes and advanced stages of diabetic nephropathy. Here we aimed to investigate the gut microbiota and a panel of targeted plasma metabolites in individuals with long-duration type 1 diabetes and different levels of albuminuria.
Materials and methods: In this cross-sectional study we included 161 individuals with type 1 diabetes and 50 age- and gender-matched healthy controls, where individuals with type 1 diabetes were categorised into three groups according to historically measured albuminuria: 1) normoalbuminuria (<30 mg/24 h or mg/g), 2) microalbuminuria (30-299 mg/24 h or mg/g) and 3) macroalbuminuria (≥300 mg/24 h or mg/g). The gut microbiota composition was characterised at genus level by 16S rRNA gene amplicon sequencing and plasma metabolite levels were measured using LC-MS/MS and labelled standards for each metabolite.
Results: Study participants were aged 60 ± 11 years (mean ± SD) and 42% were women. Individuals with type 1 diabetes had diabetes for a mean of 42 ± 15 years and had an estimated glomerular filtration rate of 75 ± 25 ml min−1(1.73 m)−2. The gut microbial beta diversity differed significantly between healthy controls and individuals with type 1 diabetes and either micro- or macroalbuminuria. Taxonomic analyses showed that 79 of 324 genera differed in relative abundance between individuals with type 1 diabetes and healthy controls and 10 genera differed significantly among the three albuminuria groups with type 1 diabetes. For the measured plasma metabolites, 9 of 31 metabolites differed significantly between individuals with type 1 diabetes and healthy controls. Furthermore, plasma concentrations of indoxyl sulphate, L-citrulline, homocitrulline and L-kynurenine were higher in individuals with type 1 diabetes and macroalbuminuria compared to individuals with type 1 diabetes with micro- and normoalbuminuria, whereas plasma concentrations of tryptophan were lower in individuals with type 1 diabetes and macroalbuminuria compared with individuals having normoalbuminuric levels.
Conclusion: We demonstrate that individuals with type 1 diabetes of long duration are characterised by altered profiles of gut microbiota and plasma metabolites when compared to the healthy controls. Moreover, individuals with type 1 diabetes had significantly varying levels of plasma metabolites and gut genera across albuminuria-stratified groups.
Supported by: NNF OC0013659
Disclosure: P. Henriksen: None.
796
Urinary cathepsin levels are predictive of the improvement of albuminuria and are associated with elevated excretion of free glucosepane
S. Brings1, T. Fleming1,2, S. Herzig3,4, P. Nawroth1,2, S. Kopf1,2;
1Department of Endocrinology, Metabolism and Clinical Chemistry, University Hospital Heidelberg, Heidelberg, 2German Center for Diabetes Research, Munich-Neuherberg, 3Institute for Diabetes and Cancer, Helmholtz Center Munich, Munich-Neuherberg, 4Technical University Munich, Munich, Germany.
Background and aims: Cathepsin D (CTSD) and -L (CTSL) are major proteolytic enzymes of soft tissue and have been suggested to play a mechanistic role in the development of diabetic nephropathy. Both CTSD and CTSL are capable of degrading and detoxifying advanced glycation end product (AGE) modified proteins which are predictive of diabetic nephropathy. The aim of the study was to establish a LC MS/MS assay for the quantification of cathepsin levels in urine from patients with type 2 diabetes and to relate these to the amount of urinary free AGEs and traditional markers of kidney function.
Materials and methods: We established and validated a LC MS/MS method for the absolute quantification of CTSD and CTSL in urine. AGEs were quantified via a previously established LC MS/MS method. Patients with type 2 diabetes were screened for diabetic kidney disease and 141 patients were included in the current study of which 102 were seen again after a four year follow-up. Data was analysed by multivariable (mv) and univariable (uv) linear regression analysis.
Results: The detection limit (LOD) of CTSD and CTSL in urine was 2.4 ng/l and 19.1 ng/l, respectively. Both, CTSD (mv: p<0.0001, beta=0.488; uv: p<0.0001, r=0.555) and CTSL (mv: p<0.0001, beta=0.515; uv: p<0.0001, r=0.608) correlated strongly and positively with albuminuria at baseline. High urinary CTSL levels at baseline were the strongest predictor of improvement of albuminuria (mv: p=0.007, beta=-0.366) after four years of follow-up and a similar trend was seen for CTSD (mv: p=0.059, beta=-0.267). In addition levels of CTSD (mv: p=0.008, beta=0.256; uv p=0.012, r=0.225) and CTSL (mv: p<0.001, beta=0.308; uv: p<0.001, r=0.376) but not albuminuria correlated with urinary levels of the cross-linking AGE glucosepane. The strongest predictor for decline of eGFR over four years was the use of statins (mv: p=0.006, beta=-0.390).
Conclusion: A LC MSM/MS assay for the quantification of CTSD and CTSL in urine was established. Levels of the proteases correlate strongly with albuminuria in type 2 diabetic patients and high levels are predictive of improvement of albuminuria after four years of follow-up. The correlation of the proteases with the major cross-linking AGE glucosepane could point to an elevated proteolytic breakdown of modified proteins. This may explain that high CTSD and CTSL levels are indicative of an improvement of albuminuria. While statin use but not cardiovascular disease and cholesterol was associated with decline of eGFR it cannot be excluded that the association is due to negative pre-selection.
Clinical Trial Registration Number: NCT00263419
Supported by: DFG (SFB1118), German Center for Diabetes Research (DZD)
Disclosure: S. Brings: None.
797
Copeptin and renal function decline, cardiovascular events and mortality in type 1 diabetes
N.S. Heinrich1, S. Theilade1,2, S.A. Winther1, N. Tofte1, T.S. Ahluwalia1, J.L. Jeppesen3,4, F. Persson1, T.W. Hansen1, J.P. Goetze5,4, P. Rossing1,4;
1Steno Diabetes Center Copenhagen, Gentofte, 2Department of Medicine, Herlev-Gentofte Hospital, Herlev, 3Department of Medicine, Amager Hvidovre Hospital in Glostrup, Glostrup, 4Institute of Clinical Medicine, University of Copenhagen, Copenhagen, 5Department of Clinical Biochemistry, Rigshospitalet, Copenhagen, Denmark.
Background and aims: Plasma copeptin is a surrogate of arginine vasopressin secretion and associated with risk of renal and cardiovascular disease. We investigated associations between plasma copeptin concentrations and renal events, cardiovascular events and mortality in type 1 diabetes.
Materials and methods: Prospective cohort study on 658 individuals with type 1 diabetes from a secondary outpatient diabetes care setting. Plasma copeptin concentration and conventional risk factors were assessed at baseline. The five endpoints were traced though national registries and electronic laboratory records.
Results: Baseline mean ± SD age was 55±13 years and estimated glomerular filtration rate (eGFR) was 81±26 ml/min/1.73m². Median [interquartile range] follow-up was 6.2 [5.8-6.7] years; 123 participants reached a combined renal endpoint (decline in eGFR ≥30%, end stage kidney disease or all-cause mortality), 93 declined in eGFR ≥30%, 21 developed end stage kidney disease, 94 experienced a combined cardiovascular endpoint and 58 died from all causes. Associations of copeptin with all endpoints were significant in the unadjusted Cox regression analyses and remained so, albeit weakened, after adjustment for several risk factors. After additional adjustment for eGFR, associations remained significant only for the combined renal endpoint and decline in eGFR ≥30% with hazard ratios (95% confidence intervals) per doubling of copeptin of 1.30 (1.07-1.58) and 1.43 (1.15-1.79), respectively.
Conclusion: Higher copeptin was an independent risk marker for the combined renal endpoint and a decline in renal function. Arginine vasopressin may either be a marker of renal damage or a factor whose contribution to renal and cardiovascular risk is partially mediated by renal impairment.
Disclosure: N.S. Heinrich: None.
798
DNA damage in white blood cells is associated with progression of renal and lung fibrosis in patients with type 2 diabetes after 3 years of follow-up
S. Kopf, Z. Kender, L. Alvarez-Ramos, M. Höffgen, R. Prikulis, T. Fleming, P.P. Nawroth;
University Hospital Heidelberg, Heidelberg, Germany.
Background and aims: Intensive glucose lowering therapies were failed to reduce diabetic complications in a clinical relevant significance in patients with diabetes. Thus, the hypothesis of this longitudinal study is to observe the development and progression of diabetic complications with fibrosis dependent on DNA-damage in patients with type 2 diabetes.
Materials and methods: 197 participants (138 patients with type 2 diabetes, 59 controls) were included in this study and clinical evaluated for glucose control, urinary p21 excretion, senescence secretory phenotype (SASP), lung- and renal fibrosis. DNA-damage was measured by gH2Ax-levels in white blood cells and progression of organ fibrotic dysfunction was evaluated yearly in a follow-up period of 3 years in 85 patients with type 2 diabetes. All statistics were calculated with SPSS 23.0 and Prism GraphPad 8.1.
Results: Patients with type 2 diabetes had significant more DNA-damage in white blood cells compared as non-diabetic controls. Sub-group-analyses revealed that patients with type 2 diabetes and severe elevated gH2Ax-levels (>10%) had increased senescence (urinary p21-excretion) and increased SASP (p<0.05). Associated to elevated gH2Ax-levels and SASP, these patients showed significant loss of lung- and renal function after 3 years (log-rank p<0.01) with progression of interstitial lung disease, increasing albumin excretion and increasing renal resistance indices. This progression was independently by glucose control and HbA1c.
Conclusion: Increased DNA-damage and senescence are independently associated with fibrotic renal and lung dysfunction in patients with type 2 diabetes. Thus, increased DNA-damage and impaired DNA-repair might be potential future target for understanding and treating diabetic complications.
Clinical Trial Registration Number: NCT03022721
Supported by: The study is supported by the German Center for Diabetes Research (DZD e.V.)
Disclosure: S. Kopf: None.
799
Plasma adiponectin and changes in renal function in a cohort from the community: the prospective DESIR study
F. Fumeron1, R. El Boustany1, J.-P. Bastard2, S. Fellahi2, B. Balkau3, M. Marre1,4, N. Venteclef1, G. Velho1, R. Roussel1,5;
1Centre de Recherche des Cordeliers, INSERM, Sorbonne Université, Université de Paris, Paris, 2Biochemistry and Hormonology Department, APHP - Tenon Hospital, Paris, 3Clinical Epidemiology, University Paris-Sarclay, UVSQ, INSERM, CESP, Villejuif, 4CMC Ambroise Paré, Neuilly-sur-Seine, 5Department of Diabetology, Endocrinology, Nutrition, APHP - Bichat Hospital, Paris, France.
Background and aims: High adiponectin levels are associated with diabetic nephropathy. Nevertheless, it is not known whether plasma adiponectin is associated with renal function decline in the general population. We evaluated whether adiponectin concentrations were associated with changes in renal function in a community cohort.
Materials and methods: Plasma adiponectin levels were measured in a random sample of 3289 people from the DESIR (Data from Epidemiological Study on Insulin Resistance Syndrome) study, a nine-year prospective cohort from the general population. Data were analysed for three endpoints during follow-up: incidence of stage 3 chronic kidney disease (CKD); the KDIGO criterion "certain drop in eGFR"; rapid decline in kidney function (eGFR slope steeper than -3 ml/ min/1.73 m2/year).
Results: After exclusion of subjects with eGFR<60 ml/min/1.73 m2 at baseline and those with type 2 diabetes or impaired fasting glycemia at any time during follow-up (remaining n=2565), there was a 113% higher risk for rapid decline in kidney function in participants with adiponectin above the second tertile vs below the first tertile (Ptrend=0.004), and a 53% higher risk for kidney function decline as defined by the KDIGO criterion (Ptrend=0.04). In a cross-sectional analysis, adiponectin was positively associated with urinary albumin creatinine ratio (ACR) at baseline (P=0.009).
Conclusion: In a healthy cohort from the general population, higher levels of plasma adiponectin were associated with a decrease in renal function, at baseline and at follow-up. This result is similar to what is observed in people with diabetic nephropathy, in contrast with animal models of nephropathy. It could indicate a deleterious effect of plasma adiponectin on renal function in humans even in the absence of abnormal/disrupted glucose metabolism.
Disclosure: F. Fumeron: None.
PS 73 Clinical aspects of diabetic kidney disease
800
The association of albuminuria in youth with type 2 diabetes with in-utero type 2 diabetes exposure is not mediated through altered renal volume
B.A. Wicklow1,2, E.A.C. Sellers1,2, J.M. McGavock3,2, J. Hamilton4, S. Hadjiyannakis5, T. Pinto6, M. Jetha7, C. Panagiotopoulos8, A.B. Dart9,2;
1Pediatric Endocrinology, University of Manitoba, Winnipeg, 2Pediatrics and Child Health, The Children's Hospital Research Institute of Manitoba, Winnipeg, 3Pediatrics and Child Health, University of Manitoba, Winnipeg, 4Endocrinology, University of Toronto, Toronto, 5Pediatric Endocrinology, University of Ottawa, Ottawa, 6Pediatric Endocrinology, Dalhousie University, Halifax, 7Endocrinology and Metabolism, University of Alberta, Edmonton, 8Pediatric Endocrinology, University of British Columbia, Winnipeg, 9Pediatric Nephrology, University of Manitoba, Winnipeg, Canada.
Background and aims: Type 2 diabetes in youth is associated with significant co-morbidity particularly early renal disease. We utilized data collected from a large cohort study of youth with T2D to test the hypothesis that in utero maternal diabetes exposure impacts the developing nephron resulting in lower renal volume and ultimately early renal dysfunction as evidenced by albuminuria.
Materials and methods: We performed a cross-sectional study of renal volume and albuminuria (urine albumin: creatinine ratio ≥3mg/mmol) in 300 youth with type 2 diabetes exposed in utero to normoglycemia (n=122), gestational diabetes (n=57) and type 2 diabetes (n=121). Regression analysis was performed to look at the independent effects of maternal diabetes status on renal volume, maternal diabetes status on albuminuria and renal volume on albuminuria. Finally, a causal mediation analysis was performed to assess if the effect of maternal diabetes status on albuminuria was mediated through renal volume.
Results: Of the youth (mean age 14 yrs) with type 2 diabetes, 68% were female, 31% had albuminuria, and 42% had hypertension. Maternal diabetes status was not associated with renal volume for either gestational diabetes exposure (p=0.47) or type 2 diabetes exposure (p=0.31). After adjustment for maternal diabetes status renal volume was an independent significant predictor of albuminuria with larger renal volume (per unit increase of 1 cm3 ) being associated with albuminuria (OR 1.05, p 0.002). In causal mediation analysis only the direct effect of maternal type 2 diabetes was significantly associated with albuminuria (OR 1.94, 95% CI 1.00-3.80) with no evidence of a direct effect through gestational diabetes exposure (OR 0.57, 95%CI 0.19-1.67) or any indirect effect through renal volume (type 2 diabetes exposure p=0.41; gestational diabetes exposure p=0.71).
Conclusion: Youth with type 2 diabetes have high rates albuminuria. Gestational diabetes exposure did not have direct or indirect effects (through renal volume) on the odds of offspring with T2D developing albuminuria. Both exposure to maternal type 2 diabetes and renal volume were associated with albuminuria in offspring with T2D however, maternal diabetes status was not associated with renal volume. The effects of maternal type 2 diabetes exposure and renal volume on the presence of albuminuria in youth with type 2 diabetes are independent suggesting different mechanistic pathways in the progression of early renal damage.
Clinical Trial Registration Number: NCT02818192
Supported by: CIHR
Disclosure: B.A. Wicklow: None.
801
Sex disparity in the impact of dysglycaemia on the development of glomerular hyperfiltration
Y. Nakasone1, K. Yamashita1, H. Koike2, M. Komatsu3, T. Moriya4, T. Aizawa1;
1Diabetes Center, Aizawa Hospital, Matsumoto, 2Health Center, Aizawa Hospital, Matsumoto, 3Shinshu University School of Medicine, Matsumoto, 4Health Care Center, Kitasato University, Kanagawa, Japan.
Background and aims: In diabetes, males are more vulnerable to nephropathy than females. However, sex disparity in the early phase of nephropathy is uncertain. Aim of this study was to reveal a sex disparity of mild hyperglycemia, if any, as a risk for glomerular hyperfiltration (GHF).
Materials and methods: Data from health examinees without chronic kidney disease (CKD) and GHF were analyzed to quantify impact of elevated fasting plasma glucose (FPG) as a risk for incident GHF. The subjects were the general citizen of a middle-sized city who received the health examination at least twice during 1996 - 2005: N = 32,313, males 59%, the mean age and follow up period, 46 years and 6.8 years, respectively. Glomerular filtration rate (GFR) was estimated by serum creatinine, gender and age (estimated glomerular filtration rate (eGFR)) using the equation developed for the Japanese population. GHF was defined by the sex- and age-specific eGFR value ≥95% of the Japanese adults; CKD diagnosed by eGFR <60 ml/min/1.73 m2 or positive proteinuria. As indices of the dysglycemia, elevated fasting plasma glucose (FPG) per se (a continuous variable), prediabetes such as FPG 5.6 - 6.9 mmol/l (PDMADA) or FPG 6.1 - 6.9 mmol/l (PDMIDF), and diabetes diagnosed by FPG ≥7.0 mmol/l were employed. Relation of each of the dysgycemia to incident GHF was analyzed by multivariate logistic regression analysis with adjustment for sex, systolic BP, age, eGFR, the serum alanine aminotransferase and insulin sensitivity as indexed by the Single Point Insulin Sensitivity Estimator, SPISE = (600 ∙ HDLc0.185) ∙ ([TG0.2] ∙ [BMI1.338])-1, where HDLc and TG denoted high-density-lipoprotein cholesterol and triglycerides in the conventional units, respectively. Sex-adjustment of the multivariate analysis was performed only for the initial step and males and females were separately evaluated thereafter. JMPpro 14.0 was used for statistical calculation and P <0.05 was considered significant.
Results: During the described period, GHF developed in 1,596 subjects (0.72%/year). In the entire cohort, FPG per se, PDMADA and PDFIDF were significantly and independently related to incident GHF with the odds ratio (OR) being 1.10 to 1.29, and male sex was also independently related to the GHF with OR (95%CI) of 2.6 (2.3-3.0): P interaction for diabetes by FPG 7.0 mmol/l and sex was 0.004. When males and females were separated (Table), FPG per se, PDMADA, PDMIDF and diabetes diagnosed by FPG 7.0 mmol/l were all independently related to incident GHF only in males with progressively larger OR.
Conclusion: Hyperglycemia of prediabetic and low diabetic range is significantly related to incident GHF, with OR 1.26 to 1.84, exclusively in males. The finding suggests that dysglycemia promotes GHF only in the presence of androgenic input. This might be a basis for the male dominance of nephropathy in established diabetes.

Disclosure: Y. Nakasone: None.
802
Characterisation of glomerular hyperfiltration in the early type 2 diabetes: a collaborative study of population-based cohorts
Y. Shimada1, Y. Nakasone1, K. Yamashita1, H. Koike2, T. Sakuma3, T. Moriya4, M. Komatsu5, T. Aizawa1;
1Diabetes Center, Aizawa Hospital, Matsumoto, 2Health Center, Aizawa Hospital, Matsumoto, 3Internal Medicine, Ina Central Hospital, Ina, 4Health Care Center, Kitasato University, Kanagawa, 5Shinshu University School of Medicine, Matsumoto, Japan.
Background and aims: Glomerular hyperfiltration (GHF) is considered an early manifestation of diabetic nephropathy. However, trajectory of glomerular filtration rate (GFR) in the early phase of type 2 diabetes upon development of GHF has been unknown. We aimed to clarify the natural course of the evolution of GHF in early type 2 diabetes.
Materials and methods: We retrospectively analyzed data from two cohorts of health examinees: Aizawa Cohort (N = 23,982, collected during 2005-2015, males 60%, the mean age 49 years, followed for a mean of 5.1 years with the mean interval of examination 1.1 years) and Ina Cohort (N = 9,575, collected during 2011-2019, males 64%, the mean age 54 years, followed for a mean of 4.1 years with the mean interval of examination 1.1 years). Subjects with chronic kidney disease (CKD) or GHF at baseline were excluded. GFR was estimated by serum creatinine, gender and age (estimated glomerular filtration rate (eGFR)) using the equation developed for the Japanese general population; GHF defined as sex- and age-specific eGFR ≥95% of the Japanese adults; CKD diagnosed by eGFR <60 ml/min/1.73 m2 or positive proteinuria; diabetes diagnosed by fasting glucose ≥7.0 mmol/l or HbA1c ≥6.5% (48 mmol/mol). eGFR trajectory was evaluated by random coefficient mixed model.
Results: There were 1,493 subjects with diabetes in Aizawa cohort and 91 of them developed GHF (1.2% per year) (DM+/GHF+ group) whereas 706 of 22,509 subjects without diabetes developed GHF (0.6% per year) (DM-/GHF+ Group). Thus, the incidence of GHF was unequivocally higher in those with diabetes (P < 0.001). Trajectory of eGFR was indistinguishable between DM+ and DM- subgroups so that the combined data is shown (Figure). First, the baseline eGFR in GHF+ group, which was lower than the GHF range, had been significantly (by ~20%) elevated in GHF+ than GHF- groups for at least 9 years. Second, the mean eGFR rose sharply at the time of GHF approximately by17% on top of the already elevated baseline eGFR. Third, during the post-GHF phase, eGFR declined at an accelerated rate in GHF+ than GHF- groups; the mean (95%CI) δeGFR was −0.90 (-1.15 - -0.65) and −0.52 (-0.54 - -0.49) ml/min/1.73 m2/year, respectively (P <0.001). A qualitatively same results were obtained in Ina Cohort.
Conclusion: GHF in the very early stage of nephropathy begins with a long-lasting stable elevation of GFR, within non-GHF range, followed by a peak and an accelerated decline of it. The pattern of change in GFR was indistinguishable between subjects with and without diabetes.

Disclosure: Y. Shimada: None.
803
Factors associated with change in estimated glomerular filtration rate differ between people with 60 or higher and those with eGFR less than 60
S. Katoh1, K. Yokoyama2, M. Zeniya3, Y. Sakamoto4, K. Utsunomiya5, R. Nishimura1;
1Department of Internal Medicine, Division of Diabetes, Metabolism & Endocrinology, The Jikei University, Tokyo, 2Jikei University Harumi Triton Clinic, Tokyo, 3Gastroenterology Sanno Medical Center, International University of Health and Welfare, Tokyo, 4The Jikei University, Tokyo, 5Department of Health-Care Center, The Jikei University, Tokyo, Japan.
Background and aims: We compared factors associated with change in estimated glomerular filtration rate (ΔeGFR) between people with eGFR≥60 and those with eGFR<60 in people with diabetes mellitus (DM) and those with impaired fasting plasma glucose (IFG) (FPG 100-125 mg/dL, without DM). We also compared the results with those of people without DM or IFG.
Materials and methods: This study involved 5,733 people (3,752 men, 1,981 women; mean age: 51 years) who underwent annual medical checkups in Period I (Apr 2013 to Sep 2014) and Period II (Apr 2017 to Sep 2018). We evaluated ΔeGFR (mL/min/1.73m2/year) from Period I to Period II.
Results: The mean follow-up period was 51.5±6.4 months. In 837 people with DM or IFG, 712 had eGFR≥60 (DM-IFG-eGFR≥60 group) and 125 had eGFR<60 (DM-IFG-eGFR<60 group). In 4,896 people without DM or IFG, 4,286 had eGFR≥60 (nDM-nIFG-eGFR≥60 group) and 610 had eGFR<60 (nDM-nIFG-eGFR<60 group). Stepwise regression (SR) in the DM-IFG-eGFR≥60 group revealed that total cholesterol (TC: standardized β [Sβ]=+0.109, exclusion F value [eF]=8.6) (mg/dL), eGFR (Sβ=-0.241, eF=39.6), systolic BP (SBP) (Sβ=-0.096, eF=6.6), and age (Sβ=-0.080, eF=4.3) in Period I were independent determinants (ID) of ΔeGFR (+0.19±2.32 mL/min/1.73m2/year), but waist circumference, diastolic BP (DBP), triglyceride (TG) (mg/dL), LDL (mg/dL), alanine aminotransferase, gamma glutamyl transpeptidase (GGTP) (U/L), cholinesterase (ChE) (U/L), HbA1c, uric acid (UA) (mg/dL), BMI, smoking index (SI) (cigarettes per day × years of smoking), and use of lipid-lowering drugs were not. In this regression model (RM), ΔeGFR (DM-IFG-eGFR≥60) was expressed as 5.441 + 0.007×TC - 0.049×baseline eGFR - 0.015×SBP - 0.021×age. SR in the DM-IFG-eGFR<60 group revealed that TC (Sβ=+0.292, eF=12.6), BMI (Sβ=-0.247, eF=9.1), and SI (Sβ=-0.214, eF=6.7) in Period I were ID of ΔeGFR (+0.16±1.85 mL/min/1.73m2/year). In this RM, ΔeGFR (DM-IFG-eGFR<60) was expressed as -0.040 + 0.016×TC - 0.126×BMI - 0.003×SI. In the nDM-nIFG-eGFR≥60 group, SR revealed that GGTP (Sβ=+0.062, eF=14.2), ChE (Sβ=+0.043, eF=6.6), eGFR (Sβ=-0.269, eF=227.9), age (Sβ=-0.115, eF=50.1), TG (Sβ=-0.051, eF=9.3), UA (Sβ=-0.042, eF=5.7), and DBP (Sβ=-0.035, eF=4.5) in Period I were ID of ΔeGFR (+0.06±2.1 mL/min/1.73m2/year). In this RM, ΔeGFR (nDM-nIFG-eGFR≥60) was expressed as 5.635 + 0.003×GGTP + 0.001×ChE - 0.052×baseline eGFR - 0.025×age - 0.001×TG - 0.063×UA - 0.007×DBP. In the nDM-nIFG-eGFR<60 group, SR revealed that TC (Sβ=+0.110, eF=7.1), eGFR (Sβ=+0.086, eF=4.4), age (Sβ=-0.128, eF=9.7) and TG (Sβ=-0.103, eF=6.2) in Period I were ID of ΔeGFR (+0.58±1.6 mL/min/1.73m2/year). In this RM, ΔeGFR (nDM-nIFG-eGFR<60) was expressed as -0.289 + 0.005×TC + 0.022× baseline eGFR - 0.020×age - 0.002×TG.
Conclusion: TC, BMI and SI were significant determinants of ΔeGFR in DM-IFG-eGFR<60 group. Determinants differed between people with eGFR≥60 and those with eGFR<60 in the people with DM or IFG, as well in those without DM or IFG.
Clinical Trial Registration Number: 20-130 5420
Supported by: KAKENHI22590609
Disclosure: S. Katoh: None.
804
Cardiovascular autonomic dysfunction is a risk marker of future decline in kidney function in type 1 diabetes
T. Bjerre-Christensen, S.A. Winther, N. Tofte, S. Theilade, T.S. Ahluwalia, M. Lajer, T.W. Hansen, P. Rossing, C.S. Hansen;
Steno Diabetes Center, Copenhagen, Denmark.
Background and aims: Diabetes is associated with increased risk of cardiovascular autonomic neuropathy (CAN), which leads to increased mortality, and other diabetic complications. We investigated the association between CAN and decline in kidney function in persons with type 1 diabetes (T1D).
Materials and methods: The study included 329 persons with T1D and varying levels of albuminuria. CAN was assessed at baseline by cardiovascular reflex tests (CARTs) including heart rate response to deep breathing (E/I ratio), to standing (30/15 ratio) and to Valsalva manoeuvre. A two minutes resting heart rate (rHR) and the standard deviation of normal-to-normal intervals (SDNN) were assessed as indices of CAN. Two or more pathological CARTs defined presence of CAN. Renal outcomes included yearly change in albuminuria and estimated glomerular filtration rate (eGFR). Associations between the presence of CAN and indices of CAN and decline in kidney function were assessed by linear, regression models adjusted for age, sex, HbA1c, body mass index, smoking, exercise, beta blocker use, LDL cholesterol levels, systolic blood pressure, eGFR and urinary albumin excretion rate at baseline.
Results: Persons were mean (SD) aged 55.2 (9.4) years, 52% were male, with diabetes duration of 40.1 (8.9) years, HbA1c of 62.5 (11.0) mmol/mol, eGFR 77.9 (27.7) ml/min/1.73m2, Urine albumin-creatinine rate of 178.7 (635.5) mg/24-h and 31% were diagnosed with CAN. Median [IQR] follow-up time was 6.1 (5.8;6.5) years. Participants with CAN had a future increase in albuminuria of 7.80% (95% CI (0.50; 15.63, p=0.036) compared to participants without CAN. CARTs mainly representing sympathetic autonomic function were associated with albuminuria (Valsalva, 30/15 ratio). In an adjusted model, a one-unit lower (more detrimental) 30/15 ratio and Valsalva were associated with an annual decline in albuminuria of 30.24% (95% CI (2.5;65.5 , p=0.037) and 11.7% (95% CI (0.76; 24, p=0.037) respectively (Figure). Presence of CAN or single indices of CAN were not associated with decline in eGFR (Figure).
Conclusion: CAN and sympathetic function was a risk marker of decline in kidney function through increase in albuminuria and not by decline of eGFR. Thus, CAN may be a risk factor for development of diabetic nephropathy.

Disclosure: T. Bjerre-Christensen: None.
805
Haemoglobin glycation index is associated with progression of diabetic nephropathy in patients with type 2 diabetes
T. Kim1, J. Jeon2, S. Lee3, S. Han2, H. Kim4, D. Kim4, K. Chun5, N. Lee2, J. Woo6, K. Ahn6, S. Baik7, K.-W. Lee4;
1Internal Medicine, Seoul Medical Center, Seoul, 2Endocrinology and Metabolism, Ajou University School of Medicine, Suwon, 3Medicare Administration, Backseok Arts University, Seoul, 4Ajou University School of Medicine, Suwon, 5Preventive Medicine and Public Health, Ajou University School of Medicine, Suwon, 6Internal Medicine, Kyung Hee University College of Medicine, Seoul, 7Internal Medicine, Korea University College of Medicine, Seoul, Republic of Korea.
Background and aims: The haemoglobin glycation index (HGI) has been studied a predictor of diabetes macrovascular complications rather than microvascular complications. We investigated the association between HGI and progression of nephropathy in patients with type 2 diabetes who were followed up over 3 years.
Materials and methods: We analyzed the data from Korean National Diabetes Program (KNDP). The KNDP was a prospective, multicenter, and observational cohort study performed on type 2 diabetic patients from May 2006 and to March 2014 in Korea. Of those, we analyzed 1,506 subjects who had the hemoglobin A1c (HbA1c), fasting plasma glucose level, serum creatinine level, and albumin to creatinine ratio at baseline and follow-up and no previous history of cardiovascular disease and ≥3 years of follow-up. The HGI was defined as the difference between the measured and predicted mean HbA1c levels, which was calculated from the linear relationship between mean HbA1c level and mean fasting plasma glucose levels during follow-up period. Then, the association between HGI group and progression of nephropathy was analyzed using Cox proportional hazards models. All analyses were performed using SAS (SAS, version 9.4; SAS Institute, Cary, NC, USA).
Results: HGI was divided quartile group. The primary outcomes developed in 310 patients (20.6%). Higher HGI group had longer duration of diabetes and higher HbA1c level at baseline. In multivariate Cox hazards models after competing factors including mean HbA1c level , high HGI groups (Q3 and Q4; HR 1.573 [95% CI 1.075-2.302] and HR 1.988 [1.261-3.134], respectively) were increased risk for progression of diabetic nephropathy compared with the lowest HGI group (Q1).
Conclusion: High HGI is associated with increased risks of progression of nephropathy in patients with type 2 diabetes independently of mean HbA1c during follow-up duration.
Disclosure: T. Kim: None.
806
HbA1c followed 30 years from diagnosis and nephropathy in patients with type 1 diabetes: the Viss study
H. Arnqvist1, M. Fredriksson1, J. Ludvigsson1, M. Nordwall2, VISS Study Group;
1Biomedical and Clinical Sciences, Linkoping University, Linkoping, 2Region Östergötland, Norrköping, Sweden.
Background and aims: HbA1c was introduced in diabetes care in the early 80’s. HbA1c is related to diabetic complications but it is still controversial what HbA1c level to aim for in treatment of type 1 diabetes. Our aim was to study the impact of HbA1c followed from onset of diabetes, on the incidence of nephropathy in an unselected population of patients with type 1 diabetes.
Materials and methods: All 448 patients diagnosed with type 1 diabetes before the age of 35 years during 1983-1987 in a region of South East Sweden were followed 33±3 years (mean±SD). Nephropathy was defined as macroalbuminuria, albumin/creatinine ratio >30mg/mmol. Data about nephropathy was retrieved by a questionnaire to the patient’s physician, from the Swedish Renal Registry and the Swedish National Diabetes Registry (NDR). HbA1c data were collected from the central hospital laboratories in the region and NDR. Long term weighted mean HbA1c (wHbA1c) was calculated by integrating the area under the HbA1c values dividing by time.
Results: For 438 patients follow up data were available about nephropathy. Persistent macroalbuminuria was reported in 29/438 (7%) patients after a mean diabetes duration of 21±7 years, range 9 -34 years (Figure). Long term mean wHbA1c was 83±11mmol/L in patients with macroalbuminuria and 65±11 in patients without macroalbuminuria. 10/438 (2%) had developed terminal uraemia after a diabetes duration of 24±6 years (range16-33 years).
Conclusion: There is a very strong association between long term mean wHbA from diagnosis and development of nephropathy. The prevalence of nephropathy increases with increased duration up to 30 years or more. Low long term mean HbA1c prevent nephropathy in type 1 diabetes.

Supported by: Region Östergötland stipendiefond, Barndiabetesfonden
Disclosure: H. Arnqvist: None.
807
Physical activity in leisure-time rather than at work or housework is associated with a lower risk of diabetic nephropathy: a multicentre cross-sectional study in China
J. Liu1, S. Qiu1, D. Wang1, X. Guo2, Z. Sun1;
1Department of Endocrinology, Zhongda Hospital, Institute of Diabetes, Medical School, Southeast University, Nanjing, 2Department of Endocrinology, Peking University First Hospital, Beijing, China.
Background and aims: There emerges evidence linking the association between physical activity and risk of diabetic nephropathy (DN) in patients with diabetes, yet their conclusions remained inconsistent. Moreover, most studies focused mainly on leisure-time physical activity represented by aerobic or resistance exercise, while none of them investigated the association between other domains of physical activity, such as housework or occupation-related physical activity, and sedentary or sleep behavior, with risk of DN. Therefore, our study was aimed to address this issue using a national cross-sectional sample in urban China.
Materials and methods: Patients with diabetes aged ≥18 years were recruited from 40 tertiary, secondary, and community hospitals across 26 cities in China. Different domains of physical activities were assessed using a questionnaire validated by the Diabetes Care and Education Study Group of the Chinese Diabetes Society. DN is defined according to NKF-K/DOQI (2007) guideline. Multivariate logistic regression analysis with or without adjustment(Model 1: adjustment for sex, age, diabetes duration, and educational level; Model2: additional adjustment for HbA1c, FBG, TC, TG, LDL, HDL, BMI, WHR, blood pressure, medication use, and history of hyperlipidemia, hypertension, cardiovascular or cerebrovascular disease; Model3: additional adjustment for other domains of physical activity except itself), were conducted to investigate the association of different domains of physical activity with risk of DN. Sensitivity analysis using the propensity score matching was also performed.
Results: A total of 4,979 diabetic patients were included. Patients performed leisure-time physical activity meeting the recommendations of ADA 2016 guideline, which are defined as moderate-to-vigorous aerobic exercise more than 150 minutes and resistance exercise at least twice per week, had a lower risk of DN in general (crude OR 0.71, 95% CI 0.62 to 0.82 for aerobic exercise, and 0.66, 95% CI 0.48 to 0.91 for resistance exercise). Yet after adjustment in Model 3, the association of leisure-time physical activity with risk of DN was weakened (OR 0.75, 95% CI 0.58 to 0.97 for aerobic exercise, and OR 0.79 95% CI 0.45 to 1.38 for resistance exercise). Sensitivity analysis using the propensity score matching showed similar results (OR 0.79, 95% CI 0.73 to 0.85 for aerobic exercise, and 0.72, 95% CI 0.61 to 0.84 for resistance exercise). Interestingly, an increased risk of DN was observed for patients with heavier housework physical activity defined as >4 h/day (OR 1.74, 95% CI 1.14 to 2.65) or larger occupation-related physical activity (OR 1.83, 95% CI 1.22 to 2.76). Yet longer sleep duration (>8 h/day) or sedentary time (>4h /day) showed no significant association with risk of DN (both P >0.05) in Model 2 and Model 3. In the subgroup analysis, the association of leisure-time physical activity with risk of DN became pronounced among patients who had longer sleep duration or sedentary time.
Conclusion: The association between physical activity and risk of DN varied across the specific domains of physical activity. It seems that more leisure-time physical activity and less housework or occupation-related physical activity would be beneficial in preventing DN.
Clinical Trial Registration Number: ChiCTR-OCS-14005204
Disclosure: J. Liu: None.
PS 74 The ROCK and role of experimental kidney disease
PS 74 The ROCK and role of experimental kidney disease
808
Pacsin2 phosphorylation at serine 313 is elevated in diabetic kidney disease
R. Bouslama1, V.P. Dumont1, S.H. Lindfors1, L. Paavolainen2, J. Tienari3,4, H.O. Nisen5, T. Mirtti3,6, C. Forsblom1,7, D.T. Gordin1,8, P.-H. Groop1,8, S. Suetsugu9, S.H. Lehtonen1,3;
1Research Program for Clinical and Molecular Metabolism, University of Helsinki, Helsinki, Finland, 2FIMM, HiLIFE, University of Helsinki, Helsinki, Finland, 3Department of Pathology, University of Helsinki, Helsinki, Finland, 4Department of Pathology, Helsinki University Hospital, Hyvinkää, Finland, 5Department of Urology, University of Helsinki, Helsinki, Finland, 6ONCOSYS, Faculty of Medicine, University of Helsinki, Helsinki, Finland, 7Folkhälsan Research Center, Helsinki, Finland, 8Abdominal Center, Nephrology, University of Helsinki and Helsinki University Hospital, Helsinki, Finland, 9Graduate School of Biological Sciences, Nara Institute of Science and Technology, Ikoma, Japan.
Background and aims: We previously found that PACSIN2, which regulates actin organization and protein trafficking, is elevated in the glomeruli of Zucker Diabetic Fatty (ZDF) rats having severe diabetes and renal defects. Interestingly, PACSIN2 can be phosphorylated at serine 313 by Protein Kinase C alpha (PKCα), which is elevated in diabetes. In the present study, we aim to evaluate the phosphorylation status of PACSIN2 in the glomeruli of diabetic kidney disease (DKD) and define the mechanisms via which the phosphorylation of PACSIN2 could contribute to the progression of DKD.
Materials and methods: Quantitative immunoblotting is used to measure PKCα and phosphorylation of PACSIN2 at S313 in isolated rat glomeruli or cultured podocytes. Non-esterified fatty acids (NEFA) content of the sera is measured using a chemistry analyzer. The effect of PACSIN2 and its phosphorylation on the actin cytoskeleton organization in podocytes is analyzed by overexpression of wild-type (WT) PACSIN2 or PACSIN2 constitutively phosphorylated or dephosphorylated at S313 followed by high-content screening.
Results: Phospho-S313-PACSIN2 and total PACSIN2 are elevated in the glomeruli isolated from ZDF rats compared to the glomeruli isolated from lean controls. Phosphorylated PACSIN2 increases after treating human podocytes with sera from individuals with T2D having microalbuminuria compared to treatment with sera obtained from normoalbuminuric individuals. Serum analysis of obese ZDF rats and microalbuminuric patients shows an increase in NEFA compared to controls. Consequently, treating cultured podocytes with palmitic acid, the most abundant circulating NEFA, results in the phosphorylation of PACSIN2 on S313, which can be prevented by pharmacologically inhibiting PKCα. High content screening revealed that overexpression of WT PACSIN2 and constitutively dephosphorylated PACSIN2 induces disruption of the actin cytoskeleton and podocyte morphology.
Conclusion: Our results indicate that PACSIN2 phosphorylation at serine 313 is elevated in diabetic conditions. Based on our in vitro studies, we reason that NEFA trigger the phosphorylation of PACSIN2 via PKCα. We further suggest that phosphorylation at serine 313 affects the capacity of PACSIN2 to regulate the actin cytoskeleton in podocytes.
Supported by: DPBM University of Helsinki, HiLife, Orion Foundation, Sigrid Jusélius Foundation
Disclosure: R. Bouslama: Grants; HiLife, University of Helsinki, Sigrid Jusélius Foundation, Finnish Kidney Foundation, Doctoral Programme in Biomedicine, Diabetestutkimussäätiö.
809
Lin28a attenuates renal fibrosis caused by unilateral ureteral obstruction in mice
Y. Hwang1, G.-S. Jung2, K.-M. Lee3;
1Division of Electronics & Information System, DGIST, Daegu, 2New Drug Development Center, DGMIF, Daegu, 3Division of Biotechnology, DGIST, Daegu, Republic of Korea.
Background and aims: Renal tubulointerstitial fibrosis is a common feature of the final stage of nearly all cause types of chronic kidney disease. Lin28a has diverse functions including regulation of cancer, reprogramming and regeneration, but whether this promotes renal injury or is a protective reaction to injury is unknown.
Materials and methods: We studied how lin28a acts against UUO-induced tubulointerstitial fibrosis. We further defined the role of lin28a on transforming growth factor (TGF)-signaling pathways in renal tubulointerstitial fibrosis through in vitro study.
Results: Here, in TGF-β-stimulated cultured human tubular epithelium-like cells, the expression of lin28a was reduced and the expression of renal fibrotic markers such as type I collagen, α-SMA, vimentin and fibronectin was increased. In the mouse unilateral ureteral obstruction model, obstruction markedly decreased the expression of lin28a, increased the expression of renal fibrotic markers such as type I collagen, α-SMA, vimentin and fibronectin. Adenovirus-mediated overexpression of lin28a inhibited the expression of TGF-β-stimulated type I collagen, α-SMA, vimentin and fibronectin. Lin28a inhibited TGF-β-stimulated Smad3 activity via inhibition of Smad3 phosphorylation but not MAPK pathway such as ERK, JNK or p38. In conclusion, lin28a attenuates renal tubulointerstitial fibrosis in obstructive nephropathy.
Conclusion: These results suggest that upregulation of lin28a during renal injury is a protective response against the development of renal fibrosis.
Supported by: This work was supported by the DGIST project 20-BT-06 and 2019010122 from the Ministry of Science
Disclosure: Y. Hwang: None.
810
Differential expression of ROCK isoforms in diabetic kidney disease
K. Matoba1, Y. Takeda1, Y. Nagai1, T. Akamine1, Y. Kanazawa1, T. Yokota1, D. Kawanami2, K. Utsunomiya3, R. Nishimura1;
1Division of Diabetes, Endocrinology, and Metabolism, The Jikei University School of Medicine, Tokyo, 2Fukuoka University School of Medicine, Fukuoka, 3The Jikei University School of Medicine, Tokyo, Japan.
Background and aims: Rho-associated coiled-coil-containing protein kinase (ROCK) is a serine/threonine kinase implicated in a diverse array of cellular functions (e.g., cell adhesion, migration, gene expression). Experimental efforts over the past decade identified ROCK as a key molecule in the progression of diabetic kidney disease. We have previously demonstrated the activation of ROCK in type 2 diabetic kidneys in animal models. In an attempt to elucidate the pathological roles of the elevated ROCK activity, our laboratory provided evidence that ROCK blockade inhibits the increase of albuminuria, glomerulosclerosis, and podocyte apoptosis in diabetic mice. Mechanistically, ROCK regulates inflammatory cascade and hypoxia-induced fibrotic responses. However, specific roles of each ROCK isoform, ROCK1 and ROCK2, in diabetic kidney is poorly understood.
Materials and methods: In the present study, we investigated the renal expression pattern of ROCK1 and ROCK2 in wild-type mice and normal human kidney samples obtained at necropsy. Gene expression levels of glomerular ROCK2 were also evaluated in diabetic mouse models and patients with type 2 diabetes.
Results: The immunohistochemical analysis revealed the distribution of both ROCK isoforms in the glomerular lesion, tubulointerstitium, and vessel walls. While ROCK1 was predominantly expressed in the cytoplasm, ROCK2 was accumulated in the nucleus of these cells. Double immunostaining with anti-nephrin antibody showed co-localization of ROCK2 with nephrin, suggesting a distinctive function of ROCK2 in the glomerular podocyte. In order to understand the role of podocyte ROCK2, we next investigated mRNA levels of ROCK2 in high-fat diet-fed mice, streptozotocin-injected mice, and patients with diabetic kidney disease. In both mice models and patients, ROCK2 was elevated in the setting of diabetes compared to healthy controls. Importantly, ROCK2 mRNA levels in isolated glomeruli were positively correlated with the increase of albuminuria in mice.
Conclusion: When considered alongside our previous work, the current study highlights the pathological significance of ROCK2 in diabetic podocytopathy.
Supported by: Grant-in-Aid for Scientific Research from Japan Society for the Promotion of Science
Disclosure: K. Matoba: Grants; Grant-in-Aid for Scientific Research from Japan Society for the Promotion of Science, MSD Life Science Foundation, Takeda Science Foundation, Suzuken Memorial Foundation.
811
C-peptide affects glyoxalase 1 level in proximal tubular cells in vitro
E. Krocka, D. Galuska, K. Chalasova, L. Pacal, K. Kankova;
Department of Pathophysiology, Masaryk University, Brno, Czech Republic.
Background and aims: Diabetic kidney disease (DKD) is the most common cause of end-stage renal disease. Therapeutic strategy to prevent DKD progression involves compensation of diabetes and control of blood pressure, lipids and other metabolic parameters. However, even strict control does not have to be efficient enough. Glyoxalase system with enzyme glyoxalase I (GLO-1) is considered a protective pathway as it eliminates reactive aldehyde methylglyoxal that is involved in the development of DKD. C-peptide which has been long considered as an inert molecule, gained attention recently as it shows favourable effect on molecular and organ level in diabetes. It was shown to increase activity and expression of several antioxidants and it improved renal parameters in animal experiments. The aim of the in vitro experiment was to study the effect of C-peptide on GLO-1.
Materials and methods: GLO-1 expression was studied in HK2 cells, an immortalised line of epithelial cell of proximal tubule. Cells were cultured in the basal medium (DMEM + Hams F-12) in four experimental conditions: normoglycaemia (NG), normoglycaemia + C-peptide (NGC), hyperglycaemia (HG) and hyperglycaemia + C-peptide (HGC). Glucose concentration in the medium was 7.2 mmol/l for normoglycaemia and 25 mmol/l for hyperglycaemia. C-peptide concentration was 1 nmol/l in both cases. After culturing cellular proteins were isolated and GLO-1 was quantified using Western blotting with specific antibody and normalised to β-actin.
Results: C-peptide in HG condition was shown to decrease GLO-1 expression compared to NG (P<0.01) and NGC (P=0.03). We also found difference between HG and HGC although statistically not significant (P=0.06).
Conclusion: Physiologic concentration of C-peptide (1 nmol/l) was shown to decrease GLO-1 protein level in hyperglycaemic conditions in HK-2 cell line. Further study is needed to explain this unexpected finding.
Supported by: Czech Health Research Council, grant nr. NV18-01-00046
Disclosure: E. Krocka: None.
812
Glp-1 receptor agonist improves the energy metabolism of mesangial cells induced by high glucose and lipid by regulating mitochondrial homostasis
L. Liu, L. Wang;
Fujian Institute of Endocrinology, Fujian Medical University Union Hospital, Fuzhou, Fujian, China.
Background and aims: Diabetic kidney disease is the main cause of end-stage renal disease. In this study,glomerular mesangial cells were selected and the methods of transcriptome,gene and protein detection, etc were used to explore the mechanism of energy metabolism in diabetic kidney disease.
Materials and methods: The mice glomerular mesangial cells SV40 MES 13 were divided into four groups: control group (C group), high glucose and high fat group(HGHF,GP group), GLP-1 receptor agonist group (EX-GP group), AMPK agonist group(AGP group). CCK-8 was used to detect the cell survival rate, Hochest fluorescent staining was used to test the cell apoptosis rate, RNA-seq was used to sequence the three groups,ELASA was used to check the activity of SDH, PFK, PDH-E1 and the concentration of lactate, Western blot was used to determine the expression of Bcl-2, Bax, Cyt-C, caspase, OPA and p-drp-1, and the gene expression of PFK, CS, OGDH, LC-3, beclin-1, mtDNA, SIRT1 and PGC-1 were detected by RT-PCR.
Results: 1. The apoptosis rate of mesangial cells treated with HGHF increased 6 times, the expression of FN increased 1.3 times (P < 0.05), pretreated by exendin-4 could reduce the apoptosis rate and FN expression.(Fig.1A) 2. Using RNA-seq, there were differences in gene expression among groups. Gene Ontology analysis showed response to endoplasmic reticulum stress, activity,pyruvate kinase activity,ect. include. (Fig.1B) 3. The antioxidant capacity of mesangial cells was restored by exendin-4 pretreatment (Fig.1C P < 0.05). in HGHF group ,the ratio of Bax / Bcl-2, caspase-3 and Cyt-C protein expression increased, resulting in the increase apoptosis rate. exendin-4 pretreatment could improve the above phenomena (Fig.1D P < 0.05). In the GP group, the concentration of lactate increased, the activity of PFK decreased (P < 0.05), in the EX-GP group, the activity of PFK increased and the concentration of lactate decreased (P < 0.05). The activity of SDH increased in EX-GP group (P < 0.05), PDH-E1 decreased in HGHF group (P < 0.05 Fig.1F) 4. Exendin-4 reduced the ratio of mitochondrial dynamic protein p-drp / OPA, increased the fusion of mitochondria, and increased the expression of mtDNA gene (Fig.1E P < 0.05). Exendin-4 could significantly increase the expression of LC3 and beclin-1 (P < 0.05). Exendin-4 pretreated cells increased the expression of SIRT1, PGC-1 or, and partially restored the PFK gene expression inhibited by GP group (Fig.1F P < 0.05).5. AICAR, an activator of AMPK signaling pathway was used. It was found that compared with the HGHF group, the survival rate of cells increased, the concentration of lactate decreased, and the activities of PFK, SDH and PDH-E1 increased (Fig.1G P < 0.05).
Conclusion: GLP-1 receptor agonist exendin-4 can protect mesangial cell from damage induced by HGHF. The mechanism may be related to the improvement of energy metabolism related pathways, including glycolysis, glucose oxygen oxidation, mitochondrial function, mitochondrial dynamics and autophagy.

Supported by: the Natural Science Foundation of Fujian Province, China
Disclosure: L. Liu: None.
813
The GLP-1 receptor agonist liraglutide improves glomerular filtration rate, renal inflammation and fibrosis in the type 2 diabetic SDT fatty rat
F. Briand1, M. Shinohara2, E. Brousseau1, Y. Kageyama2, T. Sulpice1;
1Physiogenex, Escalquens, France, 2Clea Japan Inc, Tokyo, Japan.
Background and aims: The Glucagon-Like Peptide 1 (GLP-1) receptor agonist liraglutide (LIRA) may reduce the rate of development and progression of diabetic kidney disease in type 2 diabetic patients. To evaluate its impact on kidney function, we evaluated the effects of LIRA on glomerular filtration rate (GFR), in both the hyperfiltration and GFR decline phases in the Spontaneously Diabetic Torii (SDT) fatty rat, a preclinical model of type 2 diabetes.
Materials and methods: SDT fatty male rats were treated subcutaneously, once daily with vehicle or LIRA 0.4mg/kg for 10 weeks. To measure the effects of LIRA on glomerular hyperfiltration, rats were injected with FITC-sinistrin at 4 weeks of treatment to measure GFR. After 5 weeks of treatment, rats underwent unilateral nephrectomy and were put on a 0.3% salt diet to induce a GFR decline for the last weeks of treatment, then GFR was measured at 10 weeks of treatment. Urine biochemistry and kidney histology analysis were also performed.
Results: Compared with vehicle, LIRA resulted in significant body weight loss and lower body weight. LIRA also reduced blood glucose levels significantly by up to ~20%, as expected. During the hyperfiltration phase, LIRA attenuated hyperfiltration, with a 19% lower GFR vs. vehicle (vehicle: 21 ± 1.1 mL/min/kg; LIRA: 17.1 ± 1.0 mL/min/kg, p<0.05 vs. vehicle). In vehicle treated animals, unilateral nephrectomy and 0.3% salt diet induced a major reduction (-56%) in GFR, as expected. After 10 weeks of treatment, LIRA markedly attenuated this GFR decline (vehicle: 9.3 ± 0.5 mL/min/kg; LIRA: 13.3 ± 0.9 mL/min/kg, p<0.001 vs. vehicle). In line with the benefits observed on GFR, LIRA lowered urine albumin to creatinine ratio both in the hyperfiltration and GFR decline phases. Moreover, histology analysis showed that LIRA significantly reduced kidney inflammation and fibrosis scores, as compared with vehicle.
Conclusion: In conclusion, LIRA shows significant benefits on GFR, renal inflammation and fibrosis in the SDT fatty rat model.
Disclosure: F. Briand: Employment/Consultancy; Physiogenex.
814
Elabela ameliorate renal lesion in type 2 diabetic mice
M. Shi, W. Gu, H. Zhang;
Endocrinology, The Affilated Huai’an No.1 People’s Hospital of Nanjing Medical University, Huai’an, China.
Background and aims: A crucial role for tubular autophagy dysfunction in diabetic kidney disease (DKD) has been established. ELABELA (ELA), an endogenous ligand for apelin receptor (APJ), exerts a protective effect on ischemia/reperfusion renal injury by activating autophagy and is decreased in plasma of DKD patients. However, the effects of ELA on relieving diabetic renal lesion have not been reported. This study was performed to investigate the potential role and mechanism of ELA on DKD
Materials and methods: Db/db mice and their normal littermates were used in animal experiments, and db/db mice were treated with ELA (5.0mg/kg/day, 8 weeks) or saline. Metabolic parameters, renal function and morphology, extracellular matrix marker FN and COL-IV and autophagy marker LC3 and beclin-1 were examined respectively. In vitro, the human proximal tubular epithelial cells (HK-2 cells) were cultured with high glucose (HG, 30 mM) in the presence or absence of ELA. 3-Methyladenine (3-MA) was employed to determine whether the autophagy was involved in the effect of ELA in HK-2 cells.
Results: We found that ELA was aberrant decreased in the kidney of db/db versus db/m. ELA treatment mitigated renal damage and decreased the expression of FN and COL-IV in db/db mice independent of body weight and glucose. Moreover, ELA induced autophagy in the kidneys of db/db mice characterized by enhanced protein levels of Beclin-1 and LC3-II and LC3-II/I ratio. Consistently, autophagy was inhibited in HK-2 cells in high glucose condition while those effects were reversed by ELA. Pre-treatment of 3-MA blocked the suppressing effects of ELA on the secretion of FN and COL-IV in high glucose.
Conclusion: ELA provided protection against renal damage in db/db mice and HK-2 cells injury induced by high-glucose and that those effects were mediated by regulating autophagy. The results indicated that ELA might be a new therapeutic candidates for DKD.
Supported by: National Natural Science Foundation of China Grant Award (81200595/81400807/81700723)
Disclosure: M. Shi: None.
815
Ntimp3 peptide: a new therapy for diabetic nephropathy
R. Menghini1, V. Casagrande1, G. Iuliani1, S. Menini2, M. Mavilio1, G. Pugliese2, M. Federici1;
1Dept. of Systems Medicine, University of Rome Tor Vergata, Rome, 2Dept. of Clinical and Molecular Medicine, Sapienza University of Rome, Rome, Italy.
Background and aims: loss of TIMP3, an Extracellular matrix (ECM)-bound protein, is a hallmark of diabetic nephropathy in human and mouse models, suggesting its pivotal role in renal diseases associated to diabetes. There is currently no specific therapy for diabetic nephropathy and the ability to restore high TIMP3 activity specifically in the kidney may represent a potential therapeutic strategy for the amelioration of renal injury under conditions in which its reduction is directly related to the disease. To strengthen the kidney-specific uptake of TIMP3, we generated a new peptide based on the human TIMP3 N-terminal domain, specifically conjugated with a carrier peptide highly selective and efficient for transport to the kidney (Car), and we tested it as potential new drugs for diabetic nephropathy in in vivo model of long-term diabetic renal pathology.
Materials and methods: DBA/2J mice, were rendered diabetic at 8 weeks of age with a low-dose STZ protocol. 4 weeks after the day of diabetes onset, PBS, Car and Car-NTIMP3 were administered by iv injection for 8 weeks (n=10 mice per group). At the end of the treatment albuminuria was determined by ELISA, and kidneys were processed for histology and morphometric analysis. Kidney samples were also analyzed by IHC and western blot.
Results: in diabetic mice, Car-NTIMP3 peptide treatment results in a significant and consistent decline in albuminuria (p<0,01) along with reduction in renal lesions, as assessed by lower increase in mGA (p<0,0001), mMA (p<0,0001) and fMA (p<0,0001), in the reduction of markers of fibrosis and oxidative stress, as determined respectively by Type IV collagen and NOX4 staining (p<0,001) and in the improvement of podocyte structural markers such as WT1 and podocin (p<0,01), compared to PBS or Car treatments. The positive effects of the drug are exerted through a mechanism independent from glycemic control and no toxic effects have been observed at behavioral level and through hematological and biochemical analysis.
Conclusion: Our data indicate that the treatment with the new Car-NTIMP3 peptide may prevent or otherwise delay kidney injury induced by diabetes, representing a valid approach to characterize the pathogenesis of diabetic nephropathy and to develop new biological drugs for its prevention and treatment.
Supported by: EFSD/Boehringer Ingelheim Programme 2017
Disclosure: R. Menghini: None.
PS 75 New tools to view diabetic retinopathy
816
Waist-height ratio is a predictor of severe retinopathy in adults with type 1 diabetes
E.B. Parente1,2, V. Harjutsalo1,3, C. Forsblom1,4, P.-H. Groop2,4, on behalf of the FinnDiane Study Group;
1Folkhälsan Institute of Genetics, Folkhälsan Research Center, Helsinki, 2Research Program for Clinical and Molecular Metabolism, Faculty of Medicine, University of Helsinki, Helsinki, 3National Institute for Health and Welfare, Helsinki, 4Abdominal Center, Nephrology, University of Helsinki and Helsinki University Hospital, Helsinki, Finland.
Background and aims: Diabetic retinopathy, a common microvascular complication of diabetes, may progress to severe diabetic retinopathy (SDR), and even to blindness. The worldwide increase in obesity has affected people with type 1 diabetes (T1D) similarly. Although obesity is causally related to diabetic nephropathy, it is still not known whether obesity and central fat are related to SDR in T1D. Therefore, we investigated the relationship between body composition and SDR and sought to find an anthropometric measure to predict the risk of SDR in this population.
Materials and methods: From 5401 individuals with T1D in the Finnish Diabetic Nephropathy Study, 1791 laser-treated, 448 with end-stage renal disease and 350 with macroalbuminuria at baseline were excluded. We assessed 3225 individuals of which 438 underwent dual-energy-X-ray-absorptiometry for body composition analysis. Visceral fat was measured by CoreScan and appendicular refers to both arms and legs. Subgroup analyses were done according to urinary albumin excretion rate (UAER): normoalbuminuria (UAER < 30 mg/24h) and microalbuminuria (UAER ≥ 30 and < 300 mg/24h). Multivariable Cox-regression analysis adjusted for traditional SDR risk factors was performed to estimate the impact of anthropometric measures on SDR risk. Logistic regression analysis evaluated the association between body composition variables (scaled for 10) and prevalence of SDR, adjusted for the same risk factors. The primary outcome was SDR, defined as laser treatment, proliferative retinopathy or diabetic maculopathy identified from the Care Register for Health Care until the end of 2017. The relevance ranking of each variable was based on the z statistics.
Results: At baseline median age was 31.8 (IQR 23.8-43.3) years, 52.2% were female and median duration of diabetes 14.9 (8.0-23.1) years. There were 827 incident SDR events during median follow-up of 14.8 (IQR 7.7-17.5) years. The body composition variables most strongly associated with SDR were visceral fat mass/android fat mass [OR 1.27, (95% CI 1.06-1.52), z=2.62], android fat mass/appendicular lean mass [1.85, (1.14-2.99), z=2.49], and appendicular lean mass/total body weight [0.36, (0.15-0.87), z=-2.26]. Waist-height ratio (WHtR) was the best predictor of SDR [HR=1.37 for 0.1 increase, 95% CI (1.20-1.57), z= 4.50], followed by waist circumference [1.02 for 1cm increase, (1.01-1.02), z=3.62], body mass index [1.04, (1.02-1.06), z=3.44] and waist-hip ratio [1.17 for 0.1 increase, (1.03-1.33), z=2.43]. The ranking order was the same in the subgroup analyses (normo or microalbuminuria), although waist-hip ratio was no more a predictor of SDR. The risk of SDR was 33% higher in individuals with WHtR ≥0.5 versus those <0.5.
Conclusion: Central obesity and low lean mass are strongly associated with SDR and a simple measure such as WHtR is a good predictor of SDR risk in adults with T1D irrespective of the presence or absence of microalbuminuria. In a clinical perspective, this study supports the inclusion of WHtR into the routine consultations of people with T1D.
Supported by: Folkhälsan Res. Fdn, Academy of Finland, Wilhelm and Else Stockmann Fdn, Liv och Hälsa Soc., NNF
Disclosure: E.B. Parente: Grants; Folkhälsan Research Foundation, Academy of Finland, Wilhelm and Else Stockmann Foundation, Liv och Hälsa Society, Helsinki University Central Hospital Research Funds, Novo Nordisk Fdn.
817
Deep learning for classification of laterality of retinal fundus images
L. Díaz1, D. Vistisen1, M. Eika Jørgensen1,2, M. Valerius1,3, J. Nouri Hajari1,3, H.L. Andersen1,3, S. Byberg1;
1Dpt. of Clinical Epidemiology, Steno Diabetes Center Copenhagen, Copenhagen, 2National Institute of Public Health, Copenhagen, 3Dpt. of Ophtalmology, University Hospital Glostrup, Copenhagen, Denmark.
Background and aims: It is recommended that persons with diabetes attend eye screening regularly to prevent vision loss from diabetic retinopathy. Retinal fundus images, obtained from routine eye screenings, contain important information, not only concerning microvascular lesions of the retina, but potentially also of the progression and manifestation of various other diabetes complications and their interrelationship. Recent advances in the field of machine learning, so-called deep learning neural networks (DNN), have made it possible to automatically detect retinal lesions from fundus photos. Our overall aim is to develop a DNN to detect retinal vascular lesions. In this abstract, we describe part of the pre-processing of retinal fundus photos using a DNN.
Materials and methods: At each eye screening, 5 retinal images of parts of the eye are taken, and collected into a joint mosaic image, used for image grading. In the database, there is no labelling of the images to identify left or right eyes. To distinguish left- from right eye images, we used a set of 1,916 unique, high-definition retina mosaic fundus images from individuals with diabetes in the period 2003-2017. We trained and validated a DNN, using 964 left-eye (training set: 713, validation: 251) and 952 right-eye images (training set: 706, validation: 246). A DNN is a method that finds the optimal algorithm for relating a large set of input (mosaic fundus images) to output (left or right eye). The DNN used, was based on the InceptionV3 architecture and run for 100 epochs with 100 gradient descent steps pr. epoch.
Results: The DNN classification obtained a validation AUC-ROC of 0.92 and a validation accuracy of 0.86.
Conclusion: The DNN successfully distinguished left-eye from right-eye images. We plan to use the DNN to identify right- and left-eye images in an image database comprising ~ 80,000 mixed left-eye and right-eye images. We will subsequently develop a DNN for automated detection of referable diabetic retinopathy of the retinal fundus images, for use in the clinic.
Disclosure: L. Díaz: None.
818
Reteval electroretinography in diabetic retinopathy: real world experience and novel applications
E.J. Tabet1,2, J. Wong1,2, T. Wu1, M.I. Constantino1,2, M. McGill1,2, B. Wu1, L.M. Molyneaux1, S.M. Twigg1,2;
1Diabetes Centre, Royal Prince Alfred Hospital, 2University of Sydney, Sydney, Australia.
Background and aims: Diabetic retinopathy (DR) remains the leading cause of working-age blindness among adults in developed countries. RETeval is a handheld, non-mydriatic DR screening instrument utilising electroretinography and pupillary responses to generate a score for predicting presence of vision-threatening diabetic retinopathy (VTDR). We aimed to: (i) validate the utility of RETeval as a screening test for VTDR in a real-world setting; and (ii) examine for a relationship between abnormal RETeval parameters and other microvascular complications.
Materials and methods: A retrospective study was conducted at our Centre. RETeval data from 420 patients in our database were analysed against their retinopathy classification, urine albumin, and lower-limb biothesiometer (bio) reading (V) and Z-score for peripheral neuropathy (PN).
Results: An abnormal RETeval score (≥20) showed by ROC-curve analysis 85% sensitivity and 78% specificity (AUROC 0.91) for detecting VTDR in our cohort. The same value of ≥20 (a composite of nerve-conduction velocity expressed as implicit time 32 Td.s (IT) and reduced nerve conduction amplitude) had 51% sensitivity and 75% sensitivity (Χ2= 11.5; p= 0.0007; AUROC 0.67), for detection of macroalbuminuria (> 300mg/L). Early pathological changes in the retinal IT alone associate more with PN Z-score >1.5 (Χ2= 8.8; p=0.01) or bio > 40V (Χ2= 40.3; p < 0.0001; AUROC 0.65) than with any albuminuria or VTDR.
Conclusion: RETeval is an efficient and highly accurate screening test for VTDR in a real-world setting. It has successfully identified at-risk patients in our cohort requiring ophthalmology review. These data suggest that the RETeval score has added utility in the prediction of concurrent macroalbuminuria. Finally, we postulate that early abnormalities in IT may detect early retinal neuropathy, also linking to PN. This finding suggests a common pathway of systemic neurodegeneration that precedes more severe structural microvascular eye disease.
Disclosure: E.J. Tabet: None.
819
Circulating metabolites in relation to presence and development of diabetic retinopathy in individuals with type 1 diabetes
V. Rotbain Curovic, T. Suvitaival, I. Mattila, K. Trošt, S. Theilade, T.W. Hansen, C. Legido-Quigley, P. Rossing;
Steno Diabetes Center Copenhagen, Gentofte, Denmark.
Background and aims: Metabolomic methods can be used as a powerful tool to identify novel pathways and pathophysiological mechanisms of interest in relation to diabetic retinopathy (DR). Using this method, we investigated a wide panel of circulating metabolites in relation to presence, progression, and onset of DR in type 1 diabetes.
Materials and methods: Metabolomic analyses were performed using two-dimensional gas chromatography with time-of-flight mass spectrometry in 648 individuals with type 1 diabetes. Subjects were sub-divided into: no DR, mild non-proliferative DR (NPDR), moderate NPDR, severe NPDR and proliferative DR. Cross-sectional relationships between single metabolites and baseline DR stages were assessed using multivariate linear regression models adjusted for relevant clinical variables. Thereafter, the single measures were cross-sectionally associated to categories of DR stage and tested using ANCOVA. The Benjamini-Hochberg method (pBH) was used to correct for multiple testing for presented P-values. Metabolites with pBH<0.05 in the adjusted cross-sectional model were included in survival analysis with the Cox proportional hazards model for the following endpoints: any progression of DR (progression from any DR stage to any other higher DR stage), onset of DR (progression from no DR to any other DR stage) and proliferation of DR (progression from no DR or NPDR to proliferative DR) tracked from standard ambulatory care. All analyses were adjusted for the following variables: age, sex, HbA1c, systolic blood pressure, smoking, body mass index, triglycerides, LDL cholesterol, and prescribed antihypertensive medication or statins.
Results: The cohort consisted of 648 participants aged mean 54.4±12.8 years, 55.5% were male, and follow-up was 5.1-5.5 years. The distribution of subjects across DR stages were 22%, 14%, 29%, 19%, and 17% for no DR, mild NPDR, moderate NPDR, severe NPDR and proliferative DR respectively. Cross-sectionally, in multivariable linear regression models, 2,4-dihydroxybutyric acid (2,4-DHBA; pBH<0.001), ribonic acid (pBH=0.017), ribitol (pBH=0.032), and 3,4-DHBA (pBH=0.036) were significantly positively correlated to higher DR stage. This was confirmed with ANCOVA, as all four metabolites remained associated to DR stage categories (pBH≤0.041) and were thereafter included in subsequent analyses. Longitudinally, higher 3,4-DHBA was a risk marker for any progression of DR (n=133), but neither for onset (n=47), nor proliferation of DR, (n=29) after adjustment (p=0.033).
Conclusion: 2,4- and 3,4-DHBA, ribonic acid and ribitol were positively correlated to higher grade of DR in type 1 diabetes. Furthermore, higher 3,4-DHBA was an independent risk marker for progression of DR, however, confirmatory studies are required.
Disclosure: V. Rotbain Curovic: None.
820
The circulating lipidome in diabetic retinopathy
T. Suvitaival, V.R. Curovic, L. Ahonen, S. Theilade, T.W. Hansen, C. Legido-Quigley, P. Rossing;
Steno Diabetes Center Copenhagen, Gentofte, Denmark.
Background and aims: Retinopathy is a dreadful complication that with some level of severity affects nearly all persons with long-standing type 1 diabetes (T1D). Understanding the pathogenesis of diabetic retinopathy (DR) is crucial to preventing or delaying its onset. Here, we investigated the circulating lipidome to uncover patterns that could bring insights into the pathogenesis of DR.
Materials and methods: In this cross-sectional study of 632 persons with T1D, retinopathy was determined as no DR, mild non-proliferative DR (NPDR), moderate NPDR, severe NPDR or proliferative DR. Blind participants were not included. Plasma lipid levels were measured with non-targeted liquid-chromatography mass-spectrometry. Association to retinopathy was tested with lipid-specific regression models adjusted for age, BMI, duration of T1D, HbA1c, sex, smoking, systolic BP, total cholesterol, total triglycerides, and prescription of antihypertensive medication and statins. Associations corrected for multiple testing were reported. Results were visualized as a lipidome-wide association heatmap using the lipidomeR package for R.
Results: Complete clinical data and a lipidomic profile were available from 632 persons, of whom 138, 90, 181, 118 and 105, respectively, had no DR, mild NPDR, moderate NPDR, severe NPDR and proliferative DR. Clinical characteristics (mean (sd)) were as follows: age 55 (13) years, BMI 25.5 (5.9) kg/m2, duration of T1D 32 (16) years, HbA1c 64 (13) mmol/mol and 54 % male. In total, 120 lipids from five classes were identified (LPC: lyso-phosphatidylcholine, PC: phosphatidylcholine, PC-O/P: alkyl-acyl phosphatidylcholine, SM: sphingomyelin, TG: triacylglycerol; see Figure). All associations between lipid levels and DR with statistical significance were inverse. Highest number of associations to DR were in TGs, where the 50-carbon TGs 50:1, 50:2, 50:3 and TG(52:2) were reduced in DR (see the TG panel in the Figure). Furthermore, PC(32:1), PC(33:1) and LPC(16:1) were reduced in DR (see the PC and LPC panels in the Figure).
Conclusion: Lower levels of short mono-unsaturated phospholipids were discovered in DR. Lower levels were also observed in mid-sized unsaturated TGs. These findings indicate a disruption in the balance of lipids in DR, where short and medium-sized unsaturated lipids are reduced while saturated and large lipids remain unchanged. The analyses were adjusted to key clinical factors, including clinical lipid measurements, indicating that the found associations are independent of the total lipid levels and other risk factors. Figure: Lipidome-wide heatmap of associations with diabetic retinopathy (DR). Lipids are grouped into panels by class and organized by species size (x-axis) and species degree of unsaturation (y-axis). Association to DR is shown by color (red: positive; blue: inverse), where each colored rectangle corresponds to one lipid species. Associations with multiple-testing-corrected p < 0.01, 0.05 and 0.1, respectively, are highlighted by asterisk, cross and plus signs.

Disclosure: T. Suvitaival: None.
821
Prevalence of diabetic retinopathy in Chinese hospitalised patients with type 2 diabetes, 2016-2018
Y. Yuan, C.C. Wang, H.S. Wang;
Southeast University, Nanjing, China.
Background and aims: The prevalence of diabetes in China has increased. Diabetic patients are at risk for diabetic retinopathy (DR). No recent hospital population-based estimate of the prevalence and severity of diabetic retinopathy among Chinese diabetic patients exists.To estimate the prevalence of diabetic retinopathy in hospitalized patients with type 2 diabetes mellitus (T2DM), and the risk factors.
Materials and methods: A total of 14488 hospitalized patients with T2DM was investigated, and eventually 1172 participants had complete demographic and clinical data, including two fundus photographs taken of each eye with a digital nonmydriatic camera.. The age-standardized prevalence of DR was calculated based on the sixth population census in China, and multivariate logistic regression analysis was used to analyze the risk factors.
Results: The crude prevalence of DR was 22.4% and an standardized prevalence was 23.9% (24.7% and 23.1% in men and women, respectively). Men aged 40-49 and women aged 30-39 had the highest prevalence of DR (28.0% and 28.6%, respectively), men and women aged over 70 had the lowest prevalence (15.8% and 11.9%, respectively). Multivariate regression analysis showed that the risk of DR rised by 1.34 per 5 years additional diabetes duration (95%CI 1.112-1.601, P<0.001) and decreased 33.2% per 10 years increased since diagnosis of diabetes (95%CI 0.573-0.778, P<0.001). Additionally, higher levels of fasting blood glucose, apolipoprotein A1, urea nitrogen and fibrinogen were all risk factors of DR in diabetic patients (OR was 1.190, 1.204, 1.250 and 1.199, respectively, all P <0.05).
Conclusion: In China, prevalence of DR is rather high, especially among the young or long-duration patients with diabetes. Early scanning and risk factors e.g hyperglycemia and dyslipidmia controlling are important to prevent DR.
Clinical Trial Registration Number: 2020ZDSYLL028-P01
Supported by: NSFC
Disclosure: Y. Yuan: None.
PS 76 Diabetic retinopathy: screening and intervention
822
In South Asian diabetics a first major adverse cardiovascular event occurs after a shorter diabetes duration irrespective of the degree of retinopathy
J. van Niel1, P.H. Duijvestijn1, M.H. van Heugten1, M.E. Numans2, R.C. Vos2;
1Internal Medicine, Haaglanden Medical Centre, The Hague, 2Public Health and Primary Care LUMC, Leiden Univerisy Medical Center/LUMC campus, Leiden/The Hague, Netherlands.
Background and aims: It has been suggested that in type 2 diabetic patients even a mild stage of diabetic retinopathy already gives a higher risk of cardiovascular disease (CVD) and stroke, independent of traditional risk factors. People form South Asian descent are known to have more severe diabetic retinopathy and more CVD than white Caucasians. Most of South Asians that came from Suriname live in The Hague region and are treated in our diabetes clinic. Therefore, we studied the association between diabetic retinopathy and first Major Adverse Cardiovascular Event (MACE) in our cohort of South Asians compared to native Dutch patients.
Materials and methods: All 3831 adults with type 2 diabetes, 1358 South Asian Hindostani and 2473 native Dutch patients, treated in our diabetes clinic between 2006-2017 were studied. Data on age of diagnosis, smoking habits (never, former, current), micro- and macrovascular complications and cause of death were extracted from the electronic medical records. Socioeconomic status was categorized by postal code (low, normal and high). Diabetic retinopathy was defined as: no-, mild or moderate (non-proliferative) only and severe (proliferative, laser coagulation and macula edema). MACE was defined as stroke, myocardial infarction, cardiovascular death, coronary artery bypass or percutaneous coronary intervention and peripheral artery surgery or percutaneous transluminal angioplasty. Descriptive statistics, Cox regression analysis and hazard ratios, stratified by retinopathy group, with diabetes duration until first MACE as outcome and ethnicity as determinant, adjusted for smoking, sex, age at diagnosis and socioeconomic status were performed with SPSS 26.
Results: 54% of Hindustani never smoked versus 32% of native Dutch. Hindustani have more severe DRP and when DRP is present they have more MACE and time until MACE is ±7 years shorter, OR 2.0 (CI 1.5-2.6) . See Table.
Conclusion: With increasing severity of DRP more MACE events were found in both groups. However, Hindostani have more severe DRP and when DRP is present they also have significantly more MACE and after a shorter diabetes duration. This might be due to the fact that Hindostani have a similar phenotype, whereas the phenotype of Caucasians varies from insulin deficient to severe insulin resistant with different risks of complications.

Disclosure: J. van Niel: None.
823
Low levels of the circulating anti-ageing hormone Klotho predict the progression of diabetic retinopathy
N. Fountoulakis, A. Corcillo, A. Sohal, F. Farrow, A. Mangelis, S. Ayis, J. Karalliedde;
King's College London, London, UK.
Background and aims: Klotho is a circulating anti-ageing hormone with anti-oxidative and anti-inflammatory properties that has demonstrated vascular protective effects in animal studies. Recent data suggests that low levels of circulating Klotho predict increased risk of progression of cardiovascular and renal disease. The role of Klotho in patients with diabetic retinopathy is unknown.
Materials and methods: We performed a single-centre observational follow-up study of 81 people (males 62%) with Type 2 diabetes (all with an estimated glomerular filtration rate >30 ml/min) followed for a median of 44 months. The primary outcome was progression of retinopathy defined as new onset retinopathy or step change in retinopathy grading. Retinopathy was evaluated by monoscopic fundus photos of dilated pupils using a nonmydriatic camera). Digital retinal images were graded according to the United Kingdom National Health Service Diabetic Eye Screening Program. Soluble Klotho, serum phosphorus, serum calcium, and fibroblast growth factor-23 (FGF-23) levels were measured from stored samples collected at baseline. Clinical, biochemical and anthropometric data were collected from electronic health records.
Results: The mean age (range) of our cohort was 61 (48 to 78) years with a median diabetes duration of 11.8 years. Baseline median (interquartile range-IQR) circulating Klotho levels were 265 (184.7 to 567.78) pg/ml. At baseline 47 people (57%) had diabetic retinopathy. During the follow up observation period 46 (56%) people had progression of retinopathy. People with progression of retinopathy as compared to those without had lower levels of Klotho (median (IQR) 226.9 (171.1 to 394.0) vs 484.5 (221.8 to 709.9) p=0.001. The only other parameters that were significantly different between the two groups were serum calcium and estimated glomerular filtration rate (eGFR). In multivariable logistic regression analyses baseline Klotho levels were associated with reduced risk of progression of retinopathy independent of eGFR, calcium levels and traditional risk factors for retinopathy progression (e.g. systolic and diastolic blood pressure measures, HbA1c, duration of diabetes). Our results suggest that a halving of Klotho levels increases the risk of retinopathy progression by 44%.
Conclusion: In our cohort of people with Type 2 diabetes lower circulating levels of the vascular protective hormone Klotho are associated with increased risk of progression of diabetic eye disease. Klotho may be a novel biomarker of diabetic retinopathy and a potential treatment target for diabetic eye disease.
Disclosure: N. Fountoulakis: None.
824
Diurnal rhythms of myeloid cells infiltration in the diabetic retina
E. Beli1, R. Silk1, C. Evans-Molina2, M. Grant3;
1Wellcome Wolfson Institute for Experimental Medicine, Queen's University Belfast, Belfast, UK, 2Center for Diabetes and Metabolic Diseases, Indiana University, Indianapolis, USA, 3Department of Ophthalmology, University of Alabama, Birmingham, USA.
Background and aims: Diurnal rhythms govern both circulation but infiltration of leukocytes into the tissues. Recent evidence suggests an interplay between metabolism and the circadian clock and diabetes is long been suspected to affect circadian rhythmicity. We hypothesized that Type 1 diabetes affects the diurnal rhythmicity of immune cell infiltration into the retina. Thus, we performed a multicolor immunofluorescence phenotyping of the time of the day at which leukocytes infiltrate the retina in control and diabetic mice.
Materials and methods: We used the Ins2Akita mouse model as a model of diabetes induced hyperglycemia. Four months old control and diabetic mice were euthanized at certain time points of a ZT cycle (ZT1, ZT5, ZT9, ZT13, ZT17, ZT21, where ZT= Zeitgeber Time, ZT=0, lights on), n=4-8 per time point, male mice. Mice were perfused with PBS and tissues were isolated and either were prepared for single cell suspensions or snap frozen. Multicolor flow cytometry (antibodies for CD45, CD11b, Ly6G, Ly6C, CD115, F4/80, CD11c, CD19, CD3, NKp46 and CD43) was employed to dissect the composition of immune cells in the retina at each time point. Control gating was drawn based on FMOs and comparison to splenic composition. Cosine function was used to identify if there is a circadian rhythmicity.
Results: Overall, a complex immune cell landscape of the retinal parenchyma (perfused retinas) was identified with various subtypes of macrophages and dendritic cells that cannot be accurately identified with the markers used in this study. Differences in the subset composition of infiltrating cells into the retina were identified between control and diabetes. Specifically at ZT1 there were statistically significant more (p<0.05) dendritic cells and monocytes in the retinas of diabetic mice but this was normalized at later times. Rhythmic behavior was identified not only in the infiltrating CD45hi cells but also in microglia with peak time around the early morning hours. The only exception was the CD11blo F480hi myeloid cells, whose numbers peaked during the late hours of the day (ZT13).
Conclusion: These data indicate that the infiltration of immune cells into the retina is not static but changes throughout the day. It also demonstrates that at early hours of the day there is higher immune cell infiltration in the diabetic mice compared to control. Altogether, these data inform us for the optimal timing of therapeutic targeting immune cell activation in the retina.
Supported by: 1-FAC-2019-878-A-N
Disclosure: E. Beli: None.
825
Effects of fenofibrate on hematopoietic stem/progenitor cells in patients with diabetes and retinopathy: a randomised placebo-controlled trial
B. Bonora, R. Cappellari, M. Mazzucato, A. Avogaro, G. Fadini;
Department of Medicine, University of Padova, Padova, Italy.
Background and aims: Long-standing diabetes is often complicated by retinopathy. The mechanisms that induce the development of diabetic retinopathy are incompletely understood and include alterations in bone marrow derived hematopoietic stem/progenitor cells (HSPCs) and endothelial progenitor cells (EPCs). Fenofibrate is a PPAR-alpha agonist that lower triglyceride-rich lipoproteins but exerts several additional benefits on the vessel wall, including reduction of inflammation. In a trial conducted in type 2 diabetic individuals, fenofibrate reduced retinopathy-related endpoints, suggesting a direct effect of the drug on the mechanisms that drive the development of this complication. Preliminary data show that fenofibrate has the potential to improve HSPC survival in vitro and, consequently, may benefit patients with retinopathy. Herein, we tested whether a treatment with fenofibrate increases HSPC and EPC levels in diabetic subjects with retinopathy, compared to placebo.
Materials and methods: Individuals with type 1 and type 2 diabetes and diabetic retinopathy were randomized to receive fenofibrate 145 mg or matching placebo for 12 weeks. HSPC (CD34+, CD133+, CD34+CD133+, CD34+CD45dim) and EPC (CD34+KDR+, CD133+KDR+, CD34+CD133+KDR+) were measured by flow citometry at baseline and at study end. The primary end-point was the change in HSPC and EPC levels in fenofibrate-treated versus placebo-treated subjects over 12 weeks.
Results: Forty-two individuals were enrolled in the study, n=21 in the fenofibrate group and n=21 in the placebo group. One subject in the placebo group was lost to follow-up. Subjects were on average 57 years old, with a known diabetes duration of 18.2 years and a baseline HbA1c of 59 mmol/mol. A treatment of 12 weeks with fenofibrate was effective in reducing triglycerides (from 121.9 to 96.5 mg/dl, p=0.014). After 12 weeks, HSPCs increased significantly in the fenofibrate group whereas EPCs increased non-significantly. In the placebo group, HSPCs and EPCs decreased non-significantly or remained stable. The change from baseline of all HSPC phenotypes was significantly different between the two groups (Figure).
Conclusion: A treatment of 12 weeks with fenofibrate significantly increases HSPCs in diabetic subjects with retinopathy. Thus, the beneficial effect of fenofibrate on diabetic retinopathy could involve the modulation of stem/progenitor cells.

Clinical Trial Registration Number: NCT01927315
Disclosure: B. Bonora: None.
826
Effect of l-type calcium channel blockers on vegf secretion in retinal cells
A. Kumar1,2, S. Mutter1,2, M. Lehto1,2, P.-H. Groop1,2, on behalf of FinnDiane study group;
1Folkhälsan Research Center, Helsinki, 2Research Program for Clinical and Molecular Metabolism, Faculty of Medicine, University of Helsinki, Helsinki, Finland.
Background and aims: Vascular endothelial growth factor (VEGF) plays a crucial role in the progression of diabetic retinopathy (DR), the worldwide leading cause of blindness and vision impairment in the adult population. L-type calcium channel blockers are frequently used as antihypertensive medication in individuals with diabetes. Evidence suggests that L-type calcium channel blockers may impact VEGF levels. Therefore, in this study, we tested effects of amlodipine, a widely used L-type calcium channel blockers, on the VEGF secretion in cells of retinal origin in vitro.
Materials and methods: A Muller cell line (MIO-M1) was cultured in accordance with established protocols. Amlodipine (A5605, Sigma-Aldrich) was dissolved in DMSO under sterile conditions. Cells were treated with 10μM of amlodipine and with DMSO as control. Cell culture medium was collected and replaced with fresh medium containing DMSO/amlodipine every 24 hours interval until the end of the experiment at 96 hours. Secreted VEGF in cell culture medium was measured using human VEGF quantikine ELISA kit (DVE00, R&D Systems) as per manufacturer’s protocol. Statistical analyses were done using student t-test, two samples equal variance.
Results: The levels of VEGF secretion in the cell culture medium were at 24 hours : control=149± 2 pg/ml, amlodipine= 226±4 pg/ml (P < 0,001), at 48 hours : control=166±3 pg/ml, amlodipine= 283± 12 pg/ml (p<0,005), at 72 hours : control=190± 29 pg/ml, amlodipine= 435.6±60.2 pg/ml (P<0,035), at 96 hours, control=165±1 pg/ml, amlodipine= 600±72 pg/ml (P<0,013).
Conclusion: Our data suggest a time-dependent effect of amlodipine on the VEGF secretions in cells of retinal origin in vitro. The currently available treatment options for severe DR include intravitreal injections of anti-VEGF antibody. Our findings suggest that L-type calcium channel may be a novel molecular target in retinal cells involved in VEGF secretion and possibly retinal neovascularization. These results warrant further clinical studies to evaluate the effects L-type calcium channel blockers in individuals with DR.
Disclosure: A. Kumar: None.
827
DPP-IV inhibitors for treating early stages of diabetic retinopathy in an experimental model: a dose-efficacy study
H. Ramos1,2, P. Bogdanov1,2, J. Sampedro1,2, M. Valeri3, R. Simó1,2, C. Hernández1,2;
1Diabetes and Metabolism Research Unit, Vall d'Hebron Research Institute, Barcelona, 2CIBERDEM, Madrid, 3Unit of High Technology, Vall d'Hebron Research Institute, Barcelona, Spain.
Background and aims: Neurovascular unit (NVU) plays an essential role in the development of diabetic retinopathy (DR). In recent years several studies have demonstrated the efficacy of GLP-1 in preventing and arresting the progression of neurodegeneration and vascular leakage (two essential features of NVU impairment) in experimental diabetes. Since GLP-1 is rapidly degraded by the enzyme dipeptidyl peptidase IV (DPP-IV), which is also present at low concentrations in the retina, the inhibition of DPP-IV was postulated as a new therapeutic strategy for treating early stages of DR pathway. In fact, in a previous study we demonstrated that DPP-IV inhibitors (DPP-IVi) prevents retinal neurodegeneration and vascular leakage in db/db mice. The aim of the study is to examine the dose-response effect of topical administration of DPP-IVi.
Materials and methods: Two different DPPIVi (sitagliptin and saxagliptin) at different concentrations (5 and 10 mg/mL for sitagliptin, and 1 and 10 mg/mL for saxagliptin) one or twice per day were tested. They were administered for 2 weeks and compared to vehicle. Non-diabetic db/+ mice were used as control group. We evaluated reactive gliosis (GFAP immunostaining and WB), neural apoptosis (cell counting), vascular leakage (Evans blue), retinal inflammation (IL-1 β, IL-6, TNFα and NFKB expression), and GLP-1R activation by assessing AKT phosphorylation.
Results: Our results suggest that both DPP-IVi were effective in preventing the dysfunction of the NVU. This prevention was observed without any changes in blood glucose levels. Both, sitagliptin and saxagliptin showed a dose-dependent effectiveness in preventing glial activation, neural death, overexpression of pro-inflammatory cytokines and vascular leakage. In addition, a dose-dependent AKT activation was observed.
Conclusion: Our findings confirm the beneficial effects of DPP-IVi in preventing neurovascular dysfunction in early stages of experimental DR, and reveal that this effect is dose-dependent. These results could help in the design of clinical trials aimed at treating early stages of DR.
Supported by: ISCIII (DTS18/00163)
Disclosure: H. Ramos: None.
PS 77 Focus on diabetic foot ulcers
828
Incidence of first diabetic foot ulcer, hospitalisation and mortality in people with diabetes from the primary care setting in the United Kingdom
J. Roeikjer1, F. de Vries2, N. Ejskjaer1, J.P.W. van den Bergh3, P. Vestergaard1, N.C. Schaper3, M. Hasselstrøm4, O. Klungel5, J.H.M. Driessen6;
1Dept. of Endocrinology, Steno Diabetes Center North Jutland, Aalborg, Denmark, 2Division of Pharmacoepidemiology & Clinical Pharmacology, Utrecht Institute for Pharmaceutical Sciences, Maastricht, Netherlands, 3Department of Internal Medicine, Maastricht University Medical Centre, Maastricht, Netherlands, 4Steno Diabetes Center North Jutland, Aalborg, Denmark, 5Division of Pharmacoepidemiology & Clinical Pharmacology, Utrecht Institute for Pharmaceutical Sciences, Utrecht University, Maascticht, Netherlands, 6Cardiovascular Research Institute Maastricht (CARIM), Maastricht, Netherlands.
Background and aims: Diabetic foot ulcers are a severe condition associated with significant morbidity and mortality. Studies in incidence and outcome are rare and often limited by access to reliable data from the primary care setting in particular. The aim of the study was to examine overall incidence and trends in first diabetic foot ulcer in people with type 1 and type 2 diabetes from the primary care setting in the United Kingdom. We also examined hospitalisation-rate and all-cause mortality following first diabetic foot ulcer in people with type 2 diabetes.
Materials and methods: From the Clinical Practice Research Datalink GOLD we identified and sub-grouped 76,245 people with diabetes between 1987 and 2017 by a prescription for insulin or a non-insulin anti-diabetic drug. First diabetic foot ulcers were identified between 2007 and 2017 using Read codes. Trends were described using least-squares linear regression and expressed as incidence rate per 1,000 person-years.
Results: The mean incidence rate of first diabetic foot ulcer was 1.3% [CI: 0.9%, 1.7%] for people with type 1 diabetes and 2.5% [CI: 2.0%, 3.0%] for people with type 2 diabetes. Furthermore, during follow-up the incidence rates did not change significantly over time for neither people with type 2 diabetes nor people with type 1 diabetes. The average hospitalisation-rate and 1-year mortality was 9.0% [CI: 5.1%, 12.9%] and 11.9% [CI: 10.4%, 13.3%] respectively, without significant changes over time
Conclusion: This study emphasizes the fact that the last decade has provided no improvement in the prevention of the first diabetic foot ulcer, while also confirming high mortality-rates following its’ presentation.
Clinical Trial Registration Number: ISAC protocol No: 19_027
Disclosure: J. Roeikjer: None.
829
History of diabetic foot ulcer increases the risk of recurrence in a long-term follow-up cohort in Germany
K. Ogurtsova1,2, S. Morbach3,4, B. Haastert5,4, A. Icks1,4;
1Institute for Health Services Research and Health Economics, German Diabetes Centre, Düsseldorf, 2German Centre for Diabetes Research, Neuherberg, 3Department of Diabetes and Angiology, Marienkrankenhaus, Soest, 4Institute for Health Services Research and Health Economics, Heinrich-Heine-University, Düsseldorf, 5mediStatistica, Neuenrade, Germany.
Background and aims: The diabetic foot syndrome is a chronic condition with high chances of recurring episodes: 30-40% of patients experience a recurrent diabetic foot ulcer (DFU) within the first year, 60% in three years, and 65% in five years after healing of an initial lesion. We aim to investigate if a history of previous DFU is associated with increased risk of DFU recurrence.
Materials and methods: We analysed 227 patients with new DFUs recruited in a single diabetes centre in Germany between June 1998 and December 1999 and followed-up until 1st January, 2019, death or a drop out of the study. The mean of follow-up period was 6.6 (SD = 5.8) years. The start point for the analysis was complete primary healing, healing following minor amputation, or a unilateral major amputation as treatment of the index DFU. Time from the start to an event of interest, any first recurrent DFU, was censored at last follow-up visit before a dropout, at the end of the observation period, or at death. The recurrence rate per person-year was calculated. The median time of recurrence was estimated from Kaplan-Meier curves. The association of history of DFU with time to any first DFU recurrent lesion was examined in a multivariate Cox proportional hazard regression analysis. The model included the following baseline covariates: age, sex, type of diabetes, diabetes duration, chronic renal insufficiency, renal replacement therapy, neuropathy, Charcot neuropathic osteoarthropathy, any peripheral arterial disease, history of minor amputations, a minor amputation as a treatment of the index lesion.
Results: The mean age at inclusion was 69.1 (SD = 10.9) years, 97 (42.7%) participants were women, 201 (88.5%) had type 2 diabetes, 122 (53.7%) reported a history of DFU before the index lesion. During the follow-up, 157 (69.2%) had at least one DFU recurrence, 59 (26.0%) died and 11 (4.8%) were lost to follow-up before any recurrent episode. The median time to the first recurrence was 2.2 (95%CI [1.9, 3.0]) years in the entire cohort, and 3.1 (CI [2.3, 5.5]) and 1.9 (CI [1.3, 2.3]) years in the groups without and with history of previous DFU. The individuals lived total 586.8 person-years under the risk of recurrence in the entire cohort, and 327.3 and 259.4 person-years in groups without and with history of DFU. We observed 0.27 (95%CI [0.23, 0.31]) events per person-year in the entire cohort, and 0.20 (95%CI [0.15, 0.25]) and 0.36 (95%CI [0.29, 0.44]) in the subgroups without and with a history of previous DFU. In the Cox model, history of DFU before the index lesion led to a higher hazard of DFU recurrence (HR=1.63, 95%CI [1.10, 2.41]) being adjusted for the above mentioned confounders.
Conclusion: We found the risk of a new lesion following a repetitive episode of DFU was higher than after the first ever one, significantly and independently of other risk factors. This phenomenon, which seemed obvious, has not yet been described.
Disclosure: K. Ogurtsova: None.
830
Malnutrition in a diabetic foot ulcer population: prevalence and relation to ulcer severity and outcome
P. Lauwers1, J. Hendriks1, A. Verrijken2, K. Van Dessel2, F. Peiffer2, C. De Block2, E. Dirinck2;
1Vascular Surgery, Antwerp University Hospital, Edegem, 2Endocrinology, Diabetology and Metabolism, Antwerp University Hospital, Edegem, Belgium.
Background and aims: Malnutrition negatively impacts wound healing. However, there is little data on the link between malnutrition and diabetic foot ulcers (DFU). This study assessed the prevalence of protein-energy malnutrition in people admitted for a DFU, and the relation with DFU severity and outcome.
Materials and methods: This prospective single centre observational cohort study consecutively included people with a DFU admitted between July 1 2016 and September 30 2019. Nutritional status was investigated within 48 hours of admission using the Mini Nutritional Assessment questionnaire, anthropometry and body impedance analysis. The Global Leadership Initiative on Malnutrition (GLIM) criteria were used to determine the presence of malnutrition and its severity. Ulcer severity was determined using the SINBAD classification. Outcome was evaluated after 6 and 12 months and scored as: healing, minor or major amputation, or death. Logistic regression analysis determined which factors were significant predictors of the combined endpoint wound healing + minor amputation: gender, age, smoking, cardiac history, peripheral arterial disease, BMI, history of DFU or amputation, DFU duration, SINBAD classification, osteomyelitis, eGFR, HbA1c, and malnutrition.
Results: 110 persons were included. Malnutrition was diagnosed in 26 (24%). Patients were divided according to nutritional status: normal (n = 84, group A); moderately malnourished (n = 9, group B); and severely malnourished (n = 17, group C). Demographics and diabetes characteristics were comparable between groups. History of DFU (56% vs 67% vs 41%) or amputation (31% vs 22% vs 24%), as well as duration (105 vs 91 vs 148 days) and localization of the DFU (forefoot in 85% vs 89% vs 82%) were also equally distributed. Severely malnourished people presented with most severe DFU. No differences were noted in outcome according to nutritional status at 6 months. At 1 year, there was a significant difference in healing between groups, with no healed ulcers in group C. In a logistic regression analysis, outcome at 6 months was determined by smoking (p = 0.002), osteomyelitis (p = 0.029) and HbA1c (p = 0.029); at 12 months only smoking significantly contributed to outcome (p = 0.03).
Conclusion: One quarter of people admitted for a DFU suffered from malnutrition. Ulcer severity was significantly worse in subjects with malnutrition. Moreover, there was a significant difference in the most favourable outcome (wound healing) between groups with and without malnutrition. Five other studies have reported an alarmingly high prevalence of malnutrition in DFU patients. A negative influence of malnutrition on DFU severity and outcome was not observed in all of them, probably due to variations in methodology. These data highlight the need for further research and implementation of malnutrition screening in guidelines on the management of DFU.

Disclosure: P. Lauwers: None.
831
Factors associated with progression to ulceration in a high risk diabetic foot population
M. Oroko, L. Hall;
Diabetes and Endocrinology, Queen Elizabeth University Hospital, Glasgow, UK.
Background and aims: Certain patients with diabetes have high risk of ulceration (determined by the Scottish Care Information-Diabetes Collaboration (SCI-Diabetes) risk calculator) but do not go on to develop foot ulcers, whilst others with high risk feet do ulcerate. In our clinic population, we aimed to examine differences between these two groups by comparing high risk patients who had never ulcerated (HRNU) to patients with current or previous foot ulceration (CPFU). We looked for differences in age, ethnicity, deprivation (as measured by Scottish Index of Multiple Deprivation (SIMD)), type and duration of diabetes, body-mass index (BMI), HbA1c, lipids, smoking status and presence of other microvascular complications (levels of urinary albumin excretion and presence of proliferative diabetic retinopathy) in the two groups.
Materials and methods: We used the SCI-Diabetes database to identify patients in our clinic currently in the HRNU and CPFU groups. SCI -Diabetes was also used to acquire demographic, social, anthropometric and metabolic data for each patient.
Results: 530 patients were identified in total. Of those 197 were HRNU and 333 patients were in the CPFU group. CPFU patients were younger than HRNU patients (62.4 vs 66.9 years p =0.0001), although diabetes duration was longer in the CPFU group (19.7 vs 16.5 years, p=0.0017). A higher proportion of CPFU patients were male (68.3 vs 50%, p=0.0005) and higher proportion of CPFU patients had Type 1 Diabetes (29 vs 17% p=0.0025). Proliferative retinopathy was present in 13% of CPFU patients and 4% of HRNU patients (p = 0.00091) and ACR was higher in the CPFU group (52.1 vs 26.5, p =0.013). There were no significant differences in ethnicity, SIMD, HbA1c, BMI, LDL-cholesterol, blood pressure or smoking status between the two groups.
Conclusion: In keeping with previous published literature, foot ulceration in our clinic population can be interpreted as a marker of diabetes severity as it is significantly associated with more severe microvascular complications affecting eyes and kidneys. The apparent lack of differences in glycaemic control, blood pressure, lipids and smoking status between the 2 groups may, at least partly, represent existing strategies to aggressively manage cardiovascular risk factors in patients with foot ulcers. Our patients with high risk feet who are male and who have Type 1 diabetes seem to be at highest risk of ulceration, and should be particular targets for future preventative interventions.

Disclosure: M. Oroko: None.
832
Diagnosing osteomyelitis in diabetes foot ulceration
K. Larsen, S. Dwarampudi, C. Uffendell, S. Miller, L. Wang, C. O'Dowd, U. Srinivas-Shankar;
Wirral University Teaching Hspital, Liverpool, UK.
Background and aims: Osteomyelitis is a known complication of diabetes foot ulceration (DFU). However, making a diagnosis of this condition can be challenging. We sought to determine the prevalence of osteomyelitis and various clinical and radiological features used to make a diagnosis of osteomyelitis complicating DFU.
Materials and methods: Observational study of patients who were reviewed by a multidisciplinary diabetes foot team over a period of 20 months between December 2017 and September 2019. All patients managed as osteomyelitis were included in this cohort. Data collected included base line characteristics, clinical features of osteomyelitis present and details of imaging performed.
Results: There were 1006 new episodes of diabetes foot review, amongst 771 inpatients and outpatients by the multidisciplinary diabetes foot team. 321/1006 episodes had a non-infected ulcer, 140/1006 episodes had an infected ulcer, 102/1006 episodes had an ulcer that had healed on initial review, with the rest having other diabetes foot-related problems. Of the 471/1006 episodes of foot ulceration, 180 (38.2%) episodes were complicated by osteomyelitis. 134/180 (74.4%) episodes were in males and 46/180 (25.6%) were in females. History of previous osteomyelitis, previous amputation and previous vascular intervention was present in 35.5%, 31.6% and 44.4% respectively in the cohort with a new diagnosis of osteomyelitis (n=180). The commonest location of ulceration in the cohort with osteomyelitis was the fore foot (88.9%). 80/180 (44.4%) ulcers were neuropathic, 88/180 (48.9%) were neuroischaemic ulcers and 12 (6.7%) were ischaemic ulcers. Osteomyelitis was associated with cellulites in 69/180 (38.3%) and infected foot ulceration in 74/180 (41.1%) episodes. The commonest basis for diagnosing osteomyelitis was clinical features {duration of ulceration 61.1%, sausage shaped digits 56.1%, probing to bone 41.7% and exposed bone 22.8%}. Foot X ray was performed in 164/180 (91.1%) episodes and there was evidence of osteomyelitis in 52.4% of the foot X rays. Magnetic resonance imaging (MRI) of the foot was performed in 94/180 (52.2%) episodes and in 89.4% of these episodes, MRI revealed features consistent with osteomyelitis.
Conclusion: Osteomyelitis is a common complication of diabetes foot ulceration and occurs in over a third of foot ulcers. A low threshold is needed to suspect this complication of diabetes foot ulceration and one should not wait for radiological confirmation before treatment for osteomyelitis is initiated.
Disclosure: K. Larsen: None.
833
Role of custom made insoles in prevention of neuropathic diabetic foot ulcer recurrence
F. Kyrillos1, A. Salah2, E. EL-Adawy1, H. Gawish1;
1Endocrine and Diabetes unit - Department of Internal Medicine, Mansoura University, Mansoura, 2Internal Medicine department, Dekernis General Hospital, Dekernis, Egypt.
Background and aims: Re-ulceration is a big problem facing patients with previous neuropathic diabetic foot ulcers (NDFU). It may be more reliable to consider wound closure as a period of remission rather than healing. Custom-made insoles (CMI) reduce ulcer risk by redistributing plantar pressure of the foot, therefore attenuating peak pressure (PP) on at-risk areas. The aim of the study was to evaluate the role and effectiveness of CMI in prevention or delaying recurrence of NDFU.
Materials and methods: 49 diabetic patients of matched age, sex, and BMI; 17 (intervention) used CMI inside therapeutic shoes, and 32 (control) used therapeutic shoes only, were recruited after healing of previous NDFU. Patients with peripheral arterial disease, foot deformities, previous amputation, and associated co-morbidities were excluded. Plantar pressure assessment was done using F-scan in-shoe pressure analysis system (TEKSCAN Ltd). Sensors were placed inside shoe beneath the socks. Data were collected immediately following sensor calibration. All tests are composed of three walking trials (each with average of minimum of six steps). Software divides foot into 12 areas (medial heel, lateral heel, mid foot, metatarsal area 1, 2, 3, 4, 5, hallux, 2nd toe, 3rd toe, 4th and 5th toes as one area). Two kinetic outcome measures were collected; plantar peak pressure (PP) and pressure time integral (PTI) at each area. Each CMI was 14 mm thick, made from polyethylene foam and was designed using CAD/CAM (Computer- Aided Design and computer-aided manufacturing) system. All patients were followed up until a study end point; recurrent plantar ulcer or study termination at 12 months.
Results: Big toe was the commonest site of previous ulceration in control and intervention groups (53.1% and 58.82%) respectively, while metatarsal head areas (1, 2) were the 2nd common site (28.1% and 23.6%) respectively; with no significant difference between both groups. Rate of ulcer recurrence was (34.37% vs 17.64%) within first 12 weeks of study (p=0.22), and (78.1% vs 52.9%) within the study duration (one year) (p=0.07) in control & intervention groups, respectively. CMI decreased significantly PP among patients with ulcer recurrence during one year study in intervention versus control group {106(41-320) vs 161(0-490) KPa} (p= 0.02), with no difference as regard PTI {37.5(10-155) vs 43.1(0-156.4) KPa} (p=0.95). On the other side, CMI did not decrease significantly PP {(137(67-320) vs 165.5(41-499) KPa} (p=0.51) or PTI {41(15.2-155) vs 42.9(17.5-156.4) KPa} (p=0.35) at same sites of previous ulcers among these patients. CMI increased median ulcer free period; 10 months vs. 6 months in control group with no significant difference (p=0.09). Ulcer recurrence occurred at same site in 12 patients (37.5%) in control versus 7 patients (41.17%) in intervention group (p=0.8). Big toe was the commonest site; 13(52%) versus 4(44.4%) in control & intervention groups respectively. In each group, there was no difference as regard PP or PTI between patients with ulcer recurrence versus those without.
Conclusion: CMI are in need for more evidence to prove its role in prevention of NDFU recurrence. Previously published PP thresholds for ulcer recurrence may need to be reassessed. Other factors than PP and PTI may participate in ulcer recurrence.
Disclosure: F. Kyrillos: None.
PS 78 Hypertension and vascular disease
834
Abrupt blood pressure elevation buffering, linkage with microcirculation and vascular Ca 2+ channel blockade, implication to treat arterial hypertension in diabetes
J. Gmitrov1,2;
1Krompachy Hospital, Agel SK inc., Krompachy, Slovakia, 2National Institute of Public Health, Tokyo, Japan.
Background and aims: A mounting evidence suggests that diabetic autonomic neuropathy generates hemodynamic instability with microvascular dysfunction and enhanced blood pressure (BP) variability, superposed by extremely dangerous abrupt BP elevation which significantly exceeds the cardiovascular risk of steady-state high BP level. The goal was to estimate verapamil’s BP buffering capacity and its possible linkage with microcirculation, aimed to broaden verapamil clinical implementation in unstable arterial hypertension and diabetic microangiopathy.
Materials and methods: Thirty experiments (10 controls and 20 with verapamil) were performed in rabbits sedated using pentobarbital infusion (5 mg kg -1 h-1). Arterial baroreflex sensitivity (BRS), mean femoral artery blood pressure (MAP), heart rate (HR) and ear lobe skin microcirculatory blood flow, estimated using microphotoelectric plethysmography (MPPG), were simultaneously measured during 30 min of verapamil infusion (20 μg kg -1 h-1). BRS was assessed from change in HR in response to MAP abrupt elevation (MAPAE) evoked by intravenous bolus injections of phenylephrine (Ph) and by power spectral analysis using transfer function (TF) from MAP to the HR (BRSPh,TF).
Results: Verapamil significantly increased microcirculatory blood flow, decreased MAP, BRSPh,TF and phenylephrine-induced MAPAE (Fig. 1). A significant inverse correlation was also found between verapamil-induced decrease in MAPAE, BRS and microcirculatory blood flow measured before phenylephrine BP challenge (ΔMAPAE with ΔBRSTF, r = - 0.47, p < 0.036; ΔMAPAE with ΔMPPG, r = - 0.49, p < 0.025).
Conclusion: The principal finding in this study is that a novel short-term BP buffering mechanism exists liked with microcirculation and potentiated by systemic vascular Ca2+ channel blockade, operating even in the condition when decreased BRS, the main short-term BP control mechanism is apparent (Fig. 1). A significant inverse correlation between abrupt BP elevation and microvascular dilation suggests microcirculation to be directly involved in BP regulation physiology, completing the vicious circle between arterial hypertension and microvascular dysfunction, evoked by diabetic autonomic neuropathy early, even in preclinical stages of the disease. We suggest verapamil, throughout vascular smooth muscle Ca2+ channel blockade, boosters endothelial sheer stress-NO-dependent BP-buffering mechanism and, enhancing vessel compliance to BP challenge, smothers BP swings up. Our results are in accordance and may in part explain verapamil’s efficiency to blunt clinically important morning surge in BP, widening the range of systemic vascular Ca2+ channel blockade implementation in diabetes where autonomic neuropathy significantly contributes to hemodynamic instability, including microvascular dysfunction and diminished capacity to impede abrupt BP elevation with deleterious cardiovascular outcomes.

Disclosure: J. Gmitrov: None.
835
Kidney injury is associated with hypertension in the Renin-AAV uninephrectomised db/db mouse model of diabetic nephropathy
M.V. Østergaard, I.R. Sørensen, A.A. Pedersen, T. Secher, J.L. Skytte, F.E. Sembach, J. Jelsing, L.N. Fink, N. Vrang;
Gubra, Hørsholm, Denmark.
Background and aims: Diabetic nephropathy (DN) is a long-term complication that occurs in ~40% of diabetes patients and is a leading cause of end-stage renal disease. In a newly established mouse model of advanced DN, we investigated the effects of hypertension on the progression of kidney injury.
Materials and methods: At 8 weeks of age, female db/db mice were i.v. injected with a Renin encoding adeno-associated virus (AAV) construct at different doses to induce hypertension, while a LacZAAV construct was used as negative control. At 9 weeks of age, mice were uninephrectomized (UNx). Blood pressure and glomerular filtration rate (GFR) was measured at 22 weeks of age, while urine albumin-to-creatinine ratio (ACR) was measured before tissue sampling at 24 weeks of age. Prior to sacrifice, lectin and albumin was i.v. injected, and kidneys were processed for 3D imaging by light sheet fluorescence microscopy (LSFM) and subsequent for histopathological evaluation.
Results: Blood pressure was dose-dependently increased by single-dose ReninAAV (p<0.001) and maintained for at least up to 14 weeks after AAV-injection with the highest blood pressure of 212±10 mmHg in mice receiving 10e10 GC. GFR measurements indicated hyperfiltration in LacZAAV-injected UNx db/db mice (519±46 μL/min), while ReninAAV dose-dependently decreased GFR compared to LacZAAV in UNx db/db mice (p<0.01) reaching 344±50 μL/min in UNx db/db mice receiving 10e10 GC ReninAAV. Plasma Cystatin C was increased in ReninAAV, 10e10 GC compared with LacZAAV UNx db/db mice (p<0.001) and correlated with GFR across all groups. Urine ACR was dose-dependently increased by ReninAAV (p<0.001) with highest levels of ACR reaching ~13e3 μg/mg. Likewise, 3D kidney imaging enabled quantification of albumin in renal structural compartments and showed increased albumin in glomeruli and cortex in ReninAAV, 2e10 GC compared to LacZAAV UNx db/db mice (p<0.05). AI-assisted glomerulosclerosis scoring demonstrated hypertension-induced worsening of glomerulosclerosis in ReninAAV compared to LacZAAV UNx db/db mice (p<0.001).
Conclusion: ReninAAV-induced hypertension in female UNx db/db mice accelerates the progression of DN as displayed by decreasing GFR and exacerbated albuminuria and glomerulosclerosis. These data confirm that ReninAAV UNx db/db mice represent a reliable model of DN with features of late stage human disease.
Disclosure: M.V. Østergaard: None.
836
Comparative effects of medications for type 2 diabetes on blood pressure: a systematic review and network meta-analysis of 192 trials
I. Avgerinos1, T. Karagiannis1, P. Kakotrichi1, C. Mantsiou1, G. Tousinas1, A. Manolopoulos1, A. Liakos1, K. Kitsios1, A. Tsapas1,2, E. Bekiari1;
1Clinical Research and Evidence-Based Medicine Unit, Aristotle University of Thessaloniki, Thessaloniki, Greece, 2Harris Manchester College, University of Oxford, Oxford, UK.
Background and aims: Treatment effect on blood pressure varies among different antidiabetic medications in patients with type 2 diabetes. We conducted a systematic review and network meta-analysis to assess the comparative effects of all antidiabetic medications on blood pressure.
Materials and methods: We searched Medline, Embase, and Cochrane Central until December 2019 for randomised controlled trials in patients with type 2 diabetes. We performed a frequentist random-effects network meta-analysis to calculate mean differences for change in blood pressure. We assessed study quality with the revised Cochrane risk of bias tool and graded overall confidence in each effect estimate.
Results: 192 studies (153,435 patients) assessing 21 treatments were included in our analysis. Patients’ mean systolic blood pressure at baseline was 131.89 mmHg and mean diastolic blood pressure was 79.47 mmHg. Compared to placebo, systolic blood pressure was reduced with SGLT2 inhibitors (mean difference -3.01 mmHg, 95% confidence interval -3.52 to -2.51), GLP-1 receptor agonists (-2.45 mmHg, -2.97 to -1.92), metformin (-1.21 mmHg, -2.22 to -0.21) and DPP-4 inhibitors (-0.81 mmHg, -1.37 to -0.25). The remaining drug classes had a neutral effect. Intraclass differences were also evident among individual agents (Figure). In between-treatment comparisons, empagliflozin was more effective than dapagliflozin (-1.24 mmHg, -2.35 to -0.12), while oral semaglutide was superior to lixisenatide (-3.08 mmHg, -5.25 to -0.91), dulaglutide (-2.16 mmHg, -3.61 to -0.72) and weekly exenatide (-1.56 mmHg, -3.11 to -0.02). Empagliflozin was also the most efficacious agent in reducing diastolic blood pressure (mean difference versus placebo -1.73 mmHg, -2.12 to -1.34), followed by dapagliflozin (-1.48 mmHg, -1.91 to -1.04) and canagliflozin (-1.42 mmHg, -1.77 to -1.06). Less profound diastolic blood pressure reductions were evident with pioglitazone, ertugliflozin, exenatide and semaglutide. Sensitivity analyses restricted to trials at low risk of bias and to trials over 52 weeks yielded similar results to those of the main analyses both for systolic and diastolic blood pressure. In general, the confidence in effect estimates for all analyses was moderate to high.
Conclusion: Among 11 antidiabetic drug classes, SGLT2 inhibitors, GLP-1 receptor agonists, and metformin were effective in reducing systolic diastolic blood pressure in patients with type 2 diabetes, while SGLT2 inhibitors also reduced diastolic blood pressure. Differences between individual agents were also evident. Overall, by summarising available evidence, these findings could assist clinicians and patients in the decision making process.

Supported by: EFSD-PACT Programme supported by AstraZeneca
Disclosure: I. Avgerinos: None.
837
Patiromer to enable spironolactone in patients with resistant hypertension and chronic kidney disease (AMBER): results in the prespecified subgroup with diabetes
P. Rossignol1, S. Arthur2, A. Conrad2, G. Cornea3, W.B. White4, B. Williams5, R. Agarwal6;
1University of Lorraine and FCRIN INI-CRCT, Nancy, France, 2Relypsa, Inc., a Vifor Pharma Group Company, Redwood City, USA, 3Vifor Fresenius Medical Care Renal Pharma Ltd, a part of Vifor Pharma, St. Gallen, Switzerland, 4University of Connecticut School of Medicine, Farmington, USA, 5University College London (UCL), London, UK, 6Indiana University School of Medicine, Indianapolis, USA.
Background and aims: Spironolactone (SPIRO) reduces BP in patients with resistant hypertension (RHTN); however, its use in patients with advanced chronic kidney disease (CKD) is often limited by hyperkalaemia. In AMBER, patiromer enabled more persistent use of SPIRO in patients with RHTN and CKD. As SPIRO is recommended in RHTN, and diabetes mellitus (DM) increases hyperkalaemia risk, we report results in prespecified subgroups with Type 1 or 2 DM (DM+) and without DM (DM-).
Materials and methods: Randomised, double-blind, placebo (PBO)-controlled trial in adults with RHTN and eGFR 25 to ≤45 mL/min/1.73m2. Patients were assigned (1:1) to PBO or patiromer, and SPIRO 25 mg once daily, with dose titrations permitted after 1 week for patiromer/PBO and 3 weeks for SPIRO. The primary endpoint (between-group difference at Week 12 in the percent of patients on SPIRO) was assessed prospectively in prespecified subgroups by DM status.
Results: 295 patients were randomised, 145 (49%) DM+ and 150 (51%) DM-. Baseline mean (SD) serum K+ (mmol/L) was 4.76 (0.34) in DM+ and 4.67 (0.39) in DM-. Significantly more patients treated with patiromer than with PBO remained on SPIRO at Week 12 in both subgroups, with a between-group difference of 18.3% in the DM+ subgroup and 20.1% in the DM- subgroup and no significant interaction between subgroups (Figure). The least squares mean (SE) cumulative SPIRO dose in both subgroups was higher with patiromer than PBO, by 438.7 (177.7) mg in DM+ and 317.8 (175.0) mg in DM-. Adverse events occurred in 61% (PBO) and 60% (patiromer) of DM+ patients and in 46% (PBO) and 51% (patiromer) of DM- patients. Adverse events of hyperkalaemia or blood K+ increased occurred in 7 (PBO) and 8 (patiromer) DM+ patients and 7 (PBO) and 1 (patiromer) DM- patients. Four patients had serum magnesium <0.58 mmol/L between baseline and Week 12 (none <0.49 mmol/L), including 3 DM+ (1 PBO, 2 patiromer) and 1 DM- (patiromer) patients. In 2 of these patients, serum magnesium was below the lower limit of normal (LLN; 0.74 mmol/L) at baseline. None of these patients had cardiac arrhythmias temporally associated with low magnesium levels, neuromuscular abnormalities, or serum K+ below the LLN (3.5 mmol/L).
Conclusion: Patiromer enabled more patients with advanced CKD and RHTN to continue treatment with SPIRO, regardless of DM status.

Clinical Trial Registration Number: NCT03071263
Supported by: Relypsa, Inc., a Vifor Pharma Group Company
Disclosure: P. Rossignol: Employment/Consultancy; G3P, Idorsia. Grants; AstraZeneca, Bayer, CVRx, Novartis, Vifor Fresenius Medical Care Renal Pharma. Honorarium; Ablative Solutions, AstraZeneca, Bayer, Boehringer Ingelheim, Corvidia, CVRx, Fresenius, Grunenthal, Novartis, Novo Nordisk, Relypsa, Servier, Stealth Peptides, Vifor Fresenius Medical Care Renal Pharma. Other; Cofounder: CardioRenal.
838
Benfotiamine and alpha-lipoic acid: effects on arterial stiffness and heart rate variability parameters in patients with diabetic cardiac autonomic neuropathy
V. Serhiyenko, L. Serhiyenko, V. Segin, A. Serhiyenko;
Danylo Halytsky National Medical University, Lviv, Ukraine.
Background and aims: Cardiac autonomic neuropathy (CAN) is the most frequent autonomic complication, that confer high mortality and morbidity. Increased arterial stiffness and reduced heart rate variability (HRV) are both associated with increased cardiovascular risk in type 2 diabetes mellitus (T2DM). The aim of study was to investigate the effect of benfotiamine (BFT), alpha-lipoic acid (ALA) and its combination on arterial stiffness and HRV parameters in the patients with T2DM and CAN.
Materials and methods: The study involved 72 patients with T2DM and moderate CAN, aged between 50-59 yrs, BMI 27.3±0.24 kg/m2 and HbA1c 7.2±0.15%. 24-hour HRV was evaluated using ECG “ЕС-3Н” (“Labtech”), arterial stiffness-Tensio MedTM Arteriograph 24. Patients were allocated to four groups with 18 in each: control; BFT-300 mg/day; ALA-600 mg/day; combined-BFT 300 mg+ALA 600 mg/day during 3 mos. Statistics: ANOVA.
Results: Benfotiamine prescription was accompanied with an increase of percentage of difference between adjacent normal R-R intervals that is greater than 50 (pNN50) [4.97±0.5 vs 7.3±1.04%], high-frequency (HF) during the active [267.9±17.6 vs 326.2±16.9 ms2] and passive [333.1±18.5 vs 392.7±19.2 ms2] periods (p<0.05). Decrease of pulse wave velocity (PWV) during the passive period [11.1±0.3 vs 10.0±0.4 m/s, р<0.05] was obtained. ALA prescription was accompanied by increase of standard deviation of the normal-to-normal interval (SDNN) [96.7±5.5 vs 111.7±4.7 ms], standard deviation of all normal R-R intervals for all 5-min segments (SDANNi) [80.3±4.2 vs 92.8±3.8 ms], root mean squares of successive differences between normal sinus R-R intervals (RMSSD) [21.4±1.4 vs 25.3±1.3 ms] and pNN50 [4.4±0.4 vs 5.9±0.4%]; low- (LF) during the active [408.3±24.7 vs 494.5±21.9 ms2] and passive [559.2±30.1 vs 660.2±24.6 ms2]; HF during active [259.3±15.4 vs 310.0±14.6 ms2] and passive [357.3±19.1 vs 415.0±17.3 ms2] periods (p<0.05). Reduction in aorta augmentation index (Aixao) [29.8±1.5 vs 24.7±1.2%) and PWV [10.1±0.4 vs 8.9±0.3 m/s) during active (p<0.05); PWV [10.6±0.4 vs 9.4±0.3 m/s, p<0.01], AIxao [33.6±1.3 vs 28.6±1.4%, p<0.05] and brachial augmentation index (Aixbr) [-7.8±2.2 vs -12.4±2.3%, p<0.05] during the passive period was found. Combined administration contributed to increase of SDNN [99.2±3.7 vs 110.1±3.4 ms, p<0.05], SDANNi [84.2±3.4 vs 93.1±2.9 ms, p<0.05], RMSSD [18.1±1.1 vs 22.5±1.2 ms, p<0.01], pNN50 [5.0±0.7 vs 8.1±1.1%, p<0.01]; LF [406.4±26.0 vs 508.2±24.2 ms2, p<0.01] and HF [264.2±18.2 vs 325.2±17.2 ms2, p<0.01] during the day; VLF [1356.4±50.2 vs 1512.2±49.9 ms2, p<0.05], LF [534.2±40.2 vs 672.8±36.7 ms2, p<0.01], HF [322.4±24.2 vs 436.2±26.1 ms2, p<0.001] during the night. Decrease of Aixao [29.4±1.6 vs 24.6±1.2%, p<0.01], Aixbr [-10.2±2.7 vs -17.4±2.3%, p<0.05], PWV [10.1±0.5 vs 8.6±0.2 m/s, p<0.01] during the active and Aixao [31.2±1.4 vs 26.4±1.1%, p<0.01], Aixbr [-8.1±2.5 vs -14.9±2.2%, p<0.05], PWV [10.8±0.4 vs 9.1±0.5 m/s, p<0.01] during the passive period was found.
Conclusion: The administration of BFT promotes increase of parasympathetic activity and decrease of PWV during the night; ALA - increase of time- and frequency-domain HRV, reduction of arterial stiffness parameters. Combination of BFT and ALA showed more pronounced increase of HRV and decrease of arterial stiffness, that might be useful in treatment of CAN.
Disclosure: V. Serhiyenko: None.
839
Afro-caribbean ethnicity predicts significant decline in renal function in people with type 1 diabetes
A. Mangelis, S. Ayis, N. Fountoulakis, J. Collins, S.M. Thomas, J. Karalliedde;
King's College London, London, UK.
Background and aims: There is limited data and clinical information on the impact of Afro-Caribbean ethnicity on renal outcomes in people with type 1 diabetes (T1D). In this retrospective study of an ethnically-diverse population in South London, we describe the demographic and clinical features of people with T1D who developed >50% decline in estimated glomerular filtration rate (eGFR).
Materials and methods: We evaluated 1335 people with T1D (48.5% male, 13% Afro-Caribbean), with baseline median age of 32 years and duration of diabetes of 11 years. All of the cohort had baseline eGFR>45 ml/min and were attending hospital-based diabetes out-patient clinics in South London. Median follow up was 7.2 years. Primary endpoint was an eGFR decline >50% from baseline with a final eGFR <30ml/min. eGFR was calculated by Chronic Kidney Disease Epidemiology Collaboration (CKD-EPI) equation.
Results: Of the cohort of 1335 people, 33 (2.5%) reached the primary endpoint. At baseline people who reached primary endpoint were significantly older, with higher systolic blood pressure with more prevalent retinopathy compared to those who did not. We observed that people of Afro-Caribbean origin were significantly more likely to reach the primary endpoint compared to non Afro-Caribbeans (4.4% vs. 2.4%) with a 21% prevalence of Afro-Caribbean ethnicity in the 33 people who reached endpoint. Overall Afro-Caribbeans were younger, with shorter duration of diabetes but had similar levels of systolic and diastolic blood pressure compared to non Afro-Caribbeans. Competing risk analyses with death as competing event, hazard ratios (95% Confidence intervals), demonstrated that Afro-Caribbean ethnicity 2.22 (1.55, 3.17), age 1.02 (1.01, 1.03), HbA1c 1.01 (1.00, 1.10) were independent predictors of the primary endpoint. In further analyses where >40% fall in eGFR with final eGFR <30 ml/min was evaluated as secondary endpoint we observed similar results.
Conclusion: In our cohort of people with T1DM, we observed that Afro-Caribbean ethnicity is associated with a more than 2-fold higher risk of >50% eGFR loss. Further and larger studies in T1DM people of Afro-Caribbean origin are needed to confirm our results and examine associated patient characteristics/risk factors that may explain our observation.
Supported by: Guy's and St. Thomas's Foundation Trust Charity
Disclosure: A. Mangelis: Grants; Guy’s and St Thomas’ NHS Foundation Trust.
840
The emergence of peripheral arterial disease in persons with diabetes in Dar es Salaam, Tanzania, an emerging time bomb in Africa
Z.G. Abbas1,2, J.K. Lutale1, L.K. Archibald3;
1Internal Medicine, MUHAS, Dar es Salaam, United Republic of Tanzania, 2Internal Medicine, AMC, Dar es Salaam, United Republic of Tanzania, 3Infectious Diseases, College of Medicine University of Florida, Gansve, USA.
Background and aims: The incidence of foot ulcers among persons with diabetes in Tanzania has been increasing over the past three decades. Surveillance data aggregated by the authors for persons attending the diabetes outpatient clinic in Dar es Salaam, Tanzania during the 1980s and 1990s had shown that the vast majority (>80%) of foot ulcers in persons with diabetes were neuropathic in origin and not associated with peripheral arterial disease (PAD). However, over the past decade, there has been a noticeable increase in PAD among persons who attend DM clinics at Muhimbili National Hospital ((MNH) and Abbas Medical Center (AMC) in Dar es Salaam. We carried out this study to characterize the epidemiology of PAD in this population and identify attributable risk factors.
Materials and methods: During Jan 2014 through Dec 2018 (study-period) and following informed consent, patients who attended MNH and AMC diabetes outpatient clinics with foot ulcers were evaluated. Detailed epidemiologic and clinical data were recorded in a standardized questionnaire and included demography, educational level of individuals, social habits, diet, and patient outcomes. Statistical analyses were carried out using SAS® statistical software (SAS Institute, Cary, North Carolina). Logistic regression was performed and adjusted odds ratio (AOR) and 95% confidence intervals (CI) were calculated.
Results: Of 5,687 enrolled subjects, 3,621 (65%) were male; median BMI was 26.5; median age and diabetes duration were 57 and 8 years, respectively. All patients had some degree of PN; 28% had PAD; ischemic heart disease was uncommon (0.4%). Independent factors associated with PAD included hypertension (AOR: 1.3, CI: 1.1-1.5); tobacco (AOR: 1.4, CI: 1.2-1.7); major amputation (AOR: 3.2, CI: 1.9-5.9); or death (AOR: 2.2, (1.6-3.0).
Conclusion: We documented a significant increase in the prevalence of PAD in persons with diabetes who attend outpatient clinics in Tanzania—a problem that heretofore was not appreciated by clinicians and epidemiologists. The increase appears to be linked to hypertension and tobacco and likely reflects the situation for persons with diabetes across the African continent. Reasons for this increase include urbanization of African communities with movement of populations from rural settings to the cities, more sedentary lifestyles, lack of exercise, and diet. PAD is now playing a more substantial role in the causation of foot ulcer in Africa than was previously thought.
Disclosure: Z.G. Abbas: None.
PS 79 Cure the pain of diabetic neuropathy
841
Mean amplitude of glycaemic excursions is superior to time in range in detecting cardiovascular autonomic neuropathy in newly diagnosed and drug-naive type 2 diabetic patients
X. Yang1, Y. Zhu1, W. Xu1, J. Weng2;
1Sun Yat-sen University, Guangzhou, Guangdong, 2the First Affiliated Hospital, Division of Life Sciences and Medicine of the University of Science and Technology of China (USTC), Hefei, China.
Background and aims: Cardiovascular autonomic neuropathy(CAN) is closely associated with increased mortality in diabetic patients. Mean amplitude of glycemic excursions (MAGE), one of the most important indices of glycemic variability, has been proved to be the independent risk factor of CAN in our previous study. However, the impact of time in range (TIR) on CAN in newly diagnosed type 2 diabetic patients is still unclear. Therefore, this study aimed to investigate the association between MAGE, TIR and CAN in newly diagnosed and drug-naive type 2 diabetic patients.
Materials and methods: Ninety newly diagnosed and drug-naive type 2 diabetic patients (68.9% male, mean age: 45 years old) were divided into two groups according to the standard cardiac autonomic reflex tests (CARTs): patients with CAN (CAN+ group) and without patients CAN (CAN- group). MAGE and TIR were obtained by continuous glucose monitoring (CGM).
Results: The positive rate of CAN in newly diagnosed type 2 diabetic patients was 22.2%. MAGE in CAN+ group was significantly higher than that in CAN- group (5.27±1.99mmol/L vs. 4.04±1.39mmol/L, P=0.001). No significant difference of TIR was observed between CAN+ group and CAN- group(38.9±28.7% vs.47.4 ± 34.2%, P=0.374 ). Logistic regression analysis revealed that MAGE but not TIR was significantly associated with CAN [MAGE: odds ratio (OR): 1.73, 95% confidence interval (CI): 1.01~2.73, P=0.018); TIR: OR: 0.992, 95% CI: 0.975~1.009, P=0.371]. The area under the receiver-operating characteristic curve for MAGE (0.80, 95% CI: 0.63~0.97, P=0.001) was superior to TIR (0.43, 95% CI: 0.28~0.57, P=0.371) in detecting CAN.
Conclusion: MAGE but not TIR was independently associated with CAN in patients with newly diagnosed and drug-naive type 2 diabetes. MAGE is superior to TIR in detecting CAN in this population.
Supported by: Medical Scientific Research Foundation of Guangdong Province of China (A2018286)
Disclosure: X. Yang: None.
842
The treatment of erectile dysfunction in younger men with type 2 diabetes is up to 4 times higher than the equivalent non-diabetes population
M. Albanese1, A.H. Heald2, M. Whyte3, M. Lunt4, M. Livingston5, R. Gadsby6, G. Hackett7, S.G. Anderson8, M. Stedman9;
1EndoCardio, Merlischachen, Switzerland, 2Endocrinology & Diabetes, Salford Royal Hospital, Stott Lane, UK, 3Clinical and Experimental Medicine, University of Surrey, Guildford, UK, 4University of Manchester, Salford, UK, 5Clinical Biochemistry, Walsall Manor Hospital, Walsall, UK, 6Medical School, Warwick University, Coventry, UK, 7Aston University, Birmingham, UK, 8Endocrinology & Diabetes, University of the West Indies, Barbados, UK, 9The Office, Res Consortium, Andover, UK.
Background and aims: Erectile Dysfunction (ED) is common in older age and diabetes (DM). Phosphodiesterase type 5-inhibitors (PDE5-is) are first-line for ED treatment and are now used in individuals both with and without overt CVD risk factors, including T2DM. We investigated how levels of diabetes and age of males affects the PDE5-i use in the primary care setting.
Materials and methods: 2018-19 Practice level quantity of all PDE5-i agents were taken from the GP Prescribing Data set in England. The male population in each practice and age categories were taken from GP practice published data (2019). Number of men with T1DM and T2DM in each practice, including number aged >65 years, were taken from the National Diabetes Audit. A statistical regression model linking %>65 age and diabetes to amount of PDE5i, was then extrapolated to provide expected level if 100% were Non-DM30-65, Non-DM>65, T2DM<65, T2DM>65, and T1DM.
Results: We included 5,761 larger practices supporting 25.8m men (90% of the population in England), of whom 16.4m were ≥30years old, of these 4.2m≥65 years old. Of these, 1.4m had T2DM, with 0.8m of these>65 and 137k had T1DM. 28.8m tablets of PDE5-i were prescribed within the 12 months (2018-19) period in 3.7m prescriptions (7.7 tablets/prescription), at total costs of £15.8m (£0.55/tablet). The NHS ED limit of 1 tablet/user/week suggests that 540k males are being prescribed a PDE5-i at a cost of £29/year each. With approx 30,000 GPs practising, this is equivalent to one GP providing 2.5 prescriptions/week to overall 18 males. There was a 3x variation between the highest decile of practices (2.6 tablets/male/year) and lowest decile (0.96 tablets/male/year). The statistical model (Table 1) captured 14% of this variation and showed T1DM males were the largest users, while for age<65, those with T2DM were being prescribed 4 times as much as non-DM. Those T2DM>65 were prescribed 80% of the non-DM amount.
Conclusion: There is wide variation in use of PDE5-is. Older age and T2DM are drivers for ED prescribing, NHS rules restricting non<DM65 may limit use in that group. Older T2DM men may also have hypogonadism so have reduced response to PDE5-is. With only 14% variance capture, other factors including wide variation in patient awareness, prescribing rules of local health providers, and recognition of the importance of male sexual health by GP prescribers might have significant impact.

Disclosure: M. Albanese: None.
843
Efficacy and safety of an oral dispersible tablet containing vitamin B12 after 12 months of administration in patients with diabetic neuropathy and good glycaemic control
T. Didangelos1, E. Karlafti1, E. Margariti1, P. Giannulaki2, Z. Kontoninas1, C. Margaritidis1, S. Tesfaye3, A. Hatzitolios1;
1Diabetes Center, 1st Prop. Department of Internal Medicine, “AHEPA” Hospital, Aristotele University, Thessaloniki, Greece, 2Department of Nutrition and Dietetics, University General Hospital of Thessaloniki “AHEPA”, Thessaloniki, Greece, 3Diabetes Research Unit, Royal Hallamshire Hospital, Sheffield Teaching Hospitals NHS Foundation Trust, Sheffield, UK.
Background and aims: To investigate the efficacy and safety of the administration for 12 months of a new oral dispersible tablet containing Vit. B12 (1000 μg/24h) in patients with Diabetic Neuropathy.
Materials and methods: In current prospective, double-blind, placebo controlled, age matched study, 90 patients participated with Diabetes Mellitus Type 2 (DMT2), who received metformin for at least four years previously and they randomized in two groups: group A: n=44 received the tablet and group B: n=46 placebo. All patients had been diagnosed with neuropathy peripheral and autonomic and they were Vit. B12 deficient (n.v.>450 pmol/L). The following methods used for detecting Diabetic Peripheral and Autonomic Neuropathy: Michigan Neuropathy Screening Instrument Questionnaire and Examination (MNSIQ and MNSIE), measurement of vibration perception threshold with biothesiometer (BIO) and Cardiovascular Autonomic Reflex Tests (CARTS) assessed by: mean circular resultant (MCR), Valsalva index (Vals), 30:15 ratio and orthostatic hypotension (OH). Sural nerve functions were measured using DPN Check [sural nerve conduction velocity (SNCV) and amplitude (SNAP)]. Moreover, sudomotor function was assessed with measurement of hand and foot Electrochemical Skin Conductance (H and FESC) using the Sudoscan device. We used a pain (PAIN) and a quality of life (QL) questionnaire.
Results: All values of laboratory tests and indices of measurements between the two groups did not differ at baseline A vs B including HbA1c [6.79±0.69% vs 6.81(51 mmol/mol)±0.72% p=0.874, Vit.B12 235±73 vs 231±86 pmol/L p=0.817). The following indices improved significantly in group A (baseline vs final): BIO 32±13 vs 25±14 volts (p<0.001), MNSIQ 5.8±2.2 vs 5.4±2.1 (p=0.002), QL 39.9±10.3 vs 38.1±9.5 (p<0.0001), PAIN 18.4±9.7 vs 17.1±9.0 (p<0.0001), SNCV 28.1±22.7 vs 30.3±23.2 m/s (p<0.0001), SNAP 5.4±4.3 vs 7.3±4.7 uV (p<0.0001) and FESC 72.8±10.1 vs 74.5±10.1 μS (p=0.014). Indices of CARTS and MNSIE did not differ significantly in group A (baseline vs final). Vit. B12 increased in group A 235±73 vs 776.7±242.2 pmol/L (p<0.0001) and was unchanged in group B. We observed a significant deterioration in the following indices in group B (baseline vs final): MCR 16.3±25.0 vs 7.9±11.8 (p=0.025), MNSIQ 5.9±2.0 vs 6.2±2.0 (p=0.017), SNCV 34.8±24.5 vs 32.9±24.2 m/s (p=0.045), SNAP 5.1±4.1 vs 4.6±4.0 uV (p<0.0001) and PAIN 19.3±8.5 vs 20.9±8.5 (p<0.0001).
Conclusion: In current study after 12 months from the administration of the oral dispersible tablet containing Vit.B12 in patients with DMT2 (group A), we observed a beneficial effect on all indices of peripheral neuropathy including neurophysiological parameters, sudomotor function, Pain and Quality of Life except CARTS and MNSIE. Levels of Vit. B12 normalized in group A. In group B neurophysiological parameters, parasympathetic function and Pain deteriorated. The tablet could be helpful in the management of type 2 patients with diabetic neuropathy, with good glycemic control and Vit. B12 deficiency.
Disclosure: T. Didangelos: None.
844
Dapagliflozin and measures of cardiovascular autonomic function in patients with type 2 diabetes
L. Ang1, K. Kidwell2, B. Dillon3, J. Reiss1, V. Leone4, K. Mizokami-Stout1, R. Busui1;
1Internal Medicine; Metabolism, Endocrinology and Diabetes Division, University of Michigan, Ann Arbor, 2School of Public Health, University of Michigan, University of Michigan, Ann Arbor, 3Medical School, University of Michigan, University of Michigan, Ann Arbor, 4Metabolism, Endocrinology and Diabetes Division, University of Michigan, University of Michigan, Ann Arbor, USA.
Background and aims: Beneficial effects of sodium-glucose cotransporter-2 inhibitors on cardiovascular outcomes in patients with type 2 diabetes (T2D) have been reported. We hypothesized that these benefits may be due to modulatory effects on the sympathetic/parasympathetic imbalance through blunting of the expected compensatory increase in heart rate associated with lowering blood pressure. We aimed to evaluate the effect of dapagliflozin (DAPA) on measures of cardiovascular autonomic neuropathy (CAN) and cardiac function as assessed by the B type natriuretic peptide (BNP) in patients with T2D.
Materials and methods: We performed a pilot, randomized, 2-period crossover clinical trial comparing 12 weeks of glucose lowering intervention with DAPA versus glimepiride on measures of CAN [standardized cardiovascular autonomic reflex tests (CARTs) and heart rate variability (HRV)] assessed at baseline and at the end of each drug period. Signed rank tests and mixed models were used to evaluate the differences in CARTs and HRV indices from baseline to 12 weeks between each drug period. Serum BNP was collected as a biomarker of left ventricular function during each study drug period.
Results: Preliminary data are presented for 41 participants with T2D on metformin monotherapy (mean age 57 ± 8 years, mean diabetes duration 7 ± 6 years, mean HbA1c 7.8 ± 1.3%) at baseline. Although there were no significant differences in indices of CAN between the 2 study drug periods, there was a trend for higher expiration and inspiration (E/I) ratio during DAPA treatment compared with glimepiride (mean change 0.02 ± 0.10; p=0.07). Using mixed effects models, we found significant or near significant interactions between sex and treatment for the root mean square of the differences of successive RR intervals (rmsSD) (p=0.021) and Valsalva ratio (p=0.06) in women on DAPA versus glimepiride compared with men. In women, the mean 12-week change for both measures on DAPA was larger than the mean change on glimepiride, whereas in men, the mean 12-week change was larger on glimepiride than DAPA. The changes in the BNP levels from baseline were similar in the 2 study drug periods (mean change 3.99 ± 16.62 pg/ml, p=0.23, with DAPA vs. glimepiride).
Conclusion: These pilot data suggest that DAPA may have beneficial effects on measures of CAN particularly in women with T2D, in spite of short treatment duration. These findings need to be confirmed in larger prospective studies with longer follow-up.
Clinical Trial Registration Number: NCT02973477
Supported by: ESR 15-11724
Disclosure: L. Ang: None.
845
Glycyrrhizic acid ameliorates dysfunction of peripheral nerve in streptozotocin-induced diabetic rats
Y. Xu, M. Shi, H. Zhang;
Huai’an First Hospital Affiliated to Nanjing Medical University, Huai’an, Jiangsu, China.
Background and aims: Inflammation plays a crucial role in the development of diabetic peripheral neuropathy (DPN). The effects of high-mobility group box-1 (HMGB1, a vital factor for inflammatory response) in DPN remain unexplored. Although HMGB1 inhibitor is proved to modify autoimmune diseases, it is unclear whether the HMGB1inhibitor have therapeutic effects on DPN. The study was aimed to assess the role and mechanism of HMGB1 inhibitor on peripheral nerve injury in diabetic rats.
Materials and methods: We established the DPN rat model by intraperitoneal injection of streptozotocin (STZ) and treated with glycyrrhizic acid (GA, a specific inhibitor of HMGB1) or saline for 8weeks. The rats were randomly assigned to control group (Control), diabetic group (Diabetic), and GA-intervened diabetic group (Diabetic+GA). The therapeutic effects were compared by examining nerve conduction velocities (NCV), histopathological alteration and inflammatory cells infiltration in the sciatic nerve. The mRNA expression of inflammatory cytokines (TNF-α, IL-1β, IL-6, MCP-1 and ICAM-1), NADPH oxidase 4 (Nox4) and neurotrophic factors in the sciatic nerve were also investigated by quantitative real-time PCR. Furthermore, we evaluated caspase-3, HMGB1, receptor for advanced glycation end products (RAGE), nuclear factor Kappa B (NF-κB) and mitogen-activated protein kinases (MAPKs) levels by Western blotting.
Results: GA significantly improved NCV deficit, morphology abnormality, CD14-positive cells infiltration and inflammatory cytokines mRNA expression observed in the sciatic nerve of diabetic rats, with accompanying attenuations of HMGB1and RAGE protein expression. These neuroprotective effects of GA may be attributed to the prevention of the caspase-3 protein and Nox4 mRNA expression increase and neuritin and nerve growth factor (NGF) gene levels decrease and to the extenuated p38-MAPK/NF-κB pathway activation (as evidenced by p38-MAPK phosphorylation and NF-κB translocation) under diabetes stimulation.
Conclusion: Our findings reports firstly here that GA mitigated sciatic nerve dysfunction and inflammation reaction in diabetic rats via suppression of HMGB1 and inactivation p38-MAPK/NF-κB signaling pathway.
Supported by: NSFC (81200595/81400807/81700723)
Disclosure: Y. Xu: None.
846
Treatment of painful diabetic neuropathy using Frequency Rhythmic Electro Magnetic neural Stimulation: effectiveness in daily practice
B.P.M. Imholz1, J. Heijster1, A.A. Tahrani2, A. Kooy3;
1Internal Medicine, ETZ, Waalwijk, Netherlands, 2Endocrinology, Institute of Metabolism and Systems Research, Burmingham, UK, 3Internal Medicine, Bethesda Diabetes Research Center, Hoogeveen, Netherlands.
Background and aims: Painful Diabetic Peripheral Neuropathy (PDPN) is a common and difficult to treat condition with limited treatment options. In this study we assessed the efficacy of Frequency Electro Magnetic neural Stimulation (FREMS) in patients with PDPN.
Materials and methods: An uncontrolled prospective study of patients with PDPN and persistent pain despite at least two lines of pharmacotherapy (including pregabalin or duloxetine or similar). The primary outcome was 50% reduction in pain scores at 1 and 3 months post FREMS. FREMS was applied as per the manufacturer protocol to both legs below the knees using 4 sets of electrodes per leg; the treatment consisted of 10 sessions of 35 min applications given over 14 days. FREMS was repeated every 4 months and patients were followed up for 12 months. Pain was assessed using the Neuropathic Pain Symptom Inventory (NPSI). Quality of life (QOL) was assessed using the EQ-5D.
Results: Out of 336 subjects 248 patients met the inclusion criteria (56% men, average age and diabetes duration were 65 and 12.6 years respectively. FREMS was associated with a median decrease NPSI of 31% at M1 (range -100;+93%), and a median decrease of -37.5% at M3 (range -100;+250%). The needed 50% reduction in pain severity was reached in 80/248 (32.3%) and 87/248 (35.1%) after M1 and M3 respectively. The change in NPSI was accompanied by an decrease in self reported use of opiates of over 50 % (see Figure) Explanation: Effect of FREMS on self-reported used medication for Neuropathy during the 52 week period of follow-up. The diamonds represent all medications (solid black), the use of pregabalin (bleu squares), the use of amitriptyline (light-green downward arrows), the use of gabapentin (black upward arrow), morphine (green dots) and duloxetine (red arrow).
Conclusion: In this study, FREMS treatment was associated with significant reduction in pain severity over three months period in patients who did not have adequate response to pharmacotherapy. RCTs examining the role of FREMS as a treatment for PDPN in non-responders to pharmacotherapy are needed.

Disclosure: B.P.M. Imholz: None.
PS 80 Understanding clinical neuropathy
847
Understanding the structural changes in diabetic neuropathy
M. Le Marois1, R. Longuespee2, D. Schwarz3, P. Nawroth1, T. Fleming1;
1Department of Medicine I and Clinical Chemistry, Universitätklinikum Heidelberg, Heidelberg, 2Department of clinical pharmacology and pharmacoepidemiology, Universitätklinikum Heidelberg, Heidelberg, 3Department of Neuroradiology, Universitätklinikum Heidelberg, Heidelberg, Germany.
Background and aims: Diabetic neuropathy (DN) remains the most prevalent complication of diabetes affecting up to 50% of patients both with type 1 and type 2. It has been found that patients with DN have lesion on the proximal region of the sciatic nerve, which is associated with the clinical scoring. The nature of these lesions, which present a bright focus spots within the fascicles of the nerve, remains unknown. The aim of this study is to identify the nature of these lesions.
Materials and methods: Human sciatic nerves were obtained from patients with and without diabetes who had undergone lower limb amputations. The sciatic nerves were scanned by magnetic resonance imaging (MRI), to identify the presence and location of the lesion(s), which were subsequently isolated for histology analysis. Laser micro-dissection was used to isolate fascicles and the proteomic profile from lesion and non-lesion fascicles analyzed by liquid chromatography tandem mass spectrometry (LC-MS/MS).
Results: Lesions from diabetic patients showed increases in proteins associated with immunity and inflammation as well as an overall decrease in proteins associated with the structure of the nerve such as myelin or myelin upkeep associated proteins MBP, PMP2, MPZ and PRX. Decreases in collagen alpha chains as well as neurofilaments were also observed. The biological process of demyelination was not significantly altered; however, dysmyelination, the process of malformed or defective myelin sheath, was up-regulated in the diabetic patients, suggesting that it is not the loss of myelin but the how the myelin is formed which could be the underlining process lead to DN. A potential mechanism for this malformation is increased cellular stress as evidence by increases in proteins involved in the oxidative stress response, such as Glutathione peroxidase 1 (Gpx1) and Glyoxalase I (Glo1). Furthermore, there was a downregulation of proteins involved in carbohydrate metabolism, notably AKR1B1, involved in catalyzing the reduction of glucose to sorbitol, as well as changes in proteins involved with immunity and inflammation.
Conclusion: These results would suggest that within the nerve of patients with DN, there is a significant loss of structural integrity resulting from oxidative stress-dependent dysmyelination.
Disclosure: M. Le Marois: None.
848
Haptics for the evaluation of tactile dysfunction in type 1 diabetes
F. Picconi1, A. Moscatelli2,3, C. Ryan2,3, S. Ciotti3, B. Russo1, F. Lacquaniti2,3, S. Frontoni1;
1Unit of Endocrinology, Diabetes and Metabolism, S. Giovanni Calibita Fatebenefratelli Hospital, Department of Systems Medicine, University of Rome Tor Vergata, Rome, 2Department of Systems Medicine and Centre of Space Bio-medicine, University of Rome Tor Vergata, Rome, 3Laboratory of Neuromotor Physiology, IRCCS Santa Lucia Foundation, Rome, Italy.
Background and aims: The sense of touch is mechanical and it depends on different types of skin deformations. Tactile dysfunctions, mostly in lower limbs, are frequent in diabetic patients with peripheral neuropathy. The evaluation of tactile dysfunctions includes clinical tests like biothesiometry and monofilament tests. Haptics is a novel discipline that studies touch by means of mechatronic devices artificially recreating tactile stimuli. Here, we developed a novel test based on haptics for the evaluation of tactile dysfunctions in the upper limbs of type 1 diabetic patients (DM1).
Materials and methods: 20 DM1 patients (HbA1c < 9.5%) and 13 healthy control subjects (C) comparable in age and gender were enrolled. Patients underwent a neurological assessment with monofilament and vibratory perception (VP) to lower limbs using biothesiometry. Patients were divided in two groups based on VP alterations (VP- and VP+). Tactile sensitivity (TS) has been evaluated in all subjects using a mechatronic device that produced highly precise motions and vibration stimuli. In a forced-choice protocol, subjects contacted the movable surface of the device with their bare fingertip and reported the perceived speed. The protocol was replicated with and without masking vibrations. By means of Generalized Linear Mixed Models (GLMM), we tested the ability of the participants to discriminate motion speed in the two conditions. The steepness of the GLMM measures the ability of the participant to discriminate tactile motion. The higher the GLMM, the worse the tactile sensitivity. Multivariable linear regressions were used to test for differences in GLMM in VP- and VP+ with respect to C.
Results: None of the DM1 patients tested positive in the monofilament test. Mean HbA1c was equal to 7.8% +/- 0.84 (mean +/- SD). DM1 group was divided in 12 VP+ and 8 VP- patients.TS in the upper limbs, as measured with haptics, was significantly lower in VP+ as compared to the C group (p = 0.01). The estimated difference in the slope of the GLMM was -0.27 +/- 0.11 (slope +/- se). With masking vibrations, the GLMM was significantly lower in C with respect to VP+ group (p < 0.001, difference in slope = -0.11 +/- 0.03). In group VP-, the GLMM showed a trend of reduction of TS with respect to healthy controls, that is, considering the three group, we observed the following trend: TS in VP+ < TS in VP- < TS in controls. The effect of masking vibration significantly impaired TS in the three groups (p < 0.0001).
Conclusion: To the best of our knowledge this is the first study evaluating tactile dysfunctions in DM1 patients thanks to haptic technology. Tactile sensitivity in fingertips was significantly lower in patients with reduced vibration sensitivity in lower limbs with respect to controls. In the future, it will be possible to extend this method for lower limbs and introduce haptics in clinical tests for the evaluation of peripheral diabetic neuropathy.
Disclosure: F. Picconi: None.
849
Diabetic neuropathy impacts upper and lower limb muscle strength endurance in patients with type 2 diabetes: a controlled study
B.L.M. Van Eetvelde1, B. Lapauw2, P. Proot3, K. Vanden Wyngaert1, H. Demeyer1, D. Cambier1, P. Calders1;
1Department of Rehabilitation Sciences, Ghent University, Ghent, 2Department of Endocrinology, University Hospital Ghent, Ghent, 3Department of Neurology, University Hospital Ghent, Ghent, Belgium.
Background and aims: The negative impact of diabetic neuropathy (dNP), the most common microvascular complication of type 2 diabetes mellitus (T2DM), on maximal skeletal muscle strength in lower (knee and ankle) and upper (handgrip) limb is widely investigated. As functional activities of daily living demand the use of muscle strength during a given time, muscle endurance also determines functional independence. However, current knowledge about the impact of dNP on muscle endurance in lower and upper limbs is lacking. Therefore, the aim of this study was to compare skeletal muscle endurance of the lower and the upper limbs in T2DM patients without neuropathy (dNP-), with sensory neuropathy (dNPs), with sensorimotor neuropathy (dNPsm) in view of healthy controls without neuropathy (HC).
Materials and methods: Fifty-four men (mean age 65.4 ± 6.68), of whom 35 had T2DM diagnosed according to the ADA criteria, underwent electroneuromyography. Participants were classified as HC, or T2DM patients having no neuropathy (dNP-), or having dNPs or dNPsm. Muscle endurance was evaluated as relative total work in the lower and upper limbs (knee and elbow extension/flexion) by means of isokinetic dynamometry (30 and 25 repetitions resp.; 180° s-1).
Results: Group differences were analyzed using ANCOVA with Sidak post-hoc analysis (p level set a 0.05) with lean body mass of the respective dominant limb (acquired by DXA) as a covariate. Relative total work in knee extension was significantly lower in all diabetic subgroups compared to HC, while for knee flexion only the patients with dNPs and dNPsm had lower muscle endurance. In the upper limb, elbow extension showed only a significant lower muscle endurance when comparing dNPs and dNPsm with HC, while in elbow flexion muscle endurance was only significantly lower in dNPsm compared to HC.
Conclusion: Our study showed that muscle endurance in patients with T2DM is approximately 20% lower than in healthy controls, especially when dNPsm is present. In this study, we could not find a larger impact on knee extension/flexion compared to elbow flexion/extension. However, as muscle endurance is important for functional independence, future research needs to address whether these findings contribute to the higher incidence/prevalence of functional dependence in T2DM patients and unravel the pathophysiological mechanism behind this neuromuscular complication of diabetes.

Disclosure: B.L.M. Van Eetvelde: None.
850
Dupuytrens contracture as a predictor of peripheral polyneuropathy or diabetic foot syndrome
M. Mieczkowski1, T. Głażewski1, E. Rosiak2, E. Maj2, B. Mrozikiewicz-Rakowska1, O. Rowiński2, L. Czupryniak1;
1Department of Diabetology and Internal Medicine, Medical University of Warsaw, Warsaw, 2II Department of Clinical Radiology, Medical University of Warsaw, Warsaw, Poland.
Background and aims: Diabetes is a recognized risk factor for Dupuytren's contracture (DC), especially in men. The mechanism of development of connective tissue disorders leading to the onset of DC is not fully known. Likewise little is known about the relationship between DC and diabetic peripheral polyneuropathy or diabetic foot syndrome. Were these conditions associated, simple hand examination during an outpatient visit would help identify the patients at increased risk of diabetes related lower limb complications. The purpose of the study was to evaluate characteristics changes occurring within the hand in DC and assessment of the relationship between DC and complications of diabetes in the lower limbs.
Materials and methods: 35 patients with clinically overt DC were enrolled into the study (29 men, 6 women, 9 with type 1 diabetes, 17 with type 2 diabetes and 7 with chronic pancreatitis related diabetes, mean duration of diabetes 12±8 years, HbA1c 8.4±2.3%. All patients were evaluated for any lesions within hand flexor tendons and palmar aponeurosis with the use ultrasound and magnetic resonance imaging. Full medical examination towards peripheral polyneuropathy was conducted and advanced glycation end-products (AGE) were evaluated non-invasively with autofluorescence measurements performed in forearm skin tissue (AGE Reader, Diagnoptics, Groningen, Netherlands). A functional examination of the flexor function of the fingers was also performed using a goniometer.
Results: Peripheral polyneuropathy was found in 26 (79%), and diabetic foot syndrome in 22 (67%) patients. The magnetic resonance imaging revealed unchanged hand flexor tendon or muscles, however significant increase in the thickness of the palmar aponeurosis of the area of 6.4±3.2 x 3.0±1.6 mm found. In the goniometer test the adduction was reduced in the metacarpal joint by mean 2.6 ' (max. 15'), and in the proximal interphalangeal joint by 12.2' (max. 85'). A statistically significant positive correlation was found between HbA1c and width of palmar aponeurosis thickening (r = 0.57; p <0.05) and between AGEs presence and length of aponeurosis thickening (r = 0.39; p <0.05). In patients with peripheral polyneuropathy AGEs were more severe in comparison to the patients without neurological complications (2.80±0.39 vs 2.28±0.55; p <0.05), similar difference was noted for the patients with and without diabetic foot syndrome (2.84±0.41 vs 2.44±0.43; p <0.05).
Conclusion: Majority of patients with diabetes and Dupuytren's contracture were diagnosed with chronic complications of diabetes in the lower limbs. Severity of palmar aponeurosis thickening was directly related to the level of hyperglycemia and the AGE formation process. Dupuytren’s contracture may be used as a predictor of chronic diabetes complications within lower extremities.
Disclosure: M. Mieczkowski: None.
851
Association of long-term air pollution with prevalence and incidence of distal sensorimotor polyneuropathy: KORA F4/FF4 Study
C. Herder1,2, A. Schneider3,2, S. Zhang3, K. Wolf3,2, H. Maalmi1,2, R. Pickford3, G.J. Bönhof1,4, W. Koenig5,6, W. Rathmann1,2, M. Roden1,4, A. Peters3,2, B. Thorand3,2, D. Ziegler1,4;
1German Diabetes Center, Düsseldorf, 2German Center for Diabetes Research (DZD), München-Neuherberg, 3Helmholtz Zentrum München - German Research Center for Environmental Health, Neuherberg, 4Medical Faculty, Heinrich Heine University, Düsseldorf, Germany, 5Technical University of Munich, München, 6University of Ulm, Ulm, Germany.
Background and aims: Air pollution contributes to type 2 diabetes and cardiovascular diseases, but its relevance for other complications of diabetes is unclear. Therefore, we aimed to assess the associations between air pollutants and distal sensorimotor polyneuropathy (DSPN).
Materials and methods: Cross-sectional analyses on prevalent DSPN were based on 1,075 individuals aged 62-81 years from the population-based German KORA F4 survey (2006-2008). Analyses on incident DSPN used data from 424 study participants without DSPN at baseline (KORA F4), of whom 188 had developed DSPN until the KORA FF4 survey (2013-2014). Associations of long-term air pollution at residence with prevalent and incident DSPN were estimated using logistic regression models adjusting for multiple confounders.
Results: Higher particle number concentrations (PNC) were associated with higher prevalence (p<0.05) and incidence (p<0.1) of DSPN. In subgroup analyses, particulate (PNC, PM2.5, PM2.5abs) and gaseous (NOx, NO2) pollutants were positively associated with prevalent DSPN in the obese (both p<0.05), but not in the non-obese group. Higher PNC and NOx were also associated with incident DSPN in the obese group (p<0.01), but not in non-obese individuals (pinteraction<0.05). Odds ratios for incident DSPN per interquartile range increase of coarse particulate matter (PMcoarse), PM2.5 and NO2 were higher in the obese than in the non-obese population (1.54-1.73 vs. 0.77-0.85, respectively; pinteraction<0.05), but associations were not significant in either subgroup.
Conclusion: Both particulate and gaseous air pollutants were positively associated with prevalent and incident DSPN in obese individuals. Obesity and air pollution may have synergistic effects on the development of DSPN. Our data reinforce the importance of measures to reduce both exposure to air pollution and strategies to prevent obesity in the general population.
Supported by: DZD
Disclosure: C. Herder: None.
852
Circulating messenger RNA of the protein Myelin Protein Zero as a non-invasive marker for sensory loss of the upper extremity in patients with type 2 diabetes
Z. Kender1,2, J. Morgenstern1, L. Alvarez-Ramos1, R. Prikulis1,2, T. Fleming1, P.P. Nawroth1,2, S. Kopf1,2;
1University Hospital Heidelberg, Heidelberg, 2German Center for Diabetes Research (DZD), Munich-Neuherberg, Germany.
Background and aims: We previously demonstrated that Myelin Protein Zero cmRNA is a potential diagnostic marker for diabetic neuropathy (DPN). DPN of the upper extremity has a functional relevance, but no validated diagnostic tool such as scores or questionnaires exists to evaluate diabetic neuropathy on the hand. Here we hypothesized that this mRNA marker may also be substantial in the diagnosis of DPN on the hands.
Materials and methods: 40 Patients with type 2 diabetes and 18 age-matched control subjects were enrolled and evaluated for DNP of the upper and lower extremity using neuropathy scores, nerve conduction studies, quantitative sensory testing, and functional tests of a hand performance. Additionally, cmRNA expression of MPZ was measured in the serum in all participants.
Results: We found a significantly reduced expression of MPZ in patients with type 2 diabetes compared to those without neuropathy and healthy controls respectively (p<0.001). Hand dexterity and hand strength correlated significantly with MPZ expression (r=0.27, p=0.03 and r=0.41, p=0.009). Furthermore, univariate and multivariate analyses revealed that decreased MPZ cmRNA levels were significantly associated with loss of function for mechanical detection on the hands (r=33, p=0.03), and feet (r=0.42, p=0.007), while no associations were found for hyperalgesia. Multivariate regression analysis confirmed that MPZ cmRNA levels were the only predictor for sensory loss.
Conclusion: MPZ cmRNA is a potential noninvasive marker not only for the diagnosis of DPN of the lower limb, but also for the sensory loss and functional impairment of the hands in patients with type 2 diabetes.
Clinical Trial Registration Number: NCT03022721
Supported by: German Center for Diabetes Research, German Research Foundation CRC1158 and CRC1118
Disclosure: Z. Kender: Grants; German Center for Diabetes Research (DZD e.V.).
853
Impaired vibration perception thresholds precede nephropathy and macrovascular disease, but not retinopathy in patients with type 1 diabetes
E. Lindholm1, L. Ekman2, T. Elgzyri1, M. Löndahl3, L. Dahlin2;
1Department of Endocrinology, Lund University, Malmo, 2Department of Hand Surgery, Lund University, Malmo, 3Department of Endocrinology, Lund University, Lund, Sweden.
Background and aims: Diabetes is associated with systemic microvascular complications, including retinopathy, nephropathy and neuropathy. The cumulative incidence of diabetic peripheral neuropathy in the Diabetes Control and Complications Trial (DCCT) was 15-20 % after at least 20 years duration and depended on the complication status at baseline. Patients with neuropathy are more likely to have retinopathy and a reduced glomerular filtration rate. The aim of this study was to investigate the relationship between neuropathy, based on vibration perception thresholds (VPTs) at six frequencies (4-125 Hz), and late diabetic complications.
Materials and methods: VPTs were measured at six frequencies (4, 8, 16, 32, 64 and 125 Hz) on the plantar surface of metatarsal heads 1 and 5 on both feet, using a VibroSense Meter device, in 540 individuals with type 1 diabetes and 717 non-diabetic control subjects. Retinopathy (DRP) status was graded using International Clinical Disease Severity Scale. Grade of albuminuria and previous history of ischemic heart disease, cerebrovascular disease or peripheral arterial disease were registered. Presence of neuropathy was defined as having at least 50% of the VPTs at 4, 8, 64 and 125 Hz frequencies above 1 SD for the age- and gender-specific normal values. Macrovascular disease was defined as presence of cardiovascular, cerebrovascular and/or peripheral arterial disease.
Results: Patients without DRP had similar VPTs as non-diabetic age- and gender-matched controls, whereas patients without microalbuminuria (miAU) had higher VPTs than age- and gender-matched non-diabetic controls. Seven out of 133 (5.3%) patients with neuropathy had no signs of DRP and 282/408 (69.8%) patients with retinopathy had normal VPTs. In contrary, only 25/61 (41%) patients with miAU had normal VPTs and 97/133 (72.9%) patients with neuropathy had no micro- or macroalbuminuria. Twenty-five patients out of 63 (39.7%) with macrovascular disease had normal VPTs and 96/134 (71.6%) patients with neuropathy had no history of macrovascular disease. The values of vibration perception thresholds increased with more advanced DRP (none, background, or sight threatening), and with more advanced albuminuria (none, micro-, macroalbuminuria). Table 1 shows the results of a multinomial logistic regression analysis. Neuropathy was independently associated with retinopathy, nephropathy and macrovascular complications.
Conclusion: Diabetic neuropathy in the sole of the feet, defined as abnormal VPTs at both low and/or high frequencies, is associated with both micro- and macrovascular complications. Neuropathy seems to be rare in T1DM patients without retinopathy. Patients with microalbuminuria seem to have developed neuropathy, suggesting that retinopathy usually is an initial complication, followed by neuropathy and nephropathy.

Supported by: Governmental Agency for Innovation Systems and the Skåne Research and Development
Disclosure: E. Lindholm: None.
854
Corneal confocal microscopy detects small fiber neuropathy in patients with severe hypertriglyceridaemia and type 1 diabetes
L. D'Onofrio1,2, A. Kalteniece2, M. Ferdousi2, I. Petropoulos3, G. Ponirakis3, R. Buzzetti1, R. Malik2,3, H. Soran2;
1Department of Experimental Medicine, “Sapienza” University of Rome, Italy, Roma, Italy, 2Institute of Cardiovascular Sciences, Cardiac Centre, Manchester, UK, 3Department of Medicine, Weill-Cornell Medicine-Qatar, Doha, Qatar.
Background and aims: Higher levels of triglycerides have been shown to play a role in the development of diabetic neuropathy. The aim of this study was to establish whether patients with severe hypertriglyceridaemia show evidence of small nerve fibre damage evaluated by corneal confocal microscopy (CCM), compared to patients with type 1 diabetes (T1D) and healthy subjects.
Materials and methods: 24 patients with severe hypertriglyceridaemia (43.9±12.6 years), 21 patients with T1D (44.4±13.5 years) and 19 age-matched healthy controls (50.1±13.8 years) underwent CCM to quantify corneal nerve fiber density (CNFD) (no./mm2), corneal nerve branch density (CNBD) (no./mm2), corneal nerve fiber length (CNFL) (mm/mm2) and inferior whorl length (IWL) (mm/mm2).
Results: Age and body mass index (BMI) did not differ significantly but total cholesterol and triglycerides were significantly increased and HDL was lower in patients with hypertriglyceridaemia and controls (Table 1). Patients with severe hypertriglyceridemia had a significantly lower CNFD (p<0.001), CNBD (p<0.001), CNFL (p<0.001) and IWL (p<0.001) compared to controls and significantly lower CNFD (p<0.05) and CNFL (p<0.001) compared to T1D. Patients with T1D showed significantly lower CNFD (p<0.05), CNBD (p<0.05) and IWL (p<0.001) compared to control subjects. In patients with severe hypertriglyceridemia there was a significant negative correlation between serum triglycerides and CNFD (rho= -0.234, p<0.01), CNBD (rho= -0.644, p=0.043), CNFL (rho= -0.164, p=0.006) and IWL (rho= -0.359, p=0.034) after adjustment for age.
Conclusion: Hyperglycaemia was confirmed as a major risk factor for small-fibre neuropathy, in patients with T1D, however, this study shows that hypertriglyceridaemia per se is associated with small fibre damage observed using CCM.

Disclosure: L. D'Onofrio: None.
PS 81 From artificial intelligence to treatment of diabetic foot
855
The artificial neuronal network model for six-month prognosis in diabetic foot syndrome
A.A. Poradzka, L. Czupryniak;
Diabetology and Internal Diseases, Medical University of Warsaw, Warsaw, Poland.
Background and aims: Diabetic foot ulceration (DFU) is one of the most traumatic complications of diabetes. It is a challenge to make a reliable prognosis on foot wound healing outcomes in new patients.
We used the artificial neuronal network (ANN) to identify the most significant variables which affect DFU healing process. The model was also used for designing a digital application which could help practitioners to predict the course of healing in DFU. We present results of six months’ follow up since the beginning of DFU therapy.
Materials and methods: We enrolled 175 in-patients with 213 DFU limbs into the study and examined them using a variety of diagnostic tests. All patients and their DFU treatment outcomes were followed for six months. The study group comprised mostly of men (74%) and type 2 diabetes patients (87%) with various diabetes duration (16.9+/-10 years) and control (HbA1c 8.2+/-2 %). In the initial model, we measured 35 clinical and biochemical variables. With the help of traditional statistics (ANOVA, correlations, discriminant analysis, multiple regression) we reduced their number to eleven, and after conducting the sensitivity analysis, we found out that the final number of significant variables is seven. We applied the proportion of teaching-test-validation groups: 70%:15%:15%.
Results: According to the ANN model, the most significant variables in predicting the outcome of DFS healing seemed to be: the presence of blood flow in Doppler probe, presence of osteolysis in X-ray examinations, presence of Charcot’s joint, probe-to-bone test result, prior amputation within the foot, and the area and duration of the ulceration. We created an ANN with twelve input neurons, seven hidden nodes and two output neurons. The area under the ROC curve for teaching, test and validation groups was 0.83 (Fig. 1). The total accuracy was 77%, sensitivity 77%, specificity 78% and F1 score 78.5%. The ANN results were better than the results of the logistic regression model based on the same data set, which achieved the area under the ROC curve 0.72.
Conclusion: ANN can be effectively used in the prediction of the DFU course. The algorithm, which is the source for designing a simple digital application, is effective in predicting the healing outcomes within six months. Making this sort of reliable prediction could help clinicians plan DFU treatment course and provide reliable information on the course of the disease to patients, and subsequently it might help the patients adjust their lifestyle accordingly.

Disclosure: A.A. Poradzka: None.
856
Epidemiology of lower extremity amputations in individuals with diabetes in Austria, 2014-2017
F. Aziz1,2, B. Reichardt3, H.-P. Dimai1, C. Caren Sourij1, D. Reichart3, G. Köhler1, H. Sourij1;
1Division of Endocrinology and Diabetology, Department of Medicine, Medical University of Graz, Graz, 2Center for Biomarker Research in Medicine (CBmed), Graz, 3Austrian Health Insurance, Vienna, Austria.
Background and aims: Lower extremity amputation (LEA) is a serious complication of diabetes that results in high mortality and reduced quality of life. Significant variations in diabetes-related LEA rates have been documented among European countries. However, recent data on the epidemiology of LEA are scarce in Austria. Therefore, this study estimated the incidence and mortality rates of LEA and explored risk factors of mortality after LEA in individuals with diabetes.
Materials and methods: A retrospective data analysis of 500,073 individuals with diabetes enrolled in 12 health insurances across Austria between 2014 and 2017 was performed. Crude and age-standardized rates of major (hip, femur, knee, lower leg) and minor (forefoot, toe) LEA were estimated extracting their procedure (MEL) codes. All-cause cumulative mortality was estimated for 30-days, 1-year, 5-years, and over the entire study period. The mortality rate was estimated using the person-time calculated from the date of LEA till the date of death. Age-adjusted Charlson co-morbidity index (ACCI) was generated using the International Classification of Disease (ICD) 9 and 10 codes. Poisson regression was performed to assess the trend in LEA rates, and the Cox-regression analysis was performed to investigate significant risk factors of all-cause mortality after LEA.
Results: A total of 4,535 individuals with diabetes underwent LEA between 2014 and 2017. The average age of amputees was 71.5 ±11.4 years and 68.5% were males. Major amputations constituted 50.7%, and minor amputations 49.3% of the total LEA. Age standardized rate (per 100,000 population) of LEA was 10.9 (95%Confidence Interval [CI]: 10.6-11.2), major LEA was 6.1 (95%CI: 5.9-6.3), and minor LEA was 5.4 (95%CI: 5.1-5.6). Rates of LEA were significantly higher (p <0.001) in males (17.2 [95%CI: 16.6-17.8]) than females (5.8 [95%CI: 5.5-6.1]). Rates for major LEA were 6.0 (95%CI: 5.5-6.5) in 2014, 6.7 (95%CI: 6.2-7.3) in 2015, 7.3 (95%CI: 6.8-7.9) in 2016, and 7.3 (95%CI: 6.7-7.8) in 2017, with an insignificant annual percentage change of 3.3% (p: 0.532). Overall cumulative mortality was 41.2% (95%CI: 39.7-42.6), 30-day mortality was 9.8% (95%CI: 8.9-10.7), 1-year mortality was 27.1% (95%CI: 25.9-28.5), 5-year mortality was 50.1% (95%CI: 48.4-51.9), and the mortality rate was 222.6 (95%CI: 212.6-233.0) per 1000 person-years. Risk of mortality after LEA increased with age (adjusted hazard ratio [aHR]: 1.03, 95%CI: 1.02-1.04, p: <0.001), accumulation of co-morbidities (aHR: 1.13, 95%CI: 1.11-1.15, p: <0.001), major amputations (aHR: 1.72, 95%CI: 1.55-1.90, p: <0.001), peripheral artery disease (aHR: 1.27, 95%CI: 1.08-1.48, p: 0.004), chronic obstructive disease (aHR: 1.20, 95%CI: 1.06-1.35, p: 0.001), and renal disease (aHR: 1.53, 95%CI: 1.38-1.69, p: <0.001).
Conclusion: Diabetes-related major LEA rates remained stable between 2014 and 2017 in Austria. Short and long-term mortality rates are considerably high and old age, major amputations, and presence of co-morbidities significantly increase the risk of mortality after LEA.
Disclosure: F. Aziz: None.
857
The influence of diabetes duration on the dynamics of foot deformity prevalence in people with diabetes
V. Urbančič-Rovan1,2, I. Štotl1;
1Department of Endocrinology, University Medical Centre Ljubljana, Ljubljana, 2University of Ljubljana, Ljubljana, Slovenia.
Background and aims: Foot deformity is a significant risk factor for diabetic foot ulceration. Regular foot screening is mandatory to detect the presence and extent of foot deformity. Published data on foot deformity progression over time are scarce. We explored the dynamics of foot deformity progression in the population of patients with diabetes attending our diabetes clinic.
Materials and methods: Data from foot screenings between the years 1996 to 2019 were obtained from the local database at a single tertiary diabetic foot clinic and analyzed in order to obtain an insight into the dynamics of different foot deformities (hallux valgus, fat pad atrophy, toe nail deformity, claw/hammer toes, Charcot foot) over time. The results were grouped according to years of diabetes duration at the time of screening (0 to 25 years). A relative proportion of persons with confirmed pathological finding in observed parameter was calculated for each year. Furthermore, the associations between proportions of present pathology in observed parameters and duration of diabetes were determined using correlation and linear regression.
Results: A total of 10.521 routine screenings were performed in the observed period. From 3.206 subjects with mean 3.28 (±2.54) observations per person (2.443 with type 2, 472 with type 1, 291 with other types of diabetes) that were selected for the study, only subjects with type 2 and type 1 diabetes were included in further detailed analysis. Mean age at the time of screening was 49.7 (12.7) years for persons with type 1 and 67.6 (10.5) years for persons with type 2 diabetes. Correlation between the proportion of persons with at least one of the observed deformities and years of type 2 diabetes duration was strong, positive and significant (r=0.94, P < 0.001). A significant linear regression model was obtained when predicting deformity rate from the years of diabetes duration in people with type 2 (1.02%/year; CI: 0.85 - 1.2, P < 0.001) and type 1 diabetes (0.91%/year; CI: 0.48 - 1.34, P < 0.001). Progression of deformities in type 2 diabetes was faster in men (1.19 %/year; CI 0.96 - 1.41) than in women (0.79 %/year; CI 0.53 - 1.05), with lower estimated proportion of deformities at the time of diagnosis of diabetes in men (53.1%; CI 50.0 - 56.3) than in women (66.1%; CI 62.5 - 69.9). We did not confirm the association between positive history of smoking and progression of deformities in people with type 2 diabetes (smokers 0.87 %/year (CI 0.66 - 1.09); non-smokers 1.07 %/year (CI 0.81 - 1.35)). Progression of single types of deformities is shown in Table 1.
Conclusion: Foot deformities are frequently present at the time of diagnosis of diabetes. A prediction model for prevalence of deformities was created that could be used in diabetic foot care resource planning.

Disclosure: V. Urbančič-Rovan: None.
858
Cold atmospheric pressure plasma for accelerated wound healing in diabetic foot: the prospective, randomised, placebo-controlled KPW-Trial
T.-C. Costea1, B. Stratmann1, C. Nolte1, J. Hiller1, J. Schmidt2, J. Reindel2, K. Masur3, W. Motz2, J. Timm4, W. Kerner2, D. Tschoepe1;
1Herz- und Diabeteszentrum NRW, Ruhr Universität Bochum, Bad Oeynhausen, 2Klinikum Karlsburg der Klinikgruppe Dr. Guth GmbH & Co KG, Karlsburg, 3Leibnitz Institut für Plasmaforschung und Technologie, Greifswald, Germany, 4Competence Center for Clinical Studies Bremen, Bremen, Germany.
Background and aims: Diabetic foot is a common complication of diabetes mellitus and requires specialised treatment. Cold plasma has demonstrated beneficial effects on wound infection and healing in case reports. The “Kaltplasma Wund (KPW)-Trial” aimed to analyse whether the application of cold plasma accelerates wound healing in diabetic foot compared to standard care therapy.
Materials and methods: The KPW-trial was a prospective, randomised, placebo-controlled, patient-blinded, bi-center trial. People with diabetes mellitus and diabetic foot WA 1B or 2B were eligible. Each wound was randomized separately. In addition to standart care, wounds were treated additionally with cold plasma generated from inert argon gas in an atmospheric pressure plasma jet or placebo. Primary endpoints were reduction in wound size, in clinical infection and microbial load compared to beginning. Important secondary endpoints were time to significant wound reduction (>10%), and to reduction of infection. Ad hoc we analysed the time to 20% wound reduction. In addition, wound dressings from 15 patients per group were analysed for expression of VEGF via ELISA.
Results: In total 65 cases were included in the study and 62 were considerable for final evaluation. Plasma therapy yielded in a significant increase of wound healing, both in total area reduction (-26.31±11.72, p=0.0248 vs. placebo) as well as time to significant wound area reduction (10% from baseline, -1.60±0.58, p=0.0085 vs. placebo). The effect was even more significant, if the reduction level was set to 20% (p<0.0001). Reduction of infection and microbial load was not significantly pronounced in plasma therapy. Regarding the expression of VEGF wounds in the plasma group presented throughout the study with at most visits significant higher levels of baseline corrected VEGF that wounds randomized to placebo therapy.
Conclusion: Cold plasma therapy revealed beneficial effects in chronic wound treatment in terms of wound surface reduction and time to wound closure independent from background infection.
Clinical Trial Registration Number: NCT04205942
Disclosure: T. Costea: None.
859
Impact of immunosuppressive therapy on healing and clinical course of diabetic foot ulcers
M. Dubsky, R. Bem, A. Nemcova, V. Fejfarova, J. Husakova, A. Jirkovska, V. Woskova;
Diabetes Centre, Institute for Clinical and Experimental Medicine, Prague, Czech Republic.
Background and aims: Healing of diabetic foot ulcers (DFU) can by influenced by many factors, one of the factors that could decelerate the healing rate of DFU is the use of immunosuppresive therapy, especially in patients after transplantation of solid organs. Antiproliferative agent sirolimus, a member of mTOR (mammalian target of rapamycin) inhibitors decreases the healing after surgical procedures. The aim of our study was to assess the impact of sirolimus on the healing of chronic wounds and to compare it with other immunosuppressive agents.
Materials and methods: One hundred ninety-two patients after transplantation of solid organs (kidney, pancreas, liver or heart) or by a transplant of Langerhans islets treated in our foot clinic between 2005 and 2018 with a new ulcer were consecutively included into the study. Patients were divided into group 1 using sirolimus (n = 51) and into group 2 using other immunosuppresive agents (n = 141), which were most frequently mycophenolate mofetil, prednisone or cyclosporine. All patients were followed-up for 12 months. The main endpoints of the study were: healing of the index ulcer (defined as epithelized ulcer for at least 6 weeks), ulcer recurrence and major amputation rate.
Results: We observed in patients in group 1 treated by sirolimus significantly less healed ulcers compared to group 2 treated by other agents after 3 months (5.8 vs 36.8 %, p < 0.001), 6 months (9.8 vs 56.7 %, p < 0.001), 9 months (33.3 vs. 75.2 %, p = 0.009) and 12 months (58.8 vs. 81.6 %, p = 0,021). Significantly more ulcer recurrence up to 12 months was seen in group 1 compared to group 2 (56.9 vs. 36.2 %, p = 0.026). We found no difference in major amputation rate between both groups (5.9 vs 6.3 %, NS).
Conclusion: Our study showed that the use of sirolimus after transplantation significantly decreased the healing rate of diabetic foot ulcers and more frequently led to ulcer recurrence. Therefore in all patients with chronic wounds using sirolimus a change of therapeutic strategy or a reduction of dose of sirolimus should be considered.
Supported by: the Ministry of Health of the Czech Republic, grant no. 00023001.
Disclosure: M. Dubsky: None.
PS 82 From biomarkers to genetics of diabetic kidney disease
860
Relationship between genetic risk score for kidney function and diabetic kidney disease progression
D. Galuška;
Department of Pathophysiology, Masaryk University, Brno, Czech Republic.
Background and aims: Diabetic kidney disease (DKD) is a serious diabetic complication. Several risk factors contribute to the DKD development or progression (e.g. glucose control, hypertension, dyslipidaemia). Genetic predisposition also contributes to the total risk however it is still insufficiently explored. Recently, several genome-wide association studies (GWAS) identified a number of single nucleotide polymorphisms (SNP) associated with kidney function. We selected 9 SNPs and constructed a genetic risk score (GRS). The aim of the work was to find out whether GRS can predict the progression of DKD or cardiovascular morbidity and mortality in patients with T2DM in the Czech population.
Materials and methods: In total 347 patients (178 males and 169 females) with T2DM and different DKD stage were enrolled in our prospective study. The middle value of observation was 43 [IQR] months. We were evaluating the following end-points: 1. DKD progression (based on GFR), 2. major adverse cardiovascular events (MACV) and 3. all-cause mortality (ACM). DNA was isolated from peripheral blood. Nine SNPs associated with kidney function and/or chronic kidney disease were chosen for this study. SNPs were determined by quantitative PCR (TaqMan® Genotyping Assay).
Results: At the end of the follow-up period, the cumulative incidence was 38.8 %, 14.1 % and 33.3 % for DKD, MACE and ACM, respectively. We calculated unweighted GRS by summing-up the number of risk alleles (each risk allele was considered as one point to total GRS). First, we analysed the potential correlation between GRS and age, T2DM duration, HbA1c, creatinine and GFR. No statistically significant differences were ascertained (all P > 0.05, Spearman). For further analyses patients were stratified by median and quartiles into two and four groups, respectively. Time-to-event analysis using Kaplan-Mayer curves did not show any statistically significant differences between two or four groups, respectively (P>0.05).
Conclusion: The aim of this work was to determine the predictive power of GRS composed of selected SNPs associated with kidney function in patients with T2DM. The results suggest that GRS does not predict DKD progression, MACE or ACM in our cohort.
Supported by: NV18-01-00046
Disclosure: D. Galuška: Grants; The study was supported by the grant NV18-01-00046 from the Ministry of Health of the Czech Republic.
861
The panel of circulating cytokines in patients with type 2 diabetes and different patterns of chronic kidney disease
V.V. Klimontov, A.I. Korbut, N.B. Orlov, M.V. Dashkin;
Research Institute of Clinical and Experimental Lymphology – Branch of the Institute of Cytology and Genetics, Siberian Branch of Russian Academy of Sciences, Novosibirsk, Russian Federation.
Background and aims: A number of recent studies showed that non-albuminuric chronic kidney disease (CKD) became wide-spread complication in patients with type 2 diabetes (T2D). It has been suggested that albuminuric and non-albuminuric CKD patterns could be different in their phenotypes and pathogenic mechanisms. This study aimed to estimate the differences in a panel of circulating cytokines, mediating low-grade inflammation and fibrosis, in patients with T2D and different patterns of CKD.
Materials and methods: We examined 130 patients, 48 M/82 F, with T2D duration above 10 years (median 17 years). Among them, 33 individuals had no signs of CKD (non-CKD group), 33 patients had non-albuminuric CKD (NA-CKD), 32 subjects demonstrated persistently elevated albuminuria and estimated glomerular filtration rate (eGFR) ≥60 ml/min×1.73 m2 (A-CKD- group) and 32 ones had elevated albuminuria and eGFR <60 ml/min×1.73 m2 (A-CKD+ group). A group of 30 individuals without diabetes, obesity and cardiovascular diseases, matched by sex and age, was acted as a control. Serum IL-1β, IL-1ra, IL-2, IL-4, IL-5, IL-6, IL-7, IL-8, IL-9, IL-10, IL-12 (p70), IL-13, IL-15, IL-17A, bFGF, eotaxin, G-CSF, GM-CSF, IFN-γ, IP-10, MCP-1, MIP-1α, MIP-1β, PDGF-BB, RANTES, TNF-α, and VEGF were assessed by multiplex analysis. Serum high-sensitivity C-reactive protein (hsCRP), urinary nephrin and podocin, as podocyte injury markers, and urinary WAP four-disulfide core domain protein 2 (WFDC-2), a marker of tubulointerstitial fibrosis, were assessed by ELISA.
Results: Patients with T2D demonstrated elevated serum levels of IL-1ra, IL-2, IL-4, IL-13, IL-17A, eotaxin, bFGF, G-CSF, IP-10 and MIP-1α and reduced serum levels of IL-9, IL-12, IL-15, GM-CSF, INF-γ, and VEGF as compared to control (all p<0.05). Patients with NA-CKD had higher levels of IL-2, IL-4, IL-5, IL-8, IL-17A, bFGF, G-CSF, MIP-1α and lower level of VEGF when compared to control and CKD- group (all p<0.05). The A-CKD- group was characterized by increased levels of IL-4, IL-7, IL-12, IL-17, G-CSF, IP-10 and MIP-1α (all p<0.05). Moreover, A-CKD- patients had higher levels of IL-1ra, bFGF, GM-CSF and lower concentration of VEGF compared to control (all p<0.05). Patients of NA-CKD group showed higher levels of bFGF, G-CSF, GM-CSF, MIP-1α, IL-4, IL-8 and IL-17 when compared to patients with A-CKD+ (all p<0.05). In a multiple logistic regression analysis, reduced eGFR was associated with hsCRP, IL-4, IL-10, and MIP-1α levels (all p<0.05). However, no associations were found between albuminuria and a panel of cytokines or hsCRP. The levels of hsCRP, bFGF, G-CSF, IP-10, MIP-1α, IL-2, IL-4, IL-5 and IL-17 correlated negatively with eGFR. The excretion of WFDC-2 correlated positively with MIP-1α and hsCRP levels; whereas, negative correlations were found between WFDC-2 and IL-10, IL-15 and VEGF. No correlations were observed between cytokines, urinary albumin-to-creatinine ratio, nephrin and podocin excretion.
Conclusion: Both albuminuric and non-albuminuric CKD patterns are associated with chronic low-grade inflammation in T2D patients. The decreased eGFR and increased urinary excretion of WFDC-2, a marker of tubulointerstitial fibrosis, are associated with a predominance of pro-inflammatory and fibrogenic regulators in the panel of circulating cytokines in these patients.
Disclosure: V.V. Klimontov: None.
862
Trends in the effects of pre-transplant diabetes on mortality and cardiovascular events after kidney transplantation
S. Han, J. Jeon, N. Lee, K. Lee;
Ajou University School of Medicine, Suwon, Republic of Korea.
Background and aims: It is not clear whether survival in kidney transplant recipients with pre-transplant diabetes has improved over the past decades. We compared the rates of mortality and major adverse cardiovascular events (MACE) after renal transplantation in patients with and without pre-transplant diabetes. Furthermore, we investigated whether transplant era and recipient age affected the association between diabetes status and adverse events.
Materials and methods: This retrospective cohort study included 691 patients who underwent renal transplantation between 1994 and 2016 at a single tertiary center. We compared the incidences of post-transplant mortality and four-point MACE in patients with and without pre-transplant diabetes using Kaplan-Meier analysis and the Cox proportional hazard model, and assessed the interactions between diabetes status and transplant era and recipient age.
Results: Of 691 kidney recipients, 143 (20.7%) had pre-transplant diabetes. The mean follow-up duration was 94.5 months. Kaplan-Meier analysis revealed that patients with pre-transplant diabetes had higher incidences of post-transplant mortality and four-point MACE compared with those without pre-transplant diabetes (log rank test, p <0.001 for both). After adjusting for potential confounding factors, pre-transplant diabetes was associated with an increased risk of post-transplant mortality and four-point MACE (hazard ratio [HR], 1.90; confidence interval [CI], 1.05-3.44; p = 0.034; and HR, 1.75; CI, 1.02-3.00; p = 0.043, respectively). The associations between pre-transplant diabetes status and all-cause mortality and four-point MACE were not affected by transplant era or recipient age.
Conclusion: Pre-transplant diabetes remains a significant risk factor for mortality and four-point MACE in kidney transplant recipients over time.

Supported by: National Research Foundation of Korea
Disclosure: S. Han: None.
863
Markers of early kidney damage and corneal nerve regeneration in patients after simultaneous pancreas-kidney transplantation
A. Severina1, I. Larina1, M. Shamkhalova1, E. Artemova1, L. Nikankina1, M. Shestakova1, I. Dmitriev2, A. Pinchuk2, M. Kaabak3, G. Musaeva4;
1Endocrinology research center, Moscow, 2N.V. Sklifosovsky Scientific Research Institute of Emergency Care, Moscow, 3National Medical Research Center for Children's Health, Moscow, 4Sechenov University, Moscow, Russian Federation.
Background and aims: To evaluate the relationship between kidney transplant dysfunction markers, recurrent nephropathy and corneal nerve structures in patients with type 1 diabetes mellitus (T1DM) with terminal microvascular complications, reached stable euglycemia after simultaneous pancreas-kidney transplantation (SPKT).
Materials and methods: The study included 27 patients with T1DM duration for 21 [19; 28] years, diabetic nephropathy (DN) 7,0 [5,5; 13,5] years and duration of renal replacement therapy (dialysis) for 2 [1; 4] years after successful SPKT. All patients had decompensated diabetes for the whole duration of disease. Patients were included in the study in different duration of the posttransplantation period. Assessment included examination of the level of the main kidney transplant dysfunction markers (KIM-1, NGAL, podocin), examination of the state of corneal nerve structures according to corneal confocal microscopy (CCM), diabetes complications/ complications of ESRD status with dynamic observation for 1 year. All patients received three-component immunosuppressive therapy
Results: After the successful SPKT 41% of patients still needed antihypertensive therapy, 37% needed treatment with recombinant human erythropoietin (RHuEPO) and 30% - antiosteoporotic therapy despite of reached stable euglycemia (HbA1c 5.5 [5.1; 5.9] %, 5.5 [5.3; 5.7] % after 1 year of follow - up), the restoration of graft function to the rate of estimated glomerular filtration rate (eGFR) CKD-EPI stage C2, albuminuria stage A1. There were no statistically significant changes in NGAL, KIM-1, and podocin at baseline and after 1 year in assessment early kidney transplant dysfunction markers. The results of the correlation analysis revealed associations of KIM-1 with albumin-to-creatinine ratio (R=0.43, p= 0.04), correlation of podocin with HbA1c (R=-0.46, p=0.03), NGAL and indicators of CCM (CNFD 0 months & NGAL (R=0.61, p = 0.01), CNBD 0 months & NGAL (R=0.56, p=0.02), CNFL 0 months & NGAL (R=0.65, p=0.009) and vitamin D (R=-0.67, p = 0.008).
Conclusion: SPKT as the only way to achieve euglycemia and compensation of uremia does not provide regress of chronic kidney disease (CKD) and complications of ESRD.The revealed correlations of the early kidney transplant dysfunction markers with the degree of carbohydrate metabolism compensation and vitamin D level may reflect the persistence of damage to the microstructures with stable graft function and demonstrate the need to manage all factors in the preservation renal function. At the same time, the statistically significant correlations of early kidney transplant dysfunction markers with the state of corneal nerve structures need to more long-lasting investigation.
Supported by: Government support
Disclosure: A. Severina: None.
864
The relationship between circulating Dickkopf-1 levels and urine albumin excretion in type 2 diabetic patients
E. Mao1, C. Kan1, N. Hou1, N. Huang1, Y. Liu1, F. Han2, X. Sun1;
1Department of Endocrinology, Affiliated Hospital of Weifang Medical University, Weifang, 2Department of Pathology, Affiliated Hospital of Weifang Medical University, Weifang, China.
Background and aims: Diabetic kidney disease (DKD) is one of the most serious complications of diabetes involved in WNT-mediated renal fibrosis. Dickkopf-1, a negative regulatory molecule of WNT signaling pathway, involved in regulation of inflammation, fibrosis and glucose metabolism. However, the relationship between circulating dickkopf-1 and DKD is still elusive. Therefore, the aim of this study was to explore the relationship between circulating dickkopf-1 levels and urine albumin excretion in type 2 diabetic patients.
Materials and methods: A total of 81 type 2 diabetic patients (T2DM) and 24 age- and sex-matched normal volunteers were involved in this cross-sectional study. Clinical characteristics, metabolic indices, systolic/diastolic blood pressure (SBP/ DBP) and urinary albumin /creatinine ratio (UACR) were determined. Circulating dickkopf-1 was measured by ELISA (Univ-Bio Inc., Shanghai). The relationship between dickkopf-1 and UACR was investigated. Pearson/Spearman correlation and logistic regression analysis were used to identify the associations of various metabolic indices with UACR.
Results: 81 T2DM patients were divided into normal albuminuria (UACR<30 mg/g, n=29), microalbuminuria (UACR 30-300mg/g, n=25) and macroalbuminuria groups (UACR>300 mg/g, n=27). As expected, UACR were significantly higher in diabetic patients than those of normal healthy volunteers (231.1±32.2 mg/g vs. 6.55±0.59 mg/g; P<0.01). There were no significant differences in circulating dickkopf-1 between control and all the diabetic patients (6.63±0.29 ng/ml vs. 6.14±0.23 ng/ml; P>0.05). However, among the diabetic patients, circulating dickkopf-1 was lowest in diabetic patients with macroalbuminuria (4.61±0.15 ng/ml). Diabetic patient with microalbuminuria had a lower circulating dickkopf-1 compared to those with normal albuminuria (6.26±0.36 ng/ml vs 7.48±0.42 ng/ml; P<0.05). Bivariate correlation analysis showed that circulating dickkopf-1was significantly and positively associated with HbA1c (r=0.540, P=0.000), eGFR (r=0.260, P=0.024) and negatively correlated with diabetes duration (r=-0.248, P=0.032), SBP (r=-0.297, P=0.010), serum creatinine (r=-0.233, P=0.045) UACR (r=-0.633, P=0.000). After adjustment for age, gender, diabetes duration and HbA1c, multiple regression analysis showed that dickkopf-1 was independently associated with UACR (beta coefficient=-0.486;R2=0.513, F = 12.984, P <0.0001), but not SBP and serum creatinine. Logistic regression analyses showed that dickkopf-1, diabetes duration, SBP and blood urea nitrogen were strongly associated with UACR in type 2 diabetes patients (OR=0.369 CI 95% [0.164-0.831], OR=1.455 CI 95% [1.070-1.979], OR=1.089 CI 95% [1.013-1.172] and OR= 4.500 CI 95% [1.115-18.162], respectively).
Conclusion: Our findings strongly suggested that circulating DKK-1 level decreased gradually in diabetic patients with advanced albuminuria. Lower levels of dickkopf-1 are independently associated with UACR. Therefore, dickkopf-1 may be involved in the development of proteinuria in DKD.
Clinical Trial Registration Number: ChiCTR1800019563
Supported by: NSFC (81870593)
Disclosure: E. Mao: Grants; NSFC (81870593).
PS 83 Treatment of NAFLD and diabetes: from food to pharmacology
865
Effect of high-intensity interval training on liver fat in adults with type 1 diabetes
A.S. Lee1,2, N.A. Johnson3,4, M. McGill1,2, J. Overland1,2, C. Luo1, C.J. Baker2, S. Martinez-Huenchullan2,5, J. Wong1,2, J.R. Flack6,7, S.M. Grieve8,9, S.M. Twigg1,2;
1Department of Endocrinology, Diabetes Centre, Royal Prince Alfred Hospital, Sydney, Australia, 2Central Clinical School, Faculty of Medicine and Health, University of Sydney, Sydney, Australia, 3Faculty of Medicine and Health, University of Sydney, Sydney, Australia, 4The Boden Institute of Obesity, Nutrition, Exercise and Eating Disorders, University of Sydney, Sydney, Australia, 5Universidad Austral de Chile, Valdivia, Chile, 6Diabetes Centre, Bankstown-Lidcombe Hospital, Sydney, Australia, 7Faculty of Medicine, University of New South Wales, Sydney, Australia, 8Department of Radiology, Royal Prince Alfred Hospital, Sydney, Australia, 9Sydney Translational Imaging Laboratory, Heart Research Institute, Faculty of Medicine and Health, University of Sydney, Sydney, Australia.
Background and aims: Our study aimed to firstly, examine the clinical characteristics associated with greater liver fat in adults with type 1 diabetes, and secondly, examine the effect of high-intensity interval training (HIIT) on liver fat in a randomised controlled trial. To our knowledge, this is the first clinical study on the effect of exercise on liver fat in people with T1D.
Materials and methods: Overweight and obese inactive adults with T1D and HbA1c>7.5% were randomised to undertake 12 weeks of HIIT or usual care control. Clinical outcomes and liver fat on MRI were measured at baseline and 12 weeks. Univariate linear regression analysis determined correlations between baseline liver fat and baseline clinical characteristics. Independent samples t-test determined differences in liver fat change between groups after 12 weeks.
Results: Twenty-nine adults completed baseline assessment; 17 male/12 female, age 44±10 years, diabetes duration 20±11 years, BMI 30.1±3.2 kg/m², HbA1c 8.5±0.6%. Baseline mean liver fat was 4.0±3.9%. Increased baseline liver fat was significantly associated with: increased serum triglycerides, apolipoprotein B, high-sensitivity CRP, and platelets; and decreased adiponectin and blood pressure (all p<0.05). As a single factor, serum triglycerides had the highest correlation with baseline liver fat (R2 =37%, p<0.001). Clinical factors without significant correlation with liver fat included: age, gender, HbA1c, BMI, waist circumference, ALT, and AST. After 12 weeks, liver fat decreased in the HIIT group (n=11) from 5.0±5.5% to 4.5±4.5%, and increased from 3.3±1.8% to 3.9±3.0% in the control group (n=14), however this change was not significantly different between groups (-0.5±2.1% HIIT vs +0.7±1.6% Control, p=0.15).
Conclusion: Elevated serum triglycerides may be the single best predictor in routine clinical practice for the presence of fatty liver in T1D. HIIT exercise showed a favourable trend to reducing liver fat over 12 weeks, suggesting that larger studies are warranted.
Clinical Trial Registration Number: ACTRN12617000478314
Supported by: Sydney Medical School Foundation, DARP, Abbott Diabetes Care, NHMRC, JDRF
Disclosure: A.S. Lee: None.
866
Effects of fructose restriction on liver steatosis (FRUITLESS): a double-blind randomised controlled trial
N. Simons1, P. Veeraiah2, P.I. Simons1, N.C. Schaper1, M. Kooi3, V.B. Schrauwen-Hinderling2, E.J. Feskens4, L.E. van der Ploeg5, M.D. van den Eynde1, C.G. Schalkwijk1, C.D.A. Stehouwer1, M.C. Brouwers1;
1Department of Internal Medicine, Maastricht University Medical Centre, CARIM School for Cardiovascular Diseases, Maastricht, 2Department of Nutrition and Movement Sciences, Maastricht University Medical Centre, NUTRIM School for Nutrition and Translational Research in Metabolism, Maastricht, 3Department of Radiology and Nuclear Medicine, Maastricht University Medical Centre, CARIM School for Cardiovascular Diseases, Maastricht, 4Division of Human Nutrition, Wageningen University, Wageningen, 5Department of Dietetics, Maastricht University Medical Centre, Maastricht, Netherlands.
Background and aims: There is an ongoing debate on whether fructose plays a role in the development of nonalcoholic fatty liver disease (NAFLD) in humans. The aim of this study was to investigate the effects of fructose restriction on intrahepatic lipid (IHL) content in a double-blind randomized controlled trial using an isocaloric comparator.
Materials and methods: Between March 2017 and October 2019, forty-four adult overweight individuals with a fatty liver index ≥ 60 were randomly assigned to a six-week fructose-restricted diet (<7.5 grams per meal and <10 grams per day) supplemented with either sachets of glucose (=intervention group) or fructose (=control group) three times daily. Participants and assessors were blinded to the allocation. IHL content, assessed by proton magnetic resonance spectroscopy, was the primary outcome measure and glucose tolerance and serum lipid levels were the secondary outcome measures.
Results: Thirty-seven non-diabetic participants completed the study protocol (12 men, median age: 53 years, BMI: 31.8 kg/m2, fatty liver index: 87). After six weeks of fructose restriction, both dietary fructose intake and urinary fructose excretion were significantly lower in the intervention group (difference between both groups: -57.0 grams/day, 95%CI: -77.9;-39.5 and -38.8 μmol/day, 95%CI: -91.2;-10.7). Although IHL content decreased in both the intervention and control group (difference: -1.8 percent point, 95%CI: -3.1;-0.9 and -0.6 percent point, 95%CI: -1.9;-0.2, respectively), the change in IHL content was more pronounced in the intervention group (difference between both groups: -0.7 percent point, 95%CI: -2.0;-0.03, p=0.04). The change in glucose tolerance and serum lipids levels were not different between both groups.
Conclusion: Six-week fructose restriction leads to a small but statistically significant decrease in intrahepatic lipid content.
Clinical Trial Registration Number: www.clinicaltrials.gov; NCT03067428
Supported by: Nutricia Research Foundation (grant 2016-33); Netherlands Heart Foundation (grant 2015T042)
Disclosure: N. Simons: None.
867
Feasibility of a very low calorie diet to achieve significant weight loss in patients with advanced non-alcoholic fatty liver disease
J.H. Scragg1, L. Avery2, S. Cassidy1, G.S. Taylor1, L. Haigh3,4, M. Boyle3,4, Q.M. Anstee3,4, S. McPherson3,4, K. Hallsworth1,4;
1Population Health Sciences, Newcastle University, Newcastle upon Tyne, 2School of Health and Life Sciences, Teesside University, Tees Valley, 3Institute of Clinical & Translational Research, Newcastle University, Newcastle upon Tyne, 4Liver Unit, Newcastle Upon Tyne Hospitals NHS Foundation Trust, Newcastle upon Tyne, UK.
Background and aims: Non-alcoholic fatty liver disease (NAFLD) is the most common liver condition worldwide. It is directly linked to chronic excess calorie consumption, lack of physical activity and obesity and is closely associated with Type 2 Diabetes (T2DM). T2DM is a major risk factor for NAFLD disease progression and is more common in NAFLD patients with progressive fibrosis. Weight loss has been shown to improve metabolic control and reduce cardiovascular disease (CVD) risk, which are integral to managing NAFLD effectively. A weight loss goal of ~10% has been recommended for patients with NAFLD as this has been shown to improve liver fat, inflammation and fibrosis. However, only 10-20% of patients achieve this level of weight reduction with standard dietary approaches. The very low calorie diet VLCD has shown to be effective at inducing weight loss, but hasn’t been investigated in patients with advanced NAFLD. This pilot study aimed to determine whether an 8-12 week VLCD is an acceptable approach to achieve a target weight loss of 10% in patients with advanced NAFLD.
Materials and methods: 30 patients with clinically diagnosed advanced NAFLD (based on history, biochemistry, imaging or histology) were recruited to an 8-12 week VLCD (~800 kcal/day) using meal replacement products. Anthropometrics, blood tests (liver enzymes, HbA1c, insulin), body composition, liver stiffness and CVD risk were measured at baseline and immediately after the VLCD intervention.
Results: Of the 45 patients approached to take part in this study, 30 consented to enrol. Recruitment targets were reached at a single site within 6 months. 27/30 patients were retained post VLCD. 16 (68%) of patients reached the weight loss target of 10%. Mean weight loss was 13±7kg (11±6%) across all patients. Weight loss through an 8-12 week VLCD significantly improved liver health (liver enzymes and liver stiffness), metabolic health (HbA1c and insulin) and CVD risk (blood pressure and QRISK2). BMI and body composition also improved (See Table 1). 16 (53%) patients had T2DM at baseline (HbA1c: 59±10mmol/mol), and within this subgroup 15 (88%) were prescribed oral antidiabetic medications. Following the VLCD intervention, mean HbA1c reduced to 46±8mmol/mol and 6 (40%) patients reduced their oral antidiabetic medication dosage.
Conclusion: A VLCD is a feasible way of achieving 10% weight loss in patients with advanced NAFLD. Patients were willing to undertake the strict dietary intervention and significant improvements in liver, metabolic and cardiac health were observed.

Clinical Trial Registration Number: ISRCTN85177264
Supported by: NIHR Newcastle Biomedical Research Centre
Disclosure: J.H. Scragg: None.
868
Comparative efficacy of anti-diabetic agents on nonalcoholic fatty liver disease in patients with type 2 diabetes: a network meta-analysis
C. Liu;
The Fifth Affiliated Hospital of Zhengzhou University, Zhengzhou, China.
Background and aims: Nonalcoholic fatty liver disease (NAFLD) has a high prevalence in patients with type 2 diabetes (T2DM). We compared the efficacy of anti-diabetic agents on NAFLD in patients with T2DM.
Materials and methods: The randomized controlled trials (RCTs) with different anti-diabetic agents on NAFLD in patients with T2DM were identified by searching electronic databases including PubMed, Medline, Web of science, Cochrance Library and Embase database. Main outcomes including HbA1c, FPG, ALT, AST, HDL-C, LDL-C, TCH-C and TG were extracted by two researchers independently. The network meta-analysis (NMA) was carried out using stata software.
Results: Sixteen high-quality RCTs involving 3473 patients were taken into analysis. Compared with the placebo group, dipeptidyl peptidase-4 (DPP-4) inhibitors could significantly reduce patients' HbA1c [Mean=-0.57,95%CI(-1.08,-0.06)], thiazolidinediones (TZDs) could significantly reduce ALT in patients [Mean=-11.31,95%CI(-18.22,-4.41)], sodium-glucose transport protein type 2 (SGLT2) inhibitors could significantly reduce TG in patients[Mean=-1.29,95%CI(-2.47,-0.11)]. In terms of reducing ALT, TZDs were more obvious than DDP-4 inhibitors and biguanides. In terms of reducing LDL-C, SGLT2 inhibitors, glucagon-like peptide-1 receptor (GLP-1R) agonists and DPP-4 inhibitors were more obvious than sulfonylurea drugs. No significant difference were found in other comparisons. The probabilities of rank plot showed that DPP-4 inhibitors ranked first in reducing HbA1c and TCH-C. TZDs were the first to reduce ALT, and SGLT2 inhibitors were the first to increase HDL-C and decrease LDL-C.
Conclusion: For T2DM with NAFLD, TZDs were recommended as the best treatment for those with significantly increased liver enzymes. DPP-4 inhibitor or SGLT2 inhibitor was recommended for those with significantly higher lipids. However, due to the limitations of our study, additional high-quality researches are required.
Disclosure: C. Liu: None.
869
Oral insulin-induced reduction in liver fat content in type 2 diabetes patients with nonalcoholic steatohepatitis
M. Kidron1, S. Perles1, R. Kaloti2, R. Ghantous2, S. Sanduka2, Y. Malaadi2, R. Safadi2;
1Oramed Pharmaceuticals, Jerusalem, 2Hadassah Medical Center, Jerusalem, Israel.
Background and aims: Nonalcoholic fatty liver disease (NAFLD) and subsequent nonalcoholic steatohepatitis (NASH) are leading causes of chronic liver disease, with disease progression directly associated with insulin resistance and T2DM. In light of the risk factors, pathogenesis and complications in common with T2DM, direct insulin intervention has been suggested for T2DM patients with NAFLD. Recently, salient metabolic effects of oral insulin have been suggested, owing to first pass metabolism and local insulin availability and concentration in liver fat cells. This pilot study aimed to assess the safety, tolerability and early effects of an oral insulin formulation (ORMD-0801) on liver fat in T2DM patients with NASH.
Materials and methods: Following a 2-week placebo run-in phase, ORMD (2x8 mg capsules) was preprandially administered once-daily for 12 consecutive weeks, to 8 adult T2DM patients with NASH. Study visits were performed after 1, 2, 4, 8 and 12 weeks of treatment, at which fasting blood glucose and insulin levels were determined, fasting blood glucose diaries were reviewed, standard blood chemistry tests were performed and a Fibroscan test and magnetic resonance imaging-proton density fat fraction (MRI-PDFF) assessment were conducted to determine fat liver content.
Results: The 12-week ORMD-0801 treatment proved safe and tolerable in all patients, with no serious or severe adverse events recorded throughout the study period. The 12-week treatment induced a mean -6.9±6.8% reduction in liver fat content (sign test p value: 0.035), as measured by MRI-PDFF, with 7/8 patients showing significant reductions, while one patient showed no change. In parallel, concentrations of gamma-glutamyltransferase (GGTP), a key marker of chronic hepatitis, were significantly lower after 12 weeks of treatment as compared to baseline (-14.6±13.1 U/L; sign test p value: 0.008), as were fasting insulin levels (-96.5±206.0 pmol/L; sign test p value: 0.035).
Conclusion: These preliminary observations suggest a palliative effect of oral insulin on NASH in T2DM patients, as shown by reductions in both liver fat content and chronic hepatitis. These encouraging findings will require further validation in large-scale, randomized clinical trials.
Clinical Trial Registration Number: NCT02653300
Disclosure: M. Kidron: Employment/Consultancy; MK. Stock/Shareholding; MK.
870
Novel long-acting GLP-1/GIP/Glucagon triple agonist (HM15211) exhibits anti-inflammatory and -fibrotic effects in AMLN/TAA induced liver inflammation and fibrosis mice
H. Jo;
Hanmi Pharm. Co., Ltd., Hwaseong-si, Republic of Korea.
Background and aims: Nonalcoholic steatohepatitis (NASH), a severe form of NAFLD, is characterized by hepatic steatosis, inflammation, and fibrosis. Despite increased prevalence and related mortality, no approved medication is available, leading to a significant burden for public health. Although advances in targeting hepatic steatosis demonstrate meaningful benefits, their overall efficacy in NASH remains elusive. Recent approaches directly modulating either inflammation or fibrosis still showed limited efficacy. Since NASH is a complex disease progressed by multiple mechanism, therapeutic approaches combining different aspects of this disease should be required to effectively manage NASH. Interestingly, recent studies have proposed the potential benefits of GLP-1, GIP, and Glucagon in steatosis, inflammation and fibrosis. Thus, to provide a novel therapeutic option, we have developed a novel long-acting GLP-1/GIP/Glucagon triple agonist, HM15211. In previous studies, HM15211 was preferentially distributed to the liver, and its chronic treatment led to favorable hepatic lipid metabolism reprograming and potent liver fat reduction in DIO mice. Here, we further investigated the potential therapeutic effect of HM15211 in the animal model of liver inflammation and fibrosis.
Materials and methods: To induce liver inflammation with fibrosis, thioacetamide (TAA) was concomitantly administered to the mice fed with high-fat and -fructose diet (AMLN/TAA mice) for 16 weeks, and HM15211 was subcutaneously administered during last 8 weeks. AMLN diet group was used as negative control. At the end of treatment, the liver tissue samples were prepared, and the degree of fibrosis was determined by measuring hepatic hydroxyproline contents. Additional liver tissue samples were subjected to Sirius red staining. Quantitative PCR analysis was performed to determine the hepatic expression of markers for inflammation and fibrosis. The blood levels of PIIINP, TIMP-1, and hyaluronic acid, well-known components for ELF score determination, were measured by ELISA.
Results: In AMLN/TAA mice, HM15211 treatment significantly reduced hepatic hydroxyproline content (-53.1% vs. vehicle) and Sirius red positive area (3.5 and 1.0% for vehicle and HM15211). In addition, HM15211 treated group was associated with significant reduction in hepatic fibrosis marker gene expression such as TGF-β (-81.5% vs. vehicle), α-SMA (-53.9% vs. vehicle), TIMP-1 (-41.4% vs. vehicle), collagen-1α1 (-51.9% vs. vehicle), and collagen-3α1 (-72.5% vs. vehicle). Moreover, blood levels of PIIINP (-48.0% vs. vehicle), TIMP-1 (-49.3% vs. vehicle), and hyaluronic acid (-49.1% vs. vehicle) were also significantly reduced by HM15211 treatment. In line with the anti-fibrotic effect, hepatic pro-inflammatory marker gene expression such as F4/80 (-92.8% vs. vehicle), MCP-1 (-34.7% vs. vehicle), and IL-6 (-34.9% vs. vehicle) was also meaningfully reduced by HM15211 treatment.
Conclusion: Based on these results, anti-inflammatory and anti-fibrotic effects of HM15211 are well-corroborated. Therefore, HM15211 may be a novel therapeutic option for NASH by conferring well-harmonized pharmacologic effects of GLP-1, GIP, and Glucagon. Human efficacy studies are on-going to assess the clinical relevance of these findings.
Disclosure: H. Jo: None.
871
Anti-fibrotic effect of a novel long-acting GLP-1/GIP/Glucagon triple agonist (HM15211) in BDL-induced liver fibrosis mice
J. Kim, H. Jo, J. Lee, S. Lee, H. Kwon, J. Lee, S. Bae, S. Lee, I. Choi;
Hanmi Pharm. Co., Ltd., Seoul, Republic of Korea.
Background and aims: Fibrosis due to nonalcoholic steatohepatitis (NASH) remains a major cause of liver-related mortality. However, no medication has been approved despite accelerated drug development. Since complex biological pathways are involved, therapeutic strategies simultaneously targeting multiple aspects might be required to effectively treat fibrosis as well as NASH. To address this, we developed a novel long-acting GLP-1/GIP/Glucagon triple agonist, HM15211. Previously, HM15211 significantly improved both hepatic steatosis, inflammation, and fibrosis in diet-induced mouse models of NASH and fibrosis such as MCD- or AMLN-diet mice. In addition to the diet-induced models, bile duct ligation (BDL) has also been extensively used as an animal model of fibrosis. In the present, we further investigated the direct anti-fibrotic effects of HM15211 in BDL-induced fibrosis mice (BDL mice).
Materials and methods: To induce cholestasis-induced liver fibrosis, the anesthetized mice were subjected to the ligation of common bile duct. 2 days after surgical procedures, the mice were administered either with HM15211 or obeticholic acid (OCA) for 2 weeks. At the end of treatment, the liver tissue samples were prepared, and the degree of fibrosis was determined by measuring hepatic hydroxyproline contents. Additional liver tissue samples were subjected to H&E and Sirius red staining, followed by histological grading. Quantitative PCR analysis was performed to determine the hepatic fibrosis marker gene expression, and the blood level of fibrosis surrogate markers was measured by ELISA. To evaluate the potential therapeutic effect of HM15211 on advanced fibrosis, BDL mice were established with an extended induction period (up to 4 weeks), and the same tissue and blood analysis were performed after 2 weeks treatment of HM15211.
Results: In BDL mice, HM15211 treatment showed greater reduction in hepatic hydroxyproline (-21.9 and -43.7% vs. vehicle for OCA and HM15211) and fibrosis score (1.7, 1.8 and 1.0 for vehicle, OCA, and HM15211) compared to OCA. In addition, HM15211 treatment was also associated with more reduction in hepatic fibrosis marker gene expression such as TGF-β (-47.8 and -62.8% vs. vehicle for OCA and HM15211), α-SMA (-51.6 and -77.7% for OCA and HM15211), collagen-1α1 (-11.3 and -51.6% for OCA and HM15211), and collagen-3α1 (-36.2 and -69.0% for OCA and HM15211). Blood levels of TGF-β (9.1 and -61.4% vs. vehicle for OCA and HM15211), TIMP-1 (-13.9 and -71.6% for OCA and HM15211), and hyaluronic acid (25.0 and -68.9% for OCA and HM15211) were also significantly reduced by HM15211, but not OCA, treatment. Notably, when BDL mice with an advanced liver fibrosis administered with HM15211, same benefits in fibrosis improvement were consistently observed as indicated by reduced hydroxyproline (-41.5% vs. vehicle) and fibrosis score.
Conclusion: Considering the pathologic features of BDL mice (liver fibrosis without liver fat accumulation), these results demonstrate the direct anti-fibrotic effect of HM15211. Additionally, reduced levels of TGF-β and α-SMA suggest that the negative regulation of hepatic stellate cell activation is essential for fibrosis improvement by HM15211. Further studies are needed to assess the clinical relevance of these findings.
Disclosure: J. Kim: Employment/Consultancy; Hanmi Pharm. Co., Ltd.
872
Effects of long-term therapy with testosterone on liver metabolism over 11 years in men with hypogonadism and type 2 diabetes: real-world data from a registry study
U. Wissinger1, K.S. Haider2, A. Haider2, G. Doros3, A. Traish4, F. Saad1;
1Bayer AG, Berlin, Germany, 2Private Urology Practice, Bremerhaven, Germany, 3Boston University School of Public Health, Boston, USA, 4Boston University School of Medicine, Boston, USA.
Background and aims: Fatty liver is increasingly recognized as cardiovascular risk factor. Little is known about effects of testosterone therapy (TTh) on NAFLD and hepatic steatosis. We investigated liver function in a real-life registry in a urological setting.
Materials and methods: In a registry of 858 men with hypogonadism, 356 men (41.5%) had T2DM. 178 received testosterone undecanoate injections 1000 mg/12 weeks following an initial 6-week interval (T-group), 178 opted against treatment (CTRL). Parameters related to liver function were measured and fatty liver index (FLI) calculated to gain insight on effects of testosterone therapy (TTh) on ectopic fat deposition in the liver. Changes over time between groups were compared and adjusted for age, weight, waist circumference, fasting glucose, blood pressure, lipids and quality of life to account for baseline differences between the two groups. 2928 patient-years were analysed and 11-year data are reported.
Results: Mean follow-up 7.7±3.0 (T-group) and 8.7±2.6 (CTRL) years, baseline age: 61.5±5.4 (T-group) and 63.7±4.9 (CTRL) years. 288 (80.9%) were obese, 61 (17.1%) overweight and 7 (2.0%) had normal weight. γ-GT (U/L) decreased by 21.7±1.2 in the T-group and increased by 20.2±1.1 in CTRL, estimated adjusted difference between groups at 11 years: -41.9 (p<0.0001 for all). Triglycerides (mmol/L) declined by 1.1±0.0 (T-group) and increased by 0.5±0.0 in CTRL, difference between groups: -1.7 (p<0.0001 for all). Waist circumference (cm) decreased by 13.3±0.4 in the T group and increased in CTRL by 7.1±0.4, difference between groups: -20.4 (p<0.0001 for all).). BMI (kg/m²) decreased by 7.3±0.2 in the T group and increased by 2.2±0.2 in CTRL, difference between groups -9.5 (p<0.0001 for all). Median FLI was 97.1 (range: 62.3-100.0) in the T-group and 93.9 (46.8-100.0) in CTRL. FLI decreased by 28.6±0.7 (from 94.8±6.1 to 66.9±13.0) in the T-group and increased by 8.6±0.7 (from 90.2±10.9 to 95.0±5.2) in CTRL, estimated difference between groups: -37.1 (p<0.0001 for all). AST (U/L) decreased by 15.3±0.9 in the T-group and increased by 18.9±0.8 in CTRL, difference between groups: -34.3 (p<0.0001 for all). ALT (U/L) decreased by 12.7±1.0 in the T-group and increased by 21.1±0.9 in CTRL, difference between groups: -33.9 (p<0.0001 for all). 13 patients (7.3%) died in the T-group and 48 (27.0%) in CTRL (p<0.0001). In CTRL, 55 men (30.9%) had a myocardial infarction and 45 (25.3%) a stroke. There were no major cardiovascular events (MACE) in the T-group.
Conclusion: The baseline FLI suggests that all patients in the T-group and most in CTRL had NAFLD. A FLI ≥60 is predictive of NAFLD. Long-term TTh with TU in men with hypogonadism and type 2 diabetes resulted in improvement of surrogate parameters of NAFLD, whereas there was a worsening in untreated controls. These changes may have contributed to a reduction in mortality and MACE.
Supported by: Bayer AG provided partial funding for data entry and statistical analyses.
Disclosure: U. Wissinger: Employment/Consultancy; Bayer AG. Stock/Shareholding; Bayer AG.
PS 84 Mechanisms and prevalence of NAFLD
873
Effect of PNPLA3 rs738409 genotype and gestational diabetes history on fasting glucagon levels in early NAFLD
Á. Nádasdi1, V. Gál2, J. Harreiter3, K. Rosta4, A. Kautzky-Willer3, P. Igaz5, A. Somogyi1, G. Firneisz5;
12nd Department of Internal Medicine, Semmelweis University, Budapest, Hungary, 2Brain Imaging Centre, Research Centre for Natural Sciences, Hungarian Academy of Sciences, Budapest, Hungary, 3Department of Internal Medicine III, Medical University of Vienna, Vienna, Austria, 4Department of Obstetrics and Gynecology, Medical University of Vienna, Vienna, Austria, 5MTA-SE Molecular Medicine Research Group, Hungarian Academy of Sciences, Budapest, Hungary.
Background and aims: The PNPLA3 rs738409 G/G risk genotype is implicated in the development and progression of NAFLD. The fasting glucagon levels were reported to be higher in patients with NAFLD, however there was no data available on the effect of PNPLA3 rs738409 risk genotype on plasma glucagon levels. We assessed the intraheptic lipid content (IHCL) and the plasma glucagon levels in context of PNPLA3 genotypes and GDM history in middle aged women.
Materials and methods: We targetedly enrolled 39 women (mean age: 37.2±4.8yrs) based on the PNPLA3 rs738409 genotype (C/C n=27 vs. G/G n=12) from our prior GDM genetic association study (non-GDM n=18, pGDM n=21, 6.1 yrs after 1st GDM pregnancy). Proton density fat fractions (PDFF) were measured using MRS and Multi-echo Dixon methods (Siemens 3T Prisma MR) in the liver and pancreas. Routine abdominal MRI was also performed to exclude focal liver lesions. Liver fibrosis scores (NFS, Fib-4) were calculated. Liver enzymes, HbA1c, lipids, 75g OGTT: PG, serum insulin (CLIA): 0’-30’-120’, plasma glucagon 0’, 30’ (RIA) were measured. Patients with elevated liver enzymes were screened for alternative etiology. MW-U, SRO, ANOVA/K-W and post hoc tests were used (Statistica program).
Results: Fourteen patients were identified with NAFLD out of the 39. We have observed a significant (KW: p=7x10⁻⁴) step-wise increase in IHCL after adjusting the PDFF results to BMI categories (BMI<25, 25≤BMI<30, ≥30kg/m2) and PNPLA3 genotype (CC vs GG). We identified 13 patients with prediabetes and 1 with type 2 diabetes mellitus. The increase of fasting plasma glucagon levels was confirmed in our NAFLD patients in both genotype groups (Fig1a). When the fasting glucagon levels were stratified to PNPLA3 genotypes and GDM history we obsereved an increasing trend in the rs738409 G/G genotype group vs. CC, and the difference is near-significant in the non-GDM subgroup (Fig1b), that were interestingly completely abolished after the adjustment to the fasting serum insulin levels. A step-wise trend for increase was found both in the fasting insulin and HOMA-IR levels (nGDM<GDM, rs738409 CC<GG). (Fig 1c,d)
Conclusion: We concluded that the PNPLA3 genotype effect in combination with the GDM history have a role on the fasting plasma glucagon levels via early NAFLD development. The result confirms that additional regulatory elements to insulin should be present in the liver-alpha cell axis which explains the parallel increase in fasting glucagon, insulin and HOMA-IR levels in patients with a PNPLA3 risk genotype for NAFLD development.

Supported by: EFSD New Horizons grant, Wörwag Pharma award for PhD students
Disclosure: Á. Nádasdi: Grants; EFSD NH, Wörwag-pharma PhD award.
874
Regulating mesencephalic astrocyte-derived neurotrophic factor protects hepatic lipid accumulation
M. He, C. Wang, L. Zhang;
Endocrinology, the Second Affiliated Hospital, Chongqing Medical University, Chongqing, China.
Background and aims: Nonalcoholic fatty liver disease (NAFLD) is characterized by increasing intrahepatic lipid accumulation. Mesencephalic astrocyte-derived neurotrophic factor (MANF) is an endoplasmic reticulum stress (ER stress)-related protein and plays a key role in metabolic homeostasis. However, its function in hepatic metabolism remains largely unknown. The present study aimed to explore how MANF regulated hepatic lipid metabolism and its potential mechanisms.
Materials and methods: We first examined MANF expression at mRNA and protein levels at different time points and concentrations of free fatty acids (FFAs) treated HepG2 cells and high fat diet (HFD)-fed mice. Next, we used lentivirus expressing MANF (Lv-MANF) and lentivirus expressing short hairpin RNA-targeted MANF (Lv-shMANF) to up- and down- regulate MANF expression levels in cells to observe whether MANF influenced lipid metabolism. And we also performed tail-vein injections of adeno-associated virus expressing MANF (AAV-MANF) or adeno-associated virus expressing GFP (AAV-GFP) to normal chow diet (NCD)- or HFD- fed mice to examine the overexpression of MANF on liver lipid metabolism. Subsequently, metabolic parameters was measured. The effects of overexpression of MANF on glucose tolerance test and insulin tolerance test in NCD- or HFD-fed mice were examined. Transcriptome sequencing was used to explore potential mechanism. At last, mRNA and protein of genes involved in lipids metabolism and ER stress were further confirmed.
Results: The results indicated MANF expression was increased at early stage of hepatic lipids accumulation and gradually decreased as the disease progresses. MANF deficiency increased lipogenesis, aggravated HepG2 cell steatosis while MANF overexpression inhibited lipogenesis and rescued HepG2 cell steatosis from FFAs overload. The intracellular TG and TC levels in MANF overexpression group was prominently decreased compared with control group under the stimulation with FFAs. The tail-vein injection of AAV-MANF specifically increased the protein expression in liver and ameliorated HFD-induced hepatic steatosis and insulin resistance. MANF overexpression also significantly decreased the serum TG and TC levels. Gene enrichment showed MANF mainly affected lipids metabolism and KEGG analysis showed this was correlated with ER stress pathway. DisGeNET illustrated knockdown or overexpression of MANF mainly involved in NAFLD and metabolism related diseases. Real time qPCR further verified MANF affected lipids metabolism by regulating expressions of ACCα, FAS, SREBP-1C, HMGCR, CD36 and FABP1. Moreover, MANF overexpression increased the phosphorylation of IRE1α while MANF deficiency decreased the phosphorylation of IRE1α, indicating MANF affects hepatic lipids accumulation by regulating ER stress.
Conclusion: Our study reveals a novel protective role of MANF in regulating hepatic lipid metabolism in vivo and vitro and may be a potential therapeutic target in NAFLD.

Supported by: Natural Science Foundation Project of Chongqing CSTC, No. cstc2018jcyjAX0210
Disclosure: M. He: None.
875
Itch E3 ubiquitin ligase is involved in BCAA catabolism and NAFLD
V. Casagrande, G. Iuliani, M. Mavilio, M. Federici, R. Menghini;
University of Rome Tor Vergata, Rome, Italy.
Background and aims: Elevation in Branched-chain amino acids (BCAAs) is an hallmark for Type 2 Diabetes and its hepatic complications such as NAFLD. We recently found E3 ubiquitin ligase ITCH expression anti-correlated with liver steatosis. Since ITCH controls inflammatory responses, and inflammation is considered a major driver for NAFLD, we focused specifically on the role of ITCH and BCAAs in NAFLD regulation.
Materials and methods: In mouse models of liver disease we analyzed: 1) mRNA expression of Itch and genes involved in NASH and in BCAAs degradation, 2) liver histology and 3) intra-hepatic and plasmatic BCAAs levels.
Results: C57BL/6J male mice were fed a normal or a methionine choline deficient (MCD) diet for 4 or 12 weeks to mimic the initial and late stages of steatohepatitis. We observed that in mice fed 12 weeks with MCD intrahepatic BCAAs are up-regulated (p<0.05); ITCH, GNMT and MAT1a expression were down-regulated (p<0.05) as well as BCAA degradation enzymes such as ACADSB and ALDH6A1 (p<0.05), while COL1A1 mRNA expression was upregulated (p<0.05). To exacerbate the liver damage, we used a hepatocellular carcinoma in a dietary obesity model (HFD-HCC). HCC was induced in 2-wk-old C57BL/6J male mice with an ip injection of 25 mg/kg diethylnitrosamine (DEN) and strongly enhanced with HFD feeding (from 8 to 32 weeks of age). This model showed a similar significant correlation between low hepatic ITCH expression, reduced BCAA degradation enzymes and elevation of circulating BCAA. Next, we analyzed the Itch-/- mice fed a short-term (4 weeks) MCD diet as a model of liver lipotoxicity. Consistently, we found increased BCAA levels in serum and liver (p<0.05) from Itch-/- mice compared with wt both fed normal and MCD diet. Then, to implement a rescue strategy, Itch-/- mice were injected retro-orbitally with 2,3x10^9 PFU of AAV-Itch, weekly for 4 weeks. We found a normalization of BCAAs levels in Itch-/- liver when ITCH expression is normalized. ACADSB mRNA (p<0.05) and protein (p<0.001) levels behave accordingly. Finally, we proceeded to bone marrow transplantation (BMT) between wt and Itch-/- mice fed a MCD, to evaluate whether the ITCH-induced steatohepatitis phenotype is a consequence of the ITCH-induced inflammatory phenotype in immune cells. ACADSB mRNA (p<0.05) and protein (p<0.01) levels and intra-hepatic BCAAs (p<0.05) suggested that the NASH phenotype triggered by loss of functional expression of ITCH is only in part explained by immune cells.
Conclusion: This study suggests that increased BCAAs levels, an hallmark of metabolic disease, may be in part dependent on a mechanism involving ITCH regulation of BCAA degradation enzymes in liver.
Supported by: EU-FP7 FLORINASH (Health-F2-2009-241913)
Disclosure: V. Casagrande: None.
876
Multiparametric magnetic resonance imaging of the liver demonstrates the prevalence of steatohepatitis in patients with type 2 diabetes
E. Brown1, T. Waddell2, S. Mouchti2, A. Roca-Fernandez2, H. Thomaides-Brears2, M. Wilton1, A. Williams1, G.J. Kemp1, J.P. Wilding1, M. Kelly2, G. Thanabalasingham3, D.J. Cuthbertson1, R. Banerjee2;
1The University of Liverpool, Liverpool, 2Perspectum, Oxford, 3Oxford University Hospitals, Oxford, UK.
Background and aims: The co-prevalence of type 2 diabetes mellitus (T2D) and non-alcoholic fatty liver disease (NAFLD) is commonly observed (55.5% reported world-wide). Co-prevalent T2D and NAFLD result in a higher incidence of adverse outcomes including mortality rate. Proton density fat fraction (PDFF) and iron-corrected T1 (cT1) are multiparametric magnetic resonance imaging (mpMRI) biomarkers for liver steatosis and fibroinflammation. cT1 has been shown to predict clinical outcomes in patients with suspected liver disease. Here we investigate mpMRI in patients with T2D to determine the prevalence of steatohepatitis, or ‘higher risk T2D’, and associations with HbA1c and body mass index (BMI).
Materials and methods: 47 T2D patients received an LiverMultiScan as part of the MODIFY (HbA1c range 44-106 mmol/mol) and RESILIENT (HbA1c range 40-81 mmol/mol and BMI>29 kg/m2) ongoing clinical studies. Data for 100 healthy participants was obtained through the UK Biobank online resource (BMI <25 kg/m2, no history of chronic disease). Wilcoxon Signed-Rank tests were used to evaluate cohort differences and Spearman correlation tests were used to identify associations. Data is presented as median cT1 and PDFF.
Results: Patients with confirmed T2D had a significantly greater liver cT1 and PDFF compared to healthy participants (cT1 = 878 ms vs 678ms, p < 0.0001; PDFF = 15.8% vs 2.3%, p < 0.0001). Prevalence of steatohepatitis was 50% in the confirmed T2D group (PDFF > 10 % and cT1 >= 825 ms). BMI was positively associated with liver fibroinflammatory disease and with liver fat (rs = 0.57 for cT1, p <0.0001; rs =0.76, p <0.0001 for PDFF).
Conclusion: MpMRI revealed significantly greater values in liver markers of steatosis (PDFF) and fibroinflammation (cT1) in patients with confirmed T2D compared to healthy participants, highlighting potential utility in identifying coexistent steatohepatitis and T2D, especially in the obese where liver biopsy and elastography are difficult. Figure 1. Box plots of liver cT1 (left) and PDFF (right) between T2D patients and healthy participants, showing significance lines.

Clinical Trial Registration Number: NCT04114682 & ISRCTN52028580
Disclosure: E. Brown: None.
877
Multiparametric magnetic resonance imaging of the pancreas and liver in patients with type 2 diabetes
T.H. Waddell, S. Mouchti, D. Halliday, H. Thomaides-Brears, A. Dennis, H. Wilman, R. Nicholls, M. Kelly, A. Roca-Fernandez, R. Banerjee;
Innovation, Perspectum, Oxford, UK.
Background and aims: There is a clear association between hepatic lipid accumulation, resulting in non-alcoholic fatty liver disease, and type 2 diabetes (T2D), two hallmarks of the metabolic syndrome. Proton density fat fraction (PDFF) and iron-corrected T1 (cT1) are validated multiparametric magnetic resonance imaging (mpMRI) biomarkers for steatosis and fibroinflammation. Here we compare mpMRI markers of the liver and pancreas in participants with T2D and compare to healthy participants from the UK Biobank (NCT9914).
Materials and methods: MR images and patient demographics were collected from the UK Biobank online resource. For pancreatic analysis, 1 region of interest (ROI) (10mm) was placed in the head, body and tail of the pancreas on PDFF and T1 maps. Liver scans were analysed by placing three ROIs within the liver parenchyma only. Data from 137 participants (37 self-reported T2D and 100 healthy) were included for analysis. Wilcoxon Signed-Rank tests were used to compare metrics in subgroups and Spearman’s correlation tests were used to evaluate associations.
Results: Overall, T2D patients had a significantly increased waist circumference and BMI compared to healthy participants (mean waist = 93cm vs 78cm, p = <0.0001, mean BMI = 27.6kg/m2 vs 22.6kg/m2, p = <0.0001). T2D patients had significantly greater pancreatic and liver fat content compared to healthy participants (median pancreas = 6.6% vs 3.8%, p = <0.0001, liver = 5.2% vs 2.3%, p = <0.0001). Liver cT1, but not pancreatic T1 was significantly greater in patients with T2D compared to healthy (median liver = 719ms vs 678ms, p = <0.0001, pancreas = 627ms vs 604ms, p = 0.111). Overall, 1% of healthy participants and 5.4% of T2D patients presented with a liver cT1 of >825ms, indicating greater fibroinflammation of the liver in those with T2D. A moderate, positive correlation between liver and pancreatic PDFF (rs= 0.51, p = <0.0001) was observed.
Conclusion: MpMRI revealed significantly elevated steatosis in the liver and pancreas, along with evidence of increased fibroinflammation in the liver of patients with T2D compared to healthy participants. This suggests that in UK Biobank self-reported diabetic adults, both the liver and pancreas have ectopic fat deposition, and the liver, but not the pancreas, develops inflammatory changes, as seen with cT1.

Disclosure: T.H. Waddell: None.
878
Impact of the duration of type 2 diabetes on the screening for nonalcoholic fatty liver disease and advanced fibrosis
S. Ciardullo1,2, I. Sala3, T. Monti3, E. Muraca2, E. Bianconi2, R. Cannistraci2,1, G. Lattuada2, G. Perseghin1,2;
1School of Medicine and Surgery, University of Milano Bicocca, Monza, 2Department of Medicine and Rehabilitation, Policlinico di Monza, Monza, 3Department of Statistics and Quantitative Methods, University of Milano Bicocca, Milan, Italy.
Background and aims: We recently showed that the combined use of noninvasive markers of steatosis and fibrosis could be useful in type 2 diabetes (T2DM) to identify patients with severe liver disease. However, data are lacking on the prevalence of NAFLD and advanced fibrosis in the natural history of the disease and no screening strategies are suggested with respect to the duration of the disease.
Materials and methods: Cross-sectional analysis of adult individuals with T2DM from two cohorts: 1) 971 outpatients followed at a secondary care diabetes clinic in Italy from 2013 to 2019; 2) 1950 patients from the National Health and Nutrition Examination Survey (NHANES) cycles 2005-2016. Patients with chronic viral hepatitis and more than moderate alcohol consumption were excluded from the analysis. Patients in both cohorts were divided in 3 groups according to a disease duration < 2 years (Group 1), between 2 and 10 years (Group 2) and longer than 10 years (Group 3). Fatty liver Index (FLI) was used to assess steatosis and Fibrosis-4 (FIB-4) to predict the risk of advanced fibrosis.
Results: Prevalence of NAFLD, defined as a FLI ≥ 60, was lower with longer disease duration in the Italian cohort (70.2% in group 1 vs 59.5% in group 3, p<0.01), whereas only a non-significant trend was found in NHANES (82.2% in group 1 vs 77.1% in group 3, p=0.6). On the contrary, the prevalence of advanced fibrosis, defined as a FIB-4 > 2.67, was higher with longer diabetes duration in both the Italian (8.2% in group 1 vs 9.4% in group 3, p=0.09) and the NHANES (4.6% in group 1 vs 9.2% in group 3, p<0.01) cohort.
Conclusion: Our real-world study is in agreement with epidemiologic data showing a high prevalence of NAFLD at the onset of T2DM, and a lower prevalence in patients with long-lasting disease. Most importantly, we show that advanced fibrosis is present at disease onset in a non-negligible proportion of T2DM patients, underlying the need to start the screening early, and is higher in patients with longer diabetes duration, suggesting serial monitoring of liver fibrosis scores.
Disclosure: S. Ciardullo: None.
879
The classification of type 2 diabetes according to insulin resistance and beta cell function preservation and their different patterns of complications
Y. Cho, S. Seo, D. Seo, S. Ahn, S. Hong, S. Kim;
Department of Endocrinology and Metabolism, Inha University School of Medicine, Incheon, Republic of Korea.
Background and aims: The aim of this study is to identify whether the patterns of diabetic complications differ when the patients with T2D were simply classified by insulin sensitivity and beta cell function preservation.
Materials and methods: This was an observational study performed in 10,509 consecutively enrolled patients with type 2 diabetes. We analyzed the data of patients who performed concurrent fasting glucose, fasting insulin, insulin tolerance test and one or more complication studies within 6 months at the time of enrollment. Abnormalities of values were defined based on the median value of each gender. (Male: 1.903 of Kitt and 30.76 of HOMA-B; Female: 1.947 of Kitt and 37.02 of HOMA-B)
Results: We classified the patients with type 2 diabetes into 4 groups, which had significantly different patient characteristics and risk of diabetic complications. Compared to the control group (without insulin resistance or beta cell dysfunction), “only beta cell dysfunction” group had an increased prevalence of diabetic retinopathy (aOR (adjusted odds ratio) 1.326 (95%CI 1.092-1.611, p = 0.004). “Only insulin resistance” group had an increased prevalence of hepatic steatosis (aOR 1.687 (95%CI 1.371-2.076, p < 0.001), compared to control group. The “Both insulin resistance and beta cell dysfunction” group patients were significantly associated with higher prevalence of diabetic retinopathy (aOR 1.342 (95%CI 1.097-1.640, p = 0.004), hepatic steatosis (aOR 1.482 (95%CI 1.207-1.819, p < 0.001), and neuropathy (aOR 1.348 (95%CI 1.083-1.678, p = 0.007). The risk of carotid atherosclerosis and chronic renal failure (eGFR <60) did not differ significantly between groups.
Conclusion: The pattern of complications vary according to the simply classified type of T2D based on insulin resistance and beta cell function.
Disclosure: Y. Cho: None.
880
The role of insulin resistance and NAFLD in the cardiometabolic risk profile of type 1 diabetes
J. Mertens1,2, J. Weyler1,3, E. Dirinck2, L. Vonghia1, S. Francque3,3, C. De Block1,3;
1Hepatology, University Hospital of Antwerp, Antwerp, 2Endocrinology, University Hospital of Antwerp, Antwerp, 3Laboratory of experimental medicine and paediatrics, University of Antwerp, Antwerp, Belgium.
Background and aims: People with type 1 diabetes (T1D) are increasingly overweight or obese and at risk to develop insulin resistance (IR). IR may hamper glucose control and augment the risk of cardiovascular disease (CVD). Simultaneously, non-alcoholic fatty liver disease (NAFLD) is becoming increasingly prevalent, also in T1D. IR is linked to NAFLD, which, on its own, is a risk factor for CVD. The gold standard to assess IR is the euglycemic clamp, an invasive and time-consuming test that cannot be performed in routine screening. Estimated glucose disposal rate (eGDR) has been validated against this golden standard as a good estimation of IR. This study aims to determine the prevalence of NAFLD in T1D, to estimate IR using eGDR and elucidate associations between NAFLD, IR and CVD.
Materials and methods: 296 T1D subjects were consecutively screened for NAFLD using ultrasound and underwent anthropometry. The eGDR was calculated as follows: eGDR (mg/kg/min) = 21,158 + (-0,09*waist circumference (cm)) + (-3,407*hypertension) + (-0,551*HbA1c (%)). A history of past CVD was assessed by individual file search. According to Epstein et al., eGDR is divided into 3 categories (<5.39; 5.39-7.75; >7.75 mg/kg/min), with the lowest category representing the highest degree of IR.
Results: Median age was 48 years (range 18-88), median diabetes duration was 27 years (range 1-61), mean HbA1c: 7.6 ± 1.0%, mean BMI: 26.2 ± 4.5 kg/m2. 36.1% of subjects had overweight and 19.6% was obese. NAFLD was present in 20.6%. Subjects with vs without NAFLD were older (51 ± 16 vs 46 ± 16 y, p=0.013), had higher BMI (29.8 ± 5.0 vs 25.2 ± 3.9 kg/m2, p<0.001), higher ALT (32 ± 21 vs 24 ± 11 U/L, p<0.001), γ-GT (38 ± 33 vs 28 ± 27 U/L, p=0.039), triglycerides (111 ± 86 vs 79 ± 39 mg/dL, p<0.001) and lower HDL-cholesterol levels (57 ± 15 vs 64 ± 17 mg/dL, p=0.001). Only 5.7% fell in the highest IR category, but 26.4% expressed mild IR. NAFLD prevalence was 41%, 40% and 12% in the high, medium and low IR groups respectively (p<0.001). eGDR was lower in NAFLD subjects (7.1 ± 2.0 vs 8.8 ± 1.6 mg/kg/min, p<0.001). Composite CVD was present in 8.8% (coronary artery disease (CAD) 5.8%, peripheral arterial disease (PAD) 4.7%, cerebrovascular accident (CVA) 1.4%). The prevalence of composite CVD (21.3 vs 5.5%, p<0.001), CAD (13.1 vs 3.9%, p=0.011), PAD (11.7 vs 2.7%, p=0.009) and CVA (4.9 vs 0.4%, p=0.029) were higher in the NAFLD group. The prevalence of composite CVD was 23.5%, 16.0% and 4.9% in the high, medium and low IR groups respectively (p=0.001). Independent risk factors for CVD were NAFLD (OR:4.0, p=0.010), low eGDR (OR:1.3, p=0.047) and age (OR:1.1, p=0.005) when including these parameters and BMI, gender and diabetes duration in the regression model.
Conclusion: NAFLD and IR are common in T1D and both are independently correlated with the presence of prevalent CVD, with the highest odds for NAFLD. Although cross-sectional data do not prove causality, these results suggest a pivotal role of NAFLD and IR in the cardiometabolic risk profile of T1D.
Disclosure: J. Mertens: None.
881
Hepatic steatosis in type 2 diabetes: a survey on prevalence and response to innovative treatments in Italy
M. Morieri, A. Avogaro, G. Fadini, on behalf of the DARWIN-T2D Network of the Italian Diabetes Society;
University of Padova, Padova, Italy.
Background and aims: Diabetes, obesity and insulin resistance are major risk factors for Hepatic Steatosis (or Non-Alcoholic Fatty Liver Disease, NAFLD), that represents the main cause of chronic liver disease worldwide. The effects of innovative glucose lowering medications (GLMs) on NAFLD is not entirely clear. The aims of this work were three-folds: 1. To evaluate the prevalence of hepatic steatosis according to the Hepatic Steatosis Index (HSI) in a large Italian population of subjects with T2D; 2. To validate the HSI against ultrasound diagnosis of NAFLD; 3: to evaluate whether GLM influenced the Hepatic steatosis risk.
Materials and methods: The DARWIN-T2D collected data from 46 diabetes outpatient clinics, for a total of 281,381 patients. We extracted information from patients with available data to estimate the HSI (i.e. AST, ALT, BMI, and sex). HSI validation against ultrasound NAFLD diagnosis was conducted at a single centre using results of hepatic ultrasound examinations. Longitudinal analyses were performed among patients with a complete follow-up visit within one year after initiating new GLMs.
Results: The study included 78,895 subjects evaluated between 2015 and 2017. NAFLD, as defined by HSI > 36, was present in 76.3% of subjects, with only 2.7% receiving a score <30 (i.e. very low probability of NAFLD). Elevated HSI was associated with younger age and female sex. After accounting for these differences, higher HSI was associated with lower eGFR, higher prevalence of CKD (O.R. 1.35; 95%C.I. 1.22-1.51) and macroangiopathy (OR 1.18; 95% C.I. 1.07-1.30). We then validated HSI against NAFLD ultrasound diagnosis in 2025 subjects. The overall prevalence of steatosis was 68.7%, with a progressive trend for a higher prevalence of NAFLD in those with higher HSI scores (fig 1, panel A). The prediction performance of HSI for NAFLD diagnosis was moderate (AUC 0.71). However, the prevalence of NAFLD was >3 times higher among subjects with HSI>36 compared to those with HSI<30 (R.R. 3.4; 95% 1.9-6.1). Finally, the change in HSI after initiating new GLM was assessed in 1090 patients with T2D (Dapagliflozin n=181; Glucagon-Like Peptide-1 Receptor Agonists - GLP1-RAs - n=128; Dipeptidyl Peptidase-4 inhibitors - DPP-4i - n=460; gliclazide n=321). The median follow-up duration was about 6 months (IQR 5.3-6.9). As shown in Figure 1 (panel B), HSI significantly declined after initiation of Dapagliflozin, GLP-1RA or DPP-4i, but not Gliclazide.
Conclusion: We found that 3 out of 4 subjects with T2D in Italy have HSI higher than 36, thus suggesting the presence of NAFLD. A condition that increased also the risk of having concomitant CKD and CVD. HSI shows a moderate predictive value for ultrasound-defined NAFLD also in patients with T2D. Treatment with DPP-4i, GLP1-RA, of Dapagliflozin can reduce the risk of NAFLD.

Supported by: Italian Diabetes Society
Disclosure: M. Morieri: Grants; Amryt Pharma. Honorarium; Servier.
PS 85 Lipids everywhere: lipid metabolism in the liver and the heart
882
Relationship between hepatic and systemic angiopoietin-like 3, hepatic Vitamin D receptor expression and non-alcoholic fatty liver disease in obesity
I. Barchetta1, F.A. Cimini1, C. Chiappetta2, L. Bertoccini1, V. Ceccarelli1, D. Capoccia2, M. Gaggini3, C. Di Cristofano2, G. Silecchia2, F. Leonetti2, A. Gastaldelli3, M.G. Cavallo1;
1Department of Experimental Medicine, Sapienza University of Rome, Rome, 2Department of Medical-Surgical Sciences and Biotechnologies, Sapienza University of Rome, Rome, 3Cardiometabolic Risk Unit, CNR, Pisa, Italy.
Background and aims: Non-alcoholic fatty liver disease (NAFLD) is the most common chronic liver disease worldwide and an independent risk factor for cardiovascular mortality. Angiopoietin-like proteins (ANGPTLs) are target for vitamin D receptor (VDR)-mediated gene transcription and this axis may promote NAFLD. ANGPTL3 is a hepatokine which inhibits lipoprotein lipase and its experimentally-induced inactivation reduces hepatosteatosis. Little is known on ANGPTL3 in human NAFLD and no data exist on its relationship with hepatic VDR/VD related genes. Aim of this research was to investigate hepatic ANGPTLs and VDR/VD related gene expression in human obesity in relation to NAFLD.
Materials and methods: We conducted a cross-sectional investigation on forty obese subjects with/without NAFLD. We evaluated hepatic ANGPTL3, ANGPTL4, ANGPTL8, LPL, VDR, CYP27A1 and CYP2R1 expression on liver biopsies by rt-PCR; VDR expression was further investigated by immunohistochemistry; circulating ANGPTL3 was measured by Milliplex assay.
Results: Compared to non-NAFLD, NAFLD individuals had significantly higher hepatic VDR and ANGPTL3 mRNA expression (Mann-Whitney test, both p-values <0.01). Hepatic ANGPTL3 correlated with steatosis grade, LPL, VDR, CYP27A1 and CYP2R1 expression. Plasma ANGPTL3 concentrations were positively associated with clinical/histological markers of NAFLD/NASH (Spearman’s coefficients; FIB-4 p<0.001; steatosis grade p= 0.036, lobular inflammation p= 0.008; NAS score p= 0.04) and with hepatic ANGPTL3 expression (p= 0.04). Greater hepatic VDR expression was the main determinant of hepatic ANGPTL3 after adjusting for multiple confounders (p= 0.003, standardized b= 0.58).
Conclusion: Hepatic ANGPTL3 expression correlates with greater VDR expression, presence and severity of NAFLD and translates in increased circulating ANGPTL3, likely as a result of its modulation by up-regulated hepatic VDR in NAFLD. This study provides novel insights to potential mechanisms underlying ANGPTLs-mediated ectopic fat accumulation and NAFLD development in obesity.
Supported by: Sapienza University
Disclosure: I. Barchetta: None.
883
Relationship between de novo lipogenesis and serum sex hormone-binding globulin in humans
P.I.H.G. Simons1,2, O. Valkenburg3, I. Telgenkamp1,2, K.M. van der Waaij1,2, D.M. de Groot1, J.A.P. Bons4, M.R. Taskinen5, J. Bóren6, P. Schrauwen7, D. Cassiman8, C. Schalkwijk2,9, C.D.A. Stehouwer2,10, V.B. Schrauwen-Hinderling7,11, L. Hodson12, M.C.G. J. Brouwers1,9;
1Department of Internal Medicine, Division of Endocrinology, Maastricht University Medical Center, Maastricht, Netherlands, 2Laboratory for Metabolism and Vascular Medicine, Maastricht University, Maastricht, Netherlands, 3Department of Reproductive Medicine, Maastricht University Medical Center, Maastricht, Netherlands, 4Central Diagnostic Laboratory, Maastricht University Medical Center, Maastricht, Netherlands, 5Research Program, Unit Clinical and Molecular Metabolism, University of Helsinki, Helsinki, Finland, 6Department of Molecular and Clinical Medicine, University of Gothenburg, Gothenburg, Sweden, 7Department of Nutrition and Movement Sciences, Maastricht University, Maastricht, Netherlands, 8Department of Gastroenterology-Hepatology and Metabolic Center, University Hospital Leuven, Leuven, Belgium, 9CARIM School for Cardiovascular Diseases, Maastricht University, Maastricht, Netherlands, 10Department of Internal Medicine, Division of General Internal Medicine, Maastricht University Medical Center, Maastricht, Netherlands, 11Department of Radiology and Nuclear Medicine, Maastricht University, Maastricht, Netherlands, 12Oxford Centre for Diabetes, Endocrinology and Metabolism, University of Oxford, and National Institute for Health Research Oxford Biomedical Research Centre, Oxford University Hospitals Foundation Trust, Oxford, UK.
Background and aims: Obesity, liver fat and type 2 diabetes are associated with decreased levels of serum sex hormone-binding globulin (SHBG). Laboratory studies suggest that hepatic de novo lipogenesis (DNL) is involved in the downregulation of SHBG synthesis. The aim of the present study was to assess the role of DNL on serum SHBG in humans.
Materials and methods: This study consisted of two sub studies; 1) a cross-sectional study that examined the association between DNL, measured by stable isotopes, and serum SHBG in healthy individuals (n=55), 2) a case-control study that compared serum SHBG in healthy individuals (n=14) with monogenetic disorders affecting DNL (i.e. individuals with glucokinase-maturity onset diabetes of the young (GCK-MODY; model of decreased DNL; n=11), and glycogen storage disease type 1a (GSD1a; model of increased DNL; n=9)) or monogenetic disorders causing liver fat through other pathways (i.e. familial partial lipodystrophy (FPL, model of increased fatty acid flux; n=13) and abetalipoproteinemia (ABL, model of impaired VLDL secretion; n=2)).
Results: DNL was inversely associated with serum SHBG in women (β: -0.015, 95%CI: -0.031;-0.000), but not in men (0.005, 95%CI: -0.006;0.016). This strength of association decreased after correction for insulin in women (β: -0.013, 95%CI: -0.028;0.003). Serum SHBG levels were significantly lower in GSD1a patients when compared to controls (median: 13.0 nmol/L versus 43.0 nmol/L, p=0.003). Serum SHBG levels in GCK-MODY, FPL and ABL were not different from controls, despite a higher liver fat content in the latter two groups.
Conclusion: An inverse association between DNL and serum SHBG levels may explain the decreased serum SHBG levels that are observed in obesity and type 2 diabetes, at least in women.
Supported by: EFSD/Sanofi
Disclosure: P.I.H.G. Simons: Grants; European Foundation for the Study of Diabetes (EFSD)/Sanofi.
884
Remnant cholesterol in individuals with type 2 diabetes: correlation to components of the metabolic syndrome and triglyceride-glucose index in the DIVE and DPV registries
J. Brandts1, S.R. Tittel2, P. Bramlage3, T. Danne4, P. Schermann5, E. Hess6, M. Huptas7, R.W. Holl2, D. Müller-Wieland1;
1University Hospital RWTH Aachen, Aachen, 2Ulm University, Ulm, Germany, 3Institute for Pharmacology and Preventive Medicine GmbH, Cloppenburg, 4Children’s and Youth Hospital “Auf Der Bult”, Hannover, 5Hospital Zwettl, Zwettl, Austria, 6Diabetes Specialist Practice Dres. Hess, Worms, 7Diabetes Specialist Centre Kray, Essen, Germany.
Background and aims: Clinical and genetic studies support a causal relationship between Remnant Cholesterol (RC) and cardiovascular complications. RC represents the amount of atherogenic cholesterol transported in triglyceride (TG)-rich lipoproteins and may be elevated in individuals with insulin resistance (IR) or MetS. In this study we aim to assess the relationship between RC and prevalence of MetS and the Triglyceride-Glucose Index (TyG Index) being a marker for insulin resistance (IR), in patients with type 2 diabetes (T2D).
Materials and methods: We conducted a joint analysis of routine care data from two ongoing German diabetes registries, namely DIVE (Diabetes-Versorgungs-Evaluation) and DPV (Diabetes-Patienten-Verlaufsdokumentation). Included in the analysis were adults with T2D and complete information on variables of interest. RC was calculated as non-high-density lipoprotein cholesterol minus low-density lipoprotein cholesterol. TyG Index was calculated with fasting triglycerides and fasting glucose. MetS was defined in line with the international consensus and updated modified NCEP adult treatment panel III report (2009). Visceral obesity was defined as waist circumference ≥ 102/88 cm (male/female), Waist-to-Hip-Ratio ≥ 0.9/0.85 (male/female), and/or BMI ≥ 30 kg/m². We assessed the relationship between RC-levels and the presence of MetS using linear regression and adjusted for age and sex. The correlation between RC and TyG Index was assessed using linear regression and was adjusted for age, sex, plasma triglyceride level, HDL-C level, MetS and visceral obesity. Data are presented as median [Q1 - Q3], or as mean ± standard error.
Results: Data of 26,194 individuals (median age 66 [56 - 74] years, 50% male) were analysed for the association of RC with MetS and RC with TyG Index respectively. Mean RC levels were significantly higher in individuals with MetS than without MetS (38.2±0.3 mg/dl vs. 19.7±1.9 mg/dl, p<0.001). RC was significantly and positively correlated with the presence of a MetS (R²=0.02, β=18.5, p<0.001). Patients with TyG Index above the median value (5.0 [4.8 - 5.3]) had higher RC (39.3±0.4 mg/dl) compared with patients below the median (35.8±0.5 mg/dl). RC was significantly correlated with TyG Index (R²=0.13; β=18.6 p<0.001) suggesting that per every unit change of TyG Index the RC raises by 18.6 mg/dl independent of age, sex, plasma triglyceride level, HDL-C level, MetS and visceral obesity.
Conclusion: This study shows that RC is significantly correlated with the presence of MetS and a measure of IR. Therefore, elevated RC may explain in part the excess cardiovascular risk among patients with T2D and MetS or IR.
Disclosure: J. Brandts: None.
885
Impact of lipoprotein receptors on cardiac lipotoxicity and diabetic heart metabolic rewiring
G. Norata, L. Da Dalt, M. Audano, N. Mitro, A. Barbuti, A. Catapano;
University of Milan, Milan, Italy.
Background and aims: Patients with diabetes are more prone to develop congestive heart failure which could also be the direct consequence of the underlying dyslipidemia which could drive cellular lipotoxicity and cardiac damage independently of ischemic cardiomyopathy. Plasma lipoproteins contribute to deliver cholesterol to cardiomyocytes by interacting with specific cellular surface receptors including the low density lipoprotein receptor and related proteins (LDLr and LRPs). Under diabetic conditions, increased expression of lipoprotein receptors in the heart has been associated with lipid accumulation in cardiomyocytes through augmented uptake of cholesterol esters in the heart. Lipid overload in diabetic cardiomyocytes, in turn, associates with impaired mitochondrial function, decreased ATP and energy production, thus supporting heart failure in animal models and in humans under dysmetabolic and diabetic conditions. Aim of this study was to test the impact of LDL-R overexpression or deficiency which regulates lipoprotein receptors endoplasmic recycling on cardiac lipotoxicity and diabetic heart metabolic rewiring.
Materials and methods: Cardiomyocytes were differentiated from human-iPSC and after 30 days of culture were pretreated for 48h under hyperglycemic condition. Pcsk9 KO (Overexpressing LDLR, highLDLR), Ldlr KO and WT mice were fed with a standard or a high fat diet for 20 weeks and then heart gene expression, oxygen consumption and metabolism was profiled.
Results: Following differentiation to cardiomyocytes (iPSC-CMs), cells acquired Troponin T expression and that of genes involved in fatty acid metabolism (CD36, CPT1b, PPARg). Incubation on high glucose medium increased lipid accumulation and lysosomal activity, suggesting alterations in the uptake and in the handling of intracellular lipids.HighLDLR mice presented lower plasma cholesterol levels but also lower plasma insulin levels compared to WT littermates. This profile was associated with cholesterol accumulation in the heart, alterations in the expression of mitochondrial genes and of proteins of the electron transport chain, impairment of beta oxidation and reduced cardiac maximal oxygen consumption rate. Viceversa, LDLR KO presented reduced expression of genes involved in mitochondrial fission, such as DRP1 paralleled by an increased expression of genes associated to mitochondrial fusion such as MFN1.
Conclusion: While LDLR deficiency results in increased heart mitochondrial fusion, LDLR overexpression as a consequence of PCSK9 deficiency, although resulting in decreased plasma cholesterol levels, is associated with increased lipid accumulation, cardiac impaired metabolic signature, reduced mitochondrial mass and reduced heart oxygen consumption.
Supported by: EFSD/Lilly European Diabetes Research Programme 2019
Disclosure: G. Norata: Grants; EFSD/Lilly European Diabetes Research Programme.
886
Paraoxonase-1 and Apolipoprotein J as biomarkers in dysmetabolism: a cluster analysis
M.J. Meneses1,2, A.F. Pina1,2, I. Sousa-Lima1, R.S. Patarrão1, R.T. Ribeiro3,4, L. Gardete-Correia4, R. Duarte4,5, J.M. Boavida4, I. Correia4, R. Andrade4, J.L. Medina5, J.F. Raposo4,1, M.P. Macedo1,4;
1CEDOC, NOVA Medical School/Faculdade de Ciências Médicas, Universidade Nova de Lisboa, Lisbon, 2ProRegem PhD Program, NOVA Medical School/Faculdade de Ciências Médicas, Universidade Nova de Lisboa, Lisbon, 3Departamento de Ciências Médicas, Universidade de Aveiro, Aveiro, 4APDP - Diabetes Portugal Education and Research Center, Lisbon, 5Portuguese Diabetes Society, Lisbon, Portugal.
Background and aims: Metabolic disorders are characterized by a prooxidant and proinflammatory environment. Decreased levels of paraoxonase 1 (PON1), an enzyme with anti-inflammatory and antioxidant actions, have been associated with type 2 diabetes (T2D), LDL-c hypercholesterolemia, and renal insufficiency. PON1 is mainly produced in the liver and secreted to the bloodstream as HDL-c constituent, where apolipoprotein J (ApoJ) also coexists, and has a protective effect on atherosclerosis. ApoJ has already been associated with insulin resistance. Stratification of dysmetabolic profiles, even using common features, can allow a refined dysmetabolism diagnosis and prognosis leading to better clinical outcomes. We hypothesized that PON1 activity (POase) and ApoJ levels can be used as co-biomarkers in early stages of dysmetabolism.
Materials and methods: A cluster analysis was performed in individuals from the PREVADIAB2 cohort. 304 individuals were analyzed: 139 with normoglycemia, 126 with prediabetes (86 IGT; 25 IFG; and 15 IFG+IGT) and 39 T2D. We used an hierarchical algorithm informed by POase activity, ApoJ levels, age, estimated glomerular filtration rate (eGFR; CKD-EPI), HDL-c, LDL-c, and triglycerides. The optimal number of clusters was determined using silhouette index.
Results: We identified four groups, three with dysmetabolism although including subjects with normoglycemia, prediabetes and T2D, and one mainly with healthy younger people (G4, n=26). However, the three dysmetabolic groups could be further distinguished. G3 (n=19) with low POase activity includes mainly subjects with dysglycemia, dyslipidemia, insulin resistance, and higher eGFR, suggesting hyperfiltration to compensate dysmetabolism. The other two clusters were differentiated by POase activity: G1 (n=154) presents high POase and G2 (n=105) low POase. However, they were similar in other evaluated parameters, having intermediate levels when compared to G3 and G4. These suggests distinct genetic backgrounds or pathophysiological mechanisms involved. Specifically, G2 can represent: a) subjects with PON1 polymorphisms, which are known to associate with low PON1 activities and/or b) individuals with HDL dysfunction, as is the case in kidney disease, for which the lower antioxidant actions can be explained by a reduction of PON1 activity.
Conclusion: We have identified 4 clusters with different glycemic profile, POase activity, and lipid levels, suggesting distinct pathophysiological meaning. The (dys)metabolic profiles identified clusters can be linked to what is observed in clinical practice. Hence, using POase activity and ApoJ levels as co-biomarkers aside from the currently used parameters might allow a refinement of dysmetabolism diagnosis. This work gives new insights about the importance of these two proteins, raising relevant hypotheses. The impact of these profiles on cardiovascular risk, and the role of PON1 polymorphisms should be addressed in future studies.
Supported by: SPD; FCT: PD/BD/114256/2016; PD/BD/136887/2018; PTDC/BIM-MET/4265/2014; UID/Multi/04462/2013
Disclosure: M.J. Meneses: None.
887
Association between atherogenic index of plasma and coronary artery calcification progression in Korean adults
M. Na;
Endocrinology, Gangnam Severance Hospital, Seoul, Republic of Korea.
Background and aims: Dyslipidemia is a well-known risk factor for cardiovascular disease (CVD). Recently, atherogenic index of plasma (AIP) has been proposed as a novel predictive marker for CVD, and there are few cross sectional studies that demonstrated a relationship between AIP and coronary artery disease. We investigated the association between AIP and the progression of coronary artery calcification (CAC) in healthy Korean Adults.
Materials and methods: A total of 1,124 participants who had undergone CAC measurement at least twice by multi-detector CT in a health care center were enrolled. Anthropometric profiles and multiple cardiovascular risk factors were measured. The AIP is defined as the base 10 logarithm of the ratio of the concentration of TG to HDL-C. The CAC progression was defined as either incident CAC in a CAC-free population at baseline or an increase of ≥ 2.5 units between the square roots of the baseline and follow-up coronary artery calcium scores (CACS) among subjects with detectable CAC at baseline
Results: CAC progression was observed in 290 subjects (25.8%) during mean 4.2 years of follow-up. All subjects were stratified into three groups according to AIP. There were significant differences in cardiovascular parameters among the groups. Follow-up CACS and the incidence of CAC progression increased gradually with the rising AIP tertiles. In the logistic regression analysis, the odds ratio for CAC progression was 2.27 when comparing the highest to the lowest tertile of the AIP (95% CI: 1.61-3.19; P for trend <0.01). However, this association was attenuated after adjustment for multiple risk factors (P for trend = 0.67).
Conclusion: There is a significant correlation between AIP and CAC progression, but AIP is not an independent predictor for CAC progression.
Disclosure: M. Na: None.
888
Achievement of ESC/EAS lipid treatment goals with evolocumab in patients with type 2 diabetes: analyses of the Banting and Berson trials
A.J. Lorenzatti1, J. Chen2, M. Monsalvo3, H. Wang3, J.G. López3, R.S. Rosenson4;
1Cardiology, DAMIC Medical Institute / Rusculleda Foundation for Research, Cordoba, Argentina, 2Guangdong Cardiovascular Institute and Guangdong General Hospital, Guangzhou, China, 3Global Development, Amgen Inc., Thousand Oaks, USA, 4Cardiometabolics Unit, Icahn School of Medicine at Mount Sinai, New York, USA.
Background and aims: BANTING and BERSON showed evolocumab in type 2 diabetes (T2D) effectively lowered low-density lipoprotein cholesterol (LDL-C), apolipoprotein B (ApoB), and non-high-density lipoprotein-cholesterol (Non-HDL-C), all targets in cardiovascular disease (CVD) prevention. This study aimed to evaluate the achievement of lipid treatment goals with evolocumab vs placebo, every two weeks (Q2W) or monthly (QM) on the background of moderate- to high-intensity statins in T2D.
Materials and methods: We pooled two double-blind, randomised, phase 3 studies. In BANTING, participants received maximally-tolerated statin. In BERSON, participants began atorvastatin 20 mg daily post-baseline; almost half enrolled in China. LDL-C and non-HDL-C goal achievement were assessed at the mean of weeks 10 and 12; and ApoB at week 12.
Results: A total of 1402 participants were analysed. At baseline, mean (SD) time in years since T2D diagnosis was 10.4 (7.7) in the evolocumab group and 10.1 (7.6) in the placebo group. Of the overall, 90.1% (evolocumab) and 88.2% (placebo) were at very high CVD risk per ESC/EAS 2019 stratification; 70.3% (evolocumab) and 70.5% (placebo) were on background statin therapy. The mean (SD) LDL-C was 2.53 (0.87) mmol/L in the evolocumab group and 2.52 (0.85) mmol/L in the placebo group. Non-HDL-C and ApoB were 3.32 (0.99) mmol/L and 0.89 (0.23) g/L in the evolocumab group, and 3.30 (0.99) mmol/L and 0.88 (0.24) g/L in the placebo group, respectively. Of the 451 Chinese participants, at baseline, mean (SD) years since T2D diagnosis was 10.2 (6.6) in the evolocumab group and 8.4 (6.4) in the placebo group; 84.1% (evolocumab) and 83.2% (placebo) were at very high CVD risk per ESC/EAS 2019 stratification; 39.1% (evolocumab) and 39.6% (placebo) were on background statin therapy. The mean (SD) LDL-C was 2.30 (0.85) mmol/L in the evolocumab group and 2.22 (0.81) mmol/L in the placebo group. Non-HDL-C and ApoB were 2.98 (0.92) mmol/L and 0.84 (0.22) g/L in the evolocumab group, and 2.92 (0.94) mmol/L and 0.82 (0.24) g/L in the placebo group, respectively. After treatment, 75% and 78.9% more participants achieved both LDL-C <1.4 mmol/L and ≥50% reduction from baseline in the evolocumab Q2W and QM dose groups, respectively, compared to the placebo. Percentage achievement of non-HDL-C and ApoB treatment goals was significantly greater in evolocumab versus placebo groups (P<0.0001) (Table). Results were consistent in the Chinese subpopulation.
Conclusion: Evolocumab on top of moderate- to high- intensity statins enabled most T2D patients at very-high/high CVD risk to achieve the recommended lipid treatment goals.

Clinical Trial Registration Number: BANTING(NCT02739984);BERSON(NCT02662569)
Supported by: Amgen Inc.
Disclosure: A.J. Lorenzatti: Grants; Amgen Inc.
889
Patients with type 2 diabetes and familial hypercholesterolaemia are at very high cardiovascular risk: data from the HELLAS-FH registry
E.N. Liberopoulos1, C.V. Rizos1, I. Skoumas2, K. Tziomalos3, L. Rallidis4, V. Kotsis5, M. Doumas6, E. Skalides7, G. Kolovou8, A. Garoufi9, I. Koutagiar2, M. Papagianni10, E. Kiouri4, C. Antza5, M.S. Elisaf1;
1Internal Medicine, University of Ioannina, Ioannina, 2Cardiology Clinic, Hippokration General Hospital, Athens, 3Department of Propaedeutic Internal Medicine, Aristotle University of Thessaloniki, AHEPA University General Hospital of Thessaloniki, Thessaloniki, 4Department of Cardiology, National and Kapodistrian University of Athens, Attikon University General Hospital, Athens, 5Department of Internal Medicine, Aristotle University of Thessaloniki, Thessaloniki, 6Department of Internal Medicine, Aristotle University of Thessaloniki, Hippokration General Hospital, Thessaloniki, 7Cardiology Clinic, University General Hospital of Heraklion, Heraklion, 8Cardiology Clinic, Onassis Cardiac Surgery Center, Athens, 9Department of Pediatrics, National and Kapodistrian University of Athens, Pediatrics Clinic, General Children’s Hospital “Pan. & Aglaia Kyriakou”, Athens, 10A Department of Propaedeutic Internal Medicine, Aristotle University of Thessaloniki, AHEPA University General Hospital of Thessaloniki, Thessaloniki, Greece.
Background and aims: Familial hypercholesterolemia (FH) patients have an increased risk for premature cardiovascular disease (CVD). This is aggravated by the presence of comorbidities, such as type 2 diabetes (T2D). The aim was to compare characteristics of FH patients with and without T2D using data from the HELLAS-FH registry
Materials and methods: A total of 1,382 adult patients with a clinical diagnosis of FH were evaluated. Among them 8% (n = 110) had T2D.
Results: T2D FH patients were older (61.8±11.3 vs 50.6±14.5 years, p<0.001) and had increased BMI (29.1±5.5 vs 27.2±4.5 kg/m2, p=0.001) and hypertension prevalence (56.5% vs 25.6%, p<0.001) compared with non-T2D FH individuals, respectively. Of note, T2D FH patients had higher prevalence of CVD (57.4% vs 23.4%, p <0.001), particularly premature CVD (48.1% vs 19.5%, p <0.001). At diagnosis, T2D FH patients had lower levels of TCHOL (298±73 vs 318±81 mg/dL, p=0.012), LDL-C (214±72 vs 237±80 mg/dL, p=0.004), HDL-C (48±24 vs 52±16 mg/dL, p=0.02) and non-HDL-C (250±75 versus 267±81 mg/dL, p=0.04). In contrast, T2D FH patients had higher levels of TGs [150 [interquartile range (IQR) 120-210] vs 130 (95-180) mg/dL, p <0.001), whereas Lp(a) levels did not differ between groups [18 (10-114) vs 18 (9-53) mg/dL, p=0.423). On treatment lipid profile in subjects with T2D FH compared with non-T2D FH was as follows: TCHOL 217±64 vs 229±76 mg/dL (p=NS), HDL-C 47±19 vs 52±16 mg/dL (p=0.011), TGs 130 (100-200) vs 110 (78-152) mg/dL (p <0.001), LDL-C 137±59 vs 152±73 mg (p=0.061) and non-HDL-C (170±61 vs 177±76 mg/dL, p=NS). LDL-C target was achieved in 7.4% of T2D FH compared with 17.3% of non-T2D FH patients (p=0.022).
Conclusion: T2D FH patients are older, have increased prevalence of additional CVD risk factors as well as increased prevalence of CVD, especially premature CVD. T2D FH patients exhibit a significantly lower LDL-C target achievement rate.
Supported by: This study is funded by the Hellenic Atherosclerosis Society.
Disclosure: E.N. Liberopoulos: None.
PS 86 All about coronary arteries and diabetes
890
Glucose lowering medications use according to cardiac complications in patients with type 2 diabetes in real clinical practice
O. Vikulova, A. Zheleznyakova, M. Isakov, M. Shestakova;
Endocrinology Research Center, Moscow, Russian Federation.
Background and aims: The increased number of cardiac complications (CC) in patients with type 2 diabetes (T2DM) is well known, therefore, physicians should pay more attention to the treatment recommendations due to protective effects on the cardiovascular system of certain glucose lowering medications (GLM). The aim of our study was to access the data on frequency of use of different GLM according to the presence or absence of several CC in T2DM patients in real clinical practice.
Materials and methods: The analysis performed based on the national registry data and included all adult patients (≥18years old) with T2DM (n=4449684) at 01.01.2020. For all patients we estimated the reported cases of myocardial infarction (MI), coronary heart disease (CHD) and hypertension according to registry data as well as treatment at the time of survey. We divided all T2DM patients into the therapy groups according the presence of certain drug (in monotherapy or combination) and then analysed these groups depending on the reported CC frequency. IBM SPSS Statistics ver 22.0 was used to process the data.
Results: The structure of prescribing GLM and proportion of T2DM patients on therapy with certain CC presented in the table. The use of traditional classes dominates with common use of insulin, metformin (Met) and sulfonylurea (SU). In total T2DM patients the most frequently prescribed classes were Met (74,4%), SU (53,1%) and insulin basal (19,2%) and bolus (12,6%). The new GLM classes such as inhibitors of dipeptylpeptidase-4 (iDPP-4), inhibitors of sodium glucose co-transporter 2 (iSGLT-2), agonist receptor glucagon-like peptide type 1 (arGLP-1) not widely distributed currently (7,9%, 2,5% and 0,2%, respectively), though they have the proved protective effects on the cardiovascular system, with slight, but significant increase into iDPP-4 and iSGLT-2 groups with the combined CC (from 0 to 3). We observed significant difference between GLM groups with bigger rise of proportion of T2DM patients on traditional (insulin and SU)- more then 2 times, compared to the new drugs (iDPP-4and iSGLT-2) with rising CC presence and frequency (0-3), while Met and arGLP-1 use remain rather stable. Separate analysis was made according to the exact CC (yes or no): in patients with CC we observed bigger proportion on therapy with all GLM except arGLP-1 (stable) and less Met use in groups with MI and CHD.
Conclusion: We observed the relation between the therapy and CC in T2DM patients in real clinical practice. The therapy for T2DM should be encouraged in compliance with the new clinical recommendations and more active introduce the classes of drugs with evidence of reducing cardiovascular risk.

Supported by: Funded by the Russian Ministry of Health
Disclosure: O. Vikulova: None.
891
Screening asymptomatic patients with diabetes for coronary stenoses suitable for revascularisation: a retrospective evaluation of ESC-EASD guidelines
N. Berkane1, E. Cosson1, S. Pinto2, T. Ciunganu2, P. Valensi2;
1Diabetology-Endocrinology-Nutrition, AP-HP, Université Sorbonne Paris Nord, Bobigny, 2Diabetology-Endocrinology-Nutrition, AP-HP, Université Sorbonne Paris Nord, Bondy, France.
Background and aims: The aim of the study was to test various criteria to select asymptomatic patients with diabetes to be screened for silent myocardial ischemia (SMI). This screening might improve cardiovascular prognosis especially through identification of coronary stenoses (CS) suitable for revascularization. Clinical, biological and imaging criteria including coronary artery calcium (CAC) score were considered.
Materials and methods: We selected 416 asymptomatic patients with diabetes, no history of coronary disease and with a very high cardiovascular risk according to the following ESC/EASD-2019 criteria: either peripheral vascular disease or target organ damage (severe nephropathy or retinopathy) or early onset type 1 diabetes (before 10 years) of long duration or at least 3 risk factors (RFs) in addition to diabetes. These patients had had a CT-scan to measure CAC score, and a stress myocardial scintigraphy to detect SMI, with a coronary angiography performed in those with SMI. We tested the performances of various criteria to identify patients with SMI and CS, in particular the proposal of ESC-EASD guidelines to only screen patients with severe nephropathy or peripheral vascular disease, or those with a high CAC score.
Results: CAC score was >100 AU in 182 patients (43.7%). SMI was present in 40 patients (9.6%); 28 of them had a coronary angiography. CS were found in 15 out of these 28 patients (54%), and 11 of these 15 patients had a revascularization procedure (73.5%). Performing a scintigraphy (a) in all patients but those who had only the 3 RFs criterion (“patients (a)”: n=278 myocardial scintigraphies) would have led to miss 2 of the 11 CS suitable for revascularization; (b) in patients with peripheral vascular disease and/or a severe nephropathy only (“patients (b)”: 141 scintigraphies) would have led to miss 6 of them; (c) in the “patients (a)”; and if not, in those with a CAC score >400 (298 scintigraphies and 125 CAC performed) or >100 (327 scintigraphies and 125 CAC) would have led to miss 1 or 0 of them, respectively; (d) in the “patients (b)”; and if not, in those with a CAC score >400 (182 scintigraphies and 275 CAC) or >100 (239 scintigraphies and 275 CAC) would have led to miss 2 or 0 of them, respectively. Considering the cost of a CAC score measurement and interpretation (87€) and a scintigraphy (500€), algorithm (d) was the most cost-effective to detect all patients with CS suitable for revascularization.
Conclusion: Among the asymptomatic diabetic patients fulfilling the very high cardiovascular risk criteria according to ESC/EASD-2019 guidelines, screening for SMI and CS only those with peripheral artery disease or severe nephropathy or a CAC score >100 AU appears to be a good compromise, which allows not missing patients with CS suitable for revascularization, at a controlled cost.
Disclosure: N. Berkane: None.
892
Preoperative cardiac diagnostics in bariatric patients with diabetes: results of a cohort of 258 cases
B.L. Stillhard1, T.B.T. Ngo1, M. Slawik1, B. Woelnerhanssen2, R. Peterli3;
1Internal Medicine, St.Claraspital AG, Basel, 2Clinical Research, St.Claraspital AG, Basel, 3Visceral Surgery, Clarunis, Basel, Switzerland.
Background and aims: Obesity and diabetes mellitus (DM) are well-known risk factors for cardiovascular complications and perioperative morbidity. Bariatric surgery has long been established in the treatment of morbid obesity leading to sustainable weight loss and reduction in comorbidities including DM, as well as mortality. The aim of this study was to evaluate effectivity and reliability of the cardiac assessment in diabetic patients prior to bariatric surgery at our center.
Materials and methods: We retrospectively analysed the co-morbidities, the results and consequences of cardiac assessments of 258 morbidly obese patients with diabetes scheduled for bariatric surgery at our institution between January 2010 and December 2018.
Results: Out of 258 patients, 173 (67.1%) underwent stress-rest myocardial perfusion imaging, 15 (5.8%) patients had other cardiac imaging including diagnostic coronary angiography, 59 (22.9%) patients had echocardiography and/or stress electrocardiography, and 12 (4.7%) patients received no cardiac evaluation. Subsequently, coronary angiography was performed in 28 patients (10.9%), coronary heart disease was detected in 15 subjects (53.6%). Of these 15 individuals, 5 (33.3%) patients had a diffuse vascular sclerosis, 8 (53.3%) patients underwent a coronary angioplasty and stenting, and 2 (13.3%) patients coronary artery bypass surgery. Bariatric surgery was performed without cardiovascular events in all 258 patients.
Conclusion: Our data suggests that a detailed cardiac assessment is mandatory in diabetic bariatric patients to identify those with yet unknown cardiovascular disease before performing bariatric surgery. We recommend echocardiography and stress electrocardiography but preferable myocardial perfusion imaging as a reliable diagnostic tool.
Disclosure: B.L. Stillhard: None.
893
High-sensitivity C-reactive protein has a different prognostic impact in acute myocardial infarction patients with and without diabetes
N. Cosentino, M. Rondinelli, C. Lucci, J. Campodonico, V. Milazzo, M. De Metrio, M. Rubino, G. Marenzi, S. Genovese;
Centro Cardiologico Monzino, I.R.C.C.S., Milan, Italy.
Background and aims: An elevation of high-sensitivity C-reactive protein (hs-CRP) levels frequently occurs in acute myocardial infarction (AMI), and it is associated with adverse outcomes. Since diabetes mellitus (DM) is characterized by an underlying chronic inflammation, it can be hypothesized that hs-CRP has a different prognostic power in AMI patients with DM compared to non-DM patients.
Materials and methods: We included 2,064 AMI patients (1,016 STEMI, 1,048 NSTEMI). High-sensitivity-CRP was measured at hospital admission. Patients were grouped according to hs-CRP quartiles and DM status. The primary endpoint was a composite of in-hospital mortality, cardiogenic shock, and acute pulmonary edema. Two-year all-cause mortality was considered as secondary endpoint.
Results: Twenty-six percent (n=548) of patients had DM, and they had higher levels of hs-CRP than non-DM patients (5.32 vs. 3.24 mg/L; P<0.0001). The incidence of the primary endpoint in the overall population (7%, 9%, 13%, 22%; P for trend <0.0001), as well as in DM (14%, 9%, 21%, 27%; P=0.0001) and non-DM (5%, 8%, 10%, 19%; P<0.0001) patients increased in parallel with hs-CRP quartiles. However, the adjusted risk of the primary endpoint significantly increased in parallel with hs-CRP quartiles in non-DM patients but not in DM patients. Similarly, a significant difference in the adjusted risk of two-year mortality between hs-CRP quartiles was found in non-DM patients only.
Conclusion: This study demonstrates that hs-CRP level at hospital admission in AMI predicts in-hospital outcome and long-term-mortality. However, unlike in non-DM patients, hs-CRP does not seem to be independently associated with prognosis in DM patients.
Disclosure: N. Cosentino: None.
894
Is conventional two-dimensional ultrasound still relevant in asymptomatic patients with type 2 diabetes? DIACAR: a prospective observational study
A. Ben Hamou1, Y. Anatakly Henon2, A. Alamri1, G. Chatellier3, I. Banu1, P. Garçon2, A. Voican1, Y. Moeuf2, C. Oriez1, M. Aroulanda1, P. Abassade2, M. Fumery2, M. Komajda2, R. Cador2, O. Dupuy1;
1Diabetology, Endocrinology and Nutrition, Paris Saint Joseph Hospital, Paris, 2Cardiology Department, Paris Saint Joseph Hospital, Paris, 3Department of Epidemiology, Paris Saint Joseph Hospital, Paris, France.
Background and aims: The prevalence of heart abnormalities in asymptomatic diabetes mellitus type 2 patients (DM2) is poorly understood. Global longitudinal strain (GLS) is a sensitive echo-cardiographic parameter used to assess left ventricular function. The objective was to assess, in a population of DM2 free from any cardiovascular pathology, the proportion of patients with an abnormal strain value and to assess whether certain clinical or biological parameters were associated with this anomaly.
Materials and methods: This prospective cohort study included 200 consecutive asymptomatic DM2 (108/92 M/F) aged 57.5±11 years, with a BMI of 29.1±5.3 kg/m², hospitalized for uncontrolled diabetes (HbA1c: 9.94±2 %). They underwent a systematic transthoracic echocardiography (Philips EPIC 7 ultrasound system, probes S5 t X5). All patients with a documented history of cardiovascular disease or symptoms suggestive of a heart defect were excluded.
Results: The value of GLS was found to be abnormal (<|18.3| %) in 22.5% of patients, although the ejection fraction measured in Simpson biplane and the study of diastolic function were normal in all patients. DM2 with abnormal SLG had a BMI (31.1±5.9 vs. 28.5±5.0 kg/m²; mean difference (95% CI: 0.85 to 2.92, p=0.004)) and a heart rate (78.1±11.5 vs. 74.3±12.7 bpm; mean difference: 3.8 (95% CI: -0.38 to +8.0, p=0.075)) higher than DT2 with Normal SLG. HbA1c was comparable (10.3±4.1% vs. 9.8±4.2 %) with no significant difference on the other clinical parameters. Echographically, they had a comparable indexed LV mass (average difference: 2.2 g/m² (95% CI: -4.2 to +8.6, p=0.075) but a lower E/A ratio (0.81±0.32 vs. 0.93±0.30; mean difference: 0.12 (95% CI: 0.02 to 0.22, p=0.02)).
Conclusion: The practice of a fine analysis of the cardiac function with the measurement of the GLS of the asymptomatic DM2 permits to diagnose cardiac subclinical anomalies of the systolic function in more than 20% of the cases. Longitudinal follow-up will allow to confirm if this subgroup has an increased risk of cardiovascular complications or not.
Clinical Trial Registration Number: NCT03736668
Supported by: DIACAR
Disclosure: A. Ben Hamou: None.
895
Relationship between triglycerides-glucose index and silent coronary artery disease in asymptomatic patients with type 2 diabetes
M.-T. Nguyen1, A. Sultan2, E. Cosson1, A. Avignon2, P. Valensi1;
1Department of Endocrinology-Diabetology-Nutrition, Jean Verdier hospital, AP-HP, CRNH-IdF, CINFO, Paris-Nord University, Bondy, 2Department of Endocrinology-Diabetology-Nutrition, CHRU Montpellier, CHU de Montpellier, Montpellier, France.
Background and aims: In a recent study Triglycerides-Glucose index (TyG), a simple index of insulin resistance, was shown to be associated with a high risk of coronary artery disease in patients with type 2 diabetes (T2D). The aim of this study was to examine the association between TyG index, the cardiovascular risk factors, silent coronary disease and the risk of major cardiovascular events in asymptomatic patients with T2D free of cardiovascular history.
Materials and methods: We included 1177 patients, 55.6% men, age 60.9±9.0 years, diabetes duration 13.6±8.5 years, HbA1c 8.5±1.9%. TyG [log (triglycerides x fasting glucose)], HOMA-IR and HOMA-β indexes were calculated. Silent myocardial ischemia (SMI) was assessed using stress myocardial scintigraphy, and a coronary angiography was performed in the patients with SMI.
Results: TyG correlated positively with HOMA-IR (p<0.0001) and negatively with HOMA-β (p=0.02). The study population was separated in tertiles of TyG. In the third tertile, BMI, waist circumference, HbA1c, triglycerides, LDL-cholesterol, non-HDL cholesterol, HOMA-IR and the percentage of patients with microalbuminuria were higher, and HDL-cholesterol was lower, with a higher 10-years risk of coronary events (UKPDS) (p<0.0001 for all comparisons). SMI was present in 321 patients. A coronary angiography was performed in 257 of these 321 patients, showing significant coronary stenoses in 104 patients (40.5%). SMI was not significantly associated with TyG. There was a trend to an increasing percentage of patients with coronary stenoses from the first to the third TyG tertile : 7.4%; 9% and 11.7% (p=0.124). We followed up 490 patients, during 4.8±3.4 years. A major cardiovascular event occurred in 44 patients, with a respective incidence rate of 5.1%, 6.8% and 11.2% from the first to the third tertile (p=0.07). In a multivariate model including age, BMI, LDL-cholesterol and lipid-lowering treatment, TyG was associated with coronary stenoses (OR 1.4 [1.0-1.9]; p<0.05) and with cardiovascular events (OR 1.7 [1.0-2.9]; p=0.045).
Conclusion: In patients with T2D, TyG index may be used as a marker of insulin resistance and allows identifying those at higher risk of coronary stenoses and cardiovascular events.
Disclosure: M. Nguyen: None.
896
Prevalence and risk factors of coronary heart disease in Chinese hospitalised patients with type 2 diabetes, 2013-2018
C. Wang1, Z. Xie1, X. Huang1, Z. Wang2, H. Shangguan2, S. Wang1;
1Department of Endocrinology, The Affiliated ZhongDa Hospital of Southeast University, Nanjing, 2School of Medicine, Southeast University, Nanjing, China.
Background and aims: Coronary heart disease (CHD) is a major chronic complication of diabetes. The goal of the cross-sectional survey was to estimate the prevalence of CHD and cardiovascular risk factors in diabetic inpatients from data gathered from 2013 to 2018.
Materials and methods: A total of 66536 hospitalized patients with a definitive diagnosis of diabetes mellitus were investigated, and complete demographic and clinical data were gathered from 30693 type 2 diabetes mellitus (T2DM). The age-standardized prevalence of CHD was calculated on the basis of data from Chinese population census in 2010. Multiple imputation was used to impute missing values and logistic regression analysis was used to analyze the risk factors.
Results: The crude prevalence of CHD was estimated to be 23.5% and a standardized prevalence was 13.9% (16.0% in men and 11.9% in women) in hospitalized patients with T2DM. The prevalence of CHD increased with the age (p<0.001), and male patients had higher prevalence of CHD than females at all ages. The prevalence of one subject having 1, 2, 3, 4 or above of the 5 traditional risk factors (hyperglycaemia, overweight or obese, hypertension, dyslipidaemia, or smoking) was 2.0, 18.0, 38.3 and 41.7%, respectively. Multivariate regression analysis showed that diabetes duration, hypertension, smoking, overweight, obesity, hypoglycemia, the use of antiplatelet and statins were significantly associated with a higher risk of CHD.
Conclusion: The prevalence of CHD was high in diabetic inpatients in China, and the determination of metabolic risk factors is very important for the identification of high-risk population and follow-up intervention.
Disclosure: C. Wang: None.
897
The impact of acute glycaemic fluctuations on left ventricular systolic function in insulin-treated type 2 diabetes
A. Andersen1,2, P.G. Jørgensen3, J.I. Bagger1,2, M.P.A. Baldassarre2,4, M. Christensen2, K.U. Abelin1,2, J. Faber5,6, U. Pedersen-Bjergaard6,7, J.J. Holst8,9, T. Lindhardt3,6, G. Gislason3,6, F.K. Knop2,9, T. Vilsbøll1,6;
1Steno Diabetes Center Copenhagen, Hellerup, Denmark, 2Center for Clinical Metabolic Research, Herlev and Gentofte Hospital, Hellerup, Denmark, 3Department of Cardiology, Herlev and Gentofte Hospital, Hellerup, Denmark, 4Department of Medicine and Aging Sciences, G. d'Annunzio University, Chieti, Italy, 5Department of Endocrinology, Herlev and Gentofte Hospital, Herlev, Denmark, 6Department of Clinical Medicine, University of Copenhagen, Copenhagen, Denmark, 7Department of Endocrinology and Nephrology, Nordsjællands Hospital, Hillerød, Denmark, 8Department of Biomedical Sciences, University of Copenhagen, Copenhagen, Denmark, 9Novo Nordisk Foundation Center for Basic Metabolic Research,, University of Copenhagen, Copenhagen, Denmark.
Background and aims: Patients with type 2 diabetes have twice the risk of developing heart failure compared to individuals without diabetes and a markedly altered cardiac metabolism including a shift towards increased free fatty acid oxidation. However, the effect of acute changes in plasma glucose (PG) on cardiac function is unclear. We evaluated the effect of acute hyperglycaemia and hypoglycaemia on cardiac function.
Materials and methods: Insulin-treated patients with type 2 diabetes (n=21, [mean±SD] age 62.8±6.5 years, BMI 29.0±4.2 kg/m2, HbA1c 51.0±5.4 mmol/mol) and matched controls (n=21, age 62.2±8.3 years, BMI 29.2±3.5, HbA1c 34.3±3.3 mmol/l) with normal glucose tolerance underwent a 3-step glucose clamp day with 30 min of steady-state PG during each step: 1) fasting PG (FPG), 2) hyperglycaemia (FPG+10 mmol/l), and 3) hyperinsulinaemic hypoglycaemia (PG<3.0 mmol/l). Cardiac function was evaluated during steady-state of each step by echocardiography.
Results: Acute hyperglycaemia significantly increased left ventricular ejection fraction (LVEF) from baseline in type 2 diabetes patients whereas no significant change was observed in controls (Table 1). Additional measures of left ventricular systolic function all increased during hyperglycaemia; however, the change was only significant for s’ (type 2 diabetes and controls) and global longitudinal strain rate (controls only). All measures of left ventricular systolic function increased markedly during hypoglycaemia. No significant interaction between group and PG level on cardiac function was observed.
Conclusion: We demonstrate that LVEF increases during acute hyperglycaemia in insulin-treated patients with type 2 diabetes and that acute hypoglycaemia markedly increases all measures of left ventricular systolic function. These results point to the importance of glycemia when evaluating left ventricular systolic function by echocardiography in patients with type 2 diabetes.

Clinical Trial Registration Number: NCT03150030
Supported by: NNF, CRD
Disclosure: A. Andersen: Grants; Capital Region of Denmark, Novo Nordisk Foundation.
PS 87 Lipids and glucose: not so good for the heart
898
Machine learning algorithms for prediction of progression of vascular complications in type 1 diabetes based on achievement of treatment targets
I. Salna1, R. Krikova2, L. Pahirko2, E. Salna2, J. Sokolovska2;
1Pauls Stradins Clinical University Hospital, Riga, 2University of Latvia, Riga, Latvia.
Background and aims: Guidelines recommend optimal control of HbA1c, blood pressure and low-density cholesterol (LDL-C) to prevent progression of vascular complications of type 1 diabetes (T1D). Prediction of complication progression based on clinical markers and using machine learning algorithms (MLA) can be helpful for tailoring treatment and patient motivation purposes. Aim: to reveal how HbA1C, LDL-C and blood pressure aim achievement predicts progression of vascular complications in T1D and to elaborate a MLA which correlates with results of logistic regression.
Materials and methods: Study includes 115 patients with T1D. At baseline visit in 2013-2016, achievement of treatment targets was defined as: HbA1c <7%, blood pressure <140/85mm Hg, LDL-C <2.6 mmol/l, with stricter aims for patients with cardiovascular disease (CVD) and diabetic nephropathy (DN). Outcome variables at a follow-up in 2018-2020 were: progression of DN (eGFR decline≥3 ml/min/year or increase albuminuria stage), retinopathy stage and new CVD, analyzed as a composite outcome (those who progressed in at least one complication were defined as “progressors”). Data were analyzed using logistic regression models, Chi2 test and Wilcoxon test in program R. MLA were trained in Azure Machine Learning Studio environment, which allowed to identify markers with greatest predictive power and to compare several classification algorithms using AUC score.
Results: At baseline, “progressors” (n=55), compared to “non-progressors”(n=60), had higher prevalence of arterial hypertension (49% vs 27%; p=0.003), lower achievement of blood pressure aim (37% vs 52%, p=0.042), longer diabetes duration (18 (12-28) years vs 12.5 (5.8-23.2) years, p=0.046), higher HbA1c (8.3 (7.5-9.9)% vs 8.1 (7.2-8.9)%, p=0.045). In a fully adjusted logistic regression model, using composite complication progression as a dependent variable and achievement of blood pressure aim, HbA1c aim, LDL-C aim, sex, age, diabetes duration, body mass index (BMI), waist/hip ratio, smoking, hypolipidaemic and hypotensive treatment, complication status at baseline as predictors, and after a stepwise selection based on AIC, significant predictors and their odds ratio (95% CI) were: blood pressure aim 0.375 (0.132,1.067), p=0.066; HbA1c aim 0.181 (0.033,0.999), p=0.05; LDL-C aim 3.332 (1.038,10.701), p=0.043; smoking 3.921 (1.124,13.674), p=0.032. When the same variables were used for MLA, it predicted composite complication progression with AUC=0.681(True Positive 14; False Negative 18; False Positive 6; True Negative 19; Accuracy 0.579; Precision 0.700; Recall 0.438; F1 Score 0.538). Best MLA performance was demonstrated for prediction of CVD progression (AUC=0.824), using variables: age, diabetes duration, retinopathy status, BMI, HbA1c, Waist-to-hip ratio, blood pressure aim, HDL, Total cholesterol, Arterial hypertension, Triglyceride concentration and LDL.
Conclusion: When using the same predictors as for logistic regression, MLA demonstrated an acceptable performance in prediction of impact of treatment target achievement on progression of complications in T1D. Studies with larger patient number are needed.
Disclosure: I. Salna: None.
899
Micro- and macrovascular complications in relation to lipid-lowering drug usage among Danish type 2 diabetes subjects
M.E. Jorgensen1, M.B. Dunbar1, P.F. Rønn1, J.S. Knudsen2, B. Carstensen1, F.I. Persson1, H. Amadid1;
1Steno Diabetes Center Copenhagen, Gentofte, 2University of Aarhus, Aarhus, Denmark.
Background and aims: Although lipid-lowering treatment is crucial for prevention of cardiovascular disease, a large proportion of type 2 diabetes patients either do not initiate lipid-lowering treatment or discontinue treatment. The health consequences related to lack of- or insufficient lipid-lowering treatment in the general type 2 diabetes population are unknown. We therefore examined the incidence of micro- and macrovascular complications in relation to use of lipid-lowering drug treatment among type 2 diabetes subjects in Denmark from 1996 to 2017.
Materials and methods: The study population consisted of 404,389 subjects with type 2 diabetes living in Denmark between 1996 and 2017 identified using the Danish Diabetes Register. Redemptions of prescribed lipid-lowering drug treatment were ascertained from the nationwide Register of Medicinal Products Statistics. Events of diabetes-related micro- and macrovascular complications were ascertained from the National Patient Register. Drug-exposure to lipid-lowering drugs at any given time was based on the redeemed amount and prescribed dose of lipid-lowering drugs. During follow-up of drug-exposure, persons could move from “never use” to “current use” and at discontinuation to “ever use" (i.e. previous but not current use), and back to “current use” when treatment is resumed. Incidence rates of diabetes-related micro- and macrovascular complications by drug-exposure status (i.e. never/current/ever), current age, diabetes duration and calendar time were estimated using Poisson regression for time-split data.
Results: In total, 64% of subjects redeemed at least two prescriptions of lipid-lowering drugs during the study period. Median follow-up time was 7.2 years. The incidence of complications was lowest among individuals with type 2 diabetes during follow-up of never use of lipid-lowering drugs and highest during ever use of lipid-lowering drugs (Table 1). Current use of lipid-lowering drugs was associated with lower incidence rates compared to ever use, but with higher incidence rates compared to never use, except for cerebrovascular disease and amputations (Table 1).
Conclusion: Lipid-lowering drug treatment is associated with lower incidence rates of micro- and macrovascular complications among subjects with type 2 diabetes who are currently on lipid-lowering treatment when compared to subjects who had ever (i.e. previously) been on treatment. Individuals never on lipid-lowering treatment had lower incidence rates, probably due to a higher degree of preexisting CVD in the user groups.

Supported by: This investigator driven study was sponsored by AMGEN
Disclosure: M.E. Jorgensen: Grants; AMGEN.
900
Real world risk of major outcomes for type 2 diabetes with stable coronary artery disease without prior MI or stroke and THEMIS-like patients using SNDS French claims database
P. Blin1, P. Darmon2, P. Henry3, E. Guiard1, M.-A. Bernard1, C. Dureau-Pournin1, H. Maïzi1, F. Thomas-Delecourt4, R. Lassalle1, C. Droz-Perroteau1, N. Moore1;
1Bordeaux PharmacoEpi INSERM CIC1401, University of Bordeaux, Bordeaux, 2Hospital La Conception, Marseille, 3Hospital Lariboisiere, Paris, 4AstraZeneca, Courbevoie, France.
Background and aims: The THEMIS randomized controlled trial showed that patients with stable coronary artery disease and type 2 diabetes mellitus (CAD-T2DM), without a history of myocardial infarction (MI) or stroke, and who received ticagrelor plus aspirin, had a lower incidence of ischemic cardiovascular events but a higher incidence of major bleeding than those who received placebo plus aspirin. After 3 years of follow-up, the incidence of major outcomes in the placebo arm was 1.8% for ischemic stroke, 3.3% for MI, 4.9% for all-cause death, 9.2% for a composite of all-cause-death, MI or stroke, and 0.38 per 100 patients-years for TIMI major bleedings. The risk of these outcomes is not well known in current practice. The aim was to estimate the incidence of major outcomes for CAD-T2DM patients without prior MI-stroke and more specifically for THEMIS-like patients in a real world setting.
Materials and methods: Cohort within the main scheme of the SNDS (Système National des Données de Santé), the French nationwide claims database, representing about 86% of 66 million people. All CAD-T2DM prevalent patients without prior MI-stroke were identified on January 1st, 2014 (inclusion date), based on a 5-year database history, and followed for two years. The THEMIS-like population included CAD-T2DM patients without prior MI-stroke ≥ 50 years at inclusion date without renal failure with dialysis, cirrhosis or liver cancer history, as well as no intracranial and gastro-intestinal bleeding for the last 6 months, or anticoagulant or antiplatelet agent 2 months before and after inclusion date. The Kaplan-Meier method was used to estimate the 2-year cumulative incidence of all-cause death and a composite of all-cause death, MI and stroke, and the cumulative incidence function, taking into account death as competing risk for other clinical outcomes.
Results: From 258,260 CAD-T2DM patients without prior MI-stroke, 64,334 were included in the THEMIS-like population (24.9%) with the same median age of 72 years, with 68.3% and 65.7% men, respectively. The 2-year cumulative incidence for the CAD-T2DM without prior MI-stroke and THEMIS-like populations was 1.7% and 1.5% for ischemic stroke, 1.7% and 1.3% for MI, 9.5% and 5.3% for heart failure, 4.9% and 3.2% for major bleeding, 13.6% and 9.7% for all-cause death, and 16.2% and 12.0% for the composite outcome, respectively.
Conclusion: In current practice, the median age of the THEMIS-like population was 6 years older than in the THEMIS trial (i.e. 66 years), with an observed risk after 2 years of follow-up, about double for the composite outcome, triple for deaths and quadruple for major bleedings than those of the placebo arm of the trial (estimation after 2 years of follow-up in the THEMIS trial placebo arm assuming constant risk across time according to Kaplan-Meier graph).
Disclosure: P. Blin: Grants; Study funded by an unrestricted grant from AstraZeneca, performed independently by the Bordeaux pharamcoEpi platform of Bordeaux University and supervised by a scientific committee.
901
Periostin: a new predictor of diabetic coronary artery calcification
Y. Zhu;
Southeast University, Nanjing, China.
Background and aims: Periostin is important for bone and tooth maintenance. CML (basis of advanced glycation end products) accelerates diabetic vascular calcification. This study aims to investigate the association between plasma periostin levels, plasma CML levels and coronary artery calcification (CAC) score (Agatston score), and the effects of periostin on vascular smooth muscle cell (VSMC) osteogenic differentiation.
Materials and methods: We recruited 147 patients with type 2 diabetes and suspected angina pectoris. Subjects were divided into 3 groups based on Agatston score: score = 0 (n = 51), score = 1-300 (n = 39), score > 300 (n = 57). PLasma periostin and CML levels were measured using ELISA. Male Wistar rats received a high fat diet for 8 weeks followed by a single dose of streptozotocin to induce diabetes mellitus (DM). Calcification was induced with vitamin D3 and nicotine (VDN). VSMC calcification was induced with β-glycerophosphate (β-GP).
Results: Patients with CAC (Agatston score > 0) exhibited significantly higher plasma periostin and higher CML levels than those of control patients (Agatston score = 0). Cardiovascular risk factors, including older age, male sex, lower creatinine clearance, and hypertension were more prevalent in patients with CAC. High plasma periostin levels were associated with high CML levels. However, multivariate logistic analysis showed that high periostin and CML levels could not predict the occurrence of CAC. In vivo, the DM, VDN, and DM+VDN groups presented significant increases in periostin expression compared with normal control group. In vitro, periostin elevated VSMC osteogenic differentiation marker (RUNX2 and BMP2) protein levels in a dose-dependent manner and that maximal stimulation was attained at 24 hour. Furthermore, CML treatment enhanced periostin mRNA and protein levels in VSMCs.
Conclusion: CAC is an important determinant of dysregulated plasma periostin and CML levels, and periostin is involved in CML accelerating diabetic vascular calcification.

Clinical Trial Registration Number: 2019ZDSYLL066-P01
Supported by: National Nature Science Foundation of China (No. 81770451)
Disclosure: Y. Zhu: None.
902
Dietary advanced glycation endproducts in the mechanisms linking proteins glycosylation pattern, microbiota, and metabolic inflammation
R. Mastrocola1, D. Collotta2, F. Manig3, R. Verta2, M. Le Berre4, F. Fava5, G. Gaudioso5, M. Aragno1, F. Chiazza2, M. Hellwig3, J.Q. Gerlach4, K.M. Tuohy5, L. Joshi4, T. Henle3, M. Collino2;
1Dept. of Clinical & Biological Sciences, University of Turin, Turin, Italy, 2Dept. of Drug Science and Technology, University of Turin, Turin, Italy, 3Technische Universität Dresden, Dresden, Germany, 4National Centre for Biomedical Engineering Science National University of Ireland, Galway, Ireland, 5Dept. of Food Quality and Nutrition, Research and Innovation Centre, Fondazione Edmund Mach, San Michele all'Adige, Italy.
Background and aims: Modern diets are largely heat-processed and thus contain high levels of advanced glycation end products (AGEs), highly reactive compounds suggested to contribute to obesity, diabetes, and cardiometabolic diseases, whose pathogenic mechanism has not yet been clearly elucidated. We here explored the impact of an AGE-enriched diet on plasma proteins glycosylation pattern and on gut microbiota composition in relation to systemic and target organs metabolic and inflammatory parameters.
Materials and methods: C57BL/6 mice were allocated into control diet (CD, n=15) and AGE-enriched diet (AGE-D n=20) for 22 weeks. AGE-D was prepared replacing casein by MG-H1 (methylglyoxal 5-hydro-5-methylimidazolone)-modified casein. Plasma hormones and inflammatory profile were measured by Bio-Plex Multiplex Immunoassay System. Immunohistochemistry and western blotting analysis were used to assess AGEs accumulation in the ileum tract of intestine and in submandibular salivary glands and insulin signaling activation in the skeletal muscle. Proteins glycosylation profile was analysed in peripheral blood through lectin microarray. Faeces were collected for DNA extraction and 16SrRNA analysis through Illumina MiSeq using V3-V4 targeted primers.
Results: AGE-D chronic administration evoked increased insulin plasma levels (P<0.05) and altered glucose tolerance (AUC, P<0.05), paralleled by impaired insulin signaling transduction in the skeletal muscle, without affecting fasting plasma glucose and lipid profile. AGE-D caused a significant reduction in plasma levels of GIP and GLP-1 (P<0.05), two components of the incretin system, and of ghrelin (P<0.05). Interestingly, AGE-D was able to deeply modify the plasma glycosylation pattern and to induce accumulation of AGEs and increased levels of the AGE receptor RAGE in ileum and submandibular gland. AGE-D led to increased systemic inflammatory markers (IL-1β, P<0.01; INF-γ and IL-17, P<0.05), increased levels of plasminogen activator inhibitor-1 (P<0.01), a marker of vascular complications, and a decrease in the intestinal alkaline phosphatase activity (P<0.01), index of impaired gut microbial homeostasis and inflammation. Indeed, microbiota populations were altered by the AGE-D, with markedly reduced Bacteroidetes/Firmicutes ratio (P<0.05). A significant correlation was established between the modifications in bacteria families/genera and the levels of incretins and inflammatory markers.
Conclusion: Our data indicates that chronic exposure to dietary AGEs evoked a significant unbalance in the incretins axis and a robust increase in markers of metabolic inflammation. Notably, these effects were associated to modifications in the plasma proteins glycosylation pattern and a reshape of the intestinal microbiota, suggesting new pathological mechanisms underlying AGEs-induced metabolic derangements in obesity and diabetes, cardiometabolic diseases.
Supported by: COFUND-ERA-HDHL ERANET Project n. 25/1.09.2017
Disclosure: R. Mastrocola: None.
903
Relation between skin AGEs and the coronary artery calcium score: results of the PRECISED study
A. Planas1, O. Simó-Servat1, J. Bañeras2, C. Hernández1, I. Ferreira2, R. Simó1;
1Diabetes and Metabolism Research Unit, Vall d'Hebron Research Institute, Barcelona, 2Cardiology Research Group, Vall d'Hebron Research Institute, Barcelona, Spain.
Background and aims: Coronary artery disease (CAD) is a leading cause of mortality in subjects with type 2 diabetes (T2D). However, the increase in CAD risk is not homogeneous in patients with diabetes. In fact, a significant number of these patients will never experience cardiovascular complications. Therefore, the early identification of diabetic patients at risk of developing CAD remains a challenge. At present, the coronary artery calcium score (CACs) is considered the most sensitive risk stratification tool among asymptomatic persons with diabetes. Nevertheless, widespread screening for silent CAD using CACs in patients with diabetes cannot be recommended at this time and, consequently, the identification of a more targeted population in which the CACs would be more cost-efficient seems warranted. The accumulation of advanced glycation end products (AGEs) plays an important role in the pathogenesis and progression of cardiovascular disease in patients with diabetes. In recent years a simple and non-invasive method for AGEs assessment through skin autofluorescence (SAF) has been developed and clinically validated. The aim of this study is to evaluate whether there is a relationship between SAF values and CACs and, therefore, the assessment of SAF could be a useful tool to identify those subjects in whom CACs could be more cost-efficient.
Materials and methods: This was a prospective case-control study, comprising a total of 157 subjects with T2D with no history of clinical cardiovascular disease, and 51 non-diabetic subjects matched by age and sex (PRECISED study). We collected epidemiological data, T2D features, co-morbidity, laboratory tests, fundus eye examination and assessment of SAF by the device AGE Reader (DiagnOptics Technologies). The CT-scan was performed with Siemens Biograph mCT 64s equipment. The CACs was analyzed using semi-automatic methodology with “Syngo.Via” cardiac CT software. A value of CACs≥400 Agatston Units (AU) was considered as “high cardiovascular risk”.
Results: T2D patients had higher value of SAF (arbitray units) compared to controls (2.70±0.66 vs. 2.41±0.60; p=0.0055). Regarding subjects with diabetes, 122 presented CACs<400 and 35 CACs≥400 AU. A significant difference regarding gender, age, waist perimeter, the presence of diabetic retinopathy and serum levels of HDL cholesterol and homocysteine was observed between patients with CAC≥400 AU vs. patients with CACs<400. SAF values were significantly higher among the group with CACs≥400AU compared to patients with CACs<400 (2.96±0.86 VS. 2.59±0.57; p=0.0035). The logistic regression analysis showed that age, cholesterol HDL and SAF values were independently related to CACs≥400UA.
Conclusion: The SAF value is independently related to high CACs values in subjects with T2D. This finding suggests that SAF could be useful in selecting T2D patients in whom the screening for CAD by means of CACs assessment would be more cost-effective.
Clinical Trial Registration Number: NCT02248311
Supported by: ISCIII (PIE 2013/27)
Disclosure: A. Planas: None.
904
Association of advanced glycation end-products with cardiovascular risk parameters in type 1 diabetes individuals with diabetic nephropathy
K. Adeshara1,2, D. Gordin1,3, A. Antikainen1,2, M. Lehto1,2, C. Forsblom1,3, P.-H. Groop2,3;
1FinnDiane, Folkhälsan Research Center, Helsinki, 2Research Program for Clinical and Molecular Metabolism, Helsinki, 3Abdominal Center of Nephrology, Helsinki, Finland.
Background and aims: Non-enzymatic reactions between glucose and proteins, lipids or nucleic acids lead to formation of advanced glycation end-products (AGEs) considered to reflect glycaemic memory. Poor glycaemic control increases AGE abundance and is associated with micro- or macrovascular complications and contribute to premature morbidity and mortality. Our objective was to study the relationship between different AGEs and risk parameters of CVD in individuals with type 1 diabetes (T1D) with or without diabetic nephropathy (DN) and non-diabetic control subjects (ND).
Materials and methods: A total of 586 individuals from the Finnish Diabetic Nephropathy (FinnDiane) Study were divided into four groups: 1) ND (n=128); 2) T1D (n=336); 3) T1D with DN (n=122); and 4) T1D with end-stage renal disease (ESRD) (n=43). Normal albumin excretion rate (AER) (<30 mg/24h) and eGFR >90mL/min/1.73 m2 was considered as T1D without DN, while AER between 30-300 mg/24h was required for a diagnosis of DN. Of note, the ESRD group was also included in the T1D with DN group. Different glycation and oxidative biomarkers including early end products such as fructosamine (FA), late or advanced stage AGEs, and methylglyoxal-modified hydro-imidazolone (MG-H1) were measured. CVD risk parameters were carotid intima-media thickness (CIMT) assessed by ultrasound and pulse wave velocity (brachial and central PWV), central systolic blood pressure (CSBP),central mean arterial pressure (CMAP), central pulse pressure (CPP), central heart rate corrected augmentation index (CAIx) and subendocardial viability ratio (SEVR) assessed by applanation tonometry. Associations between different glycation/oxidative biomarkers and CVD risk parameters were assessed separately for each group by correlation analyses and linear regression adjusted for age and sex.
Results: FA and AGEs were significantly elevated in T1D with DN compared to T1D without DN and to ND. A similar finding was observed in a sub-analysis of T1D with ESRD compared to T1D without DN as well as ND. MG-H1 was significantly increased in T1D compared to ND, however no difference was observed between T1D groups with and without DN. FA was associated with brachial PWV (p=0.003), CAIx (p=0.02),CSBP (p=0.0001), CMAP (p=0.001),CPP (p=0.0001) and SEVR (p=0.03), but not with CIMT in those with T1D and DN. AGEs were associated with brachial PWV (p=0.05), central PWV (p=0.01), CIMT (P=0.003) and MG-H1 with CPWV (p=0.04) in those with T1D and DN. In the ESRD group, FA significantly correlated with CSBP (p=0.01), and CPP (0.03). All associations with FA and MG-H1 were independent of age and sex. eGFR correlated negatively with CVD risk parameters, FA and AGEs in T1D with DN.
Conclusion: Overall, FA and AGEs are increased in individuals with T1D and DN. These findings combined with the association between these markers and CVD risk parameters suggest that glycation end products are involved in the pathogenesis of target organ damage in T1D.
Disclosure: K. Adeshara: None.
905
Change in extent of coronary artery disease in people with and without diabetes undergoing coronary angiography
K.V. Kiburg1,2, A.I. MacIsaac3,2, V. Sundararajan2,4, R.J. MacIsaac1,2;
1Department of Endocrinology and Diabetes, St Vincents Hospital Melbourne, Melbourne, 2Department of Medicine, University of Melbourne, Melbourne, 3Department of Cardiology, St Vincents Hospital Melbourne, Melbourne, 4Department of Public Health, La Trobe University, Melbourne, Australia.
Background and aims: To assess whether improvements in preventative care for people with diabetes have resulted in a relative decrease in the burden of coronary artery disease (CAD) compared to people without diabetes.
Materials and methods: All patient-level linked coronary angiography and hospital separation data at a large Australian tertiary referral hospital between 2013 and 2019 were obtained. Indication for angiography and extent of CAD were based on original classification by treating cardiologists, classified as no disease, mild, moderate or severe. Propensity scores were estimated to match people with and without diabetes on a 1:1 ratio. Ordinal logistic regression models were fitted to assess trends in CAD severity in people with and without diabetes over time with adjusted odds ratios (adjOR) reported.
Results: For 3,016 people identified in the coronary angiography database and matched using propensity scores, 1508(50%) were diagnosed with diabetes. Angiographic evidence of CAD was detected in 1155(77%) and 1257(83%) people without and with diabetes. For people with diabetes there was an increased risk of more extensive CAD in 2018 compared to 2013 (adjOR: 2.02 95% C.I. 1.36, 2.99). This risk appears to have been attenuated in 2019 with no significant change in CAD burden between 2013 and 2019 (adjOR: 1.33 95% C.I. 0.90, 1.98). In contrast, there was no e!ect of time on CAD burden in people without diabetes.
Conclusion: The initial increase in severity of disease burden seen in our study for people with diabetes compared to those without diabetes may represent improved CAD screening rather than suboptimal application of preventative therapies. Possibly, greater recent use of newer glucose lowering medications with cardiovascular protective e!ects accounts for the attenuation of CAD burden in 2019 for people with diabetes. These findings highlight the importance of aggressive risk factor modification for people with diabetes to minimise the development and progression of CAD.
Supported by: KVK is supported by an Australian Government Research Training Program Scholarship
Disclosure: K.V. Kiburg: Grants; K Kiburg is a recipient of an Australian Government Research Training Program Scholarship.
PS 88 Cardiac complications: of mice, rats and cells
906
Metformin inhibits proliferation of fibro-adipogenic progenitors residing in the human heart
A. Møller1, A.H. Larsen2, L. Lin3, J. Farup4, L.P. Tolbod5, T. Billeskov1, J.B. Jensen1, E.I. Sundelin6, S. Jakobsen5, S.B. Pedersen1, F.V. DePaoli7, Y. Luo3, J. Frøkiær5, H. Wigger2, N. Jessen1;
1Institute of Clinical Medicine, Steno Diabetes Center Aarhus, Aarhus N, 2Department of Cardiology, Aarhus University Hospital, Aarhus N, 3Department for Biomedicine, Aarhus University, Aarhus C, 4Deparment for Biomedicine, Aarhus University, Aarhus C, 5Department of Nuclear Medicine and PET Centre, Aarhus University Hospital, Aarhus N, 6Diabetes and Hormonal Diseases, Aarhus University Hospital, Aarhus N, 7Department of Cardiothoracic and Vascular Surgery, Aarhus University Hospital, Aarhus N, Denmark.
Background and aims: Recent studies suggest that the anti-diabetic drug metformin may also have beneficial effects in heart failure. The aim of this study was to investigate potential mechanisms linking metformin exposure to cardio-protection.
Materials and methods: Metformin uptake in the failing human heart was investigated by PET scanning techniques. The cellular composition of human hearts was mapped by single cell gene expression profiling of monunuclear cells isolated from explanted human heart from heart transplantaiton recipients. The effect of metformin (0.1 mM) on proliferation of cardiac fibro-adipogenic progenitors isolated from human hearts was investigated in vitro.
Results: Using PET scanning techniques, we demonstrate that metformin uptake is confined to less viable and fibrotic areas of the failing human heart. As no uptake of metformin is detected in healthy human hearts, this could imply that metformin targets non-muscle cells residing in the myocardium. Therefore, we mapped the cellular composition of the left ventricle of failing human hearts by single cell gene expression profiling. This allowed us to identify a population of residing fibro-adipogenic progenitor cells (FAPs). Finally, we demonstrate that metformin in pharmacological doses (0.1 mM) inhibits proliferation of cardiac FAPs in vitro.
Conclusion: These data indicate that metformin targets residing cardiac FAPs and inhibits their proliferation, which ultimately may lead to less accumulation of fibrosis and remodelling of the failing human heart.
Clinical Trial Registration Number: NCT03122769
Supported by: Danish Medical Research Council, Danish Diabetes Academy, the Danish Diabetes Association.
Disclosure: A. Møller: None.
907
Effects of palmitate and oleate on apoptosis, autophagy and enzymes of fatty acid metabolism in human cardiac progenitor cells from control and diabetic subjects
R. Schipani, R. D'Oria, C. Caccioppoli, A. Leonardini, A. Natalicchio, S. Perrini, A. Cignarelli, L. Laviola, F. Giorgino;
University of Bari Aldo Moro, Bari, Italy.
Background and aims: Elevated circulating levels of palmitate are associated with high cardiovascular risk in diabetes. In contrast, oleate prevents palmitate-induced cytotoxic stress in multiple cell types. The viability of cardiac progenitor cells (CPC) is essential for tissue renewal in the heart. In this study, the ability of palmitate and oleate to induce apoptosis, autophagy and stress kinase phosphorylation, as well as the effects on enzymes involved in fatty acid metabolism, were investigated in human CPC isolated from control subjects and type 2 diabetic patients.
Materials and methods: Human CPC were obtained from control subjects and type 2 diabetic patients undergoing cardiac surgery for coronary artery bypass grafting and/or valve surgery. Human CPC were exposed to 0.25 mM palmitate and/or 0.1 mM oleate for 16 h. Apoptosis was assessed by caspase-3 cleavage and ELISA assay for cytoplasmic oligonucleosomes. Autophagy was evidenced by light chain 3 (LC3)-II immunoblotting. JNK and p38 MAPK signaling pathways were studied by immunoblotting. The expression of carnitine palmitoyltransferase-1B (CPT1B), one of the enzymes of mitochondrial fatty acid oxidation, and of diacylglycerol acyltransferase 2 (DGAT2), involved in triglyceride synthesis, were studied by quantitative RT-PCR.
Results: Palmitate, but not oleate, induced apoptosis in both control and diabetic CPC (p<0.05). Exposure of control and diabetic CPC to 0.25 mM palmitate for 16 h also resulted in increased autophagy (p<0.05). In contrast, oleate did not induce autophagy. Palmitate, but not oleate, also induced p38 MAPK and c-Jun phosphorylation (p<0.05) in both control and diabetic CPC. Importantly, palmitate effects on apoptosis and autophagy, as well as on stress kinase activation, were fully prevented by co-treatment with 0.1 mM oleate for 16 h (p<0.05) both in control and diabetic CPC. However, palmitate, alone or with oleate, was able to increase the mRNA levels of CPT1B (p<0.05) in control CPC but not in diabetic CPC. Moreover, the mRNA levels of DGAT2 were markedly decreased after exposure to palmitate in both control and diabetic CPC (p<0.05), and this was prevented by co-administration of oleate only in control CPC (p<0.05).
Conclusion: Oleate shows the ability to prevent palmitate-induced apoptosis, autophagy and p38 MAPK and JNK signaling in CPC from control subjects and diabetic patients. Hence, oleate supplementation might preserve the viability of cardiac progenitors from the lipotoxic damage in both control and diabetic subjects. However, specific effects of palmitate and oleate on enzymes involved in fatty acid metabolism are seen only in control CPC. Thus, diabetic CPC show selective impairment in metabolic signaling that can impair cellular recovery in response to lipotoxic damage.
Disclosure: R. Schipani: None.
908
The secretome of visceral adipose cells induces apoptosis of cardiac progenitor cells in human obesity: protective effects of the SGLT2 inhibitor dapagliflozin
S. Porro1, S. Perrini1, C. Caccioppoli1, R. D'Oria1, D. Paparella1,2, A. Braun2, V.A. Genchi1, R. Schipani1, G. Palma1, A. Cignarelli1, A. Natalicchio1, L. Laviola1, F. Giorgino1;
1University of Bari Aldo Moro, Bari, 2General and Cardiac Surgery, Santa Maria Hospital, Bari, Italy.
Background and aims: Expansion of abdominal visceral (AV) and epicardial (E) adipose tissue is associated with cardiovascular risk in subjects with the metabolic syndrome. The viability of cardiac progenitor cells (CPC) is essential for myocardial tissue function and physiological turnover. SGLT-2 inhibitors possess cardiovascular benefits beyond their anti-hyperglycemic effects, however the underlying mechanisms are not fully understood. This study aimed to assess whether the secretome from AV and E adipose stem cells (ASC), ASC-derived mature adipocytes, and isolated AV mature adipocytes may affect the viability and insulin responsiveness of CPC in human obesity, and whether dapagliflozin (DAPA) may reduce proapoptotics effects in injured CPC.
Materials and methods: ASC were isolated from AV and E adipose tissue biopsies of non-diabetic subjects with varying levels of BMI and used before and after differentiation into adipocytes in vitro. CPC were isolated from right auricle biopsies of healthy non-obese (Ob) subjects, preincubated in the presence or absence of 10 μM DAPA for 24 h, and exposed or not to conditioned media (CM) of AV-ASC, E-ASC, AV-ASC-derived adipocytes and isolated AV mature adipocytes. Induction of apoptosis was assessed by caspase-3 cleavage and ELISA assay for cytoplasmic oligonucleosomes, and insulin signaling by immunoblotting analysis of Akt phosphorylation.
Results: The CM of AV-ASC and differentiated adipocytes from Ob subjects induced CPC apoptosis after 4-8-24 h (p<0.05 vs. control CPC). In addition, exposure of CPC to CM of Ob AV-ASC and mature adipocytes resulted in marked inhibition of insulin-stimulated Akt phosphorylation (Akt-Ph) (p<0.05 vs. control CPC). In contrast, the CM of AV-ASC and differentiated adipocytes from non-Ob subjects did not induce apoptosis nor impaired insulin signaling. Similarly, the CM of AV mature adipocytes isolated from Ob subjects induced a marked apoptosis of CPC (p<0.05 vs. control CPC) and inhibited insulin-stimulated Akt-Ph, whereas no effects were observed when CPC were exposed to CM of mature adipocytes isolated from non-Ob subjects. Of note, the CM of E-ASC isolated from Ob subjects also induced CPC apoptosis and impaired insulin-stimulated Akt-Ph (p<0.05 vs. control CPC), while these effects were not observed when CPC were exposed to CM of E-ASC from non-Ob subjects. The proapoptotic effects of the CM in the CPC were inhibited when these cells were pretreated with DAPA (p<0.05).
Conclusion: The secretome of ASC and adipocytes from AV and E adipose tissue of obese subjects has the capacity to impair insulin action and promote apoptosis in human CPC, potentially leading to myocardial dysfunction. These effects can be counteracted by the SGLT2 inhibitor DAPA directly acting on the CPC.
Disclosure: S. Porro: None.
909
Transcription factor Tcf21 regulates fibrosis in ischaemic or hyperglycaemic state
Y. Baba1,2, Y. Mawezawa2, T. Minamizuka2, N. Kondo3, M. Koshizaka2, Y. Kobayashi3, K. Yokote2;
1Kimitsu Chuo Hospital, Chiba, 2Endocrinology, Hematology and Gerontology, Chiba University Graduate School of Medicine, Chiba, 3Cardiovascular Medicine, Chiba University Graduate School of Medicine, Chiba, Japan.
Background and aims: Cardiac fibrosis after ischemic heart desease or in diabetic cardiomyopathy is critical for maintaining cardiac functions. Tcf21 is a bHLH transcription factor that is expressed in epicardium and cardiac fibroblasts. Tcf21 knockout mice die immediately after birth because of cardiac malformation. On the other hand, little is known about its function in the adult heart. Therefore, we aimed to elucidate the role of Tcf21 after cardiac injury.
Materials and methods: Tcf21 was deleted after birth using inducible Cre-LoxP system to circumvent the lethality (iTcf21 KO). Isoproterenol (ISO) was injected (200 mg/kg) at eight weeks of age. Mice were sacrificed seven days and four weeks after ISO injection, and histological phenotypes were evaluated. Besides, cardiac fibroblasts were isolated from Tcf21 knockout embryos and subjected to RNA-seq analysis. Fibroblasts proliferation capacity was also assessed by BrdU uptake . Finally, Tcf21 expression in streptozotocin- (STZ-) induced diabetic state was evaluated.
Results: At day 7, 1.98±0.40% of the total cardiac area showed fibrosis in control mice, however, the fibrosis area was smaller in iTcf21 KO mice (0.67±0.14%, P < 0.001). Cardiac ultrasound revealed fractional shortening was maintained in iTcf21 KO mice compared to control. Immunostaining demonstrated Ki67-positive cells decreased in iTcf21 KO (57.1% compared to controls, P = 0.032). Isolated cardiac fibroblasts from Tcf21 KO showed lower BrdU uptake (76.0±3.3% for controls and 47.8±7.4% for Tcf21 KO, respectively, P = 0.002) and decreased phosphorylation of Erk. RNA-seq analysis revealed potential downstream targets for Tcf21 including IL33 and type 1 collagen. Gene Ontology analysis demonstrated involvements of Tcf21 in the extracellular matrix, cell adhesion, and angiogenesis. STZ induced hyperglycemic state did not evoke significant fibrosis but upregulate Tcf21 expression compared with control.
Conclusion: These findings suggest lack of Tcf21 suppresses fibrosis after cardiac injury. Tcf21 and its downstream targets would be a potential novel therapeutic target for cardiac diseases.
Supported by: JSPS KAKENHI
Disclosure: Y. Baba: None.
910
Chronic treatment with the AMP kinase activator PXL770 improves cardiac and renal function in diabetes related cardiorenal syndrome
Y. Stephan1, M. Soulié1, L. Nicol1, P. Gluais-Dagorn2, S. Hallakou-Bozec2, V. Richard1, P. Mulder1;
1Rouen University, Inserm U1096, Rouen, 2Poxel SA, Lyon, France.
Background and aims: In experimental animal models of diabetes, the direct adenosine monophosphate activated protein kinase (AMPK) activator PXL770 reduces glycaemia and plasma lipids, but whether these benefits are associated with an improvement in diabetes-related cardiac and renal dysfunction is unknown.
Materials and methods: We assessed, in ZSF-1 rats, a model of cardio-renal syndrome, the effects of a long-term (90 days) treatment with PXL770 (150 mg/kg twice a day initiated at the age of 12 weeks) on left ventricular (LV) function and hemodynamics (echocardiography and catheterization), LV tissue perfusion (MRI) and renal function (transcutaneous glomerular filtration rate, GFR).
Results: Compared to healthy lean rats, untreated ZSF1 rats had normal cardiac output (CO) and LV End-Systolic Pressure-Volume Relation (LVESPVR), while LV End-Systolic Pressure (ESP) was slightly increased. However LV End-Diastolic Pressure (EDP) and LV End-Diastolic Pressure Volume Relation (EDPVR) were significantly increased, illustrating LV diastolic dysfunction. Myocardial tissue perfusion was significantly reduced and kidney function impaired, as shown by a reduction in GFR and kidney weight. A 90-day oral treatment with PXL770 increased CO, LV ESPVR, LV tissue perfusion and GFR, while LV EDP and renal weight were reduced.
Conclusion: In ZSF1 rats, a model of metabolic syndrome-related cardio-renal syndrome, long-term treatment with the direct AMPK activator PXL770 improves both LV diastolic and renal dysfunction. These beneficial effects appear promising for the treatment of cardio-renal syndrome. PXL770 is currently in clinical development for NASH and future assessment of potential benefits for patients suffering from diabetic cardiomyopathy and/or nephropathy will be considered.

Disclosure: Y. Stephan: None.
911
GIP suppresses diabetic cardiomyopathy via attenuation of hyperglycaemia-induced oxidative stress generation
M. Hiromura1, Y. Mori1, H. Kushima1, T. Saito1, N. Osaka1, M. Terasaki1, H. Yashima1, M. Ohara1, T. Fukui1, T. Hirano2, S.-I. Yamagishi1;
1Showa University School of Medicine, Tokyo, 2Ebina General Hospital, Kanagawa, Japan.
Background and aims: Diabetic cardiomyopathy (DCM) is associated with increased risk for morbidity and mortality of heart failure in diabetic patients. However, effective therapy for DCM is still limited. We have previously shown that glucose-dependent insulinotropic polypeptide (GIP) receptor is expressed in mouse cardiomyocytes and that GIP suppresses angiotensin II-induced cardiac hypertrophy in mice, whose pathological characteristics are similar to that of DCM. In this study, we investigated the effects of GIP on DCM in a mouse model of diabetes with obesity.
Materials and methods: Male db/db mice at 6 weeks of age were assigned into vehicle (DM-vehicle, n = 6) or active GIP at 50 nmol/kg/day (DM-GIP, n = 6) treatment group. Food-restricted db/db mice were used as lean non-diabetic controls (Non-DM, n = 6). GIP was continuously infused to mice via subcutaneously implanted pumps. After 6 weeks, the hearts were collected for histological and RT-PCR analyses. Cultured mouse cardiomyocytes were pre-treated with vehicle or degradation-resistant [D-Ala2] GIP at 300 nM, and then incubated with high glucose (30mM) for 24 hours in the presence or absence of additional 24 hour-treatment with advanced glycation end products (AGEs, 100 μg/ml). Gene expression was determined by RT-PCR analysis, and oxidative stress generation was assessed by an assay using luciferin and NADPH.
Results: In the end of the experiments, DM-vehicle group showed severe hyperglycemia and obesity as compared with Non-DM group (HbA1c: 11.7 ± 0.3% vs. < 4.0%, body weight: 41.3 ± 1.9 g vs. 25.7 ± 0.4 g), whereas metabolic parameters were comparable between the two DM groups, except for plasma GIP levels (6.8 ± 4.6 pg/ml vs. 1.5 ± 1.5 pg/ml). DM-vehicle group showed significantly higher left ventricular wall thickness, papillary cardiomyocyte size, and interstitial fibrosis area compared with Non-DM group, all of which were significantly attenuated by GIP. Furthermore, as compared with vehicle, GIP decreased cardiac gene expression levels of myosin heavy chain β (beta-Mhc), a marker of cardiomyocyte hypertrophy, associated with the decrease in gene expression levels of transforming growth factor (Tgf) beta 2, a master gene of cardiac fibrosis (r = 0.768, p < 0.01). In cultured mouse cardiomyocyte, high glucose significantly up-regulated gene expression levels of beta-Mhc and Tgf-beta 2 in association with the increased activity of NADPH oxidase, all of which were suppressed by [D-Ala2] GIP. Furthermore, [D-Ala2] GIP decreased gene expression of receptor for AGEs in cardiomyoocytes exposed to high glucose, and resultantly suppressed the AGEs-induced beta-Mhc gene expression.
Conclusion: Our present study suggests that GIP might suppress cardiac hypertrophy and fibrosis in diabetic db/db mice partly via the suppression of hyperglycemia-induced oxidative stress generation in cardiomyocytes.
Disclosure: M. Hiromura: None.
912
Cardiomyocyte-specific overexpression of VEGFB isoforms is linked to an expanded coronary vasculature that amplifies the cardiovascular action of insulin
R. Shang, B. Hussein, B. Rodrigues;
Pharmaceutical Sciences, University of British Columbia, Vancouver, Canada.
Background and aims: Changes in cardiac metabolism (reduced glucose and greater fatty acid (FA) utilization) is a major contributor towards diabetic cardiomyopathy. Vascular endothelial growth factor B (VEGFB) can regulate coronary angiogenesis and influence energy metabolism. We tested the mechanism by which cardiac-specific overexpression of human VEGFB isoforms (VEGFB186 and VEGFB167) expands the coronary vasculature and decreases FA utilization and whether these effects can overcome the detrimental consequences of diabetes.
Materials and methods: VEGFB transgenic (Tg) rats, with cardiomyocyte-specific promoter α-myosin heavy chain overexpression of human VEGFB were generated. We compared the ventricle transcriptome of WT and Tg animals using RNA-seq. Isolated heart and cardiomyocytes were used to determine VEGFB isoform expression and secretion patterns. Fast-acting insulin was used to determine cardiac insulin sensitivity. Continuous retrograde perfusion of whole hearts with heparin was used to displace and measure coronary lipoprotein-lipase activity. Untargeted metabolomic analysis was performed for measurement of cardiac lipid metabolites. Cardiac insulin sensitivity was also evaluated in WT and Tg acute and chronic STZ-diabetic animals.
Results: Confirming previous reports, VEGFB overexpression induced an angiogenic response. Even though VEGFB186 displayed a higher intracellular content but slower secretion pattern than VEGFB167, the latter exhibited a cellular location that allowed it to be readily releasable. Working in tandem, these two isoforms provide a rapid cellular defence against various insults that instigate cell death in addition to promoting coronary angiogenesis. This resulted in greater delivery of insulin, amplifying its action in the Tg heart. At a cellular level, other mechanisms contributing towards enhancing insulin sensitivity included less delivery of lipoprotein lipase-derived FA, reduced accumulation of diacylglycerols and lysophosphatidylcholine and lower FA metabolism. The augmented effects on insulin action were preserved following diabetes.
Conclusion: In VEGFB Tg rats, the distinct isoform protein expression and secretion patterns likely account for the expanded coronary vasculature. This can aid in providing the heart the necessary O2 to metabolize FA, improve insulin delivery, produce physiological cardiac hypertrophy and promote cell survival. Our data suggest that using VEGFB as a cardioprotective therapy against diabetic cardiomyopathy may be an intriguing and previously unappreciated approach.
Supported by: CIHR
Disclosure: R. Shang: Grants; CIHR.
913
Treatment with the SGLT2 inhibitor empagliflozin improves cardiac function in rats with chronic heart failure
M. Soulié1, Y. Stephan1, L. Nicol1, J.-P. Henry1, V. Richard1, M.P. Pieper2, P. Mulder1;
1INSERM U1096, Rouen, France, 2Boehringer Ingelheim Pharma GmbH & Co. KG., Biberach, Germany.
Background and aims: The SGLT-2 inhibitor empagliflozin (EMPA) reduces mortality and hospitalization for heart failure (HF), but whether EMPA reduces HF related systolic/diastolic dysfunction is presently under clinical investigation. Thus, we investigated, using a rat model of HF, whether EMPA exhibits protective effect in CHF.
Materials and methods: Rats with CHF were treated with EMPA (30 mg/kg PO for 7 days starting 83 days after coronary artery ligation or 90 days starting 7 days after coronary artery ligation) to assess effects on left ventricular (LV) function and hemodynamics (echocardiography, LV catheterization).
Results: After 90 days untreated CHF rats presented LV systolic and diastolic dysfunction, illustrated by the decreases in LV end-systolic pressure (LV ESP) and in LV end-systolic pressure volume-relation (LV ESPVR) as well as the increases in LV end-diastolic pressure (LV EDP) and LV end-diastolic pressure volume-relation (LV EDPVR), while both myocardial tissue perfusion and exercise capacity were reduced. Seven- and ninety-day EMPA treatment improved systolic and diastolic LV function, illustrated by the increases in LV ESP and in LV ESPVR as well as the reductions in LV EDP and in LV EDPVR. Long-term EMPA increased myocardial perfusion and exercise capacity (p=0.06).
Conclusion: In rats with CHF, short- and long-term administration of the SGLT2 inhibitor EMPA improves LV systolic and diastolic dysfunctions and exercise capacity. Pharmacological therapy of diastolic dysfunction and HF is an unmet need, our results provide further evidence for new translational studies ongoing / completed and might also contribute to the understanding of the EMPA‐REG OUTCOME trial.

Disclosure: M. Soulié: Employment/Consultancy; Boehringer Ingelheim Pharma.
PS 89 Atherosclerotic complications: stemming from cells to the kidney
914
Conditioned medium from dental pulp stem cells directly activate endothelial cells to promote all process of angiogenesis
M. Kato1, S. Tsunekawa1, N. Nakamura2, E. Miura-Yura1, Y. Yamada1, Y. Hayashi1, Y. Morishita1, T. Himeno1, M. Kondo1, Y. Kato1, H. Kamiya1, K. Naruse2, J. Nakamura1;
1Division of Diabetes, Department of Internal Medicine, Diabetes Center, Aichi Medical University, Nagakute, Aichi, 2Department of Internal Medicine, School of Dentistry, Aichi Gakuin University, Nagoya, Aichi, Japan.
Background and aims: Regeneration medicine is expected as a new treatment for vascular diseases. Recently, transplantation of stem cells has been reported to promote therapeutic angiogenesis for ischemic disease in paracrine manner, but the precise mechanism is still obscure. In this study, we examined whether secreted factors from stem cells from human exfoliated deciduous teeth (SHED), which were thought to originate from the cranial neural crest, directly had beneficial effects on endothelial cells to promote angiogenesis.
Materials and methods: SHED-CM was collected 48 hours after culturing in serum-free DMEM, and was separated into two fractions according to molecular weight (less than 6 kDa and more than 6 kDa). Exosomes were isolated from SHED-CM by ultracentrifugation. Human umbilical-vein endothelial cells (HUVECs) were cultured with six different media (DMEM, DMEM with VEGF, SHED-CM, less than 6 kDa, more than 6 kDa or DMEM with exosomes) for 12-48 hours, then MTT assay, wound healing assay, Boyden chamber assay and tube formation assay were performed to evaluate the cell viability, migration ability and tube formation ability in HUVECs. Rat aortic ring assay and mouse Matrigel plug assay were performed to assess neovascularization and endothelial cell migration.
Results: SHED-CM significantly increased cell viability and proliferation of HUVECs in MTT assay, and accelerated the migration of HUVECs in wound healing assay and Boyden chamber assay. In Matrigel plug assay of mice, the migrated number of primary endothelial cells was markedly increased in the plug containing SHED-CM or SHED suspension. SHED-CM formed complex tubular structures of HUVECs, and significantly increased the total tube length and the number of joints in tube formation assay. Furthermore, SHED-CM significantly increased neovascularization from primary rat aorta, indicating that SHED-CM stimulated the endothelial cells to promote comprehensive angiogenesis process (the total neovessel lengths in response to DMEM, 0.5 nmol/L VEGF and SHED-CM were 11.9 ± 4.8, 32.5 ± 11.8 and 40.1 ± 15.7 pixels/field, respectively). The angiogenic effects of SHED-CM were same as or more than the effective concentration of VEGF.
Conclusion: SHED-CM could directly stimulate vascular endothelial cells to promote angiogenesis and is promising for future clinical application.
Supported by: MEXT
Disclosure: M. Kato: None.
915
Glucose-dependent insulinotropic polypeptide (GIP) inhibits macrophages foam cell formation via suppression of CD36 expression
H. Yashima1, M. Terasaki1, T. Saito1, Y. Mori1, M. Hiromura1, H. Kushima1, M. Koshibu1, N. Osaka1, M. Ohara1, T. Fukui1, Y. Seino2, Y. Yamada3, T. Hirano4, S.-I. Yamagishi1;
1Showa University, Tokyo, 2Kansai Electric Power Medical Research Institute, Kobe, 3Akita University Graduate School of Medicine, Akita, 4Ebina General Hospital, Kanagawa, Japan.
Background and aims: Glucose-dependent insulinotropic polypeptide (GIP), which is one of the incretins secreted from K-cells in the intestine, stimulates insulin secretion in a glucose-dependent manner. In addition to its glucose-lowering effect, GIP could play an atheroprotective role in animals. However, the effect of GIP on macrophage foam cell formation, an initial step of atherosclerosis remains unclear. In this study, we investigated whether and how GIP inhibits the macrophage foam cell formation.
Materials and methods: We investigated effect of GIP on foam cell formation and associated gene expression levels of macrophages derived from wild-type (C57/BL6J) mice, GIP receptor-knockout (Gipr−/−) mice, human cell line U937 and healthy humans. Nine-week-old male wild-type mice and Gipr−/− mice were continuously treated with/without subcutaneous infusion of (DAla2)GIP (25 nmol/kg/day) using an osmotic-pomp. Peritoneal macrophages were extracted from mice at 13 weeks of age just after intraperitoneal injection of thioglycollate both, and incubated with/without 1 nmol/L (DAla2)GIP for 18 hours. Foam cell formation was determined by an incorporation of [3H]-oleate-labelled oxidized-LDL into macrophages using thin-layer chromatography. CD36 quantitative RT-PCR analysis was performed using TaqMan-based probes. Human peripheral mononuclear cells were isolated from blood samples of healthy volunteers using anti-CD14 antibody-conjugated magnetic microbeads, and then incubated for 7 days to differentiate monocytes to macrophages. Human macrophages and U937 macrophages were incubated with or without 1 nmol/L (DAla2)GIP for 18 hours, then foam cell formation were measured by Dil-oxidized-LDL fluorescent intensity using immunohistochemistry. Quantitative RT-PCR analysis of CD36 and PPARγ related molecule were performed as described above.
Results: Continuous infusion of (DAla2)GIP significantly inhibited macrophage foam cell formation by 38% in wild-type mice, while it had no effect in Gipr−/− mice. Furthermore, (DAla2)GIP at 1 nmol/L also suppressed foam cell formation of macrophages derived from wild-type mice by 30%, but not those from Gipr−/− mice. Consistent with the findings in animals, (DAla2)GIP at 1 nmol/L attenuated foam cell formation of U937 macrophages and monocyte-derived macrophages isolated from healthy volunteers by 41% and by 38%, respectively. Continuous infusion of (DAla2)GIP reduced gene expression levels of CD36 in macrophages isolated from wild-type mice by 30%, but it did not affect CD36 gene expression in macrophages derived from Gipr−/− mice. (DAla2)GIP at 1 nmol/L inhibited CD36 gene expession in U937 macrophages and human monocyte-derived macrophages by 35% and 33%, respectively. Further, (DAla2)GIP at 1 nmol/L decreased gene expression levels of PPARγ-related molecule in U937 macrophages by 22%, indicating this molecule might lead to a downstream transcription reguater of GIP to reduce CD36 levels.
Conclusion: Our present findings suggest that GIP could suppress foam cell formation of macrophages through the suppression of CD36 via GIP receptor, thereby protecting against the development and progression of atherosclerosis.
Clinical Trial Registration Number: 956
Disclosure: H. Yashima: None.
916
Down-regulation of FUNDC1-mediated mitophagy aggravates AGEs-induced VSMCs calcification by triggering oxidative stress
X. Sun, N. Liu;
Department of Cardiology, Zhongda Hospital, School of Medicine, Southeast University, Nanjing, China.
Background and aims: FUNDC1 is a mitochondrial outer membrane protein that mediates mitophagy. Our previous studies found that advanced glycosylation end products (AGEs) can inhibit the expression of FUNDC1 in vascular smooth muscle cells (VSMCs) and affect mitophagy. Our research group has already confirmed that AGEs can accelerate vascular calcification, so the purpose of this experiment is to investigate whether FUNDC1-mediated mitophagy is involved in AGEs-induced vascular calcification.
Materials and methods: First, a cell model of AGEs-induced calcification of rat VSMCs was established, and then FUNDC1-mediated mitophagy was down-regulated through using molecular biology methods. Finally, the changes of calcification-related indicators and mitophagy-related indicators of VSMCs with or without down-regulation of FUNDC1 were detected, and Transmission Electron Microscope and Confocal Laser Scanning Microscope were used to observe mitochondrial morphology and mitophagy Level change. At the same time, we also tested the level of oxidative stress in the cells. In addition, we also carried out experiments at the animal level, that is, to establish aortic calcification models induced by high glucose in rats with or without FUNDC1 knockout, and then observe the degree of calcification of the thoracic aorta by Von kossa staining.
Results: Our experimental results show that down-regulating FUNDC1 reduces the binding of mitochondria and lysosomes, attenuates mitophagy levels, increases intracellular calcium content and oxidative stress level, and also aggravates calcification of VSMCs induced by AGEs. This result is consistent with the results obtained in animal experiments (Figure 1).
Conclusion: Both in vivo and in vitro experiments confirmed that FUNDC1-mediated mitophagy is involved in AGEs-induced VSMCs calcification, and down-regulates FUNDC1-mediated mitophagy aggravates oxidative stress and vascular calcification. It is well known that increased intracellular oxidative stress can also promote vascular calcification, Therefore, we believe that one of the mechanisms of FUNDC1-mediated mitophagy participating in AGEs-induced VSMCs calcification is to stimulate oxidative stress. The molecule that FUNDC1 acts on to trigger oxidative stress and the other molecular mechanisms of FUNDC1-mediated mitophagy involved in AGEs-induced VSMCs calcification needs to be further explored.

Disclosure: X. Sun: None.
917
Liraglutide prevents CD34+ stem cell dysfunction induced by high glucose concentrations
M. Vinci, V. Vigorelli, G. Pompilio, S. Genovese;
Centro Cardiologico Monzino, Milano, Italy.
Background and aims: Cardiovascular complications are the leading cause of morbidity and premature mortality in patients suffering from diabetes mellitus (DM). A large body of evidence suggests that bone marrow derived CD34+ stem/progenitor cells are involved in multiple organ homeostasis and repair. Dysfunction of these cells induced by DM suggests their pathogenic contribution to diabetic complications. Recently, liraglutide (LIRA), a GLP-1 receptor agonist (GLP-1RA) has shown pleiotropic cardiovascular benefit in Type 2 DM (T2DM) patients that appears to be beyond the effects on glycaemia. We hypothesize that the protective effects of LIRA can be also mediated by the functional improvement CD34+ stem/progenitor cell. The aim of this study was to test the effects of LIRA on CD34+ stem cell proliferation and migration (CXCR4/SDF1α axis), which is dramatically impaired by glucose exposure.
Materials and methods: CD34+ HSCs were magnetically sorted from cord blood (CB) of healthy subjects and expanded in normal-glucose (NG; with 30 mM mannitol) or high-glucose ± LIRA (HG; 30 mM) serum-free medium plus cytokines. Cells were counted after 10, 20 and 30 days. Cell migration was determined by the use of transwell culture inserts (5-μm pore membrane; Millipore) according to the manufacturer’s instruction. CD34+ cells were seeded onto the upper chamber and allowed to migrate toward the lower chamber containing +/- SDF-1 (50 ng/mL). GLP-1R gene expression was assessed by qPCR and cAMP by ELISA assay. ROS, CXCR4 and GLP-1R protein expression were evaluated by flow cytometry after CellRox, CXCR4 and GLP-1R staining respectively.
Results: We first analyzed GLP-1R expression in CD34+ stem cells. We found that both mRNA and membrane protein of the receptor were expressed in CB-CD34+ stem cells. Moreover, the treatment with 100nM LIRA, typical concentration used for in vitro experiments, consistently stimulated accumulation of intracellular cAMP over basal levels with the highest values after 10 minutes (n=4; p≤0.001). However, after that time, intracellular cAMP levels started decreasing. Since we recently published that HG exposure reduced CD34+ stem cell proliferation and CXCR4/SDF1 axis activation, the cells were treated with increasing concentration of LIRA (50 and 100nM) during HG challenge. The drug showed to significantly prevent the reduction of cell proliferation and migration toward SDF-1 (n=5; p≤0.001) as well as CXCR4 receptor downregulation (n=9; p≤0.01) in HG-CD34+ stem cells when compared to HG cell alone. Interestingly, all these pharmacological effects correlated with a significant reduction of HG-induced production of ROS (n=3; p≤0.01).
Conclusion: LIRA protects CD34+stem cells functions from oxidative stress induced by high glucose concentrations.
Supported by: The Italian Ministry of Health (RC2019)
Disclosure: M. Vinci: None.
918
A dipeptidyl peptidase-4 (DPP-4) inhibitor suppresses foam cell formation of macrophages through the suppresion of CD36 in type 1 diabetes
M. Terasaki1, H. Yashima1, Y. Mori1, T. Saito1, M. Hiromura1, H. Kushima1, M. Koshibu1, N. Osaka1, M. Ohara1, T. Fukui1, T. Hirano2, S.-I. Yamagishi1;
1Showa University School of Medicine, Tokyo, 2Ebina General Hospital, Kanagawa, Japan.
Background and aims: Dipeptidyl peptidase-4 (DPP-4) inhibitors could have anti-atherosclerotic actions in type 2 diabetic patients, in addition to their glucose lowering effect. However, since type 2 diabetic patients have comorbidities, such as obesity, hypertension, and dyslipidemia, it remains unclear whether DDP-4 inhibitors could exert atheroprotective properties directly by attenuating the harmful effects of hyperglycemia and advanced glycation end products (AGEs) or by ameliorating the comorbidities. In this study, we aimed to elucidate whether and how a DPP-4 inhibitor teneligliptin could inhibit foam cell formation of macrophages derived from type 1 diabetic patients or animals, an initial step of atherosclerosis. We also examined whether teneligliptin could inhibit foam cell formation and CD36 gene expression in AGE-exposed THP-1 cells and mouse peritoneal macrophages.
Materials and methods: Eight-week-old male wild-type mice received intraperitoneal injections of saline or 50 mg/kg/day streptozotocin for 5 consecutive days to create a type 1 diabetic mice. Peritoneal macrophages were extracted from mice at 13 weeks of age just after intraperitoneal injection of thioglycollate broth. We collected blood samples from type 1 diabetes patients and healthy volunteers. Human peripheral mononuclear cells were isolated from blood samples using anti-CD14 antibody-conjugated magnetic microbeads, and then incubated for 7 days to differentiate monocytes to macrophages. Mouse and human macrophages were incubated with or without 10 nmol/L teneligliptin for 18 hours. Foam cell formation of macrophages was determined by an incorporation of [3H]-oleate-labelled oxidized-LDL into macrophages using thin-layer chromatography. Quantitative RT-PCR analysis was performed using TaqMan-based probes. THP-1 macrophages and peritoneal macrophages extracted from wild-type mice were incubated with 100 μg/mL AGE-BSA or non-glycated BSA for 24 hours. Then the cells were treated with or without 10 nmol/L teneligliptin for 18 hours. Macrophage foarm cell formation was determined by Dil-oxidized-LDL fluorescent intensity using immunohistochemistry. Quantitative RT-PCR analysis were conducted as described above.
Results: Foam cell formation of macrophages derived from type 1 diabetic mice and type 1 diabetic patients were increased by about 2 times compared with those from control animals and subjects. CD36 gene expression was also increased in type 1 diabetic patients and animals by 2 and 3 times, respectively. Teneligliptin attenuated foam cell formation of macrophages isolated from type 1 diabetic mice by 40 % and type 1 diabetes patients by 38 % accompanied with reduction of CD36 gene expression levels. Furthermore, AGEs significantly increased foam cell formation of, and CD36 gene expression in, mouse macrophages and THP-1 cells compared with those exposed to non-glycated BSA, both of which were inhibited by teneligliptin.
Conclusion: Our present findings suggest that a DPP-4 inhibitor teneligliptin could suppress macrophage foam cell formation in type 1 diabetic mice and patients via CD36 gene expression partly by attenuating the harmful effects of AGEs. Teneligliptin may play a protective role against atherosclerosis through the inhibition of macrophage foam cell formation in type 1 diabetes.
Clinical Trial Registration Number: 956
Disclosure: M. Terasaki: None.
919
Elevated non-albuminuric proteinuria is a significant predictor of the progression of carotid artery atherosclerosis in type 2 diabetes, independent of albuminuria
Y.-E. Kim, S. Lee, H. Kim, M. Lee, B.-W. Lee;
Department of Internal Medicine, Yonsei University College of Medicine, Seoul, Republic of Korea.
Background and aims: Proteinuria in diabetic kidney disease (DKD) comprises both albuminuria of glomerular origin and non-albuminuric proteinuria (NAP) of tubulointerstitial one. Despite established association between albuminuria and atherosclerosis in T2D, the association between NAP and atherosclerosis has not been sufficiently evaluated. We investigated whether NAP can predict the progression of carotid artery atherosclerosis in type 2 diabetes (T2D).
Materials and methods: For this retrospective longitudinal study, we recruited 824 patients with T2D who consecutively measured carotid intima-media thickness (IMT) twice at baseline and at least 1 year after, along with initial urine protein-to-creatinine ratio (UPCR) and urine albumin-to-creatinine ratio (UACR). NAP to creatinine ratio (NAPCR) was defined as [UPCR-UACR]. Subjects with above UPCR 30 mg/g were excluded to evaluate clinical significance of NAP, independent of albuminuria. All subjects were classified into the progression (n = 518) and non-progression (n = 306) groups based on the changes in the mean of maximum carotid IMT (ΔIMT = follow-up maximum carotid IMT - baseline maximum carotid IMT).
Results: The subjects in the progression group showed significantly higher UPCR and NAPCR than the subjects in non-progression group (p = 0.018 for UPCR and p = 0.013 for NAPCR), but UACR was not different between two groups (p = 0.825). Both elevated initial UPCR (r2 = 0.013, p = 0.024) and NAPCR (r2 = 0.014, p = 0.016) were significantly associated with the increase in ΔIMT. In logistic regression models adjustment for multiple confounding factors, UPCR and NAPCR were more likely to be associated with carotid IMT progression (p = 0.004 for UPCR, and p = 0.003 for NAPCR).
Conclusion: The present study suggested that NAP could be a useful predictable marker even in subjects without albuminuria for the progression carotid artery atherosclerosis in T2D.
Disclosure: Y. Kim: None.
920
Non-albuminuric diabetic kidney disease in type 1 diabetes: incidence of major vascular outcomes over a 10-year follow-up observational study
M. Garofolo1, E. Gualdani2, D. Lucchesi1, R. Giannarelli1, R. Miccoli1, P. Francesconi2, G. Penno1, S. Del Prato1;
1Department of Clinical and Experimental Medicine, University of Pisa, Pisa, 2Epidemiology Unit, Regional Health Agency, Florence, Italy.
Background and aims: Non-albuminuric diabetic kidney disease (Alb-DKD) has been associated with a raised risk of cardiovascular (CV) outcomes and all-cause mortality in subjects with type 1 diabetes mellitus (T1DM). However, the informations on the relationship between Alb-DKD and CV outcomes rely in a single prospective study.
Materials and methods: We report about the association between different DKD phenotypes [be they defined as albuminuria (ACR ≥3.4 mg/mmol) alone (DKD 1-2), reduced estimated glomerular filtration rate (MDRD equation; eGFR <60 ml/min/1.73m2) alone (Alb-DKD), or both increased albuminuria and reduced eGFR (Alb+DKD)] and CV outcomes in a single-centre, observational, prospective study of 774 adult individuals with T1DM followed over a mean period of 10.4±2.9 years. Rates of outcomes (Regional Health Agency Hospital Discharge Registries) and vital status (Italian Health Card Database) have been censored on December 31, 2017. Subsequently to the Kaplan-Meier analyses, hazard ratios (HRs, 95% CI) for different outcomes associated with each DKD phenotype were assessed by unadjusted and adjusted Cox regressions. In the fully adjusted regression models, the EURODIAB PCS risk score, a powerful integrated predictor of major outcomes in T1DM, has been included among covariates.
Results: Out of 774 T1DM, 692 (89.4%) had no-DKD, 53 had DKD 1-2 (6.8%), 17 (2.2%) Alb-DKD and 12 (1.6%) Alb+DKD. Incidences of major CV outcomes, coronary events and end-stage renal disease (ESRD) were available for 736 subjects (95.1% of the whole cohort). A major CV event occurred in 49 T1DM (6.7%; 6.42 events x 1000 person-years, PYs), rising from no-DKD (4.2%) to DKD 1-2 (28.6%) and Alb-DKD (35.3%). In Alb+DKD, due to the strong competition with all-cause mortality, only a single CV event occurred. Compared to no-DKD, the adjusted HRs were 4.43 (95%CI 2.27-8.61, p<0.0001) in DKD 1-2 and 3.44 (1.34-8.81, p=0.010) in Alb-DKD. After further adjustment for prior CVD, the HR was fully preserved for DKD 1-2 (p<0.0001), but attenuated for Alb-DKD (p=0.064). An acute coronary event occurred in 35 T1DM (4.8%; 4.54 events x 1000 PYs), rising from 3.0% in no-DKD to 18.4% in DKD 1-2 and 29.4% in Alb-DKD. Compared to no-DKD, the adjusted HRs were 3.85 (1.72-8.65, p=0.001) in DKD 1-2 and 4.75 (1.66-13.56, p=0.004) in Alb-DKD. After adjustment for prior CV disease, the HRs were preserved for both DKD 1-2 (p<0.0001) and Alb-DKD (p=0.016). Only 11 subjects developed ESRD (1.5%): 0.9% in no-DKD, 2.0% in DKD 1-2, 17.6% in Alb-DKD and 10.0% in Alb+DKD. Compared to no-DKD, the risk of ESRD raised only in Alb-DKD (HR 6.59, 95%CI 1.31-33.20, p=0.022). After further adjustment for prior CV disease, this HR was 5.26 (p=0.058). Compared to no-DKD, the risk of death was increased to the same extent of about four-five fold in Alb-DKD and Alb+DKD (p<0.0001).
Conclusion: In subjects with type 1 diabetes, Alb-DKD was independently associated with a raised cumulative incidence of CV, mainly coronary, events. On the other hand, though preliminary, our data do not to confirm that Alb-DKD does not increase risk of ESRD. Anyway, this emerging DKD phenotype deserves intensive prevention strategies.
Disclosure: M. Garofolo: None.
921
Chronic kidney disease is a type 2 diabetes risk equivalent in patients with established coronary artery disease
C.H. Saely1,2, L. Sprenger2,3, A. Vonbank3,2, B. Larcher3,2, A. Mader3,2, M. Maechler2,3, D. Zanolin-Purin2,1, A. Leiherer1,2, A. Muendlein2,1, H. Drexel2,1;
1Private University of the Principality of Liechtenstein, Triesen, Liechtenstein, 2Vorarlberg Institute for Vascular Investigation & Treatment (VIVIT), Feldkirch, Austria, 3Medicine I, Academic Teaching Hospital Feldkirch, Feldkirch, Austria.
Background and aims: Both type 2 diabetes (T2DM) and chronic kidney disease (CKD) confer a high risk of cardiovascular disease (CVD). We aimed at investigating the single and joint effects of T2DM and of CKD on cardiovascular event risk in high-risk patients with established coronary artery disease (CAD).
Materials and methods: We prospectively investigated 1460 patients with angiographically proven CAD over 10.3±4.8 years.
Results: Cardiovascular events occurred more frequently in T2DM patients (n=449) than in non-diabetic subjects (56.2% vs. 44.5%; p<0.001) and in patients with CKD (eGFR <60ml/min/1.73m²; n=264) than in those with an eGFR ≥60ml/min/1.73m² (61.7% vs. 45.1%; p<0.001). When both, T2DM and CKD were considered, 856 subjects had neither T2DM nor CKD, 340 had T2DM but not CKD, 155 did not have diabetes but had CKD, and 109 had both T2DM and CKD. When compared with the cardiovascular event rate among patients with neither T2DM nor CKD (42.5%), cardiovascular risk was significantly higher in patients with T2DM who did not have CKD (51.5%; p=0.002) as well as in non-diabetic patients with CKD (55.2%; p=0.009) and was highest in patients with both, T2DM and CKD (71.0%; p<0.001), in whom the event risk was higher than in those with T2DM but no CKD (p<0.001) or those without T2DM but with CKD (p=0.005); event risk however did not differ significantly between non-diabetic CKD patients and T2DM patients who did not have CKD (p=0.692).
Conclusion: We conclude that CKD is a T2DM risk equivalent in patients with established CAD.
Disclosure: C.H. Saely: None.
922
Cardiorenal disease is the most common first cardiovascular renal disease manifestation associated with increased mortality risk in early stage of type 2 diabetes patients
N. Morita1, T. Kadowaki2, I. Komuro3, P. Yi1, S. Okami1, Y. Kidani1, T. Yajima1;
1AstraZeneca K.K., Osaka, 2Toranomon Hospital, Tokyo, 3The University of Tokyo, Tokyo, Japan.
Background and aims: Type 2 diabetes (T2D) affects more than 463 million people world-wide, with a high prevalence of cardiovascular and renal disease (CVRD). Recently, it has been reported that heart failure (HF) and/or chronic kidney disease (CKD), defined as cardiorenal disease, was the most common first CVRD manifestation in T2D patients, and imposes substantial burden on patient prognosis. However, the magnitude of cardiorenal disease risks increased in T2D patients compared to the population without diabetes (non-T2D) patients remains unclear. The aim of this study is to assess the development of CVRD (myocardial infarction (MI), stroke, peripheral artery disease (PAD), HF and CKD) and the mortality risks in patients with early stage of T2D.
Materials and methods: This is a retrospective cohort study using a Japanese hospital claims database. We extracted T2D patients aged ≥18 years with age/gender-matched non-T2D patients from April 1, 2008 to September 30, 2018. The first CVRD manifestation and incidence rate were assessed in T2DM and non-T2DM patients without a history of CVRD. In these patients, the cumulative incidence of CVRD was evaluated (Figure a). In addition, the relative mortality risk of T2D was estimated by cox proportional hazard model (Figure b, left). Mortality risk of patients with a history of cardiorenal disease was also examined in the two groups (Figure b, right).
Results: In this study, 904,274 T2D patients and 1,343,371 non-T2D patients were identified, where 426,729 (47.2%) and 1,019,333 (75.9%) patients were CVRD free, respectively. Cardiorenal disease was the most common first CVRD manifestation in both T2D and non-T2D patients with higher incidence in T2D (Figure; a). The difference in incident rate between T2D and non-T2D was 4.1 per 1000 patient-year in MI, stroke, and PAD, while higher difference of 13.1 per 1000 patient-year was observed in cardiorenal disease. T2D was associated with an increased mortality risk in CVRD free patients, HR: 1.73, 95%CI: 1.70-1.77. However, in patients who already had cardiorenal disease at the index date, the mortality risk increased in both patient groups to a similar level between T2D and non-T2D patients, HR: 1.05, 95%CI: 1.01-1.09 (Figure; b).
Conclusion: In Japanese CVRD free patients, cardiorenal disease was the most common first CVRD manifestation in T2D patients associated with higher mortality risk compared to non-T2D patients. The mortality risk after cardiorenal disease was comparable between T2D and non-T2D patients, suggesting that higher cardiorenal disease incidence in T2D patients may constitute the increased mortality risk compared to non-T2D patients. The results indicate the importance of early intervention aiming to prevention of cardiorenal disease in CVRD free, early stage of T2D patients.

Clinical Trial Registration Number: D1690R00061
Supported by: AstraZeneca K.K.
Disclosure: N. Morita: Employment/Consultancy; AstraZeneca.
PS 90 Stiff arteries and how to avoid them
923
Hyperglycaemia and arterial stiffness across two generations
S. Taimour;
Clinical Sciences, Lund University, Lund, Sweden.
Background and aims: Previous studies have indicated that impaired glucose metabolism and diabetes mellitus (DM) are related to markers of arterial stiffness. This observational study aimed to investigate such links in two generations of subjects from a population-based study.
Materials and methods: Data was used from 2640 subjects in the ongoing Swedish Malmö Offspring Study. The subjects were direct descendants of each other, parents (median [interquartile range, IQR] age 51.9[4713-57.9] years) and children (median [IQR] age 26.9[22.1-31.7] years). Arterial stiffness measured through carotid-femoral pulse wave velocity (cfPWV) was related with multiple linear regression to variables reflecting glucose metabolism (fasting glucose, glycated hemoglobin [HbA1c], skin autoflourescence [SAF]), in a model adjusted for age, sex, smoking, body mass index, low and high density lipoprotein cholesterol, triglycerides, systolic blood pressure, and anti-hypertensive medication. Analysis was first performed in all subjects and then separately in each generation. T-tests with DM as the grouping variable were performed for all subjects and separately in each generation.
Results: After adjustment for covariates in multivariate linear regression, cfPWV was significantly associated with glucose (p=0.026) and HbA1c (p<0.001), but not with SAF (p=0.675). When analyzing generations separately, cfPWV was associated with both glucose (p=0.007) and HbA1c (p<0.001) in parents, but not in children (p=0.733 for glucose and p=0.198 for HbA1c) in the adjusted analysis. cfPWV differed between subjects with and without DM in the entire group (mean difference 1.7 m/s, p<0.001) as well as within each generation (mean difference 1.3 m/s; p<0.001 in parents, and 0.7 m/s; p=0.04 in children).
Conclusion: The association between markers of impaired glucose metabolism and arterial stiffness was significant only in parents, but there was a significant difference in cfPWV between subjects with or without DM in both generations.
Disclosure: S. Taimour: Grants; Swedish Cancer Society, Swedish Medical Research Council, Albert Påhlsson and Gunnar Nilsson Foundations, Malmö City Council, Swedish Heart-Lung Foundation, Hulda Ahlmroth Foundation.
924
Arterial stiffness in patients with different stages of dysglycaemia
J. Cederqvist1, K. Rådholm1, M. Persson2, G. Engström2, J. Engvall3,4, C. Östgren1;
1Department of Health, Medicine and Caring Sciences, Linköping University, Linköping, 2Department of Clinical Science, Lund University, Malmö, 3Department of Clinical Physiology and Department of Health, Medicine and Caring Sciences, Linköping University, Linköping, 4Centre for Medical Image Science and Visualization (CMIV), Linköping University, Linköping, Sweden.
Background and aims: An increased pulse wave velocity (PWV) is an established marker for arterial stiffness that confers with an increased cardiovascular risk. Our aim was to study if PWV differs in various stages of dysglycaemia in an unselected population.
Materials and methods: Data were obtained from the Swedish CArdiopulmonary bioImage Study (SCAPIS), a population based cohort of participants 50-64 years old. The study population of 9379 participants were categorized according to glycaemic status: normoglycaemic (fasting glucose: <6.1mmol/L and HbA1c <42mmol/mol), pre-diabetes (fasting glucose: 6.1-6.9 mmol/L and/or HbA1c 42-47mmol/mol), and diabetes (fasting glucose ≥7.0 mmol/L and/or HbA1c ≥48mmol/mol or previously known diabetes). PWV was measured by the SphygmoCor XCEL system. In the logistic regression models of PWV in different stages of glycaemia the full model was adjusted for age, sex, systolic blood pressure, BMI, coronary calcium score >100, LDL-cholesterol and smoking.
Results: We identified 1964 (21%) participants with dysglycaemia, out of which 742 (8%) had diabetes. The PWV mean values were 8.4 m/s (SD 1.3), 8.8 m/s (SD 1.4) and 9.3 m/s (SD 1.6) for participants with normoglycaemia, pre-diabetes and diabetes respectively, p-value <0.001. The adjusted odds ratio (95%CI) per 1 m/s increment of PWV was 1.4 (95% CI 1.3-1.5) for diabetes vs normoglycemic, 1.2 (95%CI 1.1-1.2) for pre-diabetes vs normoglycemic and 1.2 (95% CI 1.1-1.3) for diabetes vs pre-diabetes.
Conclusion: PWV increased with higher glucose levels when adjusted for other known risk factors and calcification in the coronary arteries. This suggests that arterial stiffness is present in the early stages of dysglycaemia and independently of prevalent subclinical atherosclerosis in coronary arteries.

Supported by: The Swedish Heart-Lung Foundation
Disclosure: J. Cederqvist: Grants; The main funding body of The Swedish CArdioPulmonary bioImage Study (SCAPIS) is the Swedish Heart-Lung Foundation, The study is also funded by the Knut and Alice Wallenberg Foundation, the Swedish Research Council and VINNOVA (Sweden’s Innovation agency).
925
Carotid intima-media thickness and arterial stiffness in silent cerebral microbleeds: a study in neurologically asymptomatic individuals with type 1 diabetes
J. Inkeri1,2, A. Tynjälä1,3, C. Forsblom1,4, R. Liebkind5, T. Tatlisumak5,6, L.M. Thorn1,3, P.-H. Groop3,4, S. Shams7,8, J. Putaala5, J. Martola2, D. Gordin1,4;
1Folkhälsan Institute of Genetics, Folkhälsan Research Center, Helsinki, Finland, 2Department of Radiology, Helsinki University Hospital, Helsinki, Finland, 3Research Programs for Clinical and Molecular Metabolism, University of Helsinki, Helsinki, Finland, 4Abdominal Center, Nephrology, University of Helsinki and Helsinki University Hospital, Helsinki, Finland, 5Clinical Neurosciences, Neurology, University of Helsinki and Helsinki University Hospital, Helsinki, Finland, 6Department of Clinical Neuroscience/Neurology, Institute of Neuroscience and Physiology, Sahlgrenska Academy, University of Gothenburg and Department of Neurology, Sahlgrenska University Hospital, Gothenburg, Sweden, 7Department of Radiology, Karolinska University Hospital, and Department of Clinical Neuroscience, Karolinska Institutet, Stockholm, Sweden, 8Department of Radiology, Stanford University, Stanford, USA.
Background and aims: We observed cerebral microbleeds (CMBs) to be a surprisingly common finding in neurologically asymptomatic individuals with type 1 diabetes (T1D). The aim of this study was to determine if arterial functional and structural changes are associated with CMBs in these individuals.
Materials and methods: We enrolled 186 participants (47.8 % men; median age 39.9 (33.0 - 44.9) years) with T1D (median diabetes duration of 21.6 (18.1 - 30.2) years) in this study, as part of the Finnish Diabetic Nephropathy (FinnDiane) Study. All participants underwent biochemical work-up, brain MRI, ultrasound of the common carotid arteries, and arterial tonometry. The arterial structural and functional phenotypes were assessed by carotid intima-media thickness (CIMT), and pulse wave velocity (PWV)/augmentation index (AIx), respectively.
Results: CMBs were present in 44 (23.7%) of participants with T1D. Patients with CMBs had a higher CIMT, median (IQR) 583 (525-663) μm vs. 559 (505-607) μm, p=0.018. CIMT was positively associated with the presence of CMBs, OR 1.006 (95% CI 1.001-1.010), p=0.017, independent of clinically relevant covariates (age, sex, eGFR, apolipoprotein B, and systolic blood pressure). Arterial stiffness (PVW/AIx) was not increased in those with CMBs compared to those without; central PWV OR 1.103 (95% CI 0.846-1.439), p=0.468; peripheral PWV OR 1.023 (95% CI 0.725-1.442), p=0.898 and AIx OR 1.010 (95% CI 0.966-1.056), p=0.667.
Conclusion: Increased CIMT, a strong risk factor for cardiovascular disease, was associated with silent CMBs. This finding suggests a relationship between subclinical atherosclerosis and CMBs. CIMT, which is readily available in a clinical setting, may add to the risk prediction of CMBs in individuals with T1D, although further studies are needed before including this investigation into clinical practice.
Supported by: Academy of Finland, University of Helsinki, Folkhälsan Research Foundation, Finska Läkaresällskapet
Disclosure: J. Inkeri: Grants; Academy of Finland, University of Helsinki, Folkhälsan Research Foundation, Finska Läkaresällskapet, Juselius Foundation, Perkléns Foundation, Stockmann Foundation.
926
HbA1c variability is associated with arterial stiffness in type 1 diabetes
A. Tynjälä1,2, C. Forsblom1,2, V. Harjutsalo1,3, P.-H. Groop2,4, D. Gordin2,5, the FinnDiane Study Group;
1Folkhälsan Research Center, Helsinki, Finland, 2Abdominal Center, Nephrology, University of Helsinki and Helsinki University Hospital, Helsinki, Finland, 3National Institute for Health and Welfare, Helsinki, Finland, 4Research Program for Clinical and Molecular Metabolism, Faculty of Medicine, University of Helsinki, Helsinki, Finland, 5Joslin Diabetes Center, Harvard Medical School, Boston, USA.
Background and aims: The mechanisms of vascular complications in type 1 diabetes (T1D) still call for deeper understanding. We have observed earlier that HbA1c variability predicts cardiovascular disease (CVD) whereas mean HbA1c does not, indicating a distinct pathophysiological role of long-term changes in the glycaemic milieu. Whether this effect is mediated by arterial stiffness, an established surrogate marker for CVD, remains an intriguing question. The purpose of this study was to find out whether HbA1c variability and mean HbA1c are associated with increased endpoint arterial stiffness in individuals with T1D.
Materials and methods: This observational study was carried out with data from the Finnish Diabetic Nephropathy (FinnDiane) Study, which is an ongoing prospective cohort of individuals with T1D. The data comprised 718 individuals (median age 46.3 years [38.3-55.5], 46.9% men) with T1D meeting the criteria of no fewer than three HbA1c measurements available before a subsequent applanation tonometry visit between 2002 and 2019. Among them were 229 individuals with albuminuria or end-stage renal disease (ESRD) and 101 individuals with a previous CVD hard event. HbA1c values by standardised assays were collected from databases over the course of 10 years before the endpoint visit with thorough clinical characterisation, including assessment of arterial stiffness by applanation tonometry. Mean value and coefficient of variation (CVA1c, [standard deviation] / [mean] x 100%) were calculated for HbA1c for each subject. Brachial and carotid pulse wave velocities (bPWV and cPWV) as well as augmentation index (AIx) were used as markers for arterial stiffness. AIx was available in 697, bPWV in 373, cPWV in 352, and all three variables in 320 cases.
Results: The median number of HbA1c measurements per person was 16 (10-25) with a median intrapersonal HbA1c mean of 8.1 (7.4-8.9) % and a median intrapersonal CVA1c of 7.3 (5.4-10.0) %. In a logistic regression analysis adjusted for age, sex, and triglycerides (Model 1), higher CVA1c was associated with the highest quartiles of AIx (OR 1.077 [1.027-1.128], p = 0.002), bPWV (OR 1.061 [1.002-1.123], p = 0.043) and cPWV (OR 1.087 [1.004-1.177], p = 0.040), respectively. The association of CVA1c with AIx was found even after correction for mean HbA1c, whereas adding eGFR led to lost significance. When analysed with Model 1, mean HbA1c was associated with AIx (even independent of eGFR) and cPWV, but not with bPWV. In a subanalysis of individuals with albuminuria or ESRD, CVA1c and HbA1c mean were similarly associated with AIx as opposed to no association with bPWV or cPWV.
Conclusion: In individuals with T1D, HbA1c variability and mean HbA1c were both independently associated with increased arterial stiffness estimated by AIx. Similar results were found in a subgroup of individuals with albuminuria or ESRD. These findings support the rationale to further explore the effects of a long-term variation in blood glucose levels on the vascular complications of diabetes.
Supported by: Academy of Finland, Biomedicum Helsinki Foundation, FLS, Folkhälsan Research Foundation, NNFOC001365
Disclosure: A. Tynjälä: None.
927
Atherogenic index of plasma is an independent predictor of arterial stiffness in healthy, Korean men and women
C. Ahn;
Endocrinology, Gangnam Severance Hospital, Seoul, Republic of Korea.
Background and aims: The atherogenic index of plasma (AIP) has been suggested as a useful independent predictor of cardiovascular disease (CVD). However, there no data regarding the association between the AIP and arterial stiffness in subjects without CVD or CV risk factors. Thus, we investigated the association between AIP and arterial stiffness measured by brachial-ankle pulse wave velocity (baPWV) in healthy adults.
Materials and methods: A total of 3468 healthy subjects without a history of chronic metabolic diseases or CVD were enrolled in this study. Anthropometric and cardiovascular risk factors were measured. The AIP is defined as the base 10 logarithm of the ratio of the concentration of triglyceride to high density lipoprotein-cholesterol. Brachial-ankle PWV was measured automatic plethysmographic instrument. Subjects were classified into quartiles based on AIP. There were gradual deteriorations in metabolic parameters and an increase in baPWV across the increasing order of AIP quartiles.
Results: In fully adjusted analysis, compared with group Q1 (lowest quartile), the odds ratio (95% CI) for increased baPWV (> sex-specific 75th percentile) were higher in groups Q2 1.51 (0.84-2.73), Q3 1.64 (0.92-2.93) and Q4 (highest quartile) 2.77 (1.53-5.01) among men (P trend <0 .01), and Q2 1.09 (0.70-1.70), Q3 1.55 (1.01-2.38), and Q4 1.83 (1.19-2.81) among women (P trend <0 .05).
Conclusion: The AIP is independently associated with increased arterial stiffness in healthy, Korean adults.
Disclosure: C. Ahn: None.
928
Relationship between arterial stiffness and left ventricular diastolic function in patients with type 2 diabetes
S. Kurioka;
Komatsu Hospital, Neyagawa, Japan.
Background and aims: Increased arterial stiffness and left ventricular (LV) diastolic dysfunction are common in patients with type 2 diabetes mellitus (T2DM). However, it remains unclear whether there is an association between the increased arterial stiffness and LV diastolic dysfunction. The aim of this study was to investigate the relationship between arterial stiffness and indices of LV diastolic function.
Materials and methods: One-hundred and twenty consecutive asymptomatic patients with T2DM [63% men; age 66±10 years (mean±SD); diabetic duration 11±9 years; HbA1c 7.6±1.8%; systolic blood pressure (SBP) 130±14mmHg] were enrolled in this study. Arterial stiffness was evaluated by measuring the brachial-ankle pulse wave velocity (baPWV). LV diastolic function was assessed with echocardiographic examination. Doppler echocardiographic indices including E, A, and e'.
Results: The mean baPWV, E/A ratio, e', and E/e' ratio were 1760±373 cm/s, 0.85±0.36, 6.0±1.6 cm/s and 12±3, respectively. baPWV correlated with age (r=0.529, p<0.0001), duration of diabetes (r=0.293, p=0.001), SBP (r=0.243, p=0.007), E/A ratio (r=-0.248, p=0.002), e' (r=-0.473, p<0.0001), E/e' ratio (r=0.247, p=0.007). In multiple regression analysis, age (β=0.365, p<0.001), SBP (β=0.231, p=0.005), and e' (β=-0.259, p=0.026) correlated independently with baPWV, however, the E/A ratio (β=-0.055, p=0.547) and the E/e' ratio (β=-0.119, p=0.294) did not.
Conclusion: In this study, increased arterial stiffness was associated with LV diastolic dysfunction. Among the indices of LV diastolic function, e' correlated most significantly with baPWV.
Disclosure: S. Kurioka: None.
929
Association between polymorphisms in the Sirtuin 1 gene and the risk of coronary artery disease in Chinese Han type 2 diabetes patients
N. Gu1, L. Tong1, D. Yu1, X. Ma1, J. Li2, X. Guo1, J. Zhang1;
1Endocrinology, Peking University First Hospital, Beijing, 2Cardiovascular, Peking University First Hospital, Beijing, China.
Background and aims: The Sirtuin 1 gene, coding for a NAD+-dependent histone deacetylase (HDAC), is homologous to the silent information regulator 2 (SIR2) gene in yeast. It plays an important role in glucose and lipid metabolism and has an anti-atherosclerotic effect. This study was designed to investigate whether polymorphisms in the SIRT1 gene are associated with an increased risk of cardiovascular disease in Chinese Han type 2 diabetes (T2D) patients.
Materials and methods: In this case-control study, 492 patients were divided into two groups according to whether they had 50% or more coronary artery stenosis on coronary angiography (297 patients; CAD positive group), or 50% or less coronary artery stenosis on coronary angiography or computed tomography-angiography (195 patients; control group). Polymerase chain reaction-restriction fraction length polymorphism analysis was used to genotype five haplotype-tagging single nucleotide polymorphisms in the SIRT1 gene (rs3818291, rs12242965, rs3818292, rs4746720, and rs16924934) in CHB data on the GRCh37.p13 phase 3 database (r≤0.8, MAF≥0.05). Allele and genotype frequencies of the five SNPs were compared between the positive group and control group.
Results: The genotypic frequency distributions of five SNPs in SIRT1 were consistent with Hardy-Weinberg’s law, being colony representative. The carriers of allele G had a higher risk of CAD than the carriers of A in rs16924934 (OR=1.429; 95% CI, 1.003-2.037; p=0.048). In the additive inheritance model, the carriers of G/A had a higher risk of CAD than those of G/G in rs3818291 (OR=1.584; 95% CI, 1.006-2.494; p=0.047), even after adjustment for CAD risk factors (OR'=1.683; 95% CI, 1.033-2.743; p'=0.037). In the dominant inheritance model, the carriers of G/A or A/A in rs3818291 had a higher risk of CAD (OR=1.514; 95% CI, 1.021-2.243; p=0.039), which became negligible after adjustment for CAD risk factors. People with a higher BMI (>24kg/m2) had a higher risk of CAD when they carried G/A or A/A in rs3818291 (OR=1.674; 95% CI, 1.011-2.771; p=0.045; OR'=1.812; 95% CI, 1.047-3.135; p'=0.034, after adjustment). Subjects who smoked and carried the risk allele A in rs3818291 had a 2.6-fold higher risk of CAD than subjects who had none of these risk factors (Figure 1).
Conclusion: Genetic polymorphisms in the SIRT1 gene are associated with a higher CAD risk in Chinese Han people with T2D.

Supported by: National Natural Science Foundation of China [NSFC 30771033]
Disclosure: N. Gu: None.
930
Comparison of two recent ceramide-based coronary risk prediction scores: CERT and CERT-2
H. Drexel1,2, A. Muendlein1,2, C.H. Saely2,1, R. Laaksonen3, M. Laaperi3, A. Vonbank4,1, A. Mader4,1, B. Larcher4,1, M. Maechler1,4, L. Sprenger1,4, P. Fraunberger5, A. Leiherer2,1;
1Vorarlberg Institute for Vascular Investigation & Treatment (VIVIT), Feldkirch, Austria, 2Private University of the Principality of Liechtenstein, Triesen, Liechtenstein, 3Zora Biosciences, Espoo, Finland, 4Medicine I, Academic Teaching Hospital Feldkirch, Feldkirch, Austria, 5Medical Central Laboratories, Feldkirch, Austria.
Background and aims: The Coronary Event Risk Test (CERT) is a validated cardiovascular risk predictor that uses circulating ceramide concentrations to allocate patients into one of four risk categories. This test has recently been updated (CERT-2), now additionally including phosphatidylcholine concentrations.
Materials and methods: We investigated the power of CERT and CERT-2 to predict cardiovascular mortality in 999 patients with cardiovascular disease (CVD).
Results: Overall, comparing survival curves (figure) for over 12 years of follow up and the predictive power of survival models using net reclassification improvement (NRI), CERT-2 was the best predictor of cardiovascular mortality, surpassing CERT (NRI=0.456; p=0.01) and also the 2019 ESC-SCORE (NRI=0.163; p=0.04). Patients in the highest risk category of CERT as compared to the lowest category had a HR of 3.63 [2.09-6.30] for cardiovascular death; for CERT-2 the corresponding HR was 6.02 [2.47-14.64]. Among patients with T2DM (n=322), the HR for cardiovascular death was 3.00 [1.44-6.23] using CERT and 7.06 [1.64-30.50] using CERT‑2; the corresponding HRs among non-diabetic subjects were 2.99 [1.20-7.46] and 3.43 [1.03-11.43], respectively.
Conclusion: We conclude that both, CERT and CERT-2 scores are powerful predictors of cardiovascular mortality in CVD patients, especially in those patients with T2D. Performance is even higher with CERT-2.

Disclosure: H. Drexel: None.
931
The impact of parental risk factors on the risk of stroke in type 1 diabetes
A.J.J. Ylinen1,2, S. Hägg-Holmberg1,2, C. Forsblom1,3, V. Harjutsalo1,2, J. Putaala4, P.-H. Groop2,3, L.M. Thorn1,2, The FinnDiane Study Group;
1Folkhälsan Institute of Genetics, Folkhälsan Research Center, Helsinki, 2Research Program for Clinical and Molecular Metabolism, Faculty of Medicine, University of Helsinki, Helsinki, 3Abdominal Center, Nephrology, University of Helsinki and Helsinki University Hospital, Helsinki, 4Department of Neurology, Helsinki University Hospital, Helsinki, Finland.
Background and aims: Individuals with type 1 diabetes have an increased risk of cardiovascular complications, stroke among them. The impact of parental risk factors on the risk of stroke in type 1 diabetes has not been assessed previously. Our aim was, therefore, to study how hypertension, diabetes (type 1 or 2), stroke, and/or myocardial infarction in the parents of individuals with type 1 diabetes affect their risk of stroke.
Materials and methods: This study included 4,011 individuals without prior stroke that had participated in the Finnish Diabetic Nephropathy Study in 1997-2012. Individuals who suffered a stroke were identified from death certificates and from the National Hospital Discharge Register, and verified by a stroke neurologist, based on medical records and radiological imaging, as either cerebral infarction or hemorrhage. All participants filled out questionnaires concerning the medical history of their parents. The impact of parental risk factors on stroke risk was analyzed with Cox-regression analyses.
Results: During a median follow-up of 12.4 (10.9-14.2) years, 188 individuals (4.6%) were diagnosed with their first ever stroke; 134 were cerebral infarctions and 54 hemorrhages. Those with stroke were older than those without stroke (46 ± 10 vs 37 ± 12 years, p <0.001), at the time of participation in the study. Thus, at the same point in time, also the parents were older (mothers 71 [65 - 76] vs 61 [53 - 70] years, p <0.001, fathers 72 [62 - 75] vs 61 [54 - 69] years, p <0.001). In Cox-regression analysis, maternal stroke increased the risk of cerebral hemorrhage, HR 2.86 (95% confidence interval 1.27-6.44, p=0.011) after adjustment for sex, age, BMI, retinal photocoagulation, and diabetic nephropathy. There was, however, no association between cerebral infarction and maternal stroke. No other significant associations between parental risk factors and cerebral infarction or hemorrhage in type 1 diabetes were found.
Conclusion: A history of maternal stroke increases the risk of cerebral hemorrhage in individuals with type 1 diabetes. Other parental risk factors seem to have limited impact on the risk of stroke.
Supported by: Folkhälsan Research Foundation, Academy of Finland, Stockmann Foundation, EVO governmental grants
Disclosure: A.J.J. Ylinen: None.
932
Association between lipoprotein-associated phospholipase A2 and lower extremity arterial disease in type 2 diabetes
X. Xu, Q. Wei;
Endocrinology, Zhongda Hospital, School of Medicine, Southeast University, Nanjing, China.
Background and aims: Lipoprotein-associated phospholipase A2 (Lp-PLA2) is closely related to the development of cardiovascular disease, and the association between Lp-PLA2 and lower extremity arterial disease (LEAD) in type 2 diabetes mellitus(T2DM) is inconsistent among previous studies. This study aimed to investigate whether the increase in Lp-PLA2 is related to the occurrence of LEAD in T2DM patients.
Materials and methods: A total of 519 T2DM patients (173 LEAD patients and 346 non-LEAD patients) were enrolled. The demographics, medical history, serum lipids, glycosylated hemoglobin (HbA1c), Lp-PLA2, and ankle-brachial index (ABI) were recorded and analyzed.
Results: Diabetes duration , prevalence of hypertension and Lp-PLA2 in the LEAD group were significantly higher than in the non-LEAD group (duration of diabetes :15 [10-20] vs 8 [2 -12] years, prevalence of hypertension :58.38% vs 38.11%, Lp-PLA2 :145[108-178] vs 125 [107-138]ng / mL ,p<0.05); Lp-PLA2 was negatively correlated with ABI (r = -0.308, p <0.001). The results of multivariate logistic regression analysis showed that serum Lp-PLA2 was an independent factor for the development of LEAD: OR: 1.018(1.008-1.029), P = 0.001.
Conclusion: Increased serum Lp-PLA2 levels are associated with LEAD in T2DM patients and are independent risk factors for the occurrence of LEAD.
Disclosure: X. Xu: None.
PS 91 Cardiac function and dysfunction
933
Use of loop diuretics and outcomes in patients with type 2 diabetes: findings from the EMPA-REG OUTCOME trial
P. Pellicori1, D. Fitchett2, M. Kosiborod3, A.P. Ofstad4, L. Seman5, B. Zinman6, I. Zwiener7, C. Wanner8, J.T. George9, S.E. Inzucchi10, J. Testani11, J.G.F. Cleland1;
1Robertson Centre for Biostatistics, University of Glasgow, Glasgow, UK, 2St. Michael's Hospital, Division of Cardiology, University of Toronto, Toronto, Canada, 3St Luke’s Mid America Heart Institute, University of Missouri-Kansas City, Kansas City, USA, 4Boehringer Ingelheim Norway KS, Asker, Norway, 5Boehringer Ingelheim Pharmaceuticals Inc., Ridgefield, USA, 6Lunenfeld-Tanenbaum Research Institute, Mount Sinai Hospital, University of Toronto, Toronto, Canada, 7Boehringer Ingelheim Pharma GmbH & Co KG, Ingelheim, Germany, 8Department of Medicine, Wuerzburg University Clinic, Wuerzburg, Germany, 9Boehringer Ingelheim International GmbH, Ingelheim, Germany, 10Section of Endocrinology, Yale School of Medicine, New Haven, USA, 11Section of Cardiovascular Medicine, Yale School of Medicine, New Haven, USA.
Background and aims: Loop diuretics (LD) are a mainstay of treatment for symptoms and signs of congestion in heart failure (HF). Many people are treated with LD, often for ankle swelling, but not diagnosed with HF. We studied the relationship between HF diagnosis, use of LD, and outcomes in patients with type 2 diabetes mellitus (T2DM) in the EMPA-REG OUTCOME trial.
Materials and methods: In EMPA-REG OUTCOME, patients with T2DM and established cardiovascular (CV) disease were randomised to empagliflozin 10 mg, 25 mg, or placebo (median follow up: 3.1 years). In this post hoc analysis, we defined three subgroups at baseline [i) investigator-reported HF, ii) no diagnosis of HF but taking a LD, and iii) no HF and not taking a LD] and assessed their risk of all-cause or CV mortality, HF hospitalisation (HHF) and CV death or HHF. The effect of empagliflozin vs placebo on these events across subgroups was assessed by Cox regression adjusting for baseline risk factors.
Results: Of 7,020 patients, 706 (10%) had HF at baseline. In the placebo group, compared to those without HF and not taking a LD (referent group), those with HF had higher risk of all-cause mortality (hazard ratio [HR] [95% CI] 2.22 [1.52, 3.24]), CV mortality (2.56 [1.65, 3.97]) and HHF (5.94 [3.71, 9.54]). Those without HF but taking a LD also had an increase in all-cause mortality (HR [95% CI] 1.60 [1.08, 2.36]), CV mortality (1.94 [1.24, 3.04]) and HHF (3.11 [1.85, 5.25]) compared to the referent group. Similar associations in those without HF but taking a LD were found in patients assigned to empagliflozin (all-cause mortality: HR [95% CI] 1.51 [1.06, 2.14]; CV mortality: 1.84 [1.21, 2.79]; HHF: 4.40 [2.78, 6.98]). Empagliflozin reduced the risk of all CV events across all three subgroups compared to placebo (p for subgroup interaction >0.1 for all) (Figure).
Conclusion: In EMPA-REG OUTCOME, patients with T2DM and CV disease who were taking a LD but did not have a diagnosis of HF had risk for CV events intermediate between those diagnosed with HF and those with no HF not taking a LD. Empagliflozin reduced CV risk regardless of HF and LD status.

Clinical Trial Registration Number: NCT01131676
Supported by: Boehringer Ingelheim and Eli Lilly and Company Diabetes Alliance
Disclosure: P. Pellicori: None.
934
Subclinical echocardiographic indices of myocardial dysfunction in South Asian Indians with type 2 diabetes and glucose intolerance
S.K. Vasan1,2, M. Gowri3, V.S. Thomson4, A.G. Anoop4, J. Suresh4, B. Antonisamy3, F. Jebasingh5, F. Karpe1, M. Johnson2, C. Osmond2, C.H.D. Fall2;
1Oxford Centre for Diabetes, Endocrinology and Metabolism, University of Oxford, Oxford, UK, 2MRC Lifecourse Epidemiology Unit, University of Southampton, Southampton, UK, 3Department of Biostatistics, Christian Medical College and Hospital, Vellore, India, 4Department of Cardiology, Christian Medical College and Hospital, Vellore, India, 5Department of Endocrinology, Diabetes and Metabolism, Christian Medical College and Hospital, Vellore, India.
Background and aims: Myocardial dysfunction leading to heart failure in type 2 diabetes (T2D) could be caused by the metabolic effects of diabetes. Echocardiographic studies show impaired left ventricular (LV) function independent of clinically evident heart failure. Early onset of diabetes is well established among Asian Indians; therefore, subclinical LV abnormalities may manifest at a younger age. This study describes LV morphology, systolic and diastolic function and associations with T2D, impaired fasting glucose (IFG)/impaired glucose tolerance (IGT) and healthy controls in a large population-based South Asian cohort.
Materials and methods: Men and women (n=1,601) from the Vellore Birth Cohort, aged between 48-52 years underwent detailed clinical examination, 2-D and Doppler echocardiography using Philips CX50 Compact Xtreme machine. Indices of LV mass, systolic and diastolic function were compared between healthy (n=741), T2D (n=223) and IFG/IGT (n=186) individuals. Participants with hypertension (n=190) and co-existing T2D/IFG/IGT and hypertension (n=186) were excluded from the analysis. Multiple linear regression analysis adjusted for age, sex, height and BMI was used to examine the association between T2D and echocardiographic variables.
Results: The LV geometry in T2D and IFG/IGT was characterized by increased relative wall thickness (median 9.0 vs 8.7) despite similar LV mass indexed to BSA (median 63.3 and 61.6 g/m2) compared with healthy controls (63.8 g/m2). Systolic function in T2D was evidenced by a higher GLS % (-19.08 vs -19.98) which corresponds to a 0.19 SD (95%CI 0.05, 0.33) difference compared with healthy controls (median -20.0), in the presence of similar ejection fractions. In multivariate model, early diastolic impairment was characterized by higher mean left atrial pressure (E/e’ in T2D: β=0.36; 95%CI 0.23, 0.50; p<0.001 and IFG/IGT: β=0.15; 95%CI 0.01, 0.29; p<0.05) in both groups compared with healthy controls signifying early diastolic abnormality.
Conclusion: These results confirm the relative absence of clinically evident heart failure but shows impairment in systolic and diastolic function that is similar between IFG/IGT and T2D compared with normoglycemic controls suggesting that subclinical myocardial dysfunction maybe consequent to factors such as adiposity and insulin resistance that sets in during earlier stages of the trajectory leading to pathogenesis of T2D events.

Clinical Trial Registration Number: ISRCTN 13432279
Supported by: British Heart Foundation, UK
Disclosure: S.K. Vasan: None.
935
Changes in patterns of physical activity and risk of heart failure in newly diagnosed diabetes
I. Jung1, H. Kwon1, S.-E. Park1, K.-D. Han2, E.-J. Rhee1, W.-Y. Lee1;
1Kangbuk Samsung Hospital, Seoul, 2Department of Statistics and Actuarial Science, Soongsil University, Seoul, Republic of Korea.
Background and aims: Previous studies suggest that diabetes is a risk factor for heart failure. Since heart failure results in high levels of health care utilization and increased medical cost, interest in prevention of heart failure has grown globally. No studies have examined the relationship between changes in patterns of physical activity and development of heart failure (HF) after diagnosis of type 2 diabetes (T2DM). We aimed to assess the effect of changes in patterns of physical activity on incident HF especially in newly diagnosed diabetes.
Materials and methods: We examined the general health examination data and claim database of the Korean National Health Insurance Service of 294,528 participants, who had health examinations between 2009 and 2012 and were newly diagnosed with T2DM. The participants were classified into 4 groups according to the changes in physical activity before and after diagnosis of T2DM; (i) continuously physically inactive, (ii) inactive to active, (iii) active to inactive, (iv) continuously physically active. The development of HF were analyzed until 2017 by ICD-10 code I50 and hospitalization.
Results: Compared to those who were continuously physically inactive, those who increased their frequency of physical activity observed a reduced risk for HF [adjusted hazard ratio (aHR) 0.79; 95% confidence interval (CI) 0.66-0.93]. Those who were continuously physically active had the lowest risk for HF [aHR 0.77; 95% CI 0.62-0.96]. Regarding the intensity of physical activity, the crude incidence rates of HF were 1.5, 1.7, and 1.9 per 1,000 person-years in vigorous intensity group, moderate intensity group and walking group, respectively. Compared to those who were physically inactive, those who exercise regularly either vigorous activity or moderate activity had a lower HF risk [aHR 0.79; 95% CI 0.69-0.91].
Conclusion: Among individuals with newly diagnosed T2DM, the risk of HF was reduced in individuals with high levels of physical activity after diagnosis of T2DM. Our results suggest that either increasing or maintaining frequency of physical activity after diagnosis of T2DM may lower the risk of HF.
Disclosure: I. Jung: None.
936
The effect of metformin on GFD-15 levels in patients with heart failure and type 2 diabetes
E. Hoskova, J. Kopecky, J. Veleba, K. Velebova, V. Melenovsky, T. Pelikanova;
IKEM, Prague, Czech Republic.
Background and aims: Metformin (MET) is a first choice drug used in patients with type 2 diabetes (DM). Treatment with MET in patients with heart failure (HF) and DM is associated with better cardiovascular outcomes, but mechanisms of MET-mediated effects are unexplained. Growth differentiation factor 15 (GDF15) is a new biomarker of heart failure. Recent studies also suggests that GDF15 positively affects weight loss and decreases appetite.
Materials and methods: A randomized, double-blind, placebo-controlled, crossover study in a total time of six months testing the effect of 3- month usage of metformin vs placebo. 32 treatment naive diabetic patients (59.1 ± 6.1 years, BMI 32.8 ± 4.6 kg/m²) with chronic heart failure with restricted ejection fraction were randomized to metformin (2 g/day) or to placebo group. After 3 months of treatment the medication was changed and the treatment continued for next 3 months. At the beginning and the end of the intervention period (3 times in total) various cardiometabolic tests were done.
Results: MET reduced HbA1c compared to placebo; p˂0.01. MET treatment significantly increased GDF 15 levels compared to placebo (MET vs. PL: 3213 ± 3250 vs. 1308 ± 709 ng/l; p<0.001). MET-treatment did not change cardiac functions as assessed by echocardiography and spiroergometry.
Conclusion: In patients with heart failure and type 2 diabetes metformin increased GDF15 levels without any deterioration of cardiac function.
Clinical Trial Registration Number: 01690091
Supported by: VZ IKEM: 00023001
Disclosure: E. Hoskova: None.
937
Non-alcoholic steatohepatitis is associated with diabetic cardiomyopathy in type 2 diabetes
D.-H. Cho, J.-O. Chung, D.-J. Chung;
Div. of Endocrinology & Metabolism, Chonnam National University Hospital, Gwangju, Republic of Korea.
Background and aims: Abnormalities in cardiac structure and function in type 2 diabetic patients may develop in the absence of ischemic heart disease. These abnormalities are attributed to diabetic cardiomyopathy. Impaired diastolic heart function has been observed in persons with non-alcoholic fatty liver disease (NAFLD) and/or with type 2 diabetes. We investigated the association between liver fibrosis and left ventricular (LV) diastolic dysfunction in type 2 diabetes.
Materials and methods: We studied 92 patients with type 2 diabetes (51 men; mean age 62 ± 6 years) who had undergone liver ultrasonography and conventional Doppler echocardiography. Presence of NAFLD and/or advanced liver fibrosis was determined by abdominal ultrasonography and NAFLD fibrosis score (NFS). LV diastolic dysfunction was defined according to transmitral peak early to late ventricular filling (E/A) ratio and deceleration time (DT), using echocardiography.
Results: Fifty-four patients (58.7%) had NAFLD. On echocardiography, LVEF was within normal range in both groups, whereas LV mass index (P=0.035) and LA diameter (P=0.021) were significantly greater in the NAFLD patients. The systemic vascular resistance and arterial elasticity were not different. NAFLD patients had lower E/A ratio (P=0.014) and longer DT (P=0.042) than those without steatosis. When NAFLD was stratified by NFS, subjects with advanced liver fibrosis exhibited a higher prevalence of diastolic dysfunction (46.2%, 55.6%, 60.0%; none, simple steatosis, advanced fibrosis, respectively; P for trend = 0.025). In multivariate logistic regression, liver fibrosis was independently associated with diastolic dysfunction (OR=1.46, 95% CI=1.02-2.46, P=0.041) after adjusting for cardiometabolic risk factors.
Conclusion: Our data show that in patients with type 2 diabetes and NAFLD, liver fibrosis was associated with LV diastolic dysfunction and may be an independent risk factor for diastolic dysfunction.
Disclosure: D. Cho: None.
938
Non-invasive assessment of changes in cardiac microvascular function in persons with type 2 diabetes
I.B. Rasmussen1, P. Hasbak2, B. Scholten1, J.C. Laursen1, E.H. Zobel1, L. Holmvang3, R.S. Ripa2, P. Rossing1, A. Kjaer2, T.W. Hansen1;
1Steno Diabetes Center Copenhagen, Gentofte, 2Department of Clinical Physiology, Nuclear Medicine & PET and Cluster for Molecular Imaging, Rigshospitalet, Copenhagen, 33Department of Cardiology, Rigshospitalet, Copenhagen, Denmark.
Background and aims: The myocardial flow reserve (MFR) reflects the function of both large epicardial arteries and the microcirculation. Coronary artery calcium score (CACS) is a measure of coronary atherosclerosis. Cardiac 82Rb PET/CT imaging provides a quantitative measurement of both MFR and CACS and both measures are predictive of future cardiovascular events. Knowledge on changes in MFR and CACS over time is lacking in the general population as well as in type 2 diabetes (T2D).
Materials and methods: In 2013 we recruited 60 persons with T2D and 30 non-diabetic controls; all free of overt cardiovascular disease. All underwent a cardiac 82Rb PET/CT scan and assessment of other cardiovascular risk factor. In 2019, survivors (n=82) were invited for a repeated cardiac 82Rb PET/CT scan after a similar protocol, and 28 with T2D and 20 controls participated.
Results: Median [interquartile range] duration between examinations was 6.2 [6.0-6.3] years. At visit 1, the median duration of T2D was 12.3 [5.2-19.2] years. The Table summarizes the clinical characteristics, MFR and CACS at the 2 examinations and change between visits in persons with T2D and controls separately. MFR was lower in persons with T2D compared to controls but change in MFR was similar between groups (p=0.59) and did not differ between visits within the groups (p≥0.44). CACS was higher in persons with T2D compared to controls at both examinations. CACS progressed between visits within both groups (p≤0.015) and most in persons with T2D (p<0.001). In the total cohort, age was positively associated with progression in CACS (p=0.003), also after adjustment for other risk factors (p=0.005). Baseline urine albumin creatinine ratio and body mass index was also positively associated with progression in CACS (p≤0.017), but not after adjustment for other risk factors (p≥0.06). Progression in CACS was not associated with change in other cardiovascular risk factors between examinations. Change in MFR was not associated with other cardiovascular risk factors at baseline or change in risk factors between examinations. There was no association between change in MFR and CACS (p=0.66).
Conclusion: MFR was lower in T2D compared to controls but did not change in either of the groups when evaluated over 6 years. Progression in CACS was higher in persons with T2D and with higher age. The changes in CACS was not related to changes in MFR.

Clinical Trial Registration Number: H-19024534
Disclosure: I.B. Rasmussen: None.
939
Relationship between resting heart rate and left ventricular dysfunction in a asymptomatic population with type 2 diabetes (DIACAR Study)
I. Banu1, Y. Antakly Hanon2, G. Chatellier1, A. Benhamou1, P. Garcon2, A. Voican1, Y. Moeuf2, C. Oriez1, M. Aroulanda3, P. Abassade2, M. Komajda2, R. Cador2, O. Dupuy1;
1Diabetology, Endocrinology, Nutrition, Saint Joseph Hospital, Paris, 2Cardiology, Saint Joseph Hospital, Paris, 3Epidemiology, Saint Joseph Hospital, Paris, France.
Background and aims: A high resting heart rate (HRF)> 70 / min has been associated with an increased risk of cardiovascular events and may be an early marker of left ventricular dysfunction. The objective of this prospective observational study was to evaluate the relationship between HRF (≥ or <70 bpm) and heart dysfunction in a population of type 2 diabetics with no history of cardiovascular disease and without beta-blocker therapy.
Materials and methods: 174 patients (96 men / 78 Women) aged 56.5 ± 11.1 years, BMI 29.1 ± 5.4 kg / m2 and hospitalized for suboptimally glycemic control (HbA1c: 9.97 ± 2%) benefited from a echocardiography. The overall longitudinal strain (SLG) and the ejection fraction (Simpson biplane method) were measured as well as the heart rate during the examination.
Results: The average HRF was 75.1 ± 12.1bpm and the SLG was -19.9 ± 2.5%. 41 patients had an HRF <70 bpm and 133 ≥ 70bpm. HRF ≥70bpm was associated with higher systolic blood pressure and diastolic blood pressure (124.5 ± 16.1 vs 121 ± 21.4, p = 0.275 and 76.8 ± 8.5 vs 71.8 ± 10.4, p = 0.003 respectively), a tendency to BMI and higher triglycerides (29.7 ± 5.4 vs 27.2 ± 5.2 kg / m 2, p = 0.275) and 1.99 ± 2 vs 1.52 ± 0, 7 mmol / l, p = 0.144 respectively) and a lower Brain natriuretic peptide (BNP) (16.5 ± 15.8 vs 50.3 ± 163, p <0.01). The rate of microangiopathic complications was comparable (44.0% vs 42.0%). The SLG (-19.8 ± 2.5 vs -20.4 ± 2.4%, p = 0.137) as well as the ejection fraction (65.7 ± 7.1 vs 65.3 ± 6.7% , p = 0.75) were identical and normal. The left ventricular mass index (71.03 ± 18.8 vs 75.9 ± 15.9 g / m 2, p = 0.133) and the E / A ratio (0.85 ± 0.3 vs 1.08 ± 0, 4, p <0.001) were lower.
Conclusion: In a population with type 2 diabetes and poor glycemic control without cardiac symptoms, high resting heart rate is not associated with asymptomatic systolic heart dysfunction.
Disclosure: I. Banu: None.
PS 92 Cardiovascular complications in humans through and through
940
Metabolites of the mitochondrial energy production are associated with future cardiovascular morbidity and mortality in type 1 diabetes
N. Tofte1, T. Suvitaival1, K. Trost1, I.M. Mattila1, S. Theilade1, S.A. Winther1, M. Frimodt-Møller1, C. Legido-Quigley1, P. Rossing1,2;
1Steno Diabetes Center Copenhagen, Gentofte, 2University of Copenhagen, Copenhagen, Denmark.
Background and aims: Despite significant therapeutic advances, cardiovascular disease (CVD) remains the leading cause of mortality in persons with diabetes. There is a need for improved understanding of the underlying pathophysiology. The aim of the current study was to identify novel associations between serum metabolites and cardiovascular (CV) morbidity and mortality.
Materials and methods: The study comprised 637 persons with type 1 diabetes, 55% were male and 22% had known previous CVD. Mean (SD) age was 55 (13) years, mean arterial pressure (MAP) was 93 (10) mmHg, carotid-femoral pulse wave velocity (cfPWV) was 10.4 (3.3) m/s, estimated glomerular filtration rate (eGFR) was 81 ± 26 ml/min/1.73m2 and median (IQR) urinary albumin excretion rate (UAER) was 18 (8-65) mg/24hours. Non-targeted serum metabolomics analyses were performed using two-dimensional gas chromatography coupled to time-of-flight mass-spectrometry (GC×GC-ToF-MS). Metabolite levels were log2-transformed. Cross-sectional associations between single metabolites and measures of CVD (previous CVD and cfPWV) were analysed by linear regression. Longitudinal data on CV death and events were obtained from National Danish Health registries over a median (IQR) of 5.2 (4.8-5.7) years and included CV death (n=11), acute myocardial infarction (n=23), stroke (n=22), coronary interventions (n=43), and peripheral vascular interventions (n=32). Metabolomic associations to these events were analysed with Cox proportional hazards models. Hazard ratios (HRs) are presented per doubling of the metabolite level. Adjustments included baseline age, sex, HbA1c, MAP, smoking, body mass index, statin treatment, p-triglycerides, total p-cholesterol, eGFR, UAER, previous CVD and correction for multiple testing by false discovery rate (FDR).
Results: A total of 75 metabolites were included in the analyses. In cross-sectional analyses, 5 metabolites primarily polyols, were associated with previous CVD (PFDR<0.03), however, after adjustment for clinical covariates significance was lost. Seventeen metabolites primarily from amino acids, polyols and carboxylic acids were associated with cfPWV (PFDR<0.05), however, the associations were no longer significant after adjustment for clinical covariates. In longitudinal adjusted analyses, malic acid and succinic acid were significantly associated with a higher risk of coronary interventions (HR 2.2, CI [1.5-3.2], p=0.003 and HR 2.1, CI [1.5-3.0], p=0.003, respectively) and peripheral vascular interventions (HR 2.1, CI [1.5-3.0], p=0.002 and HR 2.0, CI [1.4-2.9], p=0.003). Furthermore, malic acid was significantly associated with a higher risk of CV death (HR 4.3, CI [1.9-9.8], p=0.03). None of the metabolites were associated with acute myocardial infarction or stroke.
Conclusion: Alterations in the serum metabolites malic acid and succinic acid were associated with development of CV morbidity and mortality during follow-up in persons with type 1 diabetes, independent of relevant confounders. Malic acid and succinic acid are components of the tricarboxylic acid cycle. Thus, the present findings indicate alterations in the mitochondrial energy production in persons with diabetes and high risk of CVD.
Supported by: NNF14OC0013659
Disclosure: N. Tofte: None.
941
Cardiovascular events and mortality in patients newly diagnosed with type 2 diabetes with and without multimorbidity: a real world observational study
B. Coles1, F. Zaccardi1, C. Hvid2, M.J. Davies3, K. Khunti1;
1Leicester Real World Evidence Unit, University of Leicester, Leicester, 2Novo Nordisk Region Europe Pharmaceuticals A/S, Copenhagen, Denmark, 3Diabetes Research Centre, Leicester, UK.
Background and aims: People with type 2 diabetes mellitus (T2DM) are at an increased risk for cardiovascular disease (CVD) and mortality compared to people without. The objective of this study was to quantify the risk of a first CVD event (fatal and non-fatal), all-cause and cardiovascular mortality and the association with multimorbidity in a population of English patients with T2DM.
Materials and methods: This retrospective observational study used primary care data from the Clinical Practice Research Datalink, linked to hospital episodes and mortality, for 120,409 adult patients newly diagnosed with T2DM from 2000 to 2018; patients were followed up for a maximum of 19 years until death or December 31, 2018 (median 8.3 years [IQR 4.9-12.1]). Patients were classified according to the level and type of multimorbidity adapted from the Charlson Comorbidity Index on or before diagnosis of T2DM. Using time since T2DM diagnosis as time scale, cause-specific hazard ratios (HRs) were estimated across level of multimorbidity using flexible parametric survival modelling. HRs were adjusted for age at diagnosis of T2DM, sex, ethnicity, deprivation, smoking, alcohol use, and the year of T2DM diagnosis.
Results: At T2DM diagnosis, 66,977 (55.6%) patients had T2DM only, 37,894 (31.5%) had 1 comorbidity, 11,357 (9.4%) had 2 comorbidities, 3,186 (2.6%) had 3 comorbidities, and 995 (0.8%) had 4 or more comorbidities. 100,183 (83.2%) patients had no CVD comorbidities, 16,874 (14.0%) had 1 CVD comorbidity, and 3,352 (2.8%) had 2 or more CVD comorbidities. The adjusted HR and 95% confidence interval (CI) of a first CVD event, all-cause and cardiovascular mortality is shown in the table by the level and type of multimorbidity at T2DM diagnosis.
Conclusion: In patients with T2DM, the level of multimorbidity significantly increased the risk of CVD events and mortality. When multimorbidity included CVD comorbidities, the risk increased even further. These findings support multimorbidity management as a primary component of comprehensive cardiovascular risk prevention in patients with T2DM.

Supported by: This project was funded by Novo Nordisk.
Disclosure: B. Coles: Grants; This project was funded by Novo Nordisk.
942
Sleep apnoea syndrome and macrovascular complications in patients with type 2 diabetes
A. Nishimura1, T. Kasai1,2, K. Matsumura1, S. Kikuno1, K. Nagasawa1, K. Narui1, Y. Mori1;
1Toranomon Hospital, Tokyo, 2Cardiovascular Respiratory Sleep Medicine, Department of Cardiovascular Medicine, Juntendo University Graduate School of Medicine, Tokyo, Japan.
Background and aims: Sleep apnea syndrome (SAS) can induce hyperglycemia, hypertension and oxidative stress. SAS, therefore, may exacerbate diabetic micro and macro-angiopathies. Recent studies including our previous studies showed independent association between SAS and diabetic micro-angiopathies. There are few studies, however, evaluating the association between SAS and macro-angiopathies (cardiovascular disease (CVD)) in patients with type 2 diabetes (T2D).
Materials and methods: We conducted a cross-sectional study in 231 patients with T2D followed in our diabetes clinic, who underwent a home sleep apnea testing (HSAT), brachial-ankle pulse wave velocity (baPWV) measurement and carotid artery intima-media thickness (IMT) measurement. Patients with the history of heart failure, atrial fibrillation, active lung disease or pretreated SDB were excluded. The severity of SAS was determined using respiratory event index (REI). We defined increased baPWV as ≥1400 cm/s because this cutoff value is an independent variable of the risk stratification according to the Framingham score. Increased IMT was defined as IMT >1.1 mm. Logistic regression analysis was performed to clarify the effect of SAS on the prevalence of CVD, increased baPWV or increased IMT adjusted for age, sex, BMI, T2D duration, smoking, mean blood pressure, glycated hemoglobin (HbA1c) and non-HDL cholesterol.
Results: Characteristics of the patients are summarized in the table. Categorical REI was independently associated with the presence of stroke (p=0.019 for linear trend, odds ratio (OR) and 95% confidence interval (CI) for 15≤ REI <30, 1.478 (0.460-4.750); 30≤ REI, 6.472 (1.726-24.264) compared with REI <15) but not with ischemic heart disease (IHD) (p=0.496 for linear trend) or peripheral artery disease (PAD) (p=0.436). There is an independent association between categorical REI and increased baPWV (p=0.031 for linear trend, OR and 95% CI for 15≤ REI <30, 2.368 (1.121-5.002); 30≤ REI, 2.737 (0.953-7.857) compared with REI <15), whereas there is no association between the severity of SAS and increased mean or max IMT. Similarly, categorical 4 % oxygen desaturation index (ODI) (4% ODI <15, 15≤ 4% ODI <30 and 30≤ 4% ODI) was independently associated with stroke (p=0.027) or increased baPWV (p=0.044). There were no associations between CVD and other HSAT parameters including lowest arterial oxyhemoglobin saturation (SaO2) or percentage of time spent with SaO2 <90.
Conclusion: Sleep apnea was independently associated with stroke and increased arterial stiffness. SAS could be a potential risk factor for macrovascular complications in patients with T2D.

Disclosure: A. Nishimura: None.
943
Cardiovascular and pharmacological profile of individuals with type 2 diabetes in primary care in Copenhagen from 2001 to 2015
F. Persson1, M. Kriegbaum2, B. Lind3, M.K. Grand2, V. Siersma2, C.L. Andersen2,4;
1Steno Diabetes Center Copenhagen, Gentofte, 2Department of Public Health, Research Unit for General Practice and Section of General Practice, Copenhagen, 3Department of Clinical Biochemistry, Copenhagen University Hospital Hvidovre, Hvidovre, 4Department of Haematology, Rigshospitalet, Copenhagen University Hospital, Copenhagen, Denmark.
Background and aims: To describe trends in the cardiovascular risk profile and pharmacological treatments of individuals with type 2 diabetes in primary care in the greater Copenhagen area.
Materials and methods: The CopLab database contains more than 176.000.000 paraclinical test results from more than 1.300.000 unique individuals from primary care patients in Copenhagen between 2000 and 2015. Data from more than 65 000 patients (age > 30 years) with diabetes defined as plasma or serum glucose ≥ 11 mmol/l or HbA1c ≥ 48 mmol/mol are available combined with pharmacological data (Danish prescription database) and hospitalization and mortality information (Danish Patient Register and Danish Mortality Register).
Results: For every calendar year between 2001 and 2015 prevalent type 2 diabetes in this primary care population increased (n= 5975 in 2001; 46293 in 2015), an increase probably reflecting increased awareness and testing. During that time mean age increased from 64.0 to 65.8 years, with approximately 45% of the population being female. Mean HbA1c varied between 50-55 mmol/mol, eGFR from 77-82 ml/min/1.73m2 and median urine albumin/creatinine ratio from 25-42 mg/g. Every year mean LDL cholesterol levels decreased in the population, from 3.2 mmol/l to 2.2 mmol/l. Approximately 80% of the population picked up prescriptions for antidiabetic therapy annually, while there was an increase in the use of cardiovascular drugs, from 68% in 2001 to 86% in 2015. About 65% were prescribed lipid-lowering drugs, and the uptake of modern antidiabetic drugs (GLP-1 RA and SGLT2 inhibitors) increased after their introduction to nine and three percent, respectively in 2015. Annual hospitalizations for cardiovascular disease varied between 20-24% while hospitalizations due to hypoglycemia decreased from 1.8% in 2001 to 0.6% in 2015. Mortality rates decreased from 5.2% in 2001 to 4.2% in 2015, with cardiovascular causes showing a decreasing fraction of all-cause mortality, from 23.8% to 13.7%.
Conclusion: Between 2001 and 2015 there was a major increase in the population with identified type 2 diabetes in the primary care sector in Copenhagen. Consistently, about 20% of the population were without antidiabetic treatment, while there was an increase in the use of cardiovascular drugs. Hospitalizations for CVD were stable but were decreasing for hypoglycemia. Interestingly, there was a marked reduction in cardiovascular mortality during the period, probably reflecting increased use of guideline-based multifactorial preventive treatment.
Supported by: Novo Nordisk
Disclosure: F. Persson: Grants; Novo Nordisk.
944
Effect of antidiabetic agents on major adverse cardiovascular events across different age group categories: a meta-analysis of cardiovascular outcome trials
E. Bekiari1, T. Karagiannis1, E. Athanasiadou1, A. Tsapas1,2;
1Clinical Research and Evidence-Based Medicine Unit, Aristotle University of Thessaloniki, Thessaloniki, Greece, 2Harris Manchester College, University of Oxford, Oxford, UK.
Background and aims: The effects of antidiabetic drugs on cardiovascular outcomes across different age group categories of patients with type 2 diabetes have not been fully explored. We assessed the potential effect of age on the incidence of cardiovascular outcomes, based on data from cardiovascular outcome trials.
Materials and methods: We did a fixed-effect meta-analysis of cardiovascular outcome trials of GLP-1 receptor agonists, SGLT2 inhibitors and DPP-4 inhibitors, synthesising data in subgroups by baseline age (<65 years, ≥65 years, <75 years, and ≥75 years). We calculated hazard ratios (HRs) and 95% confidence intervals (CIs) for the primary outcome of 3-component MACE (major adverse cardiovascular events comprising cardiovascular death, stroke or myocardial infarction). Secondary outcomes included cardiovascular mortality and hospitalisation for heart failure.
Results: We included data from 13 randomised, placebo-controlled, cardiovascular outcome trials. In the overall population, GLP-1 receptor agonists and SGLT2 inhibitors reduced MACE by 10-11%, while DPP-4i had a neutral effect (Table). For GLP-1 receptor agonists, in patients <65 years the HR was 0.94 (95% CI 0.87 to 1.02) and in patients ≥65 years it was 0.86 (95% CI 0.80 to 0.92, p for interaction = 0.101). For SGLT2 inhibitors, in patients <65 years the HR was 0.95 (95% CI 0.86 to 1.05) and in patients ≥65 years it was 0.84 (95% CI 0.76 to 0.92, p for interaction = 0.085). For GLP-1 receptor agonists, in patients <75 years the HR for MACE was 0.92 (95% CI 0.85 to 0.99) and in patients ≥75 years it was 0.75 (0.59 to 0.94, p for interaction = 0.056). For SGLT2 inhibitors, in patients <75 years the HR was 0.93 (95% CI 0.85 to 1.02) and in patients ≥75 years it was 0.77 (95% CI 0.60 to 0.99, p for interaction = 0.159). For DPP-4 inhibitors, no differences were evident compared to placebo in any age group categories.
Conclusion: Elderly patients with type 2 diabetes, especially those over 75 years of age, are more likely to benefit from the effects of GLP-1 receptor agonists and SGLT2 inhibitors on cardiovascular outcomes.

Supported by: Greece and the European Social Fund (ESF)
Disclosure: E. Bekiari: None.
945
Contemporary use of diabetes medications with a cardiovascular indication in adults with type 2 diabetes: a secondary analysis of the multinational CAPTURE study
S. Vencio1, A. Alguwaihes2, J.L. Arenas Leon3, F. Bayram4, P. Darmon5, G. Dieuzeide6, N. Hettiarachchige7, T. Hong8, M.S. Kaltoft9, C. Lengyel10, O. Mosenzon11, G.T. Russo12, S. Shirabe13, K. Urbancova14, T. Davis15;
1Instituto de Ciencias Farmaceuticas, Goiás, Brazil, 2King Saud University Medical City, Riyadh, Saudi Arabia, 3Centro de Atención e Investigación Cardiovascular del Potosí, San Luis Potosí, Mexico, 4Erciyes University, Kayseri, Turkey, 5Hôpital de la Conception, Marseille, France, 6Centro de Atención Integral en Diabetes, Endocrinologia y Metabolismo, Chacabuco, Argentina, 7Novo Nordisk A/S, Copenhagen, Denmark, 8Peking University Third Hospital, Beijing, China, 9Novo Nordisk A/S, Søborg, Denmark, 10University of Szeged, Szeged, Hungary, 11Hadassah Medical Center, Hebrew University of Jerusalem, Jerusalem, Israel, 12University of Messina, Messina, Italy, 13H. E. C Science Clinic, Yokohama, Japan, 14Diabetologická Interní Ambulance s.r.o, Ostrava, Czech Republic, 15University of Western Australia, Fremantle Hospital, Fremantle, Australia.
Background and aims: Recent diabetes and cardiology guidelines recommend blood glucose (BG)-lowering medications with proven cardiovascular (CV) benefit in people with type 2 diabetes (T2D) and established CV disease (CVD) or at high/very high CV risk. CAPTURE was a cross-sectional, observational study of CVD prevalence in adults with T2D across 13 countries in 2019. This pre-specified secondary analysis assessed the proportion of adults with T2D and CVD using a BG-lowering medication with an approved CV indication.
Materials and methods: Detailed demographic and clinical data were collected for adults with T2D at a single, routine health visit to primary or specialist care (Dec 2018 - Sept 2019). In this analysis, participants were grouped by CVD status (no CVD, any CVD, atherosclerotic CVD [ASCVD]). BG-lowering medication use was summarised descriptively by approved CV indication status per the current (2020) FDA label and in line with ADA/EASD guidelines, as a glucagon-like peptide-1 receptor agonist (GLP-1 RA: dulaglutide, liraglutide, semaglutide) or sodium-glucose cotransporter-2 inhibitor (SGLT2i: canagliflozin, dapagliflozin, empagliflozin).
Results: In CAPTURE, 96.6% (n=9492/9823) of participants received ≥1 BG-lowering medication: 75.6% used a biguanide, 29.2% a dipeptidyl-peptidase-4 inhibitor, 21.6% a sulphonylurea, 16.0% a SGLT2i, 10.1% a GLP-1 RA and 37.7% an insulin. 21.9% of participants were prescribed a BG-lowering medication with an approved CV indication (Figure), and this was similar irrespective of CVD status: 22.2% (n=1383/6241), 21.5% (n=771/3582) and 21.4% (n=659/3074) in those with no CVD, any CVD and ASCVD, respectively. SGLT2is were more frequently used than GLP-1 RAs regardless of CVD status.
Conclusion: In CAPTURE, fewer than 1 in 4 adults with T2D received a BG-lowering medication with an approved CV indication in 2019, irrespective of CVD status. Future implementation of recent guideline updates may help improve the discrepancy with current recommendations.

Clinical Trial Registration Number: NCT03811288; NCT03786406
Supported by: Novo Nordisk
Disclosure: S. Vencio: Non-financial support; Abstract supported by Novo Nordisk.
946
Exposure-weighted scoring for metabolic syndrome and the risk of myocardial infarction and stroke: a nationwide population-based study
S.-H. Lee1, E. Lee1, K. Han2, Y.-M. Park3, H.-S. Kwon1, K.-H. Yoon1, M. Kim1;
1The Catholic University of Korea, Seoul, Republic of Korea, 2Soongsil University, Seoul, Republic of Korea, 3National Institutes of Health, Research Triangle Park, USA.
Background and aims: Metabolic syndrome (MetS) is associated with an increased risk of cardiovascular disease (CVD). Although its status changes over time, few studies have investigated the relationship between the extent or duration of exposure to MetS and the risk of CVD. We investigated the cumulative effects of MetS and its components on the risk of myocardial infarction (MI) and stroke.
Materials and methods: From the Korean National Health Insurance database, 2,644,851 people who received annual health examinations from 2010 to 2013 were recruited. Exposure-weighted scores for MetS during this 4-year period were calculated in two ways: cumulative number of MetS diagnoses (MetS exposure score, range: 0-4) and the composite of its five components (MetS component exposure score, range: 0-20). The multivariable Cox proportional-hazards model was used to assess CVD risk according to the exposure-weighted scores for MetS.
Results: MetS was identified at least once in 37.6% and persistent MetS in 8.2% of subjects. During the follow-up (median, 4.4 years), 10,522 cases of MI (0.4%) and 10,524 cases of stoke (0.4%) occurred. The risk of MI and stroke increased gradually with increasing exposure scores of MetS and its components (each p for trend<0.0001). The hazard ratio [(HR) (95% CI)] of MI and stroke were 5.27 (4.20-6.62) and 3.90 (3.09-4.93), respectively, in those with a score of 20 compared with those with a MetS component exposure score of 0. People fulfilling only two MetS components out of 20 already had 22% increased risk of MI, and those with three MetS components had 24% increased risk of stroke. These associations were consistent in the subgroup and sensitivity analyses.
Conclusion: A dose-response relationship between the cumulative exposure to metabolic disturbances and incident MI or stroke was evident. Minimal exposure to MetS components was sufficient to increase the risk of CVD significantly. Our data highlight the importance of intensive risk management of metabolic dysfunction for the prevention of CVD.
Supported by: KES
Disclosure: S. Lee: None.
947
Metabolic syndrome in patients with type 2 diabetes and atherosclerotic cardiovascular disease (ASCVD): post hoc analyses of the EMPA-REG OUTCOME trial
J.P. Ferreira1, S. Verma2, F. David3, A.P. Ofstad4, S. Lauer5, I. Zwiener5, J.T. George6, C. Wanner7, B. Zinman8, S.E. Inzucchi9;
1Centre d'Investigations Cliniques Plurithématique Inserm 1433, Université de Lorraine, Nancy, France, 2St Michael’s Hospital, Division of Cardiac Surgery, University of Toronto, Toronto, Canada, 3Division of Cardiology, St Michael's Hospital, University of Toronto, Toronto, Canada, 4Boehringer Ingelheim Norway KS, Asker, Norway, 5Boehringer Ingelheim Pharma GmbH & Co. KG, Ingelheim, Germany, 6Boehringer Ingelheim International GmbH, Ingelheim, Germany, 7Würzburg University Clinic, Würzburg, Germany, 8Lunenfeld-Tanenbaum Research Institute, Mount Sinai Hospital, University of Toronto, Toronto, Canada, 9Yale University School of Medicine, New Haven, USA.
Background and aims: While metabolic syndrome (MS) is associated with increased ASCVD risk, less is known about the relationship of MS with the incidence of heart failure (HF). In EMPA-REG OUTCOME, empagliflozin (EMPA) reduced the risk of CV death by 38% and hospitalization for HF (HHF) by 35% in people with T2D and ASCVD. In this post hoc analysis, we explored the association of MS with cardiorenal and HF outcomes in EMPA-REG OUTCOME, and whether the effect of EMPA was consistent in patients with vs without MS.
Materials and methods: A total of 7020 patients with T2D and ASCVD were treated with EMPA 10mg, or 25mg or placebo [PBO] for median 3.1 years. We used the World Health Organization MS criteria. Since all had T2D, at least two additional criteria were needed to fulfill the MS diagnosis (Fig). We assessed the association between baseline MS and CV death, HHF, CV death/HHF, all-cause mortality, and incident/worsening nephropathy by Cox regression adjusted for baseline risk factors, and analyzed change in metabolic outcomes (HbA1c, weight, systolic BP [SBP]) by mixed effect models.
Results: Among 6985 patients with data available, MS at baseline was present in 5740 (82%). Compared to those without MS, these were more often white, had lower eGFR and HDL cholesterol, and higher BP, BMI, waist circumference, urine-albumin-creatinine ratio, and triglycerides, but similar age and proportion with CHD. Patients with MS had higher risk of all outcomes including CV death (HR vs those without MS in PBO: HR 1.73 [95% CI 1.01, 2.98]), HHF (HR 2.64 [1.22, 5.72]), CV death/HHF (HR 2.12 [1.30, 3.46]), and nephropathy (HR 3.11 [2.17, 4.46]), with similar pattern in EMPA. The beneficial effect of EMPA on all cardiorenal outcomes was consistent regardless of baseline MS (Fig). EMPA reduced HbA1c, weight and SBP similarly across subgroups.
Conclusion: A large proportion of the EMPA-REG OUTCOME population fulfills the criteria for MS. Those with MS have increased risk of CV and HF outcomes and nephropathy. The treatment effect of empagliflozin vs placebo on metabolic as well as cardiorenal and HF outcomes was consistent in those with and without MS.

Clinical Trial Registration Number: NCT01131676
Supported by: Boehringer Ingelheim and Eli Lilly and Company Diabetes Alliance
Disclosure: J.P. Ferreira: Grants; received modest travelling fees from Boehringer Ingelheim.
PS 93 Diabetes and neoplasia
948
Metformin modulates proliferation and inflammatory responses in activated pancreatic stellate cells and macrophages: implication for pancreatic cancer in type 2 diabetes
M. Zhi1, A. Lugea2, S.J. Pandol2, L. Li1;
1Department of Endocrinology, Southeast University, Nanjing, China, 2Department of Medicine, Cedars-Sinai Medical Center, Los Angeles, USA.
Background and aims: Pancreatic stellate cells (PaSC) mediate fibro-inflammatory responses at early stages of pancreatic adenocarcinoma (PDA) development. Obesity and diabetes are independent risk factors for fibrotic disorders and PDA. We reported that obesity and hyperinsulinemia promote PaSC growth, macrophage infiltration and PDA progression in pancreas-specific Kras mutated (KC) mice. Moreover, we and others also reported that patients with type 2 diabetes (T2DM) display peri-islet fibrosis, expansion of activated PaSC, and infiltration of macrophages within islets. Epidemiologic studies indicate that use of the anti-diabetic drug metformin (Met) is associated with reduced risk of PDA in patients with T2DM, and recent work showed that Met reduces PDA incidence in obese KC mice but its effects on PaSC and macrophage fibroinflammatory responses have not been studied in detail.
Materials and methods: We used mouse and human primary PaSC isolated from normal and PDA tissues, and immortalized imPaSC. In addition, we used bone marrow-derived mouse macrophages (Mac) and a Mac cell line (RAW 264.7). Cells were treated with Met (0.1-10 mM) in DMEM/F12 culture media containing 5 mM glucose. Mac were treated with conditioned media from PaSC stimulated with Met.
Results: We found that the mTOR/Akt pathway, which the cellular energy sensor AMP kinase (AMPK) can regulate through multiple inputs, modulates PaSC activation and fibrogenic potential. In PaSC, Met induced in a dose-dependent manner rapid activation of AMPK and inhibition of mTORC1, as indicated by increases in phospho- AMPK (Thr172) and decreases in phospho-P70S6K (Thr389) levels. These effects were independent of glucose media concentrations and sustained for 24-48 h. Met also inhibited levels of yes-associated protein 1 (YAP), a transcriptional regulator that we found modulates cell growth and the transcription in PaSC of pro-fibroinflammatory genes including CTGF, PAI-1, collagen I alpha 1 (COL1A1), MMPs, IL6 and CCL2. Consistently, Met treatment reduced the expression of COL1A1, fibronectin, IL6 and MCP1 as well as HGF, all factors that modulate cancer cell growth. Met also decreased cell proliferation as measured by MTT assay. To gain insights into the effects of PaSC on Mac polarization, we co-cultured PaSC with M1- or M2-polarized Mac. The presence of PaSC decreased Il-1b expression in M1 but increased Arg1 expression in M1 and M2 cells, suggesting that PaSC promote the M2-like phenotype. Compared to M1+PaSC, M2+PaSC secreted more pro-fibrotic factors (e.g. TIMP-1) and less pro-inflammatory factors including TNFα and the chemokines CXCL9, 10 and 11 that positively regulate T cell infiltration in PDA and other cancer types. Interestingly, 24 h treatment with Met decreased cytokine expression (IL1b and MCP1) in M1 Mac and, to a less extent, Arg1 expression in M2 Mac, and these effects were enhanced by treating Mac with conditioned media from PaSC treated with Met.
Conclusion: Our data highlights the chemopreventive potential of Met to target PaSC and macrophages and halt PDA development in type 2 diabetes.
Supported by: NSFC
Disclosure: M. Zhi: None.
949
CA 19-9, miR-200 and GIP in patients with diabetes and pancreatic cancer
P. Škrha1, A. Hořínek2, M. Anděl1, P. Frič3, J. Škrha2;
12nd Department of Internal Medicine, Third Faculty of Medicine and University Hospital Královské Vinohrady, Charles University, Prague, 23rd Department of Internal Medicine, First Faculty of Medicine and General University Hospital, Charles University, Prague, 3Department of Internal Medicine, First Faculty of Medicine and Military University Hospital, Charles University, Prague, Czech Republic.
Background and aims: Nearly 80 % of patients with pancreatic cancer (PAC) have diabetes mellitus or prediabetes (DM). New-onset DM may be the first symptom of PAC in majority of them. We compared CA 19-9, microRNAs and glucose-dependent insulinotropic polypeptide (GIP) as the PAC biomarkers in DM.
Materials and methods: Forty nine patients with and 31 without PAC were enrolled. All had DM confirmed by ADA criteria and PAC was histologically proven. Twenty five healthy persons were evaluated, too. CA 19-9, miR-192, -196, -200 and GIP were measured in the serum samples. Mann-Whitney U test was used for statistical evaluation. The sensitivity, specificity, positive (PPV) and negative (NPV) predictive values were determined in the individual markers and in their combinations.
Results: In DM patients with PAC the serum concentrations of CA 19-9 and miRNAs were elevated (p<0.0003) and GIP decreased (p<0.001) in comparison with both DM patients without PAC and non-DM controls. Sensitivity, specificity, PPV and NPV were calculated (Table). While CA 19-9 was not increased in 16 % of patients with PAC, combination with GIP and miR-200 confirmed diagnosis of PAC in all of them.
Conclusion: Addition of miR-200 and GIP to CA 19-9 caused a 100% negative predictive value meaning that three combined biomarkers could exclude the diagnosis of PAC. Combination of these biomarkers may be used for PAC screening in DM patients.

Supported by: Charles University: Progres Q25
Disclosure: P. Škrha: None.
950
Single-cell RNA sequencing points to altered IL-10 signalling and metabolism in hyperinsulinaemia-driven pancreatic cancer initiation
A. Zhang, T.J.J. de Winter, X. Hu, L. Hong, J.L. Kopp, J.D. Johnson;
University of British Columbia, Vancouver, Canada.
Background and aims: Epidemiological studies have shown hyperinsulinemia is independently associated with increased pancreatic ductal adenocarcinoma (PDAC) morbidity and mortality. We recently showed direct in vivo evidence that hyperinsulinemia promotes PDAC. Using a mouse model of PDAC development (Ptf1aCreER;LSL-KrasG12D) crossed with Ins1+/-;Ins2-/- alleles that result in ~50% reduced fasting insulin, we found a ~50% reduction in pancreatic intraepithelial neoplasia (PanIN) pre-cancerous lesions compared with Ins1+/+;Ins2-/- control mice. Mice have 2 insulin genes, Ins1 and Ins2. Ins1 expression is restricted to β-cells where it contributes to ~1/3 of secreted insulin, while Ins2 is evolutionarily conserved and expressed in pancreas, brain, and thymus. Here, we studied PanIN development in a ‘genetically humanized’ strain of Ptf1aCreER;LSL-KrasG12D mice lacking the rodent specific Ins1 gene, and with varying Ins2 allele dosage.
Materials and methods: We bred Ptf1aCreER;LSL-KrasG12D;Ins1-/-;Ins2+/+ (PK-Ins1-/-;Ins2+/+) control mice and Ptf1aCreER;LSL-KrasG12D;Ins1-/-;Ins2+/- (PK-Ins1-/-;Ins2+/-) experimental mice. They were fed with high-fat diet to induce hyperinsulinemia and their body weight, fasting glucose and insulin levels were tracked. At 57 weeks, we euthanized the mice and performed blind quantitative histopathological analysis of H&E-stained pancreas sections to assess PanIN area. Moreover, we used single-cell RNA sequencing (scRNAseq) on 12 whole pancreata to investigate the pathological mechanisms by which hyperinsulinemia drives PanIN formation and examine cell-type-specific transcriptome changes. We used R packages SoupX to remove background mRNA contamination and Seurat to correct batch effects and analyze differential gene expression
Results: Experimental PK-Ins1-/-;Ins2+/- mice had significantly lower fasting insulin levels (p<0.05), without affecting glucose homeostasis, and lower body weight (p<0.05) compared to control PK-Ins1-/-;Ins2+/+ mice. Blind quantification of (relatively rare) PanIN area showed that PK-Ins1-/-;Ins2+/- mice (n=24) had a relative lower PanIN/total pancreas area when compared with PK-Ins1-/-;Ins2+/+ mice (n=38) but the difference (1.01±0.37% vs 2.48±1.05%, respectively) was not statistically significant (p=0.17). Experimental mice also had a tendency to exhibit reduced acinar to ductal metaplasia area (1.02±0.36% vs 1.92±0.86%, p=0.76). scRNAseq identified 14 cell type clusters including acinar, ductal and fibroblast cells, as well as robust representation of immune cells (B cells, T cells, macrophages, dendritic cells). Between the genotypes, we found genes involved in metabolic pathways like Ucp2, Cebpb were differentially expressed in acinar and B cells, while genes involved in IL-10 signaling (Ccl5, Cxcl1, Cxcl2) were differentially expressed in T cells, macrophages and dendritic cells. There were also fewer tumor-promoting M2 macrophages in mice with reduced circulating insulin.
Conclusion: Our data suggest reducing circulating insulin may affect PanIN development by affecting the metabolic and immune signalings within the acinar cells and immune cells. It may also change the immune cells composition within the PanIN microenvironment. Further work on how hyperinsulinemia affects the crosstalk between immune cells and PanIN cells should provide more insights on how hyperinsulinemia may drive PanIN in our mouse models.
Supported by: CIHR PJT - 168854; CCS INNOV16-1 704225
Disclosure: A. Zhang: None.
951
Statin use and pancreatic cancer from comprehensive meta-analysis of 29 studies
B. Dong1,2, L. Li1,2;
1Department of Endocrinology, ZhongDa Hospital, School of Medicine, Southeast University, Nanjing, 2Institute of Pancreas, Southeast University, Nanjing, China.
Background and aims: Epidemiological data on the associations between statin use and the risk of pancreatic cancer (PC) are inconsistent. We conducted a system review and meta-analysis to explore the associations of statin use with the risk of PC.
Materials and methods: Comprehensive literature search was completed. The pooled odds ratio (OR) and 95% confidence intervals (CIs) were calculated using random-effects model, publication bias assessed using Begg’s and Egger’s tests and heterogeneity by Q-test and I2-value. Subgroup analyses and sensitivity analysis were also conducted.
Results: 29 studies (4 RCTs, 11 C, and 14 CC) involving 505455 participants contributed the meta-analysis. The overall pooled result demonstrated a significant reduced PC risk with statin use (OR 0.80; 95% CI 0.67-0.95; P = 0.0001; I2 = 94%). After sensitivity analysis of removal 2 studies, the overall pooled OR is 0.81 (95% CI, 0.70-0.93; P = 0.0001; I2 = 83.8%). In subgroup analysis, a significant risk reduction was seen in studies performed in the continent of Europe and Asia with OR of 0.84 (95% CI, 0.71-0.98; P =0.004, I2=61%) and 0.64(95% CI, 0.49-0.83; P =0.229, I2=28.9%), respectively. Meanwhile, these effects were confirmed for males but not for females with OR of 0.65(95% CI, 0.47-0.91; P =0.002, I2=75.7%). More importantly, a protective effect was clear for lipophilic statins 0.91 (95% CI, 0.84-0.98; P =0.0001, I2=78.7%), but not for hydrophilic statins.
Conclusion: This present meta-analysis suggests that statins have a protective effect on PC, particularly in the area of Europe and Asia, gender of male and lipophilic statins use. However, further studies are needed to verify these findings.

Supported by: NSFC 81570739 and 81970717 (Ling Li)
Disclosure: B. Dong: Grants; NSFC 81570739 and 81970717 (Ling Li).
952
Excess risk of thyroid cancer in individuals with type 1 diabetes compared to those without diabetes in Finland: nationwide study
S. Mäkimattila1,2, V. Harjutsalo1,3, C. Forsblom1,4, P.-H. Groop4,5;
1Folkhälsan Institute of Genetics, Folkhälsan Research Center, Biomedicum Helsinki, 2Abdominal Center, Endocrinology and Diabetes, University of Helsinki, Helsinki University Hospital, 3National Institute for Health and Welfare, Chronic Disease Prevention Unit, Helsinki, 4Program for Clinical and Molecular Metabolism, Faculty of Medicine, University of Helsinki, 5Abdominal Center, Nephrology, University of Helsinki, Helsinki University Hospital, Finland.
Background and aims: The prevalence and possible excess risk of thyroid cancer in T1D compared to individuals without T1D is poorly known. Therefore, the aim of this study was to assess whether there is excess risk of thyroid cancer in adults with long-term T1D compared to sex- and age-matched control individuals.
Materials and methods: The study included 4758 individuals with T1D participating in the Finnish Diabetic Nephropathy (FinnDiane) Study. For each individual, three nondiabetic control individuals who were matched for sex, age, and place of residence in the year of diagnosis of diabetes in the FinnDiane patient, were selected from the Finnish Public Registry, altogether 12710. The thyroid cancers were identified by linking the data with the Finnish Care Register for Health Care (data available for the years 1970-2015). The types of cancers as well as the presence of metastases were assessed by reviewing the medical records. Cochran-Mantel-Haenszel test was used to compare risks and produce odds ratios (ORs) with 95% confidence intervals (CI) between individuals with T1D and controls.
Results: The median age of the FinnDiane individuals at the end of follow-up in 2015 or death was 51.4 (IQR 42.6-60.1) years. As many as 27 (0.57%) had thyroid cancer, compared to 27 (0.21%) in the control individuals giving rise to an OR of 2.67 (95% CI 1.57-4.56, p=0.0002). The median age at diagnosis of thyroid cancer was 38.5 years (IQR 33.6-46.6) in T1D and 42.8 years (29.4-49.9) in the controls (p=0.83). In the controls, women had higher risk, OR=3.07 (1.30-7.26) while the risk in T1D was no different between the sexes, OR=1.61 (0.74-3.47). Median HbA1c was 8.8% (8.2-9.5) in those with T1D and thyroid cancer, while it was 8.3% (7.4-9.2) in the rest of the FinnDiane individuals (p<0.0001). 16.7% of thyroid cancers were associated with thyroid autoimmunity. The distribution of different types of thyroid cancers was similar in those with T1D and the controls. Most of the cancers were papillary; 81.5% in T1D and 88.9% in the controls, while 14.8% were follicular in T1D and 11.1% in the controls. There was only one medullary cancer in an individual with T1D. Signs of metastases were observed in 2 out of 27 individuals with T1D and in 7 out of 27 in the controls (p=0.12).
Conclusion: The prevalence of thyroid cancer is increased 2.7-fold in individuals with T1D but there was no difference between the sexes. The data also suggest that poor glycemic control is associated with risk of thyroid cancer in T1D.
Disclosure: S. Mäkimattila: None.
953
Metabolic health is the determinant factor for incident colorectal cancer in the obese population: a nationwide population-based cohort study
Y. Cho1, J. Lee2, H. Kim2, J. Kang1, C.-Y. Park3, J.-Y. Park2, W. Lee2, C. Jung2;
1Department of Internal Medicine, Hallym University Sacred Heart Hospital, Anyang, 2Department of Internal Medicine, Asan Medical Center, University of Ulsan College of Medicine, Seoul, 3Department of Internal Medicine, Kangbuk Samsung Hospital, Sungkyunkwan University School of Medicine, Seoul, Republic of Korea.
Background and aims: Obesity has been known as a risk factor for colorectal cancer (CRC). However, regarding CRC risk in subjects with metabolically healthy obesity (MHO), studies have reported conflicting results, while metabolically unhealthy obesity (MUO) consistently conferred significantly increased risk to CRC. Furthermore, metabolic health can change over time. We aimed to evaluate the association between transitions in metabolic health status and incident CRC among obese population.
Materials and methods: This study enrolled 319,397 participants from the Korean National Health Insurance Service-National Sample Cohort. Obesity (BMI ≥25 kg/m2) and non-obesity (BMI <25 kg/m2) were defined according to Asia-Pacific criteria. Metabolic health was defined according to the Adult Treatment Panel III (ATP III) criteria as having none or one of the following risk factors: (1) systolic BP ≥130 mmHg and/or diastolic BP ≥85 mmHg and/or taking antihypertensive treatment; (2) TG ≥150 mg/dL and/or taking antidyslipidemic medications; (3) FPG ≥100 mg/dL and/or taking antidiabetic medications; and (4) HDL-C <40 mg/dL in men and <50 mg/dL in women. Changes in metabolic health status and obesity from the baseline examination in 2009-2010 to the next biannual health examination in 2011-2012 were determined.
Results: The risk of incident CRC in the baseline MHO, metabolically unhealthy non-obesity (MUNO) and MUO group was higher than that in the metabolically healthy non-obesity (MHNO) group (HR, 1.14; 95% CI, 1.04-1.26, HR, 1.19; 95% CI, 1.12-1.27 and HR, 1.21; 95% CI, 1.13-1.29, respectively). However, the stable MHO group were not at increased risk of incident CRC (HR, 0.97; 95% CI, 0.83-1.14), whereas the group that evolved to metabolically unhealthy status (the MHO to MUO group) had higher risk of incident CRC than the stable MHNO group (HR, 1.34; 95% CI, 1.15-1.57). Among the subjects with MUO at baseline, the subgroup who transitioned to healthy status were not at increased risk of incidence CRC (HR, 1.06; 95% CI, 0.91-1.25), whereas the subjects who remained metabolically unhealthy status had higher risk of incident CRC than the stable MHNO group (HR, 1.29, 95% CI, 1.19-1.41).
Conclusion: Maintenance or recovery of metabolic health alleviate the risk of CRC in obese population, while consistent metabolic unhealthiness or transition to metabolic unhealthy phenotype significantly increased the risk of CRC. Clinicians should consider the risk of incident CRC in obese population and particularly counsel them about metabolic fitness.

Disclosure: Y. Cho: None.
PS 94 Contemplating cognitive dysfunction in diabetes
954
The silent occurrence of cerebral small vessel disease in middle-aged patients with type 2 diabetes
F. Fang, R. Cao, Q. Luo, R.-B. Ge, M.-Y. Lai, J.-Y. Yang, M. Kang, Y.-F. Wang;
Shanghai General Hospital, Shanghai, China.
Background and aims: The prevalence of cerebral small vessel disease (SVD) increases in elderly type 2 diabetes mellitus (T2DM) patients, which contributes to cognitive decline. However, little is known about SVD in middle-aged T2DM without cognitive dysfunction. This study aimed to detect SVD in such patients, with a particular focus on the correlation between SVD and diabetic peripheral sensorimotor polyneuropathy (DSP), which are two common diabetes-related microangiopathies involving nervous system.
Materials and methods: Totally 180 subjects (106 with T2DM, 74 controls) without mild cognitive impairment were recruited. Signs of SVD on magnetic resonance image were evaluated. The overall SVD burden was described by a combined score. T2DM patients further underwent detailed DSP evaluation. Regression models were performed to detect the association between the prevalence and severity of SVD and DSP.
Results: The prevalence of lacunes, perivascular spaces, microbleeds, and overall burden were significantly higher in T2DM than in controls. The patients with DSP were associated with an increased risk of cerebral SVD after adjusting for multiple confounders. Moreover, the Toronto Clinical Scoring System values were positively associated with increasingly severe SVD scores, while the bilateral sural sensory nerve conduction velocities were negatively related to the increased SVD scores.
Conclusion: Our findings extend the increasing prevalence of SVD to middle-aged T2DM patients without cognitive dysfunction, suggesting screening and preventive strategies targeting cognition should be considered moving forward, especially for those with DSP.
Supported by: China National Natural Science Foundation (81900813, 81870610)
Disclosure: F. Fang: None.
955
Alzheimer's disease impacts the hypothalamus and induces energetic homeostasis deregulation in mice
L. Zangerolamo, J.F. Vettorazzi, C. Solon, D.F. Engel, G.M. Soares, L.A. Velloso, E.M. Carneiro, A.C. Boschero, H.C.L. Barbosa;
Obesity and Comorbidities Research Center - Biology Institute, University of Campinas, Campinas - SP, Brazil.
Background and aims: Alzheimer’s disease (AD) is associated with peripheral metabolic disorders, including glucose intolerance and insulin resistance. Some studies have shown that amyloid-β protein deposits, a major marker of AD and generally identified in the hippocampus, is also found in the hypothalamus, resulting in hypothalamic deregulation. As hypothalamus has a crucial role in food behavior and in the interaction between the central nervous system and the periphery, hypothalamic dysfunction, that has been largely ignored in the AD field, may have important consequences, predisposing AD patients to develop peripheral metabolic impairment. In this way, we aimed to investigate the effect of AD pathogenesis on hypothalamus, evaluating the energetic homeostasis in an AD mice model.
Materials and methods: 2-months-old C57BL/6 mice were submitted to intracerebroventricular (ICV) injection of 3 mg/kg of streptozotocin (STZ) for induction of AD. Behavioral analysis was performed by the novel object recognition test (NORT). Food intake was monitored during 10 days. Leptin sensitivity was assessed through monitoring food intake for 24 hours after a leptin load. Energy expenditure (EE) and respiratory quotient (RQ) were measured by indirect calorimetry. Body weight (BW) and adiposity were acquired at the time of euthanasia. Protein content of β-amyloid was quantified by Western Blot. Hypothalamic inflammation was assessed by Iba-1 fluorescence. Gene expression of POMC, CART, NPY, AgRP, and UCP1 was evaluated by qPCR. Leptin levels were evaluated in plasma. Data were analyzed by Student’s t-test and were presented as the means ± SEM. The differences between groups were considered statistically significant if P ≤ 0.05.
Results: Mice were submitted to ICV injection of STZ for induction of AD, which was confirmed by increased amyloid oligomer in hippocampus (1,67 ± 0,08 Stz, fold change of Ctl) and reduced preference index (%) in NORT (63,25 ± 2,90 Ctl x 45,80 ± 3,05 Stz). Stz mice presented increase in cumulative 10-days food intake (g) (40,39 ± 0,77 Ctl x 49,32 ± 1,48 Stz) and reduced leptin sensitivity (3,92 ± 0,15 Ctl x 5,28 ± 0,25 Stz, food intake (g)). Stz mice also presented lower EE in light and dark cycle, respectively (151,3 ± 1,26 Ctl x 146,2 ± 1,27 Stz; 199,6 ± 2,52 Ctl x 165,3 ± 3,39 Stz, Kcal/day/kg^0.75), as well as lower RQ in dark cycle (0,90 ± 0,01 Ctl x 0,79 ± 0,01 Stz). An increase in body weight (g) (24,39 ± 0,20 Ctl x 25,72 ± 0,38 Stz), in the perigonadal (0,39 ± 0,04 Ctl x 0,63 ± 0,09 Stz, % BW) and retroperitoneal (0,06 ± 0,01 Ctl x 0,09 ± 0,01 Stz, % BW) fat pads were also observed in Stz mice, as well as an increase in plasma leptin levels (1,04 ± 0,05 Ctl x 1,26 ± 0,07 Stz, ng/mL). Moreover, Stz mice hypothalamus showed an increase in the activated microglia marker Iba-1 fluorescence intensity (6,64 ± 0,39 Ctl x 11,61 ± 1,57 Stz, AU), accompanied by an increase in gene expression of orexigenic neuropeptides (NPY: 1,55 ± 0,29 Stz; AgRP: 1,49 ± 0,15 Stz, fold change of Ctl) and no modulation in anorexigenic peptides (POMC: 0,98 ± 0,13; CART: 1,16 ± 0,04 Stz, fold change of Ctl). We also observed reduced brown adipose tissue weight (BAT) (0,31 ± 0,01 Ctl x 0,26 ± 0,01 Stz, % BW), and lower gene expression of UCP1 (0,24 ± 0,01 Stz, fold change of Ctl) in BAT of Stz mice.
Conclusion: Our results show that AD pathogenesis impairs hypothalamus and deregulates the energetic homeostasis in a mice model of AD.
Supported by: FAPESP: 2015/23729-1 and 2018/20213-2
Disclosure: L. Zangerolamo: None.
956
Chronic hyperglycaemia induces APP phosphorylation at Thr668 and regulates Aβ metabolism via RAS/JNK signalling pathways in vivo and in vitro
S. Tian, R. Huang, S. Wang;
Southeast University, Nanjing, China.
Background and aims: The mechanisms of diabetes-associated cognitive impairment is complex and unclear. The renin-angiotensin system (RAS) is involved in the pathogenesis of Type 2 Diabetes mellitus (T2DM) and Alzheimer’s disease (AD) respectively. This study was designed to investigate the role of RAS in T2DM-associated cognitive impairment.
Materials and methods: 20-week-old male KK-Ay mice were used as T2DM-associated cognitive impairment animal models, and then Captopril, Losartan or PD123319 were respectively applied to interfere with KK-Ay mice. High glucose (HG)-treated HT22 cells were used as cell models, and then Captopril, Losartan, PD123319, or SP600125 were respectively applied to interfere with (HG)-treated HT22 cells. Morris water maze test, dark-avoidance test, HE and Nissl staining, Immunofluorescence, enzyme-linked immunosorbent assay, real-time quantitative PCR, and Western blot were also applied. Angiotensin Converting Enzyme (ACE), Angiotensin II (Ang II), Angiotensin II Type 1 Receptor (AT1R), AT2R, c-Jun N-terminal kinase (JNK), p-JNK, β-amyloid precursor protein (APP), p-APP Thr 668, Amyloid β 40 (Aβ40) and Aβ42 levels were detected.
Results: 20-week-old male KK-Ay mice exhibited obesity, hyperglycemia, neuron morphology damage, Nissl bodies reduction, and impaired learning and memory function. ACE, AngII, AT1R, p-JNK, p-APP Thr 668, Aβ40 and Aβ42 levels were significantly increased in the hippocampus of 20-week-old male KK-Ay mice, as well as in HG-treated HT22 cells. After Captopril or Losartan therapy for 20-week-old male KK-Ay mice, the histopathological changes and learning and memory function were improved, the levels of p-JNK, p-APP Thr 668, Aβ40 and Aβ42 were significantly decreased in the hippocampus of mice. After Captopril, Losartan, or SP600125 intervention for HG-treated HT22 cells, the levels of p-JNK, p-APP Thr 668, Aβ40 and Aβ42 were significantly decreased.
Conclusion: Chronic hyperglycemia can induce APP phosphorylation at Thr668 and regulate Aβ metabolism via activating ACE-Ang II-AT1R Axis/JNK signaling pathways in vivo and in vitro, which mediates T2DM-associated cognitive impairment.

Supported by: NSFC(No. 81870568, SW)
Disclosure: S. Tian: None.
957
Balance capability and smell identification are associated with cognitive function in middle-aged persons with type 2 diabetes
H. Suzuki1, M. Midorikawa1, Y. Suzuki2, H. Sato3, K. Nemoto3, K. Yamauchi4, Y. Sugano1, Y. Osaki1, H. Iwasaki1, M. Sekiya1, N. Yahagi1, Y. Hada2, T. Arai3, H. Shimano1;
1Department of Internal Medicine, University of Tsukuba, Tsukuba-shi, 2Department of Rehabilitation Medicine, University of Tsukuba Hospital, Tsukuba-shi, 3Department of Psychiatry, University of Tsukuba, Tsukuba-shi, 4Department of Laboratory Medicine, University of Tsukuba, Tsukuba-shi, Japan.
Background and aims: Impaired cognitive function reportedly appears in middle-aged persons with type 2 diabetes. Reduced balance capability and olfactory dysfunction are associated with dementia. We aimed to investigate the association with cognitive function and balance or smell identification in middle-aged persons with type 2 diabetes (T2D) and healthy controls (HC).
Materials and methods: Cognitive function was assessed using the Japanese version of the Montreal Cognitive Assessment (MoCA-J), trail making test (TMT), Wisconsin card sorting test (WCST), Quick Inventory of Depressive Symptomatology (QIDS-J) and Starkstein Apathy Scale (SAS). Balance capability and smell identification were evaluated by index of postural stability (IPS), which was assessed using stabilometer and a Japanese smell identification test (Open Essence), respectively.
Results: This was a cross-sectional study of 138 middle-aged individuals (40-64 years), 57 in the T2D group and 81 in the HC group (54 ± 7 years and 52 ± 6 years, respectively; P = 0.620). The T2D group had significantly lower female proportion and educational attainment than the HC group. IPS and smell identification, cognitive functions were significantly lower in the T2D group compared with those in the HC group (Table 1). The T2D group was significantly more depressed and less motivated than the HC group. Open Essence was significantly correlated with MoCA-J (ρ = 0.318, P < 0.016) and TMT-B (ρ = -0.360, P = 0.006) in T2D group. In the T2D group, modified IPS (mIPS) were significantly correlated with MoCA-J (ρ = 0.386, P < 0.003), TMT-B (ρ = -0.401, P = 0.002), categories achieved (CA) in WCST (ρ = 0.361, P = 0.006) or perseverative errors in Nelson (PEN) in WCST (ρ = -0.397, P = 0.002) group, whereas neither QIDS-J nor SAS had a significant correlation with IPS or Open Essence. In all participants, logistic regression adjusted for age, sex, educational attainment, and presence of diabetes revealed the following independent predictors for cognitive decline: mIPS and having T2D for MoCA-J; IPS or mIPS for TMT-A; IPS for TMT-B; IPS or mIPS for CA; having T2D for PEN.
Conclusion: Cognitive function and depressive symptoms in middle-aged persons with T2D are significantly impaired compared with those in HC. Balance capability and smell identification are associated with executive function and could be useful predictors for cognitive decline in middle-aged adults.

Supported by: KAKENHI 18K18443
Disclosure: H. Suzuki: Grants; KAKENHI.
958
Lower free triiodothyronine is a risk factor of mild cognitive impairment in type 2 diabetes patients with euthyroidism
H. Zhang, W. Zhu, S. Wang;
Affiliated Zhongda Hospital of Southeast University, Nanjing, China.
Background and aims: As the most important active ingredient of thyroid hormones (THs), Free triiodothyronine (FT3) is related to cognition and insulin resistance (IR). In this present study, we aim to examine the role of FT3 in mild cognitive impairment (MCI) of patients with type 2 diabetes mellitus (T2DM).
Materials and methods: 255 T2DM patients with normal thyroid function were recruited and divided into MCI group and normal cognition group according to MoCA. Demographic characteristics, clinical parameters, and neuropsychological tests were assessed. Correlation and logistic regression analysis were preformed to explore the association between FT3 and cognitive function adjusted with or without HOMA-IR and HbA1c associated with IR and hyperglycemia respectively.
Results: Compared with 147 normal cognition patients, 108 MCI patients exhibited lower FT3 as well as higher HbA1c and HOMA-IR (p = 0.004, 0.012 and 0.033, respectively). Digit Span Test (DST), Verbal Fluency Test (VFT) and Trail Making Test B (TMTB) scores are associated with executive function, while LMT is related to scene memory. Serum FT3 level was positively correlated with MoCA, DST, VFT, and LMT (R = 0.116, 0.132, 0.030, and 0.197; P = 0.009, 0.037, 0.000, and 0.002, respectively), but negatively associated with Trail Making Test B scores (R = 0.182; p = 0.007). Furthermore, there are negative associations of FT3 to HbA1c and HOMO-IR (R = 0.292, and 0.219; P = 0.000, and 0.001, respectively). Multivariable logistic regression showed that decreased FT3, as well as increased HbA1c and HOMO-IR levels were the independent factors for MCI in T2DM patients after adjusted for age, gender, education, body mass index, diabetes duration, hypertension duration, smoking history (OR= 1.416, 0.876, and 0.329; P= 0.011, 0.028, and 0.019, respectively). However, FT3 is not an independent factor for MCI in T2DM patients after HOMO-IR and HbA1c were added to adjusted factors (OR= 1.265; P= 0.101).
Conclusion: Lower FT3 level is an independent factor for diabetic MCI, especially for executive function and scene memory. Further study is necessary to confirm whether FT3 is involved in early cognitive impairment of diabetes induced by IR or hyperglycemia.
Clinical Trial Registration Number: ChiCTR-OCC-15006060
Supported by: NSFC(No.81570732, SW and No.81870568, SW)
Disclosure: H. Zhang: None.
PS 95 Endothelial cell, circulation and the heart
959
Weight loss-induced improvements of endothelial function and cardiovascular risk factors are maintained with exercise, liraglutide or the combination
J.R. Lundgren1, E.M. Bladbjerg2, C. Janus1, L. Gliemann3, L.M. Olsen1, C.R. Juhl1, S.B.K. Jensen1, R. Thirumathyam4, B.M. Stallknecht1, J.J. Holst1, J.D. Hove5, S. Madsbad4, C. Antoinades6, S.S. Torekov1;
1Department of Biomedical Sciences, University of Copenhagen, Copenhagen, Denmark, 2Department of Clinical Biochemistry, University of Southern Denmark, Esbjerg, Denmark, 3Department of Nutrition, Exercise and Sports (NEXS), University of Copenhagen, Copenhagen, Denmark, 4Department of Endocrinology, Hvidovre Hospital, Copenhagen, Denmark, 5Department of Cardiology, Hvidovre Hospital, Copenhagen, Denmark, 6Division of Cardiovascular Medicine, John Radcliffe Hospital, Oxford, UK.
Background and aims: The endothelium has important functions including control of vascular tone and provides an anti-thrombogenic and anti-inflammatory surface. Obesity and type 2 diabetes are associated with endothelial dysfunction, which may promote manifest CVD. Our aim was to investigate changes in endothelial function and other cardiovascular risk factors after an initial diet-induced weight loss followed by 1 year of treatment with glucagon-like peptide-1 (GLP-1) receptor agonist liraglutide and/or exercise.
Materials and methods: 215 individuals with obesity (BMI 36.6 kg/m2, age 42 years) were included in this double-blinded trial with an initial 8-week very low-calorie diet (VLCD) (800 kcal/day) and subsequent randomization (n = 195) to either placebo (PLA), placebo + exercise (150 min/week) (EX), liraglutide 3.0 mg/day (LIRA) or liraglutide 3.0 mg/day + exercise (150 min/week) (LIRA/EX) for 1 year.
Results: Results are shown for participants not using antihypertensive medication in the intention-to-treat population (n = 142). The VLCD significantly (p < 0.05, paired t-test) reduced weight (-13.1 kg), systolic and diastolic BP (-8.8 and -6.8 mmHg, respectively), heart rate (-3.7 min-1), tissue-type plasminogen activator (t-PA) (-1.85 ng/ml), and von Willebrand factor (vWF) (-4.91 %), and increased flow-mediated dilation (FMD) (0.92 %). Changes during the subsequent 1-year treatment phase were analyzed with a mixed model. LIRA/EX further decreased weight (-3.4 kg, p = 0.008), while EX and LIRA maintained weight (1.7 and -1.3 kg, respectively, p > 0.05), and PLA increased weight (5.9 kg, p < 0.001). Systolic and diastolic BP increased in PLA and less so in EX but decreased in LIRA and LIRA/EX (no group differences). Heart rate increased significantly in LIRA (3.7 min-1, p = 0.013) with a significant difference to PLA (-0.7 min-1, p > 0.05) and EX (-1.6 min-1, p > 0.05) but not to LIRA/EX (0.8 min-1, p > 0.05). Change in t-PA (all groups combined) was positively correlated with change in body weight (r = 0.39, p < 0.0001) and t-PA was further reduced in LIRA/EX (-0.96 ng/ml, p = 0.086) which was significant compared to PLA (0.73 ng/ml, p > 0.05) and LIRA (0.86 ng/ml, p > 0.05).
Conclusion: A 13 kg weight loss over 8 weeks improved the endothelium by increasing FMD and reducing t-PA and vWF, which are all considered markers of endothelial dysfunction. Blood pressure and heart rate were also reduced. If no treatment (placebo) followed the weight loss, a trend to relapse was seen in most parameters. However, with exercise, liraglutide or their combination after the weight loss, many of the parameters were maintained or even further improved, indicating reduced risk of CVD and a healthier weight loss maintenance. Further, when exercise was added to liraglutide treatment there was a smaller increase in heart rate as opposed to liraglutide treatment alone.
Clinical Trial Registration Number: NCT 04122716
Supported by: NNF Excellence grant, NNF CBMR grant, NNF Immunometabolism grant, Helsefonden
Disclosure: J.R. Lundgren: None.
960
Low-molecular weight fluorophores in type 2 diabetes: associations with diabetes complications and effects of fenofibrate in the FIELD study
D. Chen1,2, A.S. Januszewski1,3, R.S. Scott4, R.L. O'Connell1, N.R. Aryal1, D.R. Sullivan5, G.F. Watts6,7, M.-R. Taskinen8,9, P.J. Barter10, J.D. Best3, J. Simes1,5, A.C. Keech1,5, A.J. Jenkins1,3;
1University of Sydney, Camperdown, Australia, 2Monash University, Melbourne, Australia, 3University of Melbourne, Fitzroy, Australia, 4Christchurch Hospital, Christchurch, New Zealand, 5Royal Price Alfred Hospital, Camperdown, Australia, 6University of Western Australia, Perth, Australia, 7Department of Cardiology, Royal Perth Hospital, Perth, Australia, 8University of Helsinki, Helsinki, Finland, 9University Central Hospital, Helsinki, Finland, 10University of New South Wales, Sydney, Australia.
Background and aims: Because risk of chronic diabetes complications persists after controlling traditional risk factors, there is a need for novel biomarkers for risk stratification and as therapeutic targets. Advanced glycation end-products (AGEs) are implicated in vascular damage and may be a novel biomarker. Non-specific fluorescence spectroscopy can detect circulating low-molecular weight (LMW)-AGEs, also known as LMW-fluorophores (LMW-F). This study in adults with type 2 diabetes assessed whether plasma LMW-F levels: (i) are associated with traditional and novel vascular risk factors; (ii) predict chronic complications; (iii) are altered by fenofibrate.
Materials and methods: Plasma LMW-F were quantified by fluorescence spectroscopy at baseline (n=9769), after 6-weeks of fenofibrate (n=9724) treatment (active run-in phase) and 1-year (n=1994) following randomisation to fenofibrate or placebo. Associations of LMW-F with existent and new macrovascular and microvascular complications and the effects of fenofibrate were determined.
Results: Median (IQR) baseline LMW-F was 3.2 AU/mL (2.5-4.1 AU/mL). LMW-F correlated positively with age, HbA1c, pulse pressure, renal dysfunction and inflammation and negatively with uric acid, BMI, oxidative stress and leptin, albeit weakly (r=0.04-0.16, all p<0.01). Independent determinants of LMW-F were smoking status, prior CVD or microvascular complications, Caucasian ethnicity, eGFR, uric acid, cystatin C, diastolic BP, HOMA2-IR, HbA1c and diabetes duration (all p≤0.01). Adjusted LMW-F levels were higher in people with vs. without baseline CVD (geometric mean (95% CI): 3.75 (3.64-3.87) vs. 3.42 (3.34-3.49) AU/mL, p<0.001) and microvascular complications (3.61 (3.52-3.71) vs. 3.43 (3.35-3.51) AU/ml, p<0.001). Tertiles of baseline LMW-F levels were associated with occurrence of on-trial macrovascular and microvascular complications before (both trend p<0.001) but not after adjustment for covariates. Six weeks fenofibrate treatment increased LMW-F levels by 21% (p<0.001).
Conclusion: LMW-F levels correlate with many vascular risk factors and with established macrovascular or microvascular disease. LMW-F predict subsequent macrovascular and microvascular events, but associations are not independent of traditional risk factors. Fenofibrate increased LMW-F.
Clinical Trial Registration Number: ISRCTN64783481
Disclosure: D. Chen: None.
961
Sedentary behaviour and physical activity are associated with endothelial dysfunction and low-grade inflammation: the Maastricht Study
E.J. Vandercappellen1, A. Koster2, H.H.C. Savelberg3, S.J.P. Eussen4, P.C. Dagnelie1, N.C. Schaper1, M.T. Schram1, C.J.H. van der Kallen1, M.M.J. van Greevenbroek1, A. Wesselius5, C.D.A. Stehouwer1, R.M.A. Henry1;
1Internal Medicine, Maastricht University Medical Centre, Maastricht, 2Social Medicine, Maastricht University, Maastricht, 3Dept. of Nutrition and Movement Science, Maastricht University, Maastricht, 4Dept. of Epidemiology, Maastricht University, Maastricht, 5Dept. of Complex Genetics and Epidemiology, Maastricht University, Maastricht, Netherlands.
Background and aims: Especially in individuals with type 2 diabetes, microvascular dysfunction (MVD) is an important mechanism in the pathology of different diseases. Both low-grade inflammation and endothelial dysfunction play an important role in the development of MVD. So we used endothelial dysfunction and low-grade inflammation as markers for MVD. Physical activity (PA) can have an effect on endothelial dysfunction and low-grade inflammation, however, the effect of sedentary behavior is still unknown. In this study we aim to examine the associations of objectively measured physical activity and sedentary time with endothelial dysfunction and low-grade inflammation.
Materials and methods: We used cross-sectional data from The Maastricht Study (n=2338; mean age: 61.0 years; 51.5% men; normal glucose metabolism (NGM) 55.9%, prediabetes 15.4% and type 2 diabetes (T2D) 28.7%). Participants wore an activPAL3® 24h/day for 8 days and we calculated the total amount of PA (hours/day), light-intensity PA (hours/day), moderate-to-vigorous PA (hours/day), vigorous PA (hours/day) and, and sedentary time during wake time (hours/day). We calculated an average Z-score for endothelial dysfunction (including sICAM-1, sVCAM-1, sE-selectin, Von Willebrand Factor) and low-grade inflammation (including SAA, IL6, IL8, TNFalpha, sICAM-1, hsCRP). Linear regression (unstandardized B (95%CI)) analyses were performed and adjusted for age, sex, glucose metabolism status, smoking, alcohol consumption, Dutch healthy diet index, BMI, level of education, CVD history, mobility limitation, triglycerides, total cholesterol-to-HDL cholesterol, lipid-modifying medication, and anti-hypertensive medication.
Results: After full adjustment, the amount of light, moderate-to-vigorous and vigorous PA was associated with statistically significantly lower endothelial dysfunction (total PA: -0.15 (-0.21;-0.09); light PA: -0.04 (-0.07;-0.01), moderate-to-vigorous PA -0.19 (-0.28;-0.10) and, vigorous PA: -0.25 (-0.48;-0.01)). A similar association was found with low-grade inflammation (total PA: -0.16 (-0.22;-0.11); light PA: -0.05 (-0.07;-0.02), moderate-to-vigorous PA -0.24 (-0.33;-0.16), vigorous PA: -0.39 (-0.61;-0.16)). Sedentary time was statistically significantly associated with endothelial dysfunction (0.03 (0.01;0.06)) and low-grade inflammation (0.04 (0.01;0.06)) independent of moderate-to-vigorous PA. Similar associations were found in those with and without type 2 diabetes.
Conclusion: Sedentary time and physical activity in all intensities were significantly associated with endothelial dysfunction and low-grade inflammation. Our data suggest that even increasing light-intensity PA or reducing sedentary time may already have a positive influence on endothelial dysfunction and low-grade inflammation and eventually on MVD.
Supported by: ERDF, PoL, SDW, PSID, CVC, CARIM, CAPHRI, NUTRIM, SA, HFL, JCBV, NNF, SAN, MD, EFSD/AstraZeneca
Disclosure: E.J. Vandercappellen: None.
962
A mixed nutrient preload attenuates glucose-induced endothelial dysfunction in individuals with abnormal glucose tolerance
L. Nesti1, A. Mengozzi1, S. Frascerra1, S. Baldi1, D. Tricò2, A. Natali1;
1Dipartimento di Medicina Clinica e Sperimentale, Università di Pisa, Pisa, 2Dipartimento di Chirurgia, Patologia Medica e Molecolare e Medicina di dell'Area Critica, Università di Pisa, Pisa, Italy.
Background and aims: Postprandial hyperglycemia occurs early in the diabetic and prediabetic states, wherein it appears to be an important independent risk factor for cardiovascular disease and all-cause mortality. This excess cardiovascular risk may be partly explained by the impairment in endothelial function that typically follows an acute increase in plasma glucose levels. Recently, nutritional interventions focused on the sequence of macronutrient consumption within the meal have been proposed to normalize postprandial glycemia in subjects with abnormal glucose tolerance (AGT). However, the effect of such intervention on the endothelial function is unknown. We therefore aimed to establish whether and by which mechanisms a protein- and fat-rich nutrients preload attenuates glucose-induced endothelial dysfunction in individuals with AGT.
Materials and methods: In this randomized controlled trial, the endothelial function was assessed by the reactive hyperemia index (RHI) using an EndoPAT® device at fasting, 60 min and 120 min during two 75g oral glucose tolerance tests (OGTTs) preceded by either a mixed virtually glucose-freenutrient preload (one boiled egg, 50g parmesan cheese, 300ml water, consisting of 23 g protein, 17 g fat and 2 g carbohydrate, to a total of ~1,000 kJ) or a water preload (500ml water; control OGTT) in a randomized fashion. A total of 30 volunteers were recruited, including 22 patients with impaired glucose tolerance (IGT, n=13) or diet-controlled type 2 diabetes (T2D, n=9), who were collectively classified as AGT. A group of 8 subjects with normal glucose tolerance underwent the control OGTT and was used as reference. Plasma glucose, insulin, glucagon-like peptide-1 (GLP-1), glucose-dependent insulinotropic polypeptide (GIP), glucagon, free fatty acids (FFA), arginine, branched chain amino acid (BCAA), and total amino acids (AA) were measured during the tests.
Results: Fasting RHI was not different between NGT and AGT subjects. The RHI negatively correlated with fasting plasma glucose (r=-0.29, p=0.04). During the control OGTT, the RHI decreased by 9% (p=0.02) and its deterioration was associated with the time-course of plasma glucose levels (β=-0.03, p=0.015). In individuals with AGT, the nutrient preload attenuated the decline in the RHI (p=0.04) and markedly reduced postprandial glycemia (p=0.0003) compared with the control OGTT. The beneficial effect of the nutrient preload on the RHI was proportional to the improvement in glucose tolerance (r=0.52, p=0.02). Furthermore, it was associated with the increase in plasma GLP-1 (r=0.47, p=0.04) and arginine levels (r=0.64, p=0.04).
Conclusion: A mixed protein- and fat-rich nutrient preload attenuates glucose-induced endothelial dysfunction in individuals with AGT by lowering plasma glucose excursions and by increasing GLP-1 and arginine levels, both of which are known upregulators of the nitric oxide vasodilator system.
Clinical Trial Registration Number: NCT02342834
Disclosure: L. Nesti: None.
963
Tenascin-c deficiency improves cardiac and vascular function in diabetic mice
Z. Arnold1, F. Nagel1, L.P. Szabo1, E. Acar1, I. Aykac1, A.J. Fee2,3, A. Josvai4, S. Hallström5, V.E. Tretter6, F. Balogh3, M. Szekeres3,7, G. Nadasy3, B.K. Podesser1, A. Kiss1;
1Ludwig Boltzmann Institute for Cardiovascular Research, Center for Biomedical Research, Vienna, Austria, 2Kansas University, Kansas, USA, 3Dep. of Physiology, Semmelweis University, Budapest, Hungary, 4Dep. of Neurosurgery, Medical Centre Hungarian Defence Forces, Budapest, Hungary, 5Division of Physiological Chemistry, Otto Loewi Research Center, Medical University Graz, Graz, Austria, 6Department of Anesthesiology, Medical University of Vienna, Vienna, Austria, 7Dep. of Morphology and Physiology, Semmelweis University, Budapest, Hungary.
Background and aims: Diabetic cardiomyopathy (CMP) is known for cardiac and vascular dysfunction in lack of structural heart disease. Recently, Tenascin-C (TNC) upregulation in the myocardium and serum has been linked to worse outcome in diabetes and heart failure. However, the role of TNC in the development of diabetic CMP is not known. We aimed to study the function of TNC in the progression of cardiovascular dysfunction in diabetes.
Materials and methods: AJ and TNC-KO adult male mice were repeatedly injected with streptozotocin (50mg/kg) to induce diabetes. Cardiac function was measured by echocardiography at baseline and at 18-20 weeks. Vascular endothelial function was assessed by wire myography in isolated thoracic aorta segments. Cardiac fibrosis and coronary network geometry were assessed. In addition, the effects of purified human TNC (phTNC) on isolated working rat hearts were evaluated. To clarify the source of TNC, a cellular model of diabetic CMP using human induced pluripotent stem cell-derived cardiomyocytes (hiPSC-CMs) was established. Moreover, human ventricular cardiac fibroblasts (HCF) were cultured, then starvated and treated with TGF-β; phTNC (10μg/ml) and TLR4 inhibitor in combination with TNC and subsequently mRNA expression of α-SMA, TNC, Col-1, Col-3 and ACE1 were assessed by RT-qPCR. Finally, human umbilical vein endothelial cells (HUVEC) were treated either with phTNC (10μg/ml) or combination with TLR-4 inhibitor (TAK-242, 50nM) and analysed the expression of NADPH oxidase 1 and 4 (NOX1, NOX4), and interleukin-6 (IL-6).
Results: TNC deficiency was accompanied by preserved ejection fraction and endothelium-dependent relaxation (p<0.05 and p<0.001, respectively). Histology revealed less cardiac fibrosis in TNC-KO diabetic animals than in the AJ diabetic group (p<0.01). Larger coronaries showed multiple branching distally and thicker walls in diabetic animals, while TNC-KO diabetic mice had richer branching systems, suggesting better left ventricular (LV) perfusion. In addition, cumulative dosage of phTN-C (80 ng/ml) resulted in a significant reduction in cardiac output (p<0.01) and LV systolic pressure (p<0.05) in isolated rat hearts. HiPSC-CMs under diabetic conditions did not upregulate TNC. In contrast, TGF-β treatment upregulated TNC expression in HCF (p<0.01). Notably, HCF exposed to phTNC promoted both α-SMA and ACE1 mRNA expression (p<0.05). In addition, HUVEC incubated with phTNC showed increased expression of IL-6 and oxidative stress-related markers (NOX4) while TLR-4 inhibitor pre-treatment markedly reversed these changes.
Conclusion: TNC creates a fibrosis and oxidative stress facilitating environment, which leads to cardiomyocyte and endothelial cell dysfunction. Thus, TNC may be a critical mediator as well as a potential therapeutical target in the progression of cardiovascular dysfunction in diabetes.
Supported by: Ludwig Boltzmann Society REM 2017-20
Disclosure: Z. Arnold: Grants; Ludwig Boltzmann Society REM 2017-20.
964
Cardiac and endocrine responses to hyperinsulinaemic hypoglycaemia in healthy and diabetic Göttingen minipigs
M.L. Skøttrup1, A. Vegge2, G.K. Povlsen2, R. Slaaby2, J. Kildegaard2, U. Pedersen-Bjergaard3, L.H. Olsen1;
1Faculty of Health and Medical Sciences, University of Copenhagen, Frederiksberg, 2Global Drug Discovery, Novo Nordisk A/S, Måløv, 3Department of Endocrinology and Nephrology, Nordsjællands Hospital Hillerød, Hillerød, Denmark.
Background and aims: Hypoglycaemia is a common, and potentially serious, side effect of insulin treatment in both type 1 and 2 diabetes and has been associated with increased risk of fatal arrhythmias and cardiovascular death. The aim of this study was to investigate healthy and diabetic Göttingen minipigs as a large animal model to study the endocrine response and electrocardiographic changes during a hyperinsulinaemic, hypoglycaemic clamp.
Materials and methods: Healthy (CON, n=5) and streptozotocin-induced diabetic (DIA, n=5), female, adult Göttingen minipigs were subjected to a hyperinsulinaemic, hypoglycaemic clamp with 16 pmol/kg/min human insulin and target plasma glucose (PG) at 3.5 mM for three hours (normoglycaemia) followed by 0.8-1.0 mM PG for two hours (hypoglycaemia), and finally two hours of normoglycaemia, using individual glucose infusion rate adjustment to achieve target PG throughout the clamp. Pigs were awake and freely moving during the clamp. Continuous Holter ECG was recorded. Ventricular premature beats (VPC), supraventricular premature beats (SVP) and/or 2nd degree atrioventricular blocks (AV blocks) were registered during hypo- and normoglycaemia. Plasma glucose, glucagon and epinephrine were measured throughout the experiment.
Results: PG decreased during hypoglycaemia in both CON and DIA, with NADIR median 1.0 mM (range 0.4-1.7) and 0.9 (0.2-1.9), compared to baseline (CON: 3.7 (3.5-4.2), DIA: 9.3 (5.7-10.3), P<0.01 for all comparisons). Plasma glucagon increased at 30 (CON: 94.4 (67.3-126.0) pM, DIA: 46.3 (5.5-78.4)) and 60 minutes (CON: 61.7 (35.0-75.2), DIA: 32.6 (12.2-46.6)) of hypoglycaemia in both groups (P<0.05 for all comparisons). Interestingly, the DIA group had an attenuated glucagon response compared to CON (P=0.02). Plasma epinephrine increased during hypoglycaemia, with no group effect, at 30 (CON+DIA: 3.2 (0.13-12.40) ng/mL), 60 (CON+DIA: 5.13 (0.70-27.60)) and 120 minutes (CON+DIA: 4.08 (1.31-10.60)) of hypoglycaemia in both groups (P<0.001 for all comparisons). Epinephrine levels after two hours of normoglycaemia before (0.1 (0.02-0.42), P=0.45) and after hypoglycaemia (0.24 (0.02-0.73), P=0.56) did not differ from baseline. The arrhythmia incidence did not differ between CON and DIA during normo- and hypoglycaemia. Considering CON and DIA together, over-all arrhythmia incidence rate was significantly increased during hypoglycaemia compared to preceding normoglycaemia (see table).
Conclusion: Our results demonstrate a human-like counter-regulatory hormonal and arrhythmic cardiac response to hypoglycaemia in both healthy and diabetic Göttingen minipigs, which may serve as a large animal model to study such responses.

Supported by: This PhD project is a part of the research center LIFEPHARM at UCPH supported by Novo Nordisk A/S
Disclosure: M.L. Skøttrup: Other; The PhD project is a part of the research center LIFEPHARM at University of Copenhagen supported by Novo Nordisk A/S.
965
Oscillating glucose and constant high glucose induce different damage on human stenotic derived aortic valve endothelial cells
P. Poggio1, V. Alfieri1, V. Loi2, V. Myasoedova1, P. Songia1, D. Moschetta1,2, I. Massaiu1, V. Valerio1,3, M. Rondinelli1, S. Genovese1;
1Research, Centro Cardiologico Monzino IRCCS, Milan, 2Università degli Studi di Milano, Milan, 3Università degli Studi di Napoli, Naples, Italy.
Background and aims: Diabetes mellitus (DM) is associated with increased risk of cardiovascular diseases and aortic valve stenosis (AS). Recent studies showed that glucose variability could be more dangerous than high glucose (HG) chronic exposure. Indeed, in vitro oscillating glucose (OG) enhances apoptosis and reactive oxygen species production in human umbilical vein and in coronary artery endothelial cells. The endothelial dysfunction caused by OG could promote valve disease insurgence and progression. However, no studies considering the effects of OG on valve endothelial cells (VEC) have been performed yet. Thus, we hypothesized that OG, more than constant high glucose exposure, could cause VEC dysfunction by inducing chronic stress with deleterious adaptive responses.
Materials and methods: We isolated VECs from AS patients (n=4). We generated an in vitro model treating cells every day with 5mM D-glucose (LowG), 25mM D-glucose (HG), 5/25mM D-glucose (OG) for 10 days. We used 25mM L-glucose (HLG) and 5/25mM L-glucose (OLG) as molarity controls. We measured i) morphological parameters (i.e. area, circularity, and aspect ratio) related to physiological state by contrast phase microscopy, ii) DNA damage related to oxidative stress by comet assay, and iii) microparticles production related to endothelial dysfunction by flow cytometry. The data were analyzed by ANOVA and Student t-test and presented as mean±SEM.
Results: We observed that VECs under HG showed a significantly larger area compared to cells in HLG and LowG conditions (5724±280 μm2, 3674±271 μm2, and 3205±272 μm2, respectively; p < 0.0001) after 10 days of treatments. No significant differences were found between HG, HLG, and LowG regarding the circularity index nor the aspect ratio. However, VECs under OG stimuli showed a significantly larger area (4120±412 μm2, 3013±288 μm2, 3205±272 μm2, respectively; p < 0.05), lower circularity index (0.61±0.01, 0.70±0.01, 0.69±0.01, respectively; p < 0.0001), and higher aspect ratio (2.47±0.09, 2.14±0.09, 2.04±0.09, respectively; p < 0.001) when compared to cells under OLG and LowG stimuli. The comet assay showed significant DNA damage, confirmed by the increase in the comet tail length, in VECs under HG treatment compared to cells in HLG and LowG conditions (2.19±0.03, 1.28±0.03, 1.03±0.03, respectively; p < 0.001). While VECs under OG showed a significant but less pronounced increment in DNA damage than cells under OLG and LowG stimuli (1.20±0.03, 1.06±0.03, 1.03±0.03, respectively; p < 0.001). Finally, we measure the number of microparticles produced by VECs under the different glycemic stimuli and we found that microparticles were significantly increased only under OG conditions compared to OLG (31.8±2.8% vs 17.7±2.5%, respectively; p< 0.05).
Conclusion: Our data show, for the first time to our knowledge, that valve endothelial cells have a different in vitro response to oscillating and constant high glucose conditions. Both oscillating and high glucose stimuli caused endothelial damage but high glucose-induced cell damage mainly generating hypertrophy and oxidative stress, while oscillating glucose triggered deleterious morphological changes and increased microparticle production. Further studies are needed to unveil the underlying mechanisms.
Supported by: FPF
Disclosure: P. Poggio: None.
966
Proteomic analysis of hyperglycaemic effects in GLUT4-overexpressing rat cardiomyoblasts: short vs long-term hyperglycaemia
B. Stratmann1, B. Eggers2, Y. Mattern1, K. Marcus2, D. Tschoepe1;
1Herz- und Diabeteszentrum NRW, Ruhr-Universität Bochum, Bad Oeynhausen, 2Medizinisches Proteom Center, Ruhr-Universität Bochum, Bochum, Germany.
Background and aims: Diabetic cardiomyopathy is characterized by oversupply of nutrients with loss of metabolic flexibility. We established a stably GLUT4 overexpressing cell line (H9C2-GLUT4) derived from H9C2 presenting a diabetic cardiomyopathy like phenotype to evaluate short and long-term hyperglycaemia effects. Protein expression patterns are analysed by proteomic approaches.
Materials and methods: GLUT4 overexpressing H9C2 (H9C2-GLUT4) were cultured under hyperglycaemic conditions (30mM glucose) either short time (14 days, ST) or long time (> 3 months, LT). Expression profiles were compared to normoglycaemic conditions (20mM glucose). Samples were prepared for mass spectrometric analysis by lysis followed by tryptic digestion. Peptides were analysed on an Orbitrap Elite (ThermoFisher Scientific) and resulting files were taken for the identification and quantification of proteins using MaxQuant and Perseus. DAVID Bioinformatics Resources 6.8 functioned as Pathway and GO term enrichment tool for further analysis of the data set.
Results: 2,841 proteins were quantified with 881 being significantly regulated in the whole analysis set (5% FDR; ANOVA corrected p-value). Further analysis of LT and ST hyperglycaemia identified 15 significantly expressed proteins in ST H9C2-GLUT4 and 156 significantly expressed proteins in the LT H9C2-GLUT4 compared to normoglycaemia (5% FDR; ANOVA corrected p-value). The comparison of ST exposure to LT exposure identified 135 significantly regulated proteins. In-depth pathway and GO term enrichment analysis support effects on metabolism, protein biosynthesis and handling, and ECM composition. In long time hyperglycaemia -not in short time hyperglycaemia- glycolytic enzymes like GAPDH, enolase-1, and pyruvate kinase are significantly downregulated, whereas components of the mitochondrial ATP-synthase complex are upregulated. ECM-markers like fibronectin and Col3A1 are upregulated, the family of calponins are downregulated, as well as several elongation factors involved in protein synthesis.
Conclusion: Chronic glucose overload in cardiomyoblasts induced by GLUT4 overexpression and hyperglycaemia resulted in time-dependent metabolic induced proteome profile change. This may elucidate the multifaceted metabolic effects of chronic hyperglycaemia on cardiomyocyte protein profile and function.
Disclosure: B. Stratmann: None.
967
Investigation of peripheral and cerebral microcirculation and visceral-subcutaneous adipose tissue distribution in type 2 diabetes and obesity
M. Káplár1, M. Emri2, R. Esze1, L. Rajnai1, S. Somodi1, M. Mikó3, Z. Képes3, G. Nagy3, Á. Káplár3, L. Balkay2, I. Garai3;
1Institution of Internal Medicine, Debrecen, 2Institution of Nuclear Medicine, Debrecen, 3ScanoMed Ltd, Debrecen, Hungary.
Background and aims: Microcirculation is damaged in diabetic patients and it has also been observed in obesity. Damage to microcirculation affects both cerebral and peripheral microvessels. Abdominal obesity and type 2 diabetes mellitus are important risk factors for vascular disorders. Visceral adipose tissue (VAT) carries greater cardiometabolic risk than subcutaneous adipose tissue (SAT). Our main aim was to investigate the effect of fat distribution on cerebral and peripheral perfusion and find any association with laboratory parameters in obesity and type 2 diabetes.
Materials and methods: Participants (diabetic group: 20 female and 30 male, mean age: 50.7±7.9 year, BMI: 33.5±5.9 kg/m2; obesity group: 25 female and 19 male, mean age: 52.4±9.8 year, BMI: 37.6±5.1 kg/m2) were recruited from the obesitology and diabetology outpatient department of Internal Medicine, University of Debrecen and were involved just after a written consent accepted by the local ethical committee was obtained. Tc99m HMPAO dynamic SPECT/CT studies were performed to assess cerebral and peripheral microcirculation. Quantification of visceral and subcutaneous fat tissue was performed in axial low-dose CT images taken at the level of LI vertebra. Within the slice semi-automatic segmentation of different regions of adipose tissue after manual selection of ROIs (region of interest) was done. Fat distribution results were expressed as VSR - VAT/SAT ratio, IAA - intra abdominal area and Sra - subcutan/total fat ratio. HbA1c, blood glucose and lipid levels were also determined. Non-parametric Spearman correlation tests with FDR corrections were applied as statistical analysis.
Results: Leg perfusion was significantly lower in the diabetic group (p<0.001) and it correlated significantly with BMI (rho=0.36). However, there were no significant differences in hemispheral and regional brain perfusion between T2DM and obese patients. Significant negative correlation of lower limb microcirculation with VSR was revealed (p=0.0002, rho:-0.37), while VSR had no impact on cerebral circulation. Significant negative correlations between Sra and fasting glucose levels (p=0.0003, rho:-0.36), furthermore Sra and HbA1c (p=0.0001, rho:-0.37) were foud. Negative association between IAA and HDL (rho:-0.4) could also be detected.
Conclusion: Visceral fat tissue has negative effect on HDL, fasting glucose and HbA1c levels and highly contributes to the demage of peripheral microcirculation in patients with obesity and diabetes.
Supported by: GINOP-2.1.1-15-2015-00609
Disclosure: M. Káplár: None.
PS 96 Tradition? No! Non-traditional complications of diabetes
968
Bone fractures in individuals with type 2 diabetes aged ≥ 50 years in the DPV registry: effect of glycaemic control and treatment
A. Eckert1, J. Mader2, M. Altmeier3, A. Gillessen4, D. Dallmeier5, V. Shah6, C. Heyer7, B. Hartmann8, R. Holl1;
1Ulm University, Ulm, Germany, 2Medical University of Graz, Graz, Austria, 3Klinikum Dortmund GmbH, Dortmund, Germany, 4Klinikum Bayreuth, Bayreuth, Germany, 5AGAPLESION Bethesda Clinic, Ulm, Germany, 6University of Colorado Anschutz Medical Campus, Aurora, USA, 7Diabetespraxis Viersen, Viersen, Germany, 8Heilig-Geist Hospital Bensheim, Bensheim, Germany.
Background and aims: Type 2 diabetes mellitus (T2DM) is associated with an elevated risk of fractures. The fracture risk increases with diabetes duration and poor glycaemic control. Treatment with insulin, glinides (GL), sulfonylureas (SU) as well as sodium-glucose linked transporter type 2 inhibitors (SGLT2i) are suspected to play a role in fracture risk. The aim was to examine the relationship between haemoglobin A1c (HbA1c) or type of treatment and fractures in patients with T2DM aged ≥50 years.
Materials and methods: 4,821 T2DM patients with documented fractures during the last 12 months from a multicentre registry (DPV) were compared to 349,179 T2DM patients without any documented fracture. Multivariable logistic regression models, adjusted for demographics, were used to determine the percentage of patients with fractures among HbA1c groups (low (HbA1c <6.5%); intermediate (HbA1c 6.5-9%); high (HbA1c >9%)) and treatment groups (Insulin; GL/SU; SGLT2i; other OADs; lifestyle (no medication)). These analyses were performed for the entire cohort and stratified by sex.
Results: Unadjusted statistics revealed that 1.4% of patients with T2DM had any fracture. Patients with fractures were more often female (63% vs 47%), older (median 77.8 [Q1; Q3: 69.7; 83.8] vs 71.6 [63.2; 78.8] years) and had longer diabetes duration (11.5 [6.6; 18.8] vs 9.2 [3.5; 15.8] years) compared to patients without fractures. Adjusted for demographics, the proportion of fractures decreased with increasing HbA1c (low: 1.15 [1.08 - 1.22] %; intermediate: 0.92 [0.87 - 0.97] %; high: 0.73 [0.66 - 0.80] %; p<0.01). Similar results were found stratified by sex. The adjusted comparison between treatment groups, revealed the highest proportion of fractures in the SGLT2i group (1.46 [1.04 - 2.04] %), which implied a significant difference to the insulin group (0.90 [0.85-0.95] %, p=0.04) and the GL/SU group (0.76 [0.67-0.87] %, p<0.01). No significant differences to the other OAD (0.98 [0.89.-1.07] %, p=0.16) or lifestyle group (1.10 [1.02-1.18] %, p=0.47) were observed. In females this effect was even stronger: SGLT2i (2.53 [1.61-3.93] %) vs. insulin (1.19 [1.11-1.28] %, p=0.01) or GL/SU (1.06 [0.90-1.25] %, p<0.01). Again, differences to other OADs (1.33 [1.19-1.50] %, p=0.05) or lifestyle (1.40 [1.27-1.54] %, p=0.09) were not significant. In males, the lifestyle group (0.91 [0.81-1.03] %) showed a significantly higher frequency of fractures compared to insulin (0.70 [0.64-0.76] %, p<0.01) and GL/SU (0.54 [0.43-0.67] %, p<0.01), but not to treatment with SGLT2i (0.87 [0.52-1.44] %, p=1.00) or other OAD (0.74 [0.64-0.85] %, p=0.97).
Conclusion: Patients with low HbA1c were associated with a higher frequency of fractures risk. This is consistent with the hypothesis that these patients have a higher risk of hypoglycaemia. Female patients reveal the highest proportion of fractures if they were treated with SGLT2i, which are said to be involved in bone turnover, while in male patients, lifestyle therapy seems to be related to highest fracture risk.
Supported by: DZD, RKI, DDG, NIH
Disclosure: A. Eckert: None.
969
Sites of fragility fractures in older women and men with and without type 2 diabetes
I. Tasci, B. Basgoz, T. Dogan, M.I. Naharci;
Internal Medicine, University of Health Sciences, Gulhane Faculty of Medicine & Training and Research Hospital, Ankara, Turkey.
Background and aims: Patients with type 2 diabetes mellitus (T2DM) are at increased risk of fragility fractures regardless of bone mineral density. T2DM has been associated with micro- and macroarchitectural abnormalities that lead to a reduction in bone strength, which may cause hidden fractures in vertebral bodies. On the other hand, classical comorbidities and high rates of falls have also been postulated and were linked to higher risk of non-vertebral fractures. This study compared the fracture sites in patients with T2DM and controls.
Materials and methods: This cross-sectional study involved older women and men (aged 65 years or above) with and without T2DM who had a recent vertebral fracture evaluation (VFE) in an outpatient setting. Wrist, proximal humerus, and hip fracture history were self-reported. Radiographic vertebral fractures were diagnosed by a 20% or greater loss of vertebral body height.
Results: Four hundred twenty older adults [n: 220 with T2DM, mean (SD) age: 73.3 (5.9), 75.5% female; n: 200 control subjects, mean (SD) age: 74.8 (6.6), 75.0% female] were included in the study. Age and gender-adjusted rate of overall fracture (32.7% vs. 23.5%, p=0.010), wrist (10.5% vs. 4.5%, p=0.019), and radiographic vertebral fracture (24.5% vs 18.0%, p=0.038) were higher in T2DM group vs. controls. The frequencies of proximal humerus, hip, and multisite fractures were similar. Compared to the control group, after adjustment for age, female patients with T2DM had more wrist fractures vs. male patients (13.9% vs. 4.7%, p=0.007). In contrast, male patients with T2DM had more radiographic vertebral fractures vs. female patients (22.2% vs. 10.0%, p=0.022). After adjustment for age and gender, a single history fall in the last 12 months was associated with increased frequency of overall (OR: 1.90, 95%CI: 1.06 to 3.42, p=0.032) and wrist fractures (OR: 2.80, 95%CI: 1.07 to 7.32, p=0.036) in the T2DM but not in the control group (OR: 1.27, 95%CI: 0.62 to 2.59, p=0.516). The duration of T2DM (14 years, median) was not associated with fracture after adjustments. Fifty percent (6/12) of self-reported vertebral fractures were not confirmed by VFE concerning>=20% loss of vertebral body height.
Conclusion: In this study, we report that overall, wrist and radiographic vertebral fractures were significantly more frequent in older adults with T2DM. Wrist fractures were more prevalent in female T2DM patients, but radiographic vertebral fractures were more prevalent in male T2DM patients. A single fall history was the predictor of overall and wrist fractures in the T2DM but not in the control group.
Disclosure: I. Tasci: None.
970
Predicting incident hip fractures in Chinese people with type 2 diabetes using A to G's: development and validation of a prediction tool
D.T.W. Lui, C. Lee, W. Chow, C.H.Y. Fong, D.C.W. Siu, Y. Woo, K.S.L. Lam;
Department of Medicine, The University of Hong Kong, Queen Mary Hospital, Hong Kong, Hong Kong.
Background and aims: FRAX is known to underestimate hip fracture risk in type 2 diabetes. Recently a hip fracture risk equation, comprising age, gender, BMI, eGFR and peripheral sensory neuropathy (PSN), was developed from a Caucasian-predominant cohort of the Fremantle Diabetes Study Phase I (FDS1) consisting of exclusively individuals with type 2 diabetes, validated in an independent Caucasian cohort. In view of significant regional differences in hip fracture risk profile and that PSN may not be readily assessed especially in the primary care setting, we aimed to develop and validate a Chinese Hip Fracture prediction equation (CHFracture) from a Chinese type 2 diabetes cohort, and compared its performance with the FDS1 hip fracture risk equation.
Materials and methods: Between 2008 and 2012, we identified, from the electronic health records in Hong Kong, 84,359 Chinese individuals with type 2 diabetes aged 60-85 years who completed diabetic complication screening during this period and with ≥2 years of follow up. Individuals with prior hip fractures or on anti-osteoporosis medications at baseline were excluded. Incident hip fractures were recorded till the censor date on 31 May 2018. This cohort was randomly divided into the training set (80%, n=67,488) for the development of CHFracture and the testing set (20%, n=16,871) for internal validation. CHFracture was developed by using multivariable Cox regression of incident hip fractures with variables selected based on Bayesian information criterion. The discrimination and calibration of CHFracture was assessed by C-statistics, Greenwood-Nam-D’Agostino statistics, and calibration plot, in comparison with the FDS1 risk equation.
Results: 84,359 individuals (53.7% women) were included, with mean age 70.7±6.97 years, BMI 25.3±3.74 kg/m2, HbA1c 7.28±1.23% and duration of diabetes of 9.84±7.92 years. 2,432 individuals had incident hip fractures during a median follow-up of 6.9 years (6.4-7.6), an incidence of 4.1 per 1000 person-years. The clinical characteristics were comparable between individuals in the training set and the testing set. Individuals who had incident hip fractures were more likely to be women, older, smokers, insulin users, have longer duration of diabetes, higher HbA1c, lower BMI and eGFR, history of severe hypoglycaemia, fall, fractures, cardiovascular diseases and stroke (all p<0.001). Based on Bayesian information criterion, CHFracture comprised Age, BMI, Cigarette (smoking), Duration of diabetes, EGFR, history of Fall, Gender and history of Stroke (mnemonic: ABCDEFG-S), all readily available in standard diabetes management. CHFracture predicted mean 5-year incident hip fracture risk at 1.6% with good discrimination (C-statistics 0.744, 95% CI 0.733-0.754) and calibration (χ2=7.995, p=0.535) in the training set. CHFracture had a better C-statistics 0.754 (95% CI 0.733-0.776) than the FDS1 risk equation (C-statistics 0.729, 95% CI 0.706-0.752; p<0.001) in the testing set.
Conclusion: CHFracture was developed based on 8 readily available parameters (‘A to G’s), which more accurately predicted incident hip fractures among Chinese individuals with type 2 diabetes, compared with the FDS1 risk prediction equation developed from Caucasian data. CHFracture had the potential clinical utility to identify high-risk individuals with diabetes, for a more aggressive approach to optimize their bone health.
Disclosure: D.T.W. Lui: None.
971
The role of myozenin-1 in diabetic sarcopenia
K.-P. Cheng1, K.-L. Huang2, H.-C. Hung1, Y.-F. Du1, A.-C. Lin1, C.-Y. Hu3, H.-T. Wu4, H.-Y. Ou1;
1Division of Endocrinology and Metabolism, Department of Internal medicine, National Cheng Kung University Hospital, College of Medicine, National Cheng Kung University, Tainan, 2Department of Biochemistry and Molecular Biology, National Cheng Kung University, Tainan, 3Department of Urology, National Cheng Kung University Hospital, College of Medicine, National Cheng Kung University, Tainan, 4Graduate Institute of Metabolism and Obesity Sciences, College of Nutrition, Taipei Medical University, Taipei, Taiwan.
Background and aims: Sarcopenia is associated with poor quality of life and high mortality. Its prevalence is up to 9.9 - 40.4 % in older adults. Diabetic patients have been found less muscle mass and strength than non-diabetics. Myozenin-1 is a protein expressed exclusively in skeletal muscles. Although myozenin-1 was related to the expression of peroxisome proliferator activated receptors (PPAR)-γ2 in one previous study, its role in glucose metabolism and myocyte differentiation remains unclear. The aim of this study was to clarify the role of myozenin-1 in diabetes and sarcopenia.
Materials and methods: High fat diet (HFD) diabetic sarcopenia animal model was established using eight-week-old C57BL/6 male mice fed with a high fat diet for 21 weeks. Insulin sensitivity and glucose utility were assessed by intraperitoneally injected glucose and insulin tolerance test. Muscle strength of the mice was determined by the rotarod test and grip strength test. In addition, myozenin-1 overexpressed L6 cells were generated using lentiviral vectors. PPAR-γ2, glucose transporter GLUT4 and myogenin-1 expressions were determined by western blot. For human subjects, we used dual-energy X-ray absorptiometry for measurement of skeletal muscle mass, and serum myozenin-1 levels were determined using commercialized ELISA kits.
Results: We established a HFD-induced diabetic sarcopenia animal model characterized by decreased insulin sensitivity and glucose utility as well as lower grip strength (p < 0.001) and hindlimb muscle mass per body weight (p < 0.001). Additionally, there were significantly lower expressions of PPAR-γ2 (p < 0.001) and GLUT4 (p < 0.001) in muscles of those mice than chow-fed mice. In order to explore the main factors that contribute to sarcopenia, we used the microarray analysis and found that the expression of myozenin-1 was significantly increased in muscles of diabetic sarcopenic mice. To determine the physiologic effect of myozenin-1 in muscles, we created the myozenin-1 overexpressed L6 cell model. In this model, we found increased PPAR-γ2 and GLUT4 expressions as well as elevated glucose uptake. Also, myozenin-1 overexpressed L6 cells showed a higher level of myogenin, a pro-differentiation myogenic transcription factor. Moreover, high concentration of glucose (25 mM) induced the expression of myozenin 1 in L6 cells. Furthermore, in human subjects there were negative correlations between serum myozenin-1 concentrations and skeletal muscle mass as well as grip strength.
Conclusion: We found in this study that myozenin-1 was a novel factor which linked diabetes and sarcopenia. Myozenin-1 not only got involved in muscle differentiation, but also increased the expressions of PPAR-γ2 and GLUT4 to enhance the glucose uptake in myocytes. Our results suggest myozenin-1 has a potential in the diagnosis and treatment of diabetic sarcopenia.
Disclosure: K. Cheng: None.
972
Adverse muscle composition in type 2 diabetes: results from the large UK Biobank imaging study
J. Linge, O. Dahlqvist Leinhard;
Department of Health, Medicine and Caring Sciences, Linköping University; AMRA Medical AB, Linköping, Sweden.
Background and aims: A recent study on UK Biobank showed today’s sarcopenia definitions (using functional measures and muscle quantity) are highly BMI dependent and consequently underestimates sarcopenia within obesity. As obesity is common in T2D, this should also affect sarcopenia diagnosis and management in T2D patients. In addition, combined magnetic resonance imaging (MRI)-based muscle assessment including sex and body size adjusted fat-free muscle volume (FFMV) and muscle fat infiltration (MFI) showed high diagnostic performance for detecting individuals with low functional performance across BMI classes. The aim of this work was to investigate prevalence of sarcopenia and low functional performance and describe MRI-based muscle composition (FFMV, MFI) and prevalence of adverse muscle composition in participants with T2D compared to controls.
Materials and methods: 9724 participants were included. Prevalence of low functional performance (slow walking pace, no stair climbing, number of falls) and sarcopenia was assessed using hand grip strength, dual energy X-ray absorptiometry (DXA) and questionnaire data in T2D (N=434) and controls (N=9154 without diabetes). FFMV and MFI were quantified using MRI. For each participant, a matched virtual control group (VCG) was created to calculate an individualized z-score (sex and body size specific) for FFMV (FFMVVCG). Adverse muscle composition was defined as low FFMVVCG (below 25th percentile, whole cohort) and high MFI (above 75th percentile (sex specific), whole cohort).
Results: Although prevalence of sarcopenia was not different comparing T2D to controls (3.5 vs 2.4 %, p=0.24), prevalence of low functional performance was higher in T2D for all variables: low hand grip strength 10.6 vs 6.1 %, slow walking pace 14.8 vs 3.9 %, no stair climbing 11.8 vs 7.7 %, more than one fall last year 8.1 vs 4.7 %, (all p<.003). FFMVVCG was lower, mean -0.31 (SD 1.03) vs 0.02 (0.98) SDs from sex and body size matched reference VCG, MFI higher 8.62 (2.37) vs 7.34 (1.81) % (1.66 (2.24) pp from sex matched reference) and adverse muscle composition more common in T2D (26.0 vs 9.5 %) (all p<.001).
Conclusion: Sarcopenia related problems were much more common in T2D as compared to controls. This was not reflected in higher prevalence of sarcopenia within T2D but more accurately described using MRI-based muscle composition.
Disclosure: J. Linge: Employment/Consultancy; AMRA Medical AB.
973
Multi-organ metabolomic profiles of high fat-high sucrose fed mice identify the lung as one of the most metabolic remodelled organs in obesity
B. Panthu1, G. Rautureau2, S. Guibert2, C. Lefevre1, J. Perrier1, A. Alves1, M.-A. Berger1, C. Pinteur1, M. Godet1, A.-M. Madec1, J. Rieusset1, B. Morio1, A. Mey1;
1Faculté de médecine de Lyon sud, CARMEN, INSERM U1060, Oullins, 2CRMN, ENS de Lyon, Villeurbanne, France.
Background and aims: Obesity is increasing worldwide. It affects many organs and is associated with several comorbidities, such as type 2 diabetes. This can also lead to an increased risk of organ failure. To better understand the dependence of a specific organ on global homeostasis, our work aims to explore whether an obesogenic diet in mice differentially alters the homeostasis of key organs.
Materials and methods: We compared the metabolomic profiles of liver, lungs, heart, muscle, kidneys, brain and serum from mice fed a standard diet vs. a high fat-high sucrose (HFHS) diet for fourteen weeks. Primary metabolites were extracted with methanol 100%, spectra were acquired using a proton nuclear magnetic resonance spectrometer, and metabolomic analyses were conducted with the chenomx software to reach quantitative metabolite concentration.
Results: In total, up to 59 primary metabolites were identified and quantified. Metabolic homeostasis was differentially affected between organs and serum. Furthermore, changes in metabolic homeostasis of organs and serum were weakly correlated. Interestingly, 23 of the 48 quantified metabolites in the liver (49%) were significantly altered in obesity, placing the liver at the top of the diseased organs. Lungs, with 13 of 46 metabolites altered (28%), was as altered as major organs such as heart (14/46, 30%) and muscle (13/51, 21%). In contrast, kidneys and brain were the less affected, with 8 of 48 (16%) and 7 of 45 (15%) metabolites altered, respectively. In the lungs, betaine (-27%, p<0.01), IMP (-61%, p<0.05), O-Phosphocholine (-22%, p<0.01), Phenylalanine (-18%, p<0.001) and myo-inositol (-30%, p<0.01) were lower in HFHS-fed mice compared to controls, whereas creatine phosphate (+43%, p<0.05), glutamine (+20%, p<0.05), malonate (+69%, p<0.05), N-Acetylaspartate (+45%, p<0.05), N-Methylhydantoin (+32%, p<0.05), NAD+ (x2, p<0.001), NADP+ (+30%, p<0.01) and sn-Glycero-3-phosphocholine (+26%, p<0.01) were higher.
Conclusion: Each organ evidenced a specific profile of alterations. With 28% of their primary metabolites altered, the lungs highlight major metabolic reprogramming in response to an obesogenic diet.
Supported by: SFD
Disclosure: B. Panthu: None.
974
Empagliflozin and obstructive sleep apnoea: exploratory analysis from the EMPA-REG OUTCOME trial
I.J. Neeland1, B. Eliasson2, T. Kasai3, N. Marx4, B. Zinman5, S.E. Inzucchi6, C. Wanner7, I. Zwiener8, B. Wojeck6, H. Yaggi6, O. Johansen9;
1University of Texas Southwestern Medical Center, Dallas, USA, 2Sahlgrenska University Hospital, Gothenburg, Sweden, 3Juntendo University Graduate School of Medicine, Tokyo, Japan, 4RWTH University Hospital, Aachen, Germany, 5Mount Sinai Hospital and University of Toronto, Toronto, Canada, 6Yale University, New Haven, USA, 7Wuerzburg University Clinic, Wuerzburg, Germany, 8Boehringer Ingelheim Pharma GmbH & Co KG, Ingelheim, Germany, 9Boehringer Ingelheim, Asker, Norway.
Background and aims: Obstructive sleep apnoea (OSA) and type 2 diabetes (T2D) occur more frequently in persons with obesity, and both OSA and T2D are associated with metabolic disturbances that increases the risk for cardiovascular disease (CVD). In EMPA-REG OUTCOME, a randomized placebo-controlled outcome trial of 7020 patients with T2D and CVD, the sodium glucose co-transporter (SGLT)-2 inhibitor empagliflozin reduced HbA1c, systolic blood pressure (SBP), waist circumference, and weight, and reduced the risk of 3-point major adverse CV events (3P- MACE) by 14%, CV death by 38% and hospitalization for heart failure (HHF) by 35%.
Materials and methods: This post-hoc analysis of EMPA-REG OUTCOME investigated the baseline prevalence of investigator-reported OSA; explored the effects of empagliflozin (vs. placebo) on metabolic parameters in patients with OSA; and sought to determine its potential effect on incident OSA.
Results: OSA was reported in 391/7020 patients with T2D and established CVD at baseline (5.6% [placebo 5.4%; empagliflozin 5.7%]). Those with OSA were more likely to be male (82.9 vs 70.8%), have moderate to severe obesity (BMI ≥ 35 kg/m2: 55.2 vs 18.2%; mean weight 105.5 vs 85.2 kg), and have greater prevalence of coronary artery disease (88.0 vs 74.9%). Over a median 3.1 years, empagliflozin had similar placebo-adjusted reductions in HbA1c, waist circumference and SBP regardless of baseline OSA status. However, empagliflozin had a larger effect on weight reduction in patients with OSA (week 28 adjusted mean (±SE) difference vs placebo: -2.9±0.4 vs -1.9±0.1 kg and at week 52: -2.9±0.5 vs -1.9 kg ±0.1 in those without OSA, respectively). Fifty patients developed incident OSA (Figure) through 7 days after study medication discontinuation, and this was reported significantly less often with EMPA (Hazard ratio 0.48 [95% CI 0.27, 0.83]). In a mediation analysis for treatment effect on incident OSA, the effects on conventional OSA-risk factors with empagliflozin did not explain the apparent reduced OSA-risk (e.g., weight reduction mediated 16.5%, SBP reduction mediated 8.9%).
Conclusion: In conclusion, empagliflozin has favourable effects on metabolic risk factors in patients with OSA and T2D/CVD and may reduce incident OSA, partially independent of its effects on OSA-risk factors.

Clinical Trial Registration Number: NCT01131676
Supported by: Boehringer Ingelheim and Eli Lilly and Company Diabetes Alliance
Disclosure: I.J. Neeland: Grants; Novo Nordisk. Honorarium; Boehringer Ingelheim, Eli Lilly, AMRA Medical.
975
Insomnia independently increases the risk of hospitalisation due to multiple morbidities in older adults with type 2 diabetes: a prospective study
S. Qiu1, T.C.K. O1, W.M. Chan1, L.C.G. Mak1, H.W. Mang1, J.C.N. Chan1,2, A.P.K. Kong1,2;
1Department of Medicine and Therapeutics, Faculty of Medicine, The Chinese University of Hong Kong, Hong Kong SAR, 2Li Ka Shing Institute of Health Sciences, Hong Kong SAR, China.
Background and aims: Type 2 diabetes (T2D) is associated with higher rates of hospitalization and longer hospital stay than the general population, inflicting major burden to the healthcare system. A significant proportion of T2D patients had comorbid insomnia associated with poor glycemic control. However, whether insomnia independently increases the risk of hospitalization in patients with T2D is under-explored. We investigated the risk association of insomnia on the rate of hospitalization and the length of hospital stay in older adults with T2D.
Materials and methods: Participants of the Hong Kong Diabetes Register aged ≥60 years who had T2D and baseline documentation of sleep habits by self-reported validated questionnaires between July 2010 and May 2015 were prospectively followed up till the censor date (January 2020) or died. Insomnia was defined as Insomnia Severity Index (ISI) score>14. The primary outcome measure, the number of hospital admissions, was retrieved from the electronic medical record. The associations of the number of hospital admission and number of days of hospital stay were examined using negative binomial regression models. All data were analyzed using the Statistical Package for Social Science software (SPSS, Version 25.0 IBM).
Results: Among the 1086 participants [58.6% men, mean ± standard deviation age: 63±3 years, disease duration of T2D: 10±8 years, body mass index (BMI):25.8±4 kg/m2], 96 (8.9%) had insomnia. At baseline, the insomniac group had poorer glycemic control than the non-insomniac group [HbA1c: (7.8±1.6 vs. 7.4±1.3, p=0.015)]. Multiple linear regression analysis showed positive associations between insomnia and HbA1c after adjustment for age, gender, BMI, T2D disease duration, frequency of self-reported hypoglycemia, use of tobacco and alcohol, medications including oral blood glucose lowering drugs and insulin, aspirin, blood pressure lowering drugs, lipid lowering drugs and psychiatric drugs, and co-morbidities including cognitive impairments and psychiatric diseases (Beta=2.9, 95% Confidence interval, CI 0.1 to 0.7, p=0.004). After a median follow-up of 3.2 (interquartile range: 2.0-3.6) years, there were 2570 hospitalization episodes and 97 deaths with 475 participants having at least one hospitalization. The primary cause of admission included cardiovascular diseases (21.9%, including heart failure, stroke and poor blood pressure control), gastrointestinal diseases (16.4%), musculoskeletal diseases (9.4%), renal diseases (8.9%), ophthalmological diseases (6.5%), lung diseases (6.2%), bone fractures (4.0%), obstructive sleep apnea (3.7%), hypoglycemia (3.2%), prostate diseases (2.9%), hematological diseases (2.1%),mental illnesses (1.9%), other metabolic diseases (1.8%), hyperglycemia (1.6%), and others (9.5%). In regression analysis with adjustment for aforementioned covariables plus HbA1c, T2D comorbid with insomnia had more hospital admissions (3.7 vs 2.2, p=0.016) (Beta=1.4, 95% CI 0.4 to 2.3, p=0.004) and cumulative bed-days (Beta=6.9, 95% CI 1.3 to 12.7, p=0.016) than their non-insomniac counterparts.
Conclusion: Patients with T2D and insomnia had more frequent hospitalizations and longer hospital stays due to multiple morbidities than their counterparts without insomnia.
Disclosure: S. Qiu: None.
976
Repressed hypoxia inducible factor-1 in diabetes aggravates aspergillus fumigatus infection
X. Zheng1, Y. Ye2, Y. Chen2, J. Sun2, H. Zhang2, W. Li2, W. Wang2, S.-B. Catrina1;
1Molecular Medicine and Surgery, Karolinska Institute, Stockholm, Sweden, 2China Medical University, Shenyang, China.
Background and aims: Pulmonary Aspergillus fumigatus (A. fumigatus) infection is a life-threatening infection for which diabetes was suggested as a risk factor. It is however unclear what mechanisms stay behind the sensitivity of patients with diabetes to A. fumigatus infection. Hypoxia inducible factor-1 (HIF-1) is a transcription factor regulating inflammatory responses. However, the role of HIF-1 signaling in pulmonary A. fumigatus infection in diabetes is unknown. This study is to investigate whether HIF-1 inhibition contributes to the severity of pulmonary A. fumigatus infection in diabetes.
Materials and methods: A clinical retrospective study was performed to analyze the relationship between diabetes and fungal pneumonia. Diabetes was then induced in mice, and the mice were inoculated with A. fumigatus or PBS as control. Dimethyloxalylglycine (DMOG) was applied in diabetic mice infected with A. fumigatus in order to investigate the role of HIF-1. The infection course, inflammatory responses and HIF-1α expression were assessed after infection. Transcriptome analysis was performed to identify the mechanism. Data are presented as mean ± SEM. Statistical significance was analyzed using Student’s t-test or ANOVA. P<0.05 was considered significant.
Results: The clinical retrospective study showed diabetes as an independent risk factor for long-term hospital stay of fungal pneumonia patients. 61.1% of patients with diabetes had a long-term stay in the hospital, which was significantly higher than the patients without diabetes (38.9%). Diabetic mice had reduced survival with 24% mortality on day 3 post infection, and retarded A. fumigatus clearance shown by increased Colony forming unit (CFU) per gram lung tissue. This was confirmed by significantly increased signal of A. fumigatus conidia and hyphae on Day 1 (21 ± 4 vs 1.3 ± 0.2), Day2 (19 ± 5 vs 1.3 ± 0.1), Day 3 (17 ± 3 vs 1.4 ± 0.5), Day 4 (21 ± 1 vs 1.2 ± 0.2), Day 7 (10 ± 3 vs 1.3 ± 0.3) and Day 14 (5 ± 2 vs 0.8 ± 0.0) after infection. Diabetic mice had increased leukocyte infiltration in the lungs after A. fumigatus infection. This was followed by an augmented inflammatory response as evaluated by the serum cytokine levels. Significant differences were highest at 2 days after infection for TNF-α (97 ± 41 vs 20 ± 7), IL-10 (101 ± 36 vs 13 ± 8), IL-6 (1131 ± 726 vs 16 ± 9), IL-22 (22 ± 11 vs 3 ± 1) and 3 days after inoculation for IL-4 (2 ± 1 vs 0.04 ± 0.03), IL-12p70 (197 ± 104 vs 3 ± 1), IL-2 (5 ± 3 vs 0.3 ± 0.3), MIP-3α (1016 ± 520 vs 31 ± 2) and IL-17A (5 ± 1 vs 1.0 ± 0.1). HIF-1α was stabilized by A. fumigatus infection early after pulmonary challenge in nondiabetic mice but not in diabetic mice. HIF-1 induction by DMOG in diabetic mice was followed by significantly decreased levels of inflammatory cytokines in serum on Day 2 after infection, such as TNF-α (16 ± 3 vs 164 ± 27), IL-2 (0 vs 1.4 ± 0.4), IL-4 (0 vs 0.7 ± 0.2), IL-6 (67 ± 31 vs 2882 ± 643), and IL-10 (9 ± 3 vs 131 ± 31). DMOG treatment reduced A. fumigatus load and increased the survival with a final mortality rate of 6% in diabetic mice. Transcriptome analysis revealed that HIF-1 induction by DMOG regulated several central inflammatory responses related signaling pathways.
Conclusion: The HIF-1 response during pulmonary A. fumigatus infection is inhibited in diabetes. HIF-1 induction protects diabetic animals against pulmonary A. fumigatus infection by attenuating the overactivated inflammatory responses and promoting the clearance of A. fumigatus.
Supported by: the National Key R&D Program of China and the National Natural Science Foundation of China
Disclosure: X. Zheng: None.
977
Mannose-binding lectin and risk of infections in type 2 diabetes: a cohort study of 7,305 patients in the Danish DD2 cohort
A. Gedebjerg1,2, R.W. Thomsen1, A.D. Kjaergaard1, R. Steffensen3, J.S. Nielsen4, J. Rungby5, S. Friborg6, I. Brandslund7, S. Thiel8, H. Beck-Nielsen4,6, H.T. Sørensen1, T.K. Hansen9, M. Bjerre10;
1Department of Clinical Epidemiology, Aarhus, 2Danish Diabetes Academy, Odense, 3Department of Immunology, Aalborg, 4DD2, Odense, 5Department of Endocrinology IC, Copenhagen, 6Department of Endocrinology, Odense, 7Department of Biochemistry, Vejle, 8Department of Biomedicine, Aarhus, 9Steno Diabetes Center Aarhus, Aarhus, 10Medical Research Laboratory, Aarhus, Denmark.
Background and aims: Mannose-binding lectin (MBL) is a pivotal factor in the innate immune system, initiating the complement cascade and promoting pathogen clearance. MBL deficiency may increase the susceptibility of infections, but the existing evidence is conflicting. Low MBL levels may only increase risk of infections when other parts of the immune system are compromised. We investigated the hypothesis that low MBL is associated causally with increased risk of infections in patients with type 2 diabetes (T2D).
Materials and methods: We measured serum MBL concentrations in 7,305 and performed MBL expression genotyping in 3,043 consecutive T2D patients enrolled in the Danish Center for Strategic Research in Type 2 Diabetes (DD2) cohort. Record linkage with population-based medical registries allowed complete follow-up of the patients for up to 8 years. Outcomes were hospital-treated infections and community-based antimicrobial prescriptions. The risk of infections associated with MBL were examined by spline and Cox regression analyses. Hazard ratios (HRs) were adjusted for sex, age, diabetes duration, C-reactive protein, obesity, smoking, alcohol consumption, HbA1c, comorbidities, lipids, anti-diabetic and lipid-lowering drug treatment.
Results: Risks of hospital-treated infections (n=1140 events) and antimicrobial prescriptions (n=5077 events) were increased in T2D patients with low serum MBL followed for up to 8 years, yielding an “L-shaped” risk profile according to increasing MBL level. Compared to the intermediate serum MBL category, the aHR for the low serum MBL category was 1.13 (95% confidence interval, 0.96-1.33) for any hospital-treated infections and 1.19 (1.01-1.41) for hospital-treated bacterial infections, including 1.14 (0.81-1.62) for urinary tract infections, 1.30 (0.98-1.70) for pneumonia, 1.77 (0.97-3.23) for diarrheal diseases, and 1.50 (1.00-2.24) for other bacterial infections. A weak positive association with low serum MBL was present for antimicrobial prescriptions in the community (aHR 1.06 [0.98-1.15]). For the low MBL expression genotype, the aHR was 1.08 (0.84-1.38) for any hospital-treated infections, including an aHR of 2.23 (1.04-4.80) for diarrheal diseases. The aHR for the low MBL expression genotype was 1.18 (1.04-1.34) for antimicrobial prescriptions.
Conclusion: In patients with T2D, low serum MBL levels were associated with increased risk of future bacterial infections. This was supported by similar, although weaker, associations with low MBL expression genotype, suggesting a potential causal role of MBL in infection risk. T2D in combination with MBL deficiency may act as a dual hit to the immune system and increase susceptibility to bacterial infections.
Supported by: DDA; Danish Heart Foundation; Aarhus University; and other foundations.
Disclosure: A. Gedebjerg: None.
Author Index
Aagaard, N. K. 26
Aanstoot, H.-J. 170
Abalo, X. M. 39
Abaniel, R. 674
Abarkan, M. 392
Abassade, P. 894, 939
Abbas, Z. G. 840
Abdalhakam, I. 463
Abdul-Ghani, M. 132, 571
Abelin, K. U. 897
Aberer, F. 721, 781
Abildgaard, J. 618
Abiru, N. 143, 222
Abner, S. 647
Abrahamsson, N. 487
Abubaker, J. 488
Abukiwan, A. 31
Acar, E. 963
Achenbach, P. 52, 202, 318, 319
Adachi, H. 342
Adam, S. 302
Adams, A. 653
Adams, J. 132, 571
Adams, J. 725
Adams-Huet, B. 710, 711
Adamski, J. 1
Adan, M. 343
Adderley, N. 118
Adeshara, K. 904
Aga-Barfknecht, H. 352
Agarwal, R. 560, 837
Agesen, R. M. 736
Aglan, A. 208
Aglialoro, A. 238, 256, 633
Agner, B. R. 689, 690
Aguilar-Recarte, D. 15
Agyin, C. 571
AHCL Study Group 169
Ahlqvist, E. 63, 299
Ahluwalia, T. S. 797, 804
Ahmad, S. 620
Ahmad, T. 566
Ahmadizar, F. 204, 519
Ahmed, I. 744
Ahn, C. 927
Ahn, K. 805
Ahn, S. 69, 879
Ahnmark, A. 213
Ahola, A. J. 62, 749
Ahonen, L. 795, 820
Ai, M. 231
Aihara, M. 644
Aittomäki, V. 794
Aizawa, T. 801, 802
Ajala, B. 738
Ajjan, R. A. 35, 398, 399, 699, 729
Akalestou, E. 226
Akamine, T. 178, 810
Akazawa, S. 222
Åkerblom, A. 124
Akhbari, P. 314
Al Khalaf, F. 719
Al Mulla, F. 488
Al Rifai, S. 21
Alamri, A. 894
Alassad, H. 738
Alatrach, M. 132, 571
Albanese, M. 842
Alberico, F. 341
Albertorio, J. 766
Albright, A. 66
Alcaide-Torres, J. 205
Alexandre, C. 21, 553
Alexiadou, K. 548
Alfaro, A. 511
Alfieri, V. 965
Alguwaihes, A. 158, 945
Al-Hasani, H. 71, 403, 405, 491
Ali Alsiddig, R. 463
Ali, A. 666
Ali, N. 190
Alibegovic, A. C. 85, 736
Alkasem, M. 463
Alkhouri, N. 132
Allden, R. 722
Allegretti, M. 370
Almby, K. E. 39, 487, 502, 547
Almeida, D. R. Q. 372
Almotawa, M. S. M. 304
Al-Mrabeh, A. 18, 235, 522
Alobaid, A. M. 399, 398, 699
Alonso, L. 109, 316
Al-Rifai, S. 553
Alshames, R. 265
Altmeier, M. 968
Altunkanat, D. 615
Alvarez-Ramos, L. 798, 852
Alves, A. 524
Alves, A. 973
Alwarith, J. 30
Amadid, H. 272, 282, 293, 899
AMD Annals Study Group 256, 633
Amiel, S. A. 191, 328, 700, 740
Ampudia-Blasco, F. J. 665, 667, 669
Anand, V. 202, 318, 319, 364
Anastasiou, I. 207, 251
Anatakly Henon, Y. 894
Anbazhagan, A. 437
Anděl, M. 949
Andersen, A. 897
Andersen, B. V. 228
Andersen, C. L. 943
Andersen, G. S. 268, 270, 282, 651
Andersen, H. 182, 185
Andersen, H. L. 817
Andersen, H. U. 603, 736
Andersen, K. R. 149
Andersen, L. B. 194
Andersen, S. T. 157, 182
Anderson, M. P. 722, 725
Anderson, S. G. 842
Andersson, E. 239
Andersson, N. A. W. 476
Andrade, R. 443, 886
Andreozzi, F. 341, 472, 474
Andrey, M. 428
Ang, L. 844
Anholm, C. 581
Anjum, A. 261
Anker, S. D. 565
Annamalai, K. 96, 397
Annamalai, N. 723
Anoop, A. G. 934
Anselmino, M. 120
Anstee, Q. M. 70, 867
Antakly Hanon, Y. 939
Antikainen, A. 100, 160, 904
Antoinades, C. 959
Anton, A. 181
Anton, A. 653
Antonellis, M. 556
Antoni, G. 578
Antonisamy, B. 934
Antza, C. 889
Anyfantakis, A. 284
Anzai, T. 575
Aoki, Y. 97
Apaolaza Gallegos, P. 314
Apostolopoulou, M. 520
Aprile, M. 76
Aragno, M. 500, 902
Aragona, M. 427, 432, 433, 435
Arai, T. 957
Araki, E. 38
Aral, F. 615
Araujo-Vilar, D. 303
Archibald, L. K. 840
Ardestani, A. 96, 378, 397
Arefin, S. 464
Arenas Leon, J. L. 158, 945
Arfanyan, A. 452
Ariansen, I. 288
Ariëns, R. A. S. 35
Arima, H. 20, 354, 541, 554
Arini, G. S. 372
Armento Lee, A. 107
Armour, S. L. 140
Armstrong, D. 249
Arnold, S. V. 280
Arnold, Z. 963
Arnott, C. 122
Arnqvist, H. 806
Arnskov, K. 775
Aroda, V. R. 660
Aronson, R. 676, 735
Arora, T. 626
Aroulanda, M. 894, 939
Arrieta, A. 170
Arroyo-Díez, F. 714
Arshad, M. F. 744
Arteaga, M. 765
Artemova, E. 863
Arthur, S. 837
Artime, E. 663
Arunachala Murthy, T. 758
Arvan, P. 261
Aryal, N. R. 960
Aschner, P. 640, 649, 650
Ashman, N. 725
Aso, Y. 691
Assah, F. K. 286
Astiarraga, B. 119
Astrup, A. 614
Athanasakis, K. 655
Athanasiadou, E. 5, 944
Atisso, C. M. 148, 585, 588
Atkinson, M. 43
Atsumi, T. 246, 575, 599, 751
Au, Y. W. 177
Audano, M. 885
Augustin, T. 55, 567
Auro, K. 110
Aust, D. 327
Austin, A. L. F. 507
Averta, C. 472, 474
Avery, L. 867
Avgerinos, I. 535, 836
Avignon, A. 895
Avogaro, A. 104, 121, 825, 881
Axel Schweitzer, M. 731
Ayis, S. 823, 839
Aykac, I. 963
Aziz, F. 856
Aziz, T. 383
Baba, Y. 909
Babenko, A. 126
Bach, L. 717
Bachbauer, M. 416
Bachran, R. 323
Bäckhed, F. 458
Bae, J. 562
Bae, J. 595
Bae, S. 115, 127, 537, 871
Baekdal, M. 188, 574
Bagger, J. I. 897
Bai, T. 379
Baik, S. 805
Bailetti, D. 533
Baillot-Rudoni, S. 233
Bain, S. C. 48, 400, 401
Bajaj, H. S. 657, 661
Baker, C. J. 865
Bakker, D. 125
Bakker, S. J. K. 236
Bakris, G. L. 122, 558, 559, 560
Balantac, Z. 746
Balboa, D. 244
Balcacean, D. 314
Balcerczyk, A. 310
Baldassare, M. P. A. 188
Baldassarre, M. P. A. 897
Baldi, S. 526, 962
Baldry, E. L. 230, 564
Baliga, B. S. 710, 711
Balkau, B. 4, 799
Balkay, L. 967
Balkhiyarova, Z. 762, 763, 766
Ballanti, M. 498
Ballantyne, C. 627
Ballhausen, H. 240
Balliro, C. A. 172, 716
Bally, L. 210, 400
Balogh, F. 963
Bandholm, T. Q. 607
Bandres-Meriz, J. 413, 416
Bañeras, J. 903
Banerjee, R. 876, 877
Bankoglu, E. 626
Bankosegger, R. 791
Banno, R. 20, 541, 554
Banu, I. 489, 894, 939
Baratova, B. 90
Barbieri, C. 28, 119
Barbosa, H. C. L. 955
Barbry, F. 425
Barbuti, A. 885
Barchetta, I. 505, 532, 533, 882
Bard, J.-M. 621
Bargetto, M. 621, 623
Barghouth, M. 12
Barillaro, M. 508
Barkai, L. 774
Barker, P. 581
Barleen, N. A. 107
Barnard, N. D. 30
Barnard-Kelly, K. 708
Barnes, A. 235
Barone, E. 505
Baroni, M. G. 505, 533
Baronti, W. 360, 362, 427, 432
Barosa, C. 408
Barovic, M. 211, 327
Barquiel, B. 422
Barreto, C. 468
Barroso Oquendo, M. 530
Barroso, I. 331
Bartakova, V. 90
Bartee, A. 683, 693, 752
Barter, P. J. 960
Basgoz, B. 969
Bashir, T. 722
Basile, J. 598
Bastard, J.-P. 799
Bastian, A. 778
Battaglia, C. 386
Battini, L. 427, 433, 435
Baudry, C. 469
Baudry, J. 281
Bauer, I. 430
Bauer, S. 551
Baumann, P. 721
Baxter, M. 668
Bayazit, B. 10
Bayram, F. 158, 945
Beall, C. 189, 457
Beato Vibora, P. I. 714
Beaulant, A. 14
Becerra, L. 231
Bech-Nielsen, H. 182
Beck, P. 721, 781
Beck, R. W. 704, 713
Beck-Nielsen, H. 617, 736, 977
Bee, Y. 755
Beebe, E. C. 116, 584
Beguinot, F. 307, 330
Béhe, M. 43
Beiglböck, H. 28
Bekers, O. 727
Bekiari, E. 5, 535, 836, 944
Bektić, A. 33
Belew, G. D. 407, 409
Belgardt, B. 54
Beli, E. 824
Bellary, S. 118
Bello, O. 328
Beloglazova, I. 452
Bem, R. 859
Ben Hamou, A. 894, 939
Bendridi, N. 14
Bengtsen, M. B. 285
Bengtsson, J. 322
Benitez-Aguirre, P. 73
Benkendorff, C. 24
Bennet, L. 84
Benninger, R. K. P. 7
Benninghoff, T. 405
Benoit, S. R. 66
Benomar, Y. 21, 553
Bensignor, M. O. 606
Berard, L. 667, 669
Berendschot, T. 481
Beretta, M. 630
Berg, T. J. 32
Bergenstal, R. M. 107, 159, 660, 678
Berger, M.-A. 14, 973
Bergerot, D. 546
Berggren, P.-O. 242
Bergmann, M. M. 281
Bergmann, N. C. 145
Bergstrand, S. 250
Berkane, N. 469, 891
Bermúdez-Silva, F. J. 368
Bernal-Lopez, M. 205
Bernard, M.-A. 900
Bernjak, A. 744
Bertoccini, L. 505, 532, 533, 882
Bertolotto, A. 427, 432, 433, 435
Bertrand, G. 8, 95
Besser, R. E. J. 262
Bessette, L. 289
Best, J. D. 960
Bethel, A. 586, 589
Beunen, K. 483
Bgatova, N. 136
Bhagroo, N. 511
Bhatia, D. 337
Bhatt, D. L. 97, 561, 627
Bhattacharyya, S. 620
Bi, Y. 305, 366, 454, 687
Biagini, T. 341
Bianchi, C. 427, 432, 433, 435
Bianconi, E. 486, 878
Bigot, G. 753
Bijkerk, R. 177
Bijnen, M. 503
Billeskov, T. 906
Billing, L. 225
Billings, L. K. 660
Bini, V. 470
Binsch, C. 403
Biondi, G. 380
Birkeland, K. I. 198, 306
Birkenfeld, A. L. 24, 72, 88, 193, 430, 530, 538, 551
Birman, P. 70
Birnbacher, R. 323
Birner-Gruenberger, R. 413
Birnie, E. 170
Bismuth, E. 171
Bispham, J. 743
Bitterman, O. 298
Biven, R. 103, 791
Bizzotto, R. 410
Bjerg, L. 157, 182
Bjerre, M. 977
Bjerre-Christensen, T. 804
Bjørkman, A.-S. D. 282
Björkström, N. 168
Blaak, E. E. 144
Blackbourn, L. A. K. 273, 701, 709, 792
Bladbjerg, E. M. 959
Blais, J. 558
Blanchard, A. 546
Blätter, J. 86, 87
Bleasdale, J. P. 722, 725
Blin, P. 900
Blond, K. 194
Blond, M. B. 293, 604, 607
Bloom, S. R. 548
Blüher, M. 41
Boavida, J. M. 443, 886
Bobrov, P. 98, 520
Bode, B. W. 48, 169, 173, 678, 715
Bodicoat, D. H. 230, 564
Bódis, K. 71, 166
Boerman, O. C. 43
Bogdanov, P. 78, 827
Bøgevig, S. 476
Boggi, U. 362
Boggs, R. 641
Bogomilov, I. 484
Bogunovic, N. 793
Böhm, A. 193
Boisseau, N. 623
Boitard, C. 52
Bojsen-Møller, K. N. 228, 411, 442, 607, 625
Boland, M. L. 129
Bolotko, Y. 436
Bomberg, E. M. 606
Bonadonna, R. C. 328
Bonàs, S. 109
Bonàs-Guarch, S. 316
Bonet, A. 765
Bönhof, G. J. 183, 851
Bonnefond, A. 217
Bonnemaison, E. 171
Bönner, A. 520
Bönner, F. 98
Bonnet, F. 295
Bonora, B. M. 104, 825
Bonora, E. 589
Bons, J. A. P. 883
Boocock, D. 45
Bóren, J. 883
Borges, D. O. 493
Borges, R. 630
Borrell, M. 670
Borrelli, A. 380
Bos, D. 519
Bos, M. 519
Boscari, F. 104
Boschero, A. C. 955
Boselli, L. 328
Bosi, E. 212, 360, 370, 396
Bosma, H. 332
Boss, A. 343, 497, 665
Boss, M. 43, 361, 393
Bossart, M. 578
Bøtker, H. E. 123
Botros, F. T. 577, 585, 588
Bouchi, R. 573
Boufleur Farinha, J. 196
Bouhours-Nouet, N. 171
Bouillet, B. 233, 523
Boujenah, J. 469
Boulton, D. W. 133
Bound, M. J. 25, 410, 439, 579
Bourbon, M. 524
Boury, S. 542
Bousboulas, S. 655
Bouslama, R. 808
Boutry, R. 217
Bovy, N. 52
Bowden Davies, K. 460
Bowe, J. 419
Boyadjieva, N. 484
Boyd, J. 678
Boye, K. S. 586
Boyle, M. 867
Bozzetto, L. 619
Bracken, R. M. 196, 197, 400, 401
Brackenridge, A. 423
Brage, S. 194
Bramante, C. T. 606
Bramlage, P. 291, 884
Branch, K. 148
Brandner, L. 729
Brandslund, I. 2, 977
Brandts, J. 884
Braun, A. 908
Brazg, R. 683, 693
Breitschaft, A. 555
Breton, M. D. 171, 713
Brette, S. 351, 667, 669, 784
Breuer, M. 430
Briand, F. 813
Brierley, G. V. 218
Briley, K. 231
Brings, S. 796
Brinkhues, S. 332
Brinton, E. 627
Bristianou, M. 284
Brito Casillas, Y. 466
Brito, G. C. 728
Brix, J. M. 431
Broca, C. 95
Brocchi, A. 427, 432
Brock, B. 268
Brodovicz, K. 289
Brolin, H. 458
Brom, M. 43, 361, 393
Brønd, J. C. 617
Brønden, A. 312, 539
Brøndsted, L. 656
Brooks, A. 740
Brorsson, C. A. 320, 353
Brøsen, J. 736
Brøsen, K. 26
Brousseau, E. 813
Brouwers, M. C. G. 727, 866
Brown, E. 876
Brown, S. A. 173, 715
Brož, J. 345
Brozek, J. 70
Brückel, J. 323
Brueckmann, M. 572
Bruggraber, S.
Bruggraber, S. F. A. 49, 320, 353
Brugnara, L. 196
Bruhn, L. 293
Bruls, Y. M. H. 17
Brunak, S. 320, 353
Brunetti, V. C. 290
Brunner, A. D. 211
Brunner, E. J. 335
Brunner, M. 567
Bruttomesso, D. 104, 667, 784
Buckingham, B. A. 173, 713, 715
Bueno, C. R. 184
Bue-Valleskey, J. M. 677, 681
Buffier, P. 233
Builles, N. 527
Buisson, J.-C. 108
Buitinga, M. 361, 393
Buldenko, T. 336
Burade, V. 580, 582
Burbridge, W. 722
Burdet, F. 327
Burgdorf, J. 479
Burkart, V. 71, 98, 166, 365
Burling, K. 581
Burrage, J. 315
Burrows, N. R. 66
Burton, J. 355
Busch, R. 627
Buschow, R. 34
Buse, J. B. 50, 134, 159, 779
Bushnell, D. M. 746
Busui, R. 844
Butler, J. 572
Buzzetti, R. 785, 854
Byberg, S. 282, 817
Byrne, D. V. 228
Bytyqi, L. 721
Cabrera, O. 94
Cacace, G. 307
Caccioppoli, C. 536, 907, 908
Cador, R. 894, 939
Cagatay, P. 615
Cahn, A. 561
Cai, Y. 152
Calafiore, R. 470
Calders, P. 849
Callaghan, B. C. 185
Calle, A. 346
Calliari, L. E. 669
Camacho, M. 259
Camastra, S. 119
Cambier, D. 849
Camerlingo, N. 747
Campbell, J. 719
Campbell, M. D. 398, 399, 699
Campi, F. 64
Campitelli, M. 307
Campodonico, J. 893
Campos-Nanez, E. 787
Cannistraci, R. 486, 878
Cannon, C. P. 122, 558
Canonica, J. 628
Canouil, M. 217, 219
Cao, H. 635
Cao, R. 954
Caparrotta, T. M. 79, 83
Capece, U. 263, 395
Capoccia, D. 505, 882
Cappellari, R. 825
Caprio, S. 67
Carbillon, L. 469
Cardarelli, F. 373
Cardozo, A. K. 223
Caren Sourij, C. 856
Carette, C. 546
Carl, M. H. 614
Carli, F. 119, 619
Carlier, V. 52
Carlson, A. 169, 678, 712
Carlsson, B. 97
Carlsson, E. R. 544
Carlsson, P.-O. 359
Carlsson, S. 299
Carneiro, E. M. 955
Caro, J. 670
Caroli, A. 470
CAROLINA investigators 149, 591
Carpena, M. 630
Carr, A. L. J. 262, 350
Carrat, G. 9, 219
Carriedo, P. 763
Carstensen, B. 268, 272, 282, 322, 899
Carter, K. 679
Carvalho, E. M. 252
Carvalho, L. 728
Casagrande, V. 137, 498, 815, 875
Cassidy, S. 867
Cassiman, D. 883
Castaño, L. 346
Casteels, K. 702
Castellanos, L. E. 172
Castillejo-López, C. 39
Cataldi, S. 76
Catapano, A. L. 91, 885
Catrina, S. 782
Catrina, S.-B. 976
Cavallo, M. G. 505, 532, 533, 882
Caxaria, S. 383
Cazaubiel, M. 425
Cazaubiel, M. 621, 623
Cebola, I. 219
Ceccarelli, V. 505, 532, 533, 882
Cederqvist, J. 924
Cefalo, C. M. A. 263, 395
Cela, V. 432
Celis-Morales, C. 6
Cen, H. 492
Cengiz, E. 713
Cento, A. 500
Cersosimo, E. 132, 571
Cesta, C. E. 424
CGM-TRAIN study group 639
Cha, J. 595
Chabanova, E. 614
Chabosseau, P. 9, 226
Chadt, A. 403, 405, 491
Chakarova, N. 482
Chalasova, K. 90, 811
Champon, B. 241
Chan, J. C. N. 292, 640, 649, 650, 975
Chan, P.-C. 165
Chan, W. M. 975
Chandra, V. 244
Chang, A. 672
Chang, A. 712
Chang, T.-H. 122
Chantelot, J.-M. 640, 649, 650
Chapman, I. 612
Charleer, S. 36, 702, 768
Charles, M. 157, 182
Charles-Edwards, G. 328
Charytan, D. M. 122, 560
Chatellier, G. 894, 939
Chatterjee, S. 230
Chaturvedi, N. 4
Chauchard, M.-C. 108
Chaumat, P. 70
Chavanelle, V. 448, 621, 623
Cháves, F.-J. 346
Cheen, H. M. 755
Cheer, K. 437
Chefu, S. 257
Chen, C. 441
Chen, D. 960
Chen, F. K. 643
Chen, H. 295
Chen, H. 377
Chen, J. 490
Chen, J. 888
Chen, L. 213
Chen, Q. 548
Chen, W. 261
Chen, X. 141
Chen, X. 261
Chen, Y. 688
Chen, Y. 976
Cheng, A. 671
Cheng, K.-P. 971
Chepurny, O. G. 94
Cherñavvsky, D. 713
Cherney, D. Z. I. 558, 559
Cherviakova, L. 336
Chetboun, M. 363
Chetouane, S. 489
Chevallier, J.-M. 546
Chiappetta, C. 505, 532, 882
Chiazza, F. 500, 902
Chibalina, M. V. 140
Chico, A. 259
Chigutsa, F. 688
Chiheb, S. 489
Child, C. J. 187, 746, 734
Chmura, P. J. 320, 353
Cho, D.-H. 937
Cho, J. I. 58, 677, 681
Cho, K. Y. 246, 575, 599, 751
Cho, Y. 340, 563, 592, 953
Cho, Y. 69, 879
Cho, Y. 73
Choi, I. 115, 127, 537, 871
Choi, J. 127, 537
Choi, S.-E. 501
Choi, Y. 69
Choudhary, P. 191, 700, 740, 747
Choung, S. 40, 167
Chow, E. 292
Chow, L. S. 404
Chow, W. 970
Chowdhury, S. 664
Christensen, A. S. 155
Christensen, B. 496
Christensen, D. H. 182, 185
Christensen, H. R. 268
Christensen, M. 139, 897
Christensen, M. B. 145, 188, 232, 476
Christensen, M. M. H. 27
Christensen, R. M. 607
Christiansen, A. S. L. 660
Christiansen, E. 593
Christiansen, M. 169, 693
Christie, M. R. 45
Christodoulides, C. 114
Chryssoula, B. 284
Chrzanowski, J. 703
Chuang, S.-M. 610
Chun, K. 805
Chundru, S. 374
Chung, D.-J. 937
Chung, J.-O. 937
Chung, W. 112
Churilov, L. 61
Churm, R. 400, 401
Ciardullo, S. 486, 878
Cibickova, L. 426
Ciccodicola, A. 76
Cigler, M. 742
Cignarelli, A. 380, 536, 907, 908
Cimini, F. A. 505, 532, 533, 882
Cinefra, C. 137
Cinti, F. 263, 395
Ciotti, S. 848
Cissell, D. 231
Ciunganu, T. 469, 891
Claessen, H. 276
Clark, A. 241
Clausen, J. O. 48
Cleal, B. 240
Clegg, L. E. 97, 133
Cleland, J. G. F. 933
Clement, M. 785
Clemente, G. 256, 633
Clemente-Postigo, M. 205
Clements, M. 778
Clemmensen, K. K. B. 293
Cline, G. W. 477
Close, K. 667, 669, 784
Cnop, M. 109, 152, 212, 316, 360, 394, 396
Coales, E. M. 398, 399, 699
Coates, V. 654
Cobo-Vuilleumier, N. 368
Coelho, M. 408, 443
Cohen, J. M. 424
Cohen, N. 717
Coin-Aragüez, L. 205
Coldewey, S. 371
Colé, N. 628
Coles, B. 647, 941
Colhoun, H. M. 79, 83, 148, 270, 273, 585, 587, 588, 701, 709, 792
Colineaux, H. 108
Collier, A. 792
Collino, M. 500, 902
Collins, J. 839
Collins, K. A. L. 146
Collombat, P. 368
Collotta, D. 500, 902
Colman, P. 717
Colombo, M. 792
Colomo, N. 346, 347
Conde, S. V. 494
Conget, I. 670
Connelly, K. A. 568
Connelly, M. A. 236
Conrad, A. 837
Conserva, F. 137
Constantino, M. I. 818
Contreras, P. H. 326
Conza, D. 330
Cooper, A. 278, 280, 295
Cooper, M. 138
Coppieters, K. 48
Coral Candelo, D. E. 111
Corcillo, A. 823
Cordiner, R. L. M. 600
Cornea, G. 837
Cornillet, M. 168
Coronel, R. 125
Correia, I. 443, 886
Cortese, V. 624
Cos, X. 785
Cosentino, C. 386
Cosentino, N. 893
Cosgrove, R. 556
Coskun, T. 116, 231, 556, 584
Coskunpinar, E. 615
Cosson, E. 469, 489, 891, 895
Cossu, E. 370, 533
Costa, N. 108
Costa, V. 76
Costa-Silva, B. 313
Costea, T.-C. 858
Costes, S. 8, 95
Coutant, D. E. 675, 676
Coutant, R. 171
Cowan, E. E. 389, 475
Cox, D. 586, 589
Craig, M. 73
Crenier, L. 36, 768
Crevisy, E. 233
Criego, A. 173, 715
Croyal, M. 234
Cruciani-Guglielmacci, C. 234
Cruz, A. M. 189, 457
Csajbok, E. 303
Cui, L. 390
Cui, L. J. 379
Cui, N. 687
Curovic, V. R. 101, 820
Cuthbertson, D. J. 460, 876
Czernichow, S. 546
Czupryniak, L. 696, 850, 855
Czyzyk, J. 47
Da Dalt, L. 91, 885
Da Porto, A. 238
Daffonchio, L. 370
Daflla, L. 344
Dagenais, G. R. 587
Dagnelie, P. C. 201, 332, 481, 611, 727, 761, 961
Dahl, D. 681, 738
Dahlin, L. 853
Dahlqvist Leinhard, O. 972
Dahm, C. C. 333
Dai, A. 138
Dai, Y. 338, 357, 384, 471
Dal, J. 279, 296
Dalgaard, L. T. 252
Dalhoff, K. P. 476
Dall, M. 142
Dalla Man, C. 72
Dalla-Vale, F. 171
Dalle, H. 523
Dalle, S. 8
Dalle, S. 95
Dallmeier, D. 968
Dalton, C. 311
Dam, N. 70
Damaraju, C. V. 558
Damiano, E. R. 172, 716
Damm, P. 85
Daniels Gatward, L. F. 507
Danne, T. 291, 676, 731, 884
Dannecker, C. 23, 538
Darmon, P. 158, 900, 945
Dart, A. B. 800
DARWIN-T2D Network of the Italian Diabetes Society 881
Das, A. K. 664
Dasgupta, B. 317
Dashkin, M. V. 861
Daskalova, I. 484
Dassau, E. 752
Dátilo, M. N. 77, 179
Datta, N. 13, 462
Dautzenberg, B. D. 229
David, F. 947
Davidova, E. 518
Davies, B. 140
Davies, J. 315
Davies, M. 265
Davies, M. J. 230, 343, 564, 647, 941
Davis, A. M. 7
Davis, T. M. E. 65, 81, 158, 643, 945
Davis, W. A. 65, 81, 643
Dayan, C. 52, 321
de Almeida, M. E. 195
De Angelis, L. 498
De Bandt, D. 546
De Block, C. 36, 768, 830, 880
De Cosmo, S. 1, 256, 633
De Franco, E. 152, 315
De Galan, B. E. 190, 192, 393, 727, 733, 739
de Gennaro, G. 427, 432, 433, 435
de Groot, D. M. 883
de Koning, E. J. P. 361
de Ligt, M. 229
de Loor, H. 464
De Luca, C. 212, 360, 396
de Lusignan, S. 756
De Metrio, M. 893
De Pouvourville, G. 705
De Ridder, F. 36, 768
de Sousa, G. 323
de Valk, H. W. 85
de Vries, F. 279, 828
de Wendt, C. 405
de Winter, T. J. J. 950
de Zeeuw, D. 122, 560
de Zoysa, N. 740
Deacon, C. F. 442, 625
DeBoer, M. 713
Dedhia, M. 769
Dedov, I. 339
Deere, R. 400, 401
DeFedele, C. 659
Defeudis, G. 209
Defrance, M. 109
DeFronzo, R. A. 132, 141, 571
Dehbi, M. 463
Dejgaard, T. F. 145, 232, 603
Dekker, P. 170
Del Favero, S. 747
Del Prato, S. 64, 427, 432, 433, 435, 482, 609, 920
Delaunay, J. 108
Delbeke, D. 726
Delgado, E. 346
Delgado, E. 670
Della Pepa, G. 619
DellaValle, B. 504
Dellva, M. A. 675, 679, 681
Delobel, M. 95
Demarez, C. 152
Demeyer, H. 849
Dempsey, P. 398, 399
Deng, W. 249
Deng, W. 682
Denimal, D. 523
Dennis, A. 877
Dennis, J. M. 776
DePaoli, F. V. 906
Dereke, J. 760
Déruaz-Luyet, A. 289
Desai, N. 566
Deschênes, S. 766
Desiderio, A. 330
Desouza, C. 596
Desoye, G. 413, 416
Detournay, B. 705
Dettmer, R. 356
DeVries, J. H. 656
Dex, T. 343
Dhand, S. 620
Di Bartolo, P. 238, 256, 633
Di Biasio, A. 532
Di Cairano, E. 386
Di Camillo, B. 121
Di Carlo, A. 120
Di Cristofano, C. 505, 532, 882
Di Giuseppe, G. 263, 325
Di Gregorio, A. 9
Diabetes in Pregnancy GSTT team 423
Diamant, M. 459
Diane, A. 463
Dias, S. 302
Díaz, L. 817
Diaz, L. J. 101
Diaz, R. 587
Diaz, S. 663
Diaz-Contreras, I. 368
Didangelos, T. 843
Dienes, J. 551
Dietrich, M. 197
Dietz, B. 551
Dieuzeide, G. 158, 945
Dillon, A. 283, 645
Dillon, B. 844
Dimai, H.-P. 856
Dimitrakopoulos, K. 535
Dimitriadis, G. 284
Dimosthenopoulos, C. 207
Dimova, R. 482
Ding, L. 220
Dingena, C. 398, 399, 699
DiNunzio, G. 409
Dipta, P. 502
Dirinck, E. 830, 880
Dirksen, C. 411
Dischinger, U. 626
Distler, M. 211
Divella, C. 137
Divilly, P. 700
Divyalasya, T. V. S. 606
Dixon, R. F. 107
Dmitriev, I. 863
Dogan, T. 969
Dolinsky, V. W. 156
Domján, B. A. 429
Domon, A. 517
Donaghue, K. 73
Donahue, M. J. 392
Donatsky, A. M. 660
Dong, B. 951
Dong, M. 455
Dong, X. 690
Donnelly, L. A. 776
D'Onofrio, L. 854
Doria, A. 184
D'Oria, R. 907, 908
Doros, G. 638, 872
dos Santos, A. F. 372
Dotres, K. 765
Dotta, F. 223, 320, 353
Doucette, C. A. 156
Douglas, K. 723
Doumas, M. 889
Doupis, J. 344
Dowd, R. 105
Downs, E. 744
Doyle, R. T. 627
dQ&A 773
Drevon, C. 198
Drexel, H. 921, 930
DRGROSS Study Group 630
Driessen, J. H. M. 828
Drinkwater, J. 643
Driva, S. 655
Drojdahl Ryg, N. 254
Dronova, A. 436
Drousiotou, A. 247
Droz, B. 556
Droz-Perroteau, C. 900
Drury, P. 162
Drzazga, A. K. 444
Du, Y.-F. 9 71
Du, Z. 275
Duarte, N. 493
Duarte, R. 443, 886
Dubourg, J. 634, 637
Dubsky, M. 859
Duff, C. 241
Duffin, K. L. 146, 577
Duijs, J. M. G. 177
Duijvestijn, P. H. 822
Duke, D. 786
Dukers-Muijrers, N. H. T. 332
Dullaart, R. P. F. 236
Dumbill, R. 114
Dumitras, D. 763
Dumont, V. P. 808
Dunbar, M. B. 899
Dungan, K. M. 593
Dunger, D. B. 49, 320
Dunger, D. D. 353
Dunkley, A. 423
Dunn, I. 50, 51
Dunn, T. C. 729
Dunne, J. L. 202, 318, 319, 355, 364
Dunseath, G. J. 400, 401
Dunstheimer, D. 323
Dupuy, O. 894, 939
Duque, N. 663
Dureau-Pournin, C. 900
Durocher, A. 624
Dürrbeck, S. 707
Duvillard, L. 233
Dvergsten, C. 50
Dwarampudi, S. 832
Dwivedi, O. P. 244
Dwulet, J. M. 7
Dyal, L. 587
Dyer, W. 653
Eberl, A. 567
Ebert, T. 464
Eby, E. 698
Echeverri, F. 94
Eckel, J. 54
Eckert, A. 968
Eckstein, M. L. 196, 197, 400, 401, 616, 742
Eckstein, S. S. 72, 88
Edelman, S. 784
Edwall Löfvenborg, J. 299
Edwards, S. S. 771
Edwardson, C. L. 230, 564
Eggers, B. 966
Egholk, J. 188
Ehrmann, D. 745, 757, 759, 767, 789, 790
Eichinger, V. 103
Eickelschulte, S. 491
Eide, H. N. 288
Eika Jørgensen, M. 817
Eizirik, D. L. 109, 152, 212, 216, 244, 316, 360, 394, 396
Ejskjaer, N. 769, 775, 828
Ekelund, M. 684, 716
Ekhlaspour, L. 713
Ekinci, E. I. 61
Ekman, L. 853
El Bekay, R. 205
El Boustany, R. 799
El Fathi, A. 174
El Haddouchi, A. 312
El Malahi, A. 36, 768
EL-Adawy, E. 833
Elawour, M. 378
Eldor, R. 60
Eleftheriadou, I. 207, 251
Elgzyri, T. 853
Eliasson, B. 545, 974
Eliasson, L. 12, 215
Elisaf, M. S. 889
Eliuz Tipici, B. 615
Eljaafari, A. 42
El-Khatib, F. 172, 716
Elkjær, I. 618
Ellacott, K. L. J. 189
Ellervik, C. 113
Elmore, C. S. 576
Elsayed, H. 742
Elsner, M. 367
Elvira Jimenez, B. 224
Emanuel, A. L. 459
Emery, C. 705
Emmerson, P. J. 116, 231, 556
Emral, R. 666
Emri, M. 967
Engberg, S. 232
Engel, D. F. 955
Engeland, A. 424
Engelse, M. A. 361
Engström, G. 924
Engvall, J. 924
Ennaifer, H. 402
Eppel, D. 86, 87
Eppel, W. 86, 87
Ericsson, Å. 239, 788
Eriksen, K. T. 158
Eriksen, P. L. 142
Eriksson, J. W. 39, 487, 502, 528, 547
Eriksson, M. I. 75
Eriksson, O. 124, 361, 578
Eringa, E. C. 459
Esguerra, J. L. S. 109, 215, 316
Espelage, L. 405
Espeland, M. A. 149, 591, 732
Esterline, R. 229, 576
Esze, R. 967
Eussen, S. J. P. 201, 332, 481, 611, 727, 761, 961
EVADIAC study group 59
Evans-Molina, C. 320, 824
Evenepoel, P. 464
Evenou, P. 671
Evers, A. 578
EVOLVE study group 85
Expósito Montesdeoca, A. 466
Faber, J. 188, 476, 539, 897
Faber, L. 793
Fabricius, T. W. 739
Fabris, C. 704
Facchinetti, A. 747
Fachim, H. A. 308, 309, 311
Fadini, G. P. 104, 121, 825, 881
Færch, K. 293
Fahrleitner-Pammer, A. 721
Fainberg, U. 102
Falcetta, M. 630
Falcetta, P. 64
Falkenhahn, M. 139
Fall, C. H. D. 934
Fan, L. 698, 743
Fang, F. 954
Fantuzzi, F. 152
Farkas, D. K. 82
Farrell, C. M. 706
Farret, A. 171
Farrow, F. 823
Farup, J. 906
Faure, N. 171
Fava, D. 633
Fava, F. 500, 902
Federici, M. 137, 498, 815, 875
Fedotkina, O. 336
Fee, A. J. 963
Feher, M. D. 756
Feigh, M. 128
Feijó, S. 728
Fejfarova, V. 859
Feldman, E. L. 185
Fellahi, S. 799
Fellinger, P. 28
Felner, E. 53, 631
Femke AI Ehlers, Lotte Wieten 503
Fend, F. 530
Fendler, W. 703
Feng, B. 454
Feng, W. 245, 261
Fenger, M. 544, 581
Fenici, P. 278, 280
Ferdousi, M. 854
Fernandes, C. 419
Fernandez, C. 214
Fernandez-Garcia, J. 205
Fernández-Tajes, J. 111
Fernø, J. 168
Ferrannini, E. 119, 120, 124, 410
Ferrannini, G. 587
Ferraro, P. M. 263
Ferreira Alves, G. 500
Ferreira, I. 903
Ferreira, I. A. 313
Ferreira, J. P. 947
Ferrer, J. 109, 316, 368
Ferri, G. 373
Ferrinho, C. 524
Feskens, E. J. 866
Festa, C. 298
Feuerriegel, S. 748
Fève, B. 523
Fex, M. 389, 475
Ficorilli, J. 94
Field, B. C. T. 756
Fignani, D. 320
Filardi, T. 341
Filion, K. B. 290
Fink, L. N. 835
FinnDiane Study Group 62, 816, 826, 926, 931
Firneisz, G. 873
Fisher, L. 769
Fisker, F. 461
Fitchett, D. 565, 566, 572, 933
Fitts, E. 669
Flack, J. R. 865
Flaxman, C. S. 262
Fleisch, E. 748
Fleming, A. 60
Fleming, M. 128
Fleming, T. 31, 796, 798, 847, 852
Florese, P. 330
Flores-Guerrero, J. L. 236
Florez, J. C. 112
Florissi, C. 773
Fogden, E. N. 722, 725
Fong, C. H. Y. 970
Fonseca, M. 156
Fonseca, V. 184, 665
Fonseca-Pinto, R. 728
Fontaine, P. 425
Fontana, F. Y. 255
Foppen, E. 234
Forberger, A. 327
Foreman, R. 225
Foreman, Y. D. 727
Forlenza, G. P. 173, 713, 715
Formigari, G. P. 77, 179
Fornego, R. 238
Forsblom, C. 62, 75, 100, 160, 749, 794, 808, 816, 904, 925, 926, 931, 952
Fortmann, A. L. 772, 778
Fortuny, R. 765
Foschini, L. 785
Foufelle, F. 234
Fountoulakis, N. 823, 839
Fouqueray, P. 634, 637
Foxton, R. 628
Fragoso-Bargas, N. 306
Francesconi, P. 64, 920
Franch-Nadal, J. 346
Francois, M. 398, 399
Francque, S. 70, 880
Franek, E. 684
Franklin, J. 289
Franks, P. W. 111, 199
Franzén, S. 6, 545
Frascerra, S. 410, 962
Fraunberger, P. 930
Frayling, T. M. 264
Freckmann, G. 639
Fredriksson, I. 250
Fredriksson, M. 806
Free-life Kid AP Study Group 171
Freeman, J. L. R. 50, 51
Frias, J. 589
Friberg, L. 161
Friborg, S. 977
Frič, P. 949
Friedel, H. 276
Friedrich, A. 11
Friedrichsen, M. 555
Friel, K. M. 654
Frielink, C. 393
Frier, B. M. 754
Frimodt-Møller, M. 795, 940
Frishman, S. 436
Fritsche, A. 23, 24, 72, 88, 193, 430, 538, 551
Fritsche, L. 23, 24, 88, 430, 538
Froguel, P. 217, 219
Frohnert, B. I. 202, 318, 319
Frøkiær, J. 906
Froment, T. 240
Frontoni, S. 848
Fruhwald, F. 781
Frystyk, J. 2, 614
Fu, Q. 248, 377
Fuchigami, A. 509
Fujisawa, H. 412
Fujita, Y. 301
Fukuda, T. 573
Fukui, M. 206
Fukui, T. 911, 915, 918
Fuller, J. H. 4
Fumeron, F. 799
Fumery, M. 894
Furu, K. 421, 424
Furukawa, M. 354
G. Simons, P. I. H. 883
Gabbay, R. A. 107
Gadsby, R. 265, 842
Gadue, P. 219
Gaffney, T. P. 754
Gaggini, M. 119, 882
Gagliardino, J. J. 351, 640, 649, 650, 669
Gál, V. 873
Galderisi, A. 67
Gali, C. C. 417
Gallego-Gamero, F. 714
Galli, A. 91, 386, 388
Gallone, A. 137
Galsgaard, K. D. 142, 477
Galtier, F. 527
Galuska, D. 811
Galuška, D. 860
Ganda, O. 627
Gangyi, Y. 446
Gannon, M. 368
Ganss, K. 11
Gao, R. 248, 377
Garai, I. 967
García Delgado, Y. 466
Garcia Escobar, E. 346
Garcia Serrano, S. 347
Garcia, M. 368
García-Serrano, S. 346
Garçon, P. 894, 939
Garden, G. L. 754
Gardete-Correia, L. 443, 886
Garfield, N. 174
Garg, S. 169
Garofolo, M. 64, 341, 920
Garoufi, A. 889
Garreta, E. 180
Garvie, A. 416
Gasbjerg, L. S. 232
Gastaldelli, A. 28, 119, 571, 619, 882
Gattesco, S. 10
Gaudioso, G. 500, 902
Gaus, B. 391
Gause-Nilsson, I. A. M. 561
Gauthier, B. R. 368
Gautier, T. 523
Gavalda-Navarro, A. 180
Gawish, H. 833
Gaysina, L. 48
GDS Group 71
Ge, R.-B. 954
Gedebjerg, A. 977
Geist, S. 291
Genchi, V. A. 536, 908
Gendaszewska-Darmach, E. 444
Geng, S. 445
Genovese, F. 577
Genovese, S. 164, 893, 917, 965
George, J. 694
George, J. T. 565, 566, 569, 570, 572, 591, 732, 933, 947
George, M. 417
Georgiadou, E. 9, 226
Georgopoulos, I. 655
Geraets, A. F. J. 761
Géraud, P. 527
Geravandi, S. 317
Gerber, M. 787
Gerdes, J. M. 368
Gerlach, J. Q. 902
Gerling, I. 314
Gerring, D. 55
Gerst, F. 530
Gerstein, H. C. 148, 184, 585, 587, 588, 598
Gesualdo, L. 137
Ge-Zerbe, L. 738
Ghalwash, M. 364
Ghanbari, M. 519
Ghannam, A. F. 629, 632
Ghantous, R. 869
Ghislanzoni, S. 386, 388
Ghoreishi, Y. 626
Ghosh, A. 780
Ghosh, M. 221
Ghosh, R. 664
Giacca, A. 447
Giaccari, A. 263, 325, 395
Gianetti, E. 362, 396
Giannarelli, R. 920
Giannulaki, P. 843
Gibb, F. 701, 709
Gibson, M. 271, 308, 309, 311
Giera, S. 243
Giezenaar, C. 612
Gikas, A. 284
Gilbert, L. 770
Gilbert, R. E. 568
Gill, J. 659, 671
Gillard, P. 36, 370, 702, 768
Gillespie, P. 654
Gillessen, A. 968
Gillies, C. 343, 647
Gilon, P. 8
Giménez, M. 187
Gimenez, M. 670
Giorda, C. B. 238
Giorgino, F. 370, 380, 536, 907, 908
Gislason, G. 897
Gissler, M. 424
Giuliani, C. 298
Glasner, A. 413, 416
Głażewski, T. 850
Gliemann, L. 959
Gloyn, A. L. 109, 241, 316
Gluais-Dagorn, P. 910
Gluud, L. 142
Gmitrov, J. 834
Göbl, C. S. 86, 87
Goda, K. 150, 277
Godet, M. 973
Goetter, K. 231
Goetze, J. P. 603, 797
Goff, L. M. 328
Gogate, J. 558
Goh, S.-Y. 755
Gokhale, K. 118
Goldenberg, R. 56, 660
Goldfaden, R. 710, 711
Goldmannova, D. 426
Goldspink, D. 225
Gomes, M. B. 280
Gomes, V. M. 372
Gómez Peralta, F. 666
Gómez, B. 259
Gomez-Rodriguez, P. 549
Gonder-Frederick, L. 740
González de Pablos, I. 549
González-Lleó, A. 466, 467
Gonzalez-Rivas, J. P. 345
Goossens, G. H. 144
Gordin, D. T. 75, 808, 904, 925, 926
Gore, A. 710, 711
Gormsen, L. C. 123
Goscinny, S. 483
Goto, A. 74
Goto, M. 354
Gotthardt, M. 43, 361, 393
Gottlieb, P. 321
Gottmann, P. 352
Gøtze, J. 625
Gøtze, J. P. 144
Gough, D. J. 216
Gougourelas, D. 655
Gourdy, P. 108
Gowda, A. 657
Gowri, M. 934
Graham, A. 382
Grajales, D. 475
Gräler, M. 371
Gram, J. 254
Gram-Kampmann, E. M. 617
Grand, M. K. 943
Granlund, L. 203
Granowitz, C. 627
Grant, M. 674
Grant, M. 824
Graungaard, T. 716
Gray, L. J. 230
Greaux, E. 172
Greci, S. 209
Greene, T. 558
Greenstone, M. A. 725
Greenwood, C. 725
Gregersen, S. 228
Gregg, E. 153
Greiner, R. S. 253
Grespan, E. 478
Gribble, F. 225
Gribsholt, S. B. 82
Grieco, G. E. 320
Grieve, S. M. 865
Grineva, E. 436
Grivell, J. 25, 410, 579
Grocott, S. 218
Grønbæk, H. 26
Grøntved, A. 194
Groop, L. 63, 244, 299, 406, 543
Groop, L. C. 306
Groop, P.-H. 62, 75, 100, 160, 749, 794, 808, 816, 826, 904, 925, 926, 931, 952
Groos, S. 741
Grosfeld, A. 523
Grosman, B. 680
Gross, J. 428
Gu, N. 929
Gu, T. 305
Gu, W. 814
Gualdani, E. 64, 920
Guarino, M. P. 728
Guasch-Ferre, M. 112
Gubian, L. 121
Guccio, N. 243
Gudbjornsdottir, S. 6
Guerci, B. 59, 705
Guerrini, S. 120
Guiard, E. 900
Guibert, S. 973
Guigas, B. 448, 623
Guindo, M. 109
Guindo-Martínez, M. 316
Guitton, J. 21
Gulseth, H. L. 288, 421, 424
Gumprecht, J. 48
Gundgaard, J. 788
Günster, C. 276
Guo, X. 807, 929
Gurgul-Convey, E. 371, 387
Gurnaghan, S. M. C. 270
Gurzov, E. N. 216, 224
Gustenhoff, P. 736
Gutierrez, V. 214
Gyawali, B. 348
Gysemans, C. 369
H Sonoda, K. 74
Haack, T. 578
Haahr, H. 656
Haak, T. 745
Haastert, B. 829
Håberg, S. E. 288
Haberl, H. C. 721
Haberland, H. 323
Hachmann-Nielsen, E. 159
Hackett, G. 842
Hada, Y. 957
Hadjiyannakis, S. 800
Hædersdal, S. 155
Haering, H.-U. 23, 551
Hagemann, C. A. 139
Hagen, B. 741
Hägg-Holmberg, S. 931
Haghighi, M. 254
Hagopian, W. 202, 318, 319, 364
Hagvall, S. 576
Haidar, A. 174
Haider, A. 638, 872
Haider, K. S. 638, 872
Haigh, L. 867
Hainey, K. 274
Hajji, Y. 70
Hakaste, L. 406
Hakim, O. 328
Hakoshima, M. 342
Haldrup, S. 283, 645
Hale, P. M. 606
Hálfdánarson, Ó. Ö. 424
Hall, G. V. 438, 618
Hall, L. 831
Hallahan, N. 352
Hallakou-Bozec, S. 910
Hallén, N. 239
Haller, M. J. 53, 631
Halliday, D. 877
Hallström, S. 963
Hallsworth, K. 867
Haluzik, M. 518, 552, 531, 753
Hamamoto, Y. 297, 301
Hamid, Y. H. 730
Hamilton, A. 475
Hamilton, J. 800
Hammar, N. 280, 295
Hammoud, S. 696
Hamo, E. 489
Hamrén, B. 97
Han, D. 446
Han, F. 130, 135, 864
Han, K. 434, 946
Han, K.-D. 935
Han, S. 501, 805, 862
Han, X. 135
Hanaire, H. 108
Handa, T. 354
Handa, T. 751
Handberg, A. 27
Hanf, R. 70
Hankir, M. 626
Hannon, E. J. 315
Hansen, A. E. 442
Hansen, C. D. 617
Hansen, C. P. 188, 574
Hansen, C. S. 804
Hansen, D. L. 544, 651
Hansen, D. L. 737
Hansen, J. 123
Hansen, J. L. 129
Hansen, K. B. 618
Hansen, L. H. 144
Hansen, M. 56, 658
Hansen, M. L. 442
Hansen, T. 155, 795
Hansen, T. H. 795
Hansen, T. K. 123, 736, 977
Hansen, T. W. 101, 525, 795, 797, 804, 819, 820, 938
Hanssen, N. 33
Hantel, S. 565, 566
Hapca, S. 706
Harding, J. L. 66
Hardy, T. 672, 677, 678
Hargreaves, M. 758
Häring, H.-U. 23, 24, 72, 88, 193, 530, 538, 551
Harjutsalo, V. 62, 100, 749, 816, 926, 931, 952
Harreiter, J. 873
Harring, S. 605, 779
Harris, S. 686, 750
Harrison, S. A. 70
Hartmann, B. 145, 188, 228, 232, 442, 574, 614
Hartmann, B. 968
Hartvig, N. 782
Hartwig, S. 491
Harvie, M. 208
Hasbak, P. 938
Hasenour, C. 148
Hashimoto, Y. 206
Hashish, A. 463
Hasib, A. 515
Hassanein, M. 624
Hasse, B. 54
Hasselstrøm Jensen, M. 279
Hasselstrøm, M. 828
Hassing, A. S. 142
Hastoy, B. 219, 241
Hatam, S. 273
Hatano, A. 777
Hattersley, A. T. 152, 264, 315, 331, 350, 776
Hattori, M. 668
Hatzitolios, A. 843
Haugaard, S. B. 581, 614
Haugstøyl, M. E. 168
Haukkala, A. 110
Haupt, A. 116, 146, 231, 584
Hautala, L. C. 451
Havekes, B. 17, 229
Hayase, A. 354
Hayashi, Y. 412
Hayashi, Y. 914
Haywood, S. 740
He, M. 874
He, X. 771
He, Y. 377
Heald, A. 308, 309, 311
Heald, A. H. 265, 271, 842
Hecht, M. 54
Hecking, M. 662, 685, 692
Hedbäck, N. 411
Hedetoft, C. 736
Hedin, A. 203
Hedrick, J. A. 53, 355, 631
Heerspink, H. J. L. 122, 133, 236, 558, 559, 560
Heijster, J. 846
Heimbürger, S. M. N. 145, 232
Heinemann, L. 639, 789, 790
Heinrich, N. S. 797
Heise, T. 567, 656
Hejlesen, O. 269
Heller, S. 740
Heller, S. R. 661, 744, 754
Hellwig, M. 902
Hempel, C. 504
Hemsley, P. 129
Hendrieckx, C. 717
Hendriks, J. 830
Hengeveld, E. 260
Heni, M. 23, 24, 72, 88, 193, 430, 530, 538, 551
Henle, T. 902
Henley, W. E. 776
Hennayake, C. K. 515
Henriksen, J. E. 270
Henriksen, P. 795
Henriksen, T. 544
Henry, J.-P. 913
Henry, P. 900
Henry, R. M. A. 481, 761, 961
Herder, C. 166, 520, 851
Herebian, D. 403
Hermann, P. 617
Hermanns, N. 745, 757, 759, 767, 789, 790
Hermansen, K. 228
Hernández, C. 78, 827, 903
Hernandez, J. P. 345
Herranz, L. 422
Herring, J. A. 513
Herrington, D. 627
Hertz, C. L. 593
Herwig, R. 403
Herzig, S. 796
Herzog, K. 299
Hess, E. 884
Hess, M. 323
Hesselink, M. K. C. 17
Hessler, D. 769
Hettiarachchige, N. 945
Hetty, S. 39
Heurling, K. 124
Heyer, C. 968
Higgins, V. 641
Hill, A. 253, 350
Hill, M. 30, 552
Hillard, M. 172
Hiller, J. 858
Hillman, M. 760
Hillman, N. 422
Himeno, T. 914
Hindsø, M. 411
Hine, J. L. 754
Hinse, D. 793
Hinton, W. 756
Hirano, T. 911, 915, 918
Hiromura, M. 911, 915, 918
Hirose, A. 74
Hirose, T. 509, 668
Hjellvik, V. 288, 421
Hjort, R. 299
Hjortebjerg, R. 2
Hlaváček, D. 531
Hlinomaz, O. 345
Hobson, S. 464
Hoch, D. 413, 416
Hochfellner, D. A. 721, 742, 781
Hodson, L. 883
Hoe, B. 145, 232
Hoeks, J. 229
Höffgen, M. 798
Hoffmann, F. 276
Hoflack, B. 11
Hofmann, P. 196
Hofmann, V. 754
Höhn, A. 79
Hoiberg, M. 732
Højlund, K. 27, 195, 617
Holl, R. 968
Holl, R. W. 291, 884
Hollingsworth, K. G. 18, 235
Hollmann, M. W. 125
Holman, R. R. 133, 776
Holmes-Walker, J. 717
Holmvang, L. 938
Holst, A. G. 258
Holst, I. 605, 779
Holst, J. J. 142, 144, 145, 155, 188, 228, 232, 293, 411, 438, 442, 476, 477, 479, 496, 540, 574, 604, 607, 614, 625, 897, 959
Holubkov, R. 30
Holz, G. G. 94
Homer, K. 60
Honeder, S. 413
Hong, L. 950
Hong, S. 69, 879
Hong, T. 158, 945
Hong, T. 305
Honka, H. 543
Hoogwerf, A. L. 57, 673
Hoogwerf, B. J. 57, 673, 674
Horie, I. 143
Horikawa, Y. 297
Hořínek, A. 949
Hornemann, S. 34
Horowitz, M. 25, 410, 439, 441, 579, 758
Horsch, A. 770
Horstkotte, D. 793
Horváth, V. J. 429
Hošková, E. 440
Hoskova, E. 936
Höskuldsdottir, G. 545
Hosmane, S. 70
Hottinger, A. 778
Hou, J. 597
Hou, N. 130, 135, 864
Houben, A. J. H. 481, 503
Houten, S. M. 125
Hove, J. D. 959
Hövelmann, U. 656, 735
Howell, S. 55
Hristov, I. 529
Hsieh, P.-S. 165
Hsu, P.-H. 610
Hu, C.-Y. 971
Hu, F. B. 112
Hu, M. 219
Hu, W. 534
Hu, X. 950
Hu, Y. 613
Huang, C. 418
Huang, H. 583
Huang, J. 485
Huang, K.-L. 971
Huang, L. 583
Huang, N. 130, 864
Huang, N. 338
Huang, R. 956
Huang, X. 896
Huang, Y. 220, 245, 261
Huang, Y. 687
Huang, Z. 682
Hubackova, S. 518
Hubbard, B. T. 477
Hubber, E. L. 381
Hudson, M. 264
Huerta, J. 78
Hugger, M. B. 617
Hughes, A. 743
Huh, B. 69
Huh, J. 562
Hull, W. 500
Hulman, A. 270, 332
Hulme, A. 208
Hulme, O. J. 228
Hum, D. W. 70
Humbert, L. 542
Hummel, J. 23, 24, 538, 88
Hung, H.-C. 971
Hunt, B. 788
Hunt, J. E. 144
Hunt, K. 156
Huptas, M. 884
Hurtado del Pozo, C. 180
Husakova, J. 859
Huschto, T. 791
Husemoen, L. 85
Hussain, K. 719
Hussein, B. 912
Husslein, P. 86, 87
Hutchison, E. J. 754
Hüttl, M. 510
Huyett, L. M. 712
Huynh, L. Q. 758
Huysmans, H. 726
Hvid, C. 647, 941
Hwang, J.-H. 71, 98, 365
Hwang, Y. 809
Hyo, T. 301
Hyun, B. 595
Ibberson, M. 211, 212, 217, 219, 327
Ibrahim, H. 152, 244
Icks, A. 276, 829
iDCL Trial Research Group 713
Idorn, T. 134
Igata, M. 38
Igaz, P. 873
Ignaut, D. 58, 678
Iijima, T. 691
Iizuka, K. 297
Ikegami, H. 351, 667
Ikram, A. 519
Ikram, M. 204
Ilkova, H. 640, 649, 650
Imai, S. 206
Imbernon, M. 553
Imholz, B. P. M. 846
Imperatore, G. 66
Inagaki, N. 297
Incani, M. 533
Indelicato, L. 763
Indovina, F. 362
Infante-Garcia, M. M. 345
Inkeri, J. 925
Inokuma, S. 342
Inshaw, J. R. J. 262
International Quality of Care for Type 1 Diabetes(IQoC-T1) Group 324
Inzucchi, S. E. 559, 565, 572, 933, 947, 974
Ioannidis, I. 237
Iraklianou, S. 237
Iredahl, F. 250
Irwin, S. P. 722
Isackson, H. 124
Isakov, M. 339, 890
Isaksen, A. A. 282
Isendahl, J. 657
Ishibashi, R. 150, 277
Ishikawa, T. 150, 277
Issa, B. G. 208, 437
Itaya-Hironaka, A. 385, 453
Ito, A. 143
Ito, Y. 20, 541, 554
Itoh, J. 573
Iuliani, G. 815, 875
Ivák, P. 531
Iwasaki, H. 957
Iyer, A. 106
J. Brouwers, M. C. G. 883
Jackson, R. 162
Jacob, P. 191, 700, 740
Jacobson, T. A. 627
Jacovetti, C. 10
Jacques, R. M. 744
Jaeger, M. 190
Jaehnert, M. 352
Jaffredo, M. 241
Jafri, R. Z. 172, 716
Jäger, S. 281
Jain, R. 389
Jakobsen, P. 269
Jakobsen, S. 906
Jamal, W. 565
James, M. A. 258
James, R. 783
Jamiołkowski, J. 764
Jan Willem Greve, Sander S Rensen, 503
Jandeleit-Dahm, K. 138
Janeczko, L. 630
Janež, A. 550
Janku, P. 90
Jannin, A. 363
Jansen, T. J. P. 361, 393
Janssen, A. W. M. 190
Janssen, M. J. R. 43
Jansson, S. 84
Jantz, J. 712
Janus, C. 540, 604, 607, 959
Januszewski, A. S. 73, 960
Januzzi, J. L. 558
Jardine, M. J. 122, 560
Jaroslaw Chmura, P. 49
Jarvis, J. 423
JDRF Australia Hybrid Closed Loop Study Group 717
Jeandidier, N. 59
Jebasingh, F. 934
Jeffries, A. R. 315
Jelsing, J. 139, 312, 835
Jendle, J. 239, 782, 788
Jenkins, A. J. 73, 680, 717, 960
Jenkins, M. G. 208, 646
Jensen, J. B. 906
Jensen, J. K. 101
Jensen, J. M. 617
Jensen, J.-E. B. 607
Jensen, M. 296
Jensen, M. D. 404
Jensen, M. H. 269
Jensen, N. J. 99, 504
Jensen, S. B. K. 540, 604, 607, 959
Jensen, T. 736
Jensen, T. S. 182, 185
Jenssen, H. 252
Jenssen, T. G. 662, 685, 692
Jenum, A. K. 306
Jeon, J. 501, 805, 862
Jeppesen, J. L. 797
Jermutus, L. 511
Jessen, N. 26, 496, 906
Jesuthasan, A. 235
Jetha, M. 800
Jeyam, A. 79, 83, 701, 709
Jezek, J. 55
Jha, J. C. 138
Ji, J. 480
Ji, L. 280, 295, 569, 687, 785
Ji, Q. 569
Ji, Y. 697
Jia, T. 661
Jiang, H. 248
Jiang, H. 377
Jiao, L. 627
Ji-Cao, J. 14
Jiménez-Sánchez, C. 325
Jirkovska, A. 859
Jo, H. 127, 870, 871
Jódar, E. 684
Joensen, L. E. 651
Joergensen, M. E. 651
Joerns, A. 44
Jõgis, A. 147
Johannesen, H. H. 442
Johannsen, M. 123
Johansen, N. J. 603
Johansen, O. E. 149, 565, 569, 591, 732, 974
Johansson, E. 124
Johansson, L. 578
Johnson, J. 771
Johnson, J. D. 492, 950
Johnson, M. 934
Johnson, N. A. 865
Johnson, R. 208
Johnston, D. 153
Johnston, L. W. 333
Jojima, T. 691
Jonas, W. 352
Jonasson, H. 250
Jonckheere, N. 217
Jones, A. G. 253, 264, 331, 350, 776
Jones, B. 548
Jones, C. 400, 401
Jones, H. 680
Jones, J. G. 407, 408, 409, 443
Jones, K. L. 25, 410, 439, 441, 579, 612, 758
Jones, L. A. 208, 646, 780
Jones, M. C. 57, 674
Jones, P. M. 243, 383, 419
Jones, R. 683, 693, 752
Jones, T. 717
Joó, V. 774
Joosten, L. 43
Joosten, L. A. B. 190
Jørgensen, J. L. 496
Jørgensen, M. 260
Jørgensen, M. E. 157, 182, 268, 270, 272, 282, 293, 322, 899
Jørgensen, N. B. 411
Jørgensen, P. G. 897
Jörns, A. 217, 367
Jorsal, T. 139, 312
Joschko, V. 491
Joshi, A. 128
Joshi, L. 902
Joshi, S. 664
Josvai, A. 963
Joung, K. 167
Joung, K. 40
Joyce, T. 242
Jude, E. 666
Juhl, C. B. 254, 736
Juhl, C. R. 479, 540, 604, 607, 959
Juliano, R. A. 627
Juneja, R. 698
Jung, C. 340, 563, 592, 953
Jung, C. 98
Jung, F. 337
Jung, G.-S. 809
Jung, I. 935
Jurczynska, J. 696
Jurišić-Eržen, D. 667
Kaabak, M. 863
Kaakinen, M. 762
Kääriäinen, H. 110
Kaas, A. 782
Kadam, Y. 620
Kadowaki, T. 149, 644, 922
Kageyama, Y. 813
Kahkoska, A. R. 779
Kahl, S. 520
Kahleová, H. 30, 552
Kahn, S. 732
Kaiserman, K. 169
Kajiyama, S. 206
Kajiyama, S. 206
Kakotrichi, P. 535, 836
Kaku, K. 634
Kalamajski, S. 389
Kalin, K. 458
Kallestrup, P. 348
Kalmykova, Z. A. 334
Kaloti, R. 869
Kalpourtzi, N. 237
Kalra, S. 664
Kalteniece, A. 854
Kaltoft, M. S. 594, 945
Kamble, P. G. 39, 487, 528, 547
Kameda, H. 246, 575, 751
Kamiński, K. 764
Kamiya, H. 914
Kamolz, L.-P. 781
Kampmann, U. 155
Kan, C. 864
Kanapka, L. G. 713
Kanazawa, Y. 37, 178, 810
Kaneko, T. 634, 637
Kang, J. 340, 563, 592, 953
Kang, L. 515
Kang, M. 954
Kang, S. 167
Kang, S. 227
Kang, Y. 501
Kankova, K. 90, 811
Kant Mangla, K. 596
Kantartzis, K. 23
Kanters, J. 479
Kanumilli, N. 785
Kao, K. 729
Kapitza, C. 608
Káplár, Á. 967
Káplár, M. 967
Karagiannis, T. 5, 535, 836, 944
Karagiannopoulos, A. 12, 215
Karakosta, A. 237
Karalliedde, J. 753, 823, 839
Karamanakos, G. 237
Karasek, D. 426
Karayiannides, S. 161
Karges, W. 323
Kariyawasam, D. 740
Karlafti, E. 843
Karlsson, C. 124
Karlstad, Ø. 288, 424
Karonova, T. 257
Karpe, F. 114, 934
Karsdal, M. 577
Karstoft, K. 293, 618
Karusheva, Y. 71, 166
Kasai, T. 942, 974
Kasetty, H. 756
Kashima, K. 557
Kasperová, B. J. 531
Kaspers, S. 565
Kasuga, M. 266
Katayama, K. 517
Katayama, Y. 777
Kato, M. 914
Kato, Y. 914
Katoh, S. 803
Katsilambros, N. 207
Katsogiannos, P. 528, 547
Katsuyama, H. 342
Katz, M. 683, 693, 752
Kaudela, T. 416
Kaudela, T. M. 413
Kauf, T. 283, 645
Kauhanen, S. 543
Kaul, P. 300
Kautzky-Willer, A. 28, 873
Kavalakatt, S. 488
Kavousi, M. 204, 519
Kawakami, A. 143
Kawanami, D. 37, 810
Kawata, S. 575, 599
Kay, R. 225
Kaye, J. 717
Kazan, H. 177
Keech, A. C. 960
Kelkar, P. 85
Kellenberger, K. 618
Keller, A. 149
Keller, S. H. 442
Kelly, A. S. 606
Kelly, M. 876
Kelly, M. 877
Kelly-Boruff, K. 577
Kelm, M. 98
Kemp, G. J. 460, 876
Kendall, D. M. 57, 673, 674
Kender, Z. 798, 852
Kennard, M. R. 506
Kenneth Verboven, Johan Jocken, Ellen E Blaak, 503
Kennon, B. 701, 709
Kepaptsoglou, O. 468
Képes, Z. 967
Kerner, W. 858
Kerr, D. 785
Kerr-Conte, J. 363
Kessels, R. P. C. 739
Ketchum, S. B. 627
Keuthage, W. 731
Keymeulen, B. 36, 52, 370, 768
Khadir, A. 488
Khalimon, N. 336
Khamis, A. 217, 219
Khee, G. 755
Khodaparast, L. 483
Khodaparast, L. 483
Khodaverdi, S. 291
Khunti, K. 230, 278, 280, 294, 343, 564, 647, 661, 686, 734, 941
Kiburg, K. V. 905
Kidani, Y. 922
Kidron, M. 60, 869
Kidwell, K. 844
Kieler, H. 424
Kielgast, U. L. 737
Kieneker, L. M. 236
Kietsiriroje, N. 35
Kikhtyak, O. P. 622
Kikuno, S. 942
Kildegaard, J. 964
Kim, D. 115, 127, 537
Kim, D. 805
Kim, G. 595
Kim, H. 167, 40
Kim, H. 340, 563, 592, 953
Kim, H. 501, 805
Kim, H. 562, 919
Kim, J. 115, 127, 871
Kim, J. 167
Kim, J. 40
Kim, J. 595
Kim, K.-S. 434
Kim, M. 946
Kim, S. 69, 879
Kim, T. 501, 805
Kim, W. 465
Kim, Y. 115
Kim, Y. 465
Kim, Y.-E. 562, 919
Kimura, T. 668
King, A. J. F. 243, 383, 506, 507
King, J. A. 230, 564
Kinney, F. Y. 725
Kiouri, E. 889
Kipke, N. 211, 327
Kipnes, M. 169
Kipper, S. 731
Kirana, S. 793
Kishimoto, J. 573
Kiss, A. 963
Kita, Y. 29
Kitano, S. 74
Kitsios, K. 836
Kitsuregawa, M. 150, 277
Kivimaki, M. 335
Kjaer, A. 101, 442, 525, 938
Kjaer, L. K. 544
Kjaer, P. 769
Kjaergaard, A. D. 113, 977
Kjærsgaard, M. 56
Kjeldsen, S. A. S. 142, 144, 625
Kjerpeseth, L. J. 421, 424
Kjolby, M. 269
Klaff, L. J. 681
Klarskov, C. K. 730
Klein, K. R. 50
Klein, O. 567
Klein, T. 499
Klementová, M. 552
Klimontov, V. V. 136, 861
Klonoff, D. C. 660, 661
Kloos, C. 707
Klopfenstein, Y. 786
Klungel, O. 828
Knabbe, C. 793
Knapp, Y. 402
Knebel, B. 71, 183, 403
Knight, B. 264
Knight, B. 350
Knight, B. A. 253
Knip, M. J. 49, 320, 353
Knoch, K.-P. 221
Knoll, L. 742
Knop, F. K. 139, 142, 145, 155, 188, 232, 312, 476, 539, 574, 603, 605, 737, 779, 897
Knudsen, C. 479
Knudsen, J. G. 140
Knudsen, J. S. 285, 899
Knudsen, K. M. 735, 738
Knudsen, L. 651
Knudsen, S. T. 185
Kobayashi, M. 222
Kobayashi, T. 354
Kobayashi, Y. 909
Kober, J. 103, 791
Koch, M. 276
Koefoed, M. 658
Koehler, G. 754
Koenig, W. 851
Koffert, J. 543
Kofoed, K. 618
Köhler, G. 856
Köhler, S. 761
Koike, H. 801, 802
Koistinen, H. A. 13, 462
Koitka-Weber, A. 559
Kojzar, H. 616
Kokkinos, A. 207
Koksharova, E. O. 334
Kolb, L. E. 642
Kolhe, D. 594
Koliaki, C. 520
Kolke, S. 620
Kollman, C. C. 713
Kolnes, K. J. 27
Kolovou, G. 889
Kolton, A. 242
Komajda, M. 894, 939
Komatsu, M. 801, 802
Komiya, T. 301
Komuro, I. 922
Kon, K. 451
Kondo, M. 914
Kondo, N. 909
Kondo, T. 38
Kong, A. P. K. 975
Kong, A. P. S. 292
Konig, M. 148, 598
Königsrainer, A. 530
Kononenko, I. V. 334
Konrad, D. 41
Kontoninas, Z. 843
Kontouri, A. 284
Kooi, E. 503
Kooi, M. 866
Kooy, A. 846
Kopecky jnr., J. 440
Kopecký sr, J. 440
Kopecky, J. 936
Kopf, S. 31, 796, 798, 852
Kopp, J. L. 950
Korantzis, A. 468
Korbut, A. I. 136, 861
Korcz, W. 696
Koren, O. 436
Korsgren, O. 203, 361
Koshibu, M. 915, 918
Koshizaka, M. 150, 277, 909
Kosiborod, M. 278, 280, 558, 933
Kosjerina, V. 268
Kosta, O. 207, 251
Koster, A. 332, 727, 761, 961
Kösters, U. 786
Kotsis, V. 889
Kotzaeridi, G. 87
Kotzbeck, P. 576
Kotzka, J. 71, 183,
Koudijs, A. 177
Koulman, A. 286
Kouloukoura, A. 284
Koutagiar, I. 889
Koutsovasilis, A. 655
Kovács Bartkóné, A. 774
Kovatchev, B. 704
Kowalska, I. 764
Kowatsch, T. 748
Kowluru, A. 374
Koye, D. 151
Koziołkiewicz, M. 444
Krag, A. 617
Krakauer, M. 539
Kramer, G. 707
Kramer, M. H. H. 459
Krarup Hansen, T. 48
Krarup, T. 614
Kratochvilova, H. 518
Kratochvílová, H. 531
Kraus, B. J. 559
Kraus, M. 748
Kravets, V. 7
Krebs, M. 28
Krempf, M. 234
Krenn, S. 662, 685, 692
Krentowska, A. 764
Krentz, N. 241
Kretschmann, J. 741
Kretzschmar, Y. 731
Kriegbaum, M. 943
Krikova, R. 898
Kristensen, F. P. 185
Kristensen, N. R. 656
Kristensen, P. L. 730
Kristiansen, M. R. 2
Kristiansen, O. P. 581
Kristiansen, V. B. 411
Kristiansson, K. 110
Krocka, E. 811
Kroiss, M. 626
Kroon, A. 481
Krssak, M. 28
Krueger, J. A. 57, 674
Krumpolec, P. 28
Kruse, R. 27
Krystynik, O. 426
Kryvalap, Y. 47
Krzizek, E.-C. 431
Ku, B. 40, 167
Kublickiene, K. 464
Kubota, N. 644
Kucharski, P. 703
Kudláčková, M. 552
Kulkarni, R. 395
Kullberg, J. 528
Kullmann, S. 23, 24, 193
Kulzer, B. 745, 757, 759, 767, 789, 790
Kumar, A. 826
Kumarathurai, P. 99, 581
Kumashiro, N. 509
Kun, A. 429
Kundan, K. 620
Kuniss, N. 707
Künsting, T. 708
Kunzova, S. 345
Kupriyanova, Y. 71
Kurioka, S. 928
Kurlbaum, M. 626
Kurnikowski, A. 662, 685, 692
Kurtukova, T. 772
Kurtz, N. 680
Kushima, H. 911, 915, 918
Kusmartseva, I. 43, 314
Kusters, Y. H. A. 503
Kuszpit, K. 511
Kuxhaus, O. 281
Kvist, J. 244
Kvist, K. 159, 605, 779
Kvitkina, T. 276
Kwak, S. 595
Kwan, A. 598
Kwon, B. 202, 318, 319
Kwon, H. 127, 871
Kwon, H. 935
Kwon, H.-S. 946
Kyriakoudi, S. 247
Kyrillos, F. 833
Kyrlaki, E. 284
Kyrylenko, P. 462
La Cour, J. L. 539
Laakso, M. 13, 462
Laaksonen, R. 930
Laaperi, M. 930
LaBell, E. S. 675, 676, 679
Labreuche, J. 425
Labriola, L. 372
Lachkar, F. 234
Lacinová, Z. 531
Lacorte, J. 546
Lacquaniti, F. 848
Ladelund, S. 661
Ladwa, M. 328
Lafzi, A. 177
Lage, M. J. 698
Lages, M. 728
Laget, J. 527
Lago-Sampedro, A. 346, 347
Lahesmaa, R. 353
Lai, M.-Y. 954
Lai, Y.-J. 267
Laichuthai, N. 571
Laimer, M. 210, 255, 748
Laitinen, I. 578
Lajer, M. 804
Lajoix, A. 527
Laker, R. C. 511
Lakshmanan, M. 148, 587
Lallement, J. 234
LaLonde, A. 683, 693, 752
Lam, A. 321
Lam, C. 278
Lam, K. S. L. 970
Lambert, E. 694
Lambooij, J. M. 448
Lampadiari, V. 284
Lampasona, V. 370
Lamprinou, A. 72
Lanaras, L. 284
LANDMARC study group 664
Landry, J. 602
Landstedt-Hallin, L. 161
Lane, W. 684, 694
Lang, J. 241, 392
Lang, M. H. 725
Lange, K. 410, 612
Lange, K. 639
Lange, V. 34
Langenberg, C. 114
Langhi, C. 623
Langkilde, A. 561
Langseder, T. 626
Laňková, I. 531
Lanng, A. R. 232
Lantier, L. 448, 511
Lanzinger, S. 291
Lanzón, B. 549
Laouteouet, D. 95
Lapauw, B. 36, 768, 849
Lapovets, L. Y. 622
Laptev, D. 154
Larcher, B. 921, 930
Larina, I. 863
Larkin, D. 261
Larsen, A. H. 906
Larsen, E. L. 603
Larsen, K. 832
Larsen, T. M. 614
Larsson, M. 250
Lassalle, R. 900
Latorre, C. 108
Lattuada, G. 486, 878
Latva-Rasku, A. 13, 124
Lau, E. S. H. 292
Lauand, F. 351, 667, 669, 686, 784
Lauer, S. 947
Laugesen, E. 157
Laureys, J. 369
Lauridsen, C. A. 618
Laurila, S. 124
Lauritsen, K. M. 123
Laursen, H. 296
Laursen, J. C. 938
Lautsch, D. 641
Lauwers, P. 830
Lavalle, F. 640, 649, 650
Laviola, L. 380, 536, 907, 908
Lavrynenko, O. 132, 571
Lawrence, F. 55
Layne, J. E. 107
Lázaro-Martín, L. 714
Le Berre, M. 902
Le Beyec - Le Bihan, J. 546
Le Dizès, O. 428
Le Gall, M. 546
Le Joubioux, F. 623
Le Mapihan, K. 363
Le Marois, M. 847
le Roux, C. W. 626
Le Stunff, H. 21, 234
Leal, E. C. 252
Lean, M. E. J. 18, 235, 522
Lebedev, D. 126
Lebrec, J. 663
Lech, G. 696
Leclerc, I. 9, 226
Ledeganck, K. 36, 768
Leduc, M. 8
Lee, A. S. 865
Lee, B.-W. 562, 919
Lee, C. 970
Lee, E. 946
Lee, H. 501
Lee, J. 115, 127, 537, 871
Lee, J. 115, 537, 871
Lee, J. 340, 563, 592, 953
Lee, J. 477
Lee, J. 744
Lee, J. L. 785
Lee, K. 862
Lee, K.-M. 809
Lee, K.-W. 501, 805
Lee, M. 227, 562, 919
Lee, M. 418
Lee, M. H. 680
Lee, N. 501, 805, 862
Lee, S. 115, 537
Lee, S. 115, 537
Lee, S. 127, 871
Lee, S. 198
Lee, S. 562, 919
Lee, S. 805
Lee, S. 871
Lee, S.-H. 946
Lee, S.-J. 15
Lee, W. 340, 563, 592, 953
Lee, W.-Y. 935
Lee, Y.-H. 69
Leech, C. A. 94
Lee-Ødegård, S. 306
Leete, P. 45, 46, 262
Lefevre, C. 973
Legardeur, H. 428
Legault, L. 174
Legido-Quigley, C. 525, 795, 819, 820, 940
Lehmann, V. 210, 748
Lehr, S. 491
Lehto, M. 826, 904
Lehtonen, E. 176
Lehtonen, S. H. 176, 451, 808
Lehtovirta, M. 406
Leigh, P. 295
Leigh-Atkins, S. 437
Leiherer, A. 921, 930
Leinonen, M. K. 424
Leiter, L. A. 134, 561, 661
Lemaitre, M. 542
Lembo, E. 131, 68
Lenardi, C. 388
Lengyel, C. 158, 945
Lenzen, S. 44, 217
Lenzi, A. 532
Leohr, J. 675, 676, 679
Leonardini, A. 907
Leone, A. 76, 330
Leone, V. 844
Leonetti, F. 505, 532, 882
Leopold, B. 417
Lepage, B. 108
Lerche, S. S. 736
Lernmark, A. 355
Leslie, R. D. 52
Leu, J. H. 53, 631
Leung, C.-H. 610
Levin, A. 558, 560
Levrat-Guillen, F. 705
Levy, C. J. 173, 715
Lewis, M. R. 548
Li, C. 163
Li, C.-I. 3, 287
Li, D. 690
Li, G. 128
Li, H. 697
Li, J. 112
Li, J. 357, 415
Li, J. 508
Li, J. 548
Li, J. 682
Li, J. 929
Li, J.-W. 122
Li, K. 135
Li, L. 16, 19, 22, 117, 249, 384, 415, 445, 471, 534, 948, 951
Li, M. 420
Li, Q. 597
Li, T.-C. 3, 287
Li, W. 359
Li, W. 481
Li, W. 976
Li, X. 213
Li, X. 245, 261
Li, Y. 53, 631
Li, Y. 682
Li, Z. 359
Liakos, A. 535, 836
Liang, L. 112
Liao, B. 688
Liatis, S. 237
Liatis, S. 655
Liberopoulos, E. N. 889
Licata, G. 223
Lichtenegger, K. M. 781
Liebkind, R. 75, 925
Lienhard, M. 403
Lietz, G. 522
Lievers, E. 177
Liew, G. 73
Liljenquist, D. 169
Lim, D.-S. 96
Lim, P. 755
Lim, S. 675
Lin, A.-C. 971
Lin, C.-C. 3, 287
Lin, L. 906
Lin, Y. 146, 577
Lind, B. 943
Linddal, A. K. 411
Lindfors, S. H. 176, 451, 808
Lindgren, P. 239
Lindhardt, T. 897
Lindholm, E. 853
Lindmeyer, A. M. 695
Lindqvist, A. 92, 475, 543
Ling, J. 294
Ling, L. 446
Ling, Q. 366
Linge, J. 972
Lingvay, I. 558, 596, 605, 658
Linn, T. 370
Linnebjerg, H. 675, 676, 679, 697
Linnemann, A. K. 9
Lion, G. 542
Lipscombe, L. L. 337
Lithovius, R. 160
Little, T. J. 579
Litwak, S. A. 216
Liu, B. 381, 419
Liu, C. 868
Liu, C.-S. 3, 287
Liu, D. 384
Liu, H. 317
Liu, H. 697
Liu, J. 213
Liu, J. 690
Liu, J. 743
Liu, J. 807
Liu, L. 689, 690
Liu, L. 812
Liu, M. 163
Liu, M. 220, 245, 261, 689, 690
Liu, N. 916
Liu, R. 58, 678
Liu, S.-C. 610
Liu, T. 379, 390
Liu, Y. 130, 864
Liu, Y. 297
Liu, Y. 377
Liu, Y. F. 379
Liu, Z. H. 379
Liver-Alpha-Cell Axis Group 144
Livingston, M. 265, 842
Loche, S. 533
Löfgren, J. 442
Loft, A. 442
Loghin, C. 602
Loh, N. Y. 114
Loi, V. 965
Löndahl, M. 853
Londero, T. 630
Longato, E. 121
Longo, M. 307
Longuespee, R. 847
Lopes de Faria, J. B. 77, 179
Lopes de Faria, J. M. 77, 179
Lopes, N. V. 728
López, J. G. 888
López-Alonso, A. 467
Lopez-Jimenez, F. 345
Lopez-Noriega, L. 226
Lopez-Pascual, A. 92
Lorenzatti, A. J. 888
Lorenzo, P. I. 368
Lortz, S. 372, 375
Lorza-Gil, E. 530
Loske, J. 34
Lotfaliany, M. 61
Loureiro, C. 311
Louw, J. 302
Löyttyniemi, E. 543
Lu, J. 366
Lu, J. 680
Lu, V. 225
Lu, W. 783
Lu, X. 635
Lu, Y. 690
Lu, Z. H. 379
Luan, C. 12
Lubwama, R. 343, 665, 666
Lucchesi, D. 64, 920
Lucci, C. 893
Luczkowska, K. 495
Ludvigsson, J. 806
Ludvik, B. 431
Lugea, A. 948
Lui, D. T. W. 970
Luis-Lima, S. 549
Luk, A. O. Y. 292
Lukacs, A. 774
Lund, A. 188, 232, 574, 603, 737
Lund, S. S. 565
Lundberg, M. 203
Lunder, M. 550
Lundgren, J. 540, 607
Lundgren, J. R. 604, 959
Lundgren, M. 202, 318, 319, 364
Lundman, P. 161
Lundqvist, M. H. 487, 502
Lunt, M. 265, 842
Luo, B. 689, 690
Luo, C. 865
Luo, Q. 954
Luo, Y. 906
Lupše, B. 397
Lupse, B. 96
Lustenberger, P. 786
Lutale, J. K. 840
Ly, T. T. 173, 712, 715
Lyng Wolden, M. 102, 596
Lyngbæk, M. 618
Lynggaard, M. B. 232
Lynn, F. C. 156
Lyons, C. L. 475
Lyssenko, V. 32, 336
Lytrivi, M. 152
Ma, B. 112
Ma, J.-H. 613
Ma, R. C. W. 292
Ma, X. 929
Ma, Y. 135
Maalmi, H. 166, 851
Maandi, S. C. 376
Maasen, K. 611
Mabley, J. G. 376
Macare, C. 741
MacCalman, A. 315
Macchi, F. 512
Macedo, M. P. 443, 493, 886
Macedo, P. 313
Machado de Oliveira, R. 313
Machann, J. 23, 551
Machann, J. 72
Machry, R. 630
Macias-Gonzalez, M. 205
MacIsaac, A. I. 905
MacIsaac, R. J. 61, 680, 905
Maclean, R. 740
Maddaloni, E. 209
Madduri, M. 378
Madec, A.-M. 973
Mader, A. 921, 930
Mader, J. K. 708, 721, 742, 747, 781, 968
Madhu, D. 488
Madsbad, S. 228, 411, 442, 540, 544, 581, 604, 607, 614, 625, 959
Maechler, M. 921, 930
Maechler, P. 325, 495
Maeda, Y. 74
Maedler, K. 96, 317, 378, 397, 499
Mael, A. 242
Maffioli, E. 388
Mafilaza, D. 392
Magnan, C. 234
Magnes, C. 55, 567, 576
Mahaffey, K. W. 122, 558, 560
Mahrík, J. 531
Maillard, E. 216
Maina, J. 762
Maïzi, H. 900
Maj, E. 850
Majali-Martinez, A. 413, 416
Majdpour, D. 174
Majeed, A. 153
Mak, L. C. G. 975
Mäkimattila, S. 952
Mäkinen, S. 13, 462
Makino, M. 385, 453
Makkar, G. 418
Makrilakis, K. 237, 284
Malaadi, Y. 869
Malandris, K. 535
Maldonado, C. 346, 347
Maldonado, J. M. 598
Malekizadeh, Y. 189
Malik, R. 854
Malik, R. E. 585, 588, 589
Malinska, H. 510
Malinská, H. 552
Mancuso, E. 472, 474
Mander, A. P. 49
Mang, H. W. 975
Mangas, M. Á. 670
Mangelis, A. 823, 839
Manicardi, E. 238
Manicardi, V. 238, 256, 633
Manig, F. 902
Mann, J. F. E. 134
Mann, M. 211
Mannino, D. 238, 256, 633
Mannino, G. C. 341, 472, 474
Manolopoulos, A. 535, 836
Mansour Aly, D. 63
Manti, R. 256, 633
Mantsiou, C. 535, 836
Mantzoros, C. S. 128
Manzoni, G. 486
Mao, E. 864
Mao, L. 455
Maquart, G. 523
Marathe, C. S. 758
Marchetti, P. 109, 212, 216, 217, 219, 316, 360, 362, 373, 394, 396
Marciani, P. 388
Marculescu, R. 28
Marcus, K. 966
Mårdby, A.-C. 782
Marenzi, G. 893
Margariti, E. 843
Margaritidis, C. 843
Mari, A. 67, 131, 263, 410, 478, 526, 600
Marinicova, Z. 221
Marinkovich, D. 668
Marjonen, H. 110
Mark, P. D. 144
Markakis, E. 284
Markgraf, D. 71, 166, 520
Markova, I. 510
Markova, M. 34
Marku, A. 91, 386, 388
Marobin, R. 630
Marrano, N. 380
Marre, M. 799
Marselli, L. 109, 212, 217, 360, 362, 373, 394, 396
Marsh, A. 398, 399, 699
Martens, P.-J. 369
Martikainen, J. 648
Martin, F. 368
Martin, J. 602
Martinez, L. 785
Martinez, M. 9
Martínez-Horta, S. 259
Martinez-Huenchullan, S. 865
Martínez-López, J. 92
Martini, J. 108
Martins, F. O. 494
Martín-Taboada, M. 549
Martinussen, C. 228, 442, 625
Martin-Vazquez, E. 368
Martola, J. 75, 925
Marx, N. 149, 591, 732, 974
Marzetta, F. 211
Marzinotto, I. 370
Mashek, D. G. 404
Masmiquel, L. 765
Masoni, M. 526
Massaiu, I. 965
Massarelli, F. 373
Masson, D. 523
Mastrocola, R. 500, 902
Mastrototaro, L. 520
Masuda, A. 412
Masui, Y. 342
Masulli, M. 619
Masur, K. 858
Matafome, P. 494
Mather, K. M. 129
Mathiesen, E. 85
Mathieu, C. 36, 48, 49, 320, 353, 369, 768
Mathieu, J. 95
Matoba, K. 37, 178, 810
Matsubara, M. 301
Matsuhisa, M. 734
Matsumura, K. 942
Mattern, Y. 966
Mattheus, M. 149, 559, 572, 591, 732
Matthew, M. 556
Matthews, D. R. 609
Matthiesen, R. 313
Mattila, I. 819
Mattila, I. M. 940
Matveyenko, A. 95
Maugard, T. 623
Maurizi, A. R. 370
Mavilio, M. 498, 815, 875
Mawezawa, Y. 909
Mayorov, A. Y. 334
Mazza, T. 341
Mazzoni, G. 353
Mazzucato, M. 825
Mba, C. M. 286
Mbanya, J. 286, 640, 649, 650
Mbundu Ilunga, R. 428
McAuley, S. 717
McAuliffe-Fogarty, A. 743
McCallum, R. 717
McCance, D. R. 85
McCann, A. 198
McCann, M. 654
McCarthy, O. 196, 197, 400, 401
McCauley, C. 654
McCrimmon, R. J. 706
Mcdiarmid, S. 208
McDonald, T. 253, 264, 350
McGavock, J. M. 800
McGill, M. 818, 865
McGovern, A. P. 331, 776
McGuinness, O. P. 448, 511
McGuire, D. K. 149, 561, 591, 732
McGurnaghan, S. J. 79, 83, 273, 701, 709, 792
McKeigue, P. M. 83, 273, 701, 709, 792
McKnight, J. A. 324, 701, 709
Mclaughlin, J. 271
McMahon, H. 219
McNeilly, A. D. 706
McPherson, S. 867
Meadows, E. S. 698, 771
Mechanick, J. I. 345
Medici, B. B. 539
Medina, J. 280, 295
Medina, J. 443
Medina, J. L. 886
Medina-Gomez, G. 549
Medina-Inojosa, J. R. 345
Meex, S. J. R. 727
Mehl, F. 211
Meier, J. J. 608, 695
Meijer, R. I. 459
Meinicke, T. 732
Melenovský, V. 440, 936
Melhem, S. 235, 522
Melidonis, A. 655
Melin, E. O. 760
Mellbin, L. 587, 593
Mellgren, G. 168
Mellwig, K.-P. 793
Melo, B. F. 494
Meneghini, L. F. 659, 671, 686
Meneses, M. 443
Meneses, M. J. 886
Meng, R. 454
Menge, B. A. 608
Menghini, R. 137, 498, 815, 875
Mengozzi, A. 526, 962
Menini, S. 815
Menon, S. 664
Menoud, V. 10
Menshikov, M. 450, 452, 456
Mentz, R. J. 133, 566
Menzaghi, C. 1
Mercader, J. 109, 316
Mercuri, L. 341
Merino, J. 112
Merlan, G. 234
Mertens, J. 880
Mey, A. 973
Mezza, T. 263, 325, 395
Mianowska, B. 703
Miccoli, R. 64, 920
Michalak, A. 703
Michurina, S. 452
Midorikawa, M. 957
Mieczkowski, M. 850
Miedzybrodzka, E. 225
Miele, C. 307, 76
Miftaraj, M. 545
Mihai, B. 529
Mihneva, V. 484
Mikkelsen, U. R. 496
Miklankova, D. 510
Mikó, M. 967
Mikulski, H. 283, 645
Milani, P. 388
Milazzo, V. 893
Milicevic, Z. 116, 231, 584, 589
Mill, J. 315
Miller, M. 627
Miller, S. 832
Milligan, G. 641
Minaldi, E. 427, 432
Minami, M. 74
Minamizuka, T. 909
Mingrone, G. 68, 131
Mirdell, R. 250
Mirtti, T. 176, 808
Mishra, S. R. 348
Misra, S. 153
Mitchell, B. D. 743, 746
Mitchell, S. J. 754
Mithal, A. 664
Mitri, J. 184
Mitro, N. 885
Mitsutake, N. 150, 277
Mittlböck, M. 87
Miuchi, M. 777
Miura, J. 681
Miura, K. 724
Miura-Yura, E. 914
Miwa, M. 222
Miya, A. 751
Miyawaki, T. 206
Miyoshi, H. 246, 575, 599, 668, 751
Mizokami-Stout, K. 844
Moazam, S. 620
Mocan, A. S. 763
Mocanu, V. 529
Modi, K. 620
Mody, R. 148, 586
Moen, G.-H. 306
Moeuf, Y. 894
Moeuf, Y. 939
Moffa, S. 263, 395
Mohamed, A. 659, 671
Mohanasundaram, S. 664
Mokou, M. 22
Moldes, M. 523
Molinier, L. 108
Møller, A. 411, 625
Møller, A. 906
Møller, D. 56
Møller, H. J. 603
Møller, J. B. 782, 788
Møller, N. 99, 123, 285, 496, 504
Møller, P. M. 27
Molnar, G. A. 303
Molyneaux, L. M. 818
Mongovin, S. 144
Monsalvo, M. 888
Montanya, E. 214, 785
Monti, T. 878
Montserrat, N. 180
Montvida, O. 151, 294
Moore, L. 300
Moore, N. 900
Moore, P. 723
Moosmang, S. 576
Mora, P. F. 710, 711
Morales Portillo, C. 48
Morales, C. 670
Morales, E. 549
Morán, I. 109, 316
Morbach, S. 829
Morey, P. M. 57, 673, 674
Morgan, N. G. 45, 46, 262, 314, 315
Morgenstern, J. 852
Mori, Y. 911, 915, 918
Mori, Y. 942
Moriconi, D. 120
Morieri, M. 881
Morille, M. 527
Morimoto, Y. 668
Morio, B. 973
Morishita, Y. 914
Morita, N. 922
Moriya, T. 801, 802
Morrett, S. 678
Morriseau, T. S. 156
Morrison, D. 680
Morton, N. M. 514
Moscatelli, A. 848
Moschetta, D. 965
Mose, M. 496
Mosenzon, O. 48, 158, 561, 945
Möser, C. 98
Moser, O. 196, 197, 400, 401, 616, 742
Moskva, K. A. 622
Motz, W. 858
Mouchti, S. 876, 877
Mounié, M. 108
Moyers, J. S. 556
Mraz, M. 518
Mráz, M. 531, 552
Mrozikiewicz-Rakowska, B. 850
Mu, Y. 569, 690
Muendlein, A. 921, 930
Mul, D. 170
Mulder, H. 389, 475
Mulder, P. 910, 913
Müller, A. 742
Müller, N. 707
Müller-Wieland, D. 785, 884
Munro, N. 756
Muraca, E. 486, 878
Muraleva, N. 136
Muralidharan, C. 9
Murase, M. 412
Muratore, M. 473
Murdoch, C. E. 515
Murphy, C. 500
Murphy, S. A. 561
Mursic, I. 567
Musacchio, N. 633
Musaeva, G. 863
Musale, V. 515
Mutter, S. 62, 100, 160, 794, 826
Muzambi, R. 761
Myasoedova, V. 965
Na, M. 887
Nacher, M. 214
Nádasdi, Á. 873
Nadasy, G. 963
Naderi, J. 307
Nagai, S. 751
Nagai, Y. 37, 178, 810
Nagai, Y. 734
Nagasawa, K. 942
Nagel, F. 963
Nagy, G. 967
Nagy, Z. 303
Naharci, M. I. 969
Naik, S. 96
Nair, A. 664
Najafzadeh, M. 289
Nakamura, A. 246, 575, 599, 751
Nakamura, J. 914
Nakamura, N. 914
Nakas, C. T. 400
Nakashima, A. 414
Nakasone, Y. 801, 802
Nanda, N. 666
Nandi, M. 506
Nannipieri, M. 120
Napoli, A. 298
Napoli, N. 209
Narres, M. 276
Narui, K. 942
Naruse, K. 914
Nasiri, A. R. 477
Näslund, I. 545
Nasser, S. 310
Natali, A. 410, 526, 962
Natalicchio, A. 380, 536, 907, 908
Nauck, M. A. 608, 695
Naujok, O. 356
Nawaz, S. 219, 241
Nawroth, P. P. 31, 796, 798, 847, 852
Neal, B. 122, 560
Neeland, I. J. 974
Nefs, G. 739
Nelson, G. 314
Nemcova, A. 859
Nemoto, K. 957
Nerild, H. H. 312
Nesti, L. 526, 962
Netea, M. G. 190
Netuka, I. 531
Netzer, E. 680
Neuen, B. L. 122
Neupane, D. 348
Neutel, J. 60
Neuzil, J. 518
Nevarez Ruiz, L. 589
Neville, M. J. 114
Newgard, C. B. 146
Ng, K. 682
Ng, S. 758
Nghiem, L. 568
Ngo, T. B. T. 892
Nguyen, M.-T. 895
Nguyen, Y. H. 462
Nian, C. 156
Nice, R. 264
Nicholls, R. 877
Nicol, L. 910, 913
Nicolaisen, S. K. 2, 182
Nicolau, J. 765
Nicolì, F. 433, 435
Nicolò, A. 76, 330
Nicolucci, A. 238, 256, 278, 280, 295, 633
Niehage, C. 11
Nielsen, B. R. R. 123
Nielsen, C. K. 737
Nielsen, C. N. 145
Nielsen, J. S. 2, 182, 977
Nielsen, M. A. 593
Nielsen, O. W. 581
Nielsen, S. W. 574
Nieß, A. 193
Nieto-Martinez, R. 345
Nigro, C. 307, 76
Nijhoff, M. F. 361
Nikankina, L. 863
Nikkel, C. 710, 711
Nikolaou, A. 770
Nikolov, R. 484
Nilsson, M. 99
Nilsson, P. M. 336
Ning, G. 689
Ning, Z. 635
Nirantharakumar, K. 118
Niri, T. 222
Nisen, H. O. 176, 808
Nishida, T. 690
Nishimura, A. 942
Nishimura, R. 37, 178, 803, 810
N'Kaoua, G. 392
Nobels, F. 36, 768
Nocca, D. 527
Nolte, C. 858
Nolvi, K. 648
Nomoto, H. 246, 575, 599, 751
Norata, G. D. 91, 885
Nordheim, E. 662, 685, 692
Nordwall, M. 806
Nørgaard, K. 736
Nørgaard, M. 424
Norhammar, A. 161
Norman, G. 105
Norman, J. A. 460
Norton, L. 141
Nouri Hajari, J. 817
Noursadeghi, N. 492
Nouvel, A. 527
Nouwen, A. 762, 763, 766
Novakovic, B. 413, 416
Novicki, A. 231
Nóvoa Medina, Y. 466
Novodvorsky, P. 744
nPOD-Virus Group 314
Nuhoho, S. 102
Numans, M. E. 822
Nunez Torres, A. 409
Nunzio, G. D. 407
Nuutila, P. 13, 124, 543
Nwokolo, M. 191
Nygaard, B. 539
Nystad, W. 288
Nyström, F. H. 250
Nyugen, Y. H. 13
O, T. C. K. 975
Obeid, J. 8
Oberholzer, L. 618
Obermayer, A. 616
Obermayer, B. 616
Oberoi, A. K. 612
O'Connell, R. L. 960
O'Connor, R. 392
O'Daly, O. 191
Odegard, J. 283, 645
Odermatt, T. S. 41
O'Doherty, I. 321, 355
O'Donnell, S. 240
Odorico, J. 242
O'Dowd, C. 832
Oenema, A. 761
Oeverink, R. 323
O'Farrell, L. S. 116, 584
Ofori, J. 215
Ofstad, A. P. 566, 572, 933, 947
Ogawa, W. 569
Ogawa, Y. 573
Ogihara, S. 414
Ogurtsova, K. 829
Ohara, M. 911, 915, 918
Øhrstrøm, C. C. 737
Oikonen, V. 543
Okada, M. 777
Okagawa, S. 38
Okami, S. 922
Okamoto, S. 297
O'Kane, M. 654
Okubo, Y. 38
Olaniru, O. E. 243
Oldgren, J. 124
Oliver, N. 708
Olsen, D. A. 2
Olsen, L. 607
Olsen, L. H. 964
Olsen, L. M. 540, 959
Olsen, M. H. 617
Oltolini, A. 486
O'Mahoney, L. 398, 399
Omer, B. 615
Omnipod Horizon Study Group 173, 715
Omori, K. 246, 575, 599
O'Neal, D. N. 680, 717
Ono, Y. 573
Onoue, T. 354
op den Kamp, Y. J. M. 17, 229
Oprescu, A. I. 744
Opsahl, J. O. 306
Oram, R. A. 262, 350
O'Reilly, J. E. 79, 83, 709
Oriez, C. 894, 939
Orlov, N. B. 861
Oroko, M. 831
Ørtenblad, N. 195
Osaka, N. 911, 915, 918
Osaki, Y. 957
Oscarsson, J. 97, 124, 229
Oshima, M. 560
Osler, M. 260
Osmond, C. 934
Östenson, C.-G. 785
Østergaard, L. 185
Østergaard, M. V. 835
Östgren, C. J. 84, 250, 924
Ostrauskas, R. 349
Ota, H. 453
Otero, Y. F. 448, 621, 623
Otonkoski, T. 152, 244
Otten, J. 80
Otto, C. 626
Otto, F. 448
Ottosson, J. 545
Ou, H.-Y. 971
Ouwens, M. 34
Overland, J. 865
Oviedo, A. 684
Owen, K. R. 52
Ozasa, N. 206
Özgümüs, T. 32, 336
Paajanen, T. 110
Paavolainen, L. 808
Pacal, L. 811
Pachera, N. 152
Pacini, G. 431
Pagacz, K. 703
Pahirko, L. 898
Pain, E. 497
Painter, S. 783
Pais de Barros, J.-P. 523
Palanduz, S. 615
Paldánius, P. M. 609
Paldus, B. 680
Palma, G. 908
Palmer, C. N. A. 273
Palmer, K. 666
Palomer, X. 15
Palumbo, M. 119
Pan, D. 635
Panagiotopoulos, C. 800
Panda, J. K. 594
Pandol, S. J. 471, 948
Pang, C. 570, 773
Pang, L. 216
Panthu, B. 973
Panzenboeck, U. 417
Papagianni, M. 889
Papantoniou, S. 601
Paparella, D. 908
Papazafiropoulou, A. 655
Pappas, A. 284
Parente, E. B. 62, 816
Parfyonova, Y. 450, 452, 456
Park, C.-Y. 340, 434, 563, 592, 953
Park, E. 537
Park, H. 227
Park, J.-Y. 340, 563, 592, 953
Park, S. 465
Park, S.-E. 935
Park, W. 465
Park, Y.-M. 946
Parker, A. 105
Parkhi, D. 652
Parkkola, R. 543
Parks, L. 778
Parra, J. 769
Parra, P. 422
Parrettini, S. 470
Parrillo, L. 330
Parvaresh Rizi, E. 660
Parving, H.-H. 736, 795
Patarrão, R. S. 443, 886
Patek, S. D. 787
Patel, C. J. 200
Patel, K. 152
Pateras, I. 251
Pathak, G. 392
Patorno, E. 289
Patrick, A. W. 792
Patterson, S. 382
Pattou, F. 363
Patzer, R. E. 66
Pauchet, A. 428
Paul, S. 151, 294
Paula, F. M. M. 216
Pauline Linssen, Katrien Gaens 503
Pauluschke-Fröhlich, J. 430
Pavkov, M. E. 66
Pavlovičová, R. 552
Pavlovka, I. 345
Pawar, A. 289
Pawlowski, W. 696
Pazzagli, L. 424
Peacock, J. 328
Peakman, M. 320, 353
Pearson, E. R. 600, 776
Pearson, S. M. 35
Pedersen, A. A. 835
Pedersen, B. K. 618
Pedersen, J. 142
Pedersen, L. 424
Pedersen, O. 795
Pedersen, S. B. 906
Pedersen-Bjergaard, U. 192, 736, 739, 897, 964
Pedrollo, E. 630
Peeples, M. 106
Pei, Y. 690
Peiffer, F. 830
Pelikánová, T. 440, 552, 936
Pellicori, P. 933
Peltier, S. L. 448, 621, 623
Peltonen, T. 648
Penaherrera, N. 638
Peña-Moreno, L. 15
Peng, X. V. 665
Peng, Y. 689
Penha-Gonçalves, C. 493
Penland, R. C. 133
Penno, G. 64, 920
Peradze, N. 128
Perakakis, N. 128
Perdomo Ugarte, N. 466
Perego, C. 91, 386, 388
Pereira, B. 621
Pereira, M. J. 39, 487, 502, 528, 547
Perez-Nieves, M. 698, 743
Perfetti, R. 629, 632
Perfetto, C. 76
Periyathambi, N. 652
Perkovic, V. 122, 134, 558, 560
Perles, S. 869
Perola, M. 110
Perra, S. 486
Perrier, J. 973
Perrini, S. 380, 536, 907, 908
Persaud, S. J. 243, 381
Perseghin, G. 486, 878
Persson, F. I. 270, 293, 797, 899, 943
Persson, M. 924
Persson, S. 239
Pertersen, K. F. 477
Pertosa, G. 137
Pervunina, T. 436
Pesta, D. 196, 520
Pestel, J. 42
Peter J Joris, Jogchum Plat, Ronald P Mensink 503
Peter, A. 24, 72, 88, 193
Peterli, R. 892
Peters, A. 667, 669
Peters, A. 851
Peters, C. 235
Petersen, B. 786, 791
Petersen, E. 186
Petersen, K. F. 30
Petersen, K. M. 476
Petersen, M. H. 195
Petersen, T. S. 476
Petersen-Bønding, C. 618
Peterson, Q. 213
Petit, J. 233
Petkovic, M. 252
Petrie, J. R. 792
Petropoulos, I. 854
Petrou, P. P. 247
Petrovski, G. 719
Petzold, A. 221
Peyrot, M. 746
Pezzica, S. 119, 619
Pezzilli, S. 341
Pfarr, E. 732
Pfeiffer, A. F. H. 34
Pferschy, P. N. 616
Pfleger, L. 28
Pheiffer, C. 302
Phielix, E. 17, 229
Philippaert, K. 483
Philis-Tsimikas, A. 169, 661, 778
Phillips, L. K. 410
Piao, X. 243
Picard, A. 580
Picconi, F. 848
Pickering, G. 623
Pickford, R. 851
Pieber, T. R. 48, 55, 567, 616, 661, 735, 738
Piechot, A. 54
Piemonti, L. 370
Pieper, M. P. 913
Pierluigi, M. 505
Pierrou, S. 578
Pilmark, N. S. 618
Pilorget, V. 351, 667
Pina, A. F. 443, 886
Pinchuk, A. 863
Pinnick, K. E. 114
Pinsker, J. E. 752
Pinteur, C. 973
Pinto, L. 630
Pinto, S. 891
Pinto, T. 800
Pinto, Y. 436
Piras de Oliveira, C. 688
Pirkalani, K. 636
Pirog, A. 392
Pirola, L. 310
Piron, A. 109, 316, 394
Pirro, V. 146
Pisanu, P. 256, 633
Pitt, A. 264
Pitt, J. P. 400, 401
Pivovarova-Ramich, O. 34
Pizarro-Delgado, J. 15
Place, J. 171
Planas, A. 903
Plank, J. 781
Plat, F. 402
Platt, R. W. 290
Plester, J. 652
Plettenburg, O. 578
Plomgaard, P. 144, 625
Plum-Moerchel, L. 735
Pöchlauer, C. 416
Pocock, S. 565
Podesser, B. K. 963
Podgorski, G. 660
Podichetty, J. 355
Poggio, P. 965
Poghosyan, T. 546
Poizat, G. 553
Polemiti, E. 281
Polianskyte-Prause, Z. 176, 451
Pollock, C. 560
Pollom, R. 676
Polonsky, W. H. 771, 772
Pomares-Millan, H. 199
Pompilio, G. 164, 917
Ponirakis, G. 854
Pontrelli, P. 137
Poon, J.-L. 743
Pop-Busui, R. 169, 184
Popova, P. 436
Poradzka, A. A. 855
Porrini, E. 549
Porro, S. 536, 908
Potter, M. B. 769
Pöttler, T. 721, 742
Poudel, M. 793
Poulia, K.-A. 344
Poulsen, H. E. 544, 603
Poveda, A. 199
Povlsen, G. K. 964
Pozzilli, P. 209, 370
Prado, P. 180
Prasad, R. B. 244, 306
Prasanna Kumar, K. M. 664
Pratley, R. E. 134, 149, 779
Pratt, E. J. 697
Prehn, C. 1
Preissl, H. 23, 24, 193, 430, 551, 88
Preitner, F. 234
Prete, A. 433, 435
Pretorius, M. 418
Prevenzano, I. 307
Prevot, V. 553
Priesterroth, L. 757
Prikulis, R. 798, 852
Prinz, N. 323
Probstfield, J. 587
Prodromiadou, E. 655
Prokopenko, I. 762
Proot, P. 849
Prudente, S. 341
Puckett, C. 132
Puder, J. J. 428, 770
Pugliese, A. 314, 320
Pugliese, G. 815
Puiggròs, M. 316
Pulz, G. 630
Pustozerov, E. 436
Putaala, J. 75, 925, 931
Pye, K. R. 189
Pylypchuk, R. 162
Qi, L. 471
Qian, H.-R. 577
Qian, Y. 377
Qiao, J. 261
Qiu, S. 19
Qiu, S. 275, 807
Qiu, S. 975
Qu, S. 689
Qu, Y. 163
Quadry, N. 629, 632
Quansah, D. 428, 770
Quast, D. R. 608
Quattrin, T. 53, 631
Quinlan, T. 602
Quist, J. S. 293
Qvigstad, E. 306
Raakvaag, E. 496
Rabbani, N. 304
Rabelink, T. J. 177
Raciti, G. A. 330
Rackham, C. 383
Radermecker, R. 36, 768
Radford, B. 418
Rådholm, K. 458, 924
Rados, D. 630
Rafizadeh, S. 378
Raha, S. 598
Raila, J. 34
Rainer, R. 781
Rainteau, D. 234
Rais, N. 664
Rajnai, L. 967
Rallidis, L. 889
Ramachandran, A. 640, 649, 650
Ramanathan, B. 667
Ramasamy, R. 629, 632
Ramesh, C. K. 606
Ramirez, L. 278, 295
Ramos, H. 78, 827
Ranchagoda, J. D. 153
Rangarajan, S. 13
Ranucci, L. 470
Raoux, M. 241, 392
Raposo, J. F. 443, 886
Raptis, A. 237
Rasijeff, E. 218
Raskin, P. 666
Raslova, K. 660
Rasmussen, I. B. 938
Rasmussen, M. G. 194
Rasmussen, N. H. 279
Rasmussen, S. 134, 258, 590
Rastogi, S. 720
Rathmann, W. 166, 295, 851
Rathor, N. 684, 694, 716
Ratter, J. 166
Ratziu, V. 70
Ratzki-Leewing, A. 750
Rautureau, G. 973
Ravier, M. A. 8, 95
Rayman, G. 265
Rayner, C. K. 25, 410, 439, 441, 579, 758
Raz, I. 561, 97
Rebelo Pimentel, A. 234
Rebelos, E. 124
Rebuffat, S. 527
Reck, L. 630
Reed, J. 169
Regazzi, R. 10
Regittnig, W. 567
Regmi, A. 116
Rehfeld, J. F. 228, 438
Reichardt, B. 856
Reichart, D. 856
Reichert, S. 551
Reimann, F. 225
Reindel, J. 858
Reiss, J. 844
Rembert, E. 30
Renard, E. 171, 351, 59, 667, 669, 753, 784
Renaud, S. 241, 392
Renström, E. 12
Revelant, F. 628
Reviriego, J. 663
Rewers, M. 364
Reynès, C. 402
Reynolds, G. 311
Rhee, E.-J. 935
Rhee, N. A. 158
Rheeder, P. 302
Rhodes, C. J. 511
Ribeiro, I. 728
Ribeiro, R. T. 443, 886
Ribel-Madsen, R. 656
Richard, V. 910, 913
Richardson, S. J. 45, 46, 262, 314
Richelsen, B. 82
Richter, D. 327
Riddell, M. C. 196
Riddle, M. C. 148, 587
Rieckmann, A. 322
Riedl, R. 616
Ried-Larsen, M. 194, 293, 618
Rieusset, J. 14, 973
Rigbolt, K. T. 139, 312
Rigby, M. 321
Rigby, M. R. 53, 631
Rigda, R. S. 612
Riis, T. 476
Ringemann, C. 283, 645, 786, 791
Ripa, R. S. 101, 525, 938
Ripoche, D. 623
Ritchie, T. 652
Ritter, I. 559
Rittig, N. 26, 496
Riveline, J.-P. 705
Rivellese, A. 619
Rivera, K. 214
Rivers, E. L. 129
Rives-Lange, C. 546
Rizos, C. V. 889
Robert, M. 42
Roberts, G. A. 754
Robinson, J. 129
Roborel de Climens, A. 497, 667, 669, 686
Roca-Fernandez, A. 876, 877
Rocca, A. 238, 256, 633
Rocher, L. 402
Rod, N. H. 322
Roden, M. 54, 71, 98, 166, 183, 196, 365, 520, 851
Rodgers, L. R. 253
Rodrigues, B. 912
Rodríguez González, G. 466
Rodríguez, I. 765
Rodriguez, T. 9
Rodriguez-Calvo, T. 314
Rodríguez-Cuellar, E. 549
Rodriguez-Rodriguez, A. E. 549
Roeikjer, J. 828
Roell, W. C. 116, 556
Rogers, H. 740
Røikjer, J. 296
Rojo-Martínez, G. 346, 347
Rolandsson, O. 80, 84, 458
Romanenkova, E. 154
Romera, I. 663
Romero, K. 355
Romero-Pérez, M. 714
Romero-Zerbo, Y. S. 368
Rondinelli, M. 893, 965
Rønn, P. F. 899
Roos, T. 789, 790
Roosimaa, M. 147
Rorsman, P. 12, 140, 473
Rose, K. 188
Rose, L. 370
Rosen, G. 128
Rosenkilde, M. M. 144
Rosenkranz, A. R. 781
Rosenson, R. S. 888
Rosenstock, J. 56, 60, 149, 591, 657, 658, 665, 732
Rosenthal, A. 34
Rosenthal, N. 122, 560
Rosiak, E. 850
Rosicky, I. 86, 87
Ross Kirk, A. 596
Rossel, J.-B. 770
Rossi, M. 238, 256, 633
Rossignol, P. 837
Rossing, P. 101, 270, 525, 795, 797, 804, 819, 820, 938, 940
Rossini, M. 137
Rost, J. 718
Rosta, K. 873
Rotbain Curovic, V. 819
Roth, K. D. 146
Rothe, M. 98, 365
Rottiers, P. 369
Roudot, A. 70
Rouland, A. 233
Roussel, R. 705, 799
Rowiński, O. 850
Roy, A. 680
Royo, R. 316
Ruane, H. 208
Rubertus, P. 757, 759, 767
Rubino, M. 893
Rudolph, V. 793
Rudovich, N. 34
Rudser, K. 606
Ruedy, K. 713
Ruffini, P. 370
Rui, S. 249
Rungby, J. 99, 260, 268, 504, 977
Ruotolo, G. 146
Russell, M. A. 46
Russell, S. J. 172, 716
Russell-Jones, D. L. 754
Russo, B. 848
Russo, G. T. 158, 238, 945
Russo, M. 619
Russo, M. F. 131, 68
Rustenbeck, I. 391
Rustom, H. 463
Rutkowski, J. 174
Rutter, G. A. 9, 219, 226, 582
Ryan, B. 750
Ryan, C. 848
Ryan, E. 300
Rydén, L. 587
Ryder, R. E. J. 722, 725
Saad, F. 638, 872
Saada, A. 387
Saarenhovi, M. 124
Saari, T. 543
Sabatine, M. 561
Saely, C. H. 921, 930
Saevereid, H. A. 258, 590
Safadi, R. 869
Saffery, R. 413, 416
Sagara, M. 691
Sagili, H. 89
Sahi, G. 508
Saito, S. 414
Saito, T. 911, 915, 918
Saito, Y. 206
Sajadieh, A. 99, 581
Sakaguchi, M. 38
Sakai, S. 412
Sakamoto, Y. 803
Sako, A. 342
Sakuma, T. 802
Sakuramoto-Tsuchida, S. 385, 453
Sala, I. 878
Salah, A. 833
Saldova, R. 792
Salem, V. 226
Salna, E. 898
Salna, I. 898
Sambado, L. 184
Sambataro, M. 184
Samkani, A. 614
Samms, R. 556
Samonigg, J. 721
Sampedro, F. 259
Sampedro, J. 827
Samson, M. 523
Samson, S. 785
Samsonov, D. 257
Sánchez Iglesias, S. 303
Sanchís, P. 765
Sandahl, T. 26
Sandbæk, A. 157, 182, 260, 348
Sandholm, N. 100, 160, 794
Sandoval, H. 778
Sands, C. 548
Sanduka, S. 869
Sansome, D. J. 25
Santoro, N. 67
Santos, A. 142
Santos, C. 473
Sanyal, A. J. 70
Sarabhai, T. 520
Saraiva, G. L. 295
Saravanan, P. 652
Sargeant, J. A. 230, 564
Sargin, M. 594
Sari, S. 125
Sarsenbayeva, A. 502
Sas, T. C. J. 170
Sasaoka, T. 414, 451
Sassi, G. 369
Satin, L. S. 261
Satman, I. 615
Sato, H. 957
Sato, J. 150, 277
Sato, T. 517
Sattar, N. 6, 18 102, 235, 522, 545, 559, 572, 776
Sauzet, O. 793
Savarese, G. 570
Savelberg, H. H. C. 332, 727, 961
Savu, A. 300
Sawatani, T. 152
Scarale, M. G. 1, 341
Schaal, C. 367
Schalkwijk, C. G. 33, 201, 481, 503, 611, 761, 866, 883
Schaper, N. C. 332, 481, 727, 761, 828, 866, 961
Scharfmann, R. 221
Schaschkow, A. 216
Schatten, C. 86, 87
Schauvliege, S. 726
Scheijen, J. L. J. 33, 201, 611
Schena, F. 1
Schenk, M. 780
Schenker, N. 608
Schermann, P. 884
Schick, F. 72, 551
Schiffano, M. 234
Schiir-Bonnans, S. 108
Schimpl, M. 129
Schipani, R. 907, 908
Schittmayer-Schantl, M. 413
Schlegel, N. 626
Schleger, F. 430
Schleicher, W. E. 7
Schloot, N. 681
Schlüntz, C. 603
Schlüter, S. 639
Schmidt, J. 858
Schmidt, O. M. 334
Schmitt, A. 745, 757, 759, 767
Schmittdiel, J. 653
Schmitz, N. 766
Schneeweiss, P. 193
Schneeweiss, S. 289
Schneider, A. 851
Schneider, N. 430
Schoelkopf, B. 551
Schoelwer, M. 713
Scholten, B. 938
Schöniger, E. 211, 327
Schovanek, J. 426
Schram, M. T. 332, 481, 727, 761, 961
Schraut, K. E. 514
Schrauwen, P. 17, 229, 883
Schrauwen, V. 17
Schrauwen-Hinderling, V. B. 229, 866, 883
Schulte, A. M. 211, 217, 219, 320, 327, 353, 360, 396, 49
Schulze, M. B. 281
Schürmann, A. 352
Schuster, L. 103
Schuurman, M. 508
Schwab, P. 551
Schwaiger, E. 662, 685, 692
Schwarz, D. 847
Schwede, F. 94
Scirica, B. M. 97
Scognamiglio, F. 76
Scott, I. A. 437
Scott, R. S. 960
Scott, S. N. 255
Scottish Diabetes Research Network (SDRN) Epidemiology Group 274, 701, 709
Scottish Diabetes Research Network Type 1 Bioresource Investigators (SDRNT1BIO) 792
Scozzaro, M. T. 526
Scragg, J. H. 867
SDRN-Epi 79
Seaquist, E. 734
Sebastiani, G. 223, 320, 353
Secher, T. 835
Seebeck, N. 34
Segel, S. 48
Seghieri, M. 155
Segin, V. 838
Seidu, S. 343, 647
Seino, Y. 149, 301, 915
Seino, Y. 412
Seiron, P. 203
Sejersten Ripa, M. 590
Sekiya, M. 957
Selagamsetty, R. 172
Selbach, M. 11
Sellers, E. A. C. 800
Sellers, K. 208
Selvamoni, S. 652
Selvarajah, D. 181
Seman, L. 933
Sembach, F. E. 835
Semple, R. K. 218
Sen Gupta, P. 722
Senior, P. 321, 684
Sentinelli, F. 533
SENZA-PDN Investigators 186
Seo, D. 69, 879
Seo, S. 69, 879
Sep, S. 481
Sequeira Duarte, J. 524
Serhiyenko, A. 838
Serhiyenko, L. 838
Serhiyenko, V. 838
Serlie, M. J. 459
Serné, E. H. 459
Sesti, G. 472, 474, 684
Sethi, B. 664
Seufert, J. 351, 669, 753
Severina, A. 863
Seyfried, F. 626
Shah, B. 783
Shah, V. 968
Shaikh, S. 620
Shakeri, H. 152
Shamkhalova, M. 863
Shams, S. 75, 925
Shang, R. 912
Shang, S. 687
Shangguan, H. 896
Sharma, A. 566, 570
Sharma, R. 348
Sharratt, E. S. 725
Shaunik, A. 497, 666
Shaw, H. 184
Shaw, J. A. M. 18
Shaw, J. E. 585, 587
Shaw, J. L. 94
Shaw, K. M. 754
Shaw, S. J. 189
Shcherbina, L. 475
Shearer, D. 106
Shehni, A. A. 792
Shendelman, S. 629, 632
Sheng, T. 778
Sherr, J. 169
Sherwood, J. S. 172, 716
Shestakova, E. 450, 456
Shestakova, M. V. 280, 295, 334, 339, 450, 456, 640, 649, 650, 863, 890
Shevchenko, E. 452
Shi, H. 163
Shi, L. 665
Shi, M. 814, 845
Shi, Y. 242
Shibata, M. 412
Shields, B. 253
Shields, B. M. 331, 776
Shigiyama, F. 509
Shimada, Y. 802
Shimano, H. 957
Shimizu, H. 557
Shinde, S. N. 329
Shinohara, M. 813
Shirabe, S. 158, 945
Shoaib, F. 447
Shobatake, R. 453
Shojaee-Moradie, F. 328
Shpilevaya, O. 257
Shraim, M. 463
Shrivastava, V. 418
Shu, H. 220, 245, 261
Shulman, D. 169
Shulman, G. I. 30, 477
Sia, J. 278
Sicras, A. 663
Siddals, K. 308, 309, 311
Siddle, K. 218
Siebenmann, C. 618
Siebner, H. R. 228
Siegel-Axel, D. 530
Siersma, V. 943
Silecchia, G. 505, 532, 882
Silk, R. 824
Silva, C. G. 728
Silverman-Retana, O. 332
Simanenkova, A. 257
Simes, J. 960
Simmons, R. K. 332
Simó, R. 78, 827, 903
Simoens, C. 483
Simon, J. 731
Simone, S. 137
Simons, K. 211
Simons, N. 866
Simons, P. I. 866
Simó-Servat, O. 903
Simpson, S. 419
Sims, C. 680
Sindrup, S. H. 185
Singh, I. 283, 645
Singh, P. 118
Singhal, R. 118
Sink II, J. 710, 711
Sirvent, P. 448, 621, 623
Siu, D. C. W. 970
Sivagnanam, T. 620
Sjöström, D. 133
Skalides, E. 889
Skarulis Young, M. 463
Skladaná, M. 345
Sklavounos, I. 468
Sklyanik, I. 450, 456
Skog, O. 203
Skolnik, N. 785
Skøttrup, M. L. 964
Skoumas, I. 889
Skovgaard, D. 555
Skovlund, S. E. 769, 775
Škrha, J. 949
Škrha, P. 949
Skrtic, S. 528
Skytte, J. L. 835
Skytte, M. G. J. 581
Skytte, M. J. 614
Slaaby, R. 964
Slawik, M. 892
Sletner, L. 306
Sloan, G. 181
Slodkowski, M. 696
Sloop, K. W. 556
Slover, R. 169
Smith, A. 744
Smith, C. 225
Smith, D. M. 129
Smith, E. L. 740
Smith, L. 419
Smith, R. M. 231
Smith, U. 330
Snoek, F. J. 686, 746
Snow, K. 106
So, W. Y. 292
Soares, G. M. 955
Söderberg, S. 80
Soedamah-Muthu, S. S. 4
Soenen, S. 612
Soenmez, A. 11
Sohal, A. 823
Sokolovska, J. 898
Sokooti Oskooei, S. 236
Solé, T. 310
Soler, A. 765
Soleymanlou, N. 570
Solimena, M. 11, 211, 217, 219, 221, 327, 360, 396
Solon, C. 955
Sommer Matthiessen, K. 102
Sommer, C. 306
Somodi, S. 967
Somogyi, A. 873
Søndergaard, E. 123
Song, M. 501
Songia, P. 965
Sönmez, A. 221
Sonne, D. P. 312
Sonne, M. P. 539
Sonoda, N. 573
Soós, A. 774
Soran, H. 854
Sørensen, A. E. 252
Sørensen, H. T. 82, 182, 185, 977
Sørensen, I. R. 835
Soriguer, F. 346, 347
Sotiropoulos, A. 237, 655
Soulié, M. 910, 913
Soulimane, s. 4
Sourij, C. 616
Sourij, H. 196, 567, 576, 616, 742, 856
Sousa-Lima, I. 443, 886
Spaepen, E. 746
Sparacino, G. 121, 747
Spégel, P. 389
Spiegel, D. 33
Spiga, R. 472, 474
Spiliopoulou, A. 273
Spinelli, R. 330
Sprenger, L. 921, 930
Springer, C. A. 403, 405
Sprung, V. S. 460
Srinivas-Shankar, U. 832
Srivastava, A. 129
Stachlewska, K. A. 657, 658, 689
Staels, B. 70
Stafeev, I. 450, 452, 456
Stahre, C. 97
Stallknecht, B. M. 540, 604, 607, 959
Stam, W. 177
Stankova, B. 510
Stantonyonge, N. 259
Starostina, E. 763
Stasi, A. 137
Steck, A. K. 53, 631
Stedman, M. 265, 842
Steen Carlsson, K. 239
Steen, O. 738
Stefan, N. 538, 551, 72
Stefanakis, K. 128
Steffensen, R. 977
Steg, P. G. 627
Stehouwer, C. D. A. 201, 332, 481, 503, 611, 727, 761, 866, 883, 961
Steinmeyer, K. 327
Stene, L. C. 288
Stensel, D. J. 230, 564
Stenvinkel, P. 464
Stephan, Y. 910, 913
Stermann, T. 405
Stettler, C. 196, 210, 255, 748
Stevanović, S. 221
Stidsen, J. V. 2
Stienstra, R. 190
Stiglund, N. 168
Stillhard, B. L. 892
Stocker, D. 726
Stokin, G. B. 345
Stommel, M. W. J. 393
Storgaard, H. 155
Storkholm, J. H. 188, 574
Størling, J. 145
Štotl, I. 857
Støy, J. 155
Stracke, A. 417
Strain, W. D. 258
Strand, K. 168
Stranks, S. 717
Strassburger, K. 71, 166, 183
Stratmann, B. 858, 966
Streeter, M. 33
Strigini, M. 310
Strollo, R. 209
Strom, A. 183
Strömberg, T. 250
Strutz, J. 417
Study on Early-onset Type 2 diabetes (SET2) group 341
Stumvoll, M. 609
Su, X. 338, 384, 471
Suba, K. 226
Subramanian, A. 118
Subtil, D. 425
Suetsugu, S. 808
Sugano, Y. 957
Sugimura, Y. 412
Sugiyama, M. 20, 541, 554
Suhl, S. 718
Suka, M. 266
Sukumar, N. 652
Suleiman, M. 212, 217, 360, 394, 396
Sullivan, D. R. 960
Sullivan, M. 172
Sulpice, T. 813
Sultan, A. 895
Summanen, P. 75
Sun, J. 245
Sun, J. 976
Sun, M. 449
Sun, M. 455
Sun, R. 20, 541, 554
Sun, X. 130, 135, 864
Sun, X. 184
Sun, X. 916
Sun, Z. 275, 358, 359, 441, 490, 807
Sund, R. 648
Sundararajan, V. 905
Sundelin, E. I. 26, 906
Surendran, A. 423
Suresh, J. 934
Surmont, F. 295
Sutter, A. 780
Sutton, Jr, D. R. 710, 711
Suvitaival, T. R. L. 353, 525, 795, 819, 820, 940
Suzuki, A. 412
Suzuki, H. 517
Suzuki, H. 957
Suzuki, Y. 957
Svane, M. S. 228, 411, 442, 607
Svart, M. 504
Svebis, M. M. 429
Svehlikova, E. 55, 567
Svendsen, L. B. 438
Svensson, A.-M. 545, 6
Svensson, J. 322
Svietleisha, T. 336
Svoboda, P. 518
Szabó, E. 429
Szabo, L. P. 963
Szadkowska, A. 703
Szekeres, M. 963
Szendroedi, J. 71, 98, 166, 183, 71
Szpakowicz, M. 764
Szymczak, F. 394
T1DI Study Group 202, 318, 319, 364
Tabák, A. G. 335, 429
Tabet, E. J. 818
Tack, C. J. 43, 190, 733, 739
Tadayon, S. 555
Taddei, S. 120
Tahrani, A. A. 118, 846
Taimour, S. 923
Takagi, H. 20, 541, 554
Takahashi, K. 246, 575
Takamura, T. 29
Takao, T. 266
Takasawa, S. 385, 453
Takayanagi, T. 412
Takeda, Y. 37, 178, 810
Takeishi, S. 724
Takeshita, Y. 29
Takeuchi, C. 777
Takeuchi, M. 777
Takeuchi, T. 573
Taki, K. 20, 541, 554
Takiishi, T. 223
Takita, Y. 734
Talaeerad, Z. 636
Tam-Amersdorfer, C. 417
Tamayo, M. 765
Tamiwa, M. 668
Tan, T. 548
Tan, Y. 447
Tan, Y. 755
Tanaka, D. 297, 301
Tanaka, T. 414
Tang, F. 280, 295
Tang, S. 455
Tang, Y. 184
Tankova, T. 482
Taoui, S. 108
Taouis, M. 21, 553
Taraoune, I. 468
Tardif, J.-C. 627
Tarlton, J. 382
Tarnow, L. 730, 736
Tarussio, D. 580
Tasci, I. 969
Taskaeva, Y. 136
Taskinen, M.-R. 883, 960
Tatlisumak, T. 75, 925
Tavares, G. 494
Tavares, L. 407, 409, 409
Tavelin, B. 80
Taylor, G. S. 867
Taylor, R. 18, 235, 522
Tazaki, H. 517
Tedeschi, G. 388
Teh, M. 755
Tehranchi, R. 735, 738
Telgenkamp, I. 883
Telle, K. E. 288
Tellez, N. 214
Tentolouris, A. 207, 251
Tentolouris, N. 207, 251
ter Horst, R. 190
Terasaki, M. 911, 915, 918
Terauchi, Y. 246, 575
Ternynck, C. 425
Terra, L. F. 372
Terrenzio, C. 362
Terzic, D. 144
Tesfaye, S. 181, 843
Teshima, A. 313
Tesi, M. 212, 360, 373, 396
Tesselaar, E. 250
Tessem, J. S. 513
Testani, J. 933
Teuho, J. 543
Teumer, A. 113
Teyton, L. 369
Thacker, H. 664
Thai, K. 568
Tham, L. S. 697
Thanabalasingham, G. 876
Thang, C. 634, 637
Theilade, S. 797, 804, 819, 820, 940
Theis, S. 139
Thennati, R. 580, 582
Thieffry, A. 240
Thiel, S. 977
Thiele, R. 31
Thielke, D. 239
Thieme, L. 552
Thiemermann, C. 500
Thirumathyam, R. 959
Thoma, I. 792
Thomaides-Brears, H. 876, 877
Thomakos, P. 468
Thomas, N. J. 331, 350
Thomas, S. M. 839
Thomas, T. 653
Thomas-Delecourt, F. 900
Thompson, A. 460
Thomsen, H. 614
Thomsen, M. N. 614
Thomsen, R. W. 82, 182, 185, 270, 285, 977
Thomson, S. 723
Thomson, V. S. 934
Thorand, B. 851
Thorens, B. 580, 582
Thórisdóttir, O. 684
Thorn, L. M. 75, 925, 931
Thornalley, P. J. 304, 463
Thrasher, J. 169
Thumboo, J. 755
Tian, S. 956
Tian, Z. 271
Tienari, J. 176, 808
Tikhonov, E. 436
Timkina, N. 257
Timm, J. 858
Timofeev, A. 154
Timofte, D. 529
Tinahones, F. J. 205
Tintěra, J. 552
Tippett, P. 350
Tiron, A. 529
Tiron, C. 529
Tirosh, B. 502
Tiss, A. 488
Tittel, S. R. 323, 884
Tjalk-Bøggild, R. 730
Tkachuk, A. 436
Tobian, J. 58, 681
Tochigi, Y. 517
Toczyska, K. 243, 381
Todd, J. A. 262
Todi, S. 89
Todorčević, M. 114
Toeller, M. 4
Tofte, N. 797, 804, 940
Tohidirad, M. 341
Tolbod, L. P. 123, 906
Toledo, E. M. 114
Tolvanen, T. A. 451
Tomaru, T. 691
Tomas, A. 9
Tong, L. 929
Torabi, F. 45
Tordjmann, T. 234
Torekov, S. S. 293, 479, 540, 604, 607, 959
Torkamani, N. 61
Torlone, E. 470
Tornóczki, J. 429
Torrents, D. 109, 316
Torres, A. N. 407
Torres, L. 549
Toschi, E. 740
Toska, L. 405
Toulis, K. A. 118
Touloumi, G. 237
Tousinas, G. 535, 836
Traish, A. 638, 872
Tramontana, F. 209
Trattnig, S. 28
Trawley, S. 717
Tree, T. 353, 49
Treebak, J. T. 142
Tremaroli, V. 458
Trescoli, C. 666
Tretter, V. E. 963
Trevaskis, J. 129
Tricò, D. 67, 410, 526, 962
Tripathy, D. 141
Triplitt, C. 571
Tripolt, N. J. 616
Trischitta, V. 1
Trnovská, J. 518, 531
Trošt, K. 819, 940
Trouva, A. 468
Trouvas, D. 468
Tsai, C.-Y. 610
Tsapas, A. 5, 535, 836, 944
Tschoepe, D. 793, 858, 966
Tsereteli, N. 111
Tsilingiris, D. 207, 251
Tsoukas, G. 48
Tsoukas, M. 174
Tsuchida, K. 575, 599
Tsunekawa, S. 914
Tsunekawa, T. 20, 541
Tsuneki, H. 414, 451
Tsuruoka, S. 777
Tubiana-Rufi, N. 171
Tuohy, K. M. 500, 902
Tuomi, T. 63, 299, 406
Tuomilehto, J. 488
Tura, A. 30, 86, 87, 431, 600
Turner, M. D. 45
Turnin, M.-C. 108
Tuttle, K. R. 577
Twigg, S. M. 818, 865
Tynjälä, A. 925, 926
Type 1 Diabetes Consortium 355
Tyrberg, B. 213
Tyulpakov, A. N. 334
Tzeng, M.-S. 610
Tzeravini, E. 251
Tziomalos, K. 889
Uchigata, Y. 74
Uchiyama, T. 453
Udumyan, R. 84
Ueki, K. 569
Ueland, P. M. 198
Ueno, S. 412
Uffendell, C. 832
Uhles, S. 628
Ullmer, C. 628
Ullrich, S. 530
Umer, F. 719
Umpierrez, G. 659, 671
Umpleby, M. 328
Unger, J. 594
Unnikrishnan, A. G. 664
Uno, K. 414
Urbančič-Rovan, V. 857
Urbancova, K. 158, 945
Urner, S. 138
Urschitz, M. 567
Urva, S. 584, 602
Ustunomiya, K. 37
Usui, I. 691
Uthman, L. 125
Utsunomiya, K. 178, 803, 810
Vaccaro, O. 619
Vadakekolathu, J. 45
Vadrevu, S. 261
Vaduganathan, M. 572
Vaidya, A. 348
Valabhji, J. 153
Valcarce, C. 50, 51
Valdés, S. 346, 347
Valensi, P. 469, 489, 891, 895
Valentine, W. J. 788
Valeri, M. 827
Valerio, V. 965
Valerius, M. 817
Valkenburg, O. 883
Valo, E. 160, 794
Valverde Tercedor, C. 466
Vambergue, A. 425
van Buuren, F. 793
van Dam, A. D. 114
van Dam, K. 763
van de Gaar, J. 33
Van de Wijer, L. 190
van den Bergh, J. P. W. 279, 828
van den Eynde, M. D. 866
van der Aart, A. B. 133
van der Heijden, W. 190
van der Kallen, C. J. H. 201, 481, 503, 611, 727, 761, 961
van der Kolk, M. B. 393
van der Meer, T. P. 200
van der Ploeg, L. E. 866
Van der Schueren, B. 483
van der Waaij, K. M. 883
van der Zande, H. J. P. 448
Van Dessel, K. 830
van Doorn, W. P. T. 727
Van Eetvelde, B. L. M. 849
Van Elsen, M. 36, 768
van Gool, A. 190
van Goor, H. 393
van Greevenbroek, M. M. J. 201, 481, 611, 961
van Heugten, M. H. 822
van Krieken, P. P. 41
Van Loco, J. 483
Van Mechelen, M. 52
van Meijel, L. A. 733
van Niel, J. 822
van Oeteren, M. 33
van Raalte, D. H. 459
Van Rampelbergh, J. 52
Van Seuningen4, I. 217
van Weeghel, M. 125
van Zonneveld, A. J. 177
Vanden Wyngaert, K. 849
Vandenbempt, V. 224
Vandercappellen, E. J. 961
Vantyghem, M.-C. 363, 542
Vart, P. 190
Vasan, S. K. 934
Vasiljević, D. 11
Vasiljević, J. 11
Vasnawala, H. 278
Vasukova, E. 436
Vázquez-Carrera, M. 15
Veedfald, S. 25, 438, 479
Veeraiah, P. 17, 866
Veeze, H. J. 170
Vega-Guedes, B. 466, 467
Vegge, A. 964
Veigel, A. 323
Veijola, R. 202, 318, 319, 364
Veit, R. 193
Velayutham, V. 73
Veleba, J. 440, 552, 936
Velebova, K. 936
Velho, G. 799
Velikyan, I. 361, 578
Velloso, L. A. 955
Velotti, F. 532
Vencio, S. 158, 945
Vennekens, R. 483
Venteclef, N. 799
Vercammen, C. 36, 768
Vercruysse, F. 53, 631
Vergès, B. 233, 523
Verhey, F. R. J. 761
Verhulst, C. E. M. 192, 739
Verma, A. 271
Verma, D. 720
Verma, S. 572, 590, 947
Verrijken, A. 830
Verta, R. 500, 902
Vesper, I. 708
Vestergaard, H. 525
Vestergaard, P. 269, 279, 828
Vettorazzi, J. F. 955
Vettoretti, M. 747
Viaene, M. 369
Vianna, A. G. D. 784
Vicaut, E. 469, 705
Vidal, H. 14, 42
Vidrio Huerta, B. 375
Vieira, A. 728
Vienneau, T. 712
Vigorelli, V. 164, 917
Vikulova, O. 339, 890
Vila-Bedmar, R. 549
Villa, M. 486
Villadsen, G. 26
Villard, O. 95
Vilsbøll, T. 134, 139, 145, 155, 188, 232, 312, 539, 574, 582, 593, 603, 605, 737, 897
Vilstrup, H. 142
Vincenti, L. 380
Vinci, M. 164, 917
Vinet, A. 402
Violato, N. M. 223
Virtanen, K. A. 543
Visentin, R. 72
Visolyi, G. 429
VISS Study Group 806
Visseren, F. 102
Vistisen, D. 270, 293, 817
Vistisen, H. T. 333
Vistoli, F. 362
Vitale, M. 619
Vlachaki Walker, J. M. 189
Vlaminck, L. 726
Vlasov, T. 257
Vogel, H. 352
Vogrin, S. 680, 717
Vogt, J. K. 795
Vogtschmidt, Y. D. 4
Voican, A. 894, 939
Volčanšek, Š. 550
von Eynatten, M. 559
von Herrath, M. 48
von Scholten, B. J. 101, 525
Vonbank, A. 921, 930
Vonghia, L. 880
Vorotnikov, A. 450, 456
Vortherms, J. 793
Vortman, T. 204
Vos, R. C. 822
Vosseler, A. 23, 24, 538
Vrang, N. 139, 835
Vranic, M. 39, 528
Vyas, A. 208
Wada, E. 354
Wada, T. 414, 451
Waddell, T. H. 876, 877
Wadsack, C. 417
Wadwa, R. P. 713
Wägner Fahlin, A. 467
Wägner, A. M. 466
Wagner, L. 193
Wagner, L. 661
Wagner, M. 578
Wagner, R. 23, 24, 72, 530, 538, 551, 88
Wahlhütter, M. 203
Wailemann, R. A. M. 372
Wäldchen, M. 240
Walker, T. 105
Wallace, M. 508
Wallet, H. 425
Walton, C. 725
Wan, P. T. 129
Wändell, P. 84
Wang, C. 874
Wang, C. C. 821, 896
Wang, D. 807
Wang, F. 697
Wang, G. 689
Wang, H. 451
Wang, H. 888
Wang, H. S. 821
Wang, K. 204
Wang, K. 773
Wang, L. 812
Wang, L. 832
Wang, M. 245
Wang, Q. 187, 734
Wang, R. 508
Wang, R. 514
Wang, S. 175
Wang, S. 492
Wang, S. 896, 956, 958
Wang, W. 283, 645
Wang, W. 689
Wang, W. 771
Wang, W. 976
Wang, X. 439, 441, 579
Wang, Y. 12
Wang, Y. 93
Wang, Y.-F. 954
Wang, Z. 66
Wang, Z. 896
Wanner, C. 559, 565, 566, 569, 572, 933, 947, 974
Wareham, N. J. 194, 286
Warren, M. 58
Waszkiewicz, N. 764
Watada, H. 280, 295, 637
Watson, L. E. 410
Watts, G. F. 960
Webb, D. R. 230, 343, 564
Webber, H. 218
Weber, A. 741
Weber, N. C. 125
Weber, P. 614
Webers, C. 481
Webster, S. P. 514
Weedon, M. 350
Wegbrod, C. 11, 221
Wei, J. 278
Wei, Q. 357, 932
Weigert, C. 193
Weightman Potter, P. G. 189
Weikert, C. 281
Weinzimer, S. A. 713
Weir, M. R. 558, 559
Weiss, M. 430
Weksler-Zangen, S. 387
Weldessalasie, Y. 652
Wells, S. 162
Welsh, J. B. 105
Wen, Z. T. 379
Wenander, C. 512
Weng, J. 841
Wennberg, M. 458
Wentorf, E. K. 195
Werge, M. P. 142
Wessel, C. 365
Wesselius, A. 727, 761, 961
West, D. J. 196
Westenskow, P. 628
Westerbacka, J. 686, 753
Westerink, J. 102
Weston, K. 463
Wetzels, S. 503
Wewer Albrechtsen, N. J. 142, 144, 293, 442, 477, 625
Wexler, D. 289
Weyler, J. 880
Wheeler, D. C. 560
White, J. 738
White, S. L. 423
White, W. B. 837
Whyte, M. 842
Wibaek, R. 651
Wicklow, B. A. 800
Wierup, N. 92, 475, 543
Wigger, H. 906
Wigger, L. 211
Wiggers, H. 123
Wiklund, U. 487, 547
Wilbek Fabricius, T. 192
Wild, S. 274
Wildberger, J. E. 17
Wilderäng, U. 124
Wilding, J. P. H. 230, 460, 561, 564, 876
Wilk, A. 276
Wilkinson, H. 792
Wilkinson, I. 181
Will, S. 511
Willard, J. 735
Willemoes, R. J. 252
Willency, J. A. 146
Williams, A. 876
Williams, B. 837
Willis, S. A. 230
Wilman, H. 877
Wilmot, E. G. 351, 667, 669
Wilson, J. 652
Wilson, J. M. 146, 231, 577
Wilton, M. 876
Wintergerst, P. 639
Winther, S. A. 795, 797, 804, 940
Winther-Sørensen, M. 142
Winzell, M. S. 213
Winzenried, M. J. 88
Wissinger, U. 872
Witasp, A. 464
Witek, L. 764
Witte, D. R. 113, 157, 182, 332, 333
Wittemans, L. B. L. 114
Wittenbecher, C. 333
Wittmann, I. 303
Wium-Andersen, I. 260
Wium-Andersen, M. 260
Wiviott, S. D. 561
Wizert, A. 555
Woelnerhanssen, B. 892
Wojeck, B. 974
Wojtusciszyn, A. 95
Wolf, G. 707
Wolf, K. 851
Wolf, M. 567
Wolf, P. 28
Wolffenbuttel, B. H. 200
Woliner- van der Weg, W. 43
Wolkersdorfer, M. 520, 71
Wolpert, H. 683, 693, 752, 771
Wolthers, B. 134, 594
Won, J. 595
Wong, J. 818, 865
Wong, L. H. 416
Woo, J. 805
Woo, V. 785
Woo, V. C. 593
Woo, Y. 970
Wood, R. 570, 718, 773
Woodward, M. 458
Wördenweber, R. 54
Worm, D. 544
Wörner, T. 786
Wortmann, F. 748
Woskova, V. 859
Wouters, K. 33, 503
Wrede, J. 103, 791
Wretlind, A. 525
Wright, E. 659
Wu, B. 162
Wu, B. 818
Wu, H. 292
Wu, H.-T. 971
Wu, T. 25, 410, 439, 441, 579, 758
Wu, T. 818
Wu, X. 568
Wueest, S. 41
Würtz, P. 100, 794
Wuyts, C. 483
Wyatt, R. 45
Wyres, M. C. 722, 725
Xavier, D. 598
Xia, Y. 53, 631
Xiao, P. 223
Xiao, X. 420
Xie, C. 25, 439, 441, 579
Xie, D. 758
Xie, J. 175
Xie, Z. 896
Xiong, Y. 261
Xolin, M. 523
Xu, K. 377
Xu, W. 841
Xu, X. 245
Xu, X. 377
Xu, X. 690
Xu, X. 932
Xu, Y. 729
Xu, Y. 845
Xue, C. 294
Xue, H. 379
Xue, M. 463
Xue, S. 16
Yabe, D. 297
Yadagiri, M. 722, 725
Yaggi, H. 974
Yaginuma, H. 20, 541, 554
Yahagi, N. 957
Yah'yaev, K. 450, 456
Yajima, T. 922
Yakovleva, A. 257
Yale, J.-F. 174
Yamada, M. 557
Yamada, T. 573
Yamada, Y. 914, 915
Yamagishi, S.-I. 911, 915, 918
Yamanaka, K. 554
Yamashita, K. 801, 802
Yamauchi, A. 385, 453
Yamauchi, K. 957
Yamauchi, Y. 575
Yamazaki, Y. 301
Yan, Y. 187, 734
Yanagisawa, H. 266
Yanai, H. 342
Yang, A. 292
Yang, G. 16, 19, 22, 117, 249, 445, 534
Yang, H. 513
Yang, H. H. 379
Yang, H.-C. 576
Yang, J. 455
Yang, J.-Y. 954
Yang, S. 117
Yang, S.-N. 242
Yang, T. 248, 377
Yang, X. 841
Yang, X. H. 379
Yang, Y. 220
Yang, Y. 485
Yao, H. 635
Yardley, J. 196
Yashima, H. 911, 915, 918
Yates, T. 230, 564
Ye, Q. 414
Ye, S. 687
Ye, Y. 12
Ye, Y. 976
Yepuri, G. 629, 632
Yerlikaya-Schatten, G. 86, 87
Yeung, R. 300
Yfantopoulos, J. 344
Yi, P. 922
Yi, X. 394
Yildiz, M. 152
Ylinen, A. J. J. 931
Yokota, T. 178, 37, 810
Yokota, T. 575
Yokote, K. 150, 277, 569, 909
Yokoyama, K. 803
Yoon, K.-H. 946
Young, K. G. 331
Young, R. L. 439
Yu, D. 929
Yu, J. 242
Yu, J. 490
Yu, L. 242
Yu, O. H. Y. 290
Yu, X. 175, 521
Yu, Y. 697
Yu, Z. 586, 589
Yuan, Q. 455
Yuan, T. 96
Yuan, Y. 821
Yurasov, A. 450, 456
Zaccardi, F. 343, 647, 941
Zafari, N. 61
Zagraj, V. B. 774
Zaharia, O. P. 71, 98, 166
Zaharieva, D. 680
Zak, P. 345
Zakrzewski, L. 55
Zangerolamo, L. 955
Zanker, M. 616
Zanolin-Purin, D. 921
Zapardiel-Gonzalo, J. 314
Zarrouki, B. 213
Zatterale, F. 307
Zaveri, N. S. 57, 673
Zawistowska-Deniziak, A. 448
Zeder, A. 210
Zelaya, F. 191
Zeniya, M. 803
Zerbini, F. 486
Zhang, A. 950
Zhang, B. 597
Zhang, C. 139
Zhang, E. 12
Zhang, H. 125, 560, 814, 845
Zhang, H. 958
Zhang, H. 976
Zhang, J. 929
Zhang, K. 93
Zhang, L. 874
Zhang, M. 187
Zhang, M. 377
Zhang, P. 305
Zhang, P. 613
Zhang, Q. 248
Zhang, Q. 420
Zhang, Q. 672, 676
Zhang, Q. 689
Zhang, S. 851
Zhang, X. 220, 245, 261
Zhang, X. 33, 503
Zhang, X. 687
Zhang, X. 734
Zhang, X.-M. 477
Zhang, Y. 379, 390
Zhang, Y. 568
Zhang, Z. 682
Zhao, G. 337
Zhao, J. 569
Zhao, K. 242
Zhao, X. 379
Zheleznyakova, A. 339, 890
Zhen, C. 311
Zheng, H. 172
Zheng, X. 976
Zhi, L. P. 379
Zhi, M. 948
Zhou, A. 213
Zhou, X. L. 449
Zhou, Y. 358
Zhou, Y. 495
Zhu, D. 305, 366, 454
Zhu, W. 958
Zhu, X. 357, 384, 415
Zhu, Y. 841
Zhu, Y. 901
Zhyzhneuskaya, S. 235
Ziegler, A.-G. 364
Ziegler, D. 183, 851
Ziegler, R. 731
Ziko, H. 721, 742
Ziller, C. 46
Zimmermann, R. 417
Zinman, B. 122, 149, 559, 565, 566, 569, 572, 591, 732, 933, 947, 974
Ziori, M. 655
Zisser, H. 107
Zobel, E. H. 101, 525, 938
Zoega, H. 424
Zoghbi, M. 594
Zoka, R. 53, 631
Zou, G. 750
Zou, H. 521
Zoupas, C. S. 468
Zraika, S. 144
Zubkova, N. 154
Zueger, T. 196, 210, 255, 748
Zügner, E. 576
Zuurbier, C. J. 125
Zwiener, I. 566, 569, 933, 947, 974
Zygała, D. 310
Rights and permissions
About this article

Cite this article
56 th EASD Annual Meeting of the European Association for the Study of Diabetes . Diabetologia 63 (Suppl 1), 1–485 (2020). https://doi.org/10.1007/s00125-020-05221-5
Published:
Issue Date:
DOI: https://doi.org/10.1007/s00125-020-05221-5