
Abstract
Many modern biology studies require deep, whole-genome sequencing of hundreds to thousands of samples. Although per-sample costs have dramatically decreased, the total budget for such massive genome sequencing constitutes a significant barrier for poorly funded labs. The costly lab tools required for genomics experiments further hinder such studies. Here, we share two strategies for extensively reducing the costs of massive genomics experiments, including miniaturization of the NEBNext Ultra II FS DNA Library Prep Kit for Illumina (reducing the per-sample total costs to ~ 1/6 of that charged by service providers) and in-lab 3D model-designing of genomics tools. These strategies not only dramatically release funding pressure for labs, but also provide students with additional training in hands-on genomics and 3D-model-designing skills, demonstrating the high potential for their application in genomics experiments and science education.
Introduction
Following its commercialization in 2008, next-generation genome sequencing has been applied to most branches of biology and has facilitated rapid advancements by removing numerous technical barriers such as sequencing speed, read length, throughput and especially cost. Consequently this technology has made possible the detection of mutations both at single-base-pair resolution and at whole-genome scale, and the identification of key genes regulating complex phenotypes (Morozova et al. 2009; Navin et al. 2011; van Dijk et al. 2014). The per-sample costs for genome sequencing have decreased dramatically in recent years, further promoting larger-scale genomics experiments. As the sequencing costs decrease faster than that of the library construction, the latter accounts for an increasing proportion of the total costs of genomics projects, especially for small genomes such as those of microorganisms. For example, it costs ~ 50 USD for an Illumina DNA library and ~ 8 USD/Gbp for a bacterium sample by Berry Genomics, Inc. (Beijing) as of June 2019.
Genome sequencers usually accept a wide range of pooled library concentrations for one lane of a flow cell. For example, our Illumina HiSeq Χ Ten service provider requires pooled libraries with ≥ 3 nM concentration and ≥ 15 μL volume. If, following manufacturers’ standard library protocols, library output per sample is one to two orders higher than the minimum concentration, dilution is usually needed during library normalization. It is thus possible to avoid such overkill and reduce the costs by scaling down the reaction system of library construction. Previous researchers have made some efforts to implement this idea: Ogiso-Tanaka et al. (2018) miniaturized the AmpliSeq library preparation reaction system of ultra-multiplexed PCR amplicons and reduced the Ion-Torrent sequencing costs to 1/7 of the original protocol; Mora-Castilla et al. (2016) also developed cost-effective single-human-cell transcriptome library procedures, including dramatically scaling down the cDNA library preparation using the Nextera XT DNA preparation kit (Illumina, Inc.).
3D printing has been revolutionizing industrial production (Attaran 2017; Gross et al. 2014). Most compact 3D printers only need limited space. They construct an object layer by layer in a quick, cost-effective, and flexible way, especially those using printing filaments made of polylactic acid (PLA) or acrylonitrile butadiene styrene (ABS). 3D design softwares, such as 3ds Max, 3D Slash, LibreCAD, DesignSpark, Sculptris etc., provide increased complexity and design freedom. All these advantages render possible the use of 3D technology to design and produce laboratory tools in-house.
As a starting experimental evolution lab, many of our studies require re-sequencing the whole genomes of hundreds of microbial cell lines. We have been trying to design the most cost-effective way of making large-scale research possible. This has resulted in the successful application of two major strategies: (1) extreme miniaturization of library construction kits. This was achieved by developing a modified protocol using a fast and reliable NEBNext Ultra II FS DNA Library Prep Kit for Illumina, a kit recently released by NEB for which the per-sample price is much lower than most other kits for the same purpose (for example, for a 24-sample kit, Illumina Nextera DNA Flex Library Prep costs 1008 vs. 635 USD for the NEB kit); (2) laboratory genomics tools designed and made in-house using a 3D-model printer. With one-and-a-half years testing of these two strategies, we are now comfortable to share them with the science community, especially those planning large-scale genomics studies.
Strategy 1: DNA library preparation kit miniaturization
As mentioned above, library construction is the most costly step for whole-genome sequencing of small-genome samples. We have developed several protocols for genome and transcriptome sequencing. Here, as an example, we introduce a modified library construction protocol using the NEBNext Ultra II FS DNA Library Prep kit (NEB Cat. No.: E7805S; 24 samples), which is fast, reliable and has low per-sample costs.
Procedures for constructing miniaturized libraries
Genomic DNA from 191 lab-evolved Escherichia coli K-12 MG1655 cell lines carrying different SNPs (single nucleotide polymorphisms) was extracted using the Wizard® Genomic DNA Purification Kit. After quality control of all the samples with Qubit® and NanoDrop®, we diluted each DNA sample with nuclease-free water to 7.7 ng/μL and transferred a 1.3 μL aliquot of each sample into a well of a 96-well plate using multi-channel pipettes. Then standard workflow of fragmentation/end preparation, adaptor ligation, cleanup of adaptor-ligated DNA, PCR enrichment of adaptor-ligated DNA, cleanup of PCR and assessment of library quality was applied. The modified reagent volumes of major steps are listed in Table 1 and a modified NEB protocol for input DNA < 100 ng with step by step details is in Supplemental File S1. It should be noted that different steps are not scaled down equally (most reagents in the same step are scaled down equally), with ratios ranging from 1/20 to ~ 1/3 following numerous trials (Table 1). The quality control of final libraries was performed by Qubit® measurement and gel electrophoresis. The library insert size was ~ 350 bp (insert size was estimated based on the library size distribution of the six libraries on the gel; Fig. 1) and mean library concentration across all samples was 4.67 (standard deviation: 2.37) ng/μL or 23.39 (11.87) nM. The insert size and concentration meet the basic requirements for downstream Illumina X Ten sequencing. Similar to many other library kits using enzymatic DNA fragmentation such as the Illumina Nextera DNA Preparation Kit, the library insert size of small genomes is too short for paired-end sequencing if following the standard protocol. We thus shortened the enzymatic fragmentation time to 5 min at 37 °C for the fragmentation reaction step (Supplemental File S1). The magnetic-beads volume ratio for size selection was also adjusted to increase the library size (steps 15 and 31 in Supplemental File S1). An additional round of size selection for library size > 450 bp on pooled libraries is recommended before sequencing.

Library size (size of insert plus indices) distribution of six randomly chosen E. coli libraries constructed with the miniaturized protocol (before pooling). From top to bottom, DNA marker sizes are 2000, 1000, 750, 500, 250, 100 bp
Miniaturized vs. outsourced libraries after sequencing
Many researchers outsource all their genomics experiments to service providers, which frequently choose the Illumina TruSeq DNA nano Library Kit due to its low price, long usage history and reliability, for example, 660 USD for a 24-sample kit (Cat. No.: 20015964). We randomly chose 10 genomic DNA from the total of 191 samples and outsourced to Berry Genomics, Inc. Beijing for TruSeq nano library construction and Illumina NovaSeq sequencing, to evaluate the sequencing quality using the miniaturized NEB library protocol. The sequencing platform was different from the above-mentioned X Ten for the miniaturized libraries, as the service provider required NovaSeq sequencing for small amounts of sample order. The two sequencing/library platforms are not known to differ in sequencing quality (Arora et al. 2019).
It is not uncommon that service providers require hundreds of nanograms to several micrograms of genomic DNA per sample (2 μg in our case) for Illumina library construction, so that they could have sufficient DNA to repeat the protocol if the initial trial is not successful. In addition, service providers usually require a minimum sequencing amount, for example, 6 Gbp per sample for our service provider, to make the exercise commercially viable. But this is overkill for our E. coli samples with a genome size of ~ 4.6 Mbp, and the sequencing resulted in 1435 × mean depth of coverage for the ten outsourced samples, with a coefficient of variation 11% (Table 2).
By contrast, the miniaturized protocol needs only 10 ng genomic DNA (the lowest DNA amount could be 100 pg as per manufacturer’s instructions). We also ordered a full X Ten lane (100 Gbp, 1091 USD) for the 191 miniaturized libraries that were normalized in the laboratory using the Qubit® measurement of each sample and this reduced the sequencing costs per sample to less than 6 USD (not including the library costs). The mean depth of coverage of the ten samples using the miniaturized protocol was about 97 ×, with a coefficient of variation of 27%. Although the miniaturized protocol leads to higher sequencing-depth variance, which is possibly caused by the enzymatic fragmentation vs. fragmentation by sonication in the outsourced TruSeq nano protocol, the coverage distribution along the whole genome is consistent between the two methods (Fig. 2; coverage distribution of another nine tested samples is shown in Supplemental Figure S1). This is usable at least for downstream SNP analysis, and one of our previous studies used a similar enzymatic-fragmentation library protocol in successfully detecting large-scale structural variants, which were verified by RT-PCR (Long et al. 2016).

Normalized coverage across the whole-genome of strain TA40MA189 using the miniaturized NEB and the outsourced protocols. The whole genome is 1-kb-binned with 500 bp step size; coverage is normalized by dividing the coverage of each bin with the mean coverage of the whole genome
The sequencing quality of reads from the miniaturized libraries is higher than that from the outsourced protocol (Table 2). To be specific, the miniaturized reads were better than the outsourced reads by 2.6% for forward reads and 1.6% for reverse reads on average in the proportion of reads with Phred quality score higher than 30 (forward reads: 98.0% miniaturized vs. 95.4% outsourced; reverse reads: 94.3% miniaturized vs. 92.7% outsourced; paired t-test, P < 0.05).
We mapped the cleaned reads from both library protocols to the E. coli MG1655 reference genome (NCBI Accession No.: NC_000913.3) using BWA ver. 0.1.12. Read mapping rates were not significantly different (99.5% outsourced vs. 97.2% miniaturized; paired t-test, P = 0.07) and the breadth of coverage (proportion of the genome sequenced) was identical (99.6%). Reads of all ten samples using both the miniaturized and outsourced library protocols have been submitted to NCBI SRA, with the BioProject number of PRJNA551791.
We also detected all the SNPs carried by the ten samples with standard hard filtering parameters as per GATK Best Practices recommendations (DePristo et al. 2011; Li and Durbin 2009; McKenna et al. 2010; Van der Auwera et al. 2013). The SNPs were identical regardless of whether the outsourced or the miniaturized method was used (Table 3).
Although the miniaturized NEB library protocol leads to a slight decrease in the overall quality after sequencing compared with the service provider’s protocol, the same SNP results from both protocols and the dramatic cost difference justify the application of the miniaturized protocol, especially if hundreds to thousands of samples need to be processed. Nevertheless, further efforts should be invested in improving this protocol to ensure it achieves no worse quality than the commercial protocol. In addition, this miniaturized protocol was only tried on E. coli, thus testing this protocol with other organisms is needed to make it more robust and reliable. Based on previous experience with similar kits using enzymatic fragmentation, miniaturized protocols usually work better with larger genomes than smaller ones.
Strategy 2: designing and making laboratory tools using 3D printing technology
As is widely known, many laboratory tools required for molecular and genomic experiments, such as hemocytometers and magnetic racks, are extremely expensive, and some are not commercially available. By contrast, 3D printers, especially home/entry-level ones that utilize PLA or ABS printing materials, are accessible, inexpensive and reliable. For example, the ET-K1 printer (Shenzhen Yite Technology Co., Ltd., http://www.et3dp.com/product/277950971) costs 700 USD and has been heavily used in our laboratory for at least 2000 h.
Procedures for 3D model designing and printing of a magnetic stand
Our lab-designed 3D models for a 20-well microtube magnetic stand, a 12-well PCR tube magnetic stand and a 96-well PCR plate magnetic rack in STL format are in Supplemental Files S2–S5, and have also been submitted to https://sketchfab.com/3d-models/magnetic-rackstand-for-omicsbiol-experiments-28817402af1348ecb13caa3b7b2709e7. Here, we demonstrate the process for designing and printing a 3D model of the 20-well microtube magnetic stand, which is required for many genomic DNA extraction and library construction kits using magnetic beads. Briefly, we performed the flowing steps:
- (1)
Sketch the model of the magnetic stand and use 3ds MAX (version 2018), a 3D modeling software, to draw the 3D model based on the sketch. The model is composed of the top and bottom parts (Fig. 3a, b, d; Supplemental Figure S2). There are three key designs for the stand: 15° oblique wells for the microtube to directly touch the magnet for high-efficiency magnetic beads enrichment; a slide way to connect the two parts; grooves for magnets to avoid the use of glue.
Fig. 3 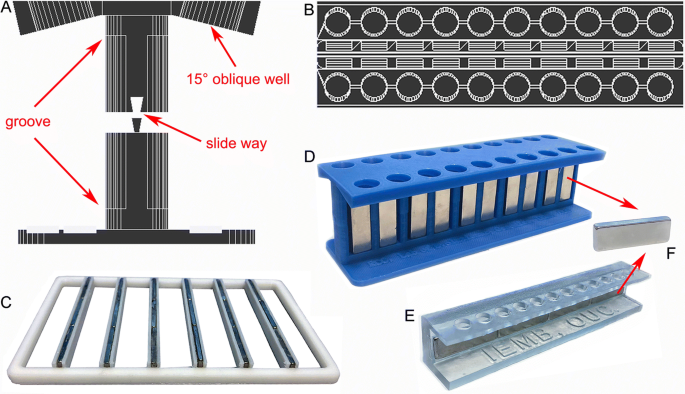
3D models of magnetic stands/racks before (a, b) and after (c–e) printing. (a) Front-lateral view of the two parts of the 20-well microtube magnetic stand model; (b) top view of the top part’s reverse side, a partial demonstration of the 3D model; (c) one 96-well PCR plate magnetic rack with NdFeB magnets (25 × 5 × 2 mm, order link: https://item.m.jd.com/product/12261579995.html) glued; (d) one 3D-printed 20-well microtube magnetic stand with NdFeB magnets loaded; (e) one 12-well PCR tube magnetic stand with magnets (30 × 10 × 4 mm, order link: https://m.tb.cn/h.e4VF7Fc?sm=a9714e) glued; (f) high power NdFeB magnet made from rare earth, with the dimension of 30 × 10 × 4 mm
- (2)
After the model is done, export it in STL format (Supplemental Files S2, S3). This could be directly printed depending on the requirements of the 3D printer. If not, continue with the following slicing.
- (3)
In Cura (version 4.1), import the model in STL and slice it. The slicing parameters are set as follows: layer thickness 0.1 mm, wall thickness 0.1 mm, bottom thickness 1 mm, and 100% filling density. Save the model in the gcode format.
- (4)
Print the model in gcode or STL with a 3D printer. Adjust the design based on the printed model. The printing time could be from minutes to days, depending on the size and complexity of the model.
- (5)
Load high-power NdFeB magnets made from rare earth to the stand. The two magnets in opposing grooves with different polarity sides attract each other, so that no glue is needed (Fig. 3d, f).

Testing the 3D-printed magnetic stand
To evaluate if the 3D-printed magnetic stand is truly useful and comparable to commercial counterparts, we enriched three 50 μL magnetic beads samples in 1.5 mL Eppendorf tubes on a 3D-printed and a commercial magnetic stand (Thermo-Scientific DynaMag-2 Magnet, Cat. No.: 12321D, 626 USD unit price as of June 22, 2019 vs. 14 USD for the 3D-printed model cost). Bead enrichment of each sample was repeated three times. The 3D-printed magnetic stand took on average 67.5 s (standard deviation: 1.3), which was shorter than the commercial one: 84.2 s (3.9). The other two 3D-printed models (12-well PCR tube stand and 96-well PCR plate rack, glue is needed for these models) (Fig. 3c, d, e) also showed high efficiency in size selection using magnetic beads, for example, all size selection in the above NEB library construction used a 3D-printed 96-well magnetic rack.
Thus, 3D technology opens the access to numerous overpriced laboratory tools and matches or even surpasses the quality of their commercial counterparts. In addition, the 3D models designed in our laboratory were from two undergraduate students (both are co-authors of this paper), who taught themselves 3D model-designing and practiced their skills with the laboratory resources. Someone even got the idea of starting a company that offers customized designing and printing service for the science community! This unexpected opportunity further motivates us in applying this strategy to every aspect of work in our laboratory.
Closing remarks
This study demonstrates two research strategies, i.e., extreme miniaturization of a genome library preparation kit and the application of 3D designing and printing technology, which dramatically reduce costs of large-scale genomics research. Nonetheless, the final costs of such research are from multiple steps, not only library construction or laboratory tools, but also DNA extraction, sequencing reactions, consumables, labor, etc. So systematic efforts are needed to reduce the costs of all steps. We are aware that many other unpublished cost-reduction strategies for biology experiments are used elsewhere and we are eager to learn of them from fellow researchers. Collectively, these techniques would lead to the more efficient running of research laboratories in the future.
References
Arora K, Shah M, Johnson M, Sanghvi R, Shelton J, Nagulapalli K, Oschwald DM, Zody MC, Germer S, Jobanputra V, Carter J, Robine N (2019) Deep sequencing of 3 cancer cell lines on 2 sequencing platforms. bioRxiv. https://doi.org/10.1101/623702
Attaran M (2017) The rise of 3-D printing: the advantages of additive manufacturing over traditional manufacturing. Bus Horiz 60:677–688
DePristo MA, Banks E, Poplin R, Garimella KV, Maguire JR, Hartl C, Philippakis AA, del Angel G, Rivas MA, Hanna M, McKenna A, Fennell TJ, Kernytsky AM, Sivachenko AY, Cibulskis K, Gabriel SB, Altshuler D, Daly MJ (2011) A framework for variation discovery and genotyping using next-generation DNA sequencing data. Nat Genet 43:491–498
Gross BC, Erkal JL, Lockwood SY, Chen CP, Spence DM (2014) Evaluation of 3D printing and its potential impact on biotechnology and the chemical sciences. Anal Chem 86:3240–3253
Li H, Durbin R (2009) Fast and accurate short read alignment with Burrows–Wheeler transform. Bioinformatics 25:1754–1760
Long H, Miller SF, Strauss C, Zhao C, Cheng L, Ye Z, Griffin K, Te R, Lee H, Chen CC, Lynch M (2016) Antibiotic treatment enhances the genome-wide mutation rate of target cells. Proc Natl Acad Sci USA 113:E2498–E2505
McKenna A, Hanna M, Banks E, Sivachenko A, Cibulskis K, Kernytsky A, Garimella K, Altshuler D, Gabriel S, Daly M, DePristo MA (2010) The Genome Analysis Toolkit: a MapReduce framework for analyzing next-generation DNA sequencing data. Genome Res 20:1297–1303
Mora-Castilla S, To C, Vaezeslami S, Morey R, Srinivasan S, Dumdie JN, Cook-Andersen H, Jenkins J, Laurent LC (2016) Miniaturization technologies for efficient single-cell library preparation for next-generation sequencing. J Lab Autom 21:557–567
Morozova O, Hirst M, Marra MA (2009) Applications of new sequencing technologies for transcriptome analysis. Annu Rev Genomics Hum Genet 10:135–151
Navin N, Kendall J, Troge J, Andrews P, Rodgers L, McIndoo J, Cook K, Stepansky A, Levy D, Esposito D, Muthuswamy L, Krasnitz A, McCombie WR, Hicks J, Wigler M (2011) Tumour evolution inferred by single-cell sequencing. Nature 472:90–94
Ogiso-Tanaka E, Kaga A, Hajika M (2018) Miniaturization technologies for cost-effective AmpliSeq library preparation for next generation sequencing. J Appl Microb Res 1:43–49
Van der Auwera GA, Carneiro MO, Hartl C, Poplin R, Del Angel G, Levy-Moonshine A, Jordan T, Shakir K, Roazen D, Thibault J, Banks E, Garimella KV, Altshuler D, Gabriel S, DePristo MA (2013) From FastQ data to high confidence variant calls: the Genome Analysis Toolkit best practices pipeline. Curr Protoc Bioinform 43:11.10.1–11.10.33
van Dijk EL, Auger H, Jaszczyszyn Y, Thermes C (2014) Ten years of next-generation sequencing technology. Trends Genet 30:418–426
Acknowledgements
This research is funded by the National Natural Science Foundation of China (31872228, 31961123002), Distinguished Scholars Support Program of Laboratory for Marine Biology and Biotechnology, Qingdao Pilot National Laboratory for Marine Science and Technology (YJ2019NO04), the Taishan Scholars Program for Early Career Experts of Shandong Province (tsqn201812024), and the Fundamental Research Funds for the Central Universities of China (201822020). We thank Jean-Francois Gout for the inspiration in 3D printing of laboratory tools.
Author information
Authors and Affiliations
Contributions
HLi, KW, HLong designed this study; HLi, KW, CR, JP, YW performed genomics experiments and 3D designing; all authors were involved in data analysis and manuscript writing.
Corresponding author
Ethics declarations
Conflict of interest
The authors declare no conflict of interest.
Animal and human rights statement
No animal or human materials were used in this study.
Additional information
Edited by Jiamei Li.
Electronic supplementary material
Below is the link to the electronic supplementary material.
Rights and permissions
Open Access This article is distributed under the terms of the Creative Commons Attribution 4.0 International License (http://creativecommons.org/licenses/by/4.0/), which permits unrestricted use, distribution, and reproduction in any medium, provided you give appropriate credit to the original author(s) and the source, provide a link to the Creative Commons license, and indicate if changes were made.
About this article

Cite this article
Li, H., Wu, K., Ruan, C. et al. Cost-reduction strategies in massive genomics experiments. Mar Life Sci Technol 1, 15–21 (2019). https://doi.org/10.1007/s42995-019-00013-2
Received:
Accepted:
Published:
Issue Date:
DOI: https://doi.org/10.1007/s42995-019-00013-2