


Abstract
Aim To differentiate between physiological and pathological left ventricular hypertrophy in athletes using echocardiography.
Methods and results Eleven patients with mild hypertrophic cardiomyopathy were compared against 17 international rowers with mild left ventricular hypertrophy, and 30 age matched controls. The time difference between peak Ea (Doppler tissue imaging) and peak mitral valve opening (using M-mode) was measured simultaneously. A novel index (E/Ea)/LVEDD, as a measure of left ventricular stiffness was recorded. In athletes the peak Ea preceded peak mitral opening by: median (interquartile range) 20ms (10,20), control group 15ms (0,30), compared with HCM where Ea followed peak mitral opening by 10ms (0,20), P <0.0001. In athletes the index of left ventricular stiffness was lower than controls 1.2 (0.93,1.4) versus 1.5 (1.3,1.6), and HCM 2.2 (2.0,2.3), P <0.0001.
Conclusion Physiological hypertrophy can be differentiated from hypertrophic cardiomyopathy in athletes using the Ea-peak mitral opening difference, and our index of ventricular stiffness.
Introduction
Sudden death in athletes is a sporting catastrophe. 1 Identifying athletes at risk of sudden death remains a great challenge because the athlete's heart undergoes adaptive changes in response to physical exercise that can induce left ventricular hypertrophy (LVH) that can mimic pathological abnormalities. 2 The more important question that needs to be resolved once an athlete is identified as having LVH is whether it is a normal physiological response or a pathological phenomenon, with hypertrophic cardiomyopathy being the important differential diagnosis. Methods are currently employed to diagnose whether athletes have physiological or pathological left ventricular hypertrophy (LVH), 3 but they are not comprehensive or practical for large populations. Genetic studies in the past have revealed that a substantial minority of patients with HCM have LVH in the same range as athletes, but genetic testing is not a practical option. 3 Traditional echocardiographic and electrocardiographic features may not adequately distinguish physiological from pathological LVH. 1
Doppler Tissue Imaging (DTI) is an ultrasound modality that can be used to record systolic and diastolic myocardial velocities. 4,5 Studies have recorded mitral annular displacement and velocity both in systole and diastole as indicators of overall cardiac performance. 6–8 Our aims were to evaluate novel indices using DTI and other echocardiography modalities to differentiate hypertrophic cardiomyopathy (HCM) from athletic physiological left ventricular hypertrophy where mild LVH exists.
Methods
Following approval from the human ethics committee of the St James Hospital, patients and volunteers were recruited and informed written consent obtained.
Between 2002 and 2004 ongoing research of 27 patients diagnosed with HCM (HCM group) led to the identification of 11 (30%) adults with characteristics of mild HCM (LV wall thickness >13mm) without left ventricular outflow tract obstruction. Routine genetic testing was not available at the time of recruitment for our study. The patients were recruited from our out-patient department with a clinical diagnosis of HCM based on clinical presentation (chest pain, dyspnoea, syncope, family history of HCM or sudden death), examination findings and the presence of significant LVH in the absence of an identifiable cause of the LVH. Six had a history of arrhythmia and abnormal ECG (of which three had increased voltages with prominent q waves and the other three had inverted t waves with prominent q waves). The other five had normal ECG, but had a strong family history of HCM, arrhythmias, dyspnoea, and serial echoes over previous years showed progressive left ventricular wall thickness.
The physiological LVH group was identified among 34 highly trained international rowers who had trained intensively 15–20h per week for more than 5 years, of which 17 (50%) had a left ventricular wall thickness ≥12mm. None had a family history of HCM or premature sudden cardiac death, and all were normotensive. A control group of 30 sedentary but otherwise normal subjects were recruited from hospital personnel including young hospital doctors and medical students.
Measurement protocol
Echocardiography images were obtained with Philips Sonos 5500 and Philips Sonos 4500 cardiac ultrasound systems (Phillips, Andover, USA).
- 1.
Baseline echocardiography examination to rule out structural abnormality.
- 2.
Doppler tissue imaging recordings were obtained from the apical views at the medial, lateral, inferior, and anterior basal segments just below the mitral annulus. The average velocity from the four sites was calculated.
- 3.
Mitral inflow pulsed wave Doppler spectral display.
- 4.
Left ventricular end-diastolic dimension (LVEDD), and septal and posterior wall thicknesses were obtained from the parasternal long axis view, with the M-mode cursor cutting through the base of the heart. Ejection fraction was calculated by the method of disc summation based on Simpson's rule. This method treats the ventricle as a stack of discs and is recommended because it is independent of preconceived ventricular shape. Left ventricular mass was estimated by the method of Devereux by applying the Penn convention. 9
- 5.Time delay between peak tissue annular velocity (Ea) and peak mitral valve opening was calculated by obtaining simultaneous M-mode recording of mitral valve opening and lateral annular DTI using two echocardiography machines and a sharply defined time referenced pulse. The reference pulse was introduced into unused ECG channels on both machines by pressing a foot switch activated circuits, which allowed comparisons to be made in the same heartbeat. This relationship is shown in Fig. 1 .Figure 1
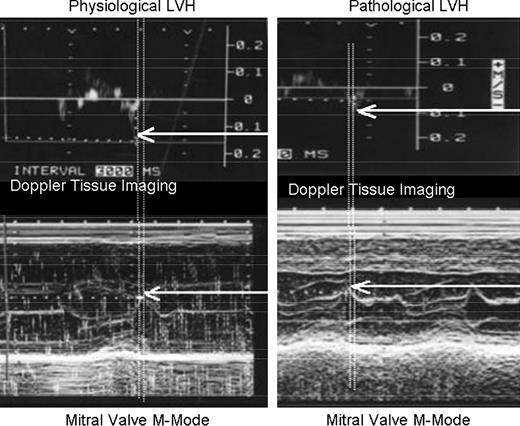
Timing relationship between peak Ea and peak mitral valve opening. A time reference pulse was introduced into the displays of both machines to allow measurement on simultaneous heartbeats. In physiological LVH, the peak Ea preceded the peak MV opening, whereas in HCM, the peak Ea followed the peak MV opening.
A sweep speed of 100mm/s was used for all recordings. Measurements were performed off-line by two independent observers, blinded to each other's data. The values presented are the average of both observers with three beats per measurement.
Derived indices
- 1.
Time difference between peak Ea and peak (maximal) mitral valve opening.
- 2.
Index of end-diastolic stiffness: E/Ea can be used to estimate left atrial pressure 8 and LVEDD can be used to estimate left ventricular end-diastolic volume. The ratio (E/Ea)/LVEDD is an estimate of end-diastolic stiffness.
Statistical methods
Results are presented as mean±standard deviations (SD) for continuous variables, and medians with interquartile ranges (IQR) for ratios and for the timing difference. For comparisons between all groups, one-way analysis of variance or non-parametric Kruskal–Wallis test was used where appropriate. Pairwise comparisons between athletes and controls, and athletes and HCMs were made using Tukey–Kramer HSD test for multiple comparisons or non-parametric Wilcoxon rank sum test where appropriate. Inter-observer variability was examined for Ea and time difference using the method of Bland and Altman. 10 All analyses were performed using the JMP statistical analysis package (SAS Inst. Inc). A P value <0.05 was considered statistically significant.
Results
There were no significant differences in group demographic details (shown in Table 1 ).
Study participant's demographic details
| HCM ( N =11) | Athlete ( N =17) | Control ( N =30) | P | |
|---|---|---|---|---|
| Age (years) a | 31 (13,40) | 28 (24,30.5) | 26 (24,28) | 0.20 |
| Men/women | 9/2 | 14/3 | 25/5 | 0.05 |
| Heart rate b (bpm) | 67.4±5.1 | 65±10.7 | 70.0±5.1 | <0.001 |
| Body surface area (m 2 ) a | 1.93 (1.91,2.0) | 2.0 (1.95,2.1) | 1.84 (1.6,1.9) | <0.001 |
HCM, athlete and control are hypertrophic cardiomyopathy, athlete, and normal control groups, respectively.
Median and IQR presented for non-normal data.
Mean±SD.
In athletes the peak Ea preceded peak mitral opening by: median (interquartile range) 20ms (10,20), control group 15ms (0,30), compared with HCM where Ea followed peak mitral opening by 10ms (0,20), P <0.0001 ( Fig. 2 ).
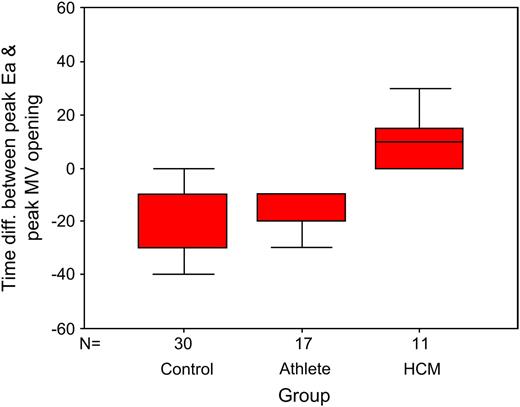
Box and whisker plot of the time difference between peak Ea and peak mitral valve opening (ms) for control, athlete and HCM groups (box represents IQR and solid line within the box the median, whiskers represent the range of values).
Echocardiography data for the three groups are shown in Table 2 . Athletes had significantly higher values than in controls for left atrial dimension, septal and posterior wall thicknesses, LVEDD and LVESD, LV mass index, and Ea. The HCM group had higher values than athletes for deceleration time, E/Ea, and the index of myocardial stiffness. The HCM group had significantly lower values than athletes for LVEDD, LVESD, E/A ratio, Ea, and DTI systolic velocity. The index of myocardial stiffness is shown for all groups in Fig. 3 .
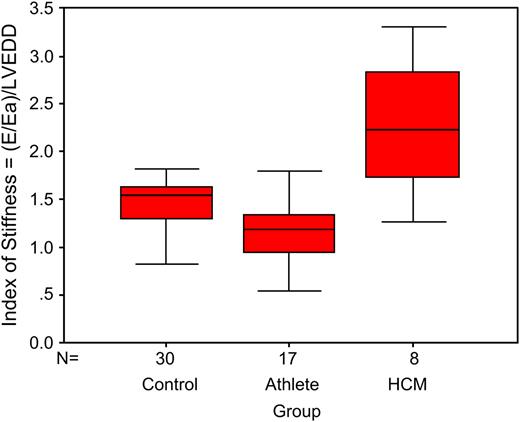
Box and whisker plot of the index of myocardial stiffness (E/Ea)/LVEDD is shown for control, athlete and HCM groups (box represents IQR and solid line within the box the median, whiskers represent the range of values).
Echocardiography data of study participants
| HCM | Athlete | Control | P | |
|---|---|---|---|---|
| Left atrial diameter (mm) a | 4.0±0.4 | 3.8±0.4 c | 3.5±0.4 | 0.002 |
| Septal wall thickness (mm) b | 1.4±0.1 | 1.3±0.1 c | 0.89±0.2 | <0.001 |
| Posterior wall thickness b | 1.3±0.06 | 1.3±0.1 c | 1.0±0.2 | <0.001 |
| LVEDD (mm) b | 4.6±0.2 d | 5.6±0.1 c | 4.8±0.4 | <0.001 |
| LVESD (mm) b | 3.0±0.5 d | 3.6±0.6 c | 3.1±0.5 | 0.015 |
| Ejection fraction (%) b | 67±5 | 64±5 | 64±5 | 0.164 |
| Left ventricular mass index (g/m 2 ) b | 167.0±22.4 | 187.9±24.3 c | 101.96±27.0 | <0.001 |
| Mitral E wave (cm/s) a | 59.3 (45,72) | 65.5 (59.1,81.2) | 72.8 (62,86.3) | 0.034 |
| Mitral A wave (cm/s) a | 40.5 (21.75,70.3) | 36.5 (32.8,47.9) | 40 (34.5,48.7) | 0.940 |
| E/A ratio a | 1.2 (0.6,1.5) d | 1.7 (1.5,2.0) | 1.7 (1.5,2.0) | 0.001 |
| IVRT b | 92.7±15.6 | 82.0±11.6 | 75.3±9.8 | 0.014 |
| Mitral E deceleration time b | 223±69 d | 185±40 | 169±39 | 0.004 |
| Ea averaged 4 site velocity (cm/s) | 8.2±1.5 d | 19.2±2.2 c | 17.9±3.0 | <0.001 |
| E/Ea b | 9.8 (7.9,12.5) d | 6.6 (5.4,7.5) | 7.1 (6.5,7.7) | 0.002 |
| Systolic wave velocity (cm/s) b | 8.7±2.5 2 | 12.2±1.6 | 10.3±1.4 | <0.001 |
| New index of myocardial stiffness (E/Ea)/LVEDD a | 2.2 (1.9,2.3) d | 1.2 (0.9,1.4) c | 1.5 (1.3,1.6) | <0.001 |
Median and IQR presented for ratios and time differences, P =Kruskal–Wallis test between groups.
Mean±SD # adjusted for age and gender, or ANOVA between groups where appropriate.
Multiple comparison test, P <0.05 for comparison of athletes to controls.
Multiple comparison test, P <0.05 for comparison of athletes to HCM.
The percentage of study participants for each group who had peak Ea delayed after peak mitral opening by ≥0ms, and who had (E/Ea)/LVEDD value ≥1.7 is shown in Table 3 .
Percentage of participants with abnormal measurements
| HCM | Athletes | Control | |
|---|---|---|---|
| Peak Ea delayed after peak MV opening by ≥0ms | 100 | 0 | 23.3 |
| (E/Ea)/LVEDD ≥1.7 | 73 | 5.9 | 13.3 |
| HCM | Athletes | Control | |
|---|---|---|---|
| Peak Ea delayed after peak MV opening by ≥0ms | 100 | 0 | 23.3 |
| (E/Ea)/LVEDD ≥1.7 | 73 | 5.9 | 13.3 |
Using the method of Bland and Altman, 10 the correlation r =0.0097 ( p =0.622), for reproducibility for each four-site average, and r =0.061 ( p =0.758) for the time difference were found. The correlations are close to 0 and therefore this suggests that there is negligible inter-observer bias in the measurements.
Discussion
Our study shows that the key distinguishing feature of pathological versus physiological LVH is the presence of diastolic dysfunction. Measures of systolic function such as ejection fraction were not different between groups, 11 and although the systolic DTI wave was lower in HCM, it was within normal values. 12 The LVEDD in athletes was larger than that in other groups and is consistent with values at the upper limit of normal or mildly dilated, 13 but with preserved ejection fraction. Of the measurements of diastolic function, the mitral inflow Doppler and isovolumic relaxation times are within normal values, though deceleration time for HCM was at the upper limit of normality. 14–17 The American Heart Association recommends Ea as the best measure of diastolic function in clinical trials, 18 but fails to recommend normal values. Studies by Ho et al. 19 and Nagueh et al. 20 suggest that DTI can be used to identify a group of individuals with HCM with or without the presence of LVH. This is consistent with our findings that Ea was significantly lower in the HCM group, but the problem lies in the definition of threshold values for delineating diastolic dysfunction from normal. Garcia et al. 17 recommend threshold values of 10cm/s for young people and 8cm/s for normal adults. This places the values for our HCM group as normal or just subnormal depending on age. If the threshold was raised to 12.5cm/s as suggested by Dumesnil et al. 21 then Ea alone could identify pathological LVH.
We report two non-invasive measurements using Doppler tissue imaging and other echocardiography modalities which can help to differentiate pathological LVH from athletic physiological hypertrophy. Diastolic stiffness is assessed by the pressure/volume relationship (E/Ea)/LVEDD. In athletes, the LVEDD is larger than controls, but at normal E/Ea, indicating a compliant ventricle. Conversely, patients with HCM exhibit normal LVEDD, but with a higher E/Ea ratio indicating reduced compliance (increased stiffness).
Our second method is to compare the timing relationship between peak Ea and peak mitral valve opening, which seeks to identify whether the myocardium moves prior to opening of the mitral valve, or whether it follows it. When Ea precedes MV opening, it suggests continued expansion of the LV prior to MV opening, and that MV opening is initiated by LV “suction” (pulling the MV open) causing a lower intracavity pressure than left atrial pressure. Conversely, if the MV opens prior to Ea, then it suggests that the continued relaxation of the LV is delayed, and MV opening is initiated by the left atrial pressure exceeding intracavity pressure (pushing the MV open). In normal volunteers and athletes, the peak Ea preceded the peak MV opening, whereas in HCM, the peak MV opening preceded the peak Ea. Importantly, there was clear separation in results between athletes with LVH and patients with HCM. Although our data cannot identify the mechanism of continued LV relaxation, our findings are consistent with preserved elastic recoil in normal hearts, whereas the complex genetic mutations of HCM lead to a loss of elastic recoil and diastolic impairment.
We have previously demonstrated that mitral diastolic peak annular tissue velocity occurs earlier than the peak of the early mitral inflow velocity in normal human hearts versus patients with diastolic dysfunction. 22 Our findings of altered timing between peak tissue velocity (Ea) and peak mitral (E) valve opening on M-mode are similar to those reported by Rodriguez et al. 23 who investigated this relationship in patients with LVH. Patients with LVH showed a delay in peak early diastolic mitral annular velocity (21ms±5.5ms, P =0.002, after the E wave), whereas in patients without heart disease the onset of mitral flow and diastolic annular motion were simultaneous, but the peak annular velocity preceded the peak mitral M-mode E by an average of 20ms. In the study by Rodriguez et al., 23 M-mode and DTI measurements were measured on different heartbeats, with times of the peak velocities referred to the ECG R-wave. In our study M-mode and DTI measurements were taken simultaneously and time differences measured are actual time differences between events in a single heartbeat. The timing method is not clinically practical as it requires two echo machines, but future technological innovation to allow the simultaneous overlay of M-mode or conventional Doppler with DTI spectra using one ultrasound system will improve the ease and reliability of the timing technique, although it may be reasonable to use different heartbeats (one machine) timed to the R-wave to determine whether peak Ea precedes or follows peak MV opening.
There are several limitations to our study. The group sizes were relatively small due to the low prevalence of LVH in athletes. The number of patients with clinically proven mild HCM and LVH that is in the same range associated with physiological hypertrophy is also small. We also only included international level athletes and so we cannot directly attribute our findings to recreational athletes. Additionally, although we recruited “normal” controls, we did not have any guarantee that they did not have subtle underlying dysfunction. There was overlap in the timing difference and ventricular stiffness measurements between normals and HCM, which could indicate that some of the normal patients may have early diastolic dysfunction rather than an insensitivity of the measurements. There was a trend that HCM patients were older, though we excluded patients older than 55 years to reduce this effect. The technical limitations with regard to time resolution of the ultrasound systems did not allow us to measure time differences below 5ms. With further technical advances we would expect to see an improvement in this time resolution in ultrasound systems. Although we have demonstrated a difference in myocardial stiffness, we do have sufficient data to present “normal values” for wide range ages, or the effect if any of gender.
Conclusion
Pathological LVH can be differentiated from physiological LVH by the presence of increased LV stiffness, and by the reversal of the normal diastolic timing between peak Ea and peak MV opening.
Acknowledgements
I wish to thank the Trinity College and Irish rowing teams who supplied the majority of the athletes and all the staff of the hospital who were used as normal controls.
