


1 Introduction
The power and, hence, the focal intensity of petawatt and multipetawatt lasers are currently limited by the size and damage threshold of compressor diffraction gratings[ Reference Danson, Bromage, Butcher, Chanteloup, Chowdhury, Galvanauskas, Gizzi, Haefner, Hein, Hillier, Hopps, Kato, Khazanov, Kodama, Korn, Li, Li, Limpert, Ma, Nam, Neely, Papadopoulos, Penman, Qian, Rocca, Shaykin, Siders, Spindloe, Szatmári, Trines, Zhu, Zhu and Zuegel 1 ]. A multifold power enhancement can be achieved using mosaic gratings in the compressor or several parallel chirped pulse amplification (CPA) channels, each of which ends with a conventional compressor of its own. In these cases, the power of the pulse increases as a result of increasing energy, while its duration remains unchanged. This approach entails a multiple increase in complexity, size, and price. An alternative recently developing approach, within the framework of which power is enhanced due to reduced pulse duration after the compressor, rather than due to energy increase, is free from these drawbacks. This approach has different names/acronyms: thin film compression (TFC)[ Reference Mourou, Mironov, Khazanov and Sergeev 2 ], compression after compressor approach (CafCA)[ Reference Khazanov, Mironov and Mourou 3 ], or post-compression[ Reference Balla, Wahid, Sytcevich, Guo, Viotti, Silletti, Cartella, Alisauskas, Tavakol, Grosse-Wortmann, Schönberg, Seidel, Trabattoni, Manschwetus, Lang, Calegari, Couairon, L’Huillier, Arnold, Hartl and Heyl 4 ]. The corresponding technique is as follows: the pulse spectrum is broadened as a result of self-phase modulation (SPM) during propagation in a medium with Kerr nonlinearity and is then compressed due to reflection from chirped mirrors (CMs) with negative dispersion.
The idea to use cubic nonlinearity for SPM was proposed as early as in 1969[ Reference Fisher, Kelley and Gustajson 5 ]. The compression of a 20 ps pulse by several times was demonstrated in Ref. [Reference Laubereau6]. Later, nonlinear compression was obtained in the femtosecond range in a fiber[ Reference Shank, Fork, Yen, Stolen and Tomlinson 7 ], in hollow waveguides filled with gas[ Reference Nisoli, Silvestri and Svelto 8 ], and in bulk material bounded in the transverse direction[ Reference Rolland and Corkum 9 ]. Despite a huge number of works (see, for example, references in the review paper Ref. [Reference Khazanov, Mironov and Mourou3]), pulses were compressed only with millijoule energy, and the energy efficiency was less than 50%. In the recent years, quite a few experimental results were obtained[ Reference Chvykov, Radier, Cheriaux, Kalinchenko, Yanovsky and Mourou 10 – Reference Ginzburg, Yakovlev, Kochetkov, Kuzmin, Mironov, Shaikin, Shaykin and Khazanov 17 ], in which CafCA was successfully implemented for pulses with an energy of 1–18 J and energy efficiency close to 100%. An important impetus for these studies was the proposed and experimentally confirmed method of suppressing small-scale self-focusing[ Reference Mironov, Lozhkarev, Ginzburg, Yakovlev, Luchinin, Shaykin, Khazanov, Babin, Novikov, Fadeev, Sergeev and Mourou 18 , Reference Mironov, Lozhkarev, Luchinin, Shaykin and Khazanov 19 ], even at large values of the B-integral
 \begin{align}B=\left(2\pi /{\lambda}_0\right){Ln}_2{I}_{\mathrm{in}},\end{align}
where n 2 and L are, respectively, the nonlinear index of refraction and the thickness of the nonlinear medium, λ0=2πс/ω0 is the central wavelength in vacuum, and I in is the input peak intensity. In particular, in Ref. [Reference Ginzburg, Yakovlev, Kochetkov, Kuzmin, Mironov, Shaikin, Shaykin and Khazanov17] the experiments were performed for the B-integral values up to 19. Large values of B-integral enable a significant increase of the compression ratio. Also noteworthy are the demonstration of two-stage compression[ Reference Ginzburg, Yakovlev, Zuev, Korobeynikova, Kochetkov, Kuzmin, Mironov, Shaykin, Shaikin and Khazanov 20 , Reference Stanfield, Beier, Hakimi, Allison, Farinella, Hussein, Tajima and Dollar 21 ] and the theoretical works on detailed numerical modeling[ Reference Mourou, Mironov, Khazanov and Sergeev 2 , Reference Voronin, Zheltikov, Ditmire, Rus and Korn 22 , Reference Ginzburg, Kochetkov, Yakovlev, Mironov, Shaykin and Khazanov 23 ] and on expanding the capabilities of the technique aimed at simultaneous contrast enhancement[ Reference Li, Kato and Kawanaka 24 – Reference Buldt, Muller, Klas, Eidam, Limpert and Tunnermann 28 ].
In experiments, different materials were used as a nonlinear medium, e.g., glass[ Reference Chvykov, Radier, Cheriaux, Kalinchenko, Yanovsky and Mourou 10 ], polyethylene terephthalate[ Reference Mironov, Ginzburg, Yakovlev, Kochetkov, Shaykin, Khazanov and Mourou 11 ], but in the majority of works it was silica[ Reference Lee, Yoo, Kim, Bhushan, Kim, Yoon, Lee, Sung and Nam 12 – Reference Ginzburg, Yakovlev, Kochetkov, Kuzmin, Mironov, Shaikin, Shaykin and Khazanov 17 ]. As shown in Ref. [Reference Khazanov, Mironov and Mourou3], a compressed pulse will be shorter at a minimal ratio of the group velocity dispersion k 2 to the nonlinear index of refraction n 2. A decrease in k 2/n 2 is especially important for large B-integral values at which pulse spectrum is broadened markedly by SPM. Among the materials that can be used for SPM in high-power lasers, silica and BK7 glass have a small value of k 2/n 2: approximately 1 fs2 PW/mm3 at a wavelength of 910 nm. For many glasses, isotropic and anisotropic crystals, k 2/n 2 is in the 1.5–2.5 fs2·PW/mm3 range. An exception is a KDP crystal (ordinary wave), as its dispersion at a wavelength of 910 nm is only 11.3 fs2/mm, which is a factor of 2.5 less than that of silica while n 2, in contrast, is higher than in silica; for KDP k 2/n 2=0.25 fs2·PW/mm3.
In the presented work we experimentally studied the compression of an output pulse of the laser PEARL (PEtawatt pARametric Laser[ Reference Lozhkarev, Freidman, Ginzburg, Katin, Khazanov, Kirsanov, Luchinin, Mal'shakov, Martyanov, Palashov, Poteomkin, Sergeev, Shaykin and Yakovlev 29 ]) by SMP in a KDP crystal in a wide range of B-integral values from 5 to 19 and compared the obtained results with those using silica[ Reference Ginzburg, Yakovlev, Zuev, Korobeynikova, Kochetkov, Kuzmin, Mironov, Shaykin, Shaikin, Khazanov and Mourou 15 , Reference Ginzburg, Yakovlev, Kochetkov, Kuzmin, Mironov, Shaikin, Shaykin and Khazanov 17 , Reference Ginzburg, Yakovlev, Zuev, Korobeynikova, Kochetkov, Kuzmin, Mironov, Shaykin, Shaikin and Khazanov 20 ].
2 Features of nonlinear compression with the use of KDP
All the aspects of nonlinear compression (spectrum broadening, pulse shortening, and peak intensity increase) were considered in detail in Ref. [Reference Khazanov, Mironov and Mourou3] as a function of two key parameters: the В-integral (Equation (1)) and the dimensionless parameter of nonlinear medium dispersion
 \begin{align}D=L\frac{k_2}{T_{\mathrm{F}}^2},\end{align}
where T F is the full width at half maximum (FWHM) duration of the input Fourier-transform-limited (FTL) Gaussian pulse. The parameters B and D characterize nonlinearity and dispersion and have a simple physical meaning: B is the ratio of the medium length L to the nonlinear length (the length at which a nonlinear phase equal to 1 is accumulated) and D is the ratio of L to the dispersion length L d = T F 2/k 2. The KDP crystal at the wavelength λ = 910 nm has a very small value of k 2 = 11.3 fs2/mm. Hereinafter, we use the Sellmeier equation from Ref. [Reference Zernike30]. Moreover, k 2 reduces with growing λ and at λ = 985 nm changes its sign. Consequently, not only group velocity dispersion k 2 but also the next, third-order dispersion (TOD) should be taken into account. For silica, the value of k 2 is much higher (28 fs2/mm). However, as we show in the following, at large B values the effect of TOD is even more significant.
With allowance for TOD, the laser pulse propagation in a medium with Kerr nonlinearity is described by the equation
 \begin{align}\frac{\partial a}{\partial \xi }\,{-}\,\frac{i\cdot D}{2}\frac{\partial^2a}{\partial {\eta}^2}\,{+}\,\frac{T}{6}\frac{\partial^3a}{\partial {\eta}^3}\,{=}-iB\left({\left|a\right|}^2\cdot a\,{-}\,\frac{2\cdot i}{\unicode{x3c0} \cdot N}\,\frac{\partial}{\partial \eta}\left({\left|a\right|}^2\cdot a\right)\right)\!,\end{align}
where ξ=z/L, z is the longitudinal coordinate, L is the thickness of the plate, η=(t-z/u)/T
F,
 $\frac{1}{u}={\left.\frac{\partial k\left(\omega \right)}{\partial \omega}\right|}_{\omega ={\omega}_0}$
, a=A/A
10 is the complex amplitude of the field normalized to the value at the input boundary (A
10), T=Lk
3/T
F
3 is the dimensionless parameter TOD,
$\frac{1}{u}={\left.\frac{\partial k\left(\omega \right)}{\partial \omega}\right|}_{\omega ={\omega}_0}$
, a=A/A
10 is the complex amplitude of the field normalized to the value at the input boundary (A
10), T=Lk
3/T
F
3 is the dimensionless parameter TOD,
 ${k}_3={\left.\frac{1}{2{k}_0}\frac{\partial^3k{\left(\omega \right)}^2}{\partial {\omega}^3}\right|}_{\omega ={\omega}_0}$
, k(ω)=n(ω)ω/с is the wave vector, k
0
=k(ω0), N=T
F/τ, and τ =2π/ω0 is the period of the optical field. At the input of the nonlinear medium, let there be a Gaussian FTL pulse
${k}_3={\left.\frac{1}{2{k}_0}\frac{\partial^3k{\left(\omega \right)}^2}{\partial {\omega}^3}\right|}_{\omega ={\omega}_0}$
, k(ω)=n(ω)ω/с is the wave vector, k
0
=k(ω0), N=T
F/τ, and τ =2π/ω0 is the period of the optical field. At the input of the nonlinear medium, let there be a Gaussian FTL pulse
 \begin{align}a\left(t,z=0\right)={e}^{-2\cdot \ln (2)\cdot \frac{t^2}{T_{\mathrm{F}}^2}}.\end{align}
CMs introduce a quadratic spectral phase; thereby the field amplitude of the output (compressed) pulse a out is defined by
 \begin{align}{a}_{\mathrm{out}}(t)={F}^{-1}\left({e}^{-\frac{i\alpha \cdot {\Omega}^2}{2}}\cdot F\left(a\left(t,z=L\right)\right)\right).\end{align}
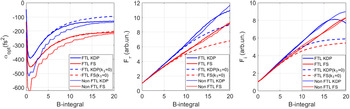
where Ω = ω – ω0, α is the parameter of CM dispersion, and F and F –1 are the direct and inverse Fourier transforms. The quantity αopt designates the value of α at which the compressed pulse intensity I out is maximal, and hence, the intensity increase factor F i = I out/I in is also maximal. The numerical modeling (Equations (3)–(5)) was performed for KDP and silica with the parameters given in Table 1. Values of B were varied from 0 to 20 by changing the input pulse intensity I in. Here B = 10 corresponds to an intensity of 0.79 TW/cm2 for KDP and 1.18 TW/cm2 for silica. Curves for αopt(B) are plotted in Figure 1(a). The dashed curves for k 3 = 0 are given for comparison. Analogous curves for F τ = τin/τo and F i at α = αopt are plotted in Figures 1(b) and 1(c).
Table 1 The parameters of numerical modeling.

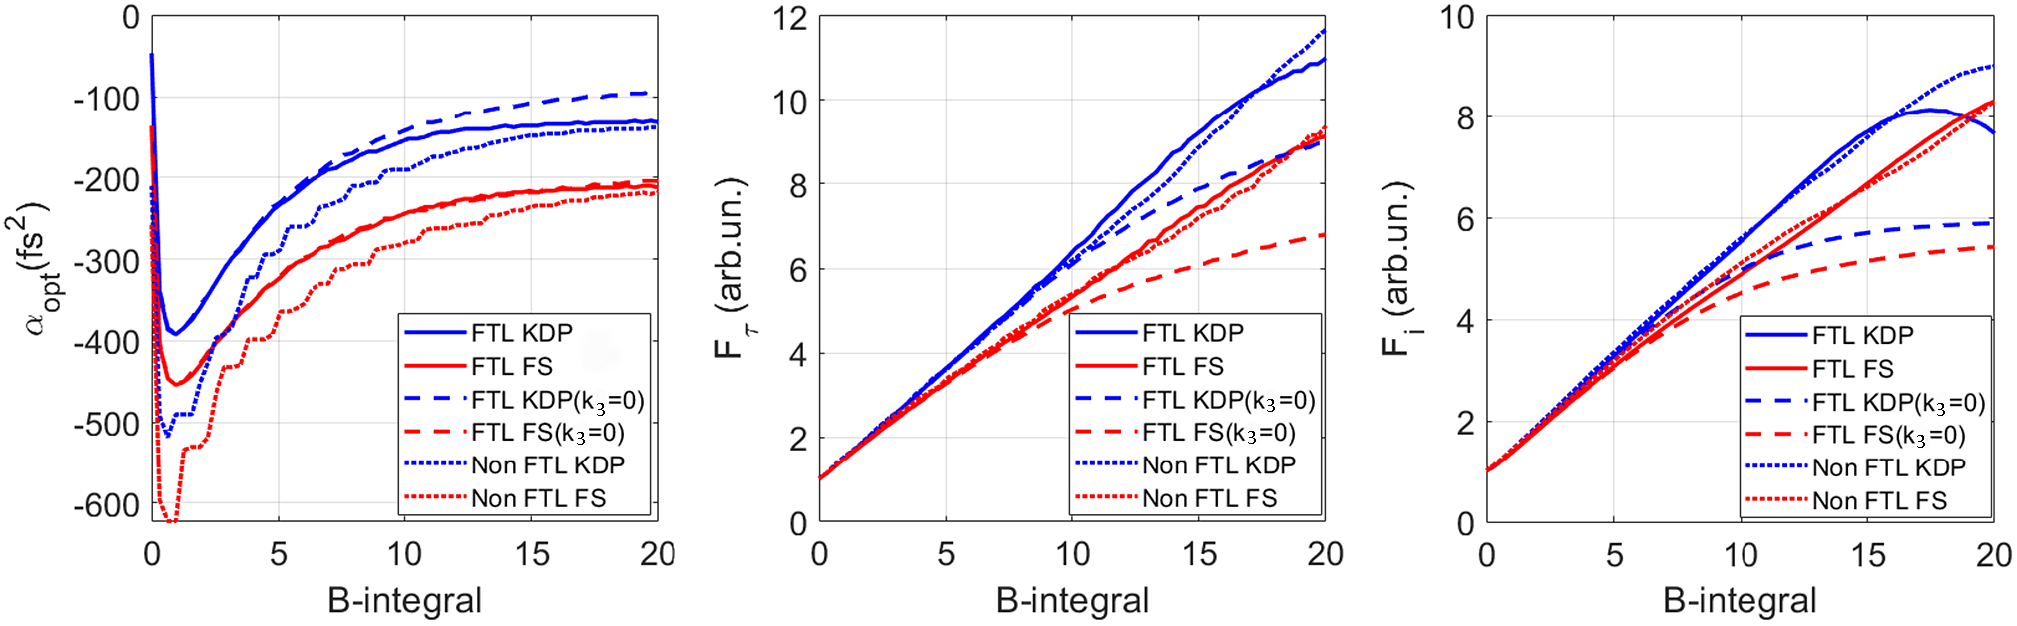
Figure 1 Curves for (a) αopt(B), (b) F τ(B), and (c) F i(B) for α = αopt for KDP (blue) and silica (red): FTL pulse at k 3 ≠ 0 (solid curves) and k 3 = 0 (dashed curves); non-Gaussian FTL pulse, the spectrum and autocorrelation function of which are presented in Figure 3(a) (dotted curves). FTL, Fourier-transform-limited.
It is clear from Figure 1(a) that at large B the allowance for TOD in KDP (in contrast to silica) results in an increase in the absolute value of αopt, which should be taken into consideration when planning experiments. In addition, with TOD taken into account, both F τ and F i become much larger for both KDP and silica. This is quite unexpected. Physically this is explained by the fact that at SPM the pulse acquires not only a positive quadratic spectral phase that is compensated by the negative quadratic dispersion of CMs, but also a negative cubic spectral phase that is partially compensated for by the positive cubic dispersion of the medium. As the values of T are identical for KDP and silica (see Table 1), the effect of TOD on these media is approximately the same (see Figures 1(a)–1(c)).
3 Experimental results
The schematic diagram of the experiment is shown in Figure 2. After reflection from the last diffraction grating of the compressor, the PEARL laser beam (central wavelength of about 910 nm) with a pulse energy of up to 18 J, a duration of 55–67 fs, and a diameter of 18 cm propagated 2.5 m in free space for self-filtering[ Reference Mironov, Lozhkarev, Ginzburg, Yakovlev, Luchinin, Shaykin, Khazanov, Babin, Novikov, Fadeev, Sergeev and Mourou 18 ]. After that, the beam was propagated in a 4-mm-thick homemade KDP crystal with angles of optical axes θ = φ = 0. The output surface had an anti-reflecting coating. We used the reflection from the input uncoated surface to measure the spectrum and the autocorrelation function (ACF) of the input pulse. The measurements were made for a small part of the beam with a diameter of 1 cm. After free propagation over a distance of 6 m, the beam was reflected from CMs with a diameter of 20 cm manufactured by UltraFast Innovations GmbH (reflection coefficient >99%, bandwidth >200 nm). We used mirrors with sum dispersion α = −100 fs2, −200 fs2, and −250 fs2. In addition, in the experiments with α = −200 fs2 and −250 fs2 we placed a 1-mm-thick silica plate before the autocorrelator to introduce additional dispersion α = +28 fs2, which is equivalent to the sum CMs dispersion α = −172 fs2 and −222 fs2, respectively.
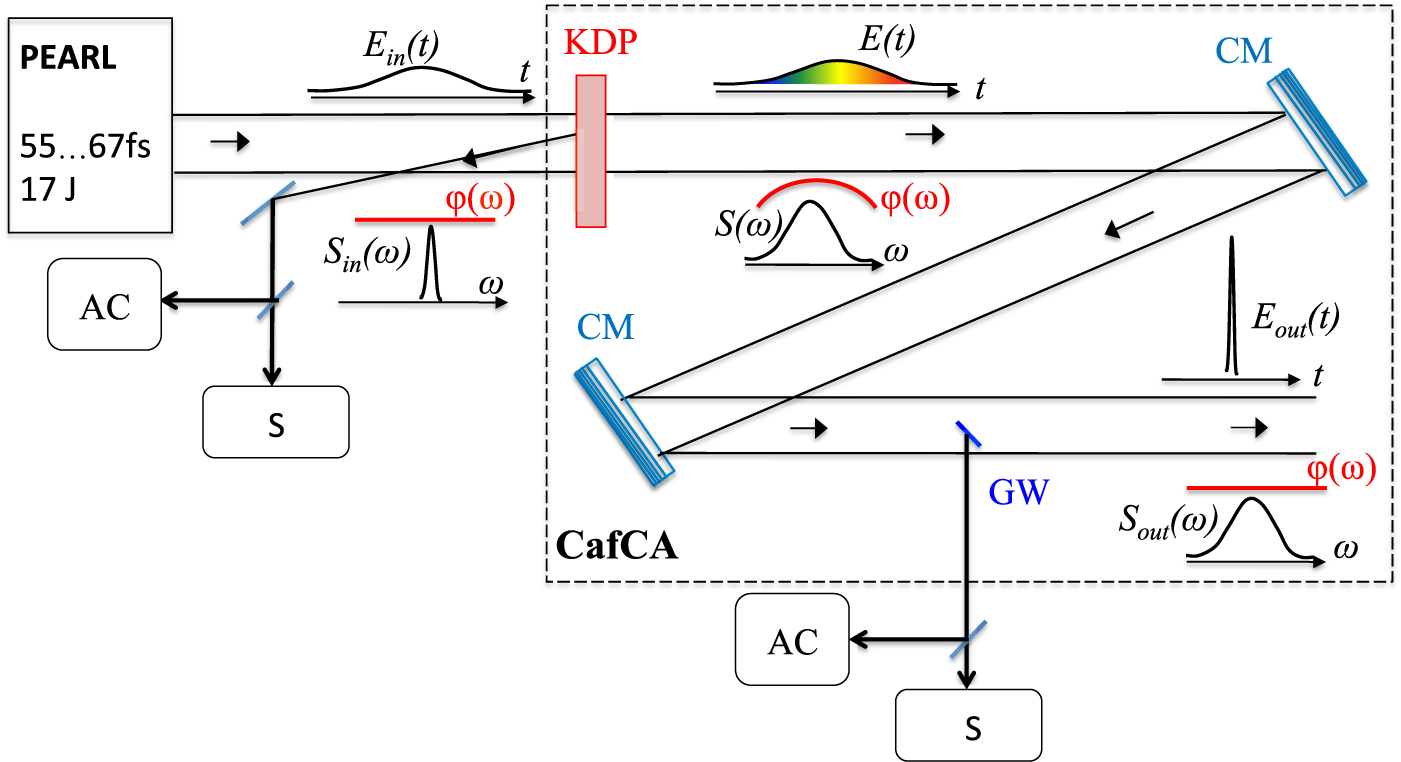
Figure 2 Schematic of the experiment. CM, chirped mirror; GW, small-aperture glass wedge; AC, autocorrelator; S, spectrometer.
To measure the parameters of the output (compressed) pulse, a glass wedge (GW) with an aperture of 1 cm × 2 cm and a matt back surface was placed in the beam path. The beam reflected from the first surface of the wedge was directed to the spectrometer and the autocorrelator. The position of the wedge within the beam aperture corresponded to the place where the ACF and the spectrum of the input beam were measured, which made it possible to measure the characteristics of the input and output pulses in a single shot. We used 1.42 as a decorrelation factor to calculate the pulse duration from the autocorrelation function.
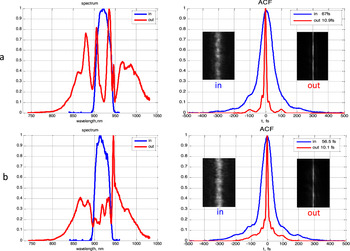
Typical measurement results are presented in Figure 3 for two shots at α = −200 fs2. The output pulse spectra have characteristic narrow peaks arising because the input pulses are not FTL (see Ref. [Reference Ginzburg, Kochetkov, Yakovlev, Mironov, Shaykin and Khazanov23] for details). Note that the measured output pulse spectrum is bounded at the longwave side by the spectrometer bandwidth (1030 nm).

Figure 3 Measured input (blue) and output (red) spectra and ACF for two typical shots: (a) B = 13, τin = 67 fs, τout = 10.9 fs and (b) B = 14, τin = 57 fs, τout = 10.1 fs.
An yoptimal value of CMs dispersion αopt depends on B (see Figure 1(a)). The curves for the minimal duration of a compressed pulse τout as a function of α for two ranges B = 5, …, 9 and B = 11, …, 19 are plotted in Figure 4. Analogous curves for 5-mm-thick and 3-mm-thick silica[ Reference Ginzburg, Yakovlev, Zuev, Korobeynikova, Kochetkov, Kuzmin, Mironov, Shaykin, Shaikin, Khazanov and Mourou 15 , Reference Ginzburg, Yakovlev, Zuev, Korobeynikova, Kochetkov, Kuzmin, Mironov, Shaykin, Shaikin and Khazanov 20 ] are also presented in this figure. Note that these are qualitative data, as a different number of shots were made for different values of α. Nevertheless, some conclusions follow from Figure 4. First, the value of αopt decreases with a decrease in the parameter D: αopt is maximal for 5-mm-thick silica (D = 0.037 at τin = 61 fs) and minimal for KDP (D = 0.01 at τin = 61 fs). The difference is not very large for large values of B, but is significant for small B. This fully agrees with Figure 1(a). Second, the absolute values of αopt obtained experimentally are larger than those predicted theoretically (see Figure 1(a)). The reason is that the pulse used in experiments was not an FTL pulse. The absolute value of αopt for such pulses is much larger than for FTL pulses, which was first noted in Ref. [Reference Mironov, Ginzburg, Yakovlev, Kochetkov, Shaykin, Khazanov and Mourou11]. To illustrate this fact, we presented in Figure 1(a) an αopt(B) curve for a KDP crystal for the case when the input pulse has the spectrum and ACF shown in Figure 3(a): the dotted blue curve is lower than the solid curve. Third, from the viewpoint of minimal pulse duration, KDP, although slightly, is preferable to silica: 10 versus 11 fs at large values of B and 13 versus 16 fs at small B. This also agrees with the results of numerical modeling (see Figure 1).

Figure 4 Experimental minimal compressed pulse duration τout for KDP (L = 4 mm), silica (L = 5 mm), and silica (L = 3 mm[ Reference Ginzburg, Yakovlev, Zuev, Korobeynikova, Kochetkov, Kuzmin, Mironov, Shaykin, Shaikin, Khazanov and Mourou 15 , Reference Ginzburg, Yakovlev, Zuev, Korobeynikova, Kochetkov, Kuzmin, Mironov, Shaykin, Shaikin and Khazanov 20 ]) for two ranges of B values. The curves are plotted to make the figure more illustrative.
The experimental data for τin=55, …, 67 fs obtained at α = −200 fs2 are presented in Figure 5. The peak power P out for a compressed pulse with τout = 10 fs was 1.5 PW (we took into account the 20% losses associated with a lower intensity at the beam periphery and the respective larger τout). Despite the spread in the values in Figure 5, we can claim that at α = −200 fs2 there exists an optimal value of the B-integral (of the order of 15) at which τout is minimal and F τ is maximal. With a further increase in B, the input pulse spectrum is broadened but, despite this fact, τout increases as |αopt| is already less than 200 fs2, that is, CMs have redundant dispersion, as a result of which the output pulse is negatively chirped. At the same time, Figure 5 demonstrates that in a wide range of B-integral values from 11 to 19, for the same CMs set (α = −200 fs2), all the shots are within the interval of τout from 9.3 to 13.6 fs and F τ from 4.6 to 7. From the practical point of view, this spread is not very large and can be made even less if the input pulse has more stable duration and spectral phase.
Despite the huge values of the B-integral, no damage was observed either in KDP or in CMs, that is, small-scale self-focusing was not a significant issue. One of the reasons for this is a significant shift of the maximum of the increment of self-focusing instability to the region of high spatial frequencies, which results in a reduced noise power in the region of the maximal increment due to a decrease in the spectral density of the noise[ Reference Ginzburg, Kochetkov, Mironov, Potemkin, Silin and Khazanov 31 ] and beam self-filtering at free propagation[ Reference Mironov, Lozhkarev, Ginzburg, Yakovlev, Luchinin, Shaykin, Khazanov, Babin, Novikov, Fadeev, Sergeev and Mourou 18 , Reference Mironov, Lozhkarev, Luchinin, Shaykin and Khazanov 19 , Reference Ginzburg, Kochetkov, Mironov, Potemkin, Silin and Khazanov 31 , Reference Ginzburg, Kochetkov, Potemkin and Khazanov 32 ]. Another possible reason is the convective nature of the self-focusing instability at pulse duration commensurate with 10 field periods[ Reference Balakin, Litvak, Mironov and Skobelev 33 , Reference Balakin, Kim, Litvak, Mironov and Skobelev 34 ]. The suppression of small-scale self-focusing is discussed in more detail in Ref. [Reference Khazanov, Mironov and Mourou3].
Note that further power scaling may be limited by damage threshold which strongly depends on the polishing and coating quality. Being a water-soluble crystal, KDP requires more efforts for both polishing and coating compared with silica. In addition, there could be crystal degradation effects on a longer term. This could limit the use of KDP in high peak power femtosecond lasers with high repetition rate.

Figure 5 Output pulse duration τout (blue) and pulse compression factor F τ = τin/τout (red) at α = −200 fs2; τin = 55, …, 67 fs.
Thus, we have experimentally demonstrated that KDP can give results similar to (τin/τout > 6), and even a little better (τout = 10 fs) than those we have recently obtained with silica[
Reference Ginzburg, Yakovlev, Kochetkov, Kuzmin, Mironov, Shaikin, Shaykin and Khazanov
17
], with the superiority of KDP being still more pronounced for small B-integrals (B = 5, …, 9) (see Figure 4). In addition, KDP has a number of other advantages. First, for KDP the αopt values are smaller (Figures 1(a) and 4). This allows a smaller number of mirrors to be used or the same number of mirrors but with lower dispersion, which are easier to produce. Second, for KDP the value of αopt changes less with the variation of the B-integral (Figure 4). This makes it possible to use one set of CMs for a wide range of intensities, as demonstrated in Figure 5. Third, KDP anisotropy enables controlling linear and nonlinear properties of the material by choosing crystal orientation that is determined by the angles θ and φ. Like in any uniaxial crystal, the linear refractive index (and, hence, k
2 and k
3) of an ordinary wave depends neither on θ nor on φ. However, similarly to any tetragonal crystal of
 $\overline{4}22$
symmetry, n
2 does not depend on θ, but is dependent on φ[
Reference Banks, Feit and Perry
35
], and n
2 maxima and minima are, respectively, at φ = 0+πm/2 and φ = π/4+πm/2 (m is an integer). Thus, for example, by rotating a z-cut crystal (θ = 0) around the z-axis it is possible to continuously change the В-integral by about a factor of 1.5: n
2(θ = 0, φ = 0) = 4.6 × 10⁻¹⁶ cm2/W, and n
2(θ = 0, φ = π/4) = 3.3 × 10⁻¹⁶ cm2/W[
Reference Kulagin, Ganeev, Tugushev, Ryasnyansky and Usmanov
36
]. Still more opportunities are provided by an extraordinary wave for which k
2 and k
3 depend on θ, and n
2 depends on both θ and φ. The n
2(θ, φ) function can be found in Ref. [Reference Kulagin, Ganeev, Tugushev, Ryasnyansky and Usmanov35]. The functions k
2(θ) and k
3(θ) can be readily obtained from the known expression for n
e(θ) and from the Sellmeier equations[
Reference Zernike
30
]. Thus, for an extraordinary wave, dispersion and nonlinearity can be controlled independently by varying θ and φ, respectively. Note that it is also possible to use a KDP crystal isomorph: a DKDP crystal whose dispersion strongly differs from KDP dispersion[
Reference Lozhkarev, Freidman, Ginzburg, Khazanov, Palashov, Sergeev and Yakovlev
37
]. The optimization of the parameters k
2, k
3, and n
2 will be considered in a separate paper.
$\overline{4}22$
symmetry, n
2 does not depend on θ, but is dependent on φ[
Reference Banks, Feit and Perry
35
], and n
2 maxima and minima are, respectively, at φ = 0+πm/2 and φ = π/4+πm/2 (m is an integer). Thus, for example, by rotating a z-cut crystal (θ = 0) around the z-axis it is possible to continuously change the В-integral by about a factor of 1.5: n
2(θ = 0, φ = 0) = 4.6 × 10⁻¹⁶ cm2/W, and n
2(θ = 0, φ = π/4) = 3.3 × 10⁻¹⁶ cm2/W[
Reference Kulagin, Ganeev, Tugushev, Ryasnyansky and Usmanov
36
]. Still more opportunities are provided by an extraordinary wave for which k
2 and k
3 depend on θ, and n
2 depends on both θ and φ. The n
2(θ, φ) function can be found in Ref. [Reference Kulagin, Ganeev, Tugushev, Ryasnyansky and Usmanov35]. The functions k
2(θ) and k
3(θ) can be readily obtained from the known expression for n
e(θ) and from the Sellmeier equations[
Reference Zernike
30
]. Thus, for an extraordinary wave, dispersion and nonlinearity can be controlled independently by varying θ and φ, respectively. Note that it is also possible to use a KDP crystal isomorph: a DKDP crystal whose dispersion strongly differs from KDP dispersion[
Reference Lozhkarev, Freidman, Ginzburg, Khazanov, Palashov, Sergeev and Yakovlev
37
]. The optimization of the parameters k
2, k
3, and n
2 will be considered in a separate paper.
4 Conclusion
In our studies of the nonlinear compression of high-power laser pulses (TFC, CafCA, post-compression) after SPM in a KDP crystal we have obtained the pulse compression factor τin/τout > 6 with the compressed pulse duration τout = 10 fs, which corresponds to a peak power of 1.5 PW. To the best of the authors’ knowledge, 10 fs is the shortest duration of all present-day petawatt lasers worldwide. It is important to note that the experiments were carried out for the B-integral values from 5 to 19, with no damage to the optical elements, which indicates that small-scale self-focusing is insignificant. Analogous results were recently obtained by our team using silica[ Reference Ginzburg, Yakovlev, Kochetkov, Kuzmin, Mironov, Shaikin, Shaykin and Khazanov 17 ]. However, as compared with silica, KDP has several advantages: (i) a larger pulse compression factor τin/τout, especially for B = 5, …, 9; (ii) smaller absolute values of CMs dispersion αopt; (iii) smaller changes in αopt with the variation of the B-integral; and (iv) a possibility to control both linear and nonlinear properties of the medium by choosing the orientation of the crystal’s optical axis and the radiation polarization.
Taking into account the obtained results and the undoubted merits of nonlinear compression (simplicity, low cost, negligible pulse energy losses, and applicability to any high-power laser), we predict further development of this approach toward multipetawatt power and single-cycle pulse duration simultaneously.
Acknowledgment
The work was supported by the Center of Excellence “Center of Photonics” funded by the Ministry of Science and Higher Education of the Russian Federation, agreement No. 075-15-2020-906 and by the European Commission, grant agreement #871072-CREMLINplus.


 Open access