


Preface
The following set of papers describe in detail the science goals of the future Space Infrared telescope for Cosmology and Astrophysics (SPICA). The SPICA satellite will employ a 2.5-m telescope, actively cooled to around 6 K, and a suite of mid- to far-IR spectrometers and photometric cameras, equipped with state of the art detectors. In particular, the SPICA Far Infrared Instrument (SAFARI) will be a grating spectrograph with low (R = 300) and medium (R ≃ 3000–11000) resolution observing modes instantaneously covering the 35–230 μm wavelength range. The SPICA Mid-Infrared Instrument (SMI) will have three operating modes: a large field of view (12×10) low-resolution 17–36 μm spectroscopic (R ~ 50–120) and photometric camera at 34 μm, a medium resolution (R ≃ 2000) grating spectrometer covering wavelengths of 18–36 μm and a high-resolution echelle module (R ≃ 28000) for the 12–18 μm domain. A large field of view (80×80), three channel (110μm, 220μm and 350μm) polarimetric camera will also be part of the instrument complement. These articles will focus on some of the major scientific questions the SPICA mission aims to address, more details about the mission and instruments can be found in Roelfsema et al. (in preparation).
1 INTRODUCTION
The tight correlations found between the masses of supermassive black holes (SMBH) and the velocity dispersion, the stellar mass, and luminosity of the spheroidal components of their host galaxies (e.g., Magorrian et al. Reference Magorrian1998; Ferrarese & Merritt Reference Ferrarese and Merritt2000; Tremaine et al. Reference Tremaine2002) suggest a link between the growth of the BH and galaxy formation/evolution. In addition, the bimodality of the colour distribution of local galaxies (e.g., Strateva et al. Reference Strateva2001; Baldry et al. Reference Baldry, Glazebrook, Brinkmann, Ivezić, Lupton, Nichol and Szalay2004), with the blue galaxies actively forming stars and red-and-dead galaxies evolving passively from the earlier epochs of peak star formation (z ~ 2), strongly suggests that the colour must have evolved rapidly, with star formation terminated on short timescales (e.g., Hopkins et al. Reference Hopkins, Hernquist, Cox, Robertson and Springel2006a; Schawinski et al. Reference Schawinski2014). These observations are consistent with a self-regulated feedback model in which funnelling of large amounts of gas into the nuclear regions of galaxies generate both a nuclear starburst (SB) and the growth of a SMBH. Once the SMBH reaches a threshold in mass/luminosity, the energy and momentum released by the accreting SMBH couples with the surrounding interstellar medium (ISM), limiting the accretion onto the SMBH and quenching the SBs via injection of turbulence or through a fast sweeping out of the ISM gas from which stars are formed (negative feedback), ultimately yielding the M BH–σ relationship (Silk & Rees Reference Silk and Rees1998; di Matteo, Springel, & Hernquist Reference di Matteo, Springel and Hernquist2005; Springel, Di Matteo, & Hernquist Reference Springel, Di Matteo and Hernquist2005; Murray, Quataert, & Thompson Reference Murray, Quataert and Thompson2005; Hopkins et al. Reference Hopkins, Hernquist, Cox, di Matteo, Robertson and Springel2006b).
In the local Universe, evidence for galaxy-scale feedback is observed in all phases of the ISM in luminous systems, and is now established as a key ingredient of galaxy evolution. The most extreme cases of feedback are observed in luminous and ultraluminous infrared galaxies ((U)LIRGs, with L IR > 1011 and >1012 L⊙, respectively) and SBs, where superwinds observed in lines of ions and neutral atoms are common (e.g., Heckman, Armus, & Miley Reference Heckman, Armus and Miley1990; Heckman et al. Reference Heckman, Alexandroff, Borthakur, Overzier and Leitherer2015; Lípari et al. Reference Lípari, Terlevich, Zheng, García-Lorenzo, Sánchez and Bergmann2005; Veilleux, Cecil, & Bland-Hawthorn Reference Veilleux, Cecil and Bland-Hawthorn2005; Rupke, Veilleux, & Sanders Reference Rupke, Veilleux and Sanders2005; Martin Reference Martin2006; Spoon & Holt Reference Spoon and Holt2009; Rodríguez-Zaurín et al. Reference Rodríguez-Zaurín, Tadhunter, Rose and Holt2013; Janssen et al. Reference Janssen2016). The molecular phase is also crucial to understand feedback, because stars are formed from molecular gas and indeed most gas mass in the central regions of gas rich/obscured galaxies is in molecular form and the column densities associated with the molecular gas are the highest. Far-infrared (far-IR) spectroscopic observations by Herschel/PACSFootnote 1 have revealed powerful molecular outflows in ULIRGs, traced by hydroxyl (OH), with velocities exceeding 1 000 km s−1 in some sources and mass outflow rates of at least several hundreds M⊙ yr−1 (Fischer et al. Reference Fischer2010; Sturm et al. Reference Sturm2011; González-Alfonso et al. Reference González-Alfonso2014, Reference González-Alfonso2017, hereafter GA14 and GA17). The outflows seen in low excitation lines of OH were found to be ubiquitous in local ULIRGs (Figure 1, Spoon et al. Reference Spoon2013; Veilleux et al. Reference Veilleux2013; Stone et al. Reference Stone, Veilleux, Meléndez, Sturm, Graciá-Carpio and González-Alfonso2016). These investigations also revealed a correlation between the terminal outflow velocity and the active galactic nucleus (AGN) luminosity. The molecular outflows are also widely observed at (sub)millimetre wavelengths in lines of CO, HCN, HCO+, and CS (Sakamoto et al. Reference Sakamoto2009; Feruglio et al. Reference Feruglio, Maiolino, Piconcelli, Menci, Aussel, Lamastra and Fiore2010, Reference Feruglio2015; Alatalo et al. Reference Alatalo2011, Reference Alatalo2015; Cicone et al. Reference Cicone2012, Reference Cicone2014; Dasyra & Combes Reference Dasyra and Combes2012; Aalto et al. Reference Aalto, García-Burillo, Muller, Winters, van der Werf, Henkel, Costagliola and Neri2012, Reference Aalto2015; Combes et al. Reference Combes2013; Lindberg et al. Reference Lindberg2016; García-Burillo et al. Reference García-Burillo2015; Pereira-Santaella et al. Reference Pereira-Santaella2016; Imanishi, Nakanishi, & Izumi Reference Imanishi, Nakanishi and Izumi2016; Privon et al. Reference Privon2017; Veilleux et al. Reference Veilleux, Bolatto, Tombesi, Meléndez, Sturm, González-Alfonso, Fischer and Rupke2017) and in ro-vibrational H2 lines at near-IR wavelengths (Rupke & Veilleux Reference Rupke and Veilleux2013a), providing evidence for molecular feedback in both AGN and SB sources up to scales of ≳ 1 kpc. Recently, modelling of outflows observed in OH in local ULIRGs has shown that their mechanical power and momentum fluxes are in most sources (0.1–0.3)% of L IR and (2–5) × L IR/c, respectively, although some sources with AGN luminosities at or above the quasar level significantly exceed these values (GA17). Depletion timescales are estimated to be <108 yr and, notably, shorter than the consumption timescales. Comparison with CO indicates that the OH observations are reliably calibrated with an overall abundance [OH]/[H] = 2.5 × 10⁻⁶ Footnote 2 .
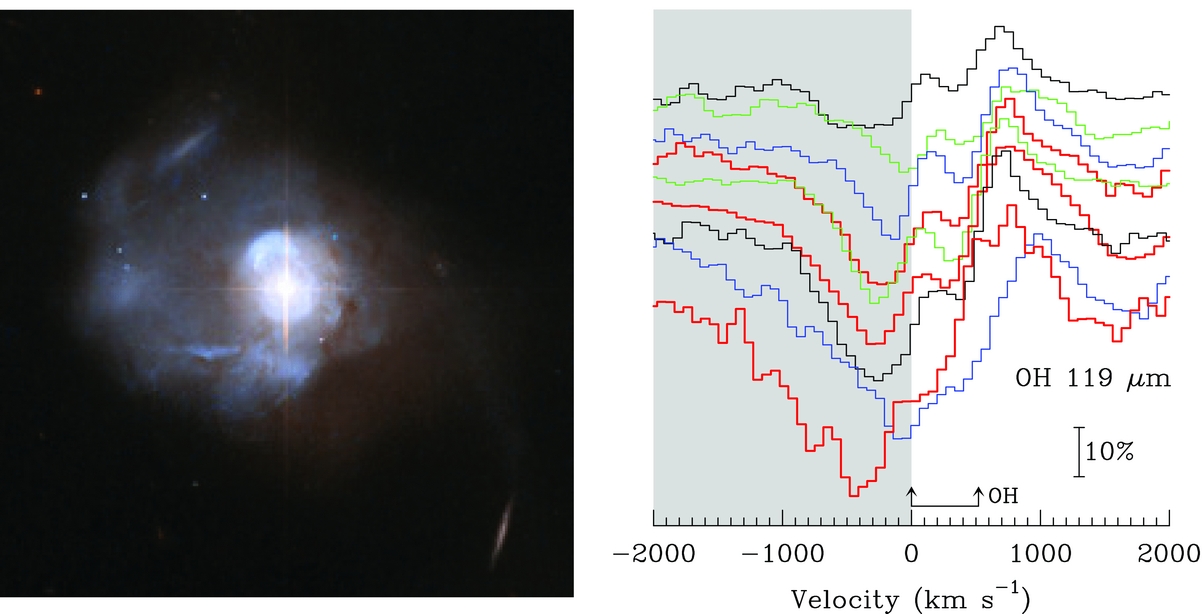
Figure 1. Left: Image of the nearest QSO Mrk 231 taken by the Hubble Space Telescope [Credit: NASA, ESA, the Hubble Heritage Team (STScI/AURA)- ESA/Hubble Collaboration, and A. Evans (University of Virginia, Charlottesville/NRAO/Stony Brook University)]. Mrk 231 shows evidence for powerful outflows at basically all wavelengths and ISM phases, with the molecular phase dominating the energetics (mass, momentum, and energy rates). Right: the OH doublet at 119 μm in nine local ULIRGs observed with Herschel/PACS, selected as examples of ULIRGs with P-Cygni profiles to illustrate that the molecular gas is outflowing at high velocities (800–1500 km s−1) in many such local gas-rich mergers. The three thick profiles in red correspond to the three local templates we use in this paper: IRAS 23365+3604, Mrk 231, and IRAS 03158+4227 (from top to bottom). While the spectral resolution of Herschel/PACS at 119 μm is R ≈ 1000, SPICA/SAFARI will attain an even better resolution in its high resolution mode.
At high redshifts, however, direct evidence for outflows and the impact of feedback, particularly on the dense ISM, is much less constrained. Observations of outflows in high-z sources have been widely reported in lines of ions (e.g., Villar-Martín et al. Reference Villar-Martín, Humphrey, Delgado, Colina and Arribas2011; Farrah et al. Reference Farrah2012; Cano-Díaz et al. Reference Cano-Díaz, Maiolino, Marconi, Netzer, Shemmer and Cresci2012; Harrison et al. Reference Harrison2012; Barrows et al. Reference Barrows, Sandberg Lacy, Kennefick, Comerford, Kennefick and Berrier2013; Genzel et al. Reference Genzel2014; Carniani et al. Reference Carniani2015; Zakamska et al. Reference Zakamska2016; Nesvadba et al. Reference Nesvadba, De Breuck, Lehnert, Best and Collet2016), indicating that AGN feedback in the warm ionised phase is common at high z. However, the outflowing molecular phase is basically unknown with only a few (possible) detections reported so far (Polletta et al. Reference Polletta, Nesvadba, Neri, Omont, Berta and Bergeron2011; Nesvadba et al. Reference Nesvadba, Polletta, Lehnert, Bergeron, De Breuck, Lagache and Omont2011; Geach et al. Reference Geach2014; Falgarone et al. Reference Falgarone2015; Feruglio et al. Reference Feruglio2017), which limits our knowledge of a key physical process that may strongly impact galaxy evolution on cosmic timescales—at least of luminous systems. While in the local Universe, the most powerful molecular outflows are observed in AGN-dominated merger ULIRGs, analysis of deep Hubble fields based on structural parameters indicate a merger fraction of massive (>1010 M⊙) galaxies increasing with redshift up to ≳ 10% at z = 1.2, implying that a typical present-day massive galaxy has undergone ~1 major merger during the last ~9 Gyr (Conselice, Yang, & Bluck Reference Conselice, Yang and Bluck2009; Robaina et al. Reference Robaina2010; Xu et al. Reference Xu, Zhao, Scoville, Capak, Drory and Gao2012). This merging rate is capable of explaining the build-up of the red sequence during the last ~8 Gyr (Eliche-Moral et al. Reference Eliche-Moral2010; Xu et al. Reference Xu, Zhao, Scoville, Capak, Drory and Gao2012; Prieto et al. Reference Prieto2013), and it is in general concordance with the ΛCDM galaxy mass assembly model (Conselice et al. Reference Conselice, Bluck, Mortlock, Palamara and Benson2014)Footnote 3 . Alternatively, smooth cold mode accretion of intergalactic gas, which is expected from simulations to be the main gas supply for star formation over cosmic times (e.g., Murali et al. Reference Murali, Katz, Hernquist, Weinberg and Davé2002; Kereŝ et al. Reference Kereš, Katz, Weinberg and Davé2005, Reference Kereš, Katz, Davé, Fardal and Weinberg2009), could conceivably present accretion ‘peaks’ at high redshifts generating bright nuclear SBs and AGN activity, and thus powerful feedback. In either case, the increasing importance of feedback processes at high redshifts is also expected from the sharp increase of the IR luminosity function as derived from the Spectral Energy Distribution (SED) analysis of Herschel/PACS selected galaxies (Gruppioni et al. Reference Gruppioni2013), as well as from the increase in AGN activity (Hopkins, Richards, & Hernquist Reference Hopkins, Richards and Hernquist2007; Merloni & Heinz Reference Merloni and Heinz2008; Delvecchio et al. Reference Delvecchio2014). SPICA would indeed measure with unprecedented accuracy and depth the cosmic evolution of AGN activity using both spectroscopic and photometric techniques (see the accompanying papers, Spinoglio et al. Reference Spinoglio2017; Gruppioni et al. Reference Gruppioni2017).
Our very limited knowledge of the role of feedback on galaxy evolution at high redshifts leaves crucial questions unanswered until observations of outflow characteristics as a function of redshift can be obtained:
-
(1) What is the incidence of molecular outflows during the last ~10 Gyr (up to z ~ 1.5) from the peak of star formation and SMBH accretion activity? How are these outflows related to the steep decline in star formation during this epoch? In the framework of the two-fold evolutionary dichotomy for IR galaxies proposed by Gruppioni et al. (Reference Gruppioni2013), with a strong SB-dominated phase accompanied by SMBH growth leading to ellipticals, and a more moderate mode of star formation that may generate the local spiral population, are feedback processes mainly responsible for the evolution along the SB–SMBH branch? An estimate of the outflow luminosity/momentum function is needed to answer this question.
-
(2) In the local Universe, massive molecular outflows in OH are observed in (U)LIRGs, which present specific star-formation rates (sSFR) well above main-sequence (MS) galaxies at z ⩽ 0.1 (e.g., Elbaz et al. Reference Elbaz2007); but what is the situation at z ~ 1–1.5? Are outflows found only in sources above the MS, or do they also take place in MS galaxies, i.e. in disk galaxies with normal rates of star formation per stellar mass? Genzel et al. (Reference Genzel2014) have found that 2/3 of the most massive galaxies (both MS and non-MS) at z = 1–3 (44 sources) display broad (~1000 km s−1) nuclear emission in Hα, [S ii], and [N ii] lines suggesting AGN feedback, but very little is known about the molecular component.
-
(3) What is the physical link between AGN feedback on small scales and the molecular outflows seen on large spatial scales (>100 pc)? Is there any correlation between the feedback and black hole accretion and SB activities, to be measured also in the far-IR (see Spinoglio et al. Reference Spinoglio2017; Gruppioni et al. Reference Gruppioni2017) as well as in X-Rays (Athena observatory in late 2020s, Nandra et al. Reference Nandra2013)? Is the coupling due to expanding bubbles driven by ultra-fast outflows (UFOs) that are generated in accretion disks around the SMBH, as observationally inferred in a few sources (Tombesi et al. Reference Tombesi, Meléndez, Veilleux, Reeves, González-Alfonso and Reynolds2015; Feruglio et al. Reference Feruglio2015; Veilleux et al. Reference Veilleux, Bolatto, Tombesi, Meléndez, Sturm, González-Alfonso, Fischer and Rupke2017) and theoretically well described (e.g., Faucher-Giguère & Quataert Reference Faucher-Giguère and Quataert2012; King & Pounds Reference King and Pounds2015; Richings & Faucher-Giguère Reference Richings and Faucher-Giguère2017), or due to radiation pressure on dust grains (Murray et al. Reference Murray, Quataert and Thompson2005; Roth et al. Reference Roth, Kasen, Hopkins and Quataert2012; Thompson et al. Reference Thompson, Fabian, Quataert and Murray2015; Ishibashi & Fabian Reference Ishibashi and Fabian2015)? What are the roles of nuclear SBs and of radio jets on molecular outflows?
-
(4) What is the physical environment [dust temperatures, continuum optical depths at IR wavelengths, radiation densities, enclosed gas masses, the gravitational potential well, isotopic enrichment and metallicities, star-formation rates (SFRs)] in the intermediate regions surrounding the SMBH (~100 pc)? Observations indicate that quenching of star formation proceeds inside-out (Tacchella et al. Reference Tacchella2015), so it is crucial to observationally trace all regions of the quenching activity. Far-IR spectroscopy of a small sample of local galaxies with Herschel/PACS have shown extremely high excitation of OH, H2O, and other molecular species in most ULIRGs and in some LIRGs, seen in high-lying absorption lines that are pumped through absorption of far-IR photons. Even though the regions probed by these lines are not resolved with far-IR facilities, absorption profiles in multiple high-excitation levels enable the estimation of the dust temperatures in these inner regions and provide direct proof that the circumnuclear environments in most local ULIRGs are warm and optically thick even at far-IR wavelengths (T dust > 60 K, GA14, González-Alfonso et al. Reference González-Alfonso2015, hereafter GA15). A source with R = 100–170 pc, T dust = 90–70 K, and τ(100μm) = 1 emits 1012 L⊙, constraining the spatial scales that are probed in ULIRGs with high-lying absorption lines in the far-IR. What are the properties of the circumnuclear regions, locally characterised by extremely high brightness and gas surface densities and representing the most buried stages of SB–AGN co-evolution, in high-z ULIRGs?
-
(5) How is the thermal energy and dynamical state of the molecular gas affected by the outflow? In particular, how is star formation in the molecular reservoir impacted by feedback from the AGN and SB? How is this molecular reservoir chemically affected when loaded by the outflow? Specifically, what is the ionisation rate of the molecular gas?
2 THE PROMISE OF SPICA
With its expected exceptional sensitivity and spectroscopic capabilities (Swinyard et al. Reference Swinyard2009; Nakagawa et al. Reference Nakagawa, Shibai, Onaka, Matsuhara, Kaneda, Kawakatsu, Roelfsema, So, Adachi and Kim2014; Sibthorpe et al. Reference Sibthorpe, Helmich, Roelfsema, Kaneda and Shibai2016; Roelfsema et al., in preparation; Spinoglio et al. Reference Spinoglio2017), the far-IR observatory SPICA would address these questions by spectroscopically observing galaxies from z = 0 to z ~ 1.5 in multiple molecular and atomic lines. The SAFARI (Swinyard et al. Reference Swinyard2009; Pastor et al. Reference Pastor and MacEwen2016; Spinoglio et al. Reference Spinoglio2017), covering the wavelength range 34–230μm, is designed to provide two spectroscopic observing modes, the low-resolution (LR) mode with nominal R nom = 300, and the high-resolution (HR) mode with R nom = 2 × 103 × (200μmλ). As shown below, a ULIRG with L IR ~ 3 × 10¹² L⊙ at z = 1.5 would only require ~2 h of observing time in the LR mode to obtain 1σ noise of ~1% the continuum level, enabling the detection of molecular outflows (as seen in the local Universe) including the simultaneous detection of lines of OH and H2O, and thus enabling the exploration of multiple transitions of several species in significant samples of galaxies. From multi-transition observations of OH, H2O, OH+, and other molecules (mostly light hydrides), the nuclear molecular outflow and related characteristics, e.g., the properties of the far-IR continuum emission, the column densities, mass outflow rates, momentum boost, depletion timescales, and the molecular richness would be probed by SPICA as a function of redshift.
Ground-based interferometric observations at (sub)millimetre wavelengths have also traced molecular outflows in local ULIRGs with CO emission line wings (e.g., Feruglio et al. Reference Feruglio, Maiolino, Piconcelli, Menci, Aussel, Lamastra and Fiore2010; Cicone et al. Reference Cicone2012, Reference Cicone2014; García-Burillo et al. Reference García-Burillo2015) and HCN-HCO+ wings (e.g., Sakamoto et al. Reference Sakamoto2009; Aalto et al. Reference Aalto, García-Burillo, Muller, Winters, van der Werf, Henkel, Costagliola and Neri2012, Reference Aalto2015; Lindberg et al. Reference Lindberg2016; Privon et al. Reference Privon2017). In the next years, ALMA and NOEMA in the (sub)millimetre, and the X-ray observatory Athena in late 2020s, will continue observing outflows in galaxies. Nevertheless, the observations in the far-IR domain by SPICA would be crucial and complementary, as they would provide unique information that cannot be obtained at other wavelengths:
-
(i) Far-IR observations unambiguously identify the outflow kinematics through P-Cygni profiles or blueshifted absorption wings, ruling out other possibilities as inflow, injection of turbulent energy (Guillard et al. Reference Guillard, Boulanger, Lehnert, Forêts, Combes, Falgarone and Bernard-Salas2015), or motions associated with merging. Because the blueshifted line wings are observed in absorption in the far-IR, low-velocity (100–300 km s−1) outflowing gas that carries a significant fraction of the outflowing mass in ULIRGs, would also be identified and analysed with a sensitive far-IR observatory with high spectral resolution. This component may be missed with pure emission lines because of confusion with the line core. While molecular P-Cygni and absorption line shapes are also observed in the submillimetre towards extremely buried galaxy cores (Sakamoto et al. Reference Sakamoto2009; Imanishi et al. Reference Imanishi, Nakanishi and Izumi2016), the far-IR domain provides a very sensitive probe of outflows owing to both the increase of continuum optical depth with decreasing wavelengths and to the high transition probabilities of light hydrides. The far-IR observations also probe the physical and chemical conditions in the circumnuclear regions on a few × 100 pc scales through the observation of high-lying lines in absorption at systemic velocities (González-Alfonso et al. Reference González-Alfonso2012; Falstad et al. Reference Falstad2015, Reference Falstad, González-Alfonso, Aalto and Fischer2017, GA14, GA15, GA17), thus enabling the characterisation of the spatial components of the observed SED at the wavelengths where most of the galaxy luminosity is emitted. This connection between lines and SEDs is an exclusive virtue of far-IR spectroscopy.
-
(ii) While Athena will probe the extremely hot phase of the outflows around the SMBHs, and ALMA will explore the cold phase (with energy levels at typically up to few tens K), the far-IR observatory SPICA would probe the intermediate molecular/warm phase and hence the key link between the innermost (pc-scale) and the outermost (kpc-scale) regions. In its most extended configuration (~16 km), ALMA provides an angular resolution of ~15 mas at 300 GHz (~100 pc at z = 0.5). By measuring multiple energy level line profiles with sufficient signal-to-noise, SPICA/SAFARI -despite its low angular resolution, ~4.5 arcsec to 19 arcsec—would probe similar spatial scales for the most excited outflowing components. This is because the high-lying lines (pumped through the far-IR field) require very high far-IR radiation densities, and high T dust−τ(100μm) implies small sizes for given luminosities (GA14 and GA17 and references therein).
-
(iii) The circumnuclear environments that are traced in the far-IR provide relevant clues to interpret global galaxy properties such as the line deficits, the far-IR colours in galaxies, as well as their layered structure (i.e. temperature and column density as a function of extent; GA12). At z < 1, a very rich, unique chemistry can be studied in the far-IR through the observation of high-lying lines of OH, H2O, CO, OH+, H2O+, H3O+, NH, NH2, NH3, CH, CH+, C3, etc. The excited lines of the O-bearing molecular ions are specially interesting as they directly probe the ionisation rate of the gas due to cosmic rays and/or X-rays in the nuclear region (González-Alfonso et al. Reference González-Alfonso2013), filtering out more spatially extended environments that are best probed with the ground-state lines (van der Tak et al. Reference van der Tak, Weiß, Liu and Güsten2016). The best tracers of photon dominated regions (PDRs) and the corresponding kinematics, i.e. [O i]63–145 μm and [C ii]157 μm, also lie in the far-IR, and outflowing gas has been detected in the [C ii]157 μm line in local ULIRGs (Janssen et al. Reference Janssen2016) and in a bright quasar at z > 6 (Maiolino et al. Reference Maiolino2012; Cicone et al. Reference Cicone2015).
Lastly and importantly, far-IR spectroscopy in these same transitions opens the exciting possibility of the detection of the feeding of the galaxy cores: at low redshifts, inflowing gas will be identified through inverse P-Cygni profiles or redshifted absorption wings of OH and [O i]63 μm, as seen in the local NGC 4418, Zw 049, Arp 299a, IRAS 11506−3851, IRAS 15250+3609, and Circinus (González-Alfonso et al. Reference González-Alfonso2012; Falstad et al. Reference Falstad2015, Reference Falstad, González-Alfonso, Aalto and Fischer2017; Stone et al. Reference Stone, Veilleux, Meléndez, Sturm, Graciá-Carpio and González-Alfonso2016, GA17). While inflowing motions can also be inferred from skewed profiles of pure emission lines and HI redshifted absorption (Costagliola et al. Reference Costagliola, Aalto, Sakamoto, Martín, Beswick, Muller and Klöckner2013), the far-IR offers a very sensitive probe of inflow due to the increasing continuum optical depth.
In summary, while extraordinary results will be obtained in the years to come from observatories working on a wide range of wavelengths, there is no replacement for the unique capabilities of the far-IR counterpart SPICA in the late 2020s.
2.1. Molecular outflows in the far-IR: P-Cygni profiles and blueshifted absorption wings
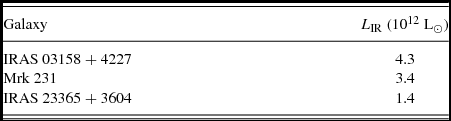
We adopt three local template ULIRGs to make predictions on the detectability of molecular outflows at high-z, by scaling the far-IR spectroscopic observations obtained with Herschel/PACS: IRAS 03158+4227, Mrk 231, and IRAS 23365+3604 (GA17). The IR luminosities (8–1000 μm, L IR) are listed in Table 1. All three sources, as well as many other local ULIRGs, show clear evidence for massive molecular outflows from P-Cygni line profiles in the ground-state OH119 and OH79 doublets (e.g., Fischer et al. Reference Fischer2010). In the cases of IRAS 03158+4227 and Mrk 231, high-velocity (≳ 1, 000 km s−1) absorption wings are also detected in the excited OH84 and OH65 doublets, indicating compact outflowing gas with high column densities (GA17). We use the currently expected sensitivities of the SPICA/SAFARI instrument as shown in Appendix A and described in Roelfsema et al. (in preparation).
Table 1. Local template ULIRGs used to make SPICA detectability predictions at high redshift.
2.1.1. Identifying massive molecular outflow candidates
It has been proposed that the most active stages of SMBH growth and nuclear SB co-evolution, involving high columns of gas funneled towards the nuclear regions of galaxies mostly as a consequence of merging or interactions, are also the stages in which feedback is expected to be most powerful, regulating the SMBH growth and star-formation burst. A unique, unambiguous probe of this buried stage comes from the absorption at far-IR wavelengths in high-lying transitions of hydrides, requiring both high dust temperatures and molecular columns over relatively compact regions (less than a few × 100 pc). The OH65 doublet, with E low ≈ 300 K, is particularly well suited for the identification of these buried and warm sources, because it can only be excited through absorption of far-IR photons in these type of environments and is correlated in local galaxies with global galaxy properties: the [C ii]158 μm deficit, the luminosity-to-gas mass ratio, the silicate absorption feature at 10 μm, and the 60-to-100 μm far-IR colour (GA15). In addition, we show in Figure 2 the relationship found in local sources between the equivalent width of the OH65 doublet at systemic velocities and the velocity of the outflowing molecular gas as traced by the OH119 doublet (GA17), indicating that indeed the highest (more blueshifted) observed outflowing velocities are found in sources with high OH65 absorption (W eq > 10 km s−1). This is entirely consistent with the finding that the highest outflow velocities in OH are found in sources with strong silicate absorption (the upper branch of the fork diagram in Spoon et al. Reference Spoon, Marshall, Houck, Elitzur, Hao, Armus, Brandl and Charmandaris2007, Reference Spoon2013).
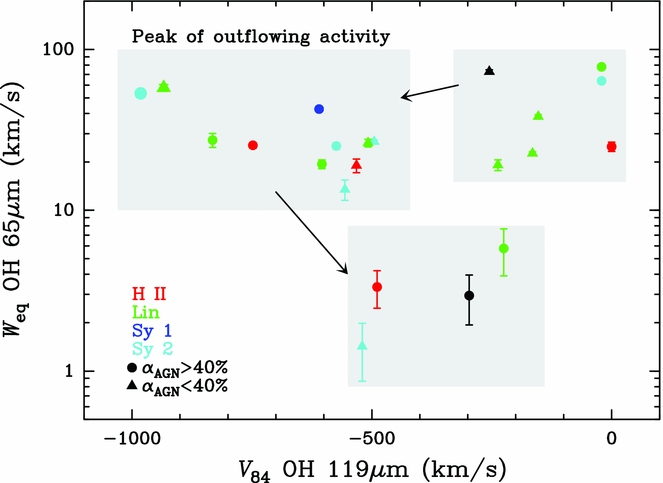
Figure 2. The equivalent width of the OH65 doublet at systemic velocities (−200 to +200 km s−1), probing buried and warm sources in the far-IR, as a function of V 84 (OH119) –84% of the absorption in the OH119 doublet is produced at velocities more positive than V 84, so that this quantity is a measure of the outflow velocity (Veilleux et al. Reference Veilleux2013). A possible evolutionary sequence is depicted, in which the peak of outflowing activity, characterized by high outflowing velocities within a (still) buried phase, is preceded by an extremely buried phase (a ‘greenhouse’ galaxy) with low velocities (and dominated by accretion in some cases) and followed by a stage where the nuclear columns of gas have decreased and the outflowing activity has subsided (adapted from GA17).
The OH65 doublet provides a unique tool to easily identify high nuclear activity, that is, the most compact and buried sources which pinpoint a particular phase in the evolution of galaxies where feedback might be expected to be strong. While Herschel/PACS has observed this doublet in only ~30 local galaxies, Figure 3 shows that the population of ULIRGs capable of generating strong absorption in OH65 would be identified up to z ~ 2, i.e. out to 3/4 of the Hubble time, through observations with SPICA/SAFARI in LR mode with only 2 h of observing time per source. Details on flux calculations based on currently expected SAFARI sensitivities are given in Appendix A.
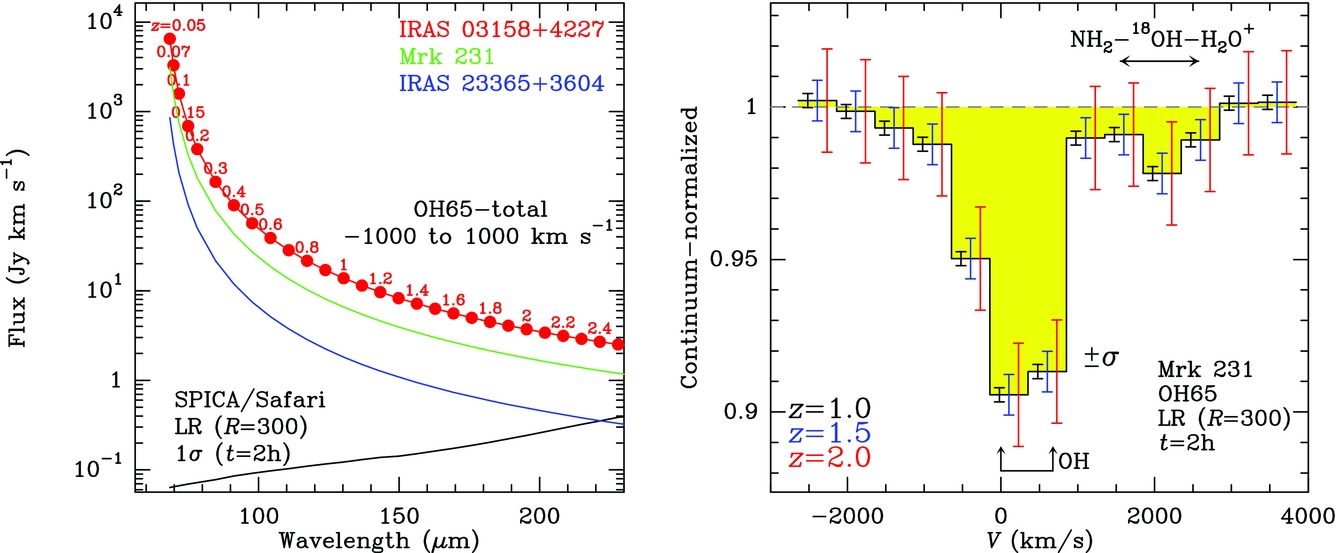
Figure 3. Left: Predicted integrated absorbing flux of the OH65 doublet in three local ULIRGs (IRAS 03158+4227, Mrk 231, and IRAS 23365+3604, from −1000 km s−1 to 1 000 km s−1) as a function of redshift (red numbers) and observed wavelength (abscissa). The black curve shows the expected sensitivity (1σ) of SPICA/SAFARI LR (R = 300) for 2 h of observing time, indicating that the doublet, probing buried stages, would be easily detected in similar ULIRGs up to z = 1.9–2.5. Right: The continuum-normalised OH65 spectrum of Mrk 231 observed with Herschel/PACS smoothed to the resolution of SPICA/SAFARI LR, with two spectral points per resolution element. The three errorbars in each spectral channel indicate the ±σ uncertainty expected with SAFARI for 2 h of observing time at the selected redshifts of z = 1.0, 1.5, and 2.0. The weak absortion around V ~ 2, 000 km s−1 is a blend of NH2, 18OH, and H2O+ lines.
2.1.2. Molecular outflows in OH at z > 1: the LR mode
The extremely efficient SPICA/SAFARI LR mode would enable the detection of molecular outflows at moderately high-z. The ground-state OH79 doublet, showing P-Cygni line shapes and correlated with the CO 1-0 luminosities in the blueshifted line wings in local ULIRGs (Sturm et al. Reference Sturm2011, GA17), would be observable with SPICA/SAFARI up to z ≈ 1.9 and provides the best tool for identifying molecular feedback. We compare in Figure 4 (upper-left panel) the predictions for the blueshifted OH79 absorption flux as a function of z with the expected SPICA/SAFARI sensitivity in LR, with only 2 h of observing time (see details in Appendix A). Strong outflow sources as IRAS 03158+4227 and Mrk 231 would be detected up to the maximum observable redshift (set by the instrumental limit), and more moderate outflow sources like IRAS 23365+3604 would be detectable up to at least z ≈ 1.3. The upper-right panel of Figure 4 shows that the LR mode predicts a clear P-Cygni line shape for the OH79 doublet in outflowing sources, thus unambiguously revealing massive molecular outflows Footnote 4 .
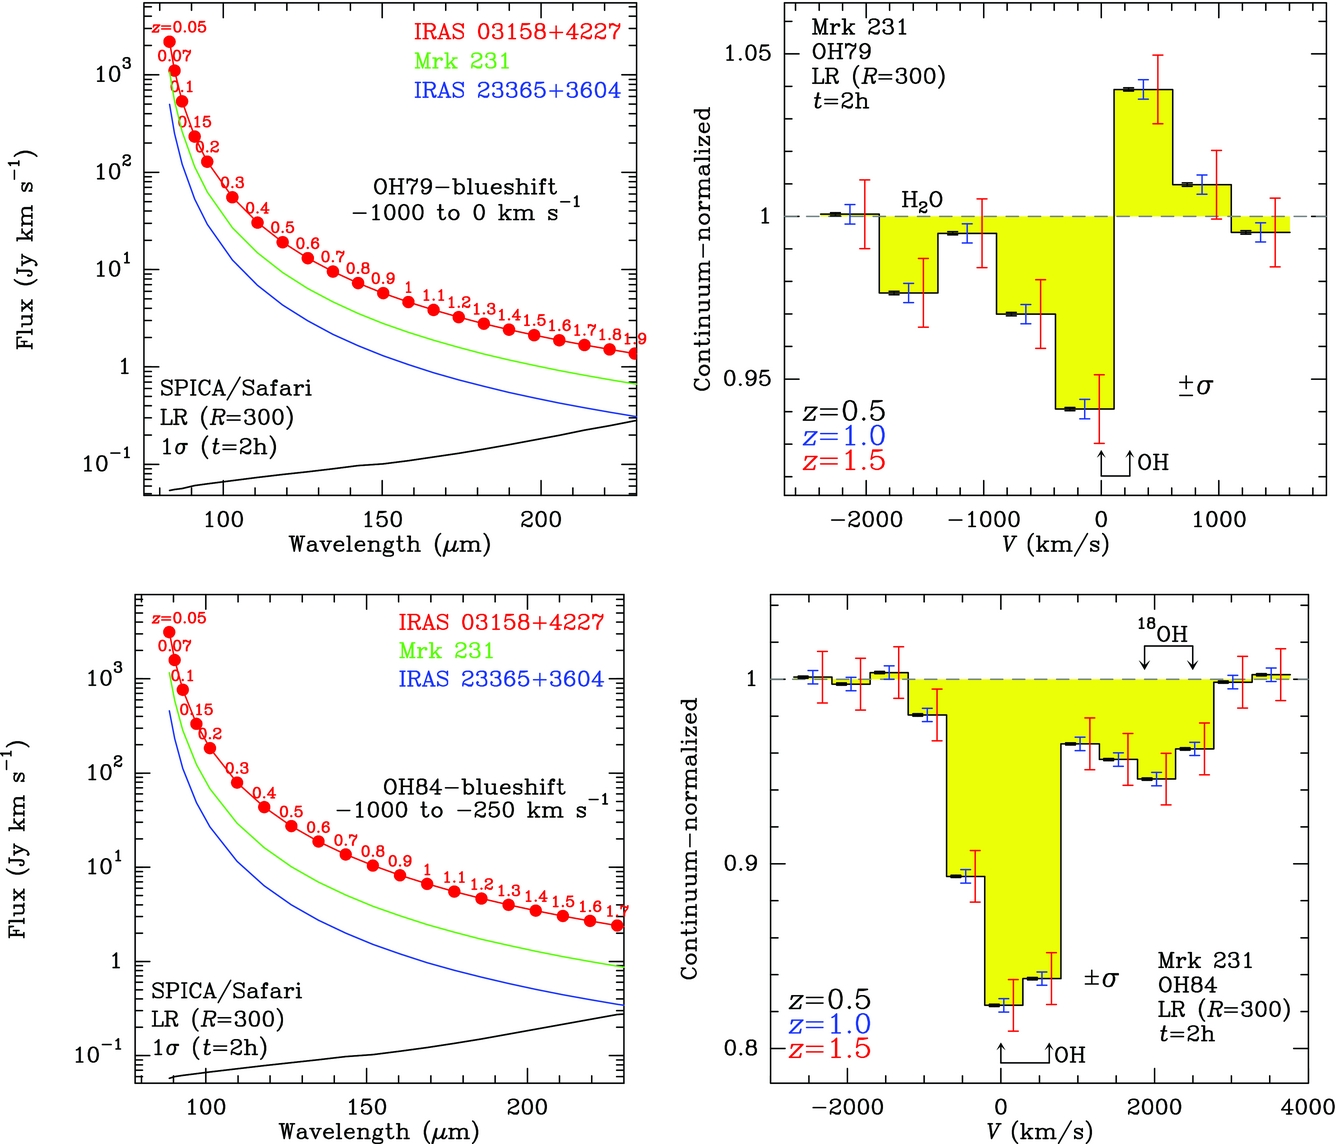
Figure 4. Upper panels. Left: Predicted integrated absorbing flux of the OH79 doublet in three local ULIRGs (IRAS 03158+4227, Mrk 231, and IRAS 23365+3604, all showing P-Cygni profiles in OH79) at blueshifted velocities (from −1000 km s−1 to 0 km s−1) as a function of redshift (red numbers) and observed wavelength (abscissa). The black curve shows the sensitivity (1σ) expected for SPICA/SAFARI LR (R = 300) with 2 h of observing time, indicating that molecular outflows would be easily detected in ULIRGs up to z = 1.3–1.9. Right: The continuum-normalised OH79 spectrum of Mrk 231 as observed with Herschel/PACS smoothed to the resolution of SPICA/SAFARI LR, with two spectral points per resolution element. The three errorbars in each spectral channel indicate the ±σ uncertainty for SAFARI with 2 h of observing time at the selected redshifts of z = 0.5, 1.0, and 1.5. The absorption at V < −1300 km s−1 is due to H2O 423 − 312. Note that not only the blueshifted absorption wing would be detected, but also the redshifted emission feature (i.e. P-Cygni), unambiguously revealing outflowing gas. Lower panels. The corresponding predictions for the excited OH84 doublet. Fluxes are shown for velocities between −1000 and −250 km s−1. In the right-hand panel, the absorption around 2000 km s−1 is due to 18OH with possible contribution by NH3 in some sources (see GA12).
Excited outflowing gas would also be detected through the OH84 doublet (lower panels in Figure 4). In the LR mode, the two l-doubling components are blended in one single feature, which shows a ‘blue’ asymmetry characteristic of outflowing gas with predicted fluxes well above the sensitivity limits up to at least z ≈ 1.3. This asymmetry is also apparent in the OH65 doublet (Figure 3).
Observations of the cross-ladder, ground-state OH doublets at 35 and 53.3 μm would enable the exploration of sources at z > 2. The equivalent width of the OH35 doublet in Mrk 231, detected with Spitzer/IRS, is ≈50 km s−1, and would be detected at z = 3 with 5σ confidence using the LR mode and 10 h of observing time. The observation would detect simultaneously the OH53.3 at 8σ level, though the blueshifted wing in this doublet is blended with highly excited lines of H2O and OH (GA14).
We also remark that hyper-luminous galaxies like HFLS3 (L FIR ~ 3 × 10¹³ L⊙, Riechers et al. Reference Riechers2013) would be easily detected with SPICA/SAFARI in the LR mode. This extraordinary source at z = 6.3, rich in molecular lines including OH, H2O, and OH+, shows a continuum flux density of 20 mJy at λrest ~ 150 μm, expectedly similar to the flux density at 35 μm. In such luminous galaxies with broad molecular linewidths (500–1500 km s−1 except CO 1-0), the OH35 doublet would be detected in LR mode up to the maximum observable redshift, z ≈ 5.5, possibly showing blueshifted line wings in absorption. Some H2O lines at shorter wavelengths could be also detected at even higher z. Likewise, gravitational lensing enables the detection of submillimetre lines of H2O, H2O+, and CH+ in z = 2–4 galaxies (Omont et al. Reference Omont2011, Reference Omont2013; Yang et al. Reference Yang2013, Reference Yang2016; Falgarone et al. Reference Falgarone2015) and will enable the studies of the molecular phase in splendid detail with the SPICA observatory.
2.1.3. The bending of the main-sequence at high M *
MS galaxies, dominating the IR luminosity function at all redshifts (Gruppioni et al. Reference Gruppioni2013), show the well-known correlation between the stellar mass (M *) and the SFR from the local Universe up to at least z ~ 3 (e.g., Noeske et al. Reference Noeske2007; Elbaz et al. Reference Elbaz2007; Rodighiero et al. Reference Rodighiero2011; Schreiber et al. Reference Schreiber2015), indicating that most galaxies produce stars at a relatively constant rate over their lifetime, gradually declining in intensity over a significant fraction of cosmic time (e.g., Noeske et al. Reference Noeske2007; Peng, Maiolino, & Cochrane Reference Peng, Maiolino and Cochrane2015). The correlation is consistent with having a linear slope (in the log) at low M *, then flattening at high M *. This ‘bending’ is more pronounced at low redshifts (e.g., Lee et al. Reference Lee2015; Schreiber et al. Reference Schreiber2016). The cause of this bending has not been established, but it has been suggested that it might be associated with the formation of ellipticals through environmental quenching (e.g., Dekel & Birnboim Reference Dekel and Birnboim2006), strangulation (Peng et al. Reference Peng, Maiolino and Cochrane2015) or outflows (negative feedback; e.g., Springel, Di Matteo, & Hernquist Reference Springel, Di Matteo and Hernquist2005).
With the SPICA observatory, we would be able to address the importance of outflows by taking IR spectra of a large sample of massive, MS galaxies. The SEDs of MS galaxies with logM *(M⊙) = 11.2 in three redshift bins are shown in Figure 5, and the positions of the OH doublets at 65, 79, 84, and 119 μm (GA14, GA17) are shown with vertical lines. With the currently expected sensitivities of the LR mode, we have shown in Figures 3 and 4 that a 1σ uncertainty of ≈2% of the continuum would enable the detection of massive molecular outflows. We thus show in Figure 5 that this level of sensitivity is reachable for high-mass MS galaxies with <6h of observing time per source. SPICA/SAFARI would thus enable a systematic search for outflows in high-mass MS galaxies.Footnote 5
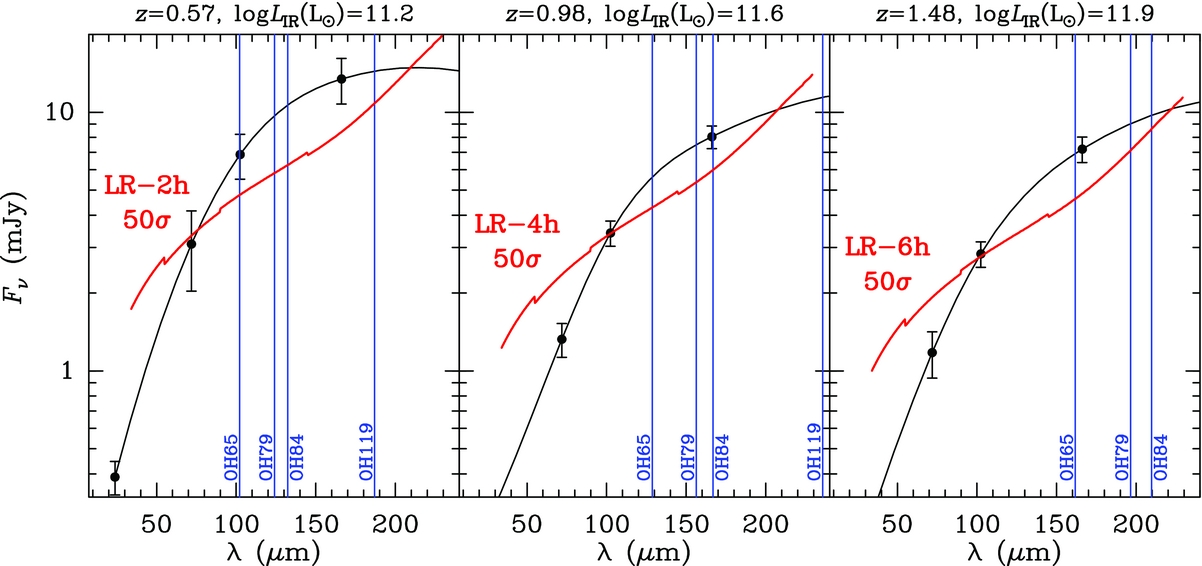
Figure 5. The black points with errorbars and black curves show the SED of main-sequence galaxies in the highest logM *(M⊙) = 11.2 bin at different redshifts (from Schreiber et al. Reference Schreiber2015), and the vertical blue lines indicate the observed wavelengths of the OH65, OH79, OH84, and OH119 doublets. The red curves show the expected 50σ sensitivities in LR mode and for one spectral channel attained in 2–6h, indicating the capability of the designed SPICA/SAFARI instrument to explore the possible outflow origin of the ‘bending’ of the M *-SFR (MS) correlation in the high M * bin.
2.1.4. Molecular outflows in OH at z < 1: the HR mode
The ground-state OH119 doublet shows ubiquitous P-Cygni line shapes in local ULIRGs (Spoon et al. Reference Spoon2013; Veilleux et al. Reference Veilleux2013), and would be detectable with SPICA/SAFARI (λmax = 230 μm) up to z = 0.94. The doublet is usually strong with blueshifted absorption deeper than 20% of the continuum, which would enable its observation with SPICA/SAFARI in HR mode. Any P-Cygni line shape would be easily detectable with 4 h of observing time, providing high-quality spectra in this doublet (see Figure 6). With R = 600, the four doublets OH119, OH79, OH84, and OH65 (see lower panels of Figure 6) would be analyzed enabling an estimate of the energetics associated with the outflows (GA17).
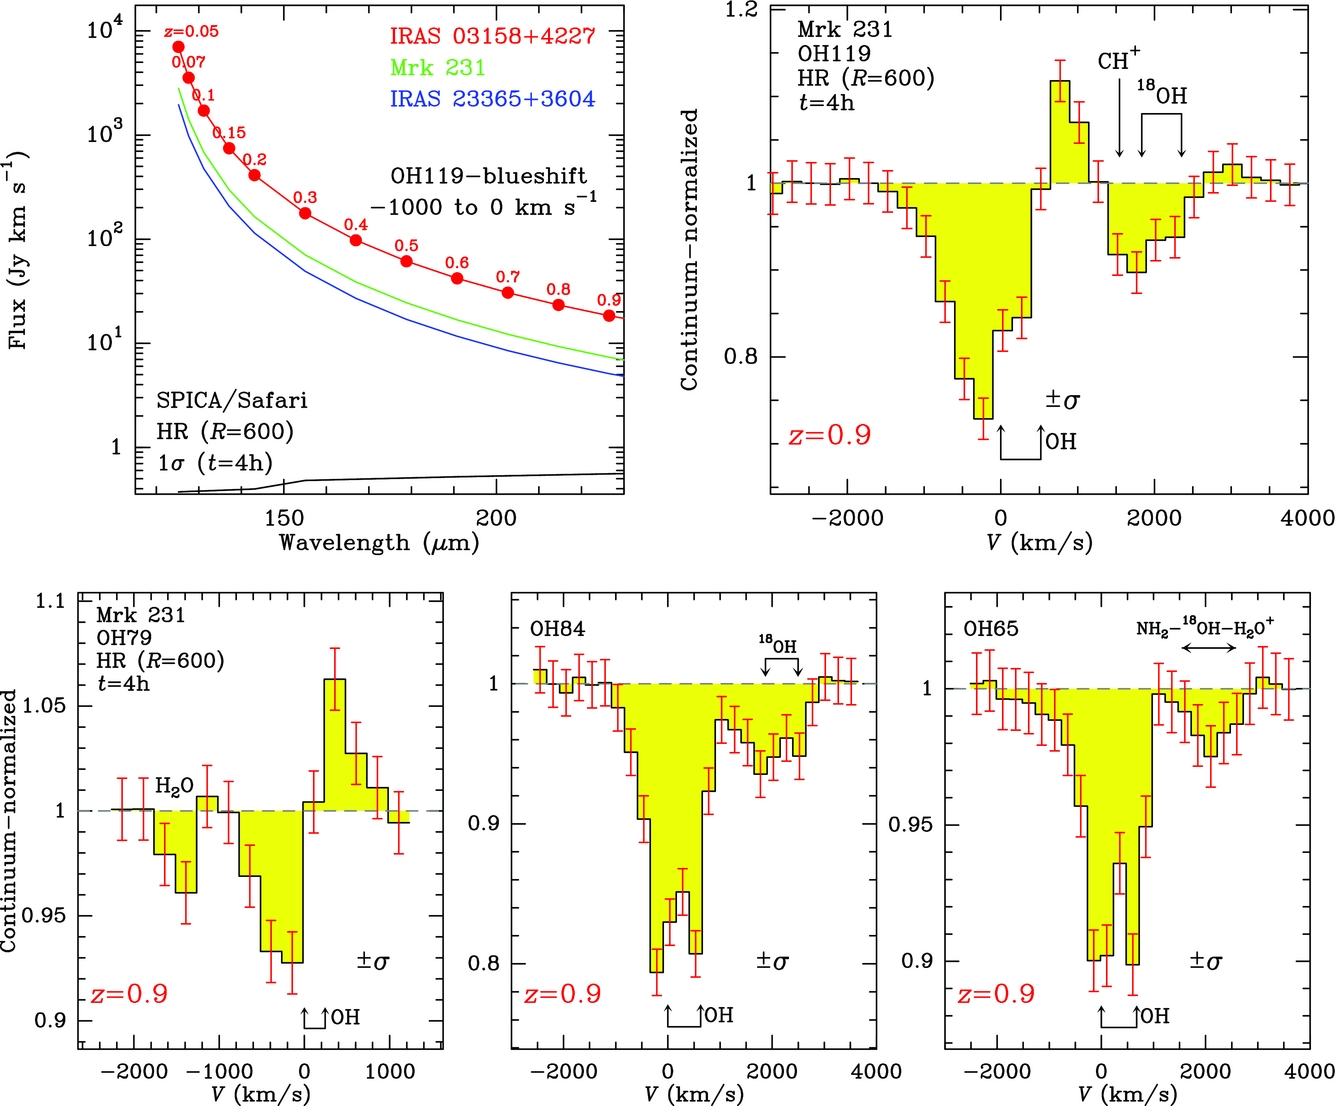
Figure 6. Upper panels. Same as Figure 4 for the OH119 doublet in HR mode smoothed to a spectral resolution of R = 600 and with 4 h of observing time, illustrating the high-quality spectra that would be obtained with SPICA/SAFARI in this OH doublet up to the maximum observable redshift, z ≈ 0.94. Contribution to the absorption by 18OH would also be detectable, constraining the metallicity of the sources (see also the companion paper, Fernández-Ontiveros et al. Reference Fernández-Ontiveros2017). Lower panels. Continuum-normalised spectra of the OH79, OH84, and OH65 doublets in Mrk 231 as observed with Herschel/PACS with the resolution of SPICA/SAFARI HR smoothed to R = 600. The errorbars indicate the expected ±σ uncertainty reachable with SAFARI with 4 h of observing time at z = 0.9.
We remark that the strongest drop in IR luminosity density occurs at 0 < z ⩽ 1 (Gruppioni et al. Reference Gruppioni2013), and SPICA/SAFARI would potentially enable the determination of molecular outflow statistics during this crucial epoch (the last ~8 Gyr of the Universe) through surveys. Hundreds of galaxies would be potentially detected in the OH119 doublet and other doublets with ~500h of observing time, enabling to constrain the outflow luminosity function in several redshift bins up to z ~ 1. In addition, the statistics of the outflow velocity (Sturm et al. Reference Sturm2011; Spoon et al. Reference Spoon2013; Veilleux et al. Reference Veilleux2013; Stone et al. Reference Stone, Veilleux, Meléndez, Sturm, Graciá-Carpio and González-Alfonso2016), as well as of the mass outflow rates, momentum and energy fluxes (GA17) as a function of the AGN and SB luminosities would be established for large numbers of galaxies over more than half the age of the Universe.
2.1.5. Probing the outflows with H2O and their ionization rates with OH+
H2O couples very well to the IR radiation field and presents dozens of absorption lines in the far-IR spectra of buried galaxies (e.g., GA12). At high redshifts, the submillimetre emission lines of H2O have been detected in several sources (van der Werf et al. Reference van der Werf2011; Omont et al. Reference Omont2011, Reference Omont2013; Yang et al. Reference Yang2013, Reference Yang2016; Riechers et al. Reference Riechers2013; Gullberg et al. Reference Gullberg2016). Based on our Mrk 231 template and the expected SAFARI sensitivities, several H2O lines with λrest < 77 μm would be detected up to z ~ 2 with the LR mode of SPICA/SAFARI in only 2 h of observing time. In Mrk 231, these lines peak at systemic velocities and show a blueshifted absorption wing, which would be too weak even for SPICA to detect at high redshifts. Nevertheless, averaging the profiles of several H2O lines, or the profile of a given line in a sample of observed galaxies, could enable the detection of a blue line-shape asymmetry in strong sources at z > 1. At z < 1, the wings of the individual lines are detectable in the HR mode with R = 600 − 1000, as illustrated in Figure 7 for the H2O 432 − 321 transition at λrest = 59 μm (E lower ≈ 300 K).

Figure 7. The H2O 432–321 line at 59 μm, and the spectrum around 153 μm including 2 J − 1 J′ lines of OH+ and NH, observed with Herschel/PACS in Mrk 231, smoothed to a resolution of 1 000 (adapted from Fischer et al., in preparation). The reference velocity corresponds the 23 − 12 line of OH+, which dominates over the partially blended NH 22 − 11 line. Errorbars indicate the expected ±σ uncertainties for SPICA/SAFARI in HR mode with 2 (left) and 4 (right) h of observing time. The H2O and OH+ lines show blueshifted absorption wings indicative of outflowing gas.
Figure 7 also shows the Herschel/PACS spectrum of Mrk 231 smoothed to R = 1000 around λrest = 153 μm (adapted from Fischer et al., in preparation), showing strong absorption in two (of the allowed six) fine-structure 2 J − 1 J′ lines of OH+ and NH. The OH+ lines show blueshifted absorption wings extended to ~− 1000 km s−1 in both transitions, as well as in other fine-structure lines. Together with the 3 J − 2 J′ (at ~100 μm) and 4 J − 3 J′ (at ~76 μm) lines, and in combination with lines of H2O+, H3O+, and OH, the OH+ lines SPICA/SAFARI would provide an excellent data set for modeling the ionization rates of the molecular outflows (González-Alfonso et al. Reference González-Alfonso2013; van der Tak et al. Reference van der Tak, Weiß, Liu and Güsten2016).
2.2. Physical conditions of the molecular outflows using the CO band at 4.7 μm in the mid-IR
Another crucial piece of information to study the physical conditions of the molecular outflows is the near-IR CO ro-vibrational transitions (Δv = 1, ΔJ = ±1, λ ~ 4.7μm). Shirahata et al. (Reference Shirahata, Nakagawa, Usuda, Goto, Suto and Geballe2013) observed the CO band in absorption toward the nucleus of IRAS 08572+3915, clearly showing that the main component of the absorption is blueshifted and thus probes the outflow from the nucleus. The observed line absorption of ~50% of the continuum indicates that the outflowing CO is covering a large fraction of the mid-IR continuum, providing a sensitive probe of molecular feedback close to the central engine. Moreover, since many lines at various excitation levels can be observed simultaneously, Shirahata et al. (Reference Shirahata, Nakagawa, Usuda, Goto, Suto and Geballe2013) could estimate the gas temperature of the outflowing gas, and hence the column density of the CO gas with very little uncertainty.
We can extend this work to the high-redshift universe with SPICA/SMI and the James Webb Space Telescope (JWST, see also §2.6). Figure 8 shows the estimated flux of ULIRGs at the wavelength around the CO feature together with the expected sensitivity of SPICA/SMI/HR. A spectral resolution of R = 5000 is required to avoid blending of adjacent CO lines and thus to correctly place the continuum. With the spectral coverage of 12 − 18 μm, which corresponds to a redshift of z = 1.5 − 3 for the CO band, SPICA/SMI can observe the band toward luminous ULIRGs with enough S/N ratio for the absorption study. Additional potential probes of molecular outflows in the mid-IR include the bands of H2O (6.3 μm), HCN (14 μm), CO2 (15 μm), and C2H2 (13.7 μm).

Figure 8. The flux densities of ULIRGs at the wavelength of the CO band (~4.7 μm) together with the expected sensitivity of SPICA/SMI/HR with the spectral resolution binned optimal for this study. With the spectral coverage of 12 − 18 μm, which corresponds to a redshift of z = 1.5 − 3 for the CO band, SPICA/SMI can observe this feature toward luminous ULIRGs.
2.3. The ionized phase of outflows: fine-structure lines of Ne ions in the mid-IR and the [C ii]157μm line
With Spitzer/IRS, blueshifted emission in the [Ne iii]15.5μm, [Ne ii]12.8μm, and [Ne v]14.3μm fine-structure lines was found in ~30% of local ULIRGs, most of them classified as AGNs (Spoon & Holt Reference Spoon and Holt2009; Spoon et al. Reference Spoon, Armus, Marshall, Bernard-Salas, Farrah, Charmandaris and Kent2009). In some sources, the wings were detected up to −3500 km s−1, with indications of higher blueshift with increasing ionization state of the gas. The high ionization potential of Ne3+, ≈97 eV, ensures that the [Ne v] line can only be produced in gas directly irradiated by an AGN, thus unambiguously probing the ionized phase of AGN feedback at wavelengths where extinction is less severe than in the UV, optical, or near-IR. Since the high velocity Ne gas is only seen in sources with weak silicate absorption (the lower branch of the fork diagram in Spoon et al. Reference Spoon, Marshall, Houck, Elitzur, Hao, Armus, Brandl and Charmandaris2007), indicating a very low dust column to the nucleus, a direct comparison of sources with molecular outflows and outflows in the high ionization gas might probe different evolutionary states (Spoon et al. Reference Spoon2013).
We use IRAS 13451+1232, where the three Ne lines are detected with blueshifted emission up to at least −3000 km s−1 (Spoon & Holt Reference Spoon and Holt2009), as a local template to compare in Figure 9 the expected fluxes for the blueshifted emission as a function of redshift with sensitivity expectations for SPICA/SMI. The three lines, at rest wavelengths of 12.8 − 15.5 μm, shift with increasing redshift from the SMI/HR band (12 − 18 μm, R nom = 28000) into the SMI/MR band (18 − 36 μm, R nom = 1300 − 2300); our sensitivity calculations correspond to a smoothed resolution of R = 300 (black curve in Figure 9). Very interestingly, strong outflows in the [Ne iii] line will be detected in 5 h of observing time up to z ~ 1, enabling direct comparison with OH119 across the cosmic epoch of most pronounced decrease in SFR.

Figure 9. Predicted integrated flux of the [Ne iii]15.5μm (red), [Ne ii]12.8μm (green), and [Ne v]14.3μm (blue) lines, in IRAS 13451+1232 at blueshifted velocities (from −3500 km s−1 to −500 km s−1, from Spoon & Holt Reference Spoon and Holt2009) as a function of redshift (small numbers) and observed wavelength. The black curve shows the sensitivity (1σ) expected for SPICA/SMI HR and MR with a resolution of R = 300 with 5 h of observing time. The ionized phase of the outflows in the mid-IR is detectable up to z ~ 0.7 − 1.
In a sample of local far-IR bright galaxies, Janssen et al. (Reference Janssen2016) have reported on the detection of broad wings in the [C ii]157μm line, and have shown that these wings are found in sources with high velocity outflowing gas as seen in OH119. In addition, the outflow masses derived from OH and broad [C ii] show a tentative 1 : 1 relationship, suggesting that the atomic and molecular gas phases of the outflow are connected (Janssen et al. Reference Janssen2016). Furthermore, the molecular outflow masses inferred from Na i D (Rupke & Veilleux Reference Rupke and Veilleux2013b), CO (Cicone et al. Reference Cicone2014), and OH (GA17), appear to show similar agreement. The similarity of the derived masses using tracers that are expected to arise from different phases or components, suggesting a phase change of the outflow material or high ionization rate of the outflowing molecular gas, deserves a more statistically significant observational study. With the SPICA/SAFARI instrument, the [C ii]157μm line would be observed in the local Universe up to z ≈ 0.45.
2.4. Inflows
In the local Universe, evidence for galaxy-scale inflows has come from inverse P-Cygni line shapes and redshifted absorption seen primarily in both the [O i]63 μm line and in the ground-state OH doublets. These inflows are usually spatially extended in comparison with the size of the nuclei, thus probing the feeding of galaxy cores (Falstad et al. Reference Falstad2015, Reference Falstad, González-Alfonso, Aalto and Fischer2017, GA12, GA17). While simulations predict that high-z galaxies are fed by relatively pristine gas, there is growing evidence that the immediate environments of high-z sources may be metal-rich (Prochaska, Lau, & Hennawi Reference Prochaska, Lau and Hennawi2014; Emonts et al. Reference Emonts2016; Neeleman et al. Reference Neeleman, Kanekar, Prochaska, Rafelski, Carilli and Wolfe2017), in which case SPICA/SAFARI can play an important role in studying galaxy-scale inflows on significant cosmic timescales. In local sources, the velocities associated with these motions are low, and thus the HR mode of SPICA/SAFARI will be required to study the inflows.
Inflow signatures are found in all observed (in the far-IR) local LIRGs (with ~(1 − 4) × 1011 L⊙) that host a very compact and warm nucleus (NGC 4418, Zw 049.057, Arp 299a, and IRAS 11506−3851), which may represent galaxies in an early stage of merging, or accreting metal-rich gas from the intergalactic medium via efficient ‘cold’ inflows. We show in Figure 10 the inverse P-Cygni observed in the [O i]63 μm line towards NGC 4418 (L IR ~ 1011 L⊙, z ≈ 0.007) smoothed to a resolution of R = 1000. The errorbars indicate the ±σ uncertainty expected for SPICA/SAFARI in 5 h of observing time at z = 0.2. For a LIRG with L IR ~ 4 × 10¹¹ L⊙, this type of line shape would be detected up to z ≈ 0.4. SPICA/SAFARI would thus obtain an estimate of massive inflow rates (≳ 10 M⊙ yr−1) in LIRGs in the local Universe and beyond.

Figure 10. Left: The [O i]63 μm line at 63 μm in the LIRG NGC 4418 observed with Herschel/PACS, showing an inverse P-Cygni profile characteristic of galaxy-scale inflowing gas (GA12). The spectrum is smoothed to a resolution of R = 1000, and errorbars indicate the expected ±σ uncertainties at z = 0.2 for SPICA/SAFARI in HR mode with 5 h of observing time. The spectral feature at ~700 km s−1 is a very excited H2O line formed in the inner galaxy core. The insert shows the unsmoothed spectrum. Right: the OH119 spectrum in IRAS 15250+3609, showing redshifted absorption. The strong feature at 1600 − 2200 km s−1 is due to redshifted CH+, because the red component of the 18OH doublet is not detected. Errorbars indicate the expected ±σ uncertainties at z = 0.5 for SPICA/SAFARI in HR mode with 5 h of observing time.
In the sample of sources observed with Herschel/PACS, there is one local ULIRG with prominent redshifted absorption in the OH doublets, IRAS 15250+3609 (L IR ~ 1012 L⊙, GA17), probably indicating massive funneling of gas toward the central galaxy core as a consequence of merging. The spectrum of HCO+ 3-2 at submillimetre wavelengths also shows a redshifted absorption feature, but the profile is dominated by redshifted emission and blueshifted absorption of the continuum characteristic of an outflow (Imanishi et al. Reference Imanishi, Nakanishi and Izumi2016)Footnote 6 . The redshifted OH119 absorption in this source is shown with R = 1000 in Figure 10. The emission feature at negative velocities is expected to be associated with outflowing gas, but the redshifted absorption represents a massive inflow. The errorbars illustrate that these type of profiles in ULIRGs can be traced to z ≳ 0.5 with SAFARI. The absorption feature at 1600 − 2200 km s−1, almost as strong as OH119, appears to be primarily due to redshifted CH+, suggesting intense dissipation of mechanical energy (Falgarone et al. Reference Falgarone2015).
2.5. Constraining SEDs from lines
Decomposition of the SED of galaxies into AGN and SB contributions is a key aspect of studies of the corresponding luminosity functions based on multi-wavelength photometric data-sets (e.g., Gruppioni et al. Reference Gruppioni2013, Reference Gruppioni2016; Delvecchio et al. Reference Delvecchio2014). While the fractional contributions to the luminosities by the AGN and the SB are in most cases very well defined, there are cases where it may be relevant to distinguish between nuclear and extended star formation, or where the columns towards the nuclear regions are not well constrained with photometric means, or where exceptionally high gas column densities may partially mask the AGN. In these cases, observations of absorption, radiatively pumped molecular lines in the far-IR can help resolve these ambiguities, as T dust and the continuum optical depth are constrained from line modeling (e.g., GA15). The continuum emitted by these far-IR optically thick, warm components is usually blended with and diluted within the contribution from colder dust, and hence the only way to dissentangle the cold (≲ 45 K) and warm (≳ 65 K) components is through lines. The technique has been applied to local (U)LIRGs, enabling the characterization of the SEDs associated with buried galaxy nuclei (e.g., Falstad et al. Reference Falstad2015, Reference Falstad, González-Alfonso, Aalto and Fischer2017, GA12,GA17), and would be applied to high-z sources with the advent of SPICA.
Information from emission lines can also potentially be used as a prior in SED fitting with the MCMC SED fitting codes which have already been developed (e.g., the SED Analysis Through Markov Chains, Johnson et al. Reference Johnson, Wilson, Tang and Scott2013). Efstathiou et al. (Reference Efstathiou2014) also discussed whether the line information in IRAS 08572+3915 is consistent with the idea that the ULIRG is powered by an AGN and a young SB, which included calculations with CLOUDY (Ferland et al. Reference Ferland2013).
An interesting way of linking the feedback studies with SED fitting is to try determine whether outflows are associated with galaxies in which the SBs are relatively old, which is expected within the negative feedback scenario of star formation quenching. As shown in earlier works, the age of the SB can be an important parameter which determines the shape of the IR spectrum and especially the prevalence of PAH features (e.g., Efstathiou, Rowan-Robinson, & Siebenmorgen Reference Efstathiou, Rowan-Robinson and Siebenmorgen2000; Rowan-Robinson & Efstathiou Reference Rowan-Robinson and Efstathiou2009). High quality rest-frame mid-IR data of galaxies will enable this kind of SED modeling, available with JWST and also potentially with SPICA itself.
2.6. Synergies with other missions
The study of outflows is among the strongest synergies between SPICA and JWST, Athena, ALMA, NOEMA, SKA, and the E-ELT. Specific questions that could be addressed with the combined capabilities of the four facilities include:
-
1) What are the morphologies, masses, mass outflow rates, and kinetic energies of the observed outflows, and how do they relate to the properties of the nucleus and the host?
-
2) What are the best tracers to obtain reliable estimates of the outflow properties?
-
3) How common are massive outflows at the peak epoch of AGN and galaxy assembly (z = 1 − 3)?
-
4) In which galaxy/AGN types do massive outflows occur? In which phase of the evolution of a galaxy and how long does the active feedback phase lasts?
-
5) How are molecular outflows linked to the ionized and atomic outflows and how do they propagate?
E-ELT/HARMONI will provide integral-field unit (IFU) observations in the optical and near-IR (0.47 − 2.45 μm) enabling the mapping of host-galaxy kinematics to distinguish between rotation signatures, irregular kinematics, and high-velocity components (i.e. potential signatures of outflowing gas) presumably up to redshifts of ~3 (e.g., Kendrew et al. Reference Kendrew2016). Because E-ELT/HARMONI is a single IFU, obtaining constraints for a large sample of AGNs will be observationally expensive. The second generation multi-IFU E-ELT/MOS will enable observations of the kinematic components of several AGNs within a single field of view at 0.8 − 1.8 μm, thus providing a catalogue of a statistically significant AGN sample. E-ELT spectroscopy will also provide additional diagnostics such as broad [Ne v] emission, Al iii and other UV absorption features, that will characterize ionized gas outflows at substantially higher redshifts than is currently possible. The SPICA observatory would probe in z < 2 galaxies the molecular counterpart, to verify whether the observed feedback is accompanied by significant amounts of star-formation material.
With the help of VLT-SINFONI IFU spectroscopy, Cano-Díaz et al. (Reference Cano-Díaz, Maiolino, Marconi, Netzer, Shemmer and Cresci2012) obtained the [O iii]λ5007 emission-line kinematics map of the luminous quasar 2QZJ002830.4-281706 at z = 2.4, that revealed a massive outflow on scales of several kpc. The detection of narrow Hα emission revealed non-uniformly distributed star formation in the host galaxy, with an SFR of ~100 M⊙ yr−1 strongly suppressed in the region where the highest outflow velocity and velocity dispersion are found. With an angular resolution and sampling of 0.01 arcsec at 2 μm, E-ELT/HARMONI will be able to image the same field of view over 250 × 250 pixels with a spatial resolution of 80 pc. Such observations will have a major impact on our understanding of the effect of ionized gas winds on the star formation of the host galaxy and, given the extremely high L AGN ≈ 1013 L⊙, SPICA would trace the clearing of the molecular gas reservoir from the galactic disk (Section 2.1.2).
In the foreseeable future, ALMA and NOEMA will continue to lead the way at (sub)millimetre wavelengths, providing maps of the cold gas components in CO and also denser tracers such as HCN, HCO+, and CS. Given the long observing time required for obtaining spatially resolved observations of line wings at high redshifts, and given that SPICA/SAFARI would enable the observation of ~1000 galaxies in the LR mode at z = 0.5 − 3.5, a possible strategy could consist of SPICA providing samples of galaxies with massive outflows to be subsequently mapped with interferometres. Cross-check of outflows detected in the far-IR and (sub)millimetre would also be important to calibrate the inferred energetics.
JWST, which is scheduled to launch in late 2018, will provide unprecedented imaging and spectroscopic capabilities in the near and mid-infrared. Specifically, the Near Infrared Spectrograph (NIRSpec), which will cover 0.6 − 5.3 μm at R ~ 2700, and the Mid Infrared Instrument (MIRI), which will cover 4.9 − 28.8 μm at R ~ 1500 − 3500, will both have Integral Field Unit (IFU) modes, enabling high sensitivity, spatially-resolved spectra of star-forming galaxies and AGN. As has been shown in studies of nearby AGN (e.g., Müller-Sánchez et al. Reference Müller-Sánchez, Comerford, Stern and Harrison2016; Riffel et al. Reference Riffel2016) and z ~ 1 − 2 SBs (e.g., Genzel et al. Reference Genzel2014; Livermore et al. Reference Livermore2015; Mieda et al. Reference Mieda, Wright, Larkin, Armus, Juneau, Salim and Murray2016), IFUs are powerful tools to disentangle the excitation and kinematics of the atomic and molecular gas in the nuclei of galaxies. At low redshifts, MIRI and NIRSpec will provide access to rest-frame near-IR and mid-IR diagnostic features that can be used to separate out photo-ionization and heating from shock excitation, on spatial scales that range from tens to hundreds of parsecs. At high redshifts, the bright optical emission lines (e.g., Hα, [N ii], [O i], [S ii]) will all pass into the NIRSpec bands, enabling traditional diagnostic diagrams (e.g., the Baldwin, Phillips and Terlevich or BPT diagram) to be used to identify shocked gas on scales of a few kpc. In the rest-frame near-IR, there are key diagnostics of shocks ([Fe ii]] at 1.25 and 1.64 μm) and warm (500–1000 K) molecular gas (the 1 − 0 S(1) H2 line at 2.21 μm), which can be directly compared to the H ii-region emission from hot, young stars as traced by the Paschen and Bracket series recombination lines, and the PDR emission as traced by the 3.3 PAH emission feature. The mid-IR provides access to a suite of PAH features to probe grain ionization and size, which can be altered by fast shocks in outflowing winds (e.g., Beirão et al. Reference Beirão2015). In addition, the H2 S(0)−S(7) lines, and bright fine-structure cooling lines provide a sensitive probe of the warm (100 − 500 K) molecular gas and the ionization and density of the atomic ISM, respectively. Slow shocks can heat the molecular gas providing enhanced H2 emission, and the large range in ionization potential and critical density of the fine structure lines can be used to not only detect buried AGN (see Spinoglio et al. Reference Spinoglio2017), but also to uncover the presence of shocks (Allen et al. Reference Allen, Groves, Dopita, Sutherland and Kewley2008; Inami et al. Reference Inami2013). A number of molecular bands in the mid-IR (CO, H2O, HCN, C2H2, and CO2) can also provide a unique view of the structure of the innermost phase of molecular outflows.
The Square Kilometre Array (SKA, e.g., Morganti, Sadler, & Curran Reference Morganti, Sadler and Curran2015), with early science planned for 2020 and fully operational in 2030, will provide HI 21 cm absorption surveys with unprecedented sensitivity, enabling the detection of the atomic phase of outflows up to z ~ 3 (Morganti et al. Reference Morganti, Sadler and Curran2015). Galaxy feedback processes at high redshifts would be studied in both the atomic and molecular phases with SKA and SPICA. In addition, inflows are potentially detectable in the HI 21 cm with SKA (as observed in the local NGC 4418, Costagliola et al. Reference Costagliola, Aalto, Sakamoto, Martín, Beswick, Muller and Klöckner2013), enabling the study of their metallicity when compared with SPICA observations of the [O i]63 μm line and the OH doublets (Section 2.4).
The observing plans for Athena currently envisage an ambitious Wide Field Imager (WFI, Meidinger et al. Reference Meidinger, Eder, Eraerds, Nandra, Pietschner, Plattner, Rau and Strecker2016) survey including medium and deep pointings which would allow the detection of thousands of (mostly mildly) Compton-thick (CT) AGN up to a redshift of 3–4 and their recognition as such up to a redshift of 3 (Carrera et al. Reference Carrera and Ness2014), characterising a few tens of those up to z ~ 3. In addition, it would also uncover X-ray nuclear UFOs in a few thousand type 1 AGN up to z ~ 3 (Carrera et al. Reference Carrera2015). This is a rich harvest of potential targets for detailed SPICA follow-up spectroscopy: CT sources could be targeted to ascertain the putative relationship between heavy obscuration and molecular outflows (Section 2.1.1) comparing the incidence of these features at different obscuration levels; SPICA could also observe populations of type 1 AGN with and without UFOs, looking for the incidence of molecular outflows in both populations, to investigate the connection between the energy injected in the circumnuclear region by the AGN and the galaxy-wide outflows that provide an effective feedback (Sections 2.1.2 and 2.1.5).
In addition, Athena will also obtain HR X-IFU (Barret et al. Reference Barret, den Herder, Takahasi and Bautz2016) spectroscopy of samples of AGNs out to z ~ 2 showing moderately ionised outflows, to measure the mechanical energy associated to those outflows (Carrera et al. Reference Carrera2015). X-IFU spectroscopy will also be carried out on nearby AGN outflows, to measure their kinetic energy and to understand how the outflows are launched, also probing the interaction of winds from AGN and star-formation with their surroundings (PontiPonti, Ptak, & Tsuru Reference Ponti, Ptak and Tsuru2015). This would help understand how BHs quench their own mass reservoir and even how the M − σ relation is established. At the same time, SPICA would observe the molecular phase, and the putative relationship between nuclear (parsec-scale) AGN winds and the more extended molecular outflows (Tombesi et al. Reference Tombesi, Meléndez, Veilleux, Reeves, González-Alfonso and Reynolds2015; Feruglio et al. Reference Feruglio2015) would be revealed on the basis of significant galaxy samples.
3 CONCLUSIONS
A breakthrough in our knowledge of molecular outflows through cosmic time is expected with the IR observatory SPICA. We have shown in this paper that the unprecedented sensitivities predicted for the SAFARI instrument would enable the detection and accurate description of outflows in OH up to z ~ 1, the limiting redshift for the observation of the most sensitive OH doublet at 119 μm. It is in this epoch when the strongest drop in IR luminosity density and star formation takes place, and SPICA would check the role of massive outflows in star formation quenching. In addition, bright sources will also be detected in the more optically thin OH transition at 79 μm up to z ~ 1.5 − 2, i.e. the last ~10 Gyr of the Universe. For the first time it will be possible to study molecular outflows in the infrared in massive, MS galaxies near their peak of activity, testing the relationship between feedback and the shape of the MS. We have shown predictions for lines of H2O and OH+ in the far-IR, and also for the CO band at 4.7 μm and the strongest lines of ionized Ne in the mid-IR. Inflowing gas associated with mergers or accretion of metal-rich intergalactic gas will also be an exciting topic of study with SPICA, through spectroscopic observations of the [O i]63μm and OH transitions. Finally, we have discussed the most important synergies that SPICA will have with other current and future observatories in the study of feedback and galactic evolution.
ACKNOWLEDGEMENTS
This paper is dedicated to the memory of Bruce Swinyard, who initiated the SPICA project in Europe, but unfortunately died on 2015 May 22 at the age of 52. He was ISO-LWS calibration scientist, Herschel/SPIRE instrument scientist, first European PI of SPICA, and first design lead of SAFARI.
We thank Corentin Schreiber and David Elbaz for providing us with the SEDs of MS galaxies in electronic form (reported in Schreiber et al. Reference Schreiber2015). EGA is a Research Associate at the Harvard–Smithsonian Center for Astrophysics, and thanks the Spanish Ministerio de Economía y Competitividad for support under projects FIS2012-39162-C06-01 and ESP2015-65597-C4-1-R. EGA and JF acknowledge support under NASA grant ADAP NNX15AE56G. Basic research in IR astronomy at NRL is funded by the US ONR. FJC acknowledges financial support through grant AYA2015-64346-C2-1-P (MINECO/FEDER). This research has made use of NASA’s Astrophysics Data System (ADS) and of GILDAS software (http://www.iram.fr/IRAMFR/GILDAS).
A SCALING FLUX DENSITIES WITH REDSHIFT AND SENSITIVITIES
We use the spectra observed by Herschel/PACS in some templates and scale the flux densities with redshift z according to F ν, Jy∝(1 + z)/D 2 L , where D L is the luminosity distance. We use for D L a flat Universe with H 0 = 69.6 km s−1 Mpc−1 and ΩM = 0.286 (Bennett et al. Reference Bennett, Larson, Weiland and Hinshaw2014).
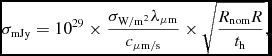
Figure A1 shows the estimated 1σ-1h sensitivities currently expected SPICA/SAFARI (Spinoglio et al. Reference Spinoglio2017; Gruppioni et al. Reference Gruppioni2017) in LR and high-HR modes, at their nominal resolution (R nom = 300 for LR and R nom = 2 × 103 × 200μm/λ for HR, where λ is the observed wavelength). The corresponding sensitivities for the flux densities are given by
 $$\begin{equation}
\sigma _{\mathrm{mJy}} = 10^{29} \times \frac{\sigma _{\mathrm{W/m^2}}\lambda _{\mathrm{\mu m}}}{c_{\mathrm{\mu m/s}}} \times \sqrt{\frac{R_{\mathrm{nom}}R}{t_{\mathrm{h}}}},
\end{equation}$$
$$\begin{equation}
\sigma _{\mathrm{mJy}} = 10^{29} \times \frac{\sigma _{\mathrm{W/m^2}}\lambda _{\mathrm{\mu m}}}{c_{\mathrm{\mu m/s}}} \times \sqrt{\frac{R_{\mathrm{nom}}R}{t_{\mathrm{h}}}},
\end{equation}$$
where the subscripts indicate units, t is the observing time, and R ⩽ R nom is the desired spectral resolution. Figure A1 shows the calculated σmJy applied to both the LR and HR modes (the latter smoothed to R = 600) for t h = 1. For the LR mode with R = R nom, t h = 2, λμm = 200 (the wavelength of the OH79 doublet at z = 1.5), and σW/m2 = 1.8 × 10⁻²⁰ (Figure A1), σmJy ≈ 0.25, or σnorm ≈ 1% of the continuum level for a continuum source of F ν = 24 mJy (i.e. Mrk 231 scaled at z = 1.5, see Figure 4). For the HR mode at λμm = 226 (the wavelength of the OH119 doublet at z = 0.9, with R nom = 1.77 × 10³), eq. (A1) with R = 600, t h = 4, and σW/m2 = 2.9 × 10⁻²⁰ (Figure A1) yields σmJy ≈ 1.1, or σnorm ≈ 2.5% of the continuum level for a continuum source of F ν = 45 mJy (i.e. Mrk 231 scaled at z = 0.9, see Figure 6).

Figure A1. Upper: Expected SPICA/SAFARI 1σ-1h sensitivities in low-resolution (LR, red) and high-resolution (HR, blue) modes, at the nominal instrumental resolution (Spinoglio et al. Reference Spinoglio2017; Roelfsema et al., in preparation). Lower: SPICA/SAFARI 1σ-1h sensitivities for flux densities in low-resolution and high-resolution modes, the latter smoothed to R = 600 (see eq. A1).
The 1σ uncertainties of the line fluxes integrated from v
min to v
max (black lines in the left panels of Figures 4 and 6) are calculated according to
 $\sigma _{\mathrm{Jy\,km/s}}=0.5\times 10^{-3} \Delta v_{\mathrm{km/s}} \sqrt{N_{\mathrm{spec}}}\, \sigma _{\mathrm{mJy}}$
, where Δv
km/s is the spectral resolution of the (smoothed) spectrum, and N
spec = 2 × (v
max − v
min)/Δv
km/s is the number of spectral points in the velocity interval (assuming a sampling of 2 points per resolution element).
$\sigma _{\mathrm{Jy\,km/s}}=0.5\times 10^{-3} \Delta v_{\mathrm{km/s}} \sqrt{N_{\mathrm{spec}}}\, \sigma _{\mathrm{mJy}}$
, where Δv
km/s is the spectral resolution of the (smoothed) spectrum, and N
spec = 2 × (v
max − v
min)/Δv
km/s is the number of spectral points in the velocity interval (assuming a sampling of 2 points per resolution element).


