


FFQ are a relatively inexpensive method of measuring usual food intake over an extended period, particularly for large samples, and are commonly used to examine the association between diet and disease. FFQ are easy to administer and have low subject burden, and therefore are the most practical method for dietary data collection. In Australia, the Cancer Council of Victoria FFQ (CCVFFQ)( Reference Ireland, Giles and O’Dea 1 ) version 2 is commonly used, whereas the paper-based and online versions of the Commonwealth Scientific and Industrial Research Organisation FFQ (CSIROFFQ)( Reference Baghurst and Record 2 , Reference Baghurst and Baghurst 3 ) are less frequently administered. The CCVFFQ is a seventy-four single-item, semi-quantitative, machine-scannable FFQ, which is optically scanned to provide g per d of food and nutrient intake. The CSIROFFQ is a quantified FFQ containing 200 items including single foods, mixed dishes, beverages and alcohol; the present study utilised the online version of the CSIROFFQ, which has serving sizes that can be altered by participants.
Keogh et al. ( Reference Keogh, Lange and Syrette 4 ) have previously compared the CCVFFQ version 2 with the paper version of the CSIROFFQ (our study reports on data utilising the same version of the CCVFFQ but the online version of the CSIROFFQ instead of the paper-based version used by Keogh et al. ( Reference Keogh, Lange and Syrette 4 )). The authors reported that there was acceptable agreement between the FFQ for energy, total, SFA and MUFA. Both questionnaires were found to rank the majority of participants in either the same quintile or within one quintile for intake of all nutrients. The authors concluded that there was ‘sufficient agreement’ between the two FFQ for group-level comparisons, but the questionnaires were not interchangeable for estimation of individual intakes. This comparative analysis was conducted in males with a mean age of 55 years.
To date, however, no comparative analysis of the paper-based CCVFFQ and the online version of the CSIROFFQ has been undertaken. Consequently, the aim of our study was to establish the level of agreement between nutrient intakes captured using the online CSIROFFQ and the paper-based CCVFFQ. We hypothesised that both FFQ adequately rank subjects in either the same or adjacent quintile for all nutrients (macronutrients and micronutrients) but are not interchangeable for the estimation of absolute nutrient intakes. The online CSIROFFQ has not previously been compared with other dietary data-collection methods, and as the internet is becoming an increasingly accessible tool for the purpose of recording dietary habits this is an important comparative analysis to undertake. Furthermore, comparison of FFQ can assist with clarifying inconsistencies across studies as well as re-evaluating disease risk.
Methods
Participants
This report describes data from 136 healthy (cognitively ‘normal’) participants taken from the Australian Imaging, Biomarkers and Lifestyle (AIBL) study of ageing( Reference Ellis, Bush and Darby 5 ) who completed the CCVFFQ version 2 (a paper-based FFQ) and the online CSIROFFQ at their 36-month follow-up assessment. The AIBL study is a longitudinal study of 1112 volunteers including healthy controls, those with mild cognitive impairment (MCI) and Alzheimer’s disease (AD). All AIBL volunteers were aged 60 years and above at baseline, and were excluded if they had a history of non-AD dementia, schizophrenia, bipolar disorder, significant current depression, Parkinson’s disease, cancer (other than basal-cell skin carcinoma) within the last 2 years, symptomatic stroke, insulin-dependent diabetes, uncontrolled diabetes mellitus or current regular alcohol use exceeding two standard drinks per d for women or four per d for men. The CCVFFQ and the online CSIROFFQ require estimations of food intake over the previous year; therefore, MCI and AD participants were excluded from this analysis as there is potential for misclassification due to limited accuracy of food intake estimations in these individuals. Further details regarding recruitment, assessment, inclusion and exclusion criteria are described by Ellis et al. ( Reference Ellis, Bush and Darby 5 ). The AIBL study is approved by the institutional ethics committees of Austin Health, St Vincent’s Health, Hollywood Private Hospital and Edith Cowan University( Reference Ellis, Bush and Darby 5 ).
FFQ
The paper-based CCVFFQ is a seventy-four single-item, semi-quantitative, machine-scannable FFQ, which is optically scanned to provide g per d of food and nutrient intakes. In brief, the first page of the four-page FFQ includes questions on how many pieces of fruits and vegetables are consumed daily, amount and type of milk and bread eaten, type of spread used, amount of sugar consumed daily, weekly egg intake and type of cheese consumed. The second page consists of four sets of photos depicting serving sizes. Pages three and four contain lists of foods with ten frequency intake options ranging from ‘never’ to ‘three or more times per d’. The foods on these pages are divided into the following categories: (1) cereals, snacks and sweets; (2) dairy products, meat and fish; (3) fruits; (4) vegetables; and (5) alcohol. The CCVFFQ has been validated relative to 3-d weighed food records in 118 participants from Adelaide, Australia (45 % male)( Reference Xinying, Noakes and Keogh 6 ), but is known to not capture intakes of some common foods such as soft drinks and snack foods( Reference Xinying, Noakes and Keogh 6 ). The completed questionnaires were analysed by the Cancer Council in Carlton, Victoria. The food composition data used to calculate daily nutrient intake originate from the Nutrient Tables for use in Australia 1995 (NUTTAB95)( Reference Lewis, Milligan and Hunt 7 ).
The online CSIROFFQ utilised in this study is a quantified FFQ capturing intakes of 200 items including single foods, mixed dishes, beverages and alcohol. The online version also includes options for serving sizes, which can be altered by the respondents, as well as a series of qualitative questions related to food preparation and cooking techniques, the use of salt, the use of sugar in beverages, type of milk used, type of bread consumed and type of fats used as spread or in cooking. Serving size options vary from question to question depending on the food of interest – for example, a question regarding muesli intake offers ten serving size options ranging from ‘never’ to ‘more than three cups’ – as well as a frequency option for intake (a number ranging from one to ten) delineating time period (never, rarely, year, month, week or day); a possible answer format could be two cups of muesli eaten three times per week. Foods are arranged into categories, and to avoid fatigue the online FFQ automatically saves the data entered allowing participants to leave the questionnaire and return later to complete it in multiple sittings. The online version eliminates incomplete questionnaires, as participants cannot move to the next section until all questions are fully answered in the current section. The paper form of the CSIROFFQ has previously been validated and used for reliability studies( Reference Lassale, Guilbert and Keogh 8 – Reference Rohan, Record and Cook 12 ); however, to our knowledge, no validation of the online version has been undertaken. Lassale et al. ( Reference Lassale, Guilbert and Keogh 8 ) validated the paper-based CSIROFFQ relative to two 4-d weighed food records in seventy-four women (aged 31–60 years) in Adelaide, Australia, whereas Ambrosini et al. ( Reference Ambrosini, Mackerras and de Klerk 9 , Reference Ambrosini, de Klerk and O’Sullivan 10 ) initially validated the paper-based CSIROFFQ relative to four 7-d food records in twenty-four females (mean age 49 years) and forty-eight males (mean age 55 years) from Western Australia, Australia, and following this in 785 14-year olds (51 % male) in Western Australia, Australia, using a 3-d food record. Food composition data used to analyse the participant responses to the online FFQ are derived from the Australian Food and Nutrient Database 2007 (AUSNUT 2007). AUSNUT 2007 contains analytical data published in Nutrient Tables for use in Australia 2006 (NUTTAB 2006) and from the Food Standards Australia New Zealand 2006 (FSANZ 2006) analytical programme, food label information, imputed data from similar foods and data calculated using a recipe approach.
The paper-based CCVFFQ takes approximately 10 min to complete, whereas the online CSIROFFQ takes approximately 45 min to complete and requires access to the internet. Both questionnaires assess usual daily intake over the preceding 12 months. Participants completed the CCVFFQ when they attended the research centre for their 36-month follow-up assessment, during which time they also were given the instructions on how to complete the online CSIROFFQ, which was then completed within the next few days. Online Supplementary Table S1 in the online supporting material compares the items included in the CCVFFQ with those included in the online CSIROFFQ for a range of categories.
Statistical analysis
All the statistical analyses were performed using IBM SPSS Statistics 19 for Windows Vista (SPSS Inc.). A P value of 0·01 or smaller determined a significant result to balance the risk of type I and type II errors due to the large number of statistical tests performed.
Mean values, standard deviations and percentages are provided for the demographics for the entire cohort as well as following stratification of the cohort by sex (Table 1). Demographic group differences were evaluated using independent sample t tests for continuous variables and χ 2 analysis for categorical variables. The raw data for the majority of nutrients was not normally distributed; logarithmic transformation produced normalised data for all nutrients that maximised the Kolmogorov–Smirnov test statistic. Following log transformation, the data were energy-adjusted (except the energy data itself) using linear regressions.
Table 1 Descriptive statistics for the healthy control cohort who completed the Cancer Council of Victoria FFQ (CCVFFQ) and the Commonwealth Scientific and Industrial Research Organisation FFQ (CSIROFFQ) and the subgroups of the cohort following stratification of the cohort by sex (Mean values and standard deviations; numbers and percentages)
* Statistically significant at P<0·01. Characteristics compared using independent-samples t test for continuous variables and χ 2 for categorical variables.
Raw data were used to calculate mean values and standard deviations for the twenty-six nutrients common to both FFQ. Mean percentage agreement between the two intakes from both FFQ was established individually for each participant for each nutrient by subtracting the CCVFFQ nutrient data from the online CSIROFFQ and dividing by 1 % of the online CSIROFFQ value. An overall mean agreement was calculated by summing all the individual percentages for each nutrient and dividing by 136 (the number of participants in this study)( Reference Ambrosini, de Klerk and O’Sullivan 10 ). Bivariate Pearson’s correlation coefficients were calculated for the log-transformed and energy-adjusted nutrient data to estimate the associations between the two FFQ.
Agreement between both questionnaires was assessed using Bland–Altman plots( Reference Bland and Altman 13 ) and 95 % limits of agreement (LOA; the mean difference±2 sd for the difference between the two measurements). Bland–Altman plots represent the individual differences between the two measurements graphed against the mean of the measurements. Interpretation of the Bland–Altman results was based on three categories – ‘good agreement’, ‘fairly good agreement’ and ‘poor agreement’ – depending on whether the difference between the two measurements is approximately equal to 1, 2 or 3 sd of the average nutrient intake, respectively. As dietary intakes were log-transformed for the agreement analysis, anti-logging rendered the LOA as a ratio – that is, a multiple of the CCVFFQ relative to the online CSIROFFQ. LOA were expressed as a percentage. LOA of 50–200 % would indicate that 95 % of all subjects’ CCVFFQ estimates were between half and two times their CSIROFFQ estimate. Least products regression analysis was used to regress CSIROFFQ intake on CCVFFQ intake. The regression estimates of the intercept and slope were used to determine the presence of fixed and proportional bias( Reference Ludbrook 14 ). Fixed bias occurs when one FFQ gives values that are higher or lower than the second FFQ by a constant amount, and proportional bias occurs when agreement between the two FFQ varies with the magnitude of intakes for all nutrients. Significant fixed bias exists when the 95 % CI of the intercept does not contain 0, and significant proportional bias exists when the 95 % CI of the slope does not contain 1.
The agreement between the relative rankings of the questionnaires was assessed by classifying subjects into quintiles and cross-tabulating (using the log-transformed and energy-adjusted data). Weighted κ statistics were calculated for the strength of agreement. All the analyses were repeated following stratification of the cohort by sex.
Online Supplementary Table S2 in the online supporting material lists the statistical methods used in this study and details what each method is assessing in terms of comparing similarity in estimates of nutrient intake between the two FFQ.
Results
The cohort comprised 136 participants (35 % male) with an average age of 73·2 (sd 11·6) years. A total of 74 % of the cohort was born in Australia and nearly half had 12 or less years of education. When comparing males and females, males had significantly higher energy intakes recorded using the CCVFFQ (Table 1).
For those nutrients common to both FFQ, riboflavin and cholesterol were closest to exact mean percentage agreement at 102 and 97 %, respectively. Ca, retinol, riboflavin and SFA had a mean percentage agreement >100 %, denoting lower values in the online CSIROFFQ than in the CCVFFQ (between 2 and 150 % lower values in the CSIROFFQ than in the CCVFFQ; for example, retinol had a mean percentage agreement of 250 %, indicating that retinol values were 150 % lower in the online CSIROFFQ than in the CCVFFQ). Mean percentage agreement for all the nutrients ranged from 35 % for folate to 250 % for retinol (Table 2).
Table 2 Mean, standard deviation, percentage agreement, Pearson’s correlation coefficients, limits of agreement, slope, fixed and proportional bias and level of agreement for nutrient intakes determined using the Commonwealth Scientific and Industrial Research Organisation FFQ (CSIROFFQ) and the Cancer Council of Victoria FFQ (CCVFFQ) (Mean values and standard deviations)
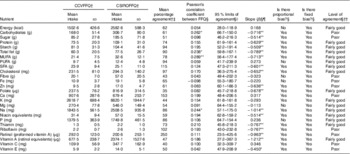
* P<0·01, ** P<0·001.
† Uses raw data.
‡ Mean percentage agreement between the two FFQ for the twenty-six nutrients common to both FFQ calculated by subtracting the CCVFFQ nutrient data from the CSIROFFQ and dividing by 1% of the CSIROFFQ value. Overall mean agreement calculated by summing all the individual percentages for each nutrient and dividing by 136 (the number of participants in this study).
§ Uses log transformed and energy adjusted data.
|| Limit of agreement calculated as mean difference±sd of difference×1·96. Limits of agreement tell us how far apart measurements by the two FFQ are likely to be for most individuals.
¶ Slope of average of methods regressed on difference between the methods. Confidence interval of the slope is utilised when assessing whether fixed bias is present.
†† ‘Good agreement’ – the difference between the two FFQ measurements is approximately equal to 1 sd of the average nutrient intake. ‘Fairly good agreement’ – the difference between the two FFQ measurements is approximately equal to 2 sd of the average nutrient intake. ‘Poor agreement’ – the difference between the two FFQ measurements is approximately equal to 3 sd of the average nutrient intake.
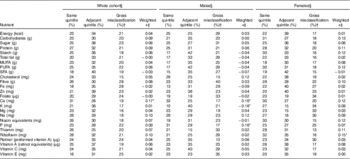
Following stratification of the cohort by sex, Ca and retinol had a mean percentage agreement over 100 % in females (equating to higher levels of these nutrients recorded by the CCVFFQ compared with the online CSIROFFQ). In males, Ca, retinol, riboflavin, total fat, Na, starch as well as MUFA, PUFA and SFA had >100 % mean percentage agreement. Mean percentage agreement ranged from 30 % (folate) to 222 % (retinol) in females and from 44 % (folate) to 301 % (retinol) in males. Cholesterol and SFA were closest to 100 % in females at 97 %, and for males P (98 %) and cholesterol (95 %) were closest to 100 % mean percentage agreement between the two FFQ (Table 3).
Table 3 Mean, standard deviation, percentage agreement and Pearson’s correlation coefficients for nutrient intakes determined using the Commonwealth Scientific and Industrial Research Organisation FFQ (CSIROFFQ) and the Cancer Council of Victoria FFQ (CCVFFQ) following stratification of the cohort by sex (Mean values and standard deviations)
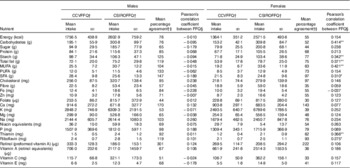
* P<0·01, ** P<0·001.
† Uses raw data.
‡ Mean percentage agreement calculated by subtracting the CCVFFQ nutrient data from the CSIROFFQ and dividing by 1 % of the CSIROFFQ value. Overall mean agreement calculated by summing all the individual percentages for each nutrient and dividing by 136 (the number of participants in this study).
§ Uses log-transformed and energy-adjusted data.
Bivariate Pearson’s correlation coefficients estimating the relationship of the nutrient intakes between the two FFQ ranged from 0·042 (vitamin E) to 0·289 (MUFA) for the cohort as a whole. In addition to MUFA, carbohydrates, total fat and Na were significantly correlated. As expected, all significant correlations were positive; as the level of nutrient intake documented using the CCVFFQ increased, the intake level documented using the online CSIROFFQ correspondingly increased (Table 2). When stratified by sex, no significant correlations were observed in males. All the correlations observed in the cohort as a whole were also seen in females, except for the correlation with Na. Females also exhibited positive correlations for starch (r 0·342, P<0·001), SFA (r 0·310, P<0·01), thiamin (r 0·366, P<0·001) and riboflavin (r 0·275, P<0·01; Table 3) intakes.
For the cohort as a whole, agreement between both questionnaires with respect to nutrient intake was assessed using Bland–Altman plots( Reference Bland and Altman 13 ) and 95 % LOA. Sixteen of the twenty-six nutrients common to both the FFQ showed ‘fairly good agreement’ (thiamin, cholesterol, energy, total fat, folate, K, Mg, Na, niacin equivalents, P, protein, vitamin A, starch as well as MUFA, PUFA and SFA; see Table 2 and representative Fig. 1(a) and 1(b)), whereas the remaining ten nutrients showed ‘poor agreement’ (fibre, carbohydrates, riboflavin, Ca, Fe, retinol, sugar, vitamins C and E and Zn; see Table 2 and representative Fig. 1(c) and 1(d)). The LOA indicated that the CCVFFQ could either underestimate or overestimate several nutrient intakes by at least 50 % of the online CSIROFFQ estimate (wide LOAs) – for example, an individual with a CSIROFFQ fibre intake of 57·02 could have a CCVFFQ fibre estimate anywhere between 28·17 (49·4 %) and 115·35 (202·3 %). Particularly wide LOA were observed for vitamin A (retinol equivalents), retinol (preformed vitamin A), PUFA, cholesterol, riboflavin and vitamin C (Table 2).
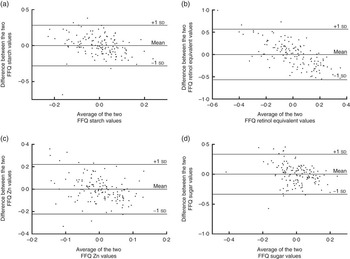
Fig. 1 Bland–Altman plots demonstrate examples of ‘fairly good agreement’ (a, b) and ‘poor agreement’ (c, d) of nutrient intakes determined using the self-report paper-based Cancer Council of Victoria and online Commonwealth Scientific and Industrial Research Organisation FFQ. The difference in intake of nutrients between the two FFQ is plotted against the average intake of the two FFQ for each individual. The upper horizontal line shows 1 sd above the mean intake, the middle horizontal line is the mean intake and the lower horizontal line shows 1 sd below the mean intake.
Least products regression analysis was used to regress online CSIROFFQ nutrient intake on CCVFFQ nutrient intake for the cohort as a whole. The regression estimates of the intercept and slope were used to determine the presence of fixed bias and proportional bias( Reference Ludbrook 14 ). There was significant evidence of fixed bias for all the nutrients. There was significant evidence of proportional bias for all the nutrients except fibre, energy, Fe, Mg, P and PUFA (Table 2). The direction of the slope informs whether the FFQ show poorer agreement at low intakes or high intakes. There was significantly poorer agreement between the nutrient levels from the two FFQ at low intakes (negative slope in differences) for all the nutrients except fibre, Fe, K and Mg, which had a negative slope that lacked significance, and Ca, energy, P, vitamin C and PUFA, which had a non-significant positive slope (positive slope in difference implies poorer agreement between the two intakes at high levels of intake; Table 2).
We also assessed how the ranking of our participants into five groups (quintiles) of nutrient intake levels compared between the two questionnaires for the cohort as a whole (Table 4). The ranking analysis indicated that between 47 and 63 % of the subjects (average 56 %) were classified into either the same or adjacent nutrient quintiles in both FFQ (% in same quintile+% in adjacent quintile), with the highest percentage observed for sugar, vitamin A and starch. The FFQ grossly misclassified (disagreement by three or four quintiles) 15–28 % of the subjects (average 21 %), with the highest misclassification seen for fibre and Fe. The strength of agreement between the two FFQ was ‘slight’ (weighted κ<0·20) for all the nutrients (Table 4). When stratified by sex, females had a slightly higher average percentage of individuals classified into either the same or adjacent nutrient quintiles than males (56 compared with 53 %). The ranking agreement was the highest for riboflavin and vitamin A in females, and for vitamin C and Zn in males. The ranking agreement was the lowest for Mg and folate in females and thiamin and folate in males. In females, the FFQ grossly misclassified between 13 and 34 % of the subjects (average 21 %) depending on the nutrient, with the highest percentage misclassification observed for folate and K intake. In males, the FFQ grossly misclassified 13–40 % of the subjects (average 25 %) depending on the nutrient, with the highest percentage misclassification observed for fibre intake. The strength of agreement between the two FFQ was ‘slight’ (weighted κ<0·20) for all the nutrients for both males and females (Table 4).
Table 4 Quintile cumulative percentage agreement between nutrient intakes determined from the Commonwealth Scientific and Industrial Research Organisation FFQ (CSIROFFQ) and the Cancer Council of Victoria FFQ (CCVFFQ) in the cohort as a whole and following stratification of the cohort by sex
* P<0·01.
† Gross misclassification=disagreement by three or four quintiles.
‡ Weighted κ measures the degree of disagreement between the nutrient intakes from the two FFQ.
§ All results reported using log-transformed and energy-adjusted data.
Discussion
The aim of our study was to establish the level of agreement between nutrient intakes captured using the online CSIROFFQ and the paper-based CCVFFQ. Of the nutrients analysed, reported intakes of Ca, retinol, riboflavin and SFA were higher in the CCVFFQ than in the online CSIROFFQ, as shown by mean percentage agreement. Following stratification of the cohort by sex, in females, only Ca and retinol intakes had higher levels reported in the CCVFFQ compared with the CSIROFFQ, and in males the intake levels of the four nutrients seen in the cohort as a whole, as well as total fat, Na, starch and MUFA and PUFA intakes, had higher levels reported in the CCVFFQ compared with the CSIROFFQ.
As expected, all bivariate Pearson’s correlations between nutrient intakes reported using the two questionnaires were positive. Nutrient intake levels that were significantly correlated between the two FFQ were carbohydrates, total fat, Na and MUFA in the cohort as a whole. In females, nutrient intake levels for carbohydrates, total fat, MUFA, SFA, starch, riboflavin and thiamin were significantly positively correlated between the two FFQ. There were no significant correlations observed in males.
We used three methods to assess absolute nutrient intake agreement between the two FFQ. First, the Bland–Altman plots assessing agreement of nutrient intake between the two FFQ revealed that sixteen of the twenty-six nutrients common to both FFQ showed ‘fairly good agreement’ between the two questionnaires, and the remaining ten nutrients and minerals showed ‘poor agreement’. Second, LOA indicated that the CCVFFQ could underestimate or overestimate several nutrient intakes by at least 50 % of the online CSIROFFQ intake level. Finally, assessment of bias between reported intakes indicated that for all nutrient intakes one FFQ gives values that are higher or lower than the second FFQ by a constant amount (fixed bias), and agreement between the two FFQ varied with the magnitude of intakes for all nutrients except fibre, energy, Fe, Mg, K and PUFA (proportional bias); proportional bias is concerning as it is difficult to correct for. Evidence of proportional bias has been seen for the majority of nutrient intakes assessed in previous studies where the paper version of the CSIROFFQ was compared with other instruments( Reference Lassale, Guilbert and Keogh 8 , Reference Ambrosini, de Klerk and O’Sullivan 10 ).
Finally, we examined the ranking of individuals into quintiles depending on their nutrient intake levels and compared quintiles between the two FFQ. The instruments showed a modest ability to rank subjects into the same or adjacent quintiles. On average, for all the nutrients common to both questionnaires, 56 % of the participants were classified into the same or adjacent quintiles in both FFQ, with the highest percentage agreement for sugar, vitamin A and starch. On average, 21 % of the participants were grossly misclassified by three or four quintiles, with the highest misclassification observed for fibre and Fe. In the validation study by Lassale et al. ( Reference Lassale, Guilbert and Keogh 8 ), approximately 70 % of the participants’ intakes reported using the paper-based CSIROFFQ were in the same or adjacent quintiles as intakes captured using weighed food records. Ambrosini et al. ( Reference Ambrosini, de Klerk and O’Sullivan 10 ) used tertiles instead of quintiles during validation of the paper-based CSIROFFQ, and found that the paper-based CSIROFFQ classified 80 to 90 % of 14-year olds’ nutrient intakes into the same or adjacent tertiles as their food record. In the present study, quintile agreement was similar to that reported in other studies, and, consistent with these studies, we concluded that the paper-based CCVFFQ and online CSIROFFQ are both suitable tools for assessing high and low nutrient intakes( Reference Lassale, Guilbert and Keogh 8 ), thereby yielding valuable information. Use of either FFQ is not, however, appropriate for obtaining accurate estimates of absolute nutrient intakes. Importantly, for epidemiological purposes, ranking of individuals may be more critical than determining absolute intakes. FFQ are commonly used in studies to examine the association between diet and disease( Reference Cade, Burley and Warm 15 ), and for these studies the ability of the FFQ to rank individuals on usual nutrient intakes may be the important issue in deciding whether the FFQ will give reliable results as opposed to its ability to estimate absolute intakes. Dietary patterns are an example of when ranking of an individual’s intake is utilised to investigate the association between diet and disease; dietary patterns can use median intake values to assign individuals a binary score for inclusion into a dietary pattern score. Dietary patterns are becoming an increasingly favourable method utilised in diet and disease research, as there is accumulating evidence to suggest that components in the foods we consume interact with each other to impart disease protection, and therefore it may be more useful to examine indices of food and nutrient intake such as dietary patterns that express several related aspects of the diet concurrently rather than focus on consumption of single nutrients( Reference Jacobs, Gross and Tapsell 16 ).
There are some important differences in the results of the comparison between nutrient intake levels when the cohort was stratified by sex, and it is, therefore, possible that the FFQ perform differently in men and women, suggesting sexes should be analysed separately. These differences could be due to males consuming larger quantities of food than females, or our results could be influenced by the increased number of females in this study compared with males (eighty-eight females and forty-eight males). A difference in performance between sexes has been noted previously when analysing the paper version of the CSIROFFQ( Reference Ambrosini, Mackerras and de Klerk 9 ). We observed a 30 % higher energy intake in the online CSIROFFQ compared with the CCVFFQ, and no significant difference between male and female energy intakes in the online CSIROFFQ, which was unexpected. Potentially, the online CSIROFFQ is overestimating energy intake, particularly in females (it has been reported previously that females are more likely to overestimate nutrient intakes via FFQ( Reference Ambrosini, de Klerk and O’Sullivan 10 )), thereby explaining the low percentage agreement between the energy intake from the online CSIROFFQ and the CCVFFQ, and the non-significant difference in online CSIROFFQ energy intake between sexes: validation of the online CSIROFFQ will further elucidate these previously unreported findings. Ambrosini et al. ( Reference Ambrosini, Mackerras and de Klerk 9 ) found expected energy intakes using the paper-based CSIROFFQ (7271·8 (sd 2230·1) kJ (1738 (sd 533) kcal) in women and 8878·4 (sd 2288·6) kJ (2122 (sd 547) kcal) in males), and therefore these energy intake discrepancies could be an issue associated only with the online version of the FFQ.
It has been shown that long lists of fruits and vegetables in FFQ tend to overestimate fruit and vegetable consumption. When a large number of food items represent a food group within a questionnaire, the total frequency estimate from that food group is likely to be inflated( Reference Krebs-Smith, Heimendinger and Subar 17 ). Such long lists may account for the higher estimates of fibre and vitamins A and C recorded using the online CSIROFFQ compared with the CCVFFQ in our study, particularly when considering the increased number of questions relating to fruit and vegetable intake included in the online CSIROFFQ compared with the CCVFFQ. Further, Ca and retinol both had higher consumption in the CCVFFQ than in the online CSIROFFQ in males and females, which is challenging to explain. Both the online CSIROFFQ and the CCVFFQ do not contain questions regarding liver, the main source of retinol; therefore, estimations of retinol consumption must be derived from other sources including egg, milk, butter, cheese, yoghurt, cream and oily fish. As retinol sources are found in high concentrations in a limited number of foods, estimates of intake are likely to be sensitive to small variations in estimated consumption of these foods. Many of these retinol sources are common to the main sources of Ca, including dairy products and oily fish. Higher CCVFFQ intakes or lower online CSIROFFQ intakes of these nutrients has not been observed previously; however, it is possible that retinol and Ca are underestimated in these common food sources in the online CSIROFFQ; future validation studies of the online CSIROFFQ will investigate this further.
Our analysis used more than one statistical approach to evaluate nutrient intake agreement between the two questionnaires. We utilised the three most commonly used statistical methods: correlations, the Bland–Altman method and κ statistics( Reference Cade, Burley and Warm 15 ). Both of our FFQ were designed to assess nutrient intake in Australian populations. Nearly three-quarters of our cohort were born in Australia, and all reside in Australia, which increases the validity of our results. It is necessary to develop specific FFQ for the population being studied to accurately reflect regional variations in local foods, as well as cultural and seasonal differences. Cultural influences lead to differences in the habitual consumption of certain foods and in traditions of preparation, and in certain cases can lead to restrictions such as exclusion of meat and milk from the diet( Reference Steptoe, Pollard and Wardle 18 ).
The two FFQ compared in this study used different versions of NUTTAB in their analysis, which represents a limitation when comparing the results: the CCVFFQ uses the 1995 version and the CSIROFFQ uses the updated 2006 version. NUTTAB 2006 has several differences compared with the 1995 version – for example, nutrient information is continually gathered, and therefore products from the 1995 NUTTAB version have been updated as they were re-analysed for the 2006 version( Reference Sobolewski, Cunningham and Mackerras 19 ). Owing to the differences, the resulting nutrient profile of some foods will vary between FFQ, which could impact our nutrient levels and comparative analysis – for example, in our ranking analysis, fibre had one of the highest misclassification percentages for the twenty-six nutrients assessed: fibre intake was higher in the online CSIROFFQ compared with the CCVFFQ. This difference could be explained, in part, by the updated NUTTAB version used to analyse the online CSIROFFQ, which could include new fibre sources in the foods included in the online CSIROFFQ. A recommendation for the future would be to update the analysis of the CCVFFQ responses with the use of the NUTTAB 2006 version, and, following this, repeat the comparison analysis.
The original paper-based CSIROFFQ (which the online version we have used in this study was produced from) has previously been compared with food records to evaluate its ability to calculate nutrient intake. All the studies found the paper CSIROFFQ poor at measuring absolute nutrient intakes, but able to correctly rank a reasonable proportion of the nutrients into exact or within one quintile difference( Reference Keogh, Lange and Syrette 4 , Reference Lassale, Guilbert and Keogh 8 – Reference Ambrosini, de Klerk and O’Sullivan 10 , Reference Amanatidis, Mackerras and Simpson 20 ). Lassale et al. ( Reference Lassale, Guilbert and Keogh 8 ) compared intake against two 4-d weighed food records from sixty-two women aged 31–60 years. Agreement was demonstrated for percentage dietary energy, protein, fat, carbohydrate, thiamin, riboflavin, Mg and Fe. The authors concluded that these are important nutrients, and therefore the paper version of the CSIROFFQ may be a useful tool in this respect. However, relative intake agreement was ‘fair’ to ‘moderate’, with approximately 70 % of the nutrients in exact or within one quintile difference. Ambrosini et al. ( Reference Ambrosini, de Klerk and O’Sullivan 10 ) evaluated the paper CSIROFFQ in comparison with 3-d food records for 785 14-year-old Western Australians. Limits of agreement ranged from 27 % for retinol to 976 % for carotene, with most nutrients being overestimated by the FFQ. For most nutrients, agreement between the two methods varied significantly with the magnitude of intake, but the FFQ classified 80 to 90 % of subjects’ nutrient intakes into the same or adjacent tertiles as their food record. Our results are in agreement with the comparison of the paper CSIROFFQ with the CCVFFQ version 2 previously completed by Keogh et al. ( Reference Keogh, Lange and Syrette 4 ), who concluded that there was sufficient agreement between the two FFQ for group-level comparisons, but that they were not interchangeable for estimation of individual intakes. This analysis was also carried out in an Australian population, but used only males, whereas our study also included females with the sexes additionally analysed separately.
To our knowledge, there are few previous studies comparing an online FFQ with a paper-based FFQ. Forster et al. ( Reference Forster, Fallaize and Gallagher 21 ) compared nutrient and food group intakes from the online Food4Me FFQ and the paper-based European Prospective Investigation into Cancer Norfolk (EPIC-Norfolk) FFQ in 113 participants with a mean age of 30 years (41 % male). Quintile agreement ranged from 77 to 97 % for nutrients (with the highest percentage agreement for alcohol and lowest percentage for energy from PUFA) and from 77 to 99 % for food groups. Unadjusted correlations for nutrient intakes ranged between 0·43 and 0·86 and ranged between 0·41 and 0·90 for food groups. The authors stated that the online FFQ had good agreement with the paper-based FFQ, and concluded that both FFQ are useful for ranking individuals based on nutrient and food group intakes. Thirty-nine students (23 % men, aged between 20 and 32 years) in Spain completed a paper-based version and an online version of the same FFQ, 3-weeks apart: both versions of this FFQ were designed by the study authors. The median dietary intakes were significantly higher for the paper-based FFQ for energy, protein, carbohydrates and fats; however, there were no differences when the consumption of food groups were calculated, except for beverages and pre-cooked groups. The authors concluded that the differences could be due to inaccurate estimations of reported portion sizes in the paper-based FFQ as, unlike the CCVFFQ used in this study, photographs of portion sizes were not presented( Reference Gonzalez Carrascosa, Garcia Segovia and Martinez Monzo 22 ). Similar to the Spanish study described above, the Block Health Habits and History Questionnaire was administered to thirty-one older females (mean age 58·2 years) in a paper-based and online format. The authors found that the online format had ‘adequate reliability’ when compared with the paper-based version, with only vitamin C and Fe falling below the acceptable standards. The authors concluded that the online format was a feasible tool for older women to self-administer( Reference Boeckner, Pullen and Walker 23 ). When considering the results of our own study, which compares nutrient intakes recorded using a paper-based and an online FFQ, it is important to note that, although care was taken to ensure that all the questions within the paper-based FFQ were answered by each participant (the online version cannot be submitted with unanswered questions) and that the older adults who participated in the study were comfortable using a computer to complete the online FFQ (or were assisted by researchers if they were uncomfortable), we cannot ignore the fact that there may be innate differences associated with comparing self-reported dietary intake recorded using a paper-based and online FFQ. For example, the larger number of food items and increased prompting associated with the drop-down menus in the online FFQ utilised in this study may incite overreporting of some foods compared with the paper-based FFQ, which may subsequently impact on the results of our study. Future validation of online CSIROFFQ responses using weighed food records in our cohort will help address these concerns.
The present study adds to previous studies, as it utilises the online CSIROFFQ, which has not been compared with any other instruments until now. This is an important, novel study, particularly when considering the fact that the internet is becoming an increasingly accessible method for use in dietary studies. Future studies are required to examine how questionnaires should be improved to discriminate dietary exposure categories adequately. Further refinement and validation of current methodologies could help both to explain inconsistencies across studies and to re-evaluate disease risk.
Acknowledgements
The authors thank Dr Malcolm Riley for his critical review of the manuscript. They also thank all those who participated in the AIBL study for their commitment and dedication to help advance Alzheimer’s disease research.
S. L. G. was supported by a University Postgraduate Award from the Dementia Collaborative Research Centres programme at the time of preparing this manuscript. Funding for the study was provided by the CSIRO Flagship Collaboration Fund and the Science and Industry Endowment Fund (SIEF) in partnership with Edith Cowan University (ECU), The Florey Institute of Neuroscience and Mental Health, Alzheimer’s Australia (AA), National Ageing Research Institute (NARI), Austin Health, CogState Ltd., Hollywood Private Hospital and Sir Charles Gairdner Hospital. The study also received funding from the National Health and Medical Research Council (NHMRC), the Dementia Collaborative Research Centres programme (DCRC2) and the McCusker Alzheimer’s Research Foundation as well as Operational Infrastructure Support from the Government of Victoria.
S. L. G., S. R. R. S., K. T., A. R., P. M., K. A. E., C. L. M., S. L. M., C. C. R., D. A. and R. N. M. designed the study; S. L. G. conducted the research; S. L. G. analysed the data; S. L. G., S. R. R. S. and J. B. K. wrote the paper; J. B. K. contributed to the development of the online CSIROFFQ; S. L. G. had primary responsibility for the final content; and all the authors read and approved the final version of the manuscript.
There are no conflicts of interest to declare.
Supplementary material
For supplementary material/s referred to in this article, please visit http://dx.doi.org/doi:10.1017/S0007114515003335


