


Living in an Arctic environment challenges Ca homoeostasis in two ways. First, sun exposure is limited with low dermal production of vitamin D. Second, the traditional Inuit diet is mainly of marine origin and a poor source of Ca.
As for vitamin D, the endogenous production of 25-hydroxyvitamin D (25OHD) depends on exposure to sunlight, and serum 25OHD levels in groups of Caucasian subjects decrease with increasing latitude( Reference Holick 1 – Reference Hagenau, Vest and Gissel 3 ). Thus, 25OHD levels should be low in Greenland Inuit( Reference El Hayek Fares and Weiler 4 , Reference Andersen, Jakobsen and Rex 5 ) and it may have been a favourable trait for Arctic residents to develop mechanisms in order to adapt to lower levels of serum 25OHD( Reference Andersen, Jakobsen and Rex 5 – Reference Andersen, Laurberg and Hvingel 7 ). Diet is another source of 25OHD, with fish and sea mammals being particularly rich in vitamin D( Reference Keiver, Draper and Ronald 8 , Reference Lu, Chen and Zhang 9 ). These dominate the traditional Inuit diet( Reference Andersen, Jakobsen and Rex 5 , Reference Kuhnlein, Receveur and Soueida 10 , Reference Andersen, Hvingel and Kleinschmidt 11 ), with seal and whale blubber considered to be of particular dietary value by the Inuit. The intake of these Arctic dietary components has the potential to compensate for the limited dermal 25OHD production in Arctic residents( Reference Andersen, Jakobsen and Rex 5 , Reference Andersen, Jakobsen and Laurberg 12 ). However, this does not provide an alternative source of Ca that is sparse in the dietary components that comprise the traditional Inuit diet. Thus, Canadian Inuit and Alaska Natives reported a low Ca intake( Reference Sharma, Hopping and Roache 13 , Reference Johnson, Nobmann and Asay 14 ), and a low dietary Ca content in local foods in Greenland( Reference Deutch, Dyerberg and Pedersen 15 ) was speculated to be the cause for low serum Ca in Greenland Inuit( Reference Jeppesen and Harvald 16 ).
Ca intake has a limited impact on short-term Ca status of an individual as Ca level in serum is maintained within narrow limits by powerful endocrine control mechanisms( Reference Bringhurst, Demay and Kronenberg 17 ). These interactive homoeostatic mechanisms may have adapted to short-term low Ca intake, whereas long-term low Ca intake maintains importance for the occurrence of diseases. Thus, low parathyroid hormone (PTH) with hypocalcaemia associates with low bone turnover, infections, IHD and dental enamel hypoplasia( Reference Bringhurst, Demay and Kronenberg 17 ). Greenland Inuit have been reported to have a high occurrence of osteoporotic fractures( Reference Sorensen, Wojtek and Pedersen 18 ), severe infections( Reference Meyer, Ladefoged and Poulsen 19 ), a distinct rise in the occurrence of IHD( Reference Kjaergaard, Andersen and Holten 20 , Reference Jorgensen, Bjerregaard and Kjaergaard 21 ) and dental diseases( Reference Petersen and Christensen 22 ). These diseases may be related to long-term low Ca intake despite being managed short term by an adaption of the homoeostatic mechanisms.
This led us to explore the associations between Ca, PTH and 25OHD in serum among Greenlanders and non-Greenlanders living in the capital city Nuuk in West Greenland and in the rural Ammassalik district in East Greenland as major players in Ca homoeostasis include PTH and vitamin D.
Methods
Area of investigation, subjects and procedures
We included subjects living in Ammassalik district (65°35'N 38°00'W) in East Greenland or in the capital city Nuuk in West Greenland (64°15'N 51°35'W).
We invited 50- to 69-year-old men and women, Greenlanders (all Inuit) and not Greenlanders (all Caucasian Danes), recorded, selected and living on the address as described in detail previously( Reference Andersen, Laurberg and Hvingel 7 , Reference Andersen, Hvingel and Kleinschmidt 11 ). The places selected for investigation were Nuuk, Tasiilaq and the settlements Tiniteqilaaq, Sermiligaaq, Kulusuk and Kuummiut in Ammassalik district. Only settlements with more than fifteen inhabitants in the selected age group were included. In Nuuk, names and addresses were obtained from the hospital registration system that keeps records of all inhabitants of Nuuk. A random sample of 25 % of the total population aged 50–69 years was selected. The hospital registration system had not been regularly updated and for the investigation in Ammassalik names and addresses were obtained from the National Civil Registration System in which every person living in Denmark, the Faeroe Islands and Greenland is registered. We invited 225 persons in Nuuk, 184 in Tasiilaq, nineteen in Tiniteqilaaq, twenty-eight in Sermiligaaq, fifty-two in Kulusuk and fifty-three in Kuummiut, and 95 % participated. A Greenlander was defined as an individual born in Greenland with both parents born in Greenland and is hereafter named Inuit.
This study was conducted according to the guidelines laid down in the Declaration of Helsinki, and the Commission for Scientific Research in Greenland approved the procedures (reference no. 2010–8). All subjects gave informed written consent in Danish or Greenlandic by participant choice.
The local hospital porter or the nursing station attendant delivered a letter of invitation. The investigation took place at the local hospital or nursing station or by request as home visits. The physical examination performed included height without shoes, weight in indoor clothing and recording of major disabilities. Participants were interviewed by a Greenlandic interpreter or by one of the investigating doctors completing a questionnaire in either Danish or Greenlandic as appropriate for the participant. Information regarding age and sex was obtained from the National Civil Registration System. Information on lifestyle patterns and dietary habits was obtained by questionnaires. Questions were asked as written in the questionnaires. The same interpreter was used at all sites.
Dietary habits
Dietary habits were assessed using an interview-based FFQ. It included seven traditional Inuit (seal, whale, wild fowl, fish, reindeer, musk ox and hare) and seven imported food items (pre-cooked meals, potatoes, vegetables, butter, cheese, egg and fresh fruit). These were selected based on their contribution to the diet in Greenland( Reference Pars 23 ). Each food item was categorised into one of six frequency categories from never to daily intake. A frequency score was calculated based on the average number of days per month it was ingested( Reference Andersen, Laurberg and Hvingel 7 , Reference Pars 23 ). Inuit food items scored positively and imported food items scored negatively. The sum of frequency scores for all food items consumed by each participant was calculated and individuals were categorised into quintiles – diet group 1: >80 % Inuit food item scores; 2: 60–80 %; 3: 40–60 %; 4: 20–40 %; 5: <20 % Inuit food item scores. The scale was based on high scores for predominantly traditional Inuit food items and low scores for imported food items. Scores were validated by cross-check questions, as well as by the use of iodine as a biomarker of the intake of the iodine-rich traditional Inuit foods( Reference Andersen, Hvingel and Kleinschmidt 11 , Reference Andersen, Hvingel and Laurberg 24 ). The intake of vitamin-D-containing supplements was evaluated from the frequency of intake.
Blood sampling and assays
Venous blood samples were obtained by venepuncture using minimal tourniquet. Whole blood was allowed to clot, spun using a portable centrifuge and serum was separated and stored at −20°C until analysis. Samples were stored on the roof of the nursing stations in the settlements in East Greenland as the temperature was below−20°C. The bag with samples had to be kept on the roof to be out of reach of sledge dogs.
Ca and albumin were measured using standard laboratory methods (Hitachi 917; Roche Diagnostics Corp.). Intra-/inter-assay CV were 0·9/1·5 % for Ca and 1·5/2·1 % for albumin (information supplied by manufacturer). Approximately 50 % of total serum Ca in blood is bound to proteins, and only the non-bound Ca is biologically active and tightly controlled by hormonal mechanisms. We thus adjusted for individual variations in albumin (adjusted serum Ca (mmol/l)=total serum Ca (mmol/l)−0·00086×(650−serum albumin (µmol/l))). PTH was measured using Immulite automated analyser (Diagnostic Products Corporation) with an overall CV below 7 %. Serum 25OHD levels were analysed by isotope dilution liquid chromatography–tandem MS with inter-assay CV of 8·6 and 9·4 % for 25OHD2 and 25OHD3 ( Reference Hojskov, Heickendorff and Moller 25 ). Calibrators traceable to National Institute of Standards and Technology standard reference material (SRM972) were used for external quality assurance (Chromsystems)( Reference Hojskov, Heickendorff and Moller 25 ).
Statistics
Results are given as medians and 25th and 75th percentiles. Groups were compared using non-parametric statistics: the χ 2 test for comparison of proportions, the Mann–Whitney U test for comparison of two groups and the Kruskal–Wallis test for comparing several groups. Distributions were tested using the Kolmogorov–Smirnov test and logarithmic transformation was performed on data not following the Gaussian distribution (Ca and PTH) for further analysis. Bartlett’s test was used to test for homogeneity of variance to support description of dispersion by standard deviations or interquartile ranges (IQR). Linear regression models were used with PTH and Ca entered as dependent variable. Explanatory variables entered were ethnic origin, diet group, alcohol intake, smoking habits, sex, age, 25OHD in serum and BMI. PTH was included for investigation of Ca, and Ca was included for investigation of PTH. Diet and origin were investigated in separate models in the multivariate linear regression analysis because of covariance. Random selection of participants in Nuuk was performed using MedStat (Astra). Data were processed and analysed using Corel Quattro Pro 8 (Corel Corporation) and the Statistical Package for the Social Sciences version 13.0 (SPSS Inc.). A P value <0·05 was considered significant.
Results
In all, 1 % of the population of Greenland was invited and 95 % participated. Table 1 lists the characteristics of the participants. Seven non-Inuit had one parent born in Greenland, whereas ninety-four had neither parent born in Greenland. Non-Inuit were mainly skilled labour from Denmark and thus included more men than women (P<0·001). This also influenced the age distribution because some leave Greenland at retirement. Alcohol intake was higher among Caucasian Danes and more Inuit were smokers. Hunting and dietary habits differed with geography. Dietary habits differed markedly both between Inuit and Caucasian Danes (P<0·001) and among Inuit groups (P<0·001). Thus, 22 % of Caucasian Danes reported a food frequency score of 40 % Inuit foods or more, whereas this was 86 % of Inuit in Nuuk and 99 % of Inuit in Tasiilaq and settlements. 25OHD groups are detailed in Table 1, and Table 2 gives the medians and 25, 75 percentiles, in addition to means and standard deviations, of 25OHD, PTH and Ca, total and corrected for individual albumin levels, in the participant groups.
Table 1 Descriptives of participants in the survey of diet and calcium homoeostasis in 50- to 69-year-old residents in East and West Greenland (Numbers and percentages; mean values and standard deviations)
* χ 2 Test.
† Including seven participants of mixed origin.
‡ Information missing in one participant in Nuuk.
§ Estimated units of alcohol per week. Information missing in nine (1/6/2/0) participants. Comparison above v. below 7 units/week.
|| Diet groups <20, 20–40 and 40–60 % combined for χ 2 test.
¶ Information missing in seven (0/5/2/0) participants. Trade and leisure groups merged for statistical analysis.
†† Information missing in seven (1/1/3/2) participants. Statistical comparison performed for below v. above 50 nM.
Table 2 Calcium, parathyroid hormone (PTH) and vitamin D among Inuit and Caucasians aged 50 to 69 years living in East and West Greenland (Mean values and standard deviations; medians and 25, 75 percentiles)
* Mann–Whitney test.
† Seven had one and ninety-four had both parents born in Denmark.
‡ All had both parents born in Greenland.
§ Total Ca.
|| Ca corrected for individual variation in albumin.
¶ 25-hydroxyvitamin D2+D3. Information missing in four participants.
Total serum Ca was lower in Inuit than in Caucasian Danes and did not differ between Inuit groups (Table 2). Albumin adjustment augmented the ethnic difference. In addition to the difference in mean, dispersion of Ca differed with ethnicity, with higher sd and IQR in Inuit compared with Caucasian Danes (P<0·01) and no difference between Inuit groups (NS). PTH differed between Inuit and Caucasian Danes, with a higher level in the latter (Table 2). In addition, PTH did not differ between Inuit groups. Dispersion of PTH differed between Inuit and Caucasian Danes (P<0·01) and among Inuit groups (P<0·01). Serum 25OHD levels differed with ethnicity (Table 2) and between Inuit groups, as did dispersion both with ethnicity (P=0·01) and between Inuit groups (P<0·01).
Fig. 1 illustrates the distinct ethnic difference in the association between serum 25OHD and PTH in the serum 25OHD insufficiency range. Although PTH rose with low serum 25OHD in Caucasian Danes, this did not occur in Inuit, and PTH differed in the 69/97 Caucasian Danes/Inuit with serum 25OHD <50 nmol/l (P=0·001).
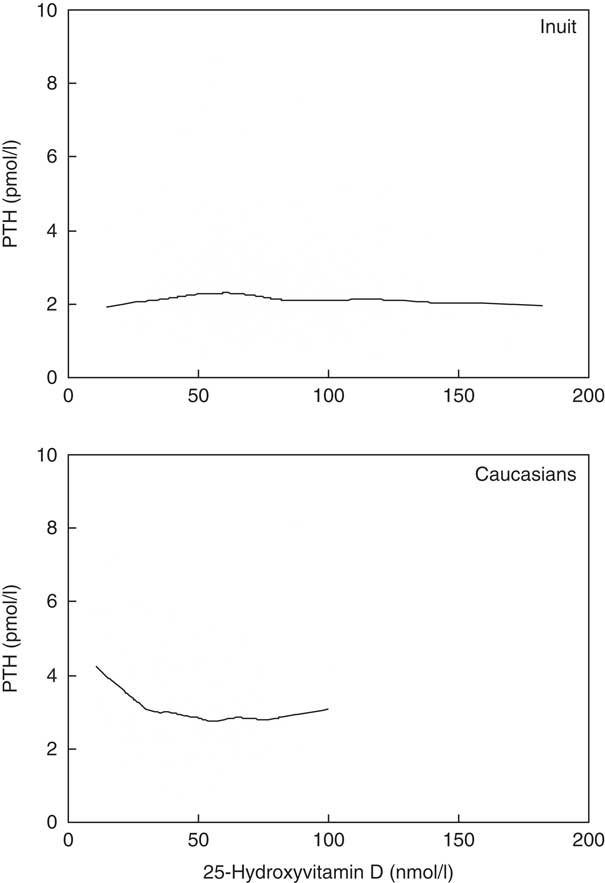
Fig. 1 Association between parathyroid hormone (PTH) and vitamin D differed between individuals of Greenlandic descent (Inuit, upper panel) and migrants (Caucasians, lower panel) living in Greenland.
Table 3 lists factors important to Ca and PTH in serum as evaluated in crude and adjusted analysis. The factors of main importance to Ca levels were ethnic origin, diet and serum 25OHD after adjusting for also sex, age and PTH. Serum PTH levels were influenced by ethnic origin, diet and serum 25OHD in the adjusted analysis that included also BMI and smoking. As for P−25OHD, a main association was seen with diet (P<0·001), whereas some association was seen with Ca (P=0·021) and PTH (P=0·007).
Table 3 Factors associated with calcium and parathyroid hormone (PTH) in 50- to 69-year-old residents in Greenland
25OHD, 25-hydroxyvitamin D.
NS P>0·1.
* Ca corrected for individual variation in albumin.
† Dependent variables were serum Ca/PTH and explanatory variables were age, sex, serum PTH/Ca, alcohol intake, diet and ethnicity. Diet and origin were tested in separate models owing to collinearity.
‡ β (Regression) coefficients were Inuit/non-Inuit; advancing age; men/women; rising BMI; decreasing Inuit diet; increasing alcohol intake; and smoking with groups as given in Table 1.
§ Diet based on diet groups calculated from the frequency of intake of seven Inuit and seven imported food items – diet group 1: 80 %; 2: 60–80 %; 3: 40–60 %; 4: 20–40 %; 5: 0–20 % Inuit food frequency scores.
Discussion
Previous findings suggested an ethnic influence on Ca homoeostasis in Inuit compared with Caucasian Danes by a difference in serum Ca( Reference Rejnmark, Jørgensen and Pedersen 6 , Reference Jeppesen and Harvald 16 ), an influence of ethnicity on PTH( Reference Rejnmark, Jørgensen and Pedersen 6 ) and by the fact that ethnic origin modified the influence of diet on serum 25OHD levels( Reference Andersen, Laurberg and Hvingel 7 ). These hints all point to an importance of ethnic origin for Ca homoeostasis. In addition, they are in resonance with the intuitive understanding of an adaption among Arctic residents to an environment low in dietary Ca and possibly vitamin D. Exploring this topic may provide further insight into our understanding of Ca homoeostasis.
The conductor of the Ca homoeostasis orchestra is PTH. Ethnicity, diet and serum 25OHD associated with PTH in our data. The differences in slope were limited, but it is intriguing that the larger beta was seen with ethnicity. The number of subjects with 25OHD in the range of insufficiency differed between Inuit and Caucasians (22·7 %, ninety-seven Inuit; 69 %, sixty-nine Caucasians), but it was clearly sufficient to detect a statistically significant difference in PTH, as well as in Ca. It seems thus that ethnicity could have a major influence on Ca homoeostasis when comparing Caucasians and Inuit. Interestingly, the same accounted for Ca that had the slightly larger beta coefficient for PTH. An influence of ethnic origin on Ca homoeostasis is thus a likely trait in our data. This is in keeping with the findings by Rejnmark et al. of lower PTH among Inuit in a study comparing forty-three Caucasian Danes in Denmark with Inuit in Denmark and Greenland with a focus on seasonal differences( Reference Rejnmark, Jørgensen and Pedersen 6 ). Despite the lower PTH, they found both higher 1,25-dihydroxyvitamin D and lower Ca in serum among Inuit compared with Caucasian Danes. This conforms to the hypothesis that Inuit has adapted to a low-Ca environment with augmented absorption of dietary Ca from the intestines and promoted Ca fluxes into blood from kidney and bones mediated by the slightly higher 1,25-dihydroxyvitamin D. These findings encourage further study.
A number of mechanisms may contribute to the differences with ethnic origin. An altered vitamin-D-binding protein has been demonstrated among Asians compared with other ethnic groups( Reference Chen, Easteal and Board 26 ). Inuit are of Asian descent and they could be speculated to have different levels of vitamin-D-binding protein. The latter may influence 25OHD metabolism( Reference Jones, Schoenmakers and Assar 27 ), and 25OHD half-life associated with vitamin-D-binding protein with ethnic differences between Gambian subjects and Caucasians( Reference Jones, Assar and Vanderschueren 28 ). However, differences in vitamin-D-binding protein levels were more marked within Inuit groups than with ethnic origin in the previous study( Reference Rejnmark, Jørgensen and Pedersen 6 ). The group size was limited in that study but a marked difference would have been detected. Hence, this mechanism is less likely, as vitamin-D-binding protein levels were similar in Inuit and Caucasian Danes.
An altered 1-α-hydroxylase activity in Inuit compared with Caucasian Danes is another mechanism to consider. Higher levels of 1,25-dihydroxyvitamin D in Inuit compared with Caucasian Danes was demonstrated despite lower levels of serum 25OHD( Reference Rejnmark, Jørgensen and Pedersen 6 ). The higher 1,25-dihydroxyvitamin D augments the intestinal absorption of Ca and suppresses PTH secretion. This is in keeping with our finding of a lower PTH among Inuit than Caucasian Danes( Reference Rejnmark, Jørgensen and Pedersen 6 ). Nevertheless, this association needs further evaluation as other mechanisms may influence PTH. These include differences in PTH activity, PTH-related proteins influencing the PTH receptor and a genetic variant in Inuit. The latter would be in line with the genetic signature of adaptation to a high-fat diet demonstrated recently( Reference Fumagalli, Moltke and Grarup 29 ). Similar mechanisms could be speculated to be at play with adaptation to a low-Ca diet. However, a number of physiologic factors may also influence PTH, including smoking and obesity.
Body build differs between Inuit and Caucasians as Inuit have shorter limbs relative to the torso( Reference Andersen, Rex and Noahsen 30 , Reference Andersen, Mulvad and Pedersen 31 ) and they may present with higher BMI for the same degree of metabolic disturbances( Reference Noahsen and Andersen 32 ). These ethnic peculiarities did not influence PTH as evaluated in the adjusted comparisons in our data.
Smoking rates are high in Greenland( Reference Bjerregaard, Jørgensen and Borch-Johnsen 33 , Reference Jakobsen, Laurberg and Vestergaard 34 ), and about 75 % of Inuit participants in our study were present smokers. The relatively high rate of 56 % smokers among Caucasians was still lower than among Inuit. Yet, smoking did not influence PTH in our data.
The lower Ca and PTH in serum in Inuit compared with Caucasians has the potential to influence bones and the risk for osteoporosis. Available data suggest no difference in BMD between Inuit and Caucasian Danes( Reference Andersen, Boeskov and Laurberg 35 ), similar fracture rates( Reference Sorensen, Wojtek and Pedersen 18 ) and similar impact of risk factors for osteoporosis( Reference Jakobsen, Laurberg and Vestergaard 34 ). Thus, the limited data available do not suggest a difference in the occurrence of bone diseases between Inuit and Caucasian Danes. However, vitamin D plays a pivotal role in skeletal health( Reference Holick 1 , Reference Adams and Hewison 2 ), and sufficient 25OHD levels in Inuit( Reference Andersen, Laurberg and Hvingel 7 , Reference Nielsen, Bjerregaard and Rønn 36 ) may contribute to this finding. 25OHD is ample in the traditional Inuit foods that comprise mainly marine mammals and fish in addition to caribou and birds( Reference Nielsen, Bjerregaard and Rønn 36 , Reference Pars 23 ), but ethnicity had an impact on the influence of diet on serum 25OHD levels( Reference Andersen, Laurberg and Hvingel 7 ). We included only subjects aged 50 through 69 years. This might underestimate the impact of the transition away from traditional foods as older Inuit have a higher intake of traditional Inuit foods( Reference Andersen, Hvingel and Kleinschmidt 11 , Reference Kuhnlein, Receveur and Soueida 37 ). Consequently, it may be speculated that the dietary transition in Arctic societies poses a particular risk for skeletal diseases among Inuit. This encourages attention to the influence of dietary transition on bone metabolism and diseases.
The older age group included contributed to a high participation rate of 95 % in this population-based exploratory survey, which supports the validity of the findings. This is further supported by the inclusion of populations at the extremes of transition of societies in Greenland from the capital city Nuuk in West Greenland to remote settlements in East Greenland. We did not measure 1,25-hydroxylase activity, vitamin-D-binding protein, PTH-related protein or further measures of Ca homoeostasis. We recommend this for future studies of influence of ethnic origin on Ca homoeostasis.
An influence of ethnic origin has been debated in relation to body build( Reference Andersen, Rex and Noahsen 30 ), bone mineral density( Reference Andersen, Boeskov and Laurberg 35 ), bone metabolism( Reference Nielsen, Bjerregaard and Rønn 36 , Reference Redmond, Jarjou and Zhou 38 ), renal function( Reference Bjerregaard, Jørgensen and Borch-Johnsen 33 ) and lipid metabolism( Reference Fumagalli, Moltke and Grarup 29 ). Although differences have been demonstrated( Reference Fumagalli, Moltke and Grarup 29 , Reference Andersen, Rex and Noahsen 30 , Reference Andersen, Boeskov and Laurberg 35 , Reference Redmond, Jarjou and Zhou 38 , Reference Andersen, Dehnfeld and Laurberg 39 ), the cause for such differences has been rather a question of filtering out environmental factors to settle whether genetic factors are at play. We conducted multivariate analysis to adjust for relevant environmental factors. However, the importance of genetics remains to be determined.
In conclusion, we found different Ca and PTH levels in serum in Inuit and Caucasian Danes. A rise in PTH was seen with low serum 25OHD levels in Caucasian Danes but not in Inuit, and ethnic origin was a major determinant of PTH and Ca in our data in addition to diet and P−25OHD. The difference in serum Ca is indicative of an influence of ethnicity on Ca homoeostasis in view of the powerful, interactive homoeostatic mechanisms to maintain serum Ca within narrow limits. This is further supported by the ethnic differences in PTH level and in PTH response to low 25OHD. Recommendations are to follow up on Arctic populations to assess the impact of transition in dietary habits on Ca homoeostasis and skeletal health, and to evaluate mechanisms underlying the ethnic influence on Ca homoeostasis.
Acknowledgements
The authors gratefully acknowledge Karoline Berglund for her enthusiasm and thorough interviewing of Inuit. The authors are grateful for invaluable support from lægeklinikken in Nuuk, from Hans Chr. Florian Sørensen and the staff at the hospital in Tasiilaq, and from the staff at the nursing stations in Tiniteqilaaq, Sermiligaaq, Kuummiut and Kulusuk. Peter Laurberg contributed to project conception, study design, raising of funds and data collection. Sadly, he tragically passed away in 2016 and did not contribute to finalising this work that was very dear to him.
This study was supported by grants from Greenland Government; Karen Elise Jensen Foundation; Northern Jutland Research Foundation; and Aalborg City Christmas Lottery.
S. A.: project conception, study design, raising of funds, data collection, analysis of data and writing of the manuscript. P. N., K. F. R. and M. B. L.: data analysis; P. N., K. F. R., I. F., N. A., M. E. J., L. K. S. and M. B. L.: reviewing of the manuscript; I. F. and L. K. S.: interpretation of data; N. A. and M. E. J: intellectual contribution; and M. B. L.: project conception.
The authors declare that there are no conflicts of interest.


