


Patients with rheumatoid arthritis (RA) are known to have increased systemic inflammation and arterial stiffness( Reference Smolen, Aletaha and Barton 1 , Reference Ambrosino, Tasso and Lupoli 2 ), a process now thought to be a significant contributor to the development of atherosclerosis and CVD( Reference Lakatta and Levy 3 , Reference Vlachopoulos, Gravos and Georgiopoulos 4 ). TNF-α antagonists have been shown to provide a small but significant reduction in aortic stiffness as measured by the augmentation index (AIx) using pulse-wave analysis in RA patients( Reference Vlachopoulos, Gravos and Georgiopoulos 4 ). This suggests that pharmacological and, possibly, non-pharmacological interventions might exert beneficial effects on markers of arterial stiffness, with a consequent reduction in CVD risk in this patient group.
Dietary fatty acids are a major dietary component and known to influence the cascade of pro- and anti-inflammatory PG( Reference Das 5 ). In patients with RA, fish oil supplementation has reduced inflammatory biomarkers( Reference Gioxari, Kaliora and Marantidou 6 ), disease activity( Reference Cleland, Caughey and James 7 ) and treatment failure( Reference Proudman, James and Spargo 8 ). In smokers( Reference Siasos, Tousoulis and Oikonomou 9 ) and individuals with the metabolic syndrome( Reference Tousoulis, Plastiras and Siasos 10 ), fish oil supplementation has reduced markers of systemic inflammation, such as IL-6 and TNF-α, in parallel with reductions in arterial stiffness. Whether or not certain patterns of fatty acid intake in the diet are associated with reduced inflammation and central and peripheral arterial wave reflection is however more difficult to assess. A wide variety of food sources contain high levels of one or more of the major fatty acids( Reference O’Sullivan, Ambrosini and Beilin 11 ) of which a large number are associated with CVD( Reference de Oliveira Otto, Wu and Baylin 12 ), and each ranges widely between individuals’ diets( Reference Ervin, Wright and Wang 13 ). Attempting to determine the independent associations between each of these fatty acids and measures of arterial stiffness with the use of multi-variate regression models is problematic due multi-collinearity between many of the fatty acids. In addition, many other known and unknown factors in the diet besides fatty acids can influence arterial stiffness, creating the potential for residual confounding.
Latent profile analysis (LPA), a special form of latent class analysis (LCA), is an objective (model-based) data reduction technique that enables the identification of underlying patterns within data, with each pattern defined by virtue of having similar values across a set of observed continuous and/or categorical variables( Reference Goodman 14 ). LCA can also be thought of as being a ‘person-centred’ rather than a ‘variable-centred’ approach, since the focus of the analysis is on identifying groups of individuals with a pattern of similar values rather than identifying the effects of each individual variable. LCA thus captures the heterogeneity within and between groups and can identify the most parsimonious number of distinct patterns in the data via formal measures of model fit( Reference Muthen and Muthen 15 ).
In this study, we aimed to identify and describe the unique patterns of dietary fatty acid intake existing within a representative sample of RA patients which we have previously studied( Reference Mangoni, Baghdadi and Shanahan 16 ). We then examined which, if any of these patterns were associated with the AIx, a marker of arterial stiffness and wave reflection, and whether or not there were separate and additive effects of n-3 fish oil supplementation. In individuals aged 50 years and over, aortic arterial wave reflection measured using the AIx has been found to be a more sensitive marker of arterial stiffening than pulse-wave velocity( Reference McEniery, Yasmin and Hall 17 ).
Methods
Study design
We conducted a longitudinal study with repeated measurements of reported dietary intake and AIx at baseline and at 8 months follow-up. LPA was used to determine the major patterns of dietary fatty acid intake. LPA is a particular form of LCA which can be used to identify hidden groups from a large number of continuous (LPA) or categorical (LCA) observed variables( Reference Goodman 14 ). The latent (hidden) variable that is formed when using LCA or LPA is categorical and clusters subjects (or other units) into a small number groups (i.e. classes or profiles). Our primary interest was to determine the strength of the relationship between these groups (defined by different patterns of dietary fatty acid intake) and the AIx. Each fatty acid was measured as a continuous variable in units of g consumed/d. We also assessed the independent association between use of fish oil supplements and the AIx.
Patient recruitment and ethical approval
We studied a consecutive series of patients with stable RA, aged ≥18 years, recruited from the outpatient clinics of the Rheumatology Department at Flinders Medical Centre and the Repatriation General Hospital, in the Southern Health Local Heath Network, Adelaide, Australia. RA was diagnosed according to the 1987 American College of Rheumatology or the 2010 American College of Rheumatology/European League Against Rheumatism criteria( Reference Aletaha, Neogi and Silman 18 ). Exclusion criteria were atrial fibrillation, active cancer or current treatment with anti-cancer drugs, heart failure and cognitive impairment. The study (registered in the Australian New Zealand Clinical Trials Registry with the registration number ACTRN12616001366448) was approved by the Southern Adelaide Clinical Human Research Ethics Committee (ethics approval no. 76·14). Each participant gave written consent before entering the study in accordance with the Declaration of Helsinki.
Augmentation index
AIx (corrected at a heart rate of 75 beats/min) was measured using pulse-wave analysis (SphygmoCor version 7.1; AtCor Medical)( Reference O’Rourke, Pauca and Jiang 19 ). Measurement of the AIx was performed at baseline and 8 months.
Dietary fatty acids
Data on reported dietary intake were collected at baseline and 8 months. Nutrient intake from the diet including fatty acid intake was determined using the validated dietary questionnaire for epidemiological studies version 2 (DQES v2)( Reference Hebden, Kostan and O’Leary 20 – 22 ). The DQES v2 is a modification of a FFQ that was developed by Cancer Council Victoria in the late 1980s to measure dietary intake of people taking part in the Melbourne Collaborative Cohort Study. The DQES v2 comprises a food list of seventy-four items grouped into four food categories: (1) cereal foods, sweets and snacks; (2) dairy products, meats and fish; (3) fruits and (4) vegetables. Each item has ten frequency response options ranging from ‘never’ to ‘3 or more times per day’ and a section covering intake of six types of alcoholic beverage with ten frequency response options ranging from ‘never’ to ‘every day’. The questionnaire also contains four questions that relate to portion size (with regard to potatoes, steak, vegetables, and meat or vegetable casserole). Responses to these questions are used to calculate a single portion size factor (PSF) indicating whether on average a person eats median-size serves (PSF=1), more than the median (PSF>1) or less than the median (PSF<1). The PSF is used to scale the standard portion size for different foods up or down from which energy and nutrient intakes can be calculated for each food frequency item. The questionnaire asks subjects to describe their intake of food over the preceding 12 months according to food type and quantity. The data collected by DQES v2 are used to calculate nutrient intake. The calculation of the majority of the nutrients is based on Australian nutrient composition data from NUTTAB95. Calculation of the intake of individual fatty acids are based on a data set obtained from Professor Neil Mann, RMIT University, and now used in the FoodWorks nutrient analysis software. The results from the software analysis provide results that include information on total energy intake (kJ/d), SFA intake (g/d), MUFA intake (g/d), PUFA intake (g/d) and the intake of thirty different fatty acids (g/d) including the sixteen major fatty acids included in the LPA described in detail subsequently.
Clinical and demographic characteristics
The following data were collected from patient interviews, medical questionnaires, clinical notes and hospital administrative databases: age, sex, medical and medication history, weight, height, BMI, the 28-joint disease activity score (DAS28)( Reference Prevoo, van’t Hof and Kuper 23 ), time spent doing physical activity, level of education, marital status, health insurance status and income. The DAS28 was measured using high-sensitivity C-reactive protein (CRP) measured at each time point and erythrocyte sedimentation rate and swollen and tender joint count taken from patient notes at the same time point. Clinic peripheral systolic blood pressure (SBP) and diastolic blood pressure (DBP) were measured in the morning, in a quiet environment at room temperature, using the clinically validated automatic blood pressure monitor (model UA-767PC; AND Medical) according to current guidelines( Reference Palatini, Frigo and Bertolo 24 ). High-sensitivity CRP was measured in serum by latex-enhanced immunoturbidimetry on an automated Modular PPE Analyzer (Roche Diagnostics) using instrument conditions and reagents supplied by the manufacturer( Reference Pepys and Hirschfield 25 ).
Statistical analysis
Descriptive statistics were used to describe the baseline characteristics of the subjects using either mean and standard deviation for normally distributed continuous variables, median and interquartile range (IQR) for non-normally distributed continuous variables and frequency (percentage) for categorical variables. Correlations between individual fatty acids were estimated using Pearson’s r correlation coefficient. LPA was performed to identify the pattern of dietary fatty acid intake using the estimated dietary intakes (g/d) of sixteen different major fatty acids (Table 2) obtained from the FFQ and listed as major fatty acids in a recent guide to dietary reference intakes( Reference Otten, Hellwig and Meyers 26 ). The LPA was performed using the mean fatty acid intakes recorded across the two visits for each subject rather than for each visit separately. There were several reasons for choosing this approach. First, the relatively high within-subject variability of fatty acid intake across the two visits (mean intraclass correlation coefficient=0·51 between baseline and 8 months) indicated a relatively high degree of measurement error in the true average intake. Second, there were problems with convergence for some of the models when using separate visit data. Third, averaging the data for the two visits meant that each subject was classified with a single latent profile that assists interpretation of the results. In addition, since intake of fatty acids was based on g/d, we used energy-adjusted intakes for analysis using the nutrient residual method( Reference Hu, Stampfer and Rimm 27 ). Briefly, we performed a linear regression of each mean fatty acid on mean daily energy intake and used the resulting residuals as the new variables for the LPA. Models were estimated for between two and six latent profiles, and for each model, the profile membership of each subject was decided based on their highest (posterior) predicted probability of profile membership. Model fit was based on the Akaike information criterion (AIC) and the Bayesian information criterion (BIC). The selected model was based on both model fit (lowest AIC and BIC) and consideration of the number of subjects assigned to each profile (a minimum of five subjects), since 5 % of subjects per profile is a good rule of thumb( Reference Stanley, Kellermanns and Zellweger 28 ). Line plots of the standardised energy-adjusted fatty acid intake for the sixteen fatty acids were used to identify the main fatty acids characterising each profile. Standardisation of the fatty acids, that is, calculating a z-score, was performed to ease interpretation, since absolute fatty acid intake varies considerably across the range of fatty acids. Mean differences in the sixteen fatty acids across the profiles were compared using linear regression with additional adjustment for energy intake( Reference Hu, Stampfer and Rimm 27 ). We compared the AIx across latent profiles using linear mixed-effects univariate and multi-variate regression with adjustment for age, sex, BMI, visit (baseline or 8 months), DAS28, use of ibuprofen, use of folic acid, use of methotrexate, energy intake, hours of physical activity per week, income, level of education, marital status and private health insurance status. The subject was included in the model as a random intercept. We also compared SBP, DBP and log10-transformed CRP across latent profiles using the same approach. In each of these models, we assessed the overall significance of the profile variable using a Wald’s test that compared models with and without the profile variable. Finally, for comparison purposes, we assessed the association between AIx and each individual fatty acid using the same univariate and multi-variate mixed-effects regression with the same adjustment as mentioned earlier.
Analysis was performed using STATA (version 15.1; StataCorp) and R software (for figures). The LPA was performed using the STATA ‘gsem’ command for generalised structural equation modelling, for which LCA was incorporated in version 15. A type 1 error rate of α=0·05 was considered statistically significant for all regression analyses. Based on a Bonferroni correction, a type 1 error rate of P=0·001 was considered significant when comparing the sixteen individual fatty acid intakes across the profiles.
Results
Clinical and demographic characteristics and fatty acid intake
A total of eighty-six subjects were recruited, and measures of diet and AIx were recorded at baseline and after 8 months. The baseline characteristics of the subjects are described in Table 1. The median age of the subjects was 64 (IQR 56–69) years, and sixty-three (73·3 %) were female. The reported mean fatty acid intake (g/d) and correlations between the fatty acids are described in Table 2. There was a high correlation between the SFA, between the mono- and polyunsaturated fats (palmitoleic acid (16 : 1), oleic acid (18 : 1) and linoleic acid (18 : 2)) and between the n-3 fatty acids.
Table 1 Baseline clinical characteristics of the study population (n 86) (Numbers and percentages; medians and interquartile ranges (IQR); mean values and standard deviations)
DAS28, disease activity score for 28 joints; SBP, systolic blood pressure; DBP, diastolic blood pressure; AIx, augmentation index.
* P-value for difference between profiles using ANOVA (normal distributions), test of medians (asymmetric distributions) or Fisher’s exact test (categorical).
Table 2 Mean dietary fatty-acid intake and Pearson’s r correlations amongst the sixteen dietary fatty acids (n 86) (Mean values and standard deviations; correlations)
AA, arachidonic acid; LA, α-linolenic acid; DPA, docosapentaenoic acid.
* Statistically significant correlations (P<0·05).
Latent profile analysis
All eighty-six subjects completed dietary assessments at baseline, and 79 subjects completed dietary assessment at 8 months. All LPA analyses with 2, 3, 4, 5 and 6 specified latent profiles converged successfully, and the AIC and BIC statistics for these are described in Table 3. Based on the lowest BIC, the optimal number of class was 5. The mean probability of accurately assigned profile membership ranged from 0·94 for profile 4 to 1·00 for profile 1 (Table 4), indicating a high degree of certainty that each individual was assigned to the correct dietary fatty acid pattern.
Table 3 Model fit statistics and profile membership distribution
AIC, Akaike information criterion; BIC, Bayesian information criterion.
Table 4 Mean posterior probabilities associated with profile membership in the five profile latent class analysis model
* P<0·05.
Fatty acid intake and food frequencies
Fig. 1 and Table 5 describe the standardised mean fatty acid intake according to each of the five dietary patterns. There were overall significant differences (P<0·001) across the five patterns for fifteen of the sixteen fatty acids (all except 18 : 2n-6 trans) (Table 5). In particular, profiles 2, 3, 4 and 5 were significantly lower than profile 1 for palmitoleic acid (16 : 1), EPA (20 : 5n-3), DHA (22 : 6n-3) (P<0·001) and docosapentaenoic acid (22 : 5n-3) (P<0·001 for each except; P=0·007 for 16 : 1 profile 3 v. profile 1) (Fig. 1). Profile 1 had the highest reported intake for each of these fatty acids and profile 3 generally the lowest reported intake. Fig. 2 displays each individual’s fatty acid intake together with the mean reported intake for the five profiles. The mean reported intake for fish, meats and the frequency distribution of the ‘usual fat spread used on bread’ according to the five profiles are described in Table 6. There were no significant differences across profiles for fried fish (P=0·08). However, reported intake of grilled fish, tinned fish and total fish were significantly higher among subjects in profile 1 (P<0·001 for each). Profile 1 had the highest reported intake for each, while profile 3 had the lowest reported intake for each. There were no significant differences across the five profiles for each of beef, veal, chicken, lamb, pork, bacon, ham, beef salami, sausages or total meat (P>0·05 for each). There was a significant difference across the five profiles in the main choice of fat spread used on bread (P<0·001). The most common spread for profiles 1 and 5 was ‘butter’ (28·6 and 53·3 %, respectively) while the most common spread for profiles 2, 3 and 4 was ‘none’, ‘none’ and ‘poly-margarine’ (36·0, 42·1 and 34·9 %, respectively).
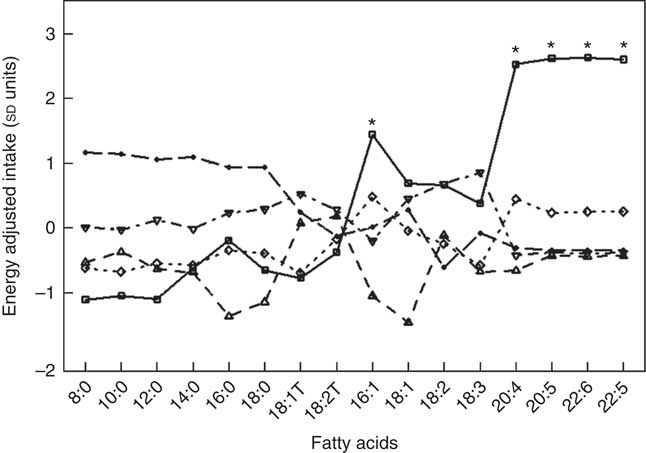
Fig. 1 Standardised energy-adjusted (using separate multi-variate linear regression models for each fatty acid regressed on energy intake) mean fatty-acid intake by latent profile membership (n 86). * Significantly different to profiles 2, 3, 4 and 5 (P<0·001 for each except P=0·007 for 16 : 1 profile 3 v. profile 1). ![]() , Profile 1;
, Profile 1; ![]() , profile 2;
, profile 2; ![]() , profile 3;
, profile 3; ![]() , profile 4;
, profile 4; ![]() , profile 5.
, profile 5.
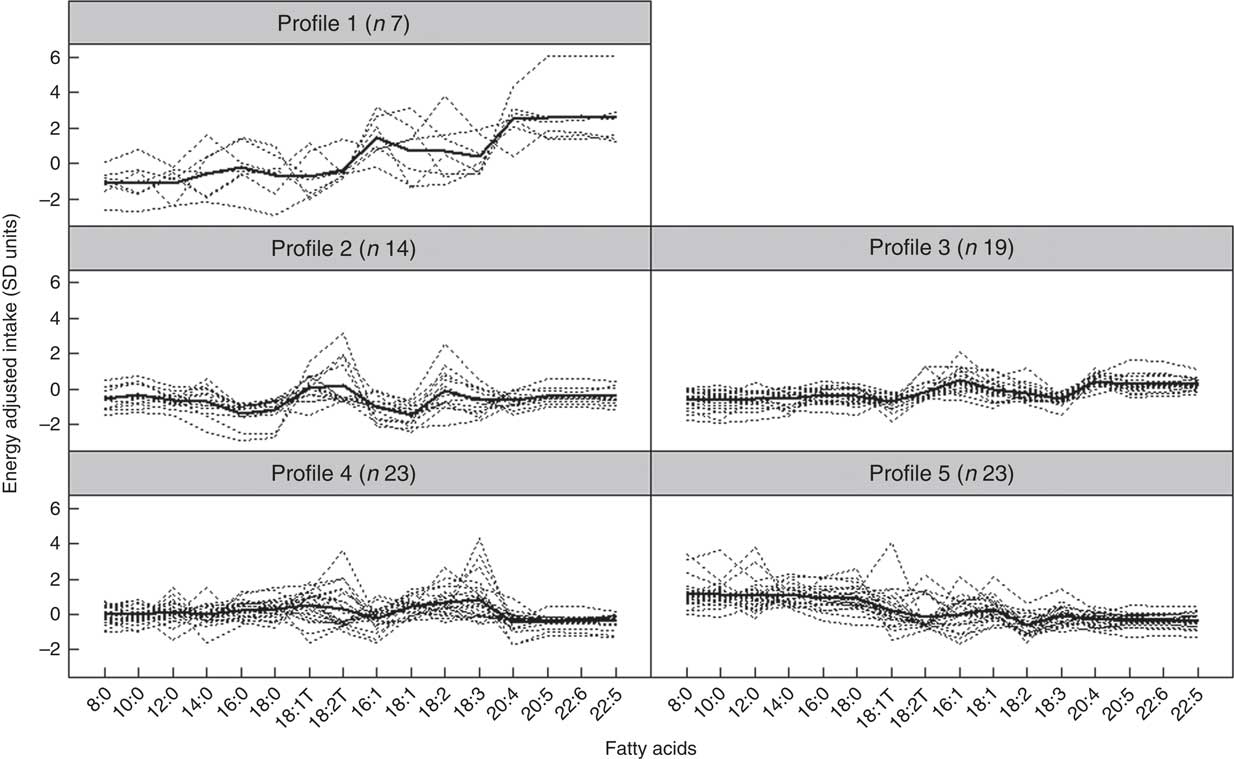
Fig. 2 Fatty-acid intake for each individual and mean intake for each profile (n 86). Dotted lines indicate individuals, and thicker continuous line indicates mean intake for the profile.
Table 5 Energy-adjusted mean standardised fatty-acid intake according to latent profile (Mean values and standard deviations)
LA, α-linolenic acid; AA, arachidonic acid; DPA, docosapentaenoic acid.
*** Mean value was significantly different from that of profile 1 (P=0·001).
† P-value across the five profiles.
Table 6 Selected food frequencies across the two visits by latent profile, n 86 subjects and n 165 records (Mean values and standard deviations; numbers and percentages)
*** Mean value was significantly different from that of profile 1 (P=0·001).
† Using mixed effects regression with adjustment for energy intake.
‡ Using Fisher’s exact test.
Multi-level regression for augmentation index 75, C-reactive protein and clinic blood pressure on latent profiles
A total of n 165 observations were included in the mixed-effects linear regression analysis for AIx with 79 subjects providing data at both baseline and 8 months and a further seven subjects providing data at baseline alone. There were five subjects that did not have AIx measured at either baseline or 8 months and were therefore excluded from the analysis for AIx.
In univariate analysis, there was an overall non-significant difference (P=0·600) across profiles in the mean AIx (Table 7). However, after adjustment for age, sex, BMI, time (baseline or 8 months), DAS28, ibuprofen, folic acid, methotrexate, physical activity, income, education, health insurance status, marital status and fish oil, the mean AIx was significantly different across profiles overall (P=0·023). In particular, subjects in profile 1 (high in n-3 fatty acids, 16 : 1 and 20 : 4) had lower AIx than subjects in profile 3 (β=–7·2 %, 95 % CI –11·5, –2·9; P=0·001) (Table 7). In addition, fish oil supplementation was an independent predictor of lower AIx (β=–4·15, 95 % CI –6·73, –1·56; P=0·002). In contrast, older age (P=0·028), female sex (<0·001) and higher BMI (0·021) were independent predictors of a higher AIx (Table 7).
Table 7 Univariate and multi-variate mixed-effects regression analysis for the augmentation index (n 81 subjects, 140 records) (β-Coefficients and 95 % confidence intervals)
Ref., reference.
* Using mixed-effects linear regression that included the listed variables and also use of prednisolone, use of ibuprofen, use of folic acid, use of methotrexate, visit (baseline v. 8 months), energy intake, hours of physical activity, marital status, income and education.
† Overall association for latent profile.
In both univariate and multi-variate analysis, there was no overall significant difference in log-transformed CRP across the four profiles (P=0·99 and P=0·89, respectively) (Table 8). However, higher DAS28 was independently associated with higher CRP (P<0·001) (Table 8).
Table 8 Univariate and multi-variate mixed-effects regression analysis for log10-transformed C-reactive protein (n 86 subjects, 155 records) (β-Coefficients and 95 % confidence intervals)
Ref., reference; DAS28, disease activity score for 28 joints.
* Using mixed effects linear regression that included the listed variables and also BMI, use of prednisolone, use of ibuprofen, use of folic acid, use of methotrexate, visit (baseline v. 8 months), use of fish oil, energy intake, hours of physical activity, health insurance status, income and level of education.
† Overall association for latent profile.
In multi-variate analysis of clinic blood pressure, there was no overall difference between profiles for either SBP (P=0·197) or DBP (P=0·308).
Multi-level regression for augmentation index 75 on individual fatty acids
Table 9 shows the results of the univariate and multi-variate mixed-effects regression for AIx and each of the sixteen individual fatty acids. There were no significant associations for any of the fatty acids in either the univariate or the multi-variate analysis.
Table 9 Univariate and multi-variate mixed-effects regression analysis for the augmentation index and individual fatty acids (n 81 subjects, 140 records) (β-Coefficients and 95 % confidence intervals)
AA, arachidonic acid; LA, α-linolenic acid.
* With adjustment for age, sex, disease activity score for 28 joints, marital status, BMI, use of prednisolone, use of ibuprofen, use of folic acid, use of methotrexate, visit (baseline v. 8 months), use of fish oil, energy intake, hours of physical activity, health insurance status, income and level of education.
Discussion
In this study, we used LPA to identify five underlying patterns of dietary fatty acid intake which were present within a population of patients with RA. Together with multi-variate regression analysis, the LPA methodology allowed us to associate patterns of reported dietary fatty acid intake with the AIx measured using pulse-wave analysis. Such associations were not present when fatty acids were assessed individually, suggesting that the aggregated information obtained from an LPA approach was better able to recover relevant information on fatty acid intake. Subjects with diets classified as being within fatty-acid profile 1, characterised by a high level of n-3 fatty acids, palmitoleic acid (16 : 1) and arachidonic acid (20 : 4n-6), had a significantly lower AIx than subjects within profiles 2 and 3, both of which had lower levels of n-3 fatty acids. Profile 2 also had lower levels of palmitic acid (16 : 0), palmitoleic acid (16 : 1) and oleic acid (18 : 1) than profile 1, and profile 5 had higher levels of all SFA and lower levels of palmitoleic acid (16 : 1) and linoleic acid (18 : 2n-6). Profile 4 was the only group with higher levels of trans-fatty acids. The adjusted difference in AIx between groups 1 and 3 was 7·18 %, much larger than the mean 1·48 % difference recently observed in a meta-analysis of randomised controlled trials for patients with RA using TNF-α antagonists( Reference Vlachopoulos, Gravos and Georgiopoulos 4 ). When comparing food consumption across the five profiles, profile 1 subjects had a similar reported mean meat intake compared with other profiles but had much higher levels of grilled and tinned fish consumption. There were also small but significant differences in their usual choice of spreads for bread, with profile 1 having a higher use of monounsaturated margarines (21 v. 4 % overall) and moderate but non-significantly higher levels of chicken and egg consumption.
In addition to observing a lower AIx for subjects with overall higher fish intake, there was an independent and additive effect of n-3 supplementation with the AIx. This supports the findings of higher reported n-3 intake from the diet being associated with lower AIx and also suggests that a dose–response n-3 intake may exist. A reduction in arterial wave reflection following n-3 supplementation has been observed in smokers( Reference Siasos, Tousoulis and Oikonomou 9 ), but there was no change in AIx with 12 weeks of 4 g/d of n-3 supplementation daily among both young and older healthy subjects( Reference Monahan, Feehan and Blaha 29 ). Similarly, there was no association between serum n-3 fatty acids and arterial wave reflection in healthy Japanese men( Reference Tomiyama, Matsumoto and Odaira 30 ). Together, these studies and our study suggest that the benefits of n-3 supplementation in preventing increased arterial stiffening and wave reflection may be most apparent in individuals at greater CVD risk.
Inflammation is known to contribute to arterial stiffening both directly( Reference Lakatta and Levy 3 , Reference Gkaliagkousi, Anyfanti and Chatzimichailidou 31 ) and indirectly, via ageing, diabetes and CVD( Reference Desjardins, Sidibe and Fortier 32 ), and n-3 fatty acids can reduce inflammation( Reference Gioxari, Kaliora and Marantidou 6 , Reference Siasos, Tousoulis and Oikonomou 9 , Reference Tousoulis, Plastiras and Siasos 10 ). However, we observed no association between CRP and AIx. It is therefore possible that the differences we observed in AIx between the five groups was mediated directly via other CVD protective effects of fish oil( Reference Mori and Woodman 33 ) rather than indirectly via their effects on inflammation. In particular, fish oil is known to influence the production of NO, improving endothelial function and vasodilatation, as well as lowering TAG, remnant lipoproteins and platelets( Reference Kromhout, Yasuda and Geleijnse 34 ).
In addition to being high in n-3 fatty acids, profile 1 was also characterised by higher levels of palmitoleic acid (16 : 1) and arachidonic acid (20 : 4n-6). While fish intake contributes to both of these, particularly palmitoleic acid (16 : 1), the major contributors to arachidonic acid (20 : 4n-6) in the diet of the general population are chicken (26·9 %), eggs (17·8 %), beef (7·3 %), sausage and bacon (6·7 %) and fish (5·8 %)( 35 ). There were no significant differences between profiles in regard to the mean reported intake of chicken, eggs, beef and sausage, although all were slightly higher in profile 1 compared with other profiles and in particular chicken and eggs. We can therefore conclude that in addition to fish, a higher consumption of eggs and chicken would have partly contributed towards a higher level of arachidonic acid (20 : 4n-6) for profile 1. Arachidonic acid (20 : 4n-6) is an essential fatty acid and a precursor for the production of inflammatory PG and, together with the n-3 fatty acids, helps to modulate inflammation( Reference Das 5 ). There is still debate as to whether or not a higher intake of n-6 fatty acids in general is beneficial or detrimental in regard to reducing risk of CVD( Reference Calder and Deckelbaum 36 ). While the American Heart Association has previously given advice to consume at least 5–10 % of energy as n-6 PUFA in order to reduce heart disease( Reference Harris, Mozaffarian and Rimm 37 ), much of the evidence for this advice was based on intervention trials that increased the intake of linoleic acid, the predominant n-6 fatty acid in the Western diet. However, many of the interventions for these trials also increased consumption of n-3 fatty acids (both α-linolenic acid and/or marine n-3 fatty acids, and also restricted the intake of trans-fatty acids)( Reference Calder and Deckelbaum 36 ). In addition, too little attention was paid to the individual fatty acids within the n-6 intake, assuming instead that their effects could be considered equivalent. A call was therefore made for greater focus on specific fatty acids and absolute amounts/concentrations rather than on fatty-acid classes and ratios( Reference Calder and Deckelbaum 36 ). Given that our study demonstrated reduced arterial stiffness among a group of individuals with a significantly higher reported intake of arachidonic acid (20 : 4n-6), it provides at least some reassurance as to the safety of such a diet, perhaps with the caution that it should be followed in conjunction with a high marine n-3 fatty-acid intake.
Strengths of this study included the use of LPA which allowed us to identify the main patterns of reported dietary fatty-acid intake, and the use of these as a single dietary exposure variable rather than many individual fatty acids either alone or together. When we assessed the individual fatty acids alone, we found no associations with the AIx. Grouping subjects according to their dietary fatty-acid patterns also allowed us to explore which foods were consumed differently across the five groups and thereby which were most likely to be responsible for the separate fatty-acid patterns. Identifying the specific food groups that contribute to the dietary patterns is also important to help provide practical dietary recommendations. Our data set was also well-described, and this allowed us to adjust our analysis for important confounders including age, sex, BMI, various medications, socio-economic status and physical activity that each might have been associated with diet quality as well as underlying CVD. Except for age, sex and BMI, these variables were not significantly associated with the AIx and did not therefore substantively alter our conclusions. Finally, we adjusted for energy intake to ensure that differences in absolute fatty-acid intake (g/d) between the profiles was not simply a result of differences in total food consumption.
Limitations to our study include its observational nature and cross-sectional design which therefore precludes making causal inferences. It is possible, for example, that subjects with higher arterial wave reflection may have known they were at a higher risk of CVD and may have altered their diet to one that included more fish and/or n-3 supplements. However, the possibility of reverse causality is low given that much of the population in general, including those with increased CVD risk, consume less fish than recommended( Reference Meyer 38 ), despite its known health benefits. The prevalence of high fish consumption in our study population was also similar to those aged ≥65 years in the Australian general population( Reference Meyer 38 ). There is also the possibility that our results were subject to residual confounding by factors that may influence both diet and arterial wave reflection. A healthier diet, and in particular one that is high in n-3 fatty acids, is often a marker of a healthier lifestyle in general, including higher levels of exercise and lower body weight. We therefore adjusted for a wide number of possible confounders including exercise, BMI, sex, and several well-established measures of socio-economic status, including level of education, income and marital status. However, our exercise measure only captured the time spent doing physical activity and not intensity. As such, it may not have completely removed the influence of each individual’s physical activity on arterial stiffness. In addition, a diet high in n-3 fatty acids might also be higher in other nutrients that themselves can influence arterial function and stiffness including flavonoids( Reference Bondonno, Bondonno and Blekkenhorst 39 ) and vitamin D( Reference Fry and Sanders 40 ), respectively, with the n-3 fatty-acid profile, perhaps therefore acting partly as a marker for these nutrients. A further limitation was the reliance on self-reported food intake for the estimation of fatty-acid intake rather than the use of measured food records or tissue data (plasma or erythrocytes). The latter would provide a more accurate assessment of fatty-acid intake from the diet in the short and medium term, respectively, and would also not be subject to memory bias. However, the collection of dietary data at repeated time points rather than a single time-point has previously been shown to increase explanatory power( Reference Stringhini, Sabia and Shipley 41 ) indicating a reduction in measurement error. In addition, the use of FFQ has been shown to give reasonably valid measures of fatty-acid intake( Reference Knutsen, Fraser and Beeson 42 ). Our FFQ did not query the type or quantity of oils or creams used in cooking information, which might potentially have had a large impact on fatty-acid intake and accurate profile classification. Finally, while our results were more informative than those obtained from univariate and multi-variate regression for each fatty acid, we did not compare our findings with other clustering techniques such as k-means clustering. Such approaches may also be useful in identifying similar dietary behaviours, albeit without objective guidance from model-based statistics including the AIC and BIC.
In conclusion, the use of LPA successfully identified five main patterns of dietary fatty-acid intake among subjects with RA using the nutrient data obtained from repeat dietary food intake questionnaires. Subjects with a dietary fatty-acid profile characterised by a high reported intake of n-3 fatty acids, palmitoleic acid (16 : 1) and arachidonic acid (20 : 4n-6) and reflecting a significantly higher reported fish intake had significantly lower AIx than subjects with the lowest reported intake of n-3 fatty acids. This was independent of a similar association with fish oil. Together, these findings suggest that n-3 fatty acids are the predominant fatty acids associated with reduced arterial wave reflection. By adhering to a diet high in fish with the possible addition of n-3 supplements, RA patients might help slow the progression of arterial ageing and the consequent increase in CVD risk. However, this hypothesis needs to be further investigated in interventional studies.
Acknowledgements
This research received no specific grant from any funding agency, commercial or not-for-profit sectors.
R. J. W. formulated the research question, assisted in study design, analysed the data, performed the first draft of the manuscript and finalised the manuscript. L. R. B. helped formulate the research question, carried out the study, analysed the FFQ, and read and approved the manuscript. E. M. S. formulated the overall study, assisted in study design, supervised the collection of data, was in charge of patient recruitment, read and revised the manuscript. I. d. S. assisted with analysis of the data, assisted with the literature review, read and revised the manuscript. J. M. H. assisted with the research questions, study design, drafting of the manuscript and final manuscript review. A. A. M. was responsible for the overall study design, project supervision, responsible for data collection for the AIx, assisted with drafting of the manuscript and final manuscript approval.
The authors declare that there are no conflicts of interest.


