


The gut metagenome has been estimated to be 150–400 times larger than the human genome(Reference Qin and Li1,Reference Li and Jia2) , yielding a colossal metabolic potential(Reference Yadav, Verma and Chauhan3). Products of the microbial metabolism comprise a vast range of molecules involved in a variety of biological functions(Reference Nicholson, Holmes and Kinross4,Reference Schroeder and Bäckhed5) and integrated in proposed ‘host–microbial metabolic axes’. These molecules complement the host metabolism and subsequently influence the host health through potential beneficial or harmful effects(Reference Schroeder and Bäckhed5–Reference Li, Wang and Zhang9). Consequently, the gut microbiota is now fully considered as an endocrine pseudo-organ within the mammalian holobiont superorganism(Reference Brown and Hazen6,Reference Kundu, Blacher and Elinav10) .
Specific studies investigating targeted molecules – such as SCFA, bile acids, choline metabolites, etc. – have considerably increased the mechanistic knowledge of microbial–human co-metabolism(Reference Nicholson, Holmes and Kinross4,Reference Louis, Hold and Flint11–Reference Fu, Bonder and Cenit13) . However, studies addressing more comprehensively the highly complex microbial–host metabolic interactions remain scarce(Reference Li, Wang and Zhang9). Metabolomics – the systematic identification and quantification of the low-molecular-weight metabolic products of a biological system at a specific point in time – enables the simultaneous detection and relative quantification of hundreds of molecules and thus holds promise to elucidate microbial–host interactions(Reference Smirnov, Maier and Walker14). Studies integrating a metabolomic approach have started to expand. Notably, gut microbiota has been reported to associate with the serum metabolome. Pedersen et al. (Reference Pedersen, Gudmundsdottir and Nielsen15) indeed showed that the serum metabolome of insulin-resistant individuals presents increased levels of branched-chain amino acids, which were further correlated with gut microbial genetic characteristics (namely the potential for biosynthesis of branched-chain amino acids and lack of genes encoding bacterial inward transporters branched-chain amino acids). Additionally, comparisons of the host metabolomes (in plasma or urine) between diseased individuals(Reference Kelly, Sordillo and Lasky-Su16–Reference Urpi-Sarda, Almanza-Aguilera and Llorach18) or subjects included in nutritional interventions(Reference Derkach, Sampson and Joseph19–Reference Tovar, de Mello and Nilsson22), and controls have detected molecules stemming exclusively from microbial activity (e.g. hippurate or p-cresol) as discriminant metabolites. However, in these studies, neither the gut microbiota composition nor its activity was analysed and direct associations between the gut microbiota and the host metabolome were not investigated. In fact, research investigating such associations is scarce and often has been conducted on limited sample sizes (n ≤ 100)(Reference Li, Wang and Zhang9,Reference Cui, Ye and Li23–Reference Liu, Hong and Xu27) or focused on subjects with specific characteristics or conditions like chronic heart failure(Reference Cui, Ye and Li23), spleen-yang-deficiency syndrome(Reference Lin, Ye and Zu26), obesity(Reference Dewulf, Cani and Claus24,Reference Liu, Hong and Xu27) , physiological and metabolic stress(Reference Karl, Margolis and Madslien25), etc. More recently, studies were performed on larger population-based samples, including several hundreds of participants and reporting associations between the composition and diversity of the gut microbiota and circulating metabolites, using metabolomics(Reference Org, Blum and Kasela28–Reference Wilmanski, Rappaport and Earls32). Following these approaches, our objective was to investigate the associations between untargeted plasma metabolomic signatures and gut microbiota composition in a large sample of healthy French subjects.
Methods
Study population
This study was conducted in the framework of the Milieu Intérieur project, which enrolled 1000 healthy French adults with primary aim to assess the determinants of immunological variance within the general healthy population. The objectives of the present study are secondary objectives to the Milieu Intérieur project, for which the rationale, design and methods have been extensively described elsewhere(Reference Thomas, Rouilly and Patin33). Briefly, 500 females and 500 males equally distributed across five classes of age (from 20 to 69 years old), and of mainland French descent for at least three generations, were recruited in the suburban area of Rennes (Ille-et-Vilaine, Bretagne, France), between September 2012 and August 2013. Participants were considered ‘healthy’ upon recruitment, as defined per stringent exclusion criteria comprising any chronic disease or condition involving the immune system, abnormal physical examination or any abnormal clinical–biological analysis(Reference Thomas, Rouilly and Patin33). Questionnaires and biological samples were administered and collected by trained medical investigators supported by a full clinical team. The study is sponsored by Institut Pasteur (Pasteur ID-RCB number: 2012-A00238-35). It was conducted as a single centre study and without any investigational product and was approved by Comité de Protection des Personnes – Ouest 6 on 13 June 2012 (CPP Ouest 6-728/MS2) and by Agence Nationale de Sécurité du Médicament on 22 June 2012 (ID-RCB number: 2012-A00238-35, reference ANSM: B120239-70). The protocol, which is registered under ClinicalTrials.gov (NCT01699893), was designed and conducted in accordance with the Declaration of Helsinki and good clinical practice as outlined in the International Conference on Harmonization of Technical Requirements for Registration of Pharmaceuticals for Human Use Guidelines for Good Clinical Practice.
Data collection
Covariates
During the medical visit, investigators measured BMI using standardised methods and collected information related to age, sex, smoking status, educational level, employment status, occupational category, income level and physical activity.
Gut microbiota profiling from stool samples
Gut microbiota composition was determined through the sequencing of the 16S ribosomal RNA gene in stool samples produced at home maximum 24 h before the scheduled medical visit, collected in a double-lined sealable bag maintaining strict anaerobic conditions and aliquoted and stored at −80°C upon reception at the clinical site. Detailed information regarding DNA preparation, barcoding PCR protocol, sequencing and computation of microbial diversity indexes are provided in online Supplementary Material and Methods 1.
Untargeted NMR metabolomics analysis in plasma samples
Fasting whole blood was collected in heparin tubes and centrifuged (300 g , 10 min, room temperature) maximum 6 h after blood draw, and supernatants were stored at −80°C maximum 10 min after centrifugation. Plasma samples underwent two freeze-thaw cycles before proton NMR analysis, the additional freeze-thaw cycle being done for all samples in order to prepare internal quality control samples necessary for the study(Reference Gika, Zisi and Theodoridis34,Reference Dunn, Broadhurst and Begley35) and so that all samples would go through the same process. The NMR analysis was performed blindly on samples (randomised for age and sex) according to a previously published protocol(Reference Lécuyer, Victor Bala and Deschasaux36). Briefly, two complementary one-dimensional NMR sequences were acquired per plasma sample, on a 500 MHz-Bruker Avance III spectrometer (Bruker) at 300 K – namely the 1H one-dimensional NMR pulse sequence nuclear Overhauser effect spectroscopy (NOESY1D) with z-gradient (Bruker pulse program noesygppr1d) and the Carr–Purcell–Meiboom–Gill (CPMG) sequences. Consequently, to acquisition, all spectra were pre-processed, calibrated and ultimately ‘sliced’ into ‘buckets’ with pre-defined limits so as to maximise recovery of peak entities. The buckets were then scaled to the total summed integrals for each spectrum, and the integrals of peak entities were calculated to obtain continuous NMR variables that were used in further statistical analyses. Finally, NMR signals were assigned using ad hoc literature(Reference Nicholson, Foxall and Spraul37). CHENOMX software (CHENOMX) and the Human Metabolome Database(Reference Wishart, Jewison and Guo38) were used to confirm the assignments using the medium spectrum (online Supplementary Fig. S3)(Reference Nicholson, Foxall and Spraul37). After the statistical analyses, the assignments of the buckets that was associated with the gut microbiota were newly carefully looked and confirmed to be unambiguously assigned by gathering information from S-total correlated spectroscopy, additional two-dimensional NMR experiments (recorded on random samples) such as 1H–1H total correlated spectroscopy and J-resolved experiments. The detailed NMR metabolomic analysis protocol (sample preparation, post-acquisition spectra pre-processing and intelligent bucketing of spectra and obtaining of NMR variables) is provided in online Supplementary Material and Methods 2.
Statistical analyses
Associations between each NMR variable and each α-diversity index were tested using non-parametric partial Spearman correlations. Associations between each NMR variable and inter-individual dissimilarities in gut microbiota composition (Bray–Curtis index of β-diversity) were tested using permutational ANOVA (PERMANOVA) with 999 permutations. Associations between each NMR variable and the relative abundances of genera and species were tested using multivariate associations with linear models (MaAsLin). This statistical framework performs boosted, additive general linear models and is suited to test the associations between the relative abundance of microbial community members and metadata (here the NMR variables and covariates). Relative abundances are first transformed through a variance-stabilising arcsin-square root transformation. Genera and species were included only if their relative abundance and prevalence were higher than 0·01 and 1 %, respectively.
Partial Spearman correlations, PERMANOVA and MaAsLin were all multi-adjusted for age (20 to <30, 30 to <40, 40 to <50, 50 to <60, and 60 to <70 years old), sex, BMI (continuous variable, in kg/m2), smoking status (non-smoker, ex-smoker, current smoker) and physical activity (continuous variable, in h/week). These covariates were indeed reported in the literature to have a potential impact on gut microbiota composition or metabolomic signature, or significantly associated with microbial or metabolomic features in our analyses. These associations between covariates and gut microbial and metabolomic features were tested using PERMANOVA and principal component partial R 2 analysis, respectively, enabling to measure the percentage of variation in microbial composition or metabolomic data explained by the factors tested. Additionally, α- and β-diversity models (partial Spearman correlations and PERMANOVA) were adjusted for sequencing depth. P-values were adjusted for multiple testing using a Benjamini–Hochberg correction with a 10 % false discovery rate.
To better visualise the inter-individual variation in metabolomics signatures in our study sample, principal component analysis of the metabolomic data sets was plotted and colour-coded based on age, sex and BMI.
Spearman correlations were performed using SAS 9.4; PERMANOVA, MaAsLin, principal component partial R 2 and principal component analysis representations of metabolomic data sets were performed using R 3.3.2 (packages vegan, Maaslin, FactoMineR and FactoExtra).
Results
Characteristics of the study sample
Among 1000 participants to the Milieu Intérieur study, 138 were excluded from the study sample because of missing gut microbiota composition data – due to failure during PCR, insufficient number of detected reads or insufficient quantity of stool aliquot or DNA extracted. Among the 862 participants with available gut microbiota data, sixteen were further excluded because their metabolomic signatures could not be determined – due to insufficient quantity of plasma aliquot or failure during NMR spectra acquisition. Participant flow chart is presented in online Supplementary Fig. 1. Characteristics of the 846 subjects are presented in Table 1. Mean BMI was 24·3 (sd 3·3) kg/m2, and mean physical activity (including both professional and leisure physical activity) was 5·4 (sd 6·3) h/week. The proportion of smokers was 19·9 %.
Table 1. Characteristics of the study population, Milieu Intérieur study, France, 2012 (n 846)
(Numbers and percentages; mean values and standard deviations)
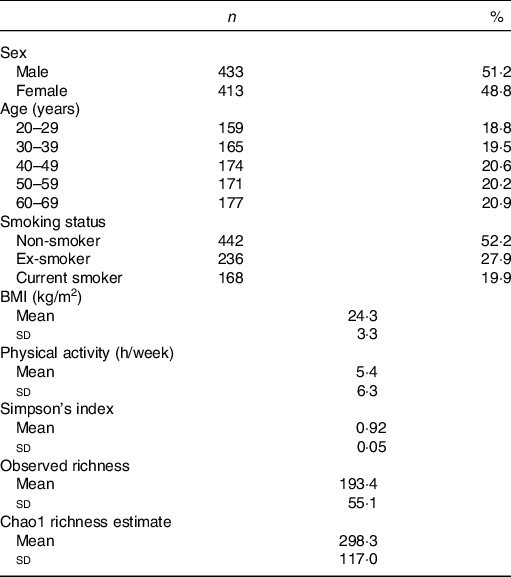
Characteristics of the gut microbiota in the Milieu Intérieur study have been previously described(Reference Scepanovic, Hodel and Mondot39,Reference Partula, Mondot and Torres40) . Microbiota analysis yielded sequencing depth ranging from 5064 to 240 472 reads per sample (mean sequencing depth 21 427 (sd 19 180) reads). Detected reads clustered into 8422 operational taxonomic units were classified into eleven phyla, 328 genera and 698 species. Firmicutes (mean relative abundance 0·68 (sd 0·13)), Bacteroidetes (0·29 (sd 0·13)), Proteobacteria (0·02 (sd 0·03)), Actinobacteria (0·007 (sd 0·01)) and Verrucomicrobia (0·004 (sd 0·008)) were the five most abundant phyla. Online Supplementary Table S1 presents the twenty-two genera constituting the ‘core microbiota’ – defined as the genera shared by at least 95 % of samples(Reference Falony, Joossens and Vieira-Silva41) – in our study population. A complete description of genera and species composing the gut microbiota of our sample is available in online Supplementary Table S2. Regarding α-diversity indexes, Simpson’s index ranged from 0·41 to 0·98 (mean 0·92 (sd 0·05)); observed richness from 56 to 346 (mean 193·4 (sd 55·1)) and Chao1 richness estimate from 62 to 1039 (mean 298·3 (sd 117·0)). Univariate associations measuring the percentage of variation in inter-individual dissimilarities in the gut microbial composition (Bray–Curtis index of β-diversity) that is explained by different covariates (age, sex, BMI, smoking status, physical activity and sequencing depth) are shown in online Supplementary Table S3.
NMR analysis on plasma samples generated 260 CPMG and 269 NOESY1D variables. Spectral regions most likely corresponding to noise (i.e. CPMG regions 0–0·5, 4·3–5·0 and 8·55–10·0 ppm; and NOESY1D regions 4·3–5·0 and 9·5–11·0 ppm) were excluded from further analysis. A list of the resulting 424 NMR continuous variables used in our analyses (202 CPMG signals and 215 NOESY1D: spectral regions with their metabolite assignments, as well as mean and sd) is presented in online Supplementary Tables S4 and S5. Results of the principal component analysis performed on the CPMG and NOESY1D metabolomic data sets are shown in Fig. 1 and online Supplementary Fig. S2, respectively. Although no clear clustering appears, grouping patterns along gradient of sex, age and BMI can be observed. Results of the principal component partial R 2 analysis measuring the percentage of variation in the metabolomic data set that is explained by the covariates (age, sex, BMI, smoking status and physical activity) are shown in online Supplementary Table S6.
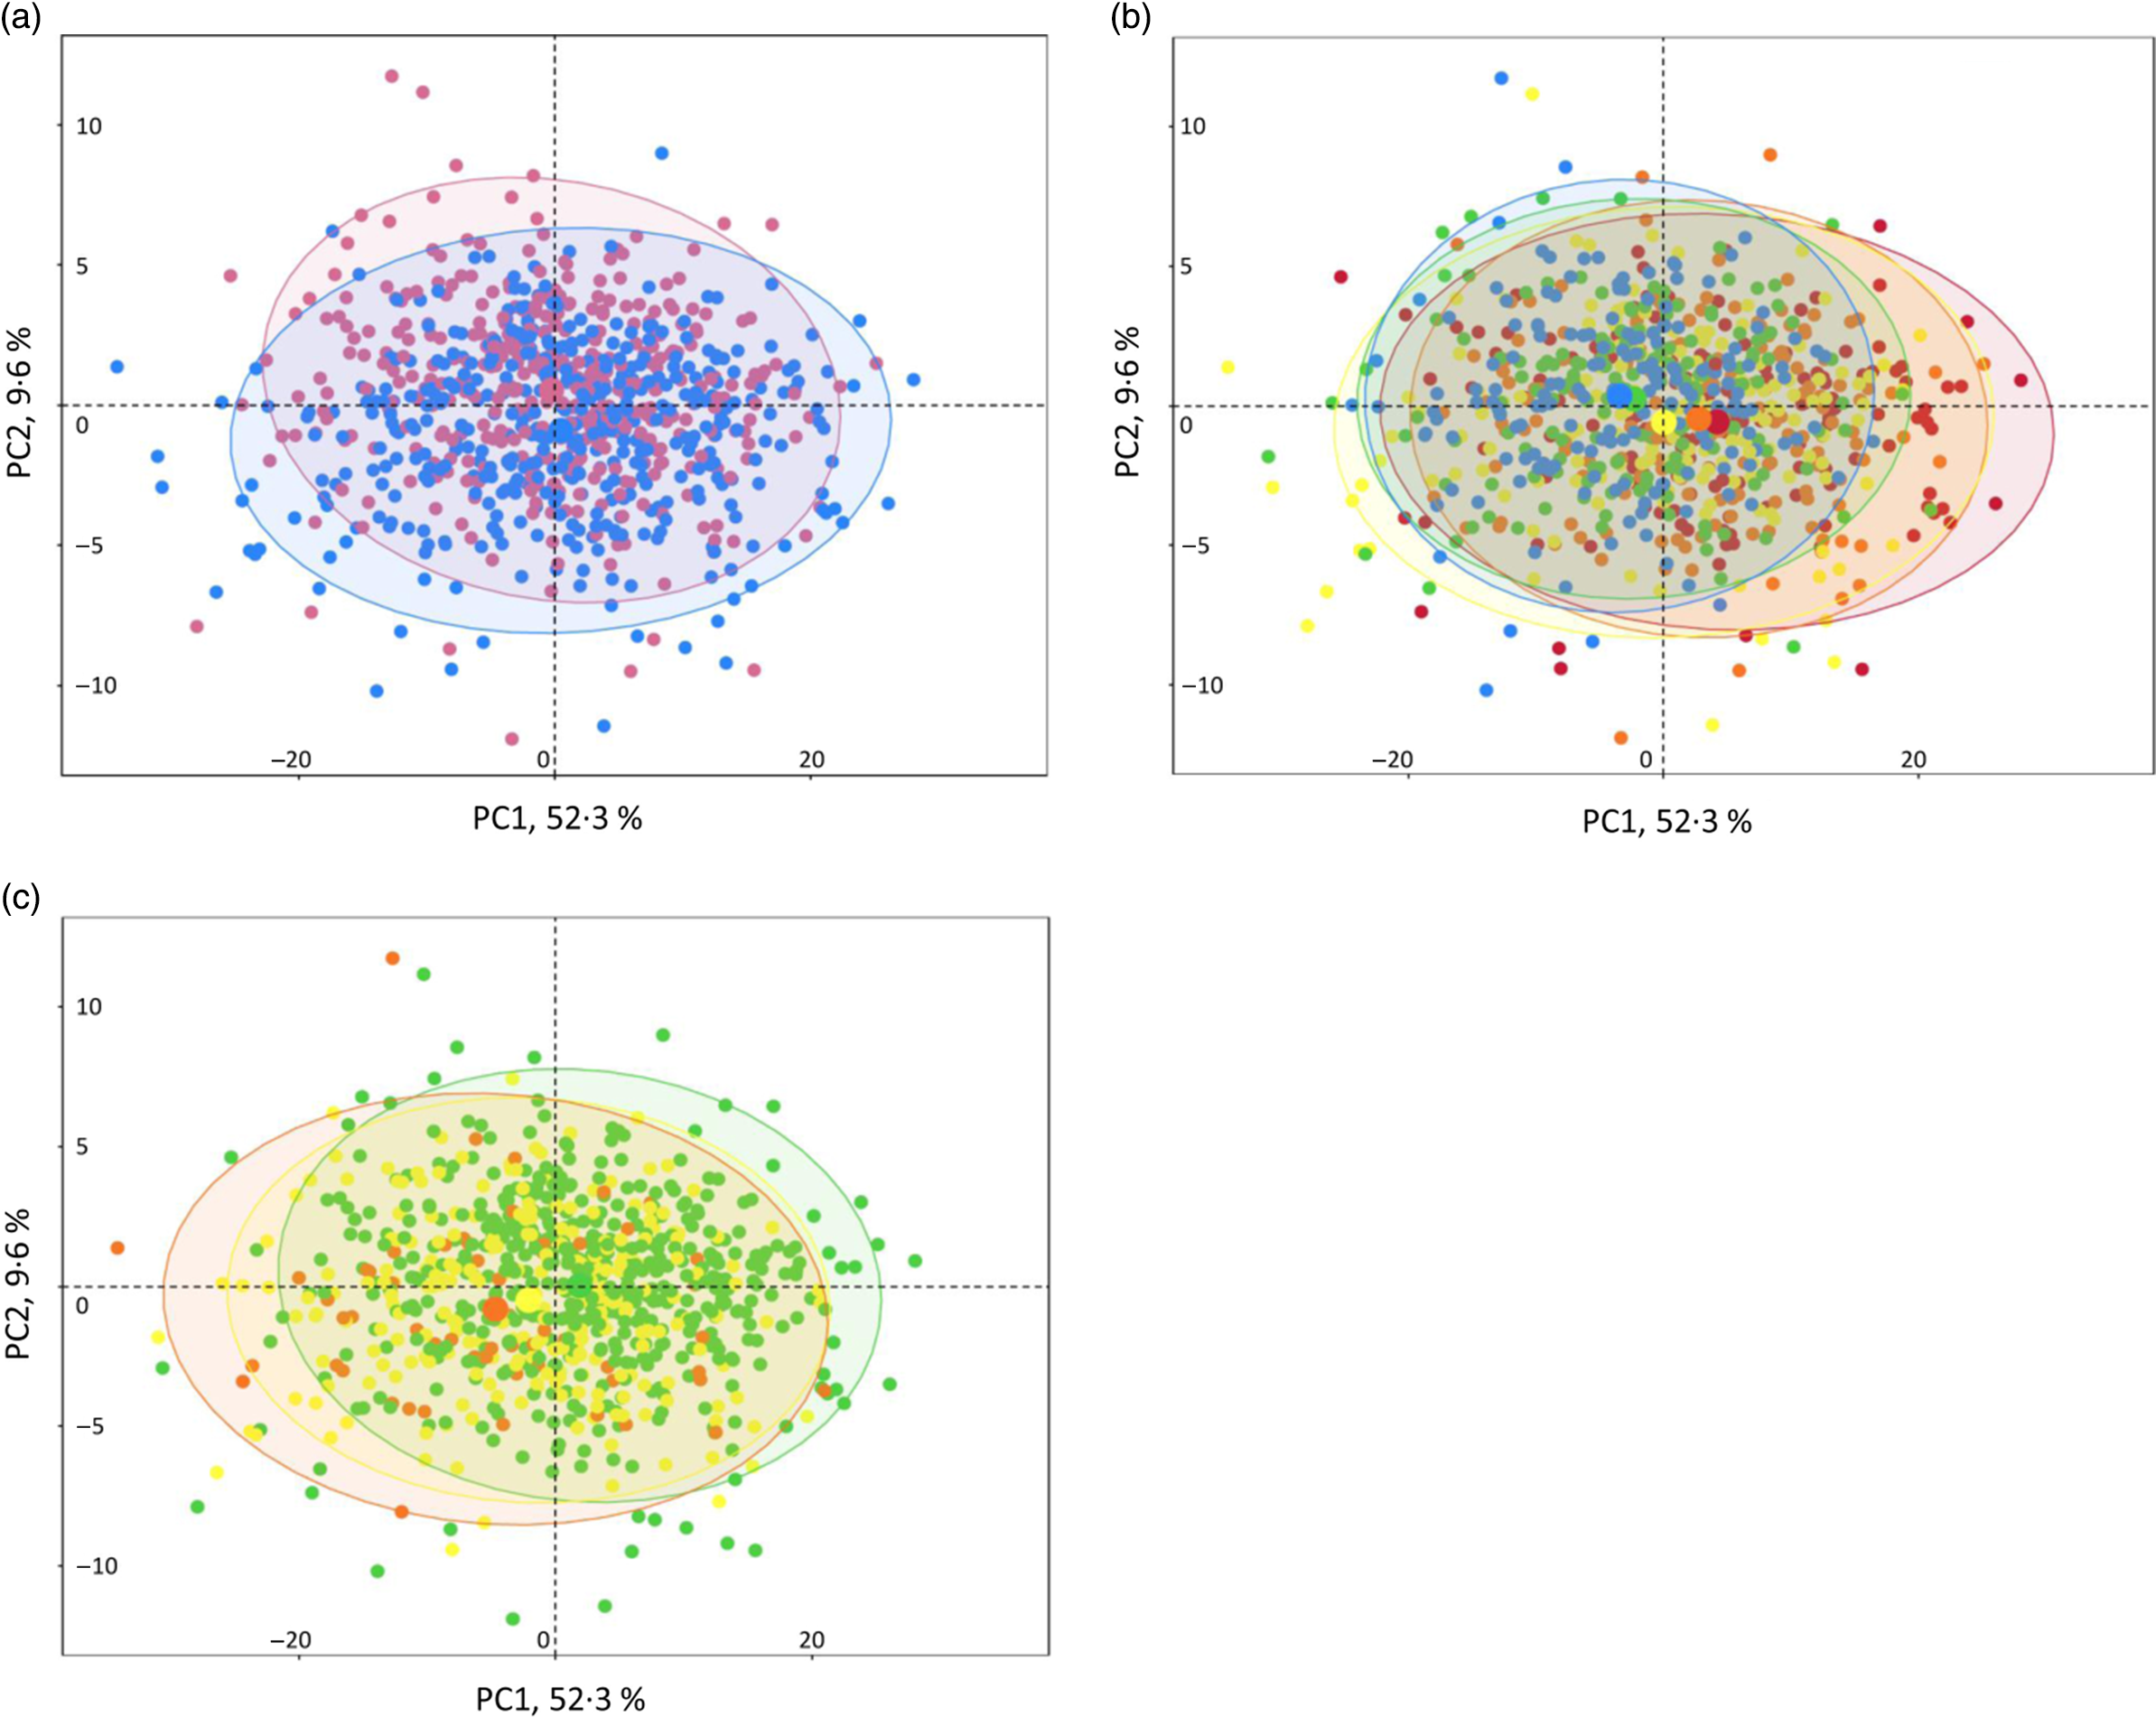
Fig. 1. Interindividual variation in metabolomic signatures represented by principal component (PC) analysis (PCA) of the Carr–Purcell–Meiboom–Gill (CPMG) metabolomic data set, Milieu Intérieur study, France, 2012 (n 846). Each point represents an individual from the study sample. PCA was obtained via the PCA function (package FactoMineR) and plotted and colour-coded based on sex (a), age (b) and BMI (c) via the fviz_pca_ind function (package FactoExtra). Concentration ellipses (95 %) are shown. Percentages on the axes represent the proportion of variation explained by the two first components of the PCA. (a) ![]() , Female;
, Female; ![]() , male. (b)
, male. (b) ![]() , 20 to <30 years;
, 20 to <30 years; ![]() , 30 to <40 years;
, 30 to <40 years; ![]() , 40 to <50 years;
, 40 to <50 years; ![]() , 50 to <60 years;
, 50 to <60 years; ![]() , 60 to <70 years. (c)
, 60 to <70 years. (c) ![]() , 18·5 to <25 kg/m2;
, 18·5 to <25 kg/m2; ![]() , 25 to <30 kg/m2;
, 25 to <30 kg/m2; ![]() , 30 to <35 kg/m2.
, 30 to <35 kg/m2.
Associations between plasma metabolomic signals and α- and β-diversity indexes
The associations between metabolomic variables and α-diversity indexes are presented in Fig. 2. Overall, and after correcting for multiple testing with a 10 % false discovery rate, observed richness was associated with twenty-four CMPG and eight NOESY1D signals. Negative associations were observed with lipid-related signals (namely lipoproteins or unsaturated lipids) as well as with ester- and ketone-related metabolites (partial Spearman’s ρ range −0·133 to −0·097), while positive associations were detected with signals pertaining to amino acids (polar glutamine and histidine and aromatic tyrosine, as well as related metabolites) and proteins, creatinine, as well as with choline- and glycolysis-related metabolites (glucose and citrate) (partial Spearman’s ρ range 0·087 to 0·126). Similar results were obtained with Chao1 richness estimate, but no association was detected with Simpson’s α-diversity index. Likewise, no association was observed between NMR metabolomic variables and inter-individual dissimilarities in gut microbiota composition (Bray–Curtis β-diversity index).
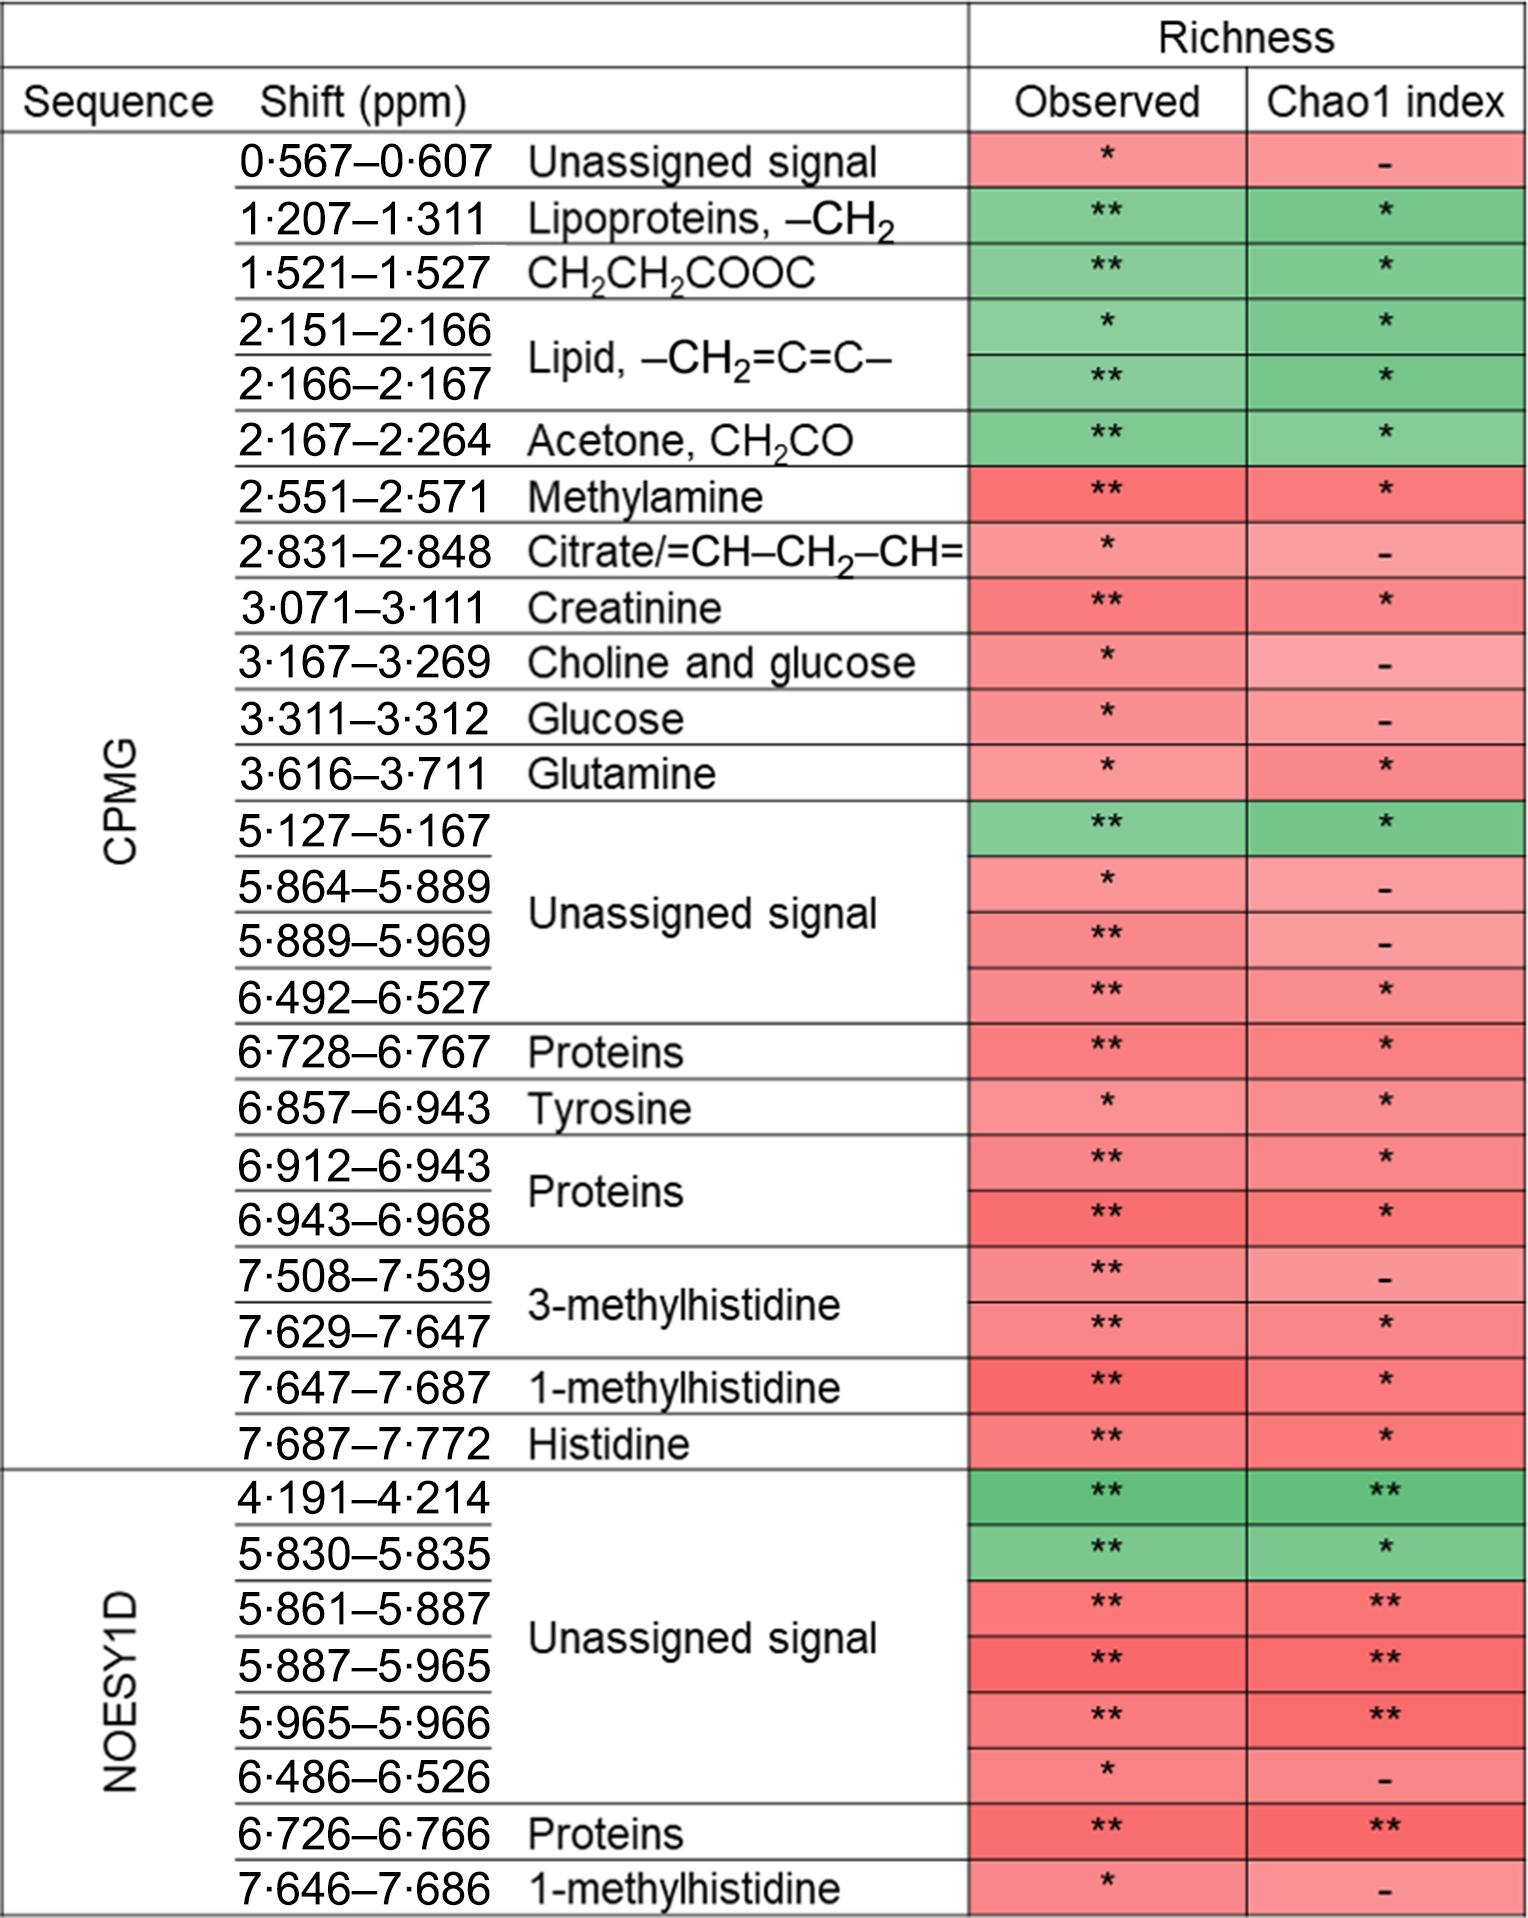
Fig. 2. Associations between NMR variables and α-diversity indexes (observed richness and Chao1 estimate of richness) from Spearman partial correlations adjusted for age, sex, BMI, smoking status, physical activity and sequencing depth, Milieu Intérieur study, France, 2012 (n 846). Q-values were obtained applying a multiple testing correction (Benjamini–Hochberg false discovery rate method). Only associations with Q-value ≤0·1 for observed richness, as well as subsequent associations with Chao1 richness are presented. ** P-value ≤ 0·003 and Q-value ≤ 0·05; * P-value ≤ 0·01 and Q-value ≤ 0·1; –, P-value ≤ 0·05 and Q-value >0·1. Corresponding values are shown in online Supplementary Table S7. Spearman ρ: ![]() , 0·13;
, 0·13; ![]() , −0·13. ppm, Parts per million; CPMG, Carr–Purcell–Meiboom–Gill; NOESY1D, 1H one-dimensional NMR pulse sequence nuclear Overhauser effect spectroscopy.
, −0·13. ppm, Parts per million; CPMG, Carr–Purcell–Meiboom–Gill; NOESY1D, 1H one-dimensional NMR pulse sequence nuclear Overhauser effect spectroscopy.
Associations between plasma metabolomic signals and bacterial taxa (relative abundances)
The associations (significant at 10 % false discovery rate) between NMR metabolomic variable and the relative abundance of gut microbiota genera and species are presented in Table 2. At the genus and species levels, twenty-five and nineteen associations were detected, respectively. Associated taxa comprised genera and species with prevalence ranging from 20 to 100 % of the study population. Creatinine was the metabolite associated with most taxa (sixteen genera and eleven species). Notably, consistent positive associations were found between the CPMG and the NOESY1D analyses for genera Catabacter, Saccharofermentans and Oscillibacter, and a negative association was observed for Faecalibacterium prausnitzii.
Table 2. Associations between NMR variables and relative abundances of taxa with a Q-value ≤ 0·1 after multiple testing correction, using multivariate associations with linear models (MaAsLins), Milieu Intérieur study, France, 2012 (n 846)
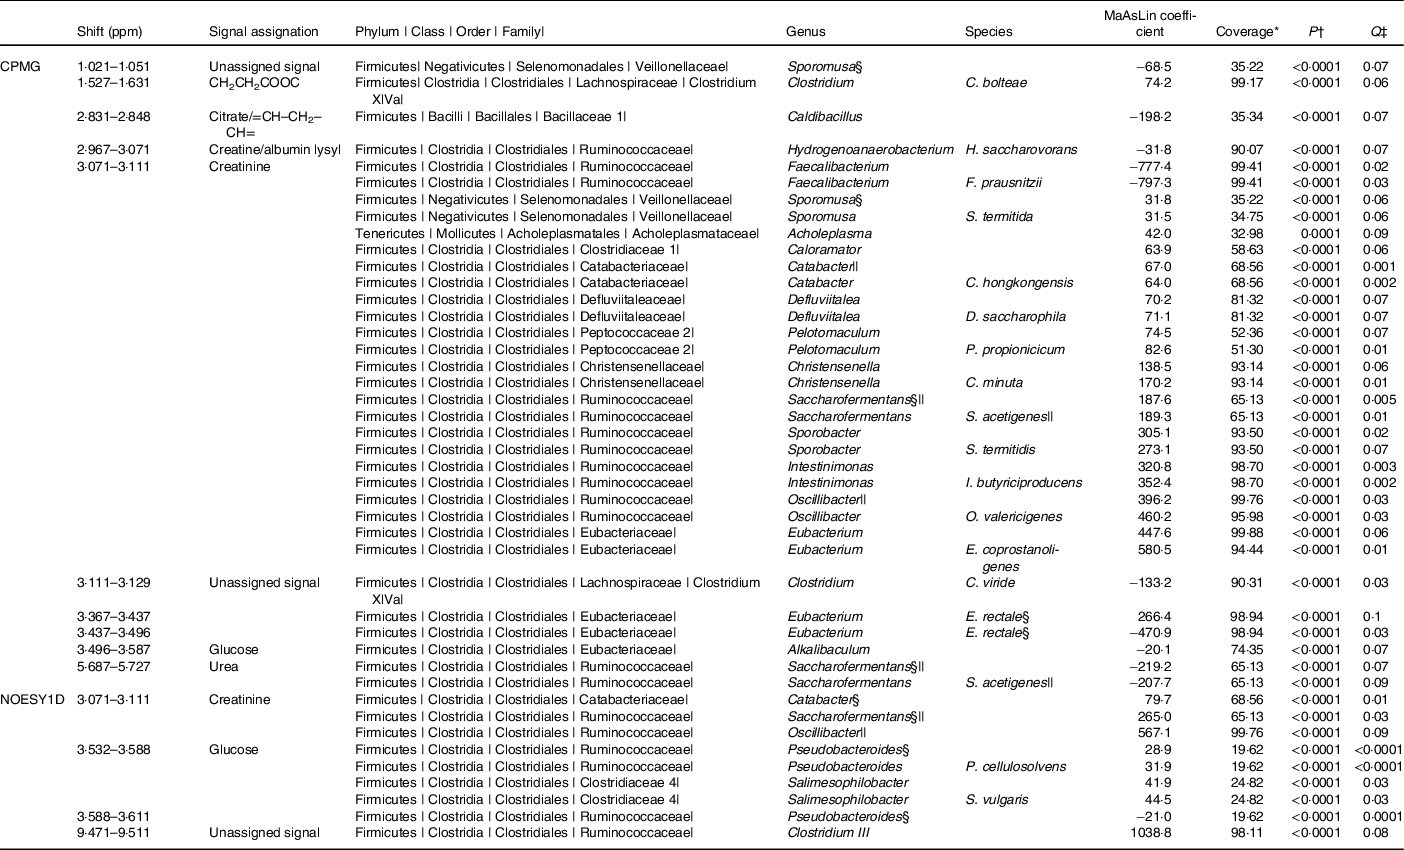
ppm, Parts per million; CPMG, Carr–Purcell–Meiboom–Gill; NOESY1D, 1H one-dimensional NMR pulse sequence nuclear Overhauser effect spectroscopy.
* Prevalence of bacterial taxa in the study sample.
† P-value for MaAsLin adjusted for age, sex, BMI, smoking status and physical activity before Benjamini–Hochberg correction; computed using the MaAsLin package on R.
‡ Corrected P-value (Benjamini–Hochberg method, 10 % false discovery rate). Only associations with a Q-value ≤ 0·1 are presented.
§ Taxa found in association with at least two NMR signals.
|| Taxa found with both CPMG and NOESY1D.
Discussion
In the present work, we investigated the associations between characteristics of the gut microbiota – namely α-diversity, inter-individual dissimilarities and the relative abundances of genera and species – and plasma NMR metabolomic signatures of the host in a large population-based sample of 846 healthy French adults. Overall, our results suggest that gut bacterial features are associated with the systemic metabolism of the host. In particular, we found that bacterial richness was positively associated with signals pertaining to amino acids (glutamine, histidine, tyrosine), as well as with creatinine-, choline- and glycolysis-related metabolites, while negative associations were observed with lipid-, as well as ester- and ketone-related signals. Finally, specific associations between metabolomic signals and bacterial members of the gut microbiota were detected.
The metabolic relevance and importance of the gut microbiota for the host are now widely admitted, and research scrutinising host–gut microbial metabolic relationships is an active area of investigation(Reference Daliri, Wei and Oh42). However, studies investigating direct associations between gut microbiota composition and host blood metabolome in large population-based samples are scarce, while more available studies have been conducted on a limited number of participants or focused on specific populations(Reference Pedersen, Gudmundsdottir and Nielsen15,Reference Cui, Ye and Li23,Reference Lin, Ye and Zu26,Reference Liu, Hong and Xu27) . In particular, a study by Org et al. (Reference Org, Blum and Kasela28) assessed the relationships between gut microbiota composition and circulating metabolites in 531 healthy Finnish males from the METSIM cohort. Consistent with their study, we reported positive correlations between bacterial richness and glutamine, histidine and creatinine – with similar Spearman correlation coefficients. Furthermore, a study on 399 subscribers to a US Scientific Wellness programme was able to explain 45 % of the gut microbiota α-diversity with forty plasma metabolites, among which a high frequency of phenylalanine and tyrosine metabolites (including p-cresol sulphate, a potentially uraemic toxin) and hippurate(Reference Wilmanski, Rappaport and Earls32), while a study in 1529 females from the TwinsUK cohort found five metabolites that consistently correlated with gut microbiota α-diversity (Shannon index) including hippurate, p-cresol sulphate, phenylacetylglutamine, 3-phenylpropionate and hyodeoxycholate(Reference Pallister, Jackson and Martin31).
In a study conducted on 893 participants from the Dutch LifeLines-DEEP cohort, Fu et al. (Reference Fu, Bonder and Cenit13) measured specific lipid levels through targeted colorimetric methods and found that TAG and HDL were, respectively, negatively and positively associated with both bacterial richness and diversity. Consistently, a more recent study using NMR metabolomics in 2309 individuals from the Rotterdam Study and the LifeLines-DEEP cohort observed inverse associations between the diversity of the gut microbiota and serum levels of not only VLDL particles, TAG, total fatty acids, MUFA and SFA but also glycoprotein acetyl, alanine, isoleucine and lactate and positive associations with HDL particles. In addition, Le Chatelier et al. (Reference Le Chatelier and Nielsen43) associated a decreased gut microbial richness with metabolic impairments such as increased fat mass and body weight, inflammation of the adipose tissue and dyslipidaemia. In the present work, we consistently found that lipid-related metabolomic signals were negatively associated with bacterial richness. However, we were unable to further characterise these lipid-related signals and discriminate between the different lipid classes potentially hampering the detection of specific associations previously reported(Reference Fu, Bonder and Cenit13,Reference Org, Blum and Kasela28) . Indeed, long-chain metabolites such as fatty acids result in an overlap of signals of protons in NMR, limiting a more specific assignment(Reference Khoury, Canlet and Lacroix44). Still, it should be noted that, in our sample, NMR signals assigned to lipids demonstrated excellent correlation with blood TAG (Spearman’s ρ > 0·65, P-value < 0·0001 for spectral regions 1·207–1·311, 2·151–2·166 and 2·166–2·167 ppm), adding support to the consistency of our results with those previous findings. Furthermore, high-fat Western diet has consistently been associated with gut microbiota impairments(Reference Davis, Yadav and Barrow45,Reference De Filippo, Cavalieri and Di Paola46) , and lipid-related signals in our study correlated positively with dietary intakes of processed meat (Spearman’s ρ = 0·09, P-value = 0·006 for spectral regions 2·166–2·167 ppm and ρ = 0·08, P-value = 0·02 for 1·207–1·311 and 2·151–2·166 ppm) and fried products (ρ = 0·07, P-value = 0·04 for 2·166–2·167 ppm), and negatively correlated with fruit (ρ = −0·09, P-value = 0·01 for 1·207–1·311 and 2·166–2·167 ppm and ρ = −0·08, P-value = 0·02 for 2·151–2·166 ppm) and vegetables (ρ = −0·09, P-value = 0·007 for 2·166–2·167 ppm and ρ = −0·07, P-value = 0·04 for 2·151–2·166 ppm). Nonetheless, these assumptions should be considered with caution as additional exploration and targeted identification of these lipid signals using MS or lipidomics are necessary to get more detailed insights into the associations we observed.
Our finding of a positive association between glutamine and gut bacterial richness echoes a result from De Souza et al. (Reference Zambom de Souza, Zambom and Abboud47) who suggested that glutamine might have an anti-inflammatory effect through a modulation of specific gut bacterial members following the observation that an oral supplementation with l-glutamine decreased the Firmicutes:Bacteroidetes ratio in obese and overweight adults.
In our study, creatinine was the metabolomic signal most associated with the relative abundances of bacterial taxa. This by-product of muscle metabolism is exclusively excreted through the kidneys, and a high creatinine level in blood is notably used as an indicator of kidney dysfunction(Reference Chhibber-Goel, Singhal and Parakh48). Our finding of positive associations between plasma creatinine and the relative abundance of various representatives of the Clostridiales order and the Ruminococcaceae family matches results from Org et al. (Reference Org, Blum and Kasela28). We also reported a negative association between creatinine and Faecalibacterium prausnitzii, a species drawing a particular attention from the research community as it has been shown to exert anti-inflammatory properties through its ability to produce anti-inflammatory metabolites (e.g. butyrate), or to inhibit of the production of pro-inflammatory cytokines(Reference Ferreira-Halder, Faria and Andrade49). Various studies have reported that F. prausnitzii is reduced in conditions such as ulcerative colitis, inflammatory bowel disease, colorectal cancer, diabetes, psoriasis, etc.(Reference Ferreira-Halder, Faria and Andrade49–Reference Machiels, Joossens and Sabino51). Consequently, this species has been proposed as a potential biomarker of gut health(Reference Lopez-Siles, Duncan and Garcia-Gil52) and is even considered as an interesting probiotic candidate(Reference Martín, Miquel and Benevides53). In particular, a decrease in F. prausnitzii was previously reported in chronic kidney disease patients compared with healthy controls(Reference Jiang, Xie and Lv54,Reference Jiang, Xie and Lv55) . This echoes our result of a negative association between F. prausnitzii and creatinine obtained in a healthy sample without renal dysfunction. Overall, the numerous associations we detected between bacterial taxa and creatinine are in support of a gut-kidney conversation(Reference Chen, Chen and Chen56,Reference Evenepoel, Poesen and Meijers57) . In this previously described bi-directional organ axis, the gut contributes to inflammation and renal injury through microbiota dysbiosis and dysregulations in microbial metabolite production. Conversely, kidney perturbations lead to dysbiosis and disruptions in tight junction function therefore promoting inflammatory conditions in the gut. Notably, Jiang et al. (Reference Jiang, Xie and Lv55) reported that indicators of the renal function such as serum creatinine, estimated glomerular filtration rate and cystatin C were the most important environmental parameters to influence the overall microbial communities in end-stage renal disease patients. In our study, a link between the gut and the kidneys seemed to be already observed even in a healthy setting where individuals were free of kidney or gut impairments. However, further exploration of renal function indicators (e.g. estimated glomerular filtration rate, cystatin C and urine creatinine) would be of utmost importance to confirm such a link. If we hypothesise a gut–kidney axis to interpret our results, alternate interpretations could also be proposed. Indeed, negative associations have also been reported between trimethylamine N-oxide and F. prausnitzii (Reference Org, Blum and Kasela28,Reference Sanchez-Alcoholado, Castellano-Castillo and Jordán-Martínez58) , and creatinine is a precursor for the gut bacterial synthesis of trimethylamine, which is further oxidised into trimethylamine N-oxide in the liver(Reference Chhibber-Goel, Singhal and Parakh48). Therefore, we cannot rule out that the association we observed between creatinine and F. prausnitzii may actually reflect the overall trimethylamine N-oxide metabolic pathway instead of being a true association. However, because trimethylamine N-oxide could not be detected by NMR in our study, it was not possible to verify this assumption.
An important strength of this work pertains to its design – namely the acquisition of both detailed metabolomics data and gut microbiome data in a large population-based sample of healthy adults. While individual or specific approaches consider biomolecules separately, metabolomics allows for the simultaneous detection and relative quantification of hundreds of molecules, hence the monitoring of subtle system-wide metabolic interactions(Reference Patti, Yanes and Siuzdak59). In this study, we used NMR metabolomics with standardised and optimised protocols yielding high-quality data(Reference Beckonert, Keun and Ebbels60). This robust and stable technology has demonstrated its suitability for long-term epidemiological studies(Reference Dumas, Maibaum and Teague61), notably by allowing to analyse large samples quickly with a high reproducibility(Reference Emwas, Roy and McKay62). From a statistical standpoint, the analyses implemented here allowed to explore detailed associations between gut bacterial and metabolomic data sets, beyond the sole assessment of global connections obtained through multivariate correlation-based approaches (e.g. co-inertia or Procrustes analyses). In addition, we were able to take into account a range of factors reported to influence the gut microbiota composition or the systemic metabolism of the host in our models, thus mitigating potential confounding. Nonetheless, residual confounding cannot be ruled out. For instance, intestinal transit time was shown to be a major confounding factor of gut microbiota composition(Reference Roager, Hansen and Bahl63), and we were not able to collect this information. Another important strength and originality of this work is that it was based on a large sample from the general population including only healthy men and women selected using strict criteria. Hence, our results were not confounded by underlying disease and reflected normal range. Yet, this may also have induced less variations in plasma metabolites levels or in gut microbiota composition and therefore resulted in associations of smaller magnitude. Some limitations should also be acknowledged for this study. First, the cross-sectional design of our study, in which blood and stool samples were taken at the same time, prevents from drawing any conclusion regarding the sequential causality of events between host metabolism (e.g. creatinine levels) and gut microbiota composition (e.g. F. prausnitzii). Further, plasma metabolomic signatures only give a metabolic ‘snapshot’ that results from both the endogenous and the gut microbial metabolisms, which makes it not possible to discriminate signals from human or microbial origin. In future studies, subsequent time points with both metabolomic and microbiota data collected would be of utmost interest to investigate the stability over time and the chronology of the associations observed in the present cross-sectional work. In addition, the fact that most detected metabolites result from multiple metabolic pathways that may be related to gut microbiota or not may also explain the modest correlation coefficients observed between plasma metabolites and gut microbial richness. It should also be acknowledged that, although highly informative, the use of 16S rRNA gene sequencing and NMR metabolomics presents technical limitations. Shotgun metagenomics for instance would give a more precise characterisation of microbiota features and also bring additional information regarding the functional metabolic capacity of the gut microbiota. This would allow to go beyond the compositional approach, limited by the redundancy of gene pool and metabolic functionalities between distinct gut microbial members(Reference Abubucker, Segata and Goll64,Reference Holmes, Li and Marchesi65) , but still relevant according to recent studies arguing that some metabolic pathways pertain to a handful of species(Reference Morrison and Preston66). Likewise, while NMR detects only the most abundant metabolites (µm to mm range), MS has lower detection limits and higher sensitivity for signal assignment and would therefore allow the detection of metabolites undetectable with NMR(Reference Riekeberg and Powers67). This technical limitation of NMR may explain why several low-concentration metabolites deriving specifically from gut microbiota were not detected in our study. As already mentioned, the precision of NMR bucket assignment was also limited for some metabolites, especially for lipids and proteins. For instance, the unsaturation corresponds to a chemical function in the aliphatic chain of various lipids, and it is impossible to differentiate among the different lipid types within the plasma sample. Hence, this limits the comparability of our results to prior studies. In addition, plasma samples underwent two freeze-thaw cycles prior to NMR analyses (necessary to prepare internal quality controls) so that the possibility of increased metabolites cleavage cannot be ruled out. Still, this would similarly affect all samples as they all went through the same process.
Although the Milieu Intérieur population is somewhat representative of the French Ille-et-Vilaine region(Reference Thomas, Rouilly and Patin33), our study sample is not representative of the whole French adult population – caution is therefore needed in the generalisation of our results. However, it is important to acknowledge that from a gut microbiota composition standpoint, our study sample was consistent with other studies performed in Western settings(Reference Falony, Joossens and Vieira-Silva41,Reference Rothschild, Weissbrod and Barkan68) , with the same five most abundant phyla and shared ‘core genera’ (online Supplementary Table S1). Finally, the results highlighted here were mostly exploratory as they were obtained from a single population. These results will need to be replicated and confirmed in the future, using independent samples and/or analytical techniques allowing a better refinement of the detected metabolites (e.g. MS, lipidomics). In addition, the hypotheses we proposed to interpret our results were based on existing literature and would need to be developed and confirmed in experimental settings in vitro and/or in vivo. In particular, detailed mechanistic studies comprehensively elucidating the metabolic capability of gut microorganisms are needed to enlighten the associations we detected.
Overall, the present study provides interesting insights regarding the associations between gut microbiota composition and plasma metabolic signatures of the host. Our results contribute to a better understanding of the host–gut microbiota relationships and notably highlight a possible gut–kidney axis in healthy subjects. Because the associations we found in healthy individuals were already reported in chronic kidney disease patients, this builds up to the concept that onset of chronic diseases is a lengthy process that could be detected at early stages. This appears all the more interesting that microbial–host co-metabolites were shown to be excellent prodromal markers of future divergence in metabolic and behavioural outcomes in mice(Reference Dumas, Rothwell and Hoyles69). However, our results remain to be confirmed in independent populations, underlying mechanisms to be elucidated and causal implications for the host health to be established.
Acknowledgements
The authors wish to thank École doctorale 474 Frontières du Vivant – Programme Bettencourt for the financial support provided to VP’s PhD. The Milieu Intérieur Consortium¶: Laurent ABEL (Hôpital Necker); Andres ALCOVER; Hugues ASCHARD; Kalla ASTROM (Lund University); Philippe BOUSSO; Pierre BRUHNS; Ana CUMANO; Caroline DEMANGEL; Ludovic DERIANO; James DI SANTO; Françoise DROMER; Gérard EBERL; Jost ENNINGA; Jacques FELLAY (EPFL, Lausanne); Odile GELPI; Ivo GOMPERTS-BONECA; Milena HASAN; Serge HERCBERG (Université Sorbonne Paris Nord); Olivier LANTZ (Institut Curie); Claude LECLERC; Hugo MOUQUET; Etienne PATIN; Sandra PELLEGRINI; Stanislas POL (Hôpital Cochin); Antonio RAUSELL (INSERM U1163 – Institut Imagine); Lars ROGGE; Anavaj SAKUNTABHAI; Olivier SCHWARTZ; Benno SCHWIKOWSKI; Spencer SHORTE; Vassili SOUMELIS (Institut Curie); Frédéric TANGY; Eric TARTOUR (Hôpital Européen Georges Pompidou); Antoine TOUBERT (Hôpital Saint-Louis); Mathilde TOUVIER (Université Sorbonne Paris Nord); Marie-Noëlle UNGEHEUER; Matthew L. ALBERT (Roche Genentech)§; Darragh DUFFY§; Lluis QUINTANA-MURCI§. ¶ Unless otherwise indicated, partners are located at Institut Pasteur, Paris, France. § Coordinator of the Milieu Intérieur Consortium. Additional information can be found at: http://www.milieuinterieur.fr/en
This work was supported by French Government’s Investissement d’Avenir Program, Laboratoire d’Excellence ‘Milieu Intérieur’ grant ANR-10-LABX-69-01. The funding body had no role in the design of the study, the collection, analysis and interpretation of data, or in the writing of the manuscript.
V. P. and M. T. designed the research; L. Q. M., M. L. A., D. D., O. L., M. T. and MI consortium conducted the research; S. M. performed microbiota sequencing; V. P. performed metabolomic signature acquisition; N. B., P. S. and M. N. T. supervised metabolomic signatures acquisition; V. P. performed statistical analysis; M. T. supervised statistical analysis; V. P. wrote the original draft; M. D. T. revised the manuscript; V. P., M. D. T., S. M., A. V. B., N. D., L. L., C. B. D., M. J. T., E. K. G., B. C., E. P., K. E. A., P. L. M., C. J., P. G., S. H., L. Q. M., M. L. A., D. D., O. L., P. S., M. N. T., M. T. and MI consortium contributed to the data interpretation and revised each draft for important intellectual content; M. T. had primary responsibility for final content; and L. Q. M., M. L. A. and D. D. are coordinators of the MI consortium. All authors read and approved the final manuscript.
The authors declare that they have no competing interests.
Supplementary material
For supplementary materials referred to in this article, please visit https://doi.org/10.1017/S0007114520004870


