


Type of feeding after birth has been associated with growth velocity (GV) during the first years of life and may determine growth during childhood and adolescence. Both weight gain during the first 2 years of life and differences in weight-for-age z-score (WAZ) indicator could define child growth pattern(Reference Ong, Ahmed and Emmett1,Reference Stettler, Zemel and Kumanyika2) . Different authors have described a rapid growth pattern in infants associated with higher risk of obesity(Reference Ong, Ahmed and Emmett1,Reference Ong and Loos3–Reference Azad, Vehling and Chan6) , type 2 diabetes and CVD later on(Reference Perng, Hajj and Belfort7–Reference Sutharsan, O’Callaghan and Williams10).
The WHO recommends exclusive breast-feeding (BF) during the first 6 months of life, continuing at least until 24 months of age along with complementary feeding(11,Reference Pecoraro, Agostoni and Pepaj12) . Infant formulas intent to promote an adequate growth, neurodevelopment and health programming in infants, when breast-feeding is not possible(Reference Dipasquale, Serra and Corsello13). However, feeding with infant formulas has been shown to increase weight gain and BMI during the first year of life(Reference Kurniawan, Anggraini and Julia14,Reference Heinig, Nommsen and Peerson15) , compared with breast milk.
During last years, infant formulas have been modified and enriched with bioactive ingredients similar to those present in human milk to provide the necessary amount of energy and nutrients to reach an optimal growth(16). Both the protein and lipid fractions of bovine milk fat globule membrane(Reference Demmelmair and Koletzko17–Reference Zavaleta, Kvistgaard and Graverholt20), long-chain PUFAs (arachidonic acid, DHA, etc.)(Reference Jasani, Simmer and Patole21,Reference Hadley, Ryan and Forsyth22) , synbiotics (probiotics and prebiotics)(Reference Mugambi, Musekiwa and Lombard23,Reference Szajewska, Ruszczyński and Szymański24) , sialic acid and milk oligosaccharides(Reference Charbonneau, O’Donnell and Blanton25,Reference Buyken, Karaolis-Danckert and Remer26) have been added to infant formulas as an alternative to narrow the nutritional and functional gap compared with breast milk. Furthermore, protein content modification(Reference Koletzko, von Kries and Closa27) and infant formula supplementation with different nutrients have been studied to identify their effects on energetic efficiency (EE)(Reference Butte, Smith and Garza28,Reference Fleddermann, Demmelmair and Grote29) , growth, development and immune function compared with breast-feeding(Reference Dipasquale, Serra and Corsello13,Reference Tijhuis, Doets and Vonk Noordegraaf-Schouten30) .
To date, numerous studies have been focused on the effects of enriched infant formulas on growth rates, obesity risk associated with protein intake at early ages and benefits of the fatty acid profile or other nutrients in childhood neurodevelopment(Reference Pecoraro, Agostoni and Pepaj12,Reference Belkind-Gerson, Carreon-Rodriguez and Contreras-Ochoa31–Reference Braun, Erler and Kiefte-de Jong33) . Nevertheless, there is insufficient scientific evidence about the effect of bioactive compounds-enriched infant formulas on infant growth trajectory(Reference Tijhuis, Doets and Vonk Noordegraaf-Schouten30). Having in mind these considerations, the present study was aimed to analyse the potential effects of the type of feeding during the first months of life, as well as its EE, on growth patterns in healthy formula fed (standard v. enriched infant formula) and breastfed (BF) infants up to 18 months of age.
Methods
The present study was carried out following the updated Declaration of Helsinki Principles(34,35) , the Good Clinical Practice recommendations of the ECC (document 111/3976/88 July 1990) and Spanish Royal Decree 561/1993 on clinical trials. All procedures involved in the COGNIS study were approved by the Research Bioethical Committee from the University of Granada, as well as the Bioethical Committees for Clinical Research of San Cecilio and Mother-Infant Hospitals of Granada. All families were informed about protocols and a signed written consent was obtained from each parent or legal guardian before involving each child in the study.
Study design and subjects
The COGNIS study (registered at www.ClinicalTrials.gov, Identifier: NCT02094547) is a prospective, double-blind randomised clinical trial (RCT) with a nutritional intervention using a new infant formula enriched with bioactive nutrients such as milk fat globule membrane components (10 % of total protein (wt:wt)), long-chain PUFAs (DHA and arachidonic acid), synbiotics (mix of fructooligosaccharide and inulin (ratio 1:1), Bifidobacterium infantis IM1 and Lactobacillus rhamnosus LCS-742), nucleotides, sialic acid and ganglioside-enriched whey proteins.
Inclusion criteria
Eligible infants were healthy term infants (37–41 weeks gestational age), with adequate birth weight for gestational age (between 3–97 percentile), normal APGAR score (7–10) and umbilical pH ≥ 7·10. They must have availability to continue throughout the study period, and parents or legal guardians have signed the informed consent.
Exclusion criteria
The exclusion criteria were defined as follows: infants participating in another study; infants who suffered neurological disorders (hydrocephalus, perinatal hypoxia, intraventricular haemorrhage, neonatal meningitis, septic shock, West syndrome, etc.) or gastrointestinal disturbances (mainly cows’ milk protein allergy/intolerance or lactose intolerance); maternal pathological background (neurological diseases, mental illness, metabolopathies (type 1 diabetes mellitus), chronic diseases (hypothyroidism), maternal malnutrition or prenatal infections (TORCH complex, etc.)), mothers who received during pregnancy or lactation drug treatments potentially harmful for neurodevelopment (anxiolytics, antidepressants, etc.); parents impossibility to continue through the study. A detailed description of the COGNIS study can be found in online Supplementary Methods. Briefly, a total of 220 full-term infants were enrolled, 170 of them were randomised (ratio 1:1) to receive, during their first 18 months of life, either a standard infant formula (SF; n 85) or an experimental infant formula (EF; n 85) enriched with bioactive nutrients. A total of fifty exclusively breastfed (BF) infants for at least 2 months were also included as reference group. The present study involved 171 infants at 6 months (SF = 60; EF = 69; BF = 42); 152 infants at 12 months (SF = 51; EF = 63; BF = 38) and 141 infants at 18 months (SF = 48; EF = 56; BF = 37). A detailed participant flow chart from the baseline visit to 18 months of life is shown in Fig. 1.
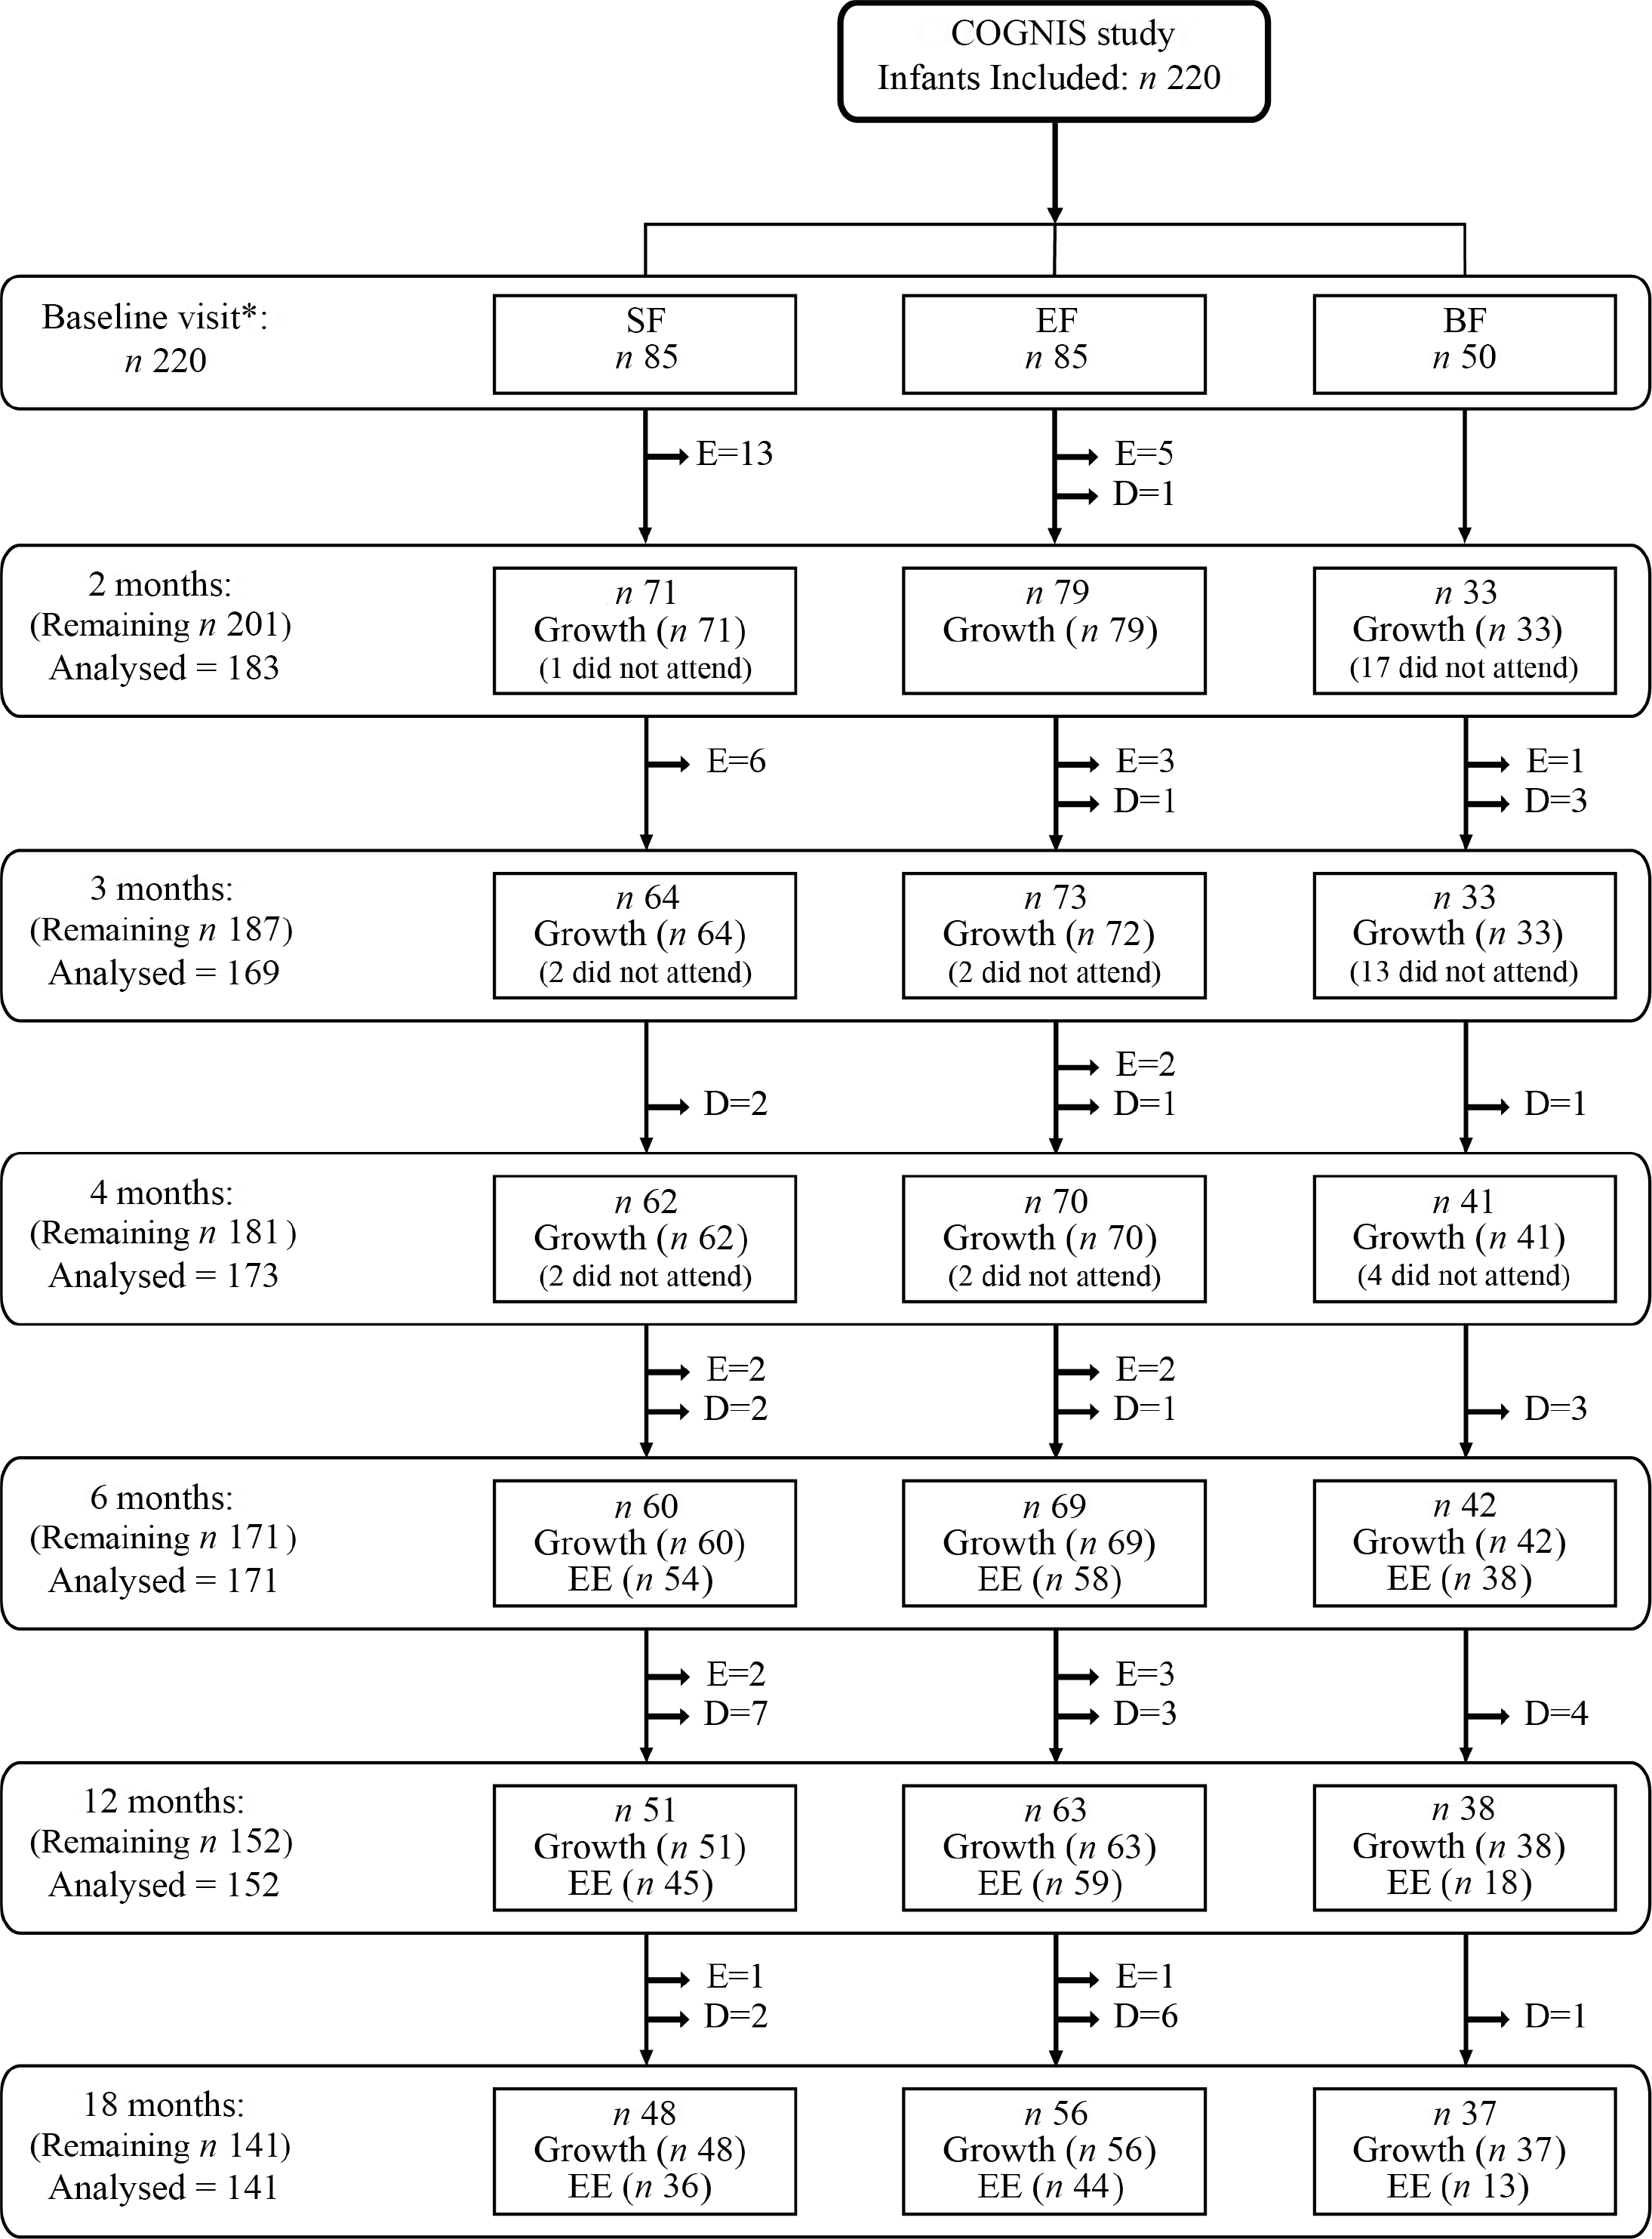
Fig. 1. Dropout rates and exclusions from the baseline visit to 18 months of age. Infants who did not show up at the follow-up visits, but remained in COGNIS study for later visits are described as ‘did not attend’. SF, standard infant formula; EF, experimental infant formula; BF, breastfed infants; EE, energetic efficiency. D = drop outs and E = exclusions, as previously reported(Reference Nieto-Ruiz, García-Santos and Bermúdez41). *SF and EF infants were randomised between 0 and 2 months of age; BF infants were included up to 6 months of age.
Demographical and clinical characteristics
Baseline information about maternal and paternal age, anthropometric characteristics (BMI and height), as well as their educational level, place of residence and intelligence quotient (IQ) was obtained at study entry. Prenatal characteristics (weight gain during pregnancy, siblings, type of delivery and smoking during pregnancy) were also recorded. Data regarding weight, length and head circumference (HC) at birth were taken from clinical records.
Evaluation of infant growth patterns
To analyse the potential effects of the type of feeding on infants growth, anthropometric measurements were collected at 1–2, 3, 4, 6, 12 and 18 months of life by a trained paediatrician, following standard procedures(36); measurements were taken in triplicate and their means were calculated. Analyses of growth patterns were performed by a trained nutritionist. A detailed description of growth measurements analyses can be found in online Supplementary Methods.
Anthropometric data included weight (SOEHNLE Multina Comfort 8352·01·001, max 20 kg), length (Harpenden Infantometer Holtain Model 702, max 91·5 cm) and HC (SECA 212, max 59 cm). All anthropometric parameters were assessed according to the current WHO Child Growth Standards by sex and age(37,38) . WAZ, weight-for-length z-score (WLZ), length-for-age z-score (LAZ), BMI-for-age z-score and HC-for-age z-score (HCZ) were calculated using WHO Anthro software package version 3.2.2 (WHO)(37).
GV was calculated according to weight, length and HC gains/d. Weight gain (g/d), length gain (cm/d) and HC (cm/d) were calculated at three different time intervals: (i) from the baseline visit (formula fed infants groups) or from birth (BF infants) to 6 months of life, (ii) from 6 to 12 months of life and (iii) from 12 to 18 months of life. These data were compared using velocity standards for weight, length and HC of the WHO growth standards presented as 6-month intervals and stratified by sex, to obtain standard deviations (sd). GV was classified as: slow (< –1 sd), normal (≥ –1 sd and ≤ + 1 sd) or rapid (> + 1 sd), based on the cut-off points indicated by WHO for the analysis of growth indicators and the identification of growth problems (≥ + 1 sd and ≤ –1 sd)(36). After this, to identify infant growth pattern developed up to 18 months of age, trajectories of weight, length, HC and growth indicators WAZ, LAZ, WLZ and HCZ were analysed up to 18 months, according to weight GV up to 6 months of age.
Catch-up growth is defined as the variation in infant weight gain rates, which shows a significant growth to compensate from intra-uterine restriction or enhancement of growth, during the first 2 years of life(Reference Ong, Ahmed and Emmett1,Reference Ong and Loos3) . Catch-up growth was calculated as WAZ and WLZ. Differences in z-scores were considered as the three time intervals mentioned above. Afterwards, catch-up growth was classified by the differences in z-scores as follows: slow (< –0·67), normal (≥ –0·67 and ≤ + 0·67) and rapid (> + 0·67)(Reference Ong, Ahmed and Emmett1,Reference Ong and Loos3) .
Estimation of breast milk/infant formula energetic efficiency
This parameter is described as the increase in weight and length according to the energy and macronutrient intake (proteins, carbohydrates and lipids) per day from infant formula or breast milk(Reference Butte, Smith and Garza28,Reference Fleddermann, Demmelmair and Grote29) . The average of energy and macronutrients intake was obtained using a 3-d dietary record at 6, 12 and 18 months. For the infant formula groups, the daily volume of milk (ml) was reported as the amount of water (ml) and powdered formula (g) for infant formula reconstitution. Volume of breast milk intake (ml) was estimated according to infant gastric capacity and theoretical estimates for breast milk intake(Reference Dewey and Brown39,Reference Kent40) . Detailed description in this regard is included in online Supplementary Methods. EE was expressed as (a) weight gain (g/d)/4184 kJ (100 kcal) of milk, (b) weight gain (g/d)/g of milk protein, (c) weight gain (g/d)/g of milk carbohydrate, (d) weight gain (g/d)/g of milk lipids, (e) length gain (mm/d)/418·4 kJ (100 kcal) of milk, (f) length gain (mm/d)/g of milk protein, (g) length gain (mm/d)/g of milk carbohydrate and (h) length gain (mm/d)/g of milk lipids(Reference Butte, Smith and Garza28,Reference Fleddermann, Demmelmair and Grote29) .
Statistical analyses
All statistical analyses were conducted using IBM® SPSS Statistics® programme, version 22.0 (SPSS Inc.). Shapiro–Wilk and Kolmogorov–Smirnov tests, as well as visual inspection of histograms, were applied for all variables in the three study groups to check them for normality. Variables with normal distribution were presented as means and standard deviations, while non-normally distributed variables as median and interquartile range. Categorical variables were expressed as frequencies and percentages. Differences among BF, SF and EF groups were tested using ANOVA or Welch and Student t test for two groups, Kruskal–Wallis rank sum test for non-normally distributed variables, and χ 2 or Fisher’s exact tests for categorical variables were used depending on the response variable. Interaction test between weight GV up to 6 months and the study groups was performed to identify effects on infant’s growth. Relevant confounders (maternal age, height and IQ) were included in the ANCOVA and in the adjusted multivariate ANCOVA. Bonferroni corrected post hoc comparisons were used to identify significant group differences in pairs. P < 0·05 values were considered statistically significant.
Sample size was calculated before the beginning of the COGNIS study, as previously described(Reference Nieto-Ruiz, García-Santos and Bermúdez41). Statistical power was calculated for the present study applying the following equation(Reference Martín Andrés and Luna del Castillo42):
 $$n = 2{{{{\left( {{\rm{Z\alpha }} + {\rm{Z}}2{\rm{\beta }}} \right)}^2}} \over {\delta '}}.$$
Results
Background characteristics and baseline data of parents and infants participating in the COGNIS study are shown in Table 1. There were statistically significant differences between study groups with respect to maternal age, height and IQ. Mothers of BF infants were older and taller than mothers of EF infants (P = 0·028 and 0·005, respectively). These variables (maternal age and height) were included as confounders in further growth patterns statistical analyses. Furthermore, mothers of BF group showed higher IQ compared with the mothers of the formula fed groups (SF and EF) (P < 0·001); thus, IQ was also included as a confounder since it was identified as a variable that may be directly or indirectly related to growth and development and the type of feeding in infants(Reference Pecoraro, Agostoni and Pepaj12,Reference Der, Batty and Deary43) .
Table 1. Parents and infants baseline characteristics by study group
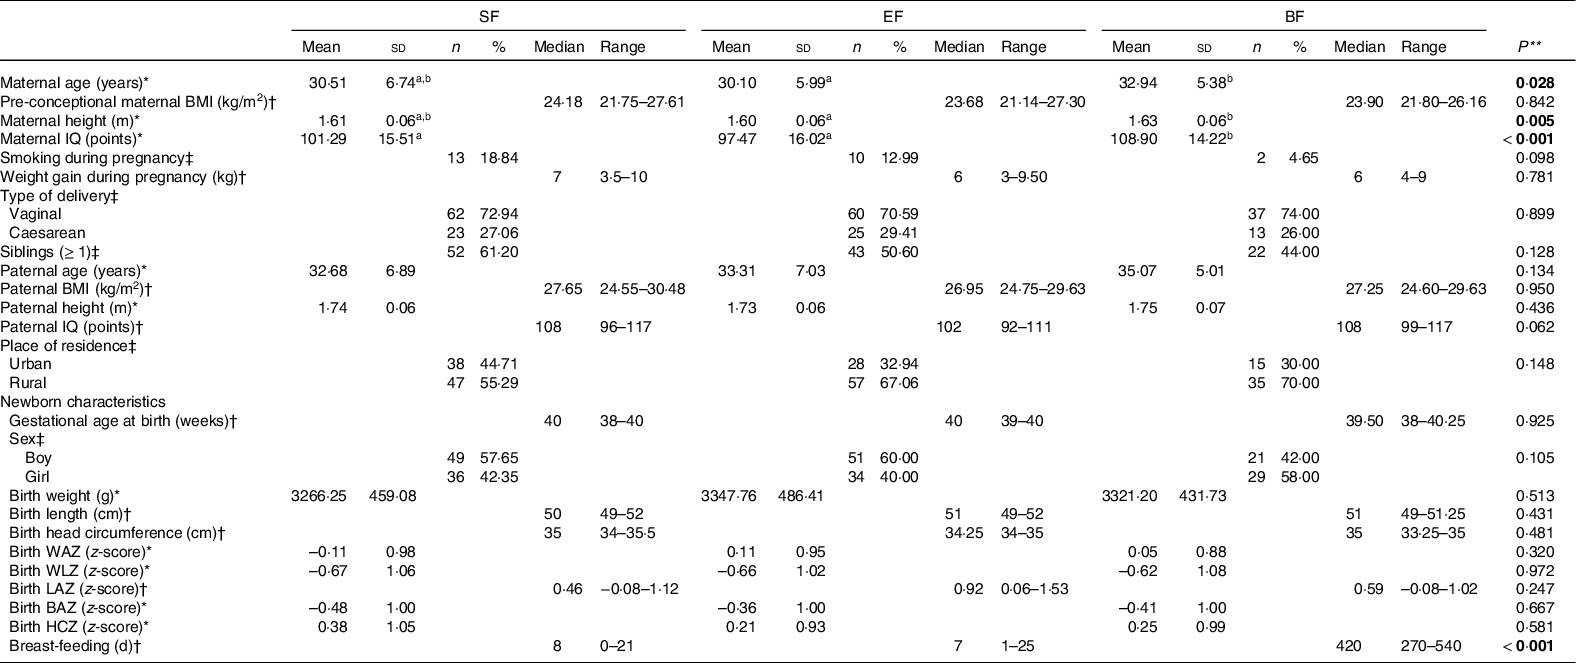
SF, standard infant formula; EF, experimental infant formula; BF, breastfed infants; IQ, intelligence quotient; WAZ, weight-for-age z-score; WLZ, weight-for-length z-score; LAZ, length-for-age z-score; BAZ, BMI-for-age z-score; HCZ, head circumference-for-age z-score.
* Mean values and standard deviations; † medians and interquartile ranges; ‡ numbers and percentages.
** P-values for overall differences between COGNIS-groups. ANOVA for normally distributed variables, Kruskal–Wallis rank-sum test for non-normal continuous variables, and χ 2 test for categorical variables. Values which do not share the same suffix (ab) were significantly different in Bonferroni post hoc test. Bold: P-value < 0·05.
Regarding newborn’s characteristics, no differences were found between study groups in anthropometrics parameters at birth, including weight, length, HC and their respective z-scores by age (WAZ, WLZ, LAZ, BMI-for-age z-score and HCZ). Breast-feeding days were significantly different between the three study groups (P < 0·001) due to the design of the COGNIS study.
Effects of the type of feeding on anthropometric characteristics and daily growth gain in infants during their first 18 months of life
Results concerning infants’ anthropometric measures are shown in Table 2. HC at 4 and 6 months was bigger in the formula fed groups compared with the BF infants in the confounders (maternal age, height and IQ) adjusted model (P adj = 0·013; P adj = 0·004, respectively). HCZ was also significantly higher at 4 and 6 months in the formula fed infants in comparison with those in the BF group (P adj = 0·018; P adj = 0·008, respectively). Moreover, length at 12 months of age was higher in the SF group than in the BF group (P adj = 0·041) (Table 2). No significant differences were found in WAZ, WLZ, LAZ and BMI-for-age z-score along the COGNIS groups.
Table 2. Effect of the type of feeding on anthropometric data in infants during the first 18 months of life.
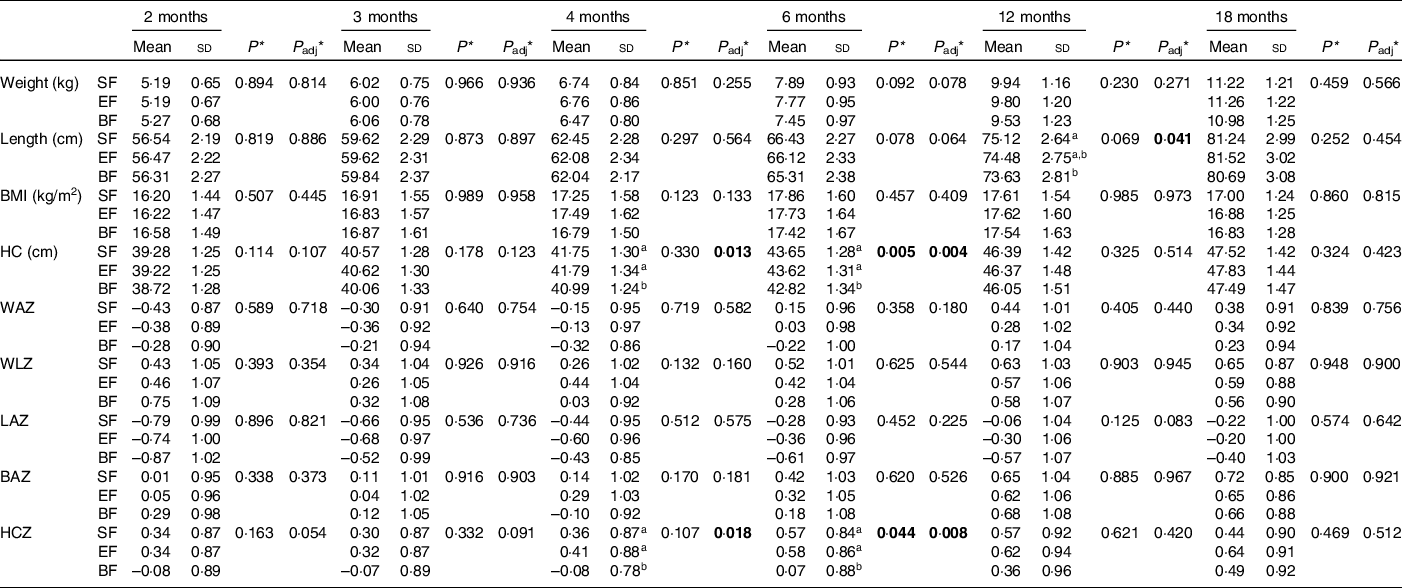
SF, standard infant formula; EF, experimental infant formula; BF, breastfed infants; HC, head circumference; WAZ, weight-for-age z-score; WLZ, weight-for-length z-score; LAZ, length-for-age z-score; BAZ, BMI-for-age z-score; HCZ, head circumference-for-age z-score; IQ, intelligence quotient.
* P-value was obtained from ANOVA; P adj was obtained from ANOVA; P adj was obtained from ANCOVA for the group differences using univariate general linear model, including the effects from the following potential confounders: maternal age, height and IQ. Bold: P-value < 0·05.
ab Values not sharing the same suffix were significantly different in Bonferroni post hoc test.
In order to estimate GV in COGNIS infants, we next evaluate weight, length and HC gains in three time intervals: (i) up to 6 months, (ii) between 6 and 12 months and (iii) between 12 and 18 months (Table 3). Infants from the formula fed groups (SF or EF) had significantly higher length gain (cm/d) (P adj = 0·015) and lower HC gain (cm/d) (P adj = 0·001) compared with the BF infants at 6 months of age. Between 6 and 12 months of age, the SF group presented a significantly lower HC gain compared with BF infants (P adj = 0·019) (Table 3).
Table 3. Daily growth gain in infants of the COGNIS study.
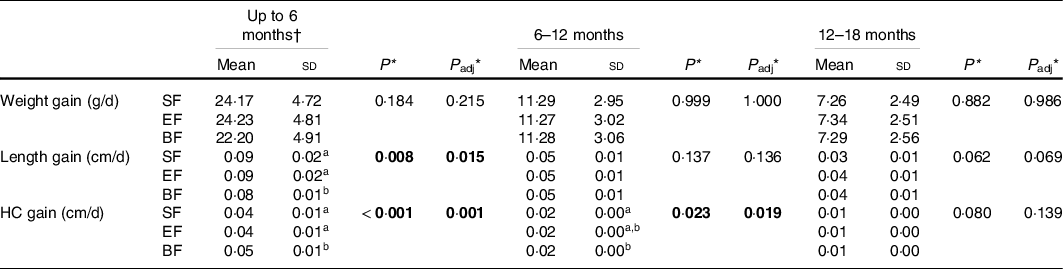
SF, standard infant formula; EF, experimental infant formula; BF, breastfed infants; HC, head circumference; IQ, intelligence quotient.
* P-value was obtained from ANOVA; P adj was obtained by ANCOVA for the group differences using univariate general linear model, including the effects of the following potential confounders: maternal age, height and IQ. Bold: P-value < 0·05.
† Calculated from the baseline visit (formula fed infants group) or from birth to 6 months of life (breastfed infants). Data were analysed using the WHO growth velocity standards, and presented as 6-month increments from birth to 18 months and stratified by sex(38).
a, b Values not sharing the same suffix were significantly different in Bonferroni post hoc test.
Growth velocity and catch-up growth
Infants’ GV and catch-up indicators were classified as slow, normal or rapid according to the aforementioned criteria in the ‘Methods’ section. At 6 months, the SF group showed a lower proportion of slow length GV when compared with the BF infants (P = 0·028). Formula fed infants showed higher proportion of slow, and lower proportion of rapid HC GV compared with the BF infants (P < 0·001) (Table 4). When analysing the WAZ catch-up until 6 months of life, the formula fed groups (SF or EF) had significantly lower percentage of slow and higher percentage of rapid catch-up growth compared with the BF group (P < 0·001). Regarding WLZ catch-up until 6 months of life, EF and BF groups are characterised by higher proportion of normal catch-up growth compared with the SF group, although not reaching significant difference. On the other hand, the SF group showed a lower percentage of infants classified as slow catch-up growth (P = 0·046). No significant differences were detected in the GV and catch-up growth parameters at 6–12 and 12–18 months of age (Table 4).
Table 4 Growth velocity and catch-up growth in infants during the first 18 months of life by COGNIS study groups.
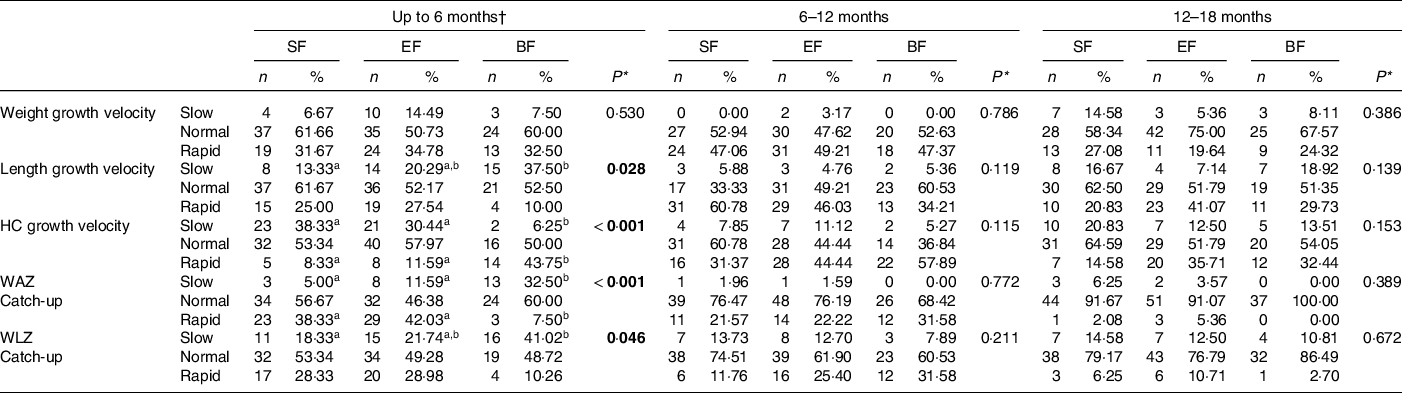
SF, standard infant formula; EF, experimental infant formula; BF, breastfed infants; HC, head circumference; WAZ, weight-for-age z-score; WLZ, weight-for-length z-score.
* χ 2 test for categorical variables. P-values are comparisons between the COGNIS-groups. Values which do not share the same suffix (a,b) are significantly different in Bonferroni post hoc test. Bold: P-value < 0·05. Growth velocity was classified as: slow: < −1 sd, normal: ≥ −1 sd and ≤ + 1 sd or rapid: > + 1 sd; catch-up growth classified as follows: slow: < −0·67, normal: ≥ −0·67 and ≤ + 0·67 and rapid: > + 0·67 (see ‘Methods’ section for more details).
† Calculated from the baseline visit (formula fed infants group) or from birth to 6 months of life (breastfed infants).
Growth patterns in COGNIS infants up to 18 months
Regarding interaction between GV up to 6 months and study groups (SF, EF and BF), no statistically significant results were detected in those test (P-values >0·05) (online Supplementary Table S2). This means that there is no effect of the study group in those growth parameters and indicators evaluated. Same happens to interaction between weight GV and study group. Only one factor has effect on growth: GV up to 6 months of age (P < 0·05), which indicates that this factor may predict subsequent growth trajectory while diet group does not. However, due to the study design, results are presented according to study group.
Growth patterns were evaluated up to 18 months of age according to the classification of weight GV up to 6 months of age visits (Fig. 2(a)–(g) and online Supplementary Table S3).
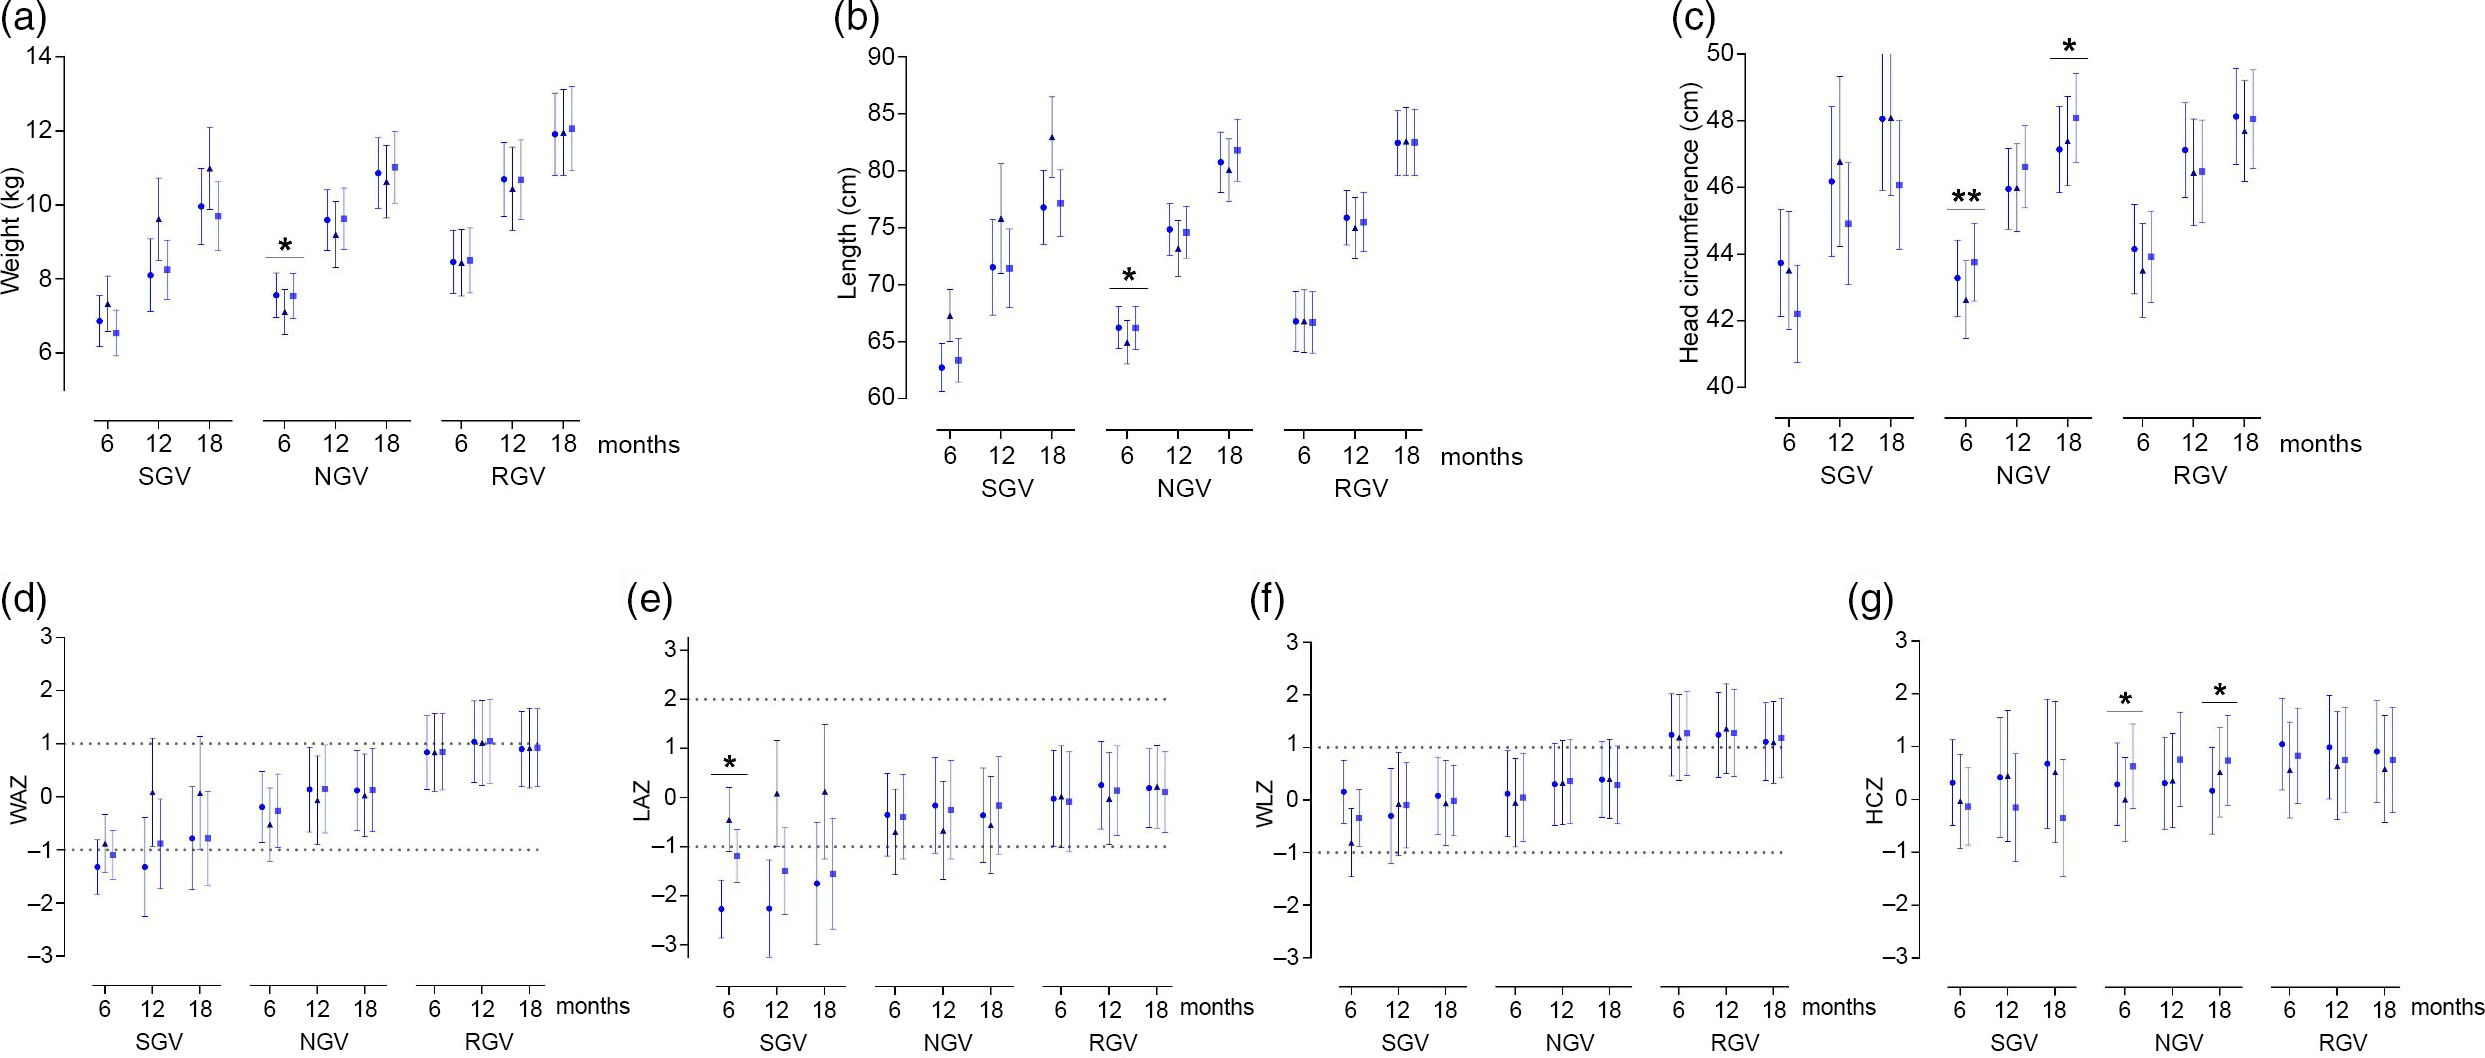
Fig. 2. Growth patterns up to 18 months of life, according to weight growth velocity up to 6 months of life by feeding group. Data are marginal mean values and standard deviations. P adj was obtained by ANCOVA for the group differences using univariate general linear model, including the effects of the following potential confounders: maternal age, height and IQ. *P adj-values < 0·05 and **P adj-values < 0·01. SGV, slow growth velocity; NGV, normal growth velocity; RGV, rapid growth velocity; SF, standard infant formula; EF, experimental infant formula; BF, breastfed infants; HC, head circumference; WAZ, weight-for-age z-score; LAZ, length-for-age z-score; WLZ, weight-for-length z-score; HCZ, head circumference-for-age z-score; IQ: intelligence quotient. Dotted lines indicate normal growth according to WHO cut-off points(37). ![]() , SF;
, SF; ![]() , BF;
, BF; ![]() , EF.
, EF.
Infants with slow growth velocity
At 6 months of age, LAZ was significantly lower in the SF group (–2·27 (sd 0·59)) compared with the BF group (–0·45 (sd 0·65)) (P adj = 0·036) (Fig. 2(e)), although the signification did not remain at later ages.
Infants with normal growth velocity
At 6 months, weight (kg) was significantly higher in the SF infants (7·56 (sd 0·60)) compared with the BF group (7·11 (sd 0·61)) (P adj = 0·025) (Fig. 2(a)); length (cm) was significantly higher in the SF group compared with the BF group (SF: 66·24 (sd 1·84); BF: 64·95 (sd 1·90); P adj = 0·041) (Fig. 2(b)), while HC (cm) was significantly higher in the EF group compared with the BF group (EF: 43·76 (sd 1·17); BF: 42·63 (sd 1·17); P adj = 0·008) (Fig. 2(c)). Similarly, at 18 months of age, the EF group presented higher HC (cm) compared with the SF group (EF: 48·08 (sd 1·34); SF: 47·14 (sd 1·30); P adj = 0·031) (Fig. 2(c)).
Regarding growth z-scores, at 6 months, HCZ was significantly higher in the EF group compared with the BF group (EF: 0·63 (sd 0·80); BF: 0·00 (sd 0·80); P adj = 0·034) (Fig. 2(g)). And at 18 months, HCZ was higher in the EF group compared with the SF group (EF: 0·74 (sd 0·85); SF: 0·17 (sd 0·82); P adj = 0·038) (Fig. 2(g)).
Energetic efficiency
EE was estimated up to 18 months of age according to energy and macronutrients intake per day from breast milk or infant formula (Fig. 3). For this purpose, we first evaluated if there were differences in infant formula/breast milk volume intake per day (d) at 6, 12 and 18 months. We found that the milk volume intake (ml/d) was significantly different between the study groups at 6 months of age (SF: 683·59 (sd 255·88); EF: 696·19 (sd 217·29); BF: 843·18 (sd 242·37), P = 0·003); thus, this parameter (milk volume intake) was included as an additional confounder for further EE analysis.
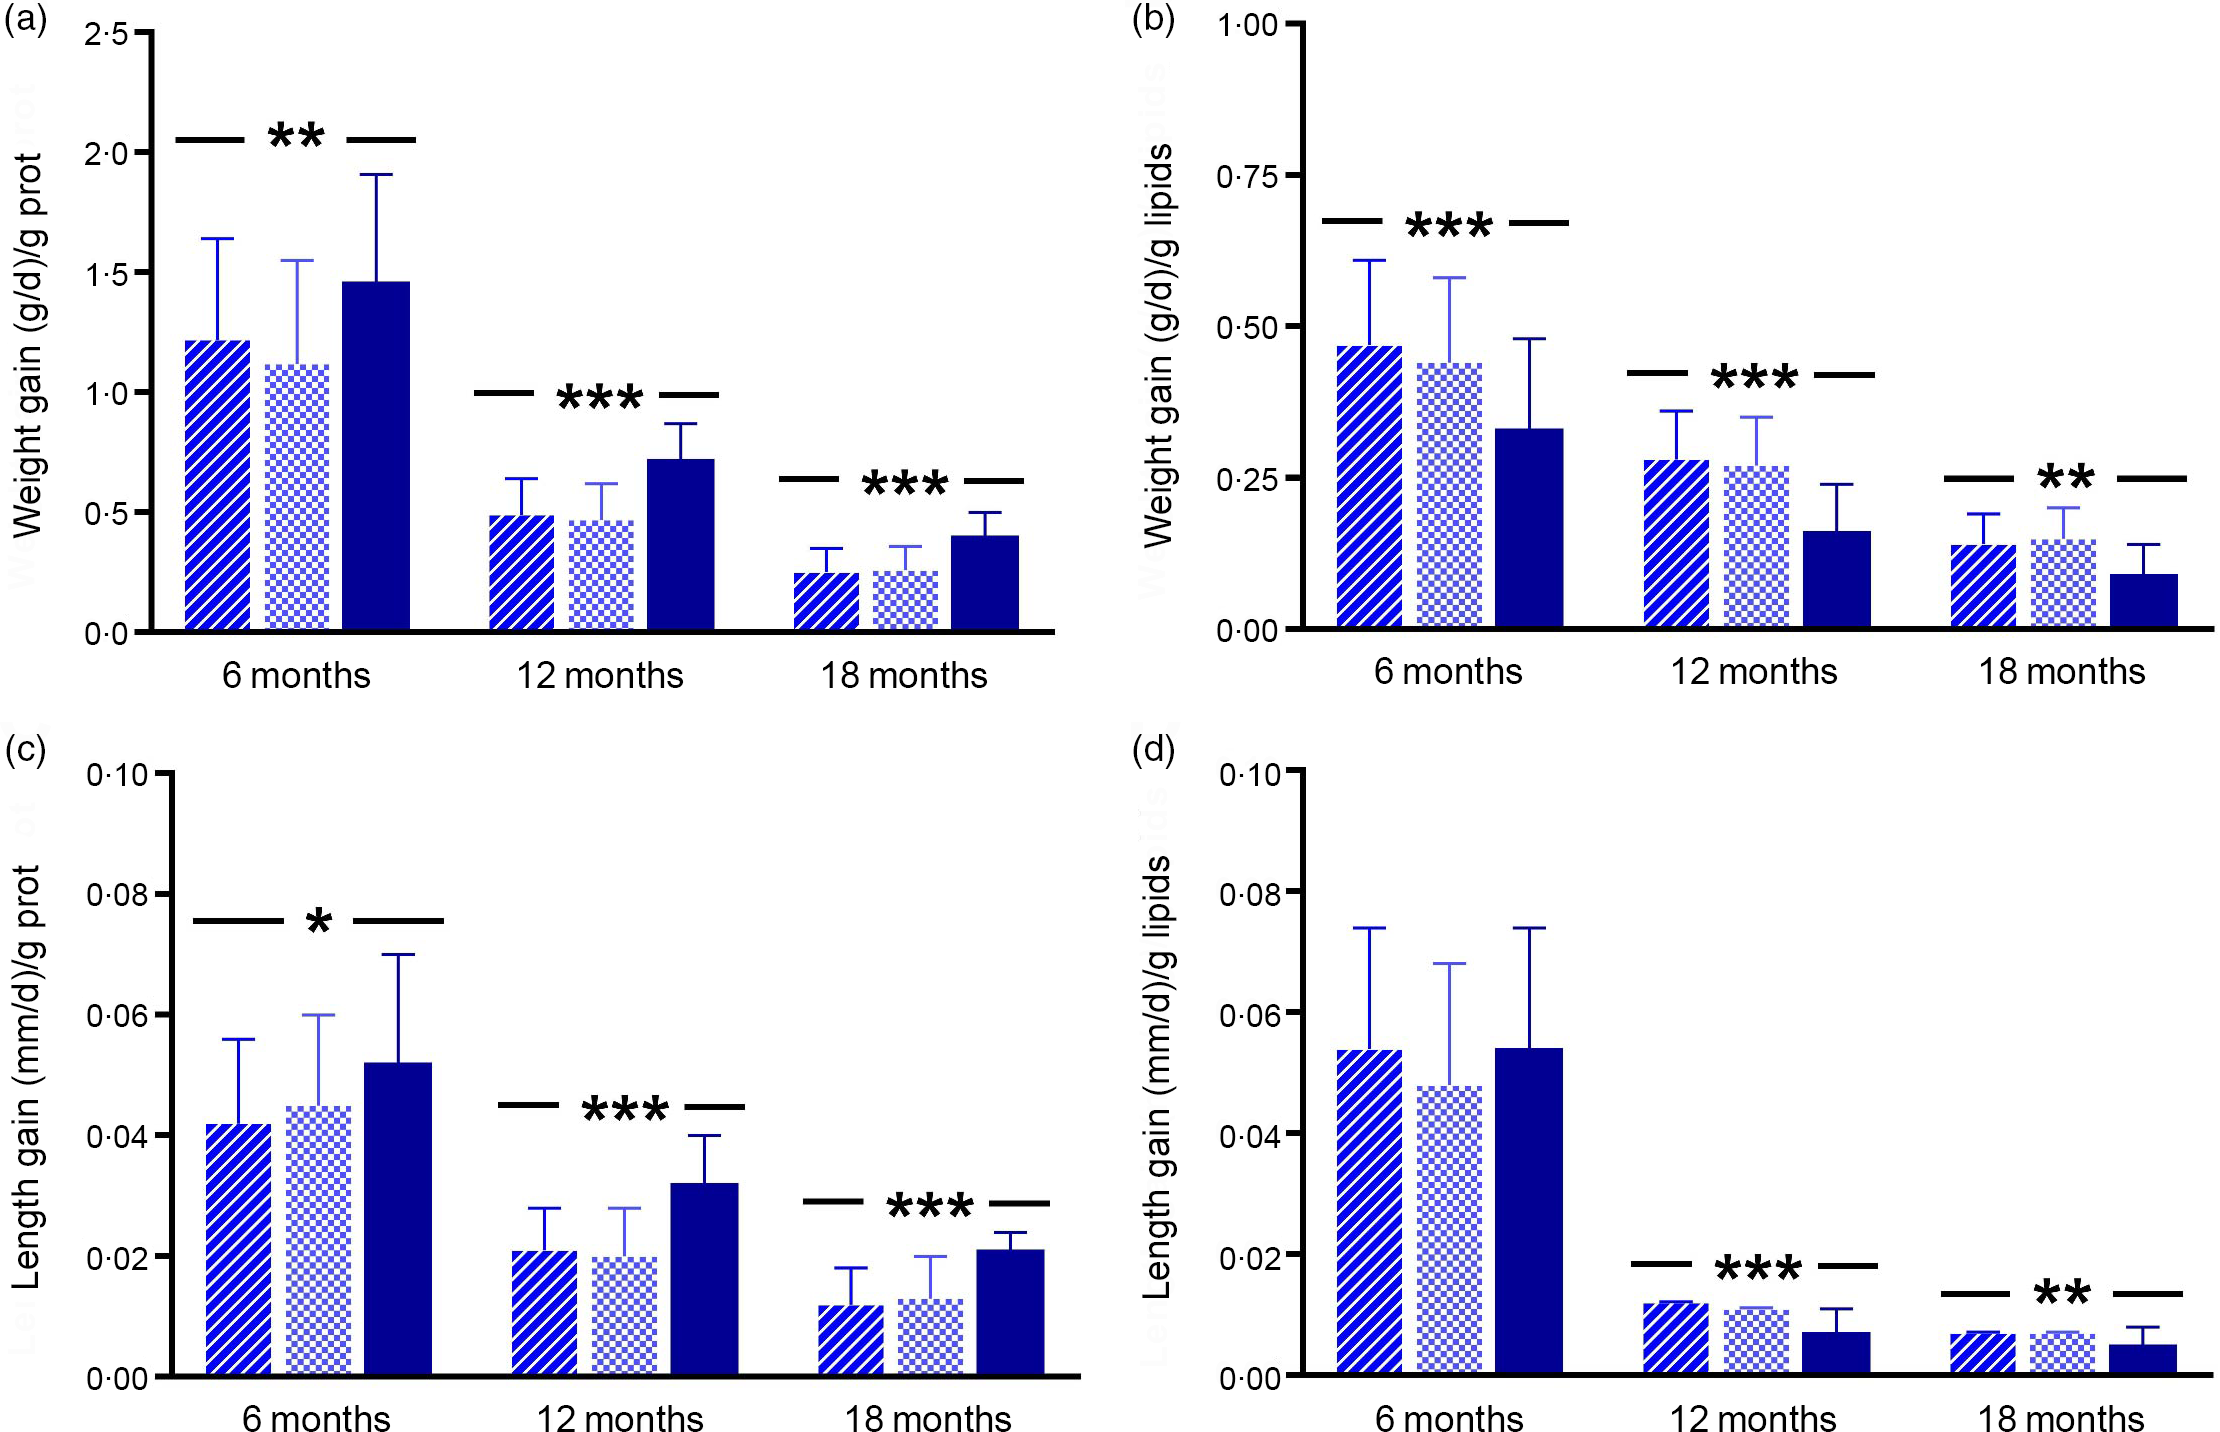
Fig. 3. Energetic efficiency analysis up to 18 months of age by feeding group. Data are marginal mean values and standard deviations. P-values were obtained by multivariate ANCOVA for group differences using multivariate general linear model, including the following confounders: maternal age, height and IQ. At 6 months of age, analysis was additionally adjusted by volume intake (ml/d) of infant formula or breast milk. For variables weight gain g/g protein; weight gain g/g lipids and length gain mm/g protein at 12 months of age, and length gain mm/g lipids at 6 and 12 months of age, P adj corresponds to log-transformed for these variables. *P adj-values < 0·05; ** P adj-values < 0·01 and *** P adj-values < 0·001. SF, standard infant formula; EF, experimental infant formula; BF, breastfed infants; IQ, intelligence quotient. ![]() , SF;
, SF; ![]() , EF;
, EF; ![]() , BF.
, BF.
Energetic efficiency and weight gain (g/d)
Weight gain/g of milk protein at 6, 12 and 18 months of age was significantly lower in the formula fed groups (SF or EF) compared with the BF group (6 months, P adj = 0·003; 12 months, P adj < 0·001; 18 months, P adj < 0·001) (Fig. 3(a) and online Supplementary Table S4). Conversely, weight gain/g of milk lipids was significantly higher in the infant formula groups compared with the BF infants (6 months, P adj < 0·001; 12 months, P adj < 0·001; 18 months, P adj = 0·007) (Fig. 3(b) and online Supplementary Table S4). Furthermore, weight gain/418·4 kJ (100 kcal) of milk was significantly higher in the SF group compared with the BF infants at 12 months of age (P adj = 0·049). However, at 6 and 18 months of age there were no significant differences. Regarding weight gain/g of milk carbohydrates, there were no significant differences between feeding groups up to 18 months (online Supplementary Table S4).
Energetic efficiency and length gain (mm/d)
In a similar way, there were no significant differences up to 18 months of age in length gain/418·4 kJ (100 kcal) of milk and length gain/g of milk carbohydrates according to the feeding group (online Supplementary Table S4). However, at 6 months of age, length gain/g of milk protein was lower in the SF group compared with the BF infants (P adj = 0·023); moreover, at 12 and 18 months of age, the formula fed groups showed lower length gain/g of milk protein than the BF group (12 months, P adj < 0·001 and 18 months, P adj < 0·001) (Fig. 3(c) and online Supplementary Table S4). Finally, we found that, at 12 months of age, length gain/g of milk lipids was higher in the infant formula groups compared with the BF group (P adj < 0·001), while at 18 months of age it was higher in SF infants compared with the BF infants (P adj = 0·002) (Fig. 3(d) and online Supplementary Table S4).
Discussion
The present study was aimed to perform an exhaustive analysis of growth patterns up to 18 months of life in COGNIS infants fed with a new bioactive compounds-enriched infant formula, compared with a standard infant formula and BF infants. Additionally, EE of infant formulas and breast milk was estimated. Our results suggest that the type of feeding during the first 6 months of life may determine infant growth patterns; length gain was higher and HC gain was lower in infants from the formula fed groups (SF or EF) compared with the BF infants. These significant differences were not found at 6–12 and 12–18 months. Moreover, the analysis of weight/length catch-up until 6 months of life suggested that EF and BF groups are characterised by higher proportion of normal catch-up growth compared with the SF group. Studies refer that HC may be associated with specific aspects of child development in healthy population(Reference Dupont, Castellanos-Ryan and Séguin44,Reference Whitehouse, Zubrick and Blair45) . Also, higher HC in infants at 4 and 6 months of age might be related to a better visual acuity at 12 months of life(Reference Nieto-Ruiz, García-Santos and Bermúdez41) and language development at 4 years old in those children fed with the enriched bioactive nutrients infant formula(Reference Nieto-Ruiz, Diéguez and Sepúlveda-Valbuena46).
In general, growth is a result of a process depending on the availability of essential nutrients. A harmonious growth results from weight and length gains in appropriate proportion; an imbalance in weight gain might affect linear growth and could negatively impact on cognitive development at later ages(Reference Uauy47). Some studies suggest to analyse weight gain rates and linear growth as independent factors that could affect health and development in adulthood(Reference Horta, Victora and de Mola48,Reference Adair, Fall and Osmond49) . Therefore, infant weight gain is generally known as the primary indicator of healthy growth; higher weight gains between 3 and 12 months of age(Reference Baird, Poole and Robinson50–Reference Singhal and Lucas52) have been related to higher risk of obesity and other metabolic disorders(Reference Owen53,Reference Baird, Fisher and Lucas54) .
Growth patterns in infants during the first months of life are a topic of interest in paediatric research; growth characteristics have been described according to the type of feeding in early stages of life, given biological dynamics of human milk compared with infant formulas(Reference Azad, Vehling and Chan6,Reference Young, Levek and Reynolds55,Reference Wallingford and Barber56) . Results from the present study showed that the SF fed group was characterised by a lower proportion of infants with slow GV in length compared with the BF infants. In addition, when analysing the weight/age catch-up until 6 months of life, the formula fed groups (SF or EF) had significantly lower percentage of slow growth infants compared with the BF group; conversely, the BF group had lower proportion of rapid WAZ catch-up. Moreover, the EF and BF groups are characterised by higher proportion of normal WLZ catch-up growth compared with the SF one. Research refers that infant formula intake is a risk factor for self-regulation satiety alteration(Reference Isselmann DiSantis, Collins and Fisher57), higher length gain(Reference Fleddermann, Demmelmair and Grote29), higher weight gain, rapid weight gain velocity, higher WAZ(Reference Patel, Dalrymple and Pasupathy58,Reference Butte, Wong and Hopkinson59) and weight excess at later ages(Reference Mannan60,Reference Giugliani61) compared with the BF infants. Since several years ago, infant formulas have been modified and enriched with bioactive nutrients trying to mimic those present in human milk to satisfy an optimal development and growth, providing the necessary amount of energy and nutrients(Reference Dipasquale, Serra and Corsello13,16) . Some studies have reported that infant formula intake implies an elevated protein intake, leading to increased secretion of insulin, insulin-like growth factor type 1 and adipogenic activity(Reference Koletzko, Broekaert and Demmelmair62,Reference Koletzko, Chourdakis and Grote63) ; these mechanisms could be involved in growth patterns observed in formula fed infants; in this regard, infants fed with low protein content formulas show less risk for obesity during childhood(Reference Koletzko, von Kries and Closa27). Infant formulas tested in the present study follow the guidelines of the ESPGHAN Committee on Nutrition(Reference Koletzko, Baker and Cleghorn64) and international and national recommendations for infant formula composition, and their protein content is within the minimum recommended range. Results from a study with a similar design to the present one indicated a rapid GV in formula fed infants compared with the breastfed ones, with no differences between standard formula or milk fat globule membrane supplemented formula(Reference Timby, Domellof and Hernell18).
The present study also evaluated whether differences in growth patterns between types of feeding with infant formula (SF or EF) or breast-feeding in the COGNIS study could be related to the EE of macronutrients present in infant formula and breast milk as a possible, and partial, explanation of the results obtained. To date, and despite that EE of infant formulas has been described, studies are largely based on short-term infant growth follow-up (until 6 months of life), and there is insufficient evidence to accurately compare EE in infant formula and breast milk(Reference Fleddermann, Demmelmair and Grote29,Reference Fleddermann, Demmelmair and Koletzko65) . The present study reports information about EE up to 18 months of age in formula fed and BF infants. Our data showed that BF infants had higher weight and length gain per g of milk protein compared with the formula fed infants up to 18 months of life, while milk lipids appear to be responsible for increased weight and length gain in those infants who received infant formula. These findings may be related to the nutritional composition of breast milk; in fact, breast milk provides high biological value proteins, optimal whey/casein ratio and adequate supply of amino acids(66–Reference Lönnerdal69). Despite its higher content in lipids, breast milk also contains enzymes needed for digestibility and utilisation of fatty acids(Reference Boquien70). Both nutritional characteristics, together with its content in bioactive nutrients, hormonal and immune factors, could determine a better EE of breast milk compared with infant formulas in order to ensure an optimal infant growth and development. It is important to note that data from the present study cannot be attributed to a single specific component of infant formulas (enriched or not), but as a whole product designed to meet infant nutritional needs; moreover, there is likely a synergy among the different bioactive components, which could be associated with bioavailability and biological utilisation of nutrients. Currently, there is insufficient evidence to support the effect of DHA and arachidonic acid enriched formula on growth and adiposity(Reference Tijhuis, Doets and Vonk Noordegraaf-Schouten30,Reference Hoffman, Harris and Wampler71,Reference Ingol, Li and Boone72) , or synbiotic supplementation on infants growth(Reference Mugambi, Musekiwa and Lombard23,Reference Tijhuis, Doets and Vonk Noordegraaf-Schouten30,Reference Braegger, Chmielewska and Decsi73,Reference van den Nieuwboer, Claassen and Morelli74) . Effects on immune system and on microbiota structure and function have been described; these may be factors influencing children growth as well(Reference Mugambi, Musekiwa and Lombard23,Reference Braegger, Chmielewska and Decsi73,Reference van den Nieuwboer, Claassen and Morelli74) . Thus, data obtained may be useful to develop further strategies not only focused on narrowing the nutritional gap but also the functional and metabolic gap, between infant formulas and human milk.
One of the strengths of the present study relies on long-term infant growth follow-up, as consequence of the longitudinal design of the COGNIS study, thus allowing a cross-sectional analyses of infant growth until 18 months of life, compared with other studies with shorter follow-up. Secondly, despite participants dropout at 18 months of life, statistical power was calculated to identify the validity of the results found in the present study. Statistical power reached to detect a minimum difference of 0·6 sd in growth patterns was 80 % at 18 months of age, enough to detect relevant differences in growth patterns between study groups. Additionally, it is also important to highlight that 26 % of infants in the control group continued breast-feeding until 18 months, which allowed to estimate the EE and compare growth patterns between infants who received SF or EF (initiation and follow-on formulas), and those who were breastfed at long-term. Finally, COGNIS design also included data about socio-demographic and anthropometric characteristics both from parents and newborns, which were used as potential confounders in statistical models.
Research about infant growth has been largely focused on the analysis of growth in a transversal way (z-scores). Despite infant weight assessment is considered a global indicator of healthy child growth, our results suggest that it could be worth to analyse in depth how the weight GV and trajectory modify the length and HC, as well as the growth indicators (WAZ, LAZ, WLZ and HCZ) during childhood. Current results have an added value due to the methodology used, based on different techniques with z-scores trajectories, GV using the WHO growth standards and classification according to growth rate (catch-up) between follow-up visits. Thus, this methodology could provide a basis to evaluate long-term potential impact of type of feeding at early age on infant GV and trajectory. Moreover, it can be useful to provide detailed and individualised guidelines for the introduction of complementary feeding, according to nutritional needs and infant growth patterns (especially for those who present rapid or slow growth trajectories), ensuring an adequate and normal growth for age.
However, there are limitations that must be acknowledged. First, due to ethical reasons, breast milk must be offered on demand with no limits in its volume or duration. Consequently, volumes of breast milk intake were obtained from 3-d dietary records as well as theoretical estimates based on previously published findings(Reference Dewey and Brown39,Reference Kent40) . For future studies, we suggest to weight the infant before and after being breastfed to know more accurately breast milk volume intake. Second, breast milk is a nutrient with a varying nutritional composition, both in a time-day basis and over time, to adapt to infants nutritional needs. Our study has not an individual analysis of the breast milk of each infant during the follow-up; therefore, composition in the present study was estimated based on a full mature breast milk composition as reported in the USDA National Nutrient Database for Standard Reference(66). It would be interesting in later studies to analyse the composition of breast milk individually and describe the composition of nutrients during the first 2 years of age. Third, our goal was to estimate EE of infant formulas (SF or EF) and breast milk, and we did not include complementary feeding in the analysis performed; thus, it would be interesting to analyse the complementary feeding in the three COGNIS groups in future studies. Finally, as previously reported(Reference Nieto-Ruiz, García-Santos and Bermúdez41), COGNIS study design implies the non-randomisation of the BF group, in contrast to both SF and EF groups, which could explain differences in maternal age, height and IQ baseline characteristics.
In summary, herewith we suggest that type of feeding received between birth and the first 6 months of life could be responsible for differences in infant GV and catch-up growth. GV during first 6 months, which may be influenced by feeding, seems to be the main predictor of subsequent growth patterns. Moreover, in infants fed with the enriched bioactive nutrients formula, higher HC at 6 months of age was found in the present study, which could be related to better visual acuity(Reference Nieto-Ruiz, García-Santos and Bermúdez41) and language development at 4 years old(Reference Nieto-Ruiz, Diéguez and Sepúlveda-Valbuena46), as previously reported. EE of breast milk nutrients seems to be responsible for its benefits on infant growth. Our results suggest that traditional methodology used for growth analysis may be insufficient to characterise the growth trajectory during childhood. In fact, traditional methodology is based on the parameters and indicators in a cross-sectional way, but not on an evolutionary one. However, analysis of weight, length and HC gains as a function of time and velocity, and how the GV changes, may better define the growth pattern at later stages. Further research based on long-term growth monitoring is necessary to establish the effects of early nutrition (infant formula fed or breast milk and complementary feeding) on body composition as an indicator of metabolic long-term health risks, and children’s growth later in life.
Acknowledgements
The authors want to acknowledge the parents and infants who participated in the COGNIS study; the authors also thank the paediatricians, technicians and researchers of the EURISTIKOS team and the Department of Paediatrics from the University of Granada, Spain. N. S.-V. acknowledges to Pontificia Universidad Javeriana and Fundación Carolina for supporting the development of her Ph.D. thesis. The results of the present study are likely to be included in the Doctoral Thesis of N. S.-V., in the context of the Clinical Medicine and Public Health Doctoral Programme at the University of Granada.
This project has been funded by Laboratorios Ordesa, S. L. Contract University of Granada General Foundation, No. 3349 and SMARTFOODS (CIEN) Contract University of Granada General Foundation, No. 4003, Spanish Ministry of Economy, Industry and Competitiveness, and partially funded by HORIZON 2020 EU DynaHEALTH Project (GA No.633595). N. S-V. has been granted with a scholarship from Fundación Carolina, Madrid, Spain.
C. C. was responsible for conceptualisation; N. S-V., A. N-R., E. D. and F. H. carried out the investigation, and performed data curation; N. S-V., A. N-R., E. D. and M. T. M. were responsible for the methodology developed, analysis and interpretation; N. S-V., A. N-R. and M. T. M. carried out the formal analysis; C. C., M. R-P. and R. D-C. were responsible for funding acquisition; C. C. was responsible for project administration; C. C. carried out supervision; N. S-V. wrote the first draft of the article; J. A. G-S. and M. G. B. discussed and supervised writing of the manuscript; A. N-R., E. D., F. H., M. E-M., R. D-C., M. R-P., M. T. M., J. A. G-S., M. G. B., C. C. reviewed and edited the present paper.
Dr. R. D-C. and Dr. M. R-P. are employees of Laboratorios Ordesa, S.L.
Supplementary material
For supplementary materials referred to in this article, please visit https://doi.org/10.1017/S000711452100057X


 Open access