


Two of the world's most-cited political scientists recently teamed up to tackle a pressing political issue: the rise of populism. Although explanations of populism are not in short supply, in Cultural Backlash, Pippa Norris and Ronald Inglehart (2019) add a new account to the ever-growing literature. Their main argument is that societies move from more conservative to more liberal values over time and that this secular trend creates a conflict between defenders of materialist or authoritarian values, on the one hand, and the champions of more liberal or libertarian views, on the other. As older cohorts are more likely to belong to the former group and younger ones to the latter, the conflict is also one between old and young. The populist backlash unfolds, so Norris and Inglehart argue, as societies reach a ‘tipping point’ at which former majorities have become or are about to be become a minority. This happens at different times in different societies but is bound to be a temporary problem, as younger cohorts will eventually replace older ones. Since publication, the book has been cited several hundred times – despite the fact that closer scrutiny of the empirical results does not support its conclusions.
There is no doubt that Cultural Backlash is a rich and stimulating book, which touches many important topics and could not be timelier. As observers discuss ‘how democracies die’ (Levitsky and Ziblatt Reference Levitsky and Ziblatt2018) or even ‘how democracy ends’ (Runciman Reference Runciman2019), we surely need guidance on how to make sense of the rise of authoritarian populism. However, Norris and Inglehart's book does not provide this guidance. In fact, Cultural Backlash has conceptual and empirical problems that undercut its aspirations. A first problem is that there is little evidence of polarization between older and younger cohorts along the authoritarian–libertarian axis. Rather than an opposition between older, more authoritarian and younger, more libertarian cohorts, the attitudes of these groups differ in degree only. Secondly, although Norris and Inglehart distinguish between authoritarian and libertarian versions of populism, they ignore this distinction in their analyses of voting behaviour, which is at odds with the theory. Thirdly, and perhaps most crucially, the empirical results do not fit to the theory. Older cohorts are more likely to hold somewhat less culturally liberal values, but they are not more likely to endorse populist values and are actually less likely to vote for populist or authoritarian-populist parties. The central problem of the book is linking a cultural explanation for populist success to generational change – and this link is weak at best.
This article proceeds as follows. The second section deals with the definition of populism that the authors use and the drawbacks it has. The third section asks if there is the kind of cultural conflict between birth cohorts that Norris and Inglehart proclaim and whether older cohorts hold more populist views. To test these claims, I rerun many of the analyses with the European Social Survey (ESS) and add further datasets where necessary. The fourth section analyses voting behaviour. Again, I first discuss Norris and Inglehart's approach and then present my own analysis that identifies authoritarian-populist parties in a more concise manner. The final section provides a conclusion to the article.
Understanding Populism
Ever since the term ‘populism’ was first used, it has been debated. For a long time, scholars disagreed over how to define it, and Canovan (Reference Canovan1982) even doubted that a definition was possible at all. However, over the past twenty years, a widely shared ‘ideational’ understanding has emerged that strongly builds on Cas Mudde's work (for example, Mudde Reference Mudde2004; Mudde and Kaltwasser Reference Mudde, Kaltwasser, Mudde and Kaltwasser2012a; Mudde and Kaltwasser Reference Mudde and Kaltwasser2017). The current near-consensus sees populism as a ‘thin ideology’ that can be attached to different, more substantial host ideologies. Its antonyms are ‘pluralism’ and ‘elitism’. From this perspective, three elements define populism:
(a) a Manichean and moral cosmology; (b) the proclamation of ‘the people’ as a homogenous and virtuous community; and (c) the depiction of ‘the elite’ as a corrupt and self-serving entity. In other words, something is defined as ‘populist’ if it has all three of these conditions. So, one cannot categorize a particular discourse as populist solely on the basis of anti-establishment rhetoric or purely on references to ‘the people’ as a political body that is morally superior. The peculiarity of the populist set of ideas lies precisely in the combination of these elements. (Hawkins et al. Reference Hawkins2019, 3)
Norris and Inglehart (Reference Norris and Inglehart2019, 66) follow this approach to some extent and define populism ‘as a rhetorical style of communications claiming that (i) the only legitimate democratic authority flows directly from the people, and (ii) established power-holders are deeply corrupt and self-interested, betraying public trust’.
In contrast to this definition, Müller (Reference Müller2016) insists that anti-elite orientations are a necessary but not sufficient part of populism. If any criticism of elites in the name of ‘the people’ is labelled populist, it risks delegitimizing valid concerns. Populists also are anti-pluralist, he argues, and claim that they are the only ones who can speak for the people. This seemingly small difference leads to different views on which politicians count as populist. Norris and Inglehart repeatedly claim that Bernie Sanders is a populist, whereas Müller (Reference Müller2016, 3) does not agree.Footnote 1 Too loose a definition of populism risks producing too many false positives. For example, the democratic revolutions in the German Democratic Republic and the mass movements of the Arab Spring would appear to be examples of populism if we disregard anti-pluralism as a defining feature.Footnote 2
Two narratives figure prominently in the explanation of the rise of populism. Both point at different problems of ‘social integration’ (Gidron and Hall Reference Gidron and Hall2019). The first common narrative stresses economic grievances, in particular, those of lower-skilled citizens. Globalization intensifies economic competition, which makes the locally bound ‘somewheres’ (Goodhart Reference Goodhart2017) particularly vulnerable and creates feelings of (relative) deprivation (Kitschelt Reference Kitschelt, Rhodes, Heywood and Wright1997). An abundance of low-skilled workers within a country or abroad makes it easier to lower wages or to offshore tasks altogether. In addition, structural change – for example, the rise of the knowledge economy – devalues skills of the old middle class, who feel left behind (Iversen and Soskice Reference Iversen and Soskice2019). Parties of the far right exploit these various grievances because they link economic hardship to the presence of minority ethnic groups and migration, using them as scapegoats for socio-economic developments (Golder Reference Golder2003). Higher levels of inequality might lead lower classes and those who experience ‘positional deprivation’ (Burgoon et al. Reference Burgoon2019) to turn towards right-wing populist parties. Empirical studies supporting this argument examine such factors as (perceived) job insecurity, fear of downward social mobility or welfare chauvinism, and their relationship to the vote for the populist right (de Koster, Achterberg and van der Waal Reference De Koster, Achterberg and van der Waal2013; Engler and Weisstanner Reference Engler and Weisstanner2020; Han Reference Han2016).
In contrast, proponents of a culture-based perspective – such as Norris and Inglehart – argue that the ‘silent revolution’ (Inglehart Reference Inglehart1977) alienates citizens with more traditionalist world views and gives rise to the ‘silent counter-revolution’ (Ignazi Reference Ignazi1992; see also Betz Reference Betz1993). According to this argument, particularistic and traditionalist preferences drive electoral support for the populist right. Other authors see ‘cultural grievances’ stemming mainly from the perception of immigration as a threat to national or cultural identity (Lucassen and Lubbers Reference Lucassen and Lubbers2012; Mutz Reference Mutz2018; Oesch Reference Oesch2008). Many argue that anti-immigrant attitudes are the decisive factor for explaining the vote choice for the far right (Ivarsflaten Reference Ivarsflaten2008; Minkenberg Reference Minkenberg2000).
Although Norris and Inglehart (Reference Norris and Inglehart2019) discuss both economic and cultural reasons for the rise of authoritarian populism, they ultimately side with a cultural explanation. To understand the recent populist tide, they maintain, we have to focus on value change and generational replacement.
Value Change, Tipping Point and Backlash
The starting point for the ‘cultural backlash theory’ is large-scale social transformations. Advanced democracies have undergone profound change over recent decades. Young adults are enrolling in universities at unprecedented numbers, more women are working than in the past, the traditional family has become less stable and new forms of partnerships have emerged. Social conformity has declined and lifestyles have become highly differentiated. Inglehart (Reference Inglehart1977) anticipated this tectonic shift early on and has been mapping the evolution of cultural value change for forty years. Building on this work, Norris and Inglehart confirm the basic move towards post-materialism or libertarian values but stress that large-scale societal change is bound to create counter-reactions. In fact, they point at Newton's third law of motion to highlight that, inevitably, the movement towards ‘post-materialism and other socially progressive policies stimulated a reaction on the part of social conservatives’ (Norris and Inglehart Reference Norris and Inglehart2019, 44).
As the silent revolution unfolds, societies become more culturally progressive on average, but not everyone cherishes this change. Those who stick to more conservative views increasingly feel cast aside and fear being turned into ‘strangers in their own land’ (Hochschild Reference Hochschild2016). However, since tectonic shifts unfold slowly, once-dominant groups feel threatened only when they become relegated from (numerical) majority to minority status. At this ‘tipping point’, threats to social conservatives trigger authoritarian reflexes, which, in turn, translate into votes and seats for populist parties (Norris and Inglehart Reference Norris and Inglehart2019, 33, Figure 2.1). The silent revolution thus provokes a counter-revolution (Betz Reference Betz1993; Ignazi Reference Ignazi1992). We have witnessed the accelerated rise of authoritarian populism over the past two decades, somewhat paradoxically, because cultural liberalism has become more widespread.
According to Cultural Backlash, three secular processes drive value change. First, the massive expansion of (higher) education in advanced democracies. Albeit at different speeds, these societies have all experienced a huge increase in tertiary education. The share of younger cohorts who attain a college degree has grown tremendously, while those who drop out of school or leave with a high-school diploma only has declined. The increase in tertiary education has been particularly pronounced for women. Secondly, the surge towards urbanization continuous. In particular, those with higher levels of education move towards large cities, creating distinct skill clusters (Iversen and Soskice Reference Iversen and Soskice2019). Thirdly, Western democracies have become much more ethnically diverse. Even countries like Germany that held on to the myth of not being an ‘immigration country’ (Einwanderungsland) for a long time have seen a large inflow of people from other countries over recent decades. As elsewhere in (Western) Europe, well above 10 per cent of its citizens today have foreign-born parents or grandparents. Taken together, these transformations promote value change among younger cohorts – and pit them against the more socially conservative older ones:
We argue that the slow process of value change arising from generational, educational, gender, and urban transformations have deepened cultural cleavages in many Western societies and changed the relative balance between liberalism and conservatism. Older social conservatives have gradually lost their hegemonic status, although remaining a large minority of society – and a bare majority of the voting public. In addition, traditional social conservatives are clustered disproportionately in declining rural communities based on manufacturing and agriculture, whereas the younger generations have moved away to cities in pursuit of college degrees and job opportunities, leaving behind aging, overwhelmingly white, and less-educated populations. (Norris and Inglehart Reference Norris and Inglehart2019, 45–46)
The cultural backlash theory thus suggests that older cohorts hold more conservative or authoritarian views (these two terms seem to be used interchangeably) and vote more often for (authoritarian-)populist parties that promise to defend the old order.Footnote 3 Younger cohorts hold more liberal views and thus vote differently – but also turn out to vote less frequently. As a consequence, the make-up of parliaments and political decisions do not fully reflect the now-dominant norms in society because socially conservative positions are disproportionately represented (Norris and Inglehart Reference Norris and Inglehart2019, 55–56).
A Cultural Cleavage?
Norris and Inglehart stress that different cohorts hold different attitudes shaped by historical experiences. Throughout the book, they distinguish between four cohorts (Norris and Inglehart Reference Norris and Inglehart2019, 36):
(1) Interwar generation (born 1900–45)
(2) Baby Boomers (1946–64)
(3) Generation X (1965–79)
(4) Millennials (1980–96)
Although cohorts and generational change are at the heart of their explanation, Norris and Inglehart do not explain either why they choose this periodization or if the political experiences of people born at the same time are comparable across countries. If we take the Baby Boomers, for example, the formative political years took place under state socialism (Eastern Europe), fascist dictatorship (Spain, Portugal), partial military rule (Greece) or liberal democracy (Western Europe and the US).Footnote 4 Given these differences, one might think that populism differs across countries or regions (Manow Reference Manow2018; Mudde and Kaltwasser Reference Mudde and Kaltwasser2012b), but this is not the focus of the book.
Instead, Norris and Inglehart assume that there is a general trend towards cultural liberalism. Due to secular, long-term transformations, each younger cohort is supposedly less socially conservative than the previous one, though period effects may attenuate overall trends. In chapter 4, the authors seek to show that cohorts do differ in their attitudes towards cultural issues. This is a crucial step in the analysis because if there was no ‘heightened polarization over cultural issues’ (Norris and Inglehart Reference Norris and Inglehart2019, 87), it would be difficult to argue that the backlash against socially liberal values stirs up support for populist parties.
To demonstrate differences between cohorts and thus the potential for polarization, Norris and Inglehart use, among other datasets, the ESS. This is a large-scale, cross-sectional survey project fielded every other year. Between 2002 and 2014, thirty-two European countries have participated (though each country did not participate in each round). Norris and Inglehart argue that older cohorts – the Interwar generation and Baby Boomers – tend to adhere to more authoritarian values, while younger cohorts – Generation X and Millennials – support liberal values. They analyse a number of survey items to prove this point. In a first step, they look, for example, at attitudes towards homosexuals, European integration and immigration.
Let us look at one example. The ESS repeatedly asks respondents whether they agree or disagree with the following statement on a five-point scale: ‘Gay men and lesbians should be free to live their own life as they wish.’Footnote 5 Norris and Inglehart use a z-transformation to scale these items and to capture value differences between birth cohorts (that is, they subtract the mean from the raw values and set the standard deviation to 1). If we look at this particular item, the resulting plot looks like the left panel in Figure 1.
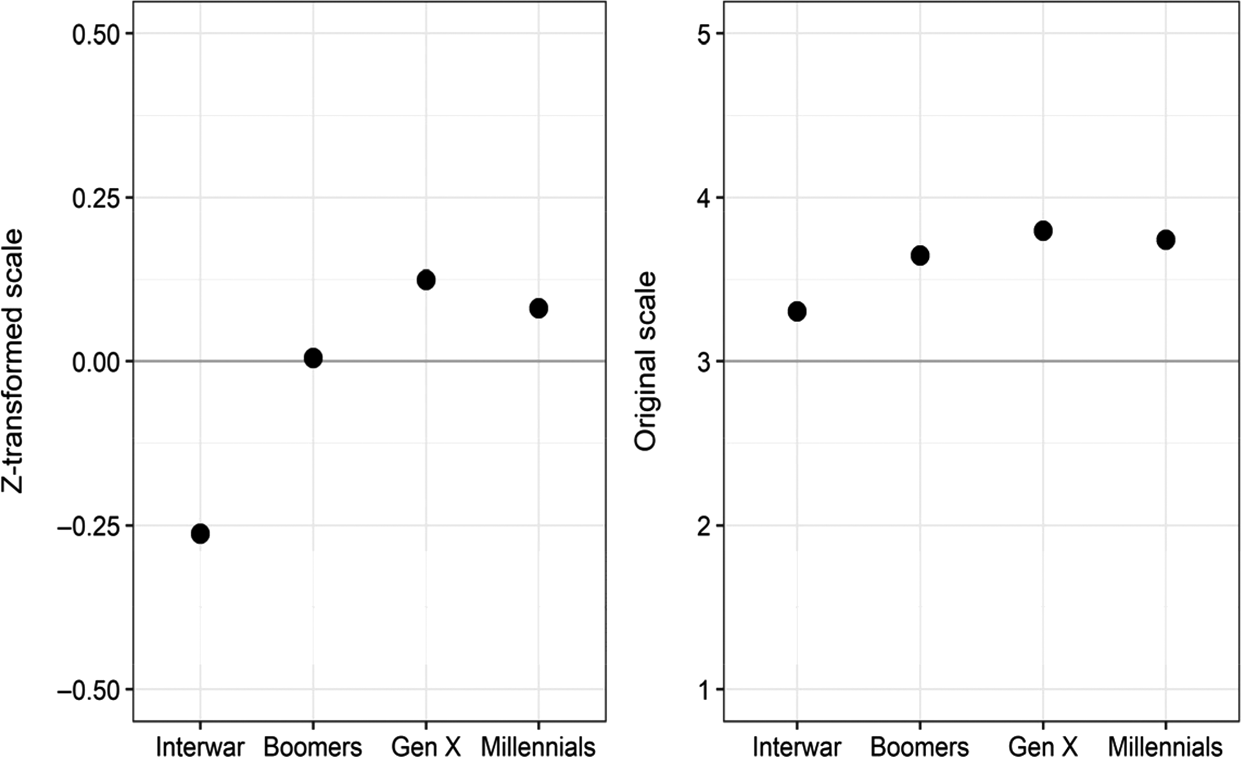
Figure 1. Attitudes towards homosexuals.
Note: Data from ESS, rounds 1–7, weighted.
The Interwar generation agrees less and has values lower than 0. Younger cohorts have more liberal attitudes and, accordingly, positive values on the scale. Similar patterns exist for the other items Norris and Inglehart (Reference Norris and Inglehart2019, 96, Figure 4.3) examine. However, if we look at the original scale on the right panel of Figure 1, we see that, on average, each cohort agrees that gay men and lesbians should be free to live their own lives as they wish. The difference is a matter of degree rather than principle, so that older cohorts are somewhat less liberal rather than socially conservative. The alleged pattern of polarization results from the specific transformation of the data. Obviously, one can produce negative and positive values from any distribution – as long as the groups somewhat differ. However, on this basis, it would be far-fetched to argue that older and younger cohorts have polarized opinions on this issue.
If we add further survey questions, the overall pattern does not change. In general, the differences between birth cohorts' opinions are small and hardly polarized (see Figure A-1 in the Online Appendix). In fact, group averages hover around mean values of the scales for most survey items. Of course, it does not follow that there are no statistically significant differences, but these also occur if everyone endorses liberal positions in principle, albeit to different degrees.
To support further the claim that older and younger cohorts differ on basic cultural attitudes, Norris and Inglehart use ten items from the Schwartz scale to measure authoritarian and liberal attitudes (Schwartz Reference Schwartz and Zanna1992). Respondents to the ESS are asked to rate on a scale from 1 to 6 how much a hypothetical person is or is not like themselves. Here are two examples:
(1) ‘It is important to her/him always to behave properly. She/he wants to avoid doing anything people would say is wrong.’
(2) ‘She/he likes surprises and is always looking for new things to do. She/he thinks it is important to do lots of different things in life.’
A principal component factor analysis shows that the ten items load on two underlying factors, which Norris and Inglehart (Reference Norris and Inglehart2019, 104, Table 4.3) label ‘authoritarian’ and ‘libertarian’ values.Footnote 6 Again, both factors are z-transformed to have a mean value of 0 and a standard deviation of 1. As before, this transformation creates respondents who fall below and above 0. Based on these transformations, the distribution of group means plotted in Figure 2 emerges, which allegedly confirms that older cohorts hold more authoritarian and less libertarian views, while the opposite is true for younger cohorts. There seems to be a clear dividing line between the Interwar generation and Baby Boomers, on the one hand, and Generation X and Millennials, on the other.
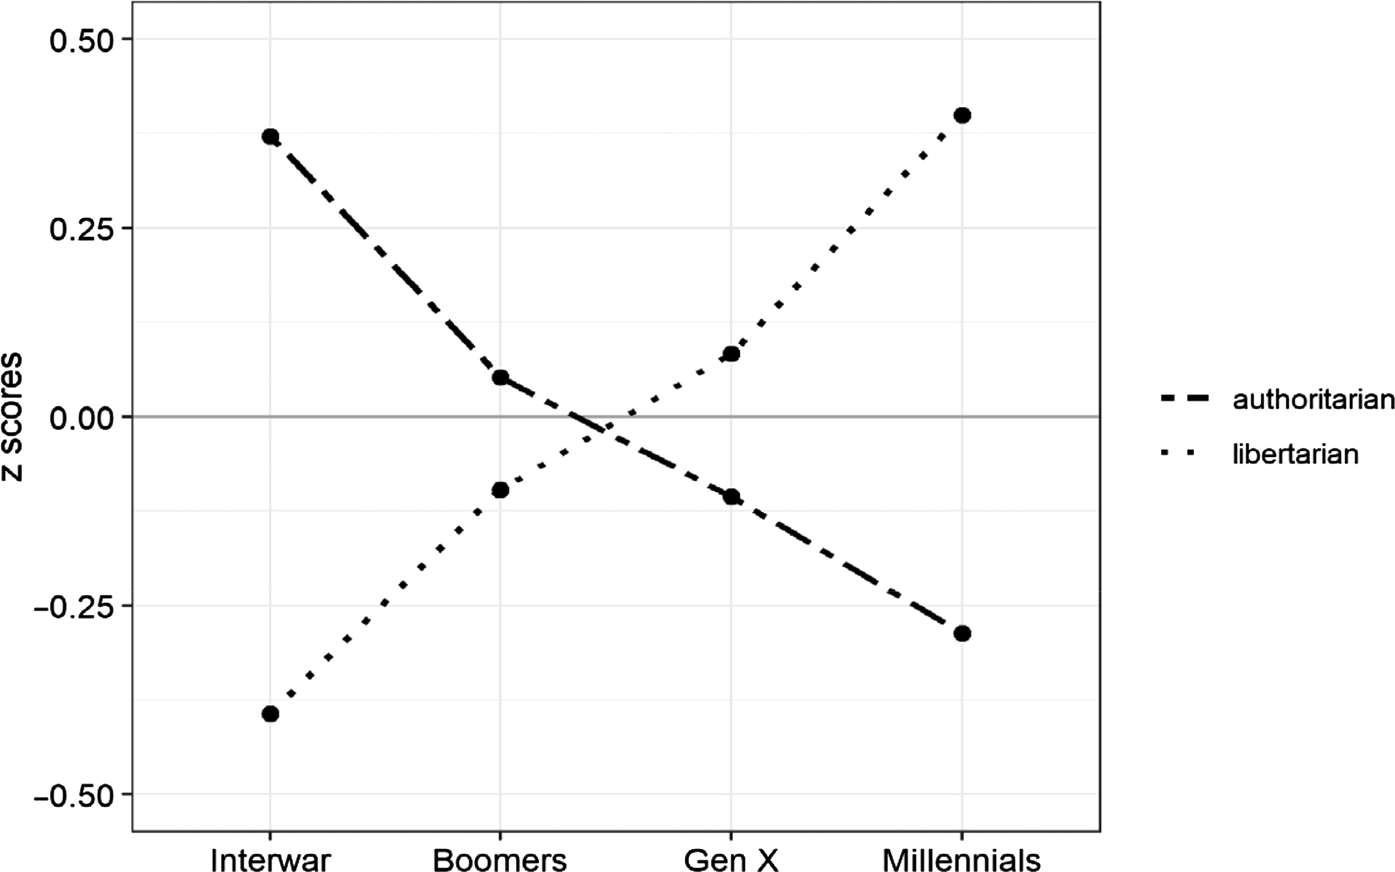
Figure 2. Authoritarian and libertarian values based on the Schwartz scale.
Note: Data from ESS, rounds 1–7, weighted, z-scores.
As before, it is worthwhile looking at the initial distribution of the values, which Figure 3 does. A few observations are worth noting. First, on most items, different birth cohorts agree in principle, though younger cohorts tend to adopt more libertarian positions. Secondly, respondents from each birth cohort endorse supposedly libertarian and authoritarian values. In other words, most respondents value not only individual freedom, but also safety and security. This bodes ill for the basic contention of Norris and Inglehart that younger cohorts cherish libertarian, and older cohorts authoritarian, values. Third, there is only one item where old and young hold opposing views: ‘She/he looks for adventures and likes to take risks. She/he wants to have an exciting life.’ However, as the median age of the Interwar generation is 72, age rather than cohort might drive the answers to this particular item – and it seems hard to read an expression of authoritarian dispositions into this.
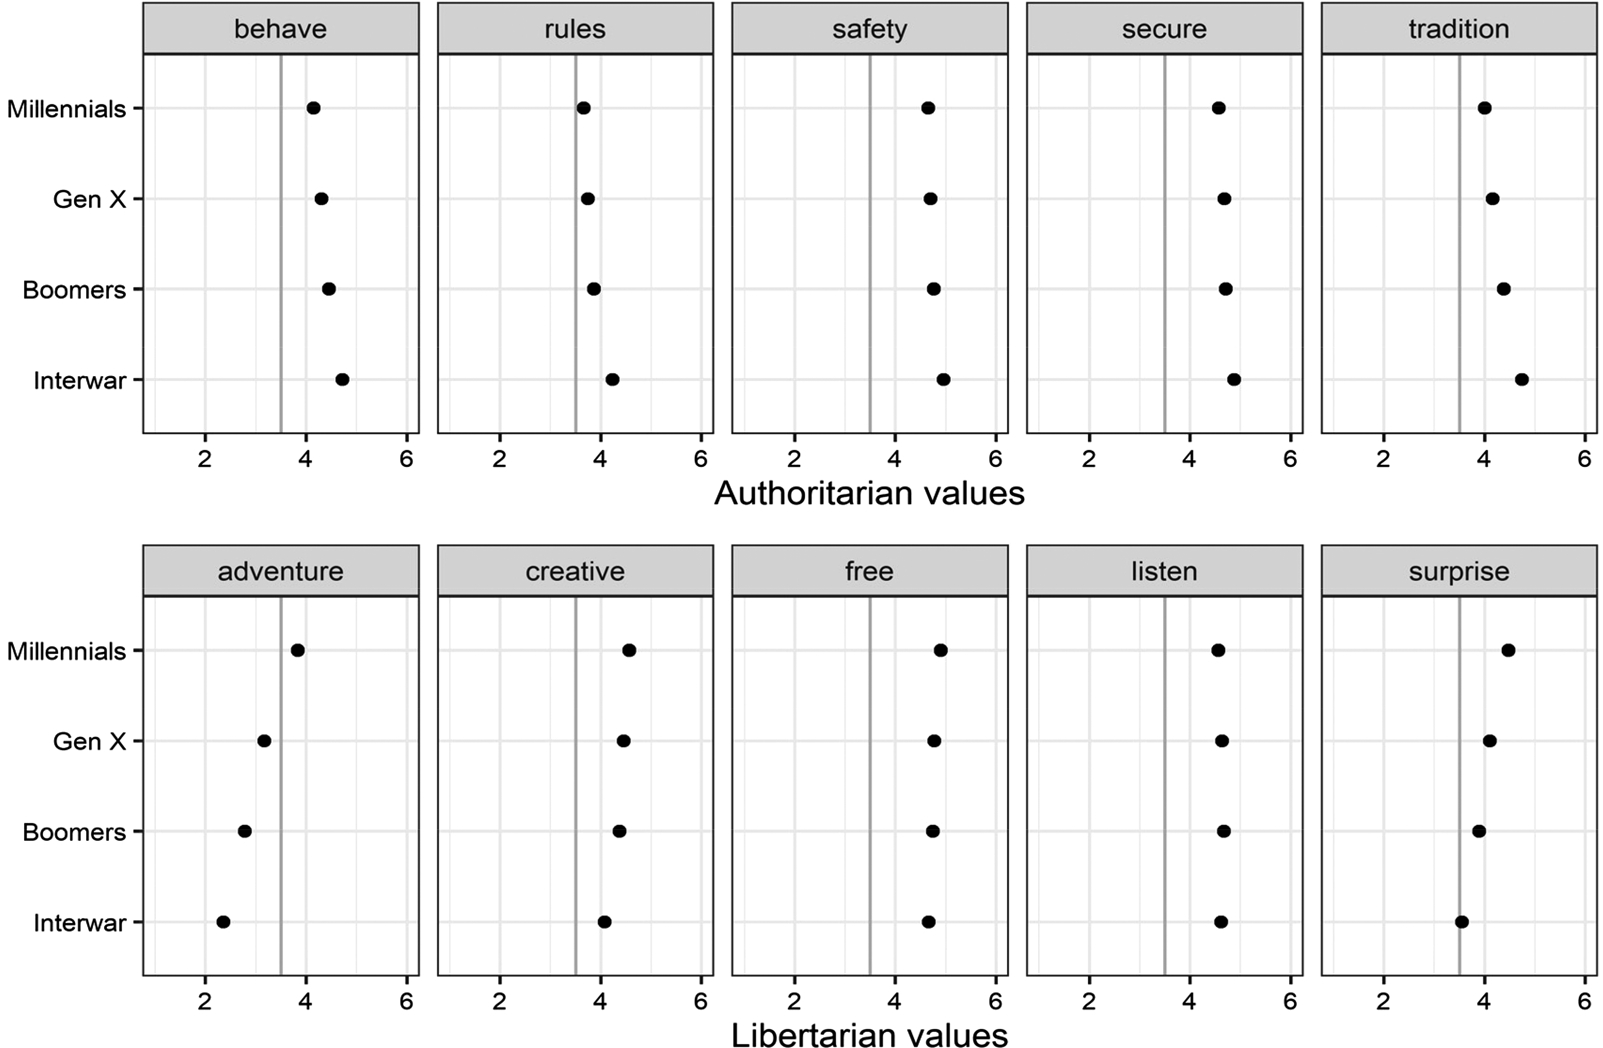
Figure 3. Authoritarian and libertarian values.
Note: Items from the ESS Human Values list. Data from ESS, rounds 1–7, weighted.
In additional multivariate analyses, Norris and Inglehart test whether the value differences between birth cohorts disappear when they control for additional variables. To facilitate interpretation, they rescale the two factors so that the minimum is 0 and the maximum is 100. In all of their models on authoritarian values, birth cohort is a significant predictor:
The results in the successive models confirm that birth cohort is an important predictor of support for authoritarian values.… the Interwar generation proved significantly more likely to endorse authoritarian values than successive generational cohorts, with Millennials being the most libertarian. Authoritarianism fades steadily in the pooled European sample as we move from older to younger birth cohorts, supporting the cultural change thesis, which emphasizes the process of generational population replacement. (Norris and Inglehart Reference Norris and Inglehart2019, 108)
Yet, this conclusion is not warranted. If we look at the predictions, the Interwar generation's estimated ‘authoritarianism’ is 69.3 on a scale from 0 to 100. The estimates for Baby Boomers, Generation X and Millennials are 65.8, 64.4 and 62.9, respectively (Norris and Inglehart Reference Norris and Inglehart2019, 109–10, Table 4.4). To be sure, this is a statistically significant difference – but one in degree. All four cohorts are predicted to hold what the authors call ‘authoritarian values’. Granted, Millennials are the least authoritarian, but in the preceding quote and, in fact, throughout the book, Norris and Inglehart suggest that younger cohorts oppose authoritarian values and champion libertarian ones.Footnote 7 However, their own findings do not bear this out. If we look at the ordinary least squares (OLS) regression that seeks to explain libertarian values (or socially liberal ones), the same picture emerges: for all cohorts, the estimated value is above 50 and ranges between 54 and 56.2 on a scale from 0 to 100. The youngest cohorts are 2.2 percentage points more libertarian than the Interwar generation – hardly an indicator of tectonic shifts or glacial movement.
To conclude this section, the data do not support the claim that in European societies, younger and older cohorts stand on two sides of a cultural conflict in which the old defend authoritarian, and the young libertarian, values. Instead, all birth cohorts tend to agree in principle but differ in the degree of support – and a majority in each group supports libertarian and allegedly authoritarian values at the same time. These findings make it unlikely that societies have reached a tipping point at which the libertarian youth push aside the generation of their parents and grandparents, who turn towards populist parties in disappointed self-defence.
Populist Attitudes
The overall argument of Cultural Backlash is that younger cohorts are socially more liberal than older ones, and as the latter lose majority status through generational replacement, they turn towards populist parties to stem the libertarian tide. Accordingly, after discussing cultural values, the authors analyse populist attitudes. Norris and Inglehart (Reference Norris and Inglehart2019, 117) acknowledge that the ESS does not offer a way to measure populist attitudes directly. Instead, the authors use three items that ask about political trust: trust in parliaments, politicians and parties.Footnote 8 Respondents indicate whether they have ‘no trust at all’ (0) or ‘complete trust’ (10). Norris and Inglehart reverse the scales so that higher values mean lower levels of trust or higher mistrust, add up the three items, and rescale the resulting values from 0 to 100. Higher numbers express higher levels of mistrust, which is used as a proxy for populist attitudes.
If the cultural backlash theory is correct, older, more socially conservative or authoritarian survey respondents would be expected to display more populist attitudes. However, this is not the case. The differences are generally small and do not fit the expected pattern. Baby Boomers and Generation X distrust political institutions slightly more than the Interwar generation and there is no difference between the latter and Millennials. These findings are robust to the inclusion of a variety of additional variables (Norris and Inglehart Reference Norris and Inglehart2019, 117–19). If we look at the pattern in Figure 4, we see not only that differences between cohorts are small, but also that there are much larger differences between countries (light-grey dots). This is in line with the analyses in chapter 5 of Cultural Backlash, in which the authors show that economic insecurity and gross domestic product (GDP) per capita correlate strongly with political trust at the macro level (Norris and Inglehart Reference Norris and Inglehart2019, 159, 163).Footnote 9
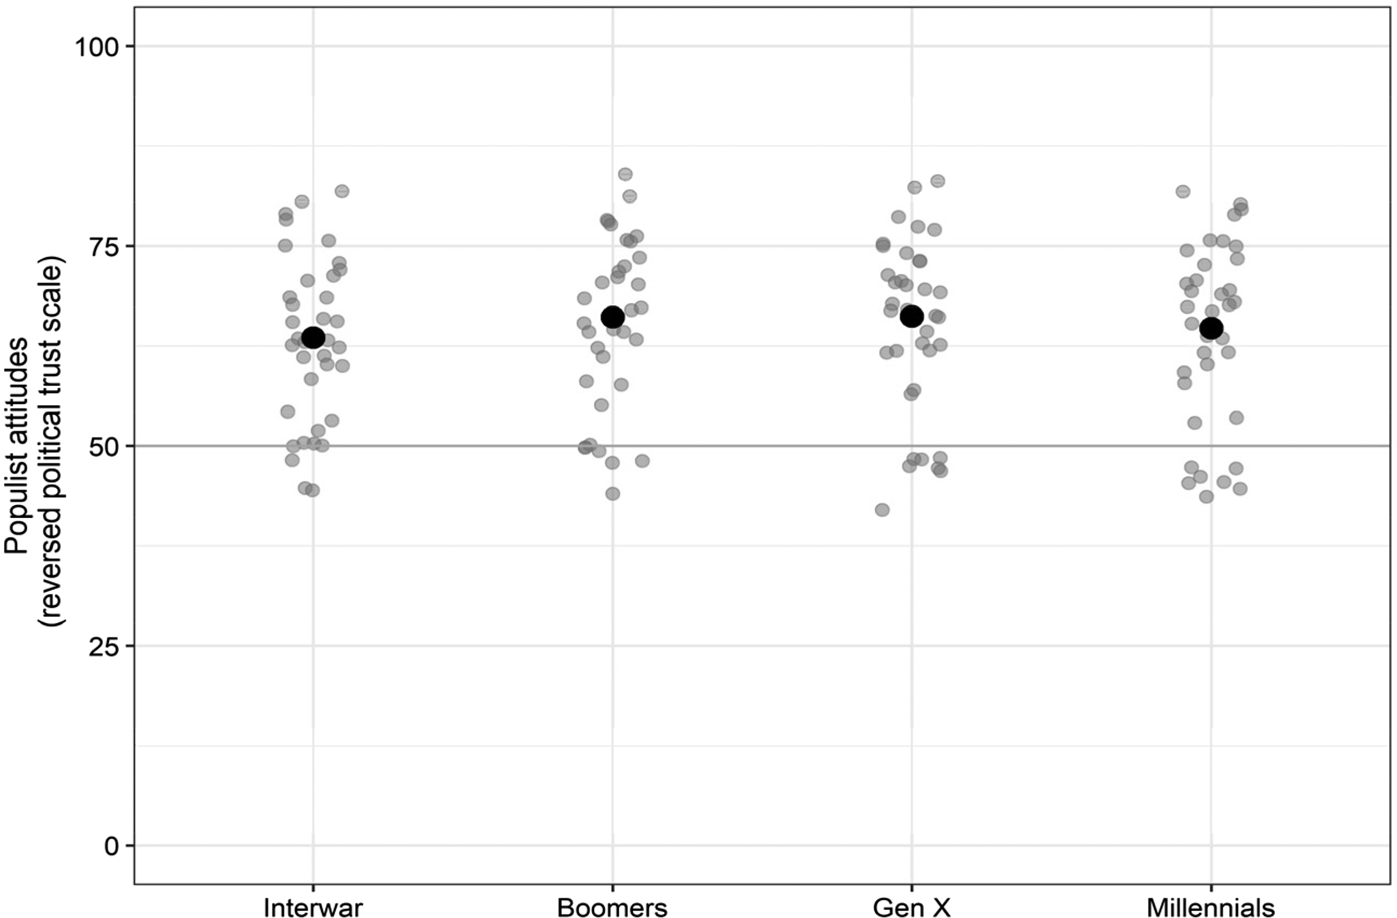
Figure 4. Populist attitudes.
Notes: Populist attitudes are the reversed scale of political trust, which combines trust in parliaments, parties and politicians. Dark dots represent the overall mean and the light-grey dots country means. Data from ESS, rounds 1–7, weighted.
According to their own analyses, older cohorts are no more populist than younger ones, though Norris and Inglehart argue that the former are more authoritarian and supposedly spearhead the populist backlash against the rise of cultural liberalism. As the argument predicts a link between authoritarian values and populism (Norris and Inglehart Reference Norris and Inglehart2019, 33, Figure 2.1), one would expect the authors to directly test this link – but they do not. Hence, I run regression models to test whether the authoritarian value scale significantly correlates with populism. Each model includes country fixed effects and also fixed effects for survey year in the second and third models. As we can see in Table 1, higher scores on the authoritarian values scale significantly reduce populist attitudes, which means that more authoritarian beliefs correlate with higher political trust.Footnote 10 In addition, the two middle cohorts are more likely to have high levels of mistrust, whereas Millennials are no more populist than the Interwar generation – none of this squares with the cultural backlash theory.
Table 1. Regression coefficients for low political trust (proxy for populism)
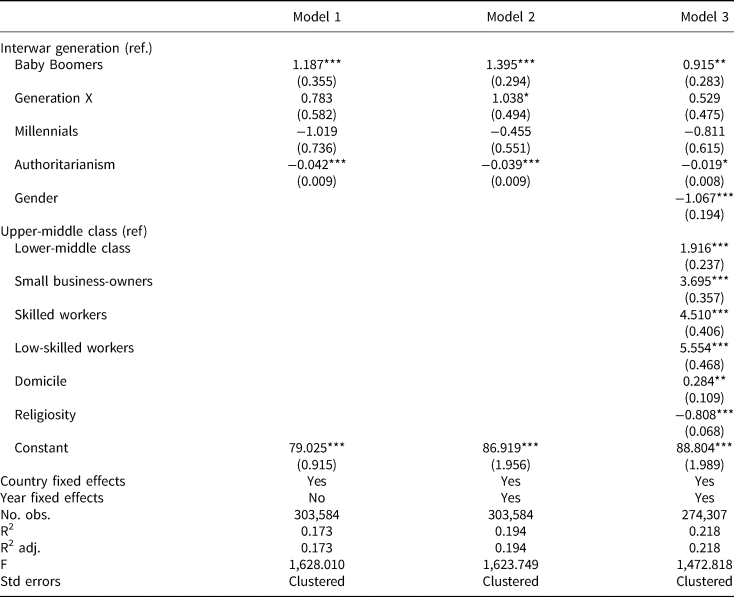
Notes: The table show the coefficients of OLS regression models that estimate populist attitudes (= low trust in political institutions). Data from ESS, rounds 1–7. + p < 0.1; * p < 0.05; ** p < 0.01; *** p < 0.001.
One of the reasons for the inconsistent results might be that low levels of trust in political institutions are not equivalent to populist attitudes.Footnote 11 One indication is that according to this measure, roughly 60 per cent of the population seem to hold populist attitudes. Norris and Inglehart's choice for mistrust to measure populist attitudes results from the lack of suitable items in the ESS. However, in chapter 11, in which they discuss the Brexit referendum, they use an alternative measure of populist attitudes.
The British Election Study 2014–2023 Internet Panel (BES) implemented a set of items to measure populism. The study relies on earlier attempts to identify survey questions that capture populist inclinations (Akkerman, Mudde and Zaslove Reference Akkerman, Mudde and Zaslove2014; Hawkins, Riding and Mudde Reference Hawkins, Riding and Mudde2012). The following items are used:
(1) The politicians in the UK Parliament need to follow the will of the people
(2) The people, and not politicians, should make our most important policy decisions
(3) I would rather be represented by a citizen than by a specialized politician
(4) Elected officials talk too much and take too little action
(5) What people call ‘compromise’ in politics is really just selling out on one's principles
The answers range from ‘strongly disagree’ (1) to ‘strongly agree’ (5). Norris and Inglehart add the responses and rescale the sum to a range from 0 to 100, where higher values stand for more populist attitudes. In addition, the BES includes a scale of libertarian to authoritarian values, which ranges from 0 to 10.Footnote 12 Both scales are highly correlated with the Leave vote in favour of Brexit (Norris and Inglehart Reference Norris and Inglehart2019: 383–4, Table 11.1). If the cultural backlash theory is true, older cohorts should have more authoritarian attitudes and score higher on the populism scale.
The upper panel of Figure 5 shows the distribution of libertarian versus authoritarian values for four birth cohorts in Great Britain. Despite the fact that the mean for each cohort is above 5, that is, it leans towards the authoritarian pole, the overall pattern fits with Norris and Inglehart's expectations: younger cohorts are somewhat less authoritarian and the variance of opinions is higher. In contrast, the Interwar generation is, on average, more inclined to authoritarianism. However, the pattern for populist attitudes does not meet the expectation, as the differences between the cohorts are negligible (see the lower panel in Figure 5).Footnote 13 Again, populist attitudes do not seem to be more prevalent among older cohorts. If we measure populism more directly than looking at political mistrust, we do not find that the old are systematically more inclined to hold these attitudes than the young.
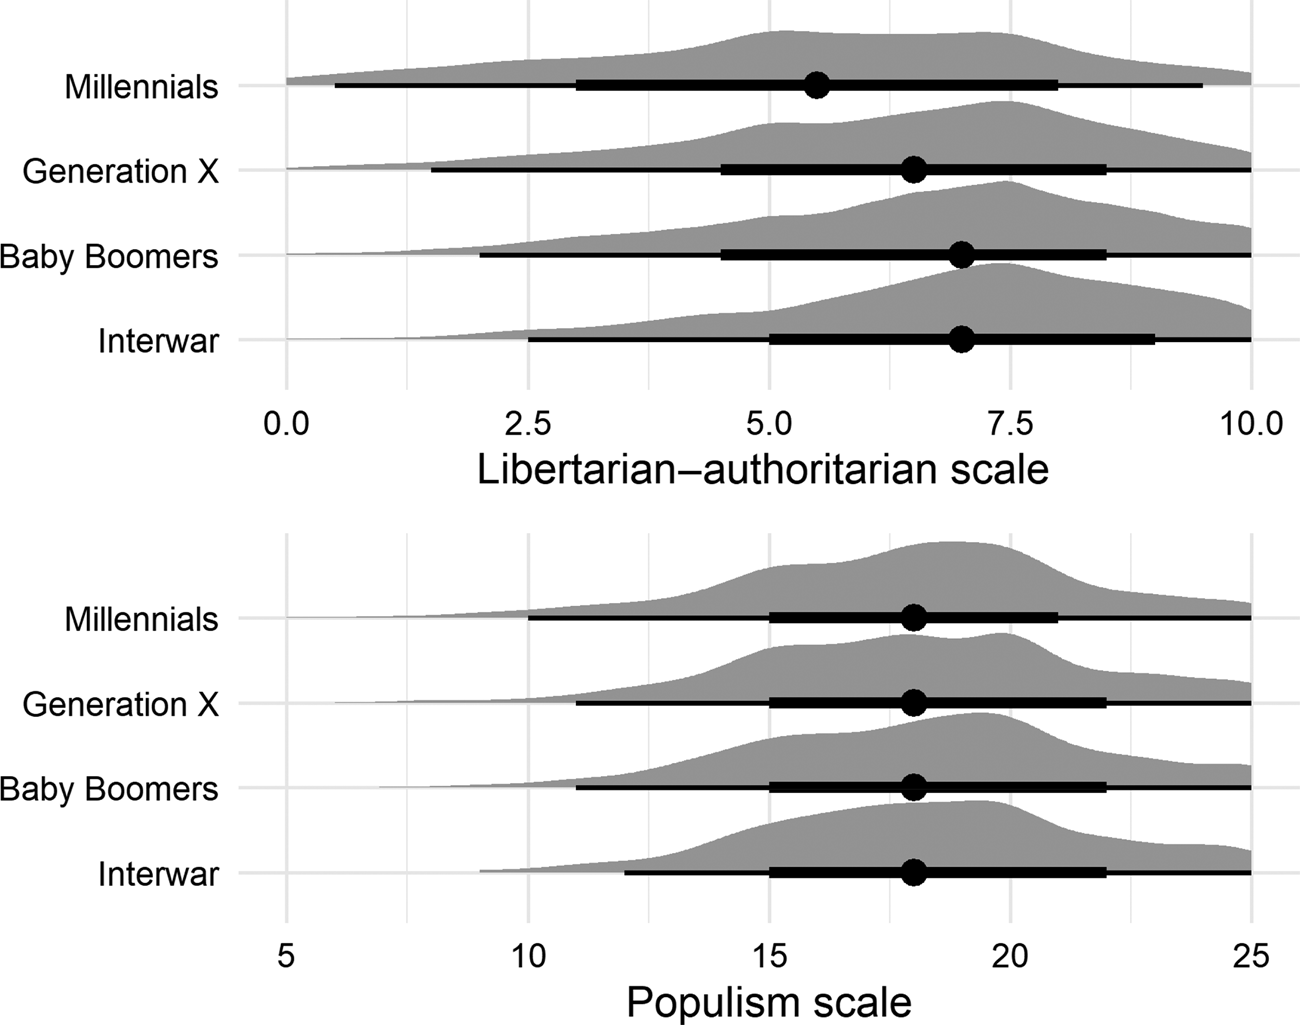
Figure 5. Authoritarian versus libertarian values and populist attitudes in Great Britain.
Note: Data from BES, wave 9.
Overall, there is little support for Norris and Inglehart's central claim that older cohorts have more authoritarian attitudes and, as they become a minority, turn towards populism to fend off societal liberalization. To further investigate this, I turn next to the vote for populist parties.
Authoritarian-Populist Parties
A number of ways exist to identify populist parties: using manifesto data, interviewing candidates running for office, analysing politicians' communications or using expert judgements. In chapter 7, Norris and Inglehart explain their take on the issue. They use the Chapel Hill Expert Survey (CHES) from 2014 to map the ideologies of parties in Europe (Bakker et al. Reference Bakker2015). The CHES is a great source for analysing party differences, though it was designed to identify parties opposed to European integration rather than populism as such. As a consequence, it does not include items on anti-pluralism or the moral worth of ‘the people’ (Norris and Inglehart Reference Norris and Inglehart2019, 230).
The 2014 round of the CHES includes 13 items that Norris and Inglehart use. Seven gauge differences between libertarian and authoritarian parties, two capture populist rhetoric, and four concern the classical economic left–right cleavage.Footnote 14 A principal component factor analysis confirms that these items are well suited to capture three dimensions of party competition. The respective items were then added and standardized to 100-point scales (higher values denote authoritarian, populist and economic conservative positions) (Norris and Inglehart Reference Norris and Inglehart2019, 232).
In Figure 6, we replicate the analyses with the 2014 CHES data (Bakker et al. Reference Bakker2015). Parties marked with black diamonds are right-wing parties (values above 50) and those marked with hollow triangles are left-wing parties.Footnote 15 Based on these data, the neo-fascist Greek party Golden Dawn and the left-wing party Syriza are similarly populist. However, they differ strongly on the libertarian–authoritarian dimension. Based on this mapping exercise, authoritarian-populist parties are placed in the upper-right corner of the figure and libertarian-populist parties in the lower-right one. The authors clearly distinguish between these two varieties of populism: ‘While authoritarian populists prioritize social conservatism, order, customary traditions, deference to strong leaders, and social stability; libertarian populists favor post-materialist values, social liberalism, individual autonomy, and tolerance of multicultural lifestyles’ (Norris and Inglehart Reference Norris and Inglehart2019, 78).
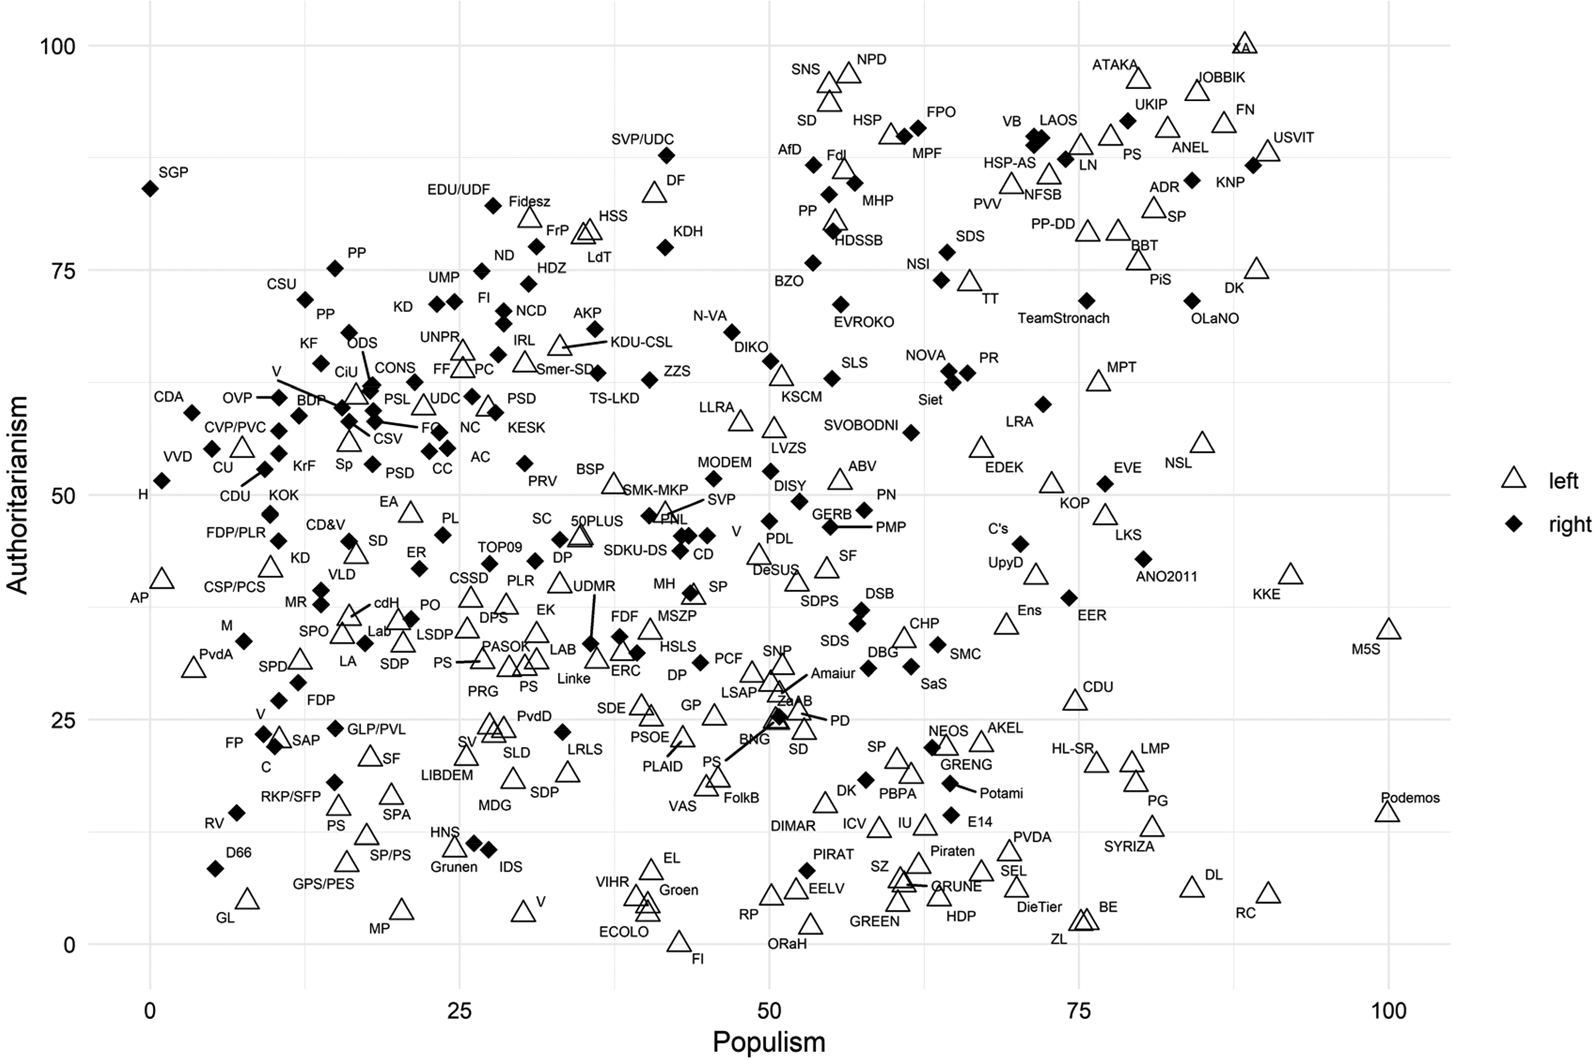
Figure 6. Authoritarian and populist parties.
Note: Data from the 2014 CHES.
In chapter 8, Norris and Inglehart combine the CHES data with the ESS to answer the question: ‘Who votes for authoritarian-populist parties?’Footnote 16 Despite the title of the chapter and numerous mentions of ‘authoritarian-populist parties’, Norris and Inglehart analyse the two dimensions separately. This is an unfortunate decision because putting libertarian- and authoritarian-populist parties into one basket might blur the results. It is an analytic choice that not only runs counter to the distinction between different varieties of populism, but is also at odds with what the theory suggests. If older cohorts are more authoritarian and younger ones more liberal, we would expect the former to vote for the authoritarian and the latter for libertarian populists (which, however, still does not fit with the tipping point part of the explanation).
The empirical sections in chapter 8 look first at electoral participation and then at the vote for authoritarian and, afterwards, populist parties. I only discuss the findings with regard to the latter two questions. In Table 8.2, Norris and Inglehart (Reference Norris and Inglehart2019, 275–6) present five OLS regression models that seek to explain the vote for authoritarian parties. They find that younger cohorts are less likely to vote for these parties than older ones, which leads to the following conclusion: ‘The Interwar generation is far more likely to support authoritarian parties than younger cohorts, with least support found among Millennials. This provides further confirmation of the cultural backlash thesis, which emphasizes intergenerational differences as drivers of value change’ (Norris and Inglehart Reference Norris and Inglehart2019, 278–9).Footnote 17
A closer look at the results casts doubts on this proposition. While the Interwar generation has an estimated likelihood to vote for an authoritarian party of 51.98, this value drops to 49.21 for Millennials (calculated from Norris and Inglehart Reference Norris and Inglehart2019, 275, Table 8.2, Model 1). On a scale from 0 to 100, it seems somewhat exaggerated to argue on this basis that older respondents are ‘far more likely to vote for authoritarian parties’ – in fact, all cohorts are pretty close to the scale's average of 50. Given the emphasis on intergenerational differences, one would assume further that Generation X respondents were less likely to vote for authoritarian parties than Baby Boomers, but this is not the case. While the results for authoritarian parties are just not very strong, the results for populist parties are at odds with the theory. As Norris and Inglehart repeatedly state, they interpret the rise of populism as a reaction to value change and social liberalism. More socially conservative generations militate against the silent revolution and turn towards (authoritarian-)populist parties. However, the results in Table 8.4 (Norris and Inglehart Reference Norris and Inglehart2019, 284–5) show that younger cohorts are more likely to vote for populist parties. Once the authors include their measurement of authoritarian attitudes, the gap between birth cohorts further increases. The final model in Table 8.4 shows that Millennials have a 4.29-point higher score than the Interwar generation on a scale from 0 to 100. If we took these results at face value, we would have to conclude that the evidence disputes the cultural backlash thesis. However, it is hard to draw even that conclusion because the empirical strategy does not fit the theory in the first place.
To be fair, Norris and Inglehart report the results but do not further reflect on what they mean for their own theory. In fact, after acknowledging that ‘it is younger cohorts who are consistently drawn toward parties that are more populist’ (Norris and Inglehart Reference Norris and Inglehart2019, 282, emphasis in original), they simply repeat the argument that populism is a thin ideology that can be used across the political spectrum:
when populism is blended with progressive appeals, it can mobilize support among the young – if they can be persuaded to vote. By contrast, anti-establishment language about restoring power to ‘real’ people linked with authoritarian positions promising tough law and order, restricted border flows, and the restoration of national sovereignty, appeals more strongly to older citizens who are easier to mobilize to vote. (Norris and Inglehart Reference Norris and Inglehart2019, 286)
Given these assumptions, it would have seemed logical to run separate analyses for libertarian- and authoritarian-populist parties – in particular, since recent work on populism has tried to distinguish different (regional) subtypes (Bornschier Reference Bornschier and Hawkins2019; Filc Reference Filc2015; Manow Reference Manow2018; Mudde and Kaltwasser Reference Mudde and Kaltwasser2012b).
While it was not possible to reproduce fully the dataset Norris and Inglehart use, I replicate their analyses with round 9 of the ESS and the latest available CHES data (Bakker et al. Reference Bakker2020).Footnote 18 The CHES coding is used to assign values on populism and authoritarianism to parties, which are combined with ESS items on voting behaviour. The first step tests whether analysing the newest available data leads to similar results as the ones offered in chapter 8 of Cultural Backlash. In contrast to Norris and Inglehart, I seek to explain the vote for ‘authoritarian-populist’ parties too. These parties are identified in two different ways. First, I create a binary variable that assigns a ‘1’ to each party that has values above 50 on both the authoritarianism and the populism scale. Secondly, I calculate the square root of the product of both scales, which will produce a continuous scale with values between 0 to 100.
Table 2 contains the results of four models that explain the vote for more authoritarian, populist, and authoritarian-populist parties, respectively. The first two columns simply show that the results with a different dataset are in line with those reported in Norris and Inglehart (Reference Norris and Inglehart2019, Tables 8.2 and 8.4): younger cohorts are less likely to vote for more authoritarian parties and more likely to vote for more populist ones.Footnote 19 In the third and fourth columns, the results for authoritarian-populist parties in a more narrow sense are reported. No matter which method is used to identify these parties, birth cohorts differ very little in their voting behaviour. As younger cohorts are supposed to hold more libertarian values, these results are hard to align with the core tenets of the cultural backlash theory.
Table 2. Regression coefficients for voting behaviour
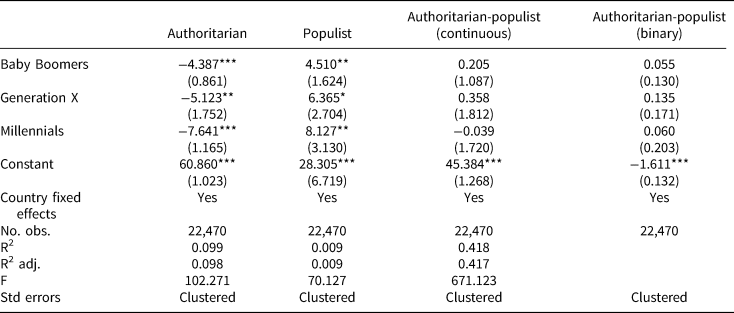
Note: The table shows the coefficients of four regression models that estimate the vote for authoritarian, populist and authoritarian-populist parties. Data from ESS, round 9. + p < 0.1; * p < 0.05; ** p < 0.01; *** p < 0.001.
If we add those variables to the models that Norris and Inglehart use to explain voting behaviour, the results clearly contradict their theory. In fact, the more controls we add, the less well the results fit the theory outlined in Cultural Backlash (compare Models 3 and 4 to Model 1 in Table A-5 in the Online Appendix). Each younger cohort is more likely to vote for authoritarian-populist parties than the next older one. Millennials – supposedly the most populism-averse cohort – have the highest probability to vote for these parties. At the same time, other explanatory variables fit very well to the results from other studies: women vote less frequently for authoritarian-populist parties than men; those with higher levels of education vote for these parties less frequently than those with lower levels; workers vote for these parties more often than sociocultural professionals; members of minority ethnic groups vote for these parties less often than other citizens; and those who position themselves politically further right are more likely to vote for these parties. It is worth noting, however, that there is no statistically significant effect of authoritarian values on the vote for authoritarian-populist parties once other factors are taken into account, while there is one for attitudes towards immigration, political trust and external efficacy. These results suggest that a cultural explanation of populism has some credibility, though it is grounded not in general authoritarian attitudes, but, more specifically, in opposition towards immigration (Ivarsflaten Reference Ivarsflaten2008; Mutz Reference Mutz2018; Oesch Reference Oesch2008).
Conclusion
Two years after publication, Cultural Backlash has been cited almost 1,000 times, according to Google Scholar. Scholars routinely refer to it when they juxtapose economic and cultural explanations for the rise of populism. However, if we look at the specific explanation Norris and Inglehart detail in their book, it does not hold. The main problem is that the cultural backlash theory they propose links generational value change to populist attitudes and voting. They argue that citizens who were socialized in far less liberal times feel cast aside by the rise of libertarianism and turn towards parties that promise a return to the golden age: ‘Make America Great Again’ or ‘Take Back Control’. Unfortunately, a closer look at the empirical data does not support the theory:
1. different age groups have very similar cultural attitudes, and there are few signs of polarization among old and young cohorts.
2. On most topics, different cohorts agree in principle, even though they might differ in degree.
3. There is no positive link between authoritarian values and populist attitudes (measured as political trust).
4. if we use a common populism scale rather than political trust, cohorts hardly differ.
5. Older cohorts are slightly more likely to vote for authoritarian parties but less likely to vote for populist ones.
6. Younger citizens are more likely than older ones to vote for authoritarian-populist parties defined in a more concise way; and
7. The Interwar generation is the cohort least likely to vote for authoritarian-populist parties.
In many ways, Cultural Backlash tells a comforting story: if authoritarian populism is a movement of older cohorts, generational replacement will attenuate the problem. However, if the recent success of authoritarian populism does not result from a countermovement of older generations against the spread of culturally liberal values, this hopeful perspective vanishes. In fact, the analyses of the previous section suggest quite the opposite: those generations that the theory assumes to be more socially liberal are more likely to vote for authoritarian-populist parties. Populism, one may conclude, is probably here to stay.
Do the analyses in this article suggest that cultural explanations of populism are generally wrong? Not really. One consistent result in Cultural Backlash and in my own replications is that opposition to immigration is linked systematically to authoritarian values and a lack of trust in politics. Opposing immigration also strongly correlates with voting for authoritarian-populist parties (see Table A-5 in the Online Appendix). If this opposition is driven by cultural rather than economic concerns, it is in line with one variant of the cultural theory of populism (Ivarsflaten Reference Ivarsflaten2008; Oesch Reference Oesch2008). It is less obvious, however, that citizens who oppose (some form of) migration also reject same-sex marriage, female emancipation or religious pluralism. In fact, voters of radical-right parties do not seem to have a closed authoritarian world view. Their cultural grievance is rather more specific and independent of the birth cohort they belong to.
Supplementary Material
Online appendices are available at: https://doi.org/10.1017/S0007123421000363.
Data Availability Statement
Replication data for this article can be found in Harvard Dataverse at: https://doi.org/10.7910/DVN/FVZ8TR
Acknowledgements
I am grateful to Lea Elsässer, Marie Kübler, Claudia Landwehr, Jan Philipp Thomeczek and Michael Zürn for very helpful and detailed comments. Two anonymous reviewers greatly helped to improve the article. I first discussed Cultural Backlash in a class with students and benefited from their ideas about the book. All remaining mistakes are mine.


 Open access