


1. Introduction
Collembola are rarely considered as economically important pests of agriculture. However, in the southern hemisphere, particularly in Australia, Sminthurus viridis (L.) (Collembola: Sminthuridae) is a major agricultural pest of broadacre crops and pastures (Bishop et al., Reference Bishop, Harris and McKenzie2001). In the southern regions of Australia, S. viridis, which is commonly named the lucerne flea, is particularly injurious during establishment of winter grain crops and again in early spring. Previous research has focused on studying their life cycle (Davidson, Reference Davidson1934; Wallace, Reference Wallace1967; Bishop et al., Reference Bishop, Harris and McKenzie2001) and assessing their susceptibility to pesticides (Bishop et al., Reference Bishop, McKenzie, Barchia and Spohr1998; Roberts et al., Reference Roberts, Umina, Hoffmann and Weeks2009), but there have been no population genetic studies conducted on this species.
Analysis of population processes can provide valuable insight into the evolution and ecology of species and there are numerous molecular tools available for such investigations (Hoy, Reference Hoy2003). Molecular markers, such as microsatellites and allozymes, are routinely used for elucidating the status of species, establishing modes of reproduction and gaining insight into population structure and gene flow (Handler & Beeman, Reference Handler and Beeman2003). This information is particularly important for pest species as cryptic species can undermine control strategies through their differing pesticide susceptibility, life cycle and plant hosts (Umina & Hoffmann, Reference Umina and Hoffmann1999; Umina et al., Reference Umina, Hoffmann and Weeks2004). Knowledge of gene flow is valuable in managing the spread of pesticide resistance and determining appropriate scales for control options (Lushai & Loxdale, Reference Lushai and Loxdale2004; Endersby et al., Reference Endersby, McKechnie, Ridland and Weeks2006).
S. viridis is a wingless springtail with adults developing to approximately 3 mm in length. Since its inadvertent introduction from Europe in the late 1800s, it has become established across southern Australia in Mediterranean-type climates (Wallace & Mahon, Reference Wallace and Mahon1971). This springtail has also invaded and become problematic in New Zealand, South Africa, South America and Asia (Wallace, Reference Wallace1974; Klein et al., Reference Klein, Rebolledo, Cerda and Aguilera2005). In Australia, S. viridis is a sporadic, winter-active pest that emerges in autumn from over-summering eggs after suitable rainfall and will undergo between two and five generations prior to the onset of summer (Bishop et al., Reference Bishop, Harris and McKenzie2001). Observational evidence of sexual mating behaviour (Betsch-Pinot, Reference Betsch-Pinot1976) and sex-ratio estimates (Davidson, Reference Davidson1934) indicate S. viridis is likely to reproduce sexually. Batches of around 60 eggs are laid on the surface of heavier loam soil types and are covered with a protective layer of glandular secretions by the female (Wallace, Reference Wallace1968). The main hosts of S. viridis are broad-leaved plants such as lucerne (Medicago sativa), clovers (Trifolium spp.) and capeweed (Arctotheca calendula); however, damage to seedlings of various grain crops is also common (Wallace, Reference Wallace1967).
Control options for S. viridis rely heavily on the prophylactic application of organophosphate pesticides (Roberts et al., 2009, No. 198). The nature of these spraying practices is likely to cause genetic bottlenecks and create strong selection pressure for pesticide resistance alleles (Hoffmann et al., 2008, No. 152). To date, there is no evidence of pesticide resistance in S. viridis populations, although they are known to have high chemical tolerances to several pesticides used for their control when compared with other establishment pests (Roberts et al., Reference Roberts, Umina, Hoffmann and Weeks2009). Knowledge of the population structure and migration potential of S. viridis will be essential for managing pesticide resistance if it arises.
Here we have used allozymes, microsatellites and the mitochondrial DNA cytochrome oxidase subunit I (COI) gene to examine the species status, mode of reproduction and population genetics of S. viridis in Australia. These marker systems have been routinely used for examining the population structure and gene flow of invertebrate pests for improving control strategies (Handler & Beeman, Reference Handler and Beeman2003). We contrast the patterns found with the different markers systems, particularly allozymes and microsatellites, and discuss the findings in the context of developing effective control strategies for S. viridis.
2. Methods
(i) Field sampling
Samples of S. viridis were collected throughout its Australian distribution between 2005 and 2007 (Fig. 1, Appendix 1 in Supplementary material). A total of 13 Victorian populations were sampled in 2005 for analysis with allozyme markers and 32 populations sampled in 2006 and 2007 across southern Australia were analysed with microsatellite markers. Samples were collected predominantly from pasture containing clover (Trifolium spp.), although samples were also collected from grain crops (e.g. oats), lucerne (M. sativa) and roadside weeds (mainly capeweed, A. calendula and barley grass, Hordeum leporinum). Collections were made by suction sampling with a Stihl SH55 blower vacuum and taken to the laboratory in plastic containers with plant material and paper towel. Adults were then isolated from the sample and stored at −70°C.

Fig. 1. Map of S. viridis sample populations across Australia used for allozyme (▴) and microsatellite (•) analysis. Australian states reading left to right are Western Australia, South Australia, New South Wales, Victoria and Tasmania.
(ii) Allozymes
We screened 38 allozyme loci for variability in S. viridis using the Titan III cellulose acetate gel electrophoresis system of Helena Laboratories (Hebert & Beaton, Reference Hebert and Beaton1989). Of these, seven were monomorphic, whereas three loci displayed polymorphic and interpretable variability; mannose-6-phosphate isomerase (MPI, EC 5.3.1.8), phosphoglucomutase (PGM, EC 5.4.2.2) and 6-phosphogluconate dehydrogenase (6PGDH, EC 1.1.1.44). All other loci either did not stain or displayed uninterpretable banding patterns. Briefly, an individual S. viridis adult was placed with 6 μl of sterile distilled water into each well of the sample plate and crushed with a spatula. Cellulose acetate gels (76 mm×76 mm) were soaked in running buffer for 20 min, blotted dry on filter paper and then placed on the aligning base. Extracts were simultaneously applied either centrally (cathodally migrating enzymes) or basally (anodally migrating enzymes) to the gel from each sample well using an applicator (Helena Laboratories). Gels were then positioned in electrophoresis tanks with the extracts at the anode end (where applicable) and the gels surface touching paper wicks at each end. Gels were run at 220 V for 20 min using a Bio-Rad Power/Pac 3000 power supply. Following this, gels were placed on glass plates and a stain consisting of 2 ml of stain ingredients and 6 ml of 1% agarose was applied to the gel surface. All stain recipes were taken from Hebert & Beaton (Reference Hebert and Beaton1989) or Richardson et al. (Reference Richardson, Baverstock and Adams1986) with some modifications. Following staining of the gel for a specific enzyme, the resulting banding pattern was recorded.
(iii) Microsatellites
DNA was extracted from whole S. viridis adults using a CTAB (hexadecyltrimethylammonium bromide) protocol involving chloroform/isoamylalcohol (24:1), proteinase K and ethanol precipitation with 5 M NaCl (Roberts & Weeks, Reference Roberts and Weeks2009). Samples were genotyped using eight microsatellite loci described in Roberts & Weeks (Reference Roberts and Weeks2009) and amplified with the same PCR mixtures and cycling conditions (with [γ33P]-ATP end labelled forward primer). PCR products were then separated through 5% polyacrylamide gels at 65 W for ~2 h and exposed for 24 h to autoradiographic film (OGX, CEA, Strängnäs, Sweden).
(iv) Mitochondrial DNA
A 437 bp fragment of the mitochondrial COI gene was amplified using S. viridis-specific primers (5′-CCTGGAAGATTAATTGGAGACG-3′/5′-TCAAAACAAGTGTTGGTATAGAATAGG-3′). These primers were designed to be specific for the COI mitochondrial DNA gene of S. viridis in Australia by using sequence data from several individuals obtained with universal invertebrate primers described by Folmer et al. (Reference Folmer, Black, Hoeh, Lutz and Vrijenhoek1994) . DNA extracted with a CTAB protocol was amplified in a 30 μl reaction containing 1×PCR buffer, 1·5 mM MgCl2, 0·2 mM dNTPs, 0·2 μM forward primer, 0·2 μM reverse primer, 0·6 units Taq polymerase (New England Biolabs) and 4 μl template DNA. PCR cycling conditions were 35 cycles of 94°C (30 s), primer annealing at 50°C (1 min) and extension at 72°C (1 min) using an Eppendorf Mastercycler 534×. The COI PCR products were sequenced by Macrogen Inc. (Seoul, South Korea) in both directions and sequence data aligned, edited and translated in MEGA version 4.0 (Tamura et al., Reference Tamura, Dudley, Nei and Kumar2007). All unique sequences have been deposited in GenBank (Accession numbers: HM355586–HM355589).
(v) Data analysis for allozymes and microsatellites
Genetic Data Analysis version 1.0 (Lewis & Zaykin, Reference Lewis and Zaykin2001) was used for estimating observed (H O) and expected (H E) heterozygosity, Weir & Cockerhams's (Reference Weir and Cockerham1984) inbreeding coefficient (F IS) and a global estimate of population differentiation (F ST), as well as testing for deviations from Hardy–Weinberg equilibrium within populations and loci. Allelic richness averaged over loci, population pairwise F ST estimates and linkage disequilibrium between loci was determined with FSTAT version 2.9.3 (Goudet, Reference Goudet2001). Additional estimates of population differentiation, G ST_est, G′ST_est and D est were obtained using SMOGD: software for the measurement of genetic diversity (Crawford, Reference Crawford2010). These estimates are suggested to be more accurate for identifying population structure by overcoming the limitations of F ST (Jost, Reference Jost2008). POWSIM version 4.0 (Ryman & Palm, Reference Ryman and Palm2006) was used for evaluation of the alpha error and statistical power of the allozyme and microsatellite loci for accurately detecting different levels of F ST. Population differentiation was also investigated using hierarchical analyses of molecular variance (AMOVA) in Arlequin version 3.11 (Excoffier et al., Reference Excoffier, Laval and Schneider2005), using pairwise F ST as the distance measure, with 10 000 permutations and missing data for loci set at 10%. The model used for the full microsatellite data partitioned the total variance among regions (Victoria, Western Australia, South Australia, New South Wales and Tasmania), among populations within regions and within populations. For the temporal data the model used partitioned the total variance among populations, among samples within populations and within samples. The model used for the Victorian microsatellite data and allozyme data partitioned the total variance among populations and within populations.
Bayesian clustering methods were used in Structure version 2.3.1 (Pritchard et al., Reference Pritchard, Stephens and Donnelly2000) and Structurama (Huelsenbeck & Andolfatto, Reference Huelsenbeck and Andolfatto2007) for identifying population structure and estimate the number of populations in the microsatellite data. In Structure version 2.3.1, a burn-in length of 10 000 followed by 10 000 iterations was used for each simulation using an admixture model and correlated allele frequencies among populations. The method of Evanno et al. (Reference Evanno, Regnaut and Goudet2005) was used for estimating the true number of populations in the data, K′. In Structurama, 10 000 Markov chain Monte Carlo cycles were used for inferring K following a Dirichlet process. This model assumes that the number of populations and the expected prior number of populations were random variables with a gamma distribution of shape and scale equal to 1 (Huelsenbeck & Andolfatto, Reference Huelsenbeck and Andolfatto2007). Patterns of genetic variation were also visualized by a factorial correspondence analysis performed in Genetix version 4.05.2 (Belkhir et al., Reference Belkhir, Borsa, Chikhi, Raufaste and Bonhomme2004) with the first two factors explaining the majority of the variation in multilocus genotypes plotted. Gene flow between populations was estimated using the F ST value averaged over all loci and the formula, Nm=(1−F ST)/4F ST (Slatkin & Barton, Reference Slatkin and Barton1989), where N is the effective population size and m is the migration rate. Linearized F ST and Nei's genetic distance D were also plotted against natural log geographic distance and tested for compliance with an ‘isolation by distance’ model by regression and Mantel tests. To test for signals of possible recent population bottleneck or founder events in the microsatellite data, the program Bottleneck version 1.2.02 was used (Piry et al., Reference Piry, Luikart and Cornuet1999). The program tests for a significant heterozygote excess compared to the heterozygosity level expected from the population sample size and allelic diversity. Dramatic reductions in effective population size are predicted to reduce allelic richness, through loss of rare alleles, more quickly than heterozygosity. One-tailed Wilcoxon tests were used under a two-phase model with 95% single-step mutations, 5% multi-step mutations and a variance among multiple steps of 12. Where needed, sequential Bonferroni corrections for multiple comparisons at the table-wide α=0·05 level were undertaken.
3. Results
(i) Allozyme analysis
From the 13 Victorian populations analysed, a total of seven alleles were found for the three polymorphic allozyme loci (Table 1) with an allelic richness of 2·33 in all populations except for Sale (r=2·00) (Table 2). This population also had the lowest observed and expected heterozygosity (0·351 and 0·307, respectively). All populations, however, showed moderate levels of observed and expected heterozygosity, typical of allozyme markers (H O, 0·351–0·493; H E, 0·307–0·519). No population had F IS values that were significantly different from zero or displayed significant departures from Hardy–Weinberg equilibrium (Table 2). There was also no linkage disequilibrium observed between loci across populations with all 39 pairwise tests being non-significant after correction for multiple comparisons.
Table 1. Molecular markers used to screen Australian populations of S. viridis. Overall values of populations for sample size (n), allelic number (a), observed (HO) and expected (HE) heterozygosity, inbreeding coefficient (FIS) and Hardy–Weinberg equilibrium P-values are given
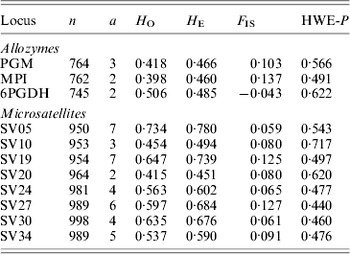
Table 2. Population statistics for S. viridis analysed with allozyme and microsatellite markers. Overall loci values for sample size (n), allelic richness (r), observed (HO) and expected (HE) heterozygosity, inbreeding coefficient (FIS) and Hardy–Weinberg equilibrium P-values are given

The estimate for F ST over all loci was 0·063 (0·022–0·111, 95% CI), which suggests significant population structure and limited gene flow exists between these samples. Similarly, significant population structure was shown by the estimates of G ST_est, G′ST_est and D est which ranged from 0·056 to 0·114 (Table 3). Significant variation among these samples was also shown in an AMOVA with 6·3% (P<0·001) of the variation explained by variation among populations and 93·7% of the variation explained by variation within populations (Table 4). Population pairwise comparisons of F ST revealed only moderate differentiation between these Victorian samples with 35 of 78 comparisons being non-significant after correction for multiple comparisons (Appendix 2 in Supplementary material). However, two populations (Echuca and Sale) showed complete differentiation from all populations and the Melton population was differentiated from all but one population. This pattern of genetic variation was supported by a factorial correspondence analysis where the first two axes explained 60·9 and 16·8% of the variation (Fig. 2(a)). Three populations (Echuca, Sale and Melton) are clearly differentiated from the other populations. However, no significant correlation was found between Slatkin's linearized F ST (Mantel r=0·195, P=0·136; R 2=0·004, F=0·297, P=0·587) or Nei's genetic distance D (Mantel r=0·195, P=0·136; R 2=0·004, F=0·297, P=0·587) against the natural log of geographic distance. Gene flow estimates using the formula, Nm=(1−F ST)/4F ST, indicate a migration rate of 3·72 individuals per generation between these populations.

Fig. 2. Factorial correspondence analysis by populations for S. viridis. Each point represents a sample region weighted by the number of individuals and the sum of alleles present. (a) Allozyme data; percentage of variation explained by the first factor is 60·89%. ECH=Echuca, VIC; MEL=Melton, VIC; SAL=Sale, VIC. (b) Microsatellite data; open diamonds=Western Australian population samples, star=South Australian population samples, closed circles=Victorian populations samples, open squares=New South Wales population samples, closed triangles=Tasmanian population samples. Percentage of variation explained by the first factor is 15·16%. CAC=Coolac, NSW; CLA=Clare, SA; COU=Coulta, SA; KOO=Koorda, WA; MGA=Mt Gambier, SA; MOL=Molong, NSW; TIM=Timboon, VIC.
Table 3. Estimates of differentiation between S. viridis populations and their 95% confidence intervals obtained from three allozymes and eight microsatellite markers

Table 4. Analysis of the molecular variation at three allozyme and eight microsatellite markers among regions (Western Australia, South Australia, Victoria, New South Wales and Tasmania), among populations within regions and within populations of S. viridis

(ii) Microsatellite analysis
A total of 38 alleles were found for the eight microsatellite loci in samples from 32 Australian locations (Table 1). Average allelic richness ranged from 2·75 to 3·74, although all but one population had an allelic richness greater than 3 (Table 2). Heterozygosity was moderately high in all populations with estimates ranging from 0·505 to 0·648 and 0·490 to 0·633 for observed and expected heterozygosity, respectively. For all populations F IS was not significantly different from zero and there were no significant departures from Hardy–Weinberg equilibrium (Table 2). No consistent linkage disequilibrium was found between loci across populations, with only three significant tests out of 896 pairwise comparisons after correction for multiple comparisons. Evidence of a recent population bottleneck was not found in any population, with no significant heterozygote excess detected after correcting for multiple comparisons.
Estimates of population differentiation for all the Australian samples indicated significant structure and limited gene flow between populations. The estimate for F ST over all loci was 0·086 (0·063–0·109, 95% CI), whereas estimates for G ST_est, G′ST_est and D est were somewhat higher ranging from 0·096 to 0·237 (Table 3). Estimates of population structure for only the Victorian populations showed similar results to the allozyme data with an F ST over all loci of 0·067 (0·051–0·083, 95% CI) and estimates for G ST_est, G′ST_est and D est ranging from 0·062 to 0·165 (Table 3). Significant genetic variation between the Australian samples was also shown from an AMOVA analysis with the majority of variation explained by variation within populations (91%, P<0·001), 7·6% (P<0·001) of the variation explained by variation among samples within regions and 1·4% (P<0·001) of the variation explained by variation among regions (Table 4). An AMOVA for only the Victorian populations showed 6·7% (P<0·001) of the variation was explained by variation among samples and 93·3% (P<0·001) of the variation was explained by variation within samples (Table 4). Maintenance of this genetic variation over time was also shown from an AMOVA analysis, with no significant variation found among four temporal samples taken from two different populations over a two-year period (P=0·884). Substantial differentiation was found for the population pairwise F ST estimates with only 21 out of 496 tests being non-significant after correction for multiple comparisons (Appendix 3 in Supplementary material). For the Victorian population pairwise F ST estimates only 2 out 105 tests were non-significant after correction for multiple comparisons (Appendix 3 in Supplementary material).
The pattern of genetic variation for these Australian samples was visualized by plotting the first two factors (15·16 and 12·57%, respectively) explaining the majority of the variation in a factorial correspondence analysis (Fig. 2(b)). Appreciable genetic variation is apparent both between and within regions, although the Victorian samples seem more discrete. Also, there is still an overlap between regions, despite considerable geographic distance between some regions (e.g. Western Australia and Victoria). In particular, Timboon (VIC), Mount Gambier (SA) and Clare (SA) were closely associated with Western Australian populations. The results from the Structure analysis, using the Evanno et al. (Reference Evanno, Regnaut and Goudet2005) method for estimating the true K, and the Structurama analysis both indicate that there are four groups within the data set. However, this grouping appears largely due to a couple of very distinct populations. Coolac (NSW), Molong (NSW), Koorda (WA) and Coulta (SA) are each the main population contributing to each group. Several other populations show a moderate affinity to these groups, although many show a strong admixture.
A significant correlation was found between Nei's genetic distance D and natural log geographic distance (Mantel r=0·166, P=0·026; R 2=0·028, F=14·047, P<0·001), but only marginal significance between Slatkin's linearized F ST and natural log geographic distance (Mantel r=0·140, P=0·075; R 2=0·020, F=9·867, P=0·002) (Fig. 3(a)). The results suggest that Australian populations may comply somewhat with an ‘isolation by distance’ model, but there are other factors also dictating structure. A similar trend was shown for the Victorian populations although again only marginal significance was found for both Slatkin's linearized F ST (Mantel r=0·191, P=0·117; R 2=0·036, F=3·897, P=0·051) (Fig. 3(b)) and Nei's genetic distance D (Mantel r=0·197, P=0·091; R 2=0·039, F=4·160, P=0·044). Gene flow estimates indicate a migration rate of 3·48 and 2·66 individuals per generation between the Victorian and Australian populations, respectively.

Fig. 3. Regression of linearized F ST (F ST/1−F ST) and natural log geographic distance (km) for (a) all microsatellite-analysed Australian populations (Mantel r=0·140, P=0·075; R 2=0·020, F=9·867, P=0·002); and (b) all microsatellite-analysed Victorian populations (Mantel r=0·191, P=0·117; R 2=0·036, F=3·897, P=0·051).
(iii) Statistical power
The statistical power of the allozyme and microsatellite markers to detect various levels of true F ST values between populations is shown in Table 5. This takes into account the sample sizes, number of loci and average allele frequencies of the data set. The results show that both marker sets will detect a true F ST of 0·01 or larger with a probability of 99% or more. The microsatellite markers did show greater statistical power with a 95% probability of detecting a true F ST as low as 0·005, whereas allozymes had only ~70% probability of detection. The alpha error (i.e. the probability of obtaining false significances when the true F ST=0) was also close to 5% for both marker sets.
Table 5. Statistical power of the allozyme and microsatellite markers for detecting various true FST values with Fisher's exact test and chi-square tests when using the study loci, allele frequencies and sample sizes. The power is expressed as the proportion of simulations that are statistically significant at the 0·05 level

(iv) Mitochondrial DNA analysis
A total of 65 S. viridis individuals from across its Australian distribution were sequenced for a 437 bp fragment of the mitochondrial cytochrome oxidase I gene. Extremely low sequence variation was found between samples with 89% of individuals belonging to a single haplotype (A). Three other haplotypes (B–D) were found although each differed from haplotype A by only a single bp substitution. All individuals from Tumby Bay, SA were haplotype B, whereas haplotype C and D were found in single individuals from Mount Gambier, SA and Donald, VIC, respectively, alongside haplotype A. Comparison between haplotype A and sequence data of S. viridis COI gene obtained from GenBank (Accession number: EU016192) revealed a 17% sequence divergence between the two sequences.
4. Discussion
The presented data indicate that S. viridis is a single, diploid species that reproduces sexually throughout its Australian distribution. Allele frequencies within populations conformed to Hardy–Weinberg proportions and remained so between temporal samples, as is expected for sexually reproducing organisms. These results support earlier evidence of sexual mating where indirect sperm transfer was observed in laboratory-reared populations of European S. viridis (Betsch-Pinot, Reference Betsch-Pinot1976) and also from sex-ratio estimates reported by Davidson (Reference Davidson1934) in South Australia. Sexual reproduction is common within the Collembola group and is the only form of reproduction to be found in the family Sminthuridae. There were also no fixed allelic differences between populations at any loci or significant variation at the mtDNA level, suggesting that all samples in this study represent a single species. However, there was substantial sequence divergence between S. viridis in Australia and the European sequence submitted to GenBank. The level of divergence is equivalent to that seen between Collembola genera. As we are confident that their taxonomic identification is accurate, it is unclear why there is such disparity between the sequences, but it is possible that they may represent cryptic species.
The data indicate that there is limited gene flow between populations of S. viridis in Australia, resulting in significant population structure. However, only a weak relationship was observed between genetic distance (linearized F ST and Nei's D) and geographic distance in the Victorian and in the Australia wide samples. This relationship seems to be largely disrupted by instances where distant populations are less differentiated than those more proximate. Being a relatively recently introduced species (~100 years ago), populations may not be at mutation-drift equilibrium and therefore identity by descent may account for some genetic similarity, particularly between distant populations (Hartl & Clark, Reference Hartl and Clark2007). However, there may also be long-distance dispersal events occurring to some degree, which obviates normal adult dispersal.
The most likely mechanism providing long-distance dispersal is human-facilitated movement of S. viridis eggs and live stages with the transportation of animal fodder, seeds and soil (Davidson, Reference Davidson1934). It is through these means that S. viridis was introduced to Australia and other countries (Davidson, Reference Davidson1934) and is likely to continue to be an important means of dispersal. Long-distance gene flow could also occur through wind dispersal of diapause eggs (Alvarez et al., Reference Alvarez, Frampton and Goulson1999). These eggs are highly resistant to desiccation, withstanding months of dry conditions before suitable moisture is available (Wallace, Reference Wallace1968). However, if this were the primary mechanism for dispersal there would be greater gene flow expected between more proximate populations and an expectation that gene flow follows an isolation by distance model.
The factorial correspondence analysis and Structure analysis both showed the Western Australian populations to be differentiated from the majority of eastern Australian populations. This is not unexpected considering the large geographical barrier of the unsuitably dry environment separating Western Australia from the eastern populations. Interestingly, Timboon from south-western Victoria and also Clare and Mount Gambier from South Australia are closely associated with the Western Australian populations. Historically, S. viridis was first recorded in South Australia and subsequently introduced to Western Australia with transported clover seed (Davidson, Reference Davidson1934). Furthermore, the first occurrences of S. viridis in Victoria were confined to the south-western region (Pescott, Reference Pescott1937). Although these patterns of variation may reflect historical gene flow, the genetic similarity of these populations suggests that more recent human-mediated dispersal is also occurring. The lack of variation between populations found at the mitochondrial COI gene further supports the notion that a small S. viridis population was introduced to Australia and has since radiated to its current distribution.
Several populations were also found to be strongly differentiated from the majority of populations and displayed some of the lowest levels of allelic richness and heterozygosity. Interestingly, those populations with low genetic diversity all occur near the distribution limits for S. viridis (Wallace & Mahon, Reference Wallace and Mahon1971). This pattern coincides with ecological theory (Sexton et al., Reference Sexton, McIntyre, Angert and Rice2009) and numerous empirical studies (Robinson et al., Reference Robinson, Weeks and Hoffmann2002; Eckert et al., Reference Eckert, Samis and Lougheed2008) that have found reduced genetic diversity and increased genetic differentiation of peripheral populations compared to central populations. Suboptimal and extreme conditions at distribution limits are likely to reduce effective population sizes and increase the occurrence of bottlenecks and founder events, which exacerbate the effects of genetic drift. Similarly, the sporadic nature of S. viridis and use of pesticides are also likely to result in bottlenecks throughout its range and contribute to the overall genetic structuring of populations. However, the Bottleneck analysis did not indicate whether any population had recently experienced a bottleneck or founder event. The signature of these events deteriorates after only two to four generations and may be difficult to detect in S. viridis, which has at least two generations a year (Bishop et al., Reference Bishop, Harris and McKenzie2001).
Similar findings of genetic structure have been found between populations of several other species of Collembola. Studies by Fanciulli et al. (Reference Fanciulli, Summa, Dallai and Frati2001) and Stevens & Hogg (Reference Stevens and Hogg2003) have both found significant structure of populations in two different Antarctic species. Unlike S. viridis, glaciers have been important geographical barriers to gene flow in these cases. However, substantial population differentiation over shorter distances was also reported. Stevens & Hogg (Reference Stevens and Hogg2003) propose that human- or bird-mediated dispersal may account for the limited gene flow that is occurring. The remaining studies of population genetics for Collembola species have been conducted in Europe. Several studies conducted on Orchesella cinta have all found significant but often low differentiation of populations at various geographical scales (Timmermans et al., Reference Timmermans, Ellers, Marien, Verhoef, Ferwerda and Van Straalen2005; Van Der Wurff et al., Reference van der Wurff, Gols, Ernsting and Van Straalen2005). In explanation of why stronger population structure was not observed for this wingless and sedentary organism, the authors propose wind dispersal of individuals as facilitating long-distance gene flow. Evidence of stronger population differentiation was observed by Fanciulli et al. (Reference Fanciulli, Melegari, Carapelli, Frati and Dallai2000) in four Collembola species from the genera Tomocerus and Pogonognathellus, with no evidence of long-distance dispersal occurring. Although it seems intuitive that genetic differentiation is somewhat characteristic of Collembola populations, passive long-distance dispersal may also be a more common feature of this group than previously thought.
Genetic structure has also been assessed for the sympatric mite pest, Halotydeous destructor (Weeks et al., Reference Weeks, Fripp and Hoffmann1995). This introduced species has a similar life cycle and distribution to S. viridis, but is more ubiquitous in its distribution and has a broader host-plant range. Based on allozyme variation, Weeks et al. (Reference Weeks, Fripp and Hoffmann1995) found lower levels of differentiation between H. destructor populations (F ST=0·015) than that found here for S. viridis. Still, substantial heterogeneity of populations discounted the presence of a single panmictic unit. Similar to S. viridis, gene flow between H. destructor populations is likely greatly facilitated through human-mediated dispersal. However, due to a greater area of suitable host-plants throughout their range, H. destructor is likely to have larger effective population sizes that will reduce the effects of genetic drift.
Insight into the population genetics of S. viridis has important implications for the development of effective control strategies and pesticide resistance management. The observed population structure has the potential to undermine control strategies that are generalized over large areas. The S. viridis life cycle is an important component in targeted control strategies, but there may be significant phenotypic plasticity present throughout its distribution. Adaptive shifts in life-cycle characteristics could arise in differentiated populations in response to these control strategies. Similarly, current spraying practices are strongly selecting for pesticide resistance. Although there is currently no evidence of pesticide resistance in S. viridis, these results suggest that long-distance dispersal events could greatly increase the spread of resistance alleles. Therefore, it is likely that the effectiveness and sustainability of targeted control strategies will be greater when developed at smaller localized scales and future pesticide resistance management may need to incorporate measures for limiting human-mediated dispersal.
Similar to previous studies (Larsson et al., Reference Larsson, Laikre, Palm, Andre, Carvalho and Ryman2007; Conte et al., Reference Conte, dos Reis, Mantovani and Vencovsky2008) we found high concordance in F ST estimates between allozymes and microsatellites. Allendorf & Seeb (Reference Allendorf and Seeb2000) suggested the majority of differences between these marker systems can be attributed to a small number of outlier loci or alleles. While the statistical power of the microsatellites was found to be greater than the allozymes, this difference was negligible at F ST values estimated in this study. However, Jost (Reference Jost2008) argues that conventional measures of differentiation are inherently flawed and D est provides a true measure of population structure. Estimates of Hedrick's G′ST and Jost's D est for the Victorian populations were substantially higher for the microsatellites than the allozymes. Therefore, it appears the allozyme markers were ineffective at capturing the full extent of the population structure. However, this result may be more a reflection of the number of loci used rather than their variability. Nevertheless, the differences between the allozymes and microsatellites and F ST versus D est are arguably of minor importance for this study as the overall pattern of differentiation remains the same.
This study has shown through the use of molecular markers that S. viridis in Australia reproduces sexually and has significant population structure as a result of limited gene flow. It also highlights the need for locally derived control strategies and the role that human-mediated dispersal could play in spreading future pesticide resistance throughout its Australian distribution.
We thank Aston Arthur for his assistance with collection of samples. We also thank the Department of Food and Agriculture Western Australia and the Department of Primary Industries, Parks, Water and Environment Tasmania for providing samples analysed in this study. This study was supported by the Grains Research and Development Corporation through a graduate studentship, the National Invertebrate Pest Initiative and the Australian Research Council through their Special Research Centre program.


